This Way Up: A Blueprint for Sustaining Growth and Increasing Profitability Salesforce Investor Day September 15, 2015 St. Regis Hotel San Francisco, California
Safe Harbor Safe harbor statement under the Private Securities Litigation Reform Act of 1995: This presentation contains forward-looking statements that involve risks, uncertainties, and assumptions. If any such uncertainties materialize or if any of the assumptions proves incorrect, the results of salesforce.com, inc. could differ materially from the results expressed or implied by the forward-looking statements we make. All statements other than statements of historical fact could be deemed forward-looking, including any projections of product or service availability, subscriber growth, earnings, revenues, or other financial items and any statements regarding strategies or plans of management for future operations, statements of belief, any statements concerning new, planned, or upgraded services or technology developments and customer contracts or use of our services. The risks and uncertainties referred to above include – but are not limited to – risks associated with developing and delivering new functionality for our service, new products and services, our new business model, our past operating losses, possible fluctuations in our operating results and rate of growth, interruptions or delays in our Web hosting, breach of our security measures, the outcome of any litigation, risks associated with completed and any possible mergers and acquisitions, the immature market in which we operate, our relatively limited operating history, our ability to expand, retain, and motivate our employees and manage our growth, new releases of our service and successful customer deployment, and challenges inherent to selling to larger enterprise customers. Further information on potential factors that could affect the financial results of salesforce.com, inc. is included in our annual report on Form 10-K for the most recent fiscal year and in our quarterly report on Form 10-Q for the most recent fiscal quarter. These documents and others containing important disclosures are available on the SEC Filings section of the Investor Information section of our Web site. Any unreleased services or features referenced in this or other presentations, press releases or public statements are not currently available and may not be delivered on time or at all. Customers who purchase our services should make the purchase decisions based upon features that are currently available. Salesforce.com, inc. assumes no obligation and does not intend to update these forward-looking statements.
Mark Hawkins CFO Financial Review

Growth/Margin Framework We are committed to balancing growth with improving profitability 1All references to operating margin refer to non-GAAP operating margin. Non-GAAP operating margin excludes the effects of stock-based compensation, amortization of purchased intangibles, amortization of acquired lease intangibles, net non-cash interest expense, and a gain on lease termination resulting from a building purchase. A complete reconciliation of GAAP to non-GAAP measures can be found in the Appendix and at www.salesforce.com/investor. Top Line > 30% Flat to Up Slightly < Revenue Growth Top & Bottom Line 20%-30% +100-300 bps ≈ Revenue Growth Bottom Line < 20% +200-400 bps > Revenue Growth High Growth Growth Low Growth Priority Revenue Growth Non-GAAP Op. Margin1 OCF Growth Mid-30s long-term op. margin at maturity

Secular Shifts Create Value And value transfers from last generation to next Source: Matrix Capital Management analysis, Bloomberg, CapitalIQ, Compustat. Note: 1987 and 2004 data has been inflated at CPI to 2014 dollars $301 $45 $80 $1,321 1987 2004 Market Cap in Billions Mainframe Client Server $1,321 $1,425 $3 $217 2004 2014 Market Cap in Billions Client Server Cloud Mainframe to Client Server… …Client Server to Cloud

New products grow TAM Large and Fast Growing Markets… Source: Gartner, Inc., Market Share: All Software Markets, Worldwide, 2014; Platform & Other defined as combination of the Other Application Development, Testing, Security Testing (DAST and SAST), Application Platforms, Business Process Management Suites, Application Services Governance, Identity Governance and Administration, Web Access Management, Collaboration and Social Software, Portal Products and User Interaction Tools market segments. $0 $10 $20 $30 $40 $50 $60 $70 FY13 FY14 FY15 FY16 FY17 FY18 FY19 FY20 (FY13-FY20 CAGR: 9%) $75 billion Analytics Platform & Other Marketing Cloud Service Cloud Sales Cloud Billion

Foundation for sustained growth …With Headroom for Organic Growth Source: Gartner, Inc., Market Share: All Software Markets, Worldwide, 2014; Platform & Other defined as combination of the Other Application Development, Testing, Security Testing (DAST and SAST), Application Platforms, Business Process Management Suites, Application Services Governance, Identity Governance and Administration, Web Access Management, Collaboration and Social Software, Portal Products and User Interaction Tools market segments. 4% Platform / Other 41% Sales Cloud 16% Service Cloud Market Share by Product 11% Marketing Cloud <1% Analytics Cloud $51B

Consistently Taking Share Extending our #1 CRM market share position Source: Industry analysts, market research and Salesforce estimates. 5.7% 6.2% 12.6% 9.1% 14.3% 12.1% 10.6% 18.4% FY11 FY12 FY13 FY14 FY15
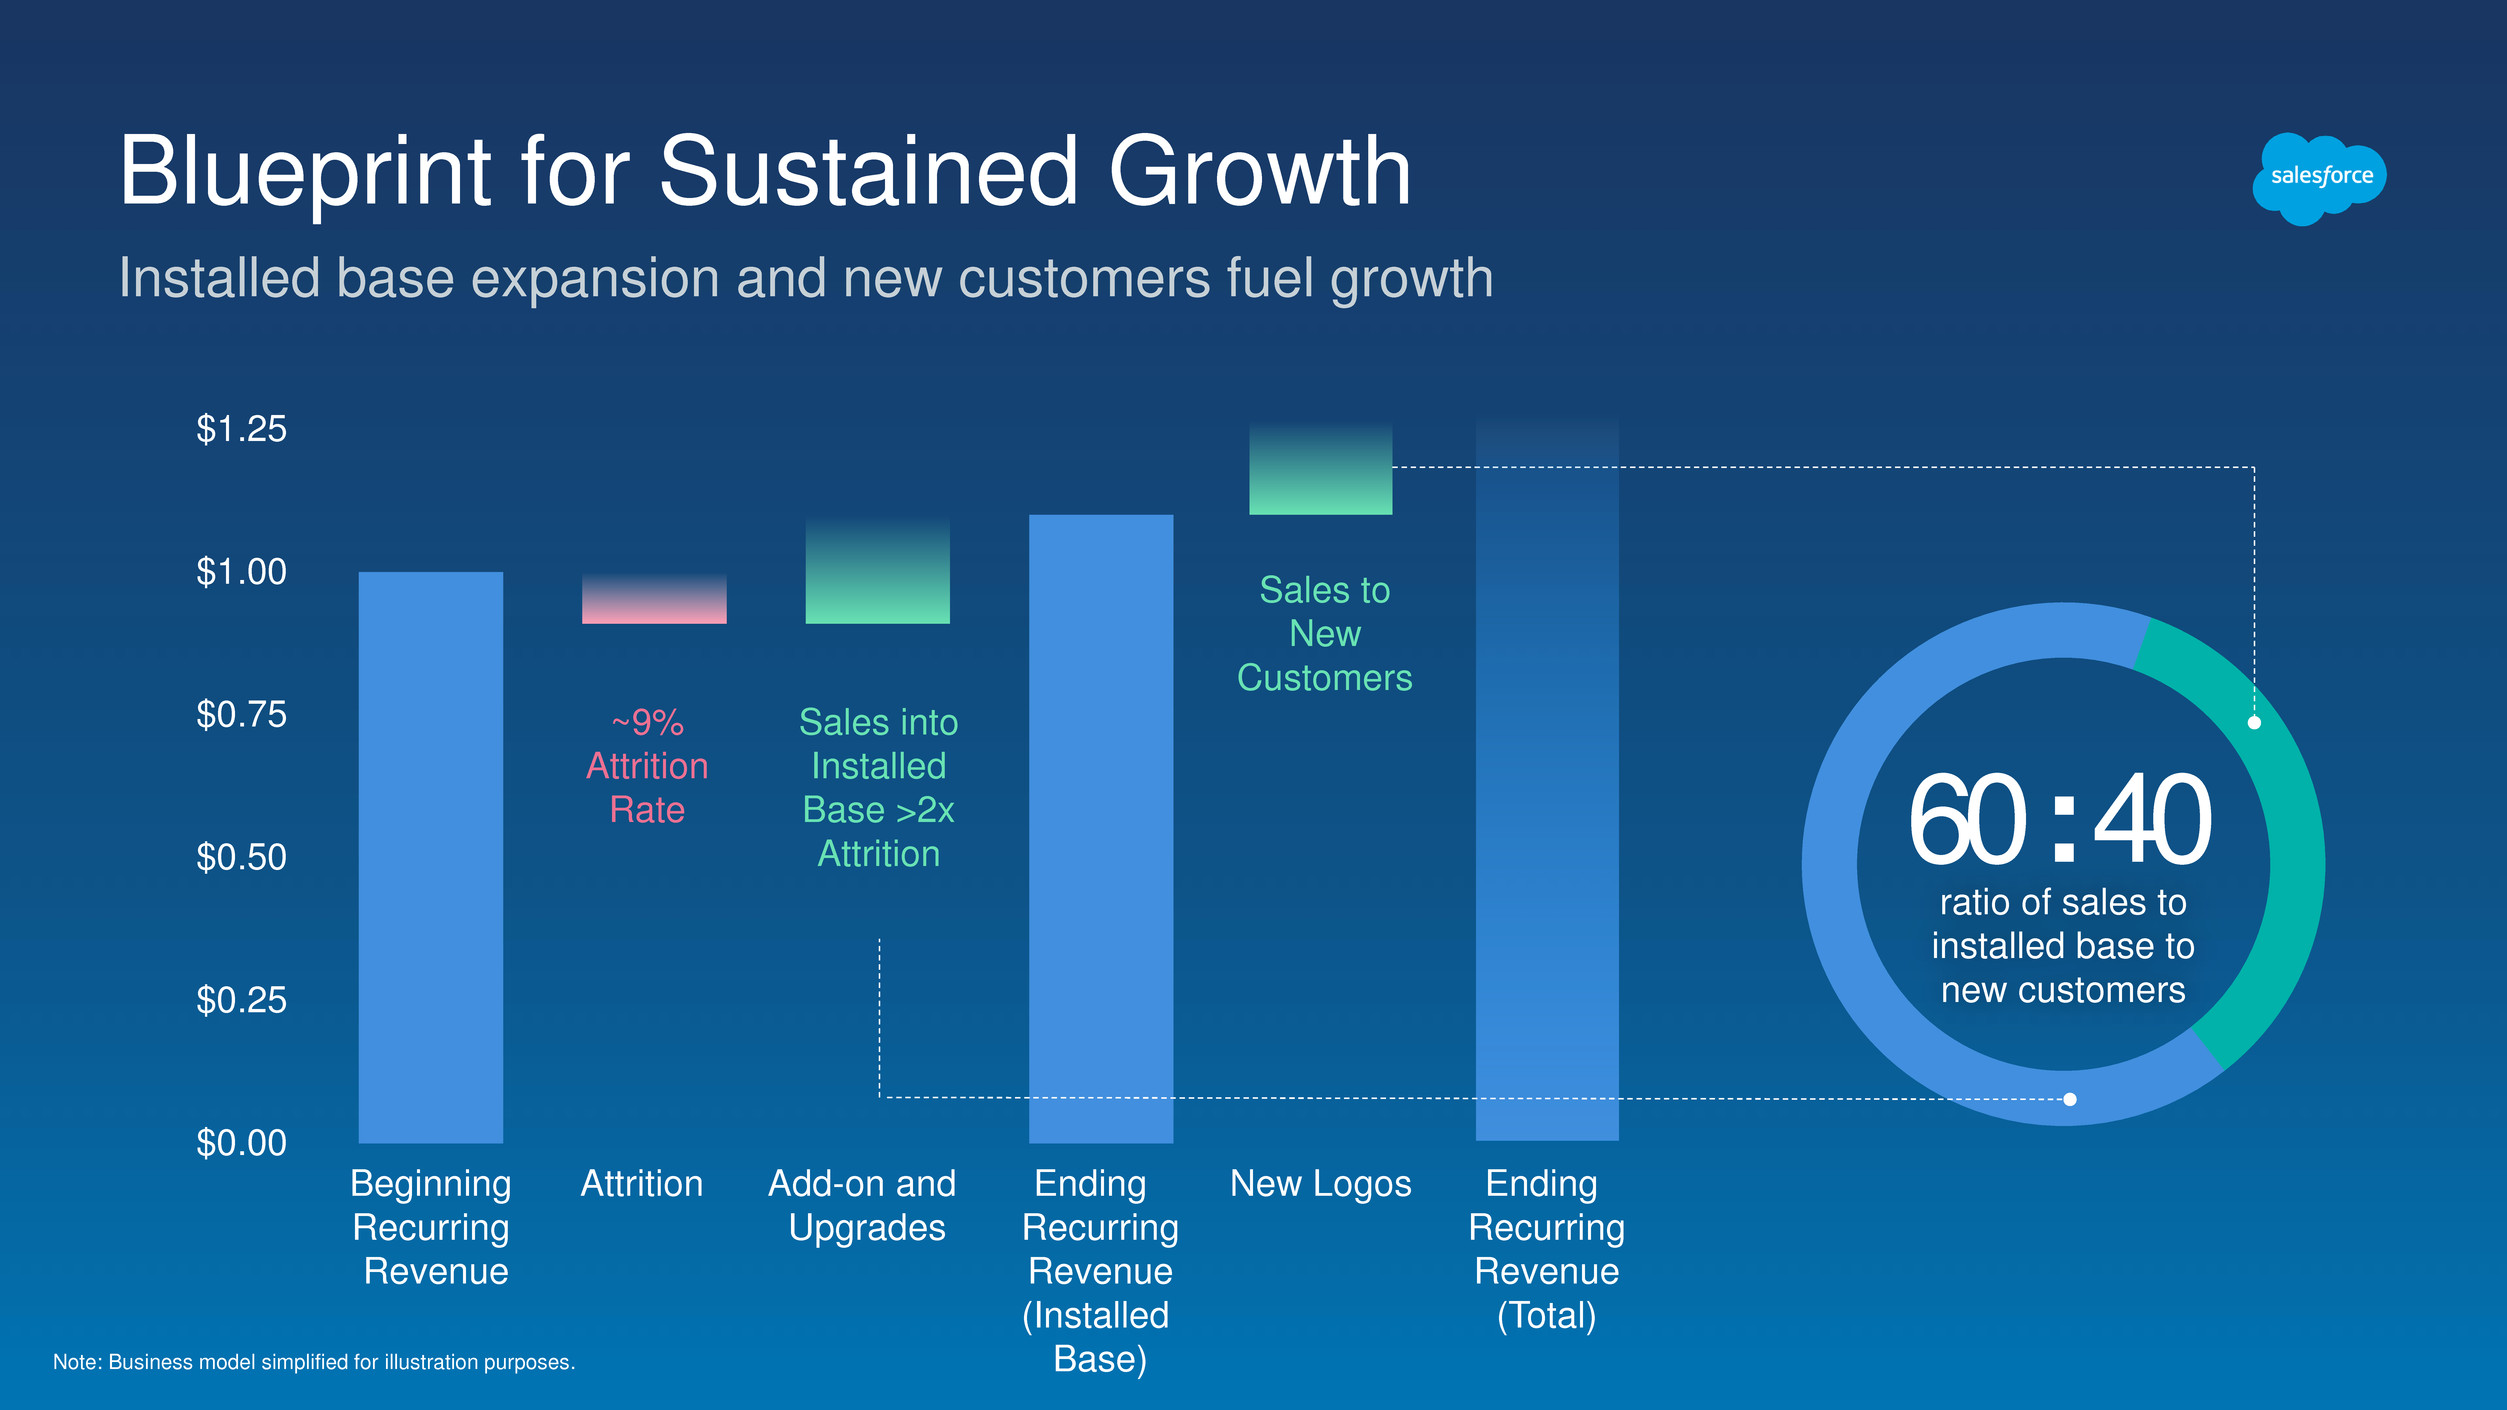
Blueprint for Sustained Growth Installed base expansion and new customers fuel growth Note: Business model simplified for illustration purposes. $0.00 $0.25 $0.50 $0.75 $1.00 $1.25 ~9% Attrition Rate Sales into Installed Base >2x Attrition 60 : 40 ratio of sales to installed base to new customers Beginning Recurring Revenue Attrition Add-on and Upgrades Ending Recurring Revenue (Installed Base) New Logos Ending Recurring Revenue (Total) Sales to New Customers

Installed Base Success

Customer Success Drives Lower Attrition Attrition rate at lowest level in company history Note: Chart of dollar attrition as a percentage of revenue when compared to the year-ago period for Sales Cloud, Service Cloud and the Force.com Platform through Q216. 1Salesforce.com Customer Relationship Survey Results, Comfirmit CustomerSat, May 2015; n=4,626 from 72 countries and 15 industry sectors. FY11 FY12 FY13 FY14 FY15 Dollar Attrition 20% 10% 0% 88% will recommend Salesforce1 234B transactions 79% y/y growth Q216 Platform Performance 99.97% availability 208ms avg page time

Top Accounts Growing in Quantity and Value Million dollar customers are up 25% year-over-year ~700 ~800 ~1,000 Q214 Q215 Q216 Number of customers paying >$1M annually 40% Y/Y increase in value of all contracts over $1 million

Our Multi-Cloud Strategy is Working… New clouds drive growth within installed base 97% top 100 customers using more than 1 cloud 3+ clouds: 75% 4+ clouds: 20% Multi-cloud customers Q216 3+ clouds: 46% 4+ clouds: 13% Multi-cloud customers Q213 76% top 40 customers using more than 1 cloud

…Also Shown by Cross-Selling Success Additional products double revenue run-rate in top 100 customers Note: Cross-sales into top 100 Sales Cloud customers, based on annual revenue as of July 31, 2015. $0.70 $0.15 $0.28 $1.00 platform and other
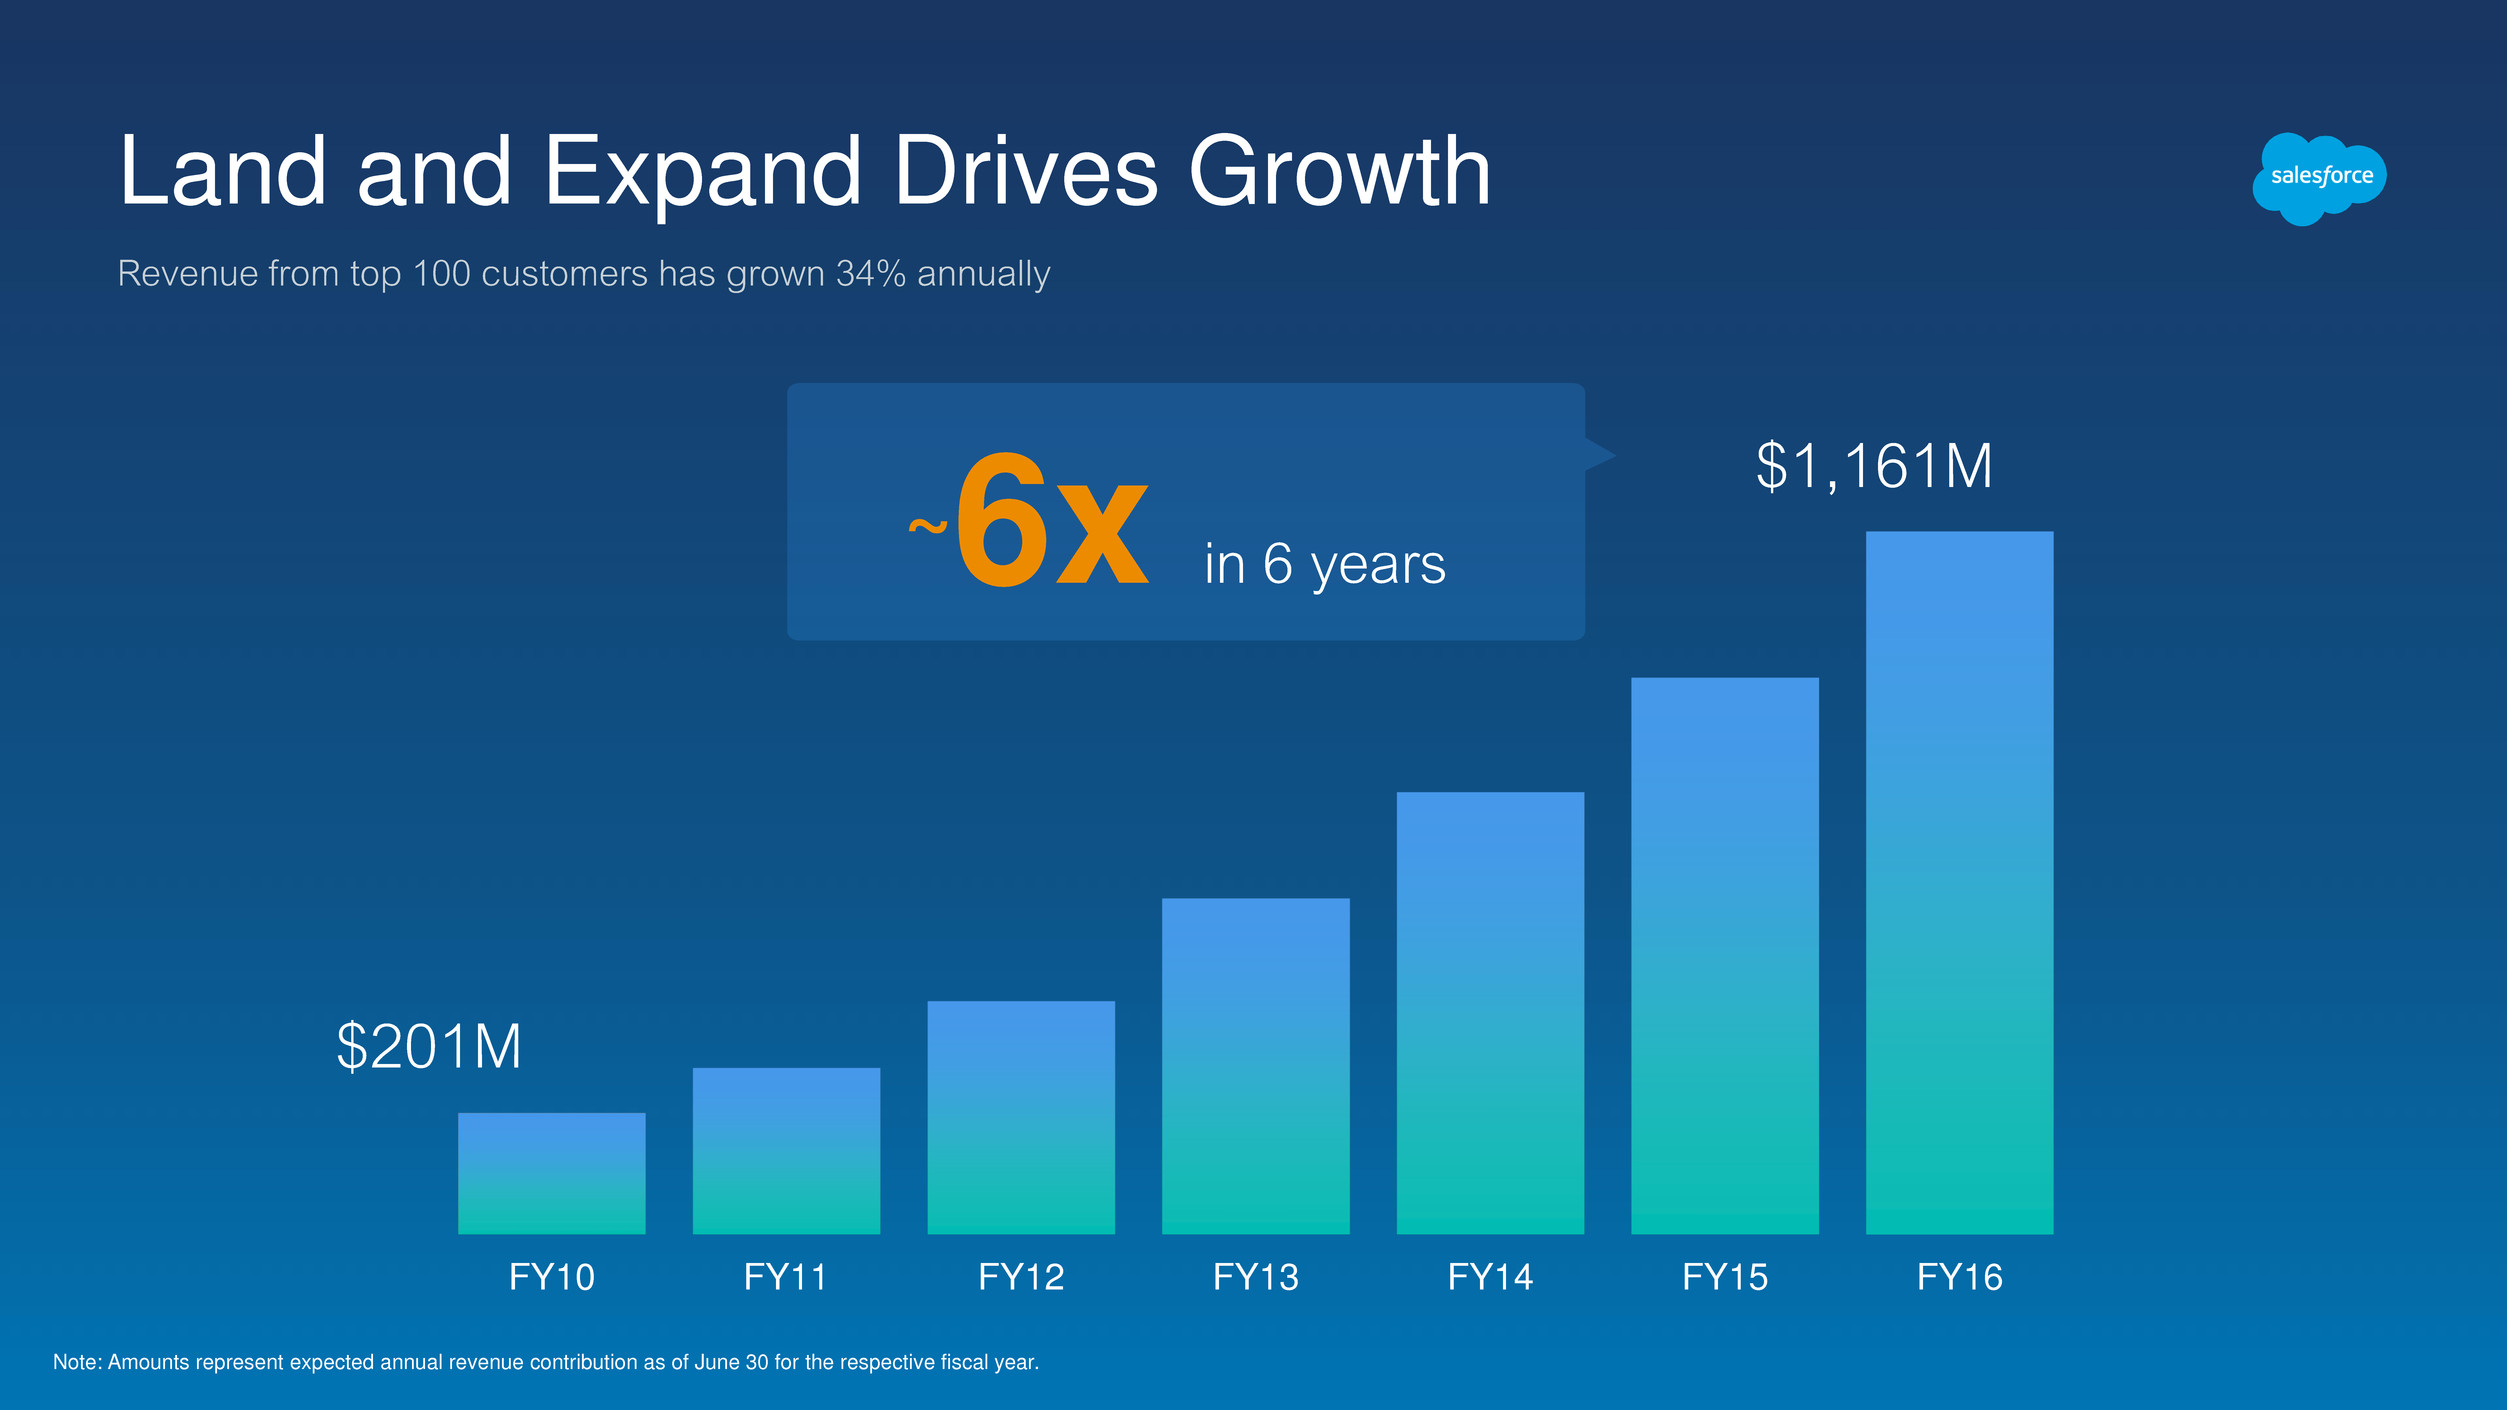
FY10 FY11 FY12 FY13 FY14 FY15 FY16 Land and Expand Drives Growth Revenue from top 100 customers has grown 34% annually Note: Amounts represent expected annual revenue contribution as of June 30 for the respective fiscal year. ~6x in 6 years $201M $1,161M

New Logo Success
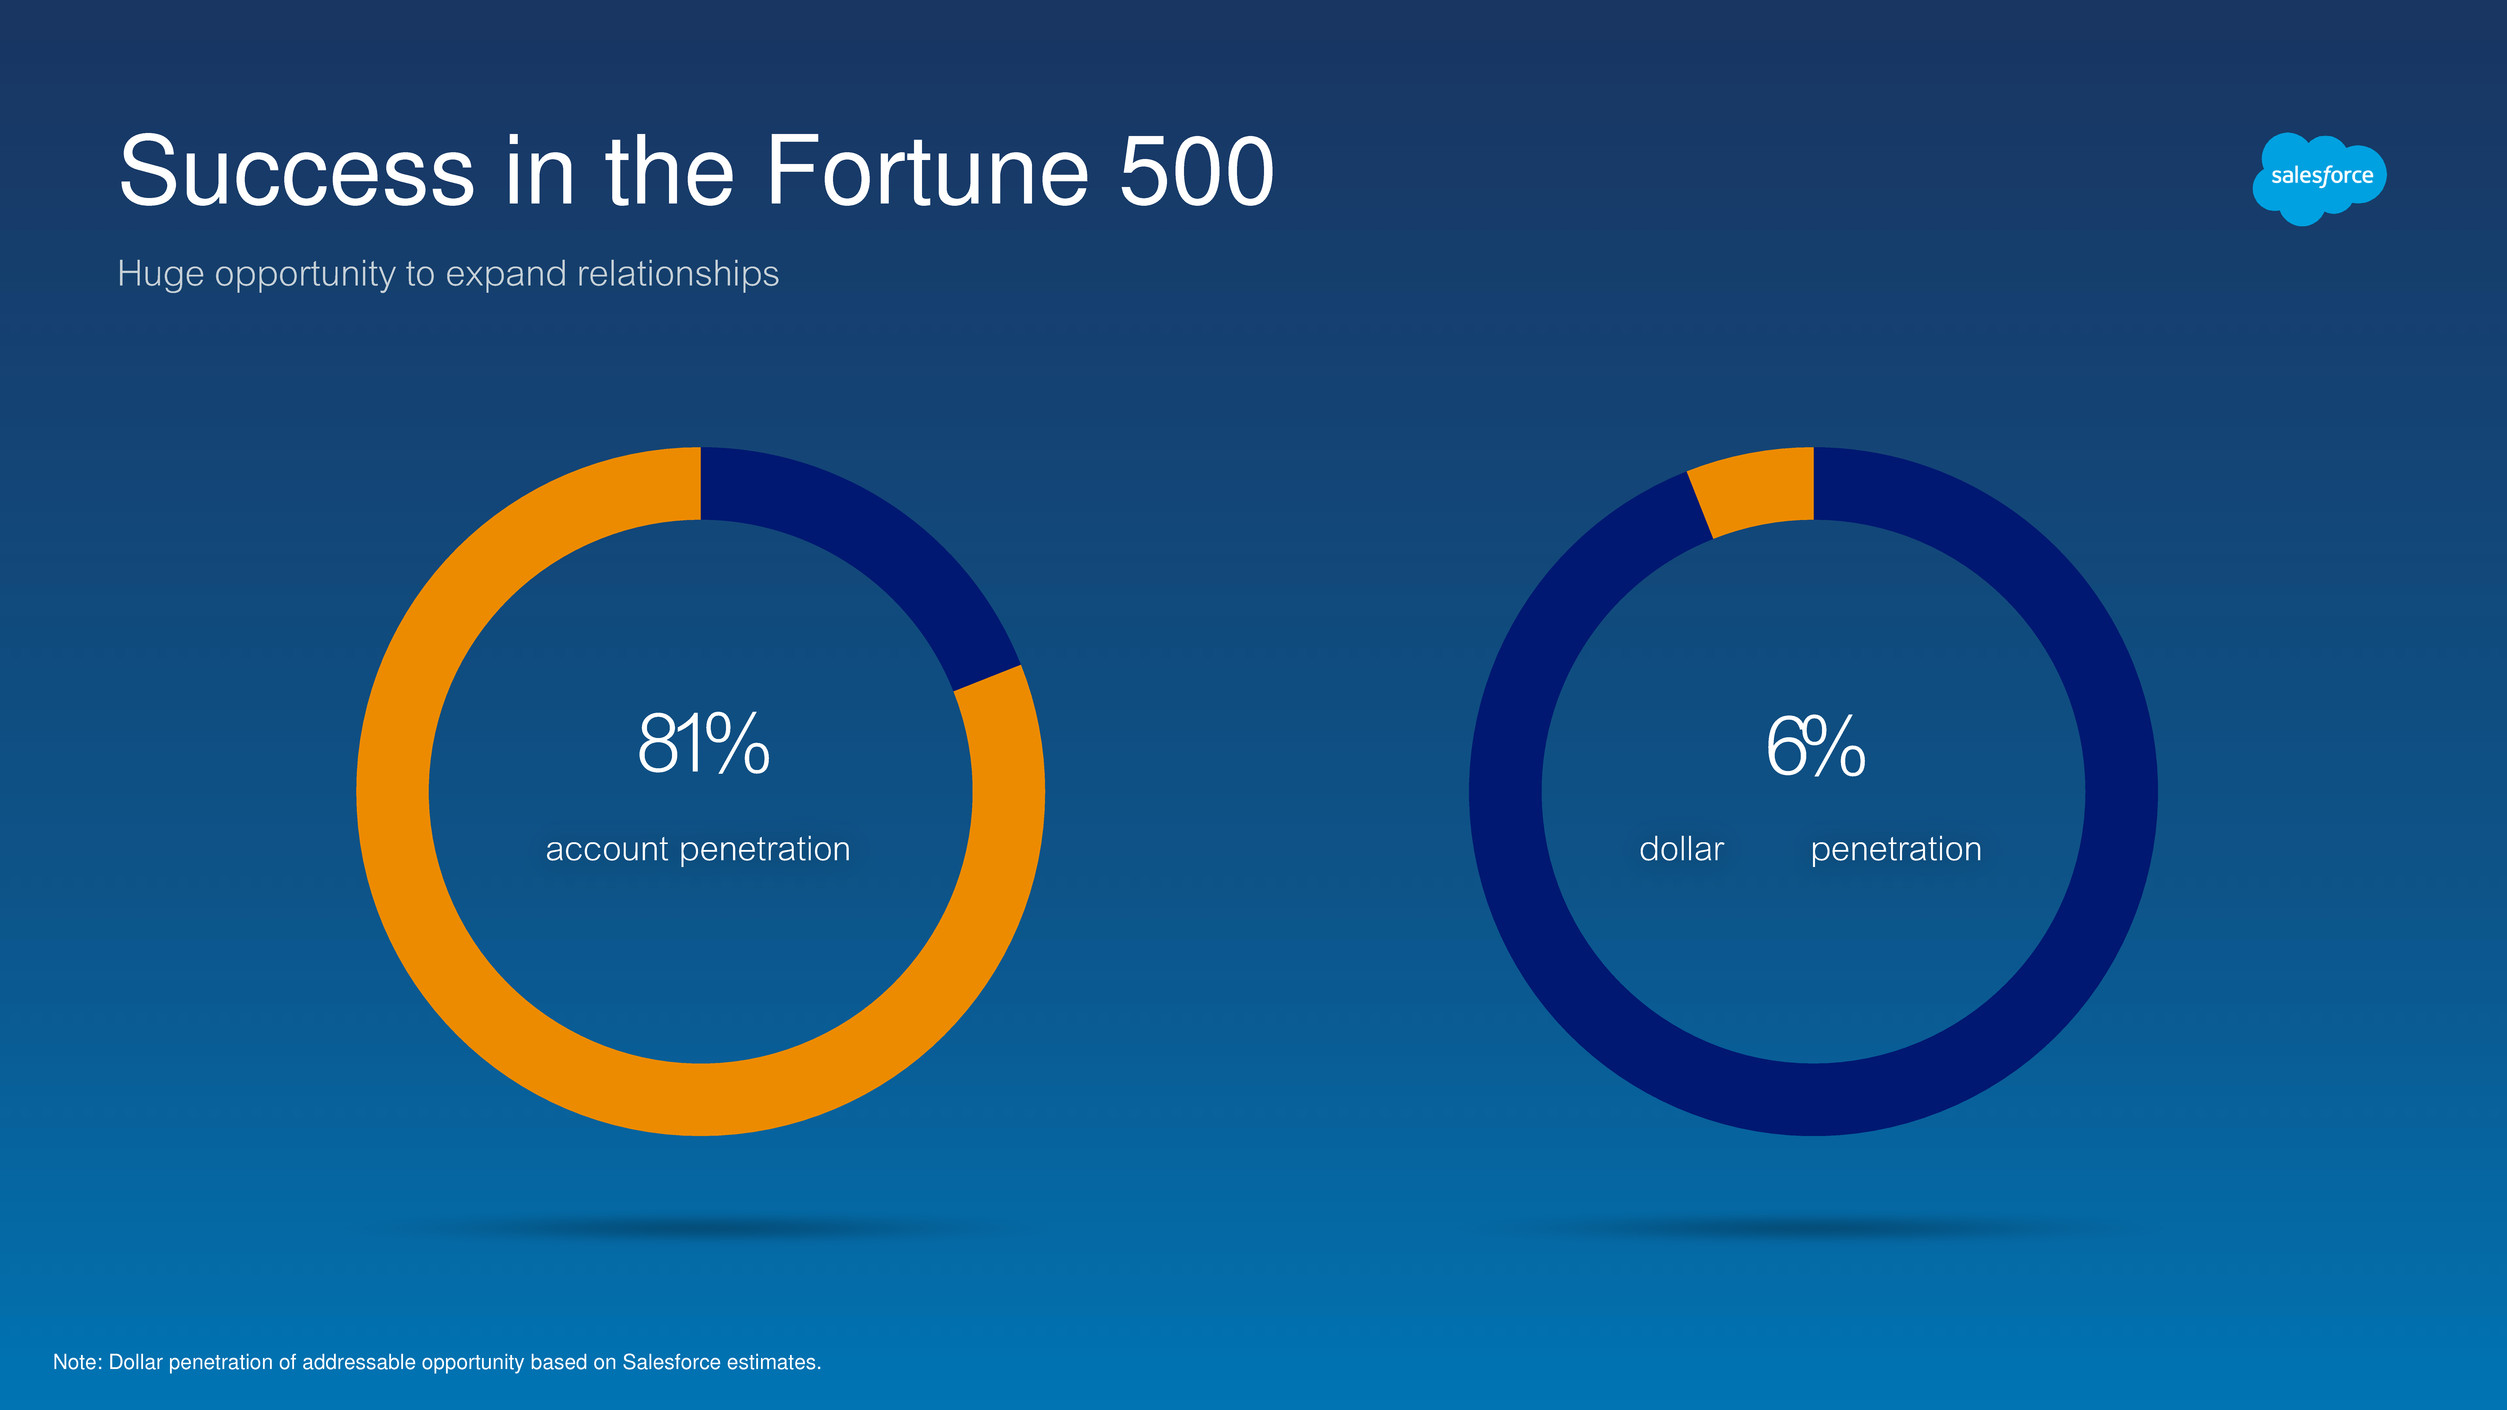
Success in the Fortune 500 Huge opportunity to expand relationships Note: Dollar penetration of addressable opportunity based on Salesforce estimates. 81% account penetration 6% dollar penetration
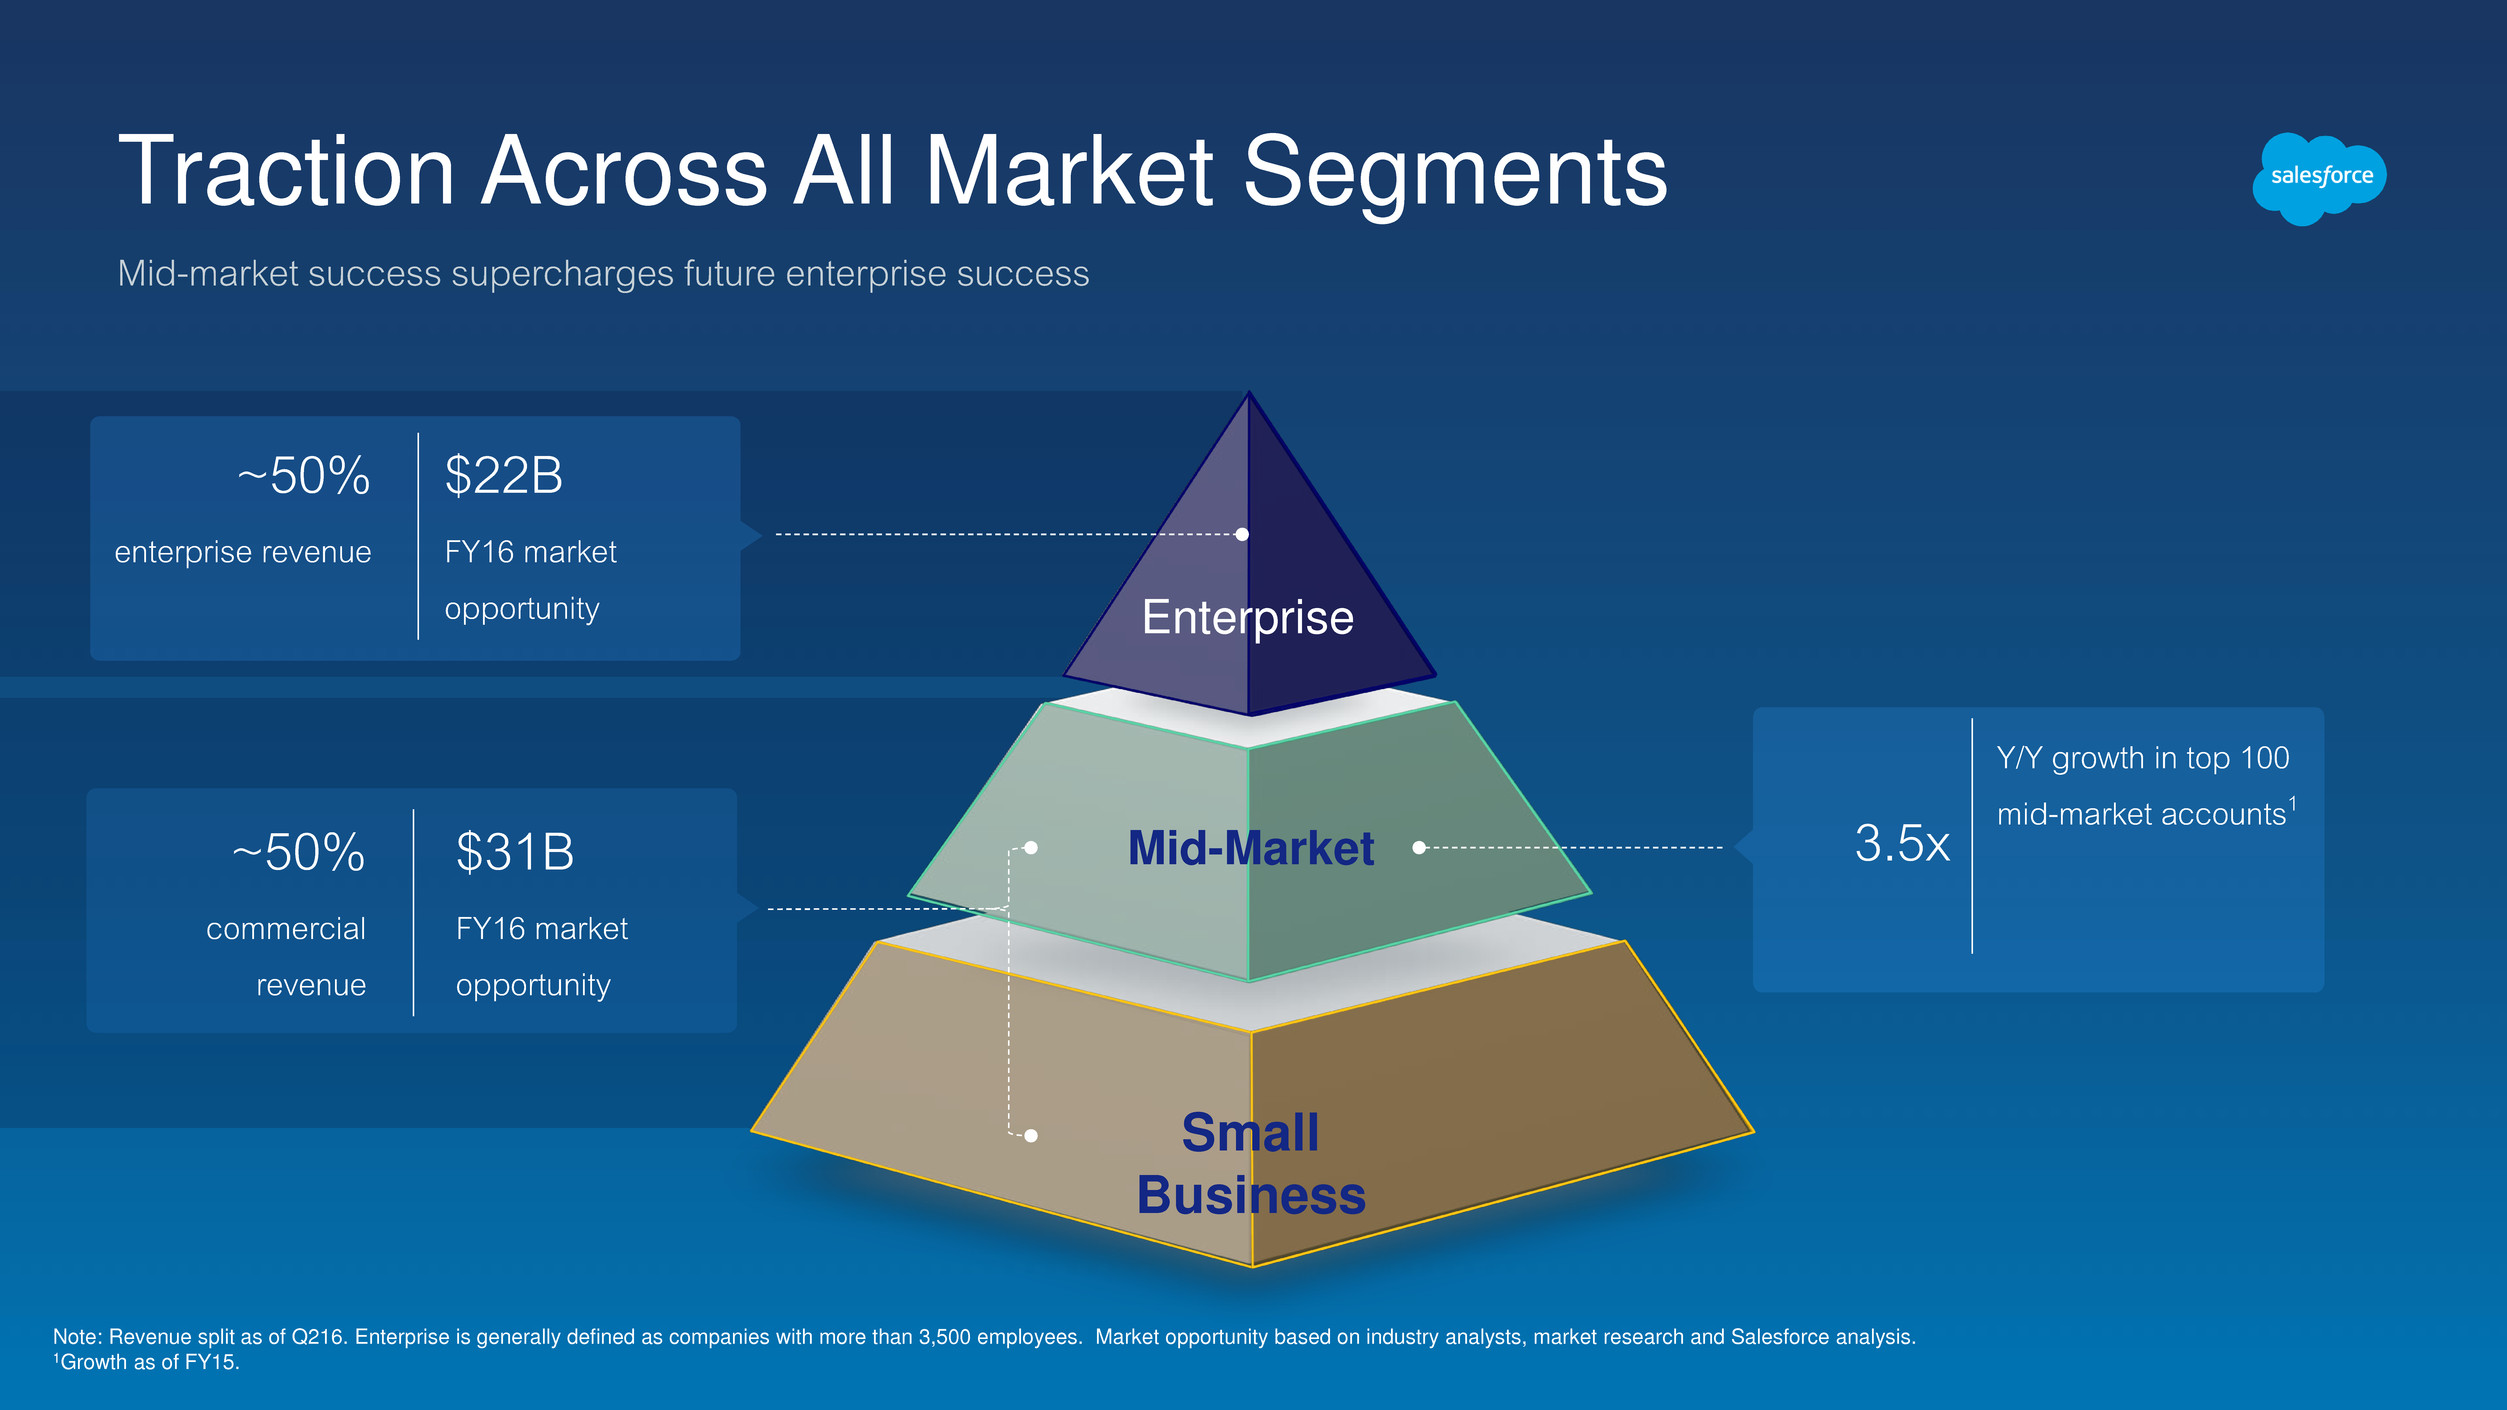
Traction Across All Market Segments Mid-market success supercharges future enterprise success Note: Revenue split as of Q216. Enterprise is generally defined as companies with more than 3,500 employees. Market opportunity based on industry analysts, market research and Salesforce analysis. 1Growth as of FY15. Enterprise Mid-Market Small Business ~50% enterprise revenue $22B FY16 market opportunity ~50% commercial revenue $31B FY16 market opportunity 3.5x Y/Y growth in top 100 mid-market accounts1

Industry Focus Opens New Doors Vertical expertise, products and partnerships make us more strategic Consumer Goods Healthcare Media Financial Services Manufacturing Retail Expertise Products Partners

Partner Ecosystem Expands Our Reach Increasing traction with SIs and ISVs 1This represents deals that had partner influence (joint, sourced, resell, or ISV) in the first half of FY16. SIs 59% y/y 1H16 ISV revenue increase ISVs 46% participation in new business1

Global Opportunity Largely Untapped Nine country strategy addresses 77% of the worldwide TAM Note: Salesforce estimates based on industry analysis, rounded to the nearest whole percentage. 13% Americas market share 6% EMEA market share 6% APAC market share 47% 3% 2% 7% 3% 5% 2% 5% 3% % Total TAM Spend

Innovation Fuels Growth New products attract new logos and increase adoption within installed base 2013 2014 2015

Drivers to Sustain 20%-30% Growth Supercharged by the secular shift to the cloud Installed base: Lower attrition and customer expansion sustains growth Large and growing TAM with headroom to continue to take share New customers: Ecosystem, new products, and geographies fuel growth

David Havlek EVP, Finance Financial Review

Growth/Margin Framework We are committed to balancing growth with improving profitability 1All references to operating margin refer to non-GAAP operating margin. Non-GAAP operating margin excludes the effects of stock-based compensation, amortization of purchased intangibles, amortization of acquired lease intangibles, net non-cash interest expense, and a gain on lease termination resulting from a building purchase. A complete reconciliation of GAAP to non-GAAP measures can be found in the Appendix and at www.salesforce.com/investor. Top Line > 30% Flat to Up Slightly < Revenue Growth Top & Bottom Line 20%-30% +100-300 bps ≈ Revenue Growth Bottom Line < 20% +200-400 bps > Revenue Growth High Growth Growth Low Growth Priority Revenue Growth Non-GAAP Op. Margin1 OCF Growth Mid-30s long-term op. margin at maturity

Predictable Revenue Subscription model creates unique visibility Note: Data includes Sales Cloud, Service Cloud and Platform subscription and support. This assumes an attrition rate, FX rates, and contract provisioning occur as forecasted. ~80% annual revenue under contract at start of the year ~95% quarterly revenue under contract at start of the quarter

Cloud Delivers Consistent Performance Cloud companies beat the consensus revenue estimate by ~2% on average. Source: Factset. Note: On-premises cohort includes SAP, Microsoft, Oracle and IBM. Cloud cohort includes Salesforce, Workday, Netsuite and ServiceNow. -5% -3% -1% 1% 3% 5% Current fiscal Quarter -2FQ -3FQ -4FQ -5FQ -6FQ -7FQ -8FQ -9FQ -10FQ -11FQ -12FQ Consensus

On-Premises Software Model is Highly Volatile On-premises software companies missed the consensus revenue estimate by ~1% on average. Cloud companies beat the consensus revenue estimate by ~2% on average. Source: Factset. Note: On-premises cohort includes SAP, Microsoft, Oracle and IBM. Cloud cohort includes Salesforce, Workday, Netsuite and ServiceNow. -5% -3% -1% 1% 3% 5% Current fiscal Quarter -2FQ -3FQ -4FQ -5FQ -6FQ -7FQ -8FQ -9FQ -10FQ -11FQ -12FQ Consensus

Balancing Growth and Profitability Investment choices are made within growth/margin framework Balance Top and Bottom Line Growth Investment Choices

Margin Performance Reflects Choices Operating margin is up ~575bps over six quarters Note: The above non-GAAP measures exclude the effects of stock-based compensation, amortization of purchased intangibles, amortization of acquired lease intangibles, net non-cash interest expense, and a gain on lease termination resulting from a building purchase. A complete reconciliation of GAAP to non-GAAP measures can be found in the Appendix and at www.salesforce.com/investor. Q414 Q115 Q215 Q315 Q415 Q116 Q216 Non-GAAP Gross Margin Non-GAAP Operating Margin 80.0% 77.5% 6.9% 12.7%
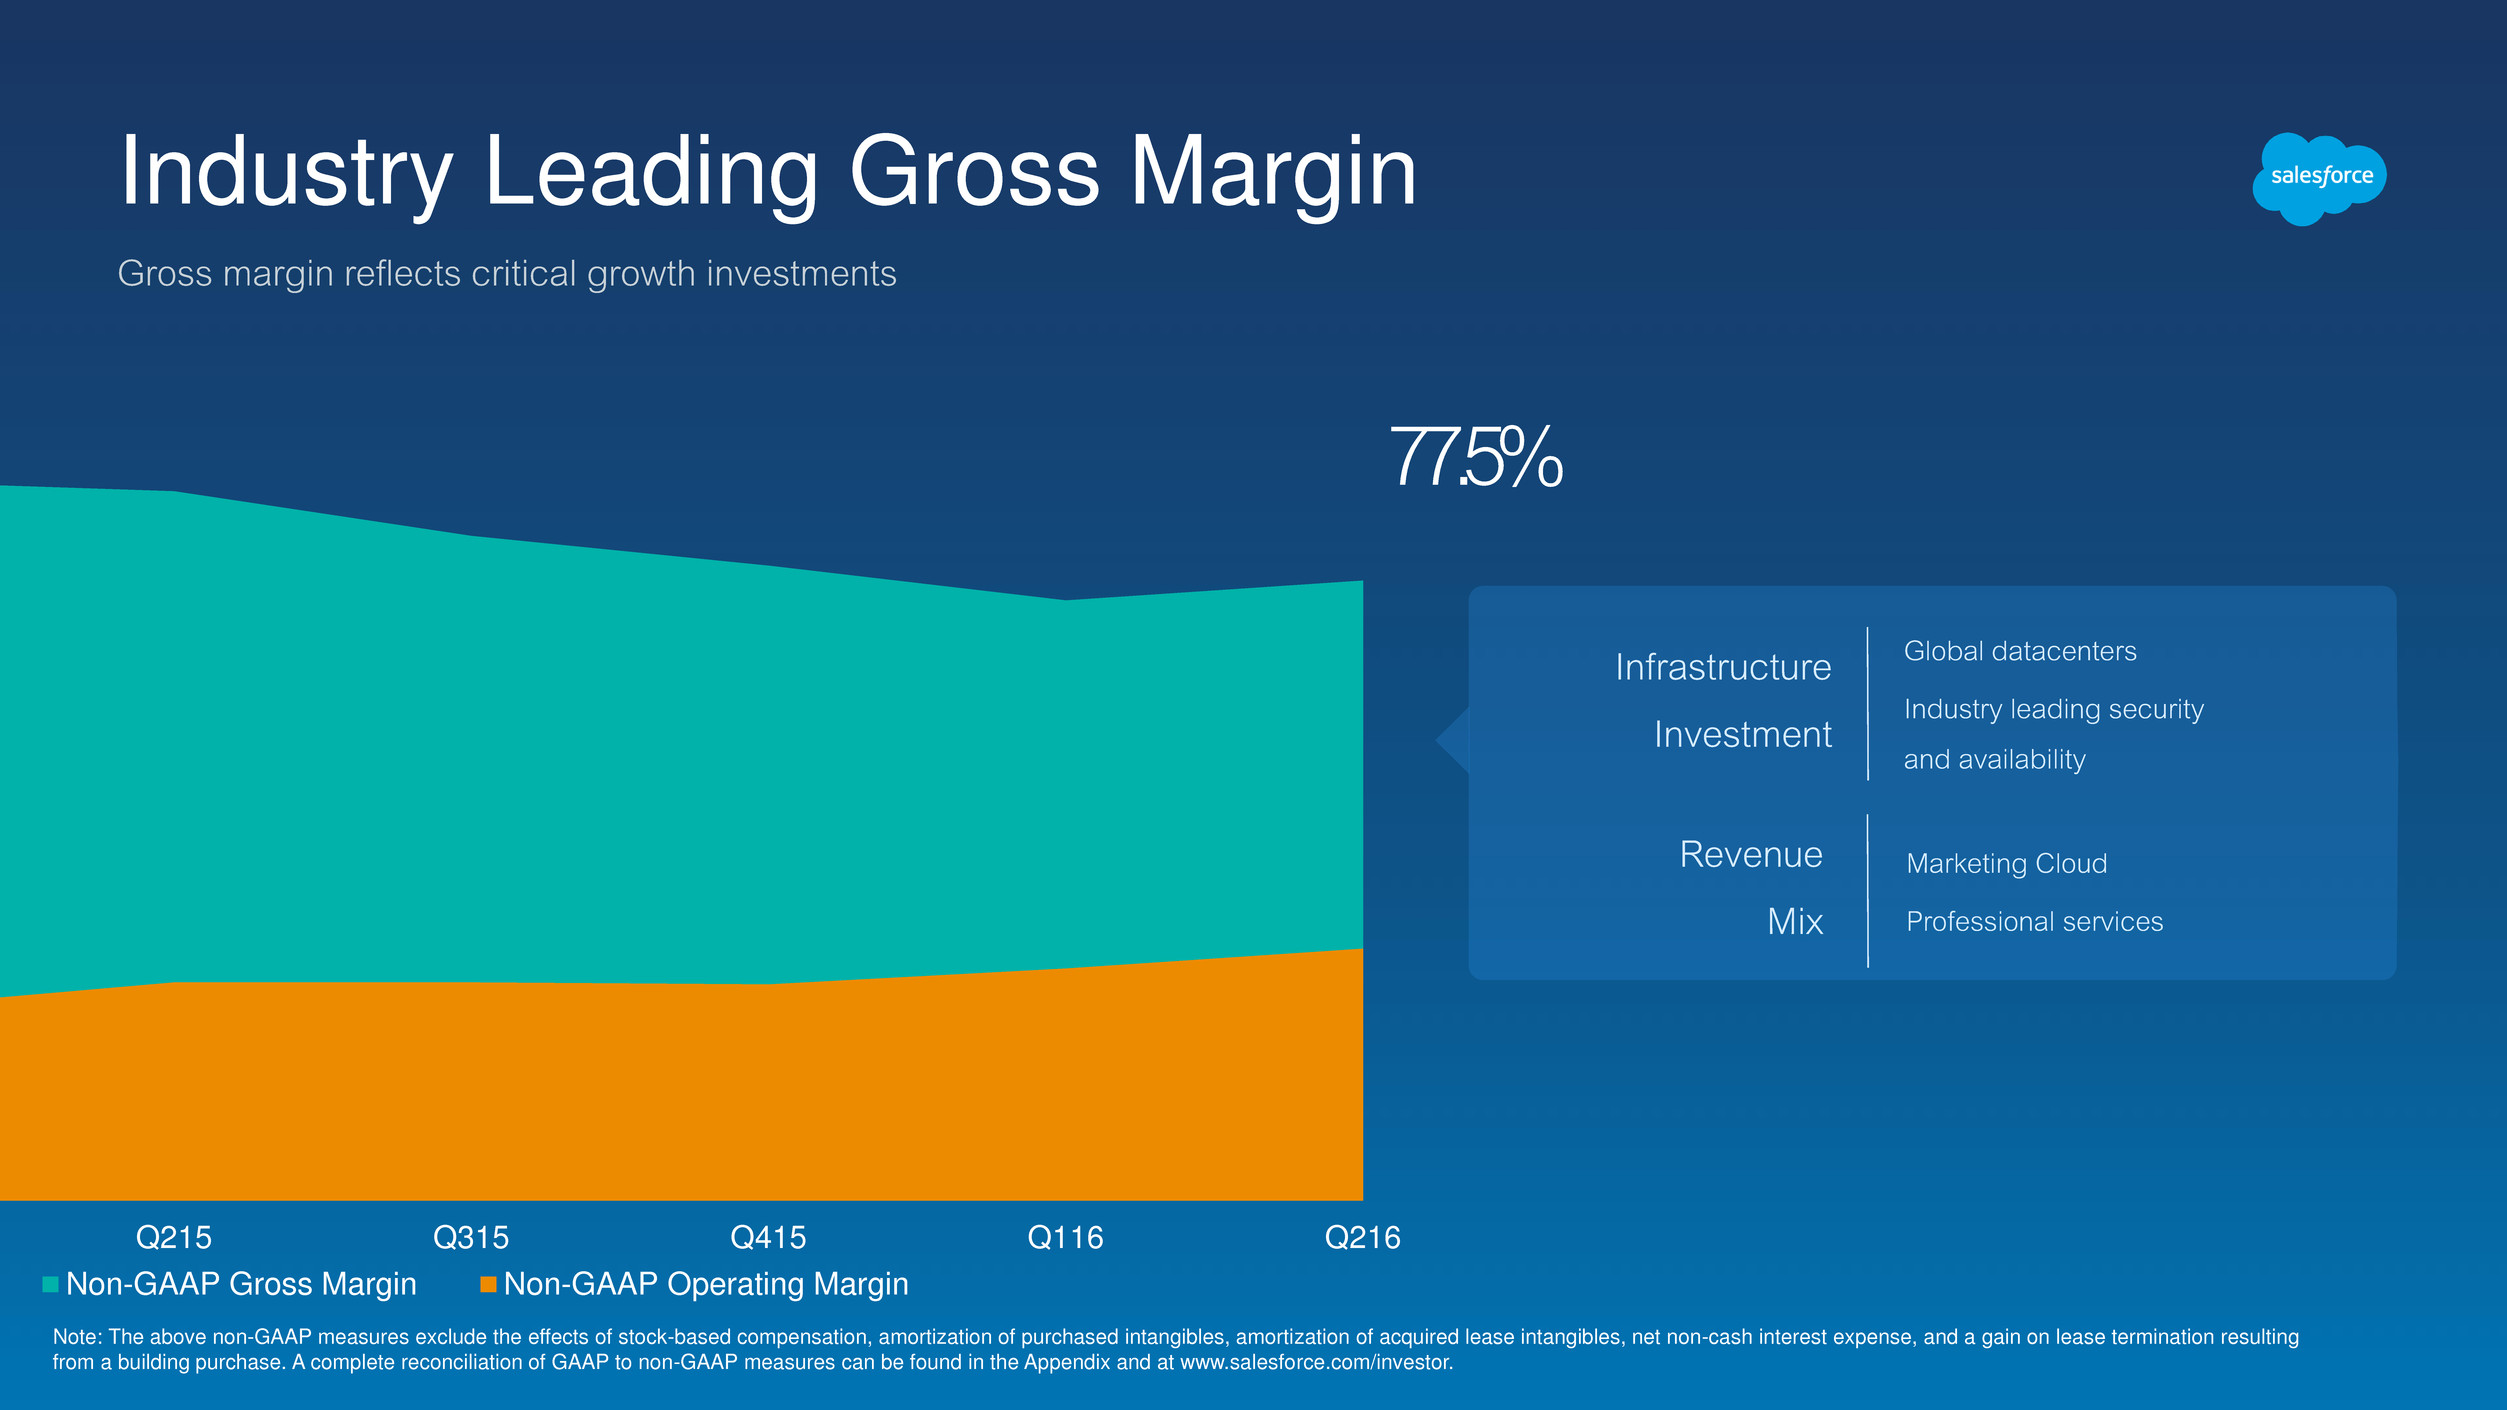
Gross margin reflects critical growth investments Industry Leading Gross Margin Note: The above non-GAAP measures exclude the effects of stock-based compensation, amortization of purchased intangibles, amortization of acquired lease intangibles, net non-cash interest expense, and a gain on lease termination resulting from a building purchase. A complete reconciliation of GAAP to non-GAAP measures can be found in the Appendix and at www.salesforce.com/investor. Global datacenters Industry leading security and availability Infrastructure Investment Marketing Cloud Professional services Revenue Mix Q414 Q115 Q215 Q315 Q415 Q116 Q216 Non-GAAP Gross Margin Non-GAAP Operating Margin 77.5%

Five consecutive quarters of Y/Y non-GAAP op margin improvement with room for more Improving Operating Margin Q414 Q115 Q215 Q315 Q415 Q116 Q216 Non-GAAP Gross Margin Non-GAAP Operating Margin Note: The above non-GAAP measures exclude the effects of stock-based compensation, amortization of purchased intangibles, amortization of acquired lease intangibles, net non-cash interest expense, and a gain on lease termination resulting from a building purchase. A complete reconciliation of GAAP to non-GAAP measures can be found in the Appendix and at www.salesforce.com/investor. Mid-30s long-term op. margin at maturity Non-GAAP op margin improvement Q2 Y/Y +170bps R&D G&A S&M Op Margin Y/Y Change +198bps +87bps +179bps 12.7%

28% 26% 24% 22% 22% 33% FY11 FY12 FY13 FY14 FY15 FY16 YTD OCF OCF Yield Margin Improvement Fuels Strong Cash Flow Consistent with growth/margin framework 1Full-year operating cash flow guidance provided August 20, 2015. $459M $1,035M 24%-25% y/y growth1 5%-7% capex as a percentage of revenue

Deferred Revenue Seasonality Evolving Result of billings compounding and amortization of larger and larger base -20% -10% 0% 10% 20% 30% 40% 50% 60% Q1 Q2 Q3 Q4 Q1 2005 2010 2015 Seq u e n ti a l g rowt h

Deferred Revenue Seasonality Evolving Result of billings compounding and amortization of larger and larger base 0% 2000% 4000% 6000% 8000% 10000% 12000% Q405 Q406 Q407 Q408 Q409 Q410 Q411 Q412 Q413 Q414 Q415 Billed Deferred Revenue In d e x e d Se q u e nt ia l Growt h
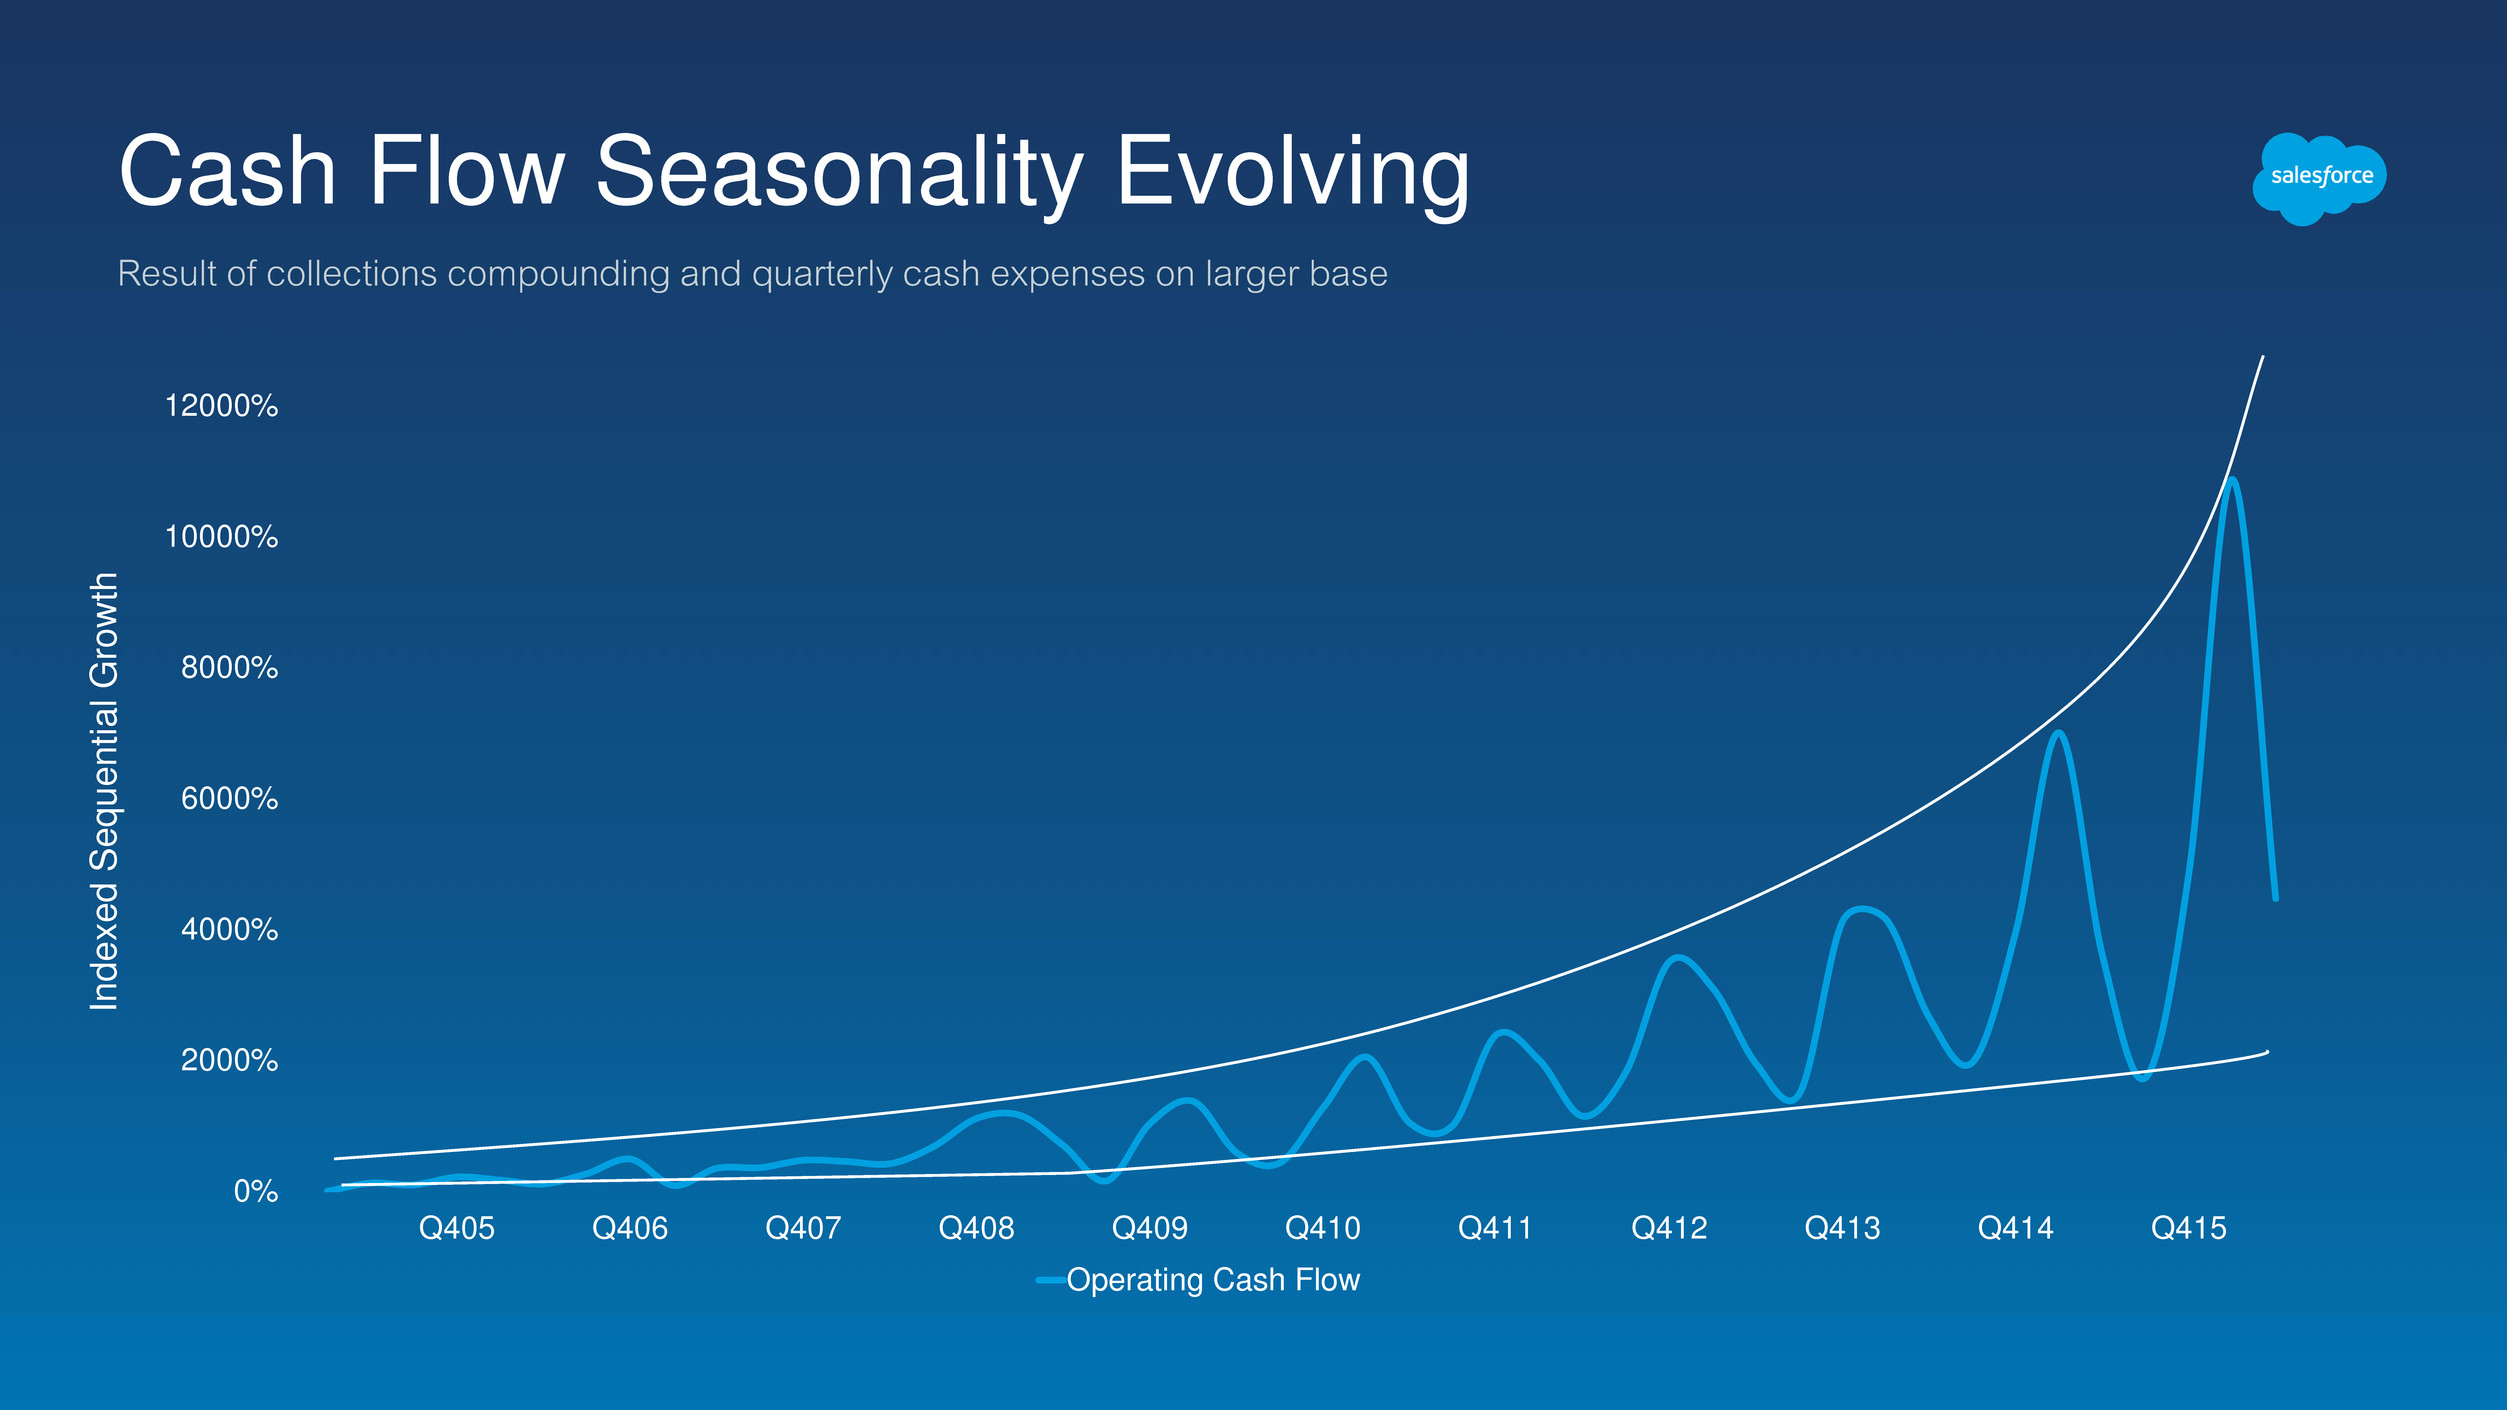
Cash Flow Seasonality Evolving Result of collections compounding and quarterly cash expenses on larger base 0% 2000% 4000% 6000% 8000% 10000% 12000% Q405 Q406 Q407 Q408 Q409 Q410 Q411 Q412 Q413 Q414 Q415 Operating Cash Flow In d e x e d Se q u e nt ia l Growt h

Welcome back to school! Lifetime Unit Economics 201

Lifetime Unit Economics 201 Cost to Book, Cost to Serve, and Attrition drive long-term economic value Fall 2014: Lifetime Unit Economics Lifetime Revenue (LTR): Cumulative value of $1 annuity over expected life (Value = $1 / attrition) Cost to Book (CTB): Cost to acquire $1 annuity Cost to Serve (CTS): Cost to serve $1 annuity over expected life Attrition: Defines expected life of $1 of annuity Unit Lifetime Value Drivers

Lifetime Revenue CTB CTS Unit Income Lifetime Unit Margin Lifetime Unit Margins Inform Decision Making Optimizing long-term unit margins may impact near-term profitability Attrition: 25% Cost to Book: $0.50 Cost to Serve: 75% Option 1: Service investment Attrition: 20% Cost to Book: $0.50 Cost to Serve: 77% Option 2: Sales investment Attrition: 20% Cost to Book: $0.60 Cost to Serve: 75% Option 1 $5.00 $0.50 $3.85 $0.65 13.0% Option 2 $5.00 $0.60 $3.75 $0.65 13.0% Today $4.00 $0.50 $3.00 $0.50 12.5%
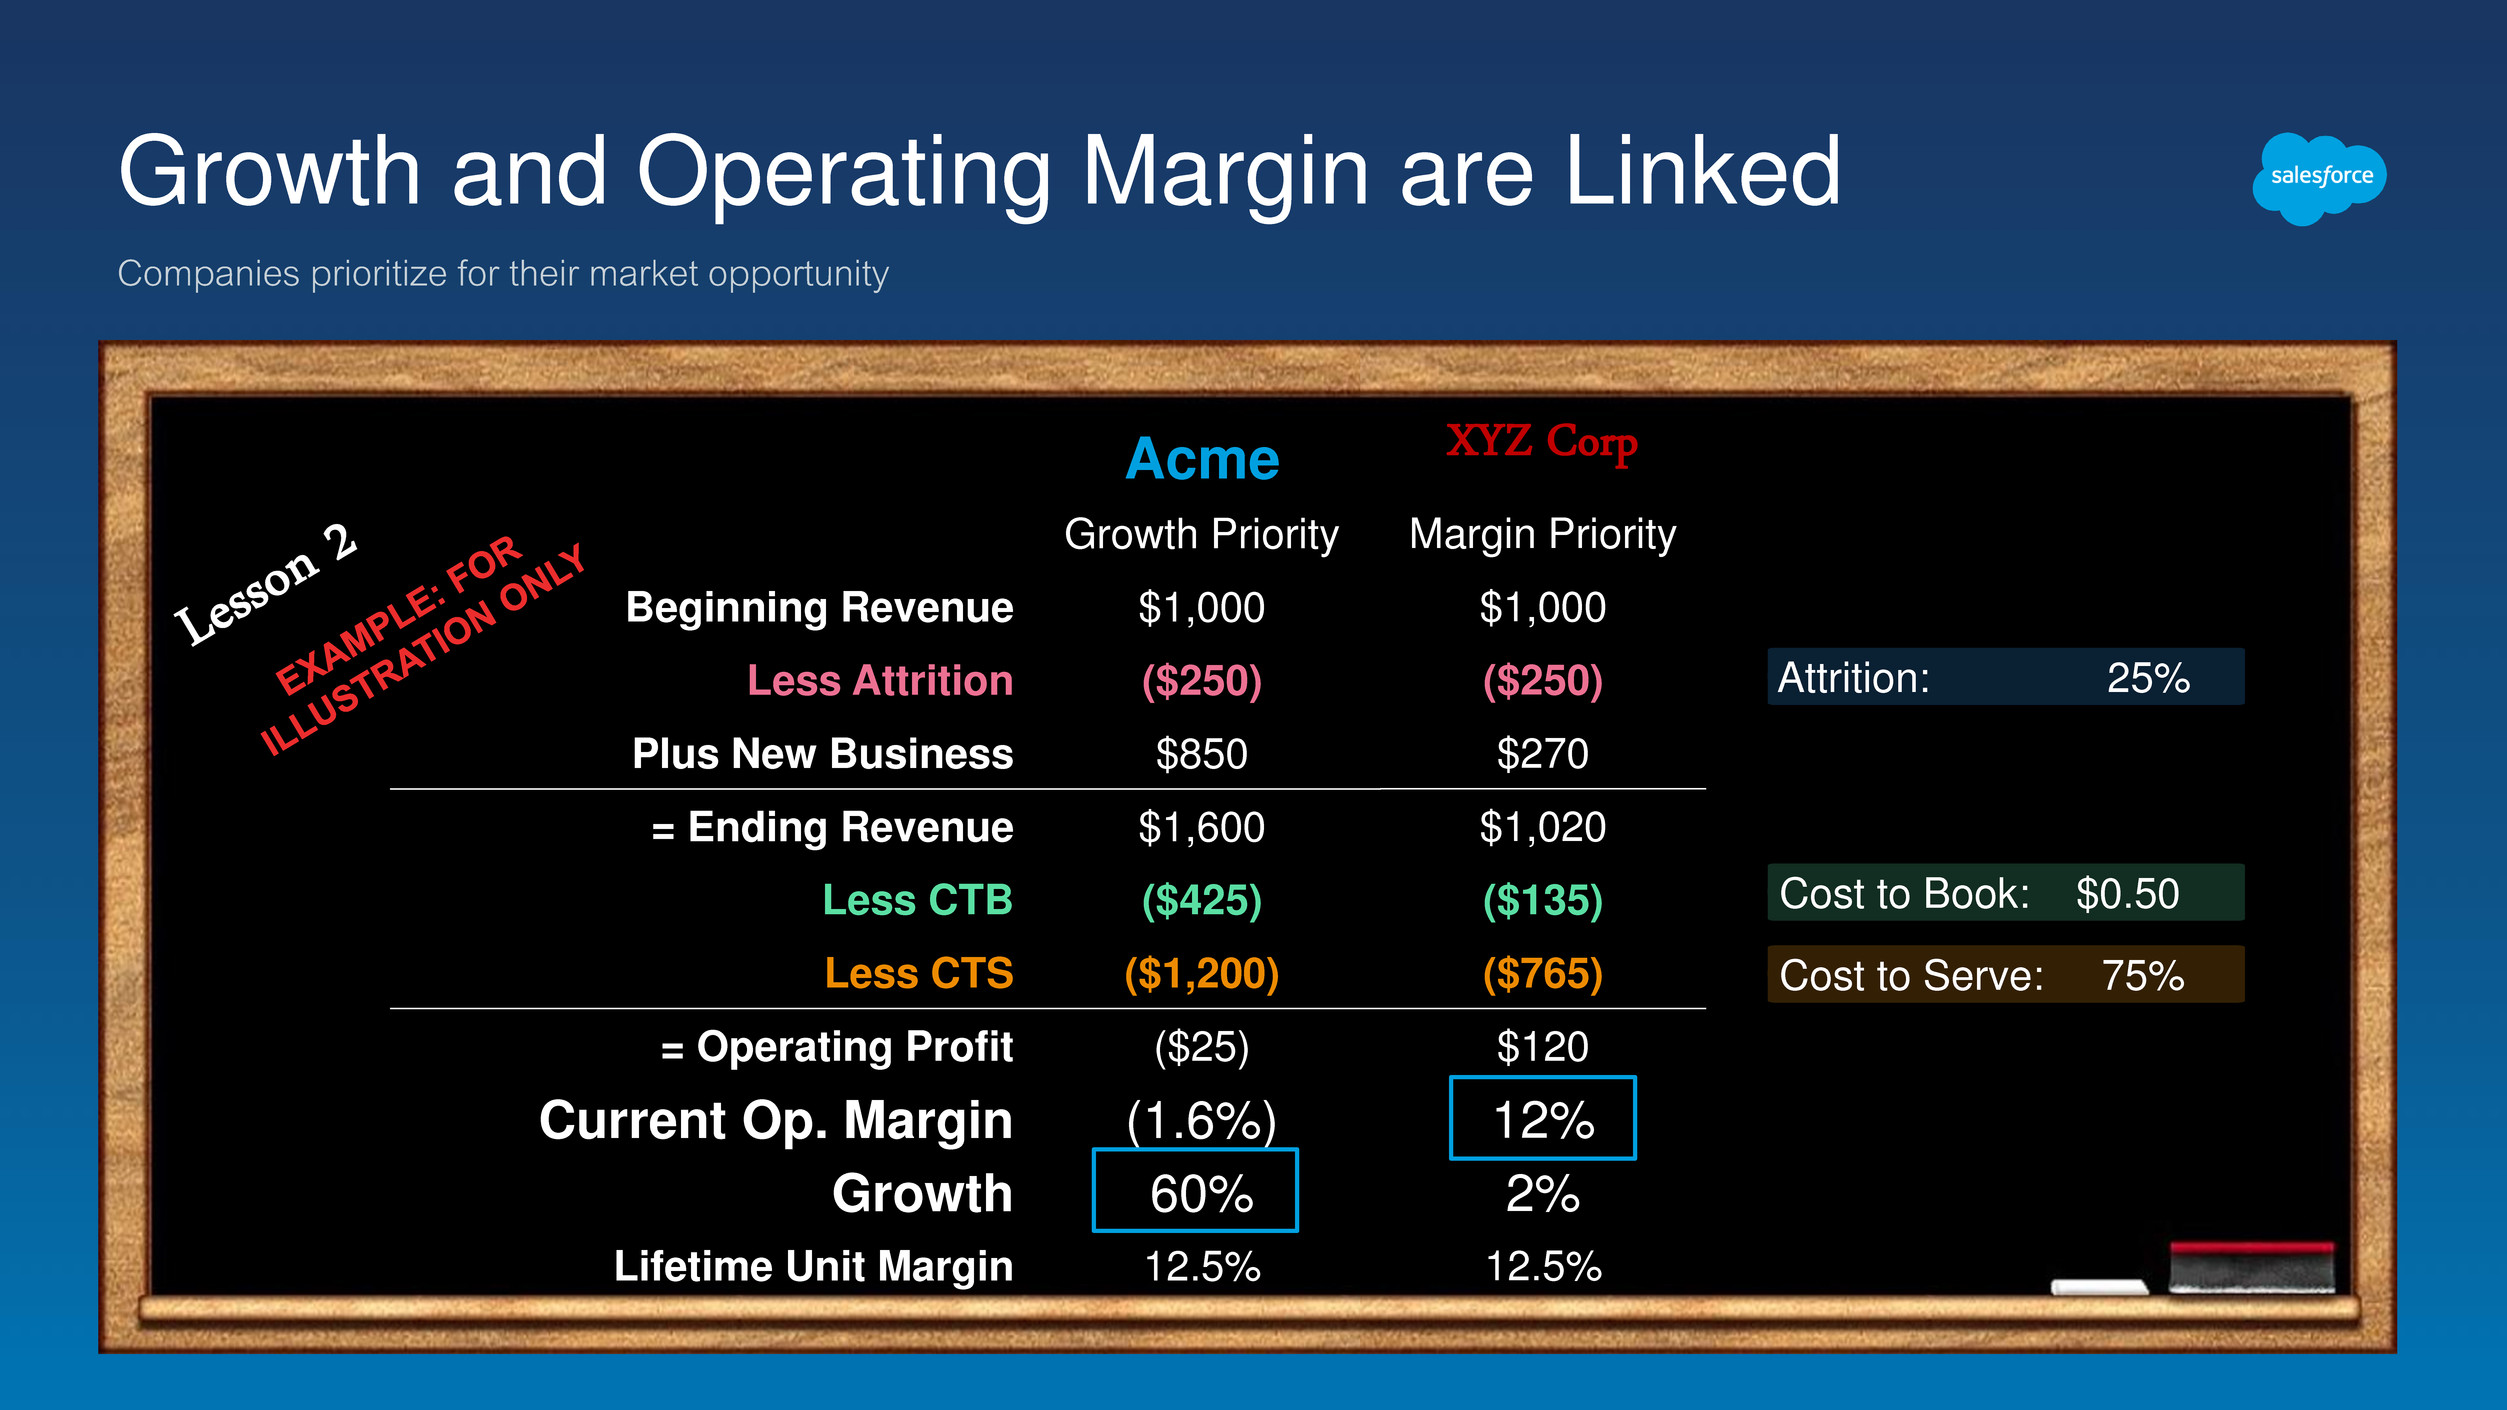
Acme Growth Priority Beginning Revenue $1,000 Less Attrition ($250) Plus New Business $850 = Ending Revenue $1,600 Less CTB ($425) Less CTS ($1,200) = Operating Profit ($25) Current Op. Margin (1.6%) Growth 60% Lifetime Unit Margin 12.5% Growth and Operating Margin are Linked Companies prioritize for their market opportunity Attrition: 25% Cost to Book: $0.50 Cost to Serve: 75% XYZ Corp Margin Priority $1,000 ($250) $270 $1,020 ($135) ($765) $120 12% 2% 12.5%

Focused on Growth Delivering improved near-term margin and long-term economics Growth is #1 priority Committed to balancing top and bottom line Key metric seasonality evolution Managing for the long term, leveraging subscription economics Mid-30s long-term op. margin at maturity

This Way Up 1Based on analyst consensus revenue for FY17. Sixth largest software company in the world this year… …fourth largest software company next year1.

Appendix

GAAP to Non GAAP Reconciliation (in 000's) FY16 (YTD) FY15 FY14 FY13 FY12 FY11 Non-GAAP gross profit GAAP gross profit 2,358,665$ 4,084,316$ 3,102,575$ 2,366,616$ 1,777,653$ 1,333,326$ Plus: Amortization of purchased intangibles 40,529 90,300 109,356 77,249 60,069 15,459 Stock-based expenses 31,721 53,812 45,608 33,757 17,451 12,158 Non-GAAP gross profit 2,430,915$ 4,228,428$ 3,257,539$ 2,477,622$ 1,855,173$ 1,360,943$ Non-GAAP operating profit GAAP income (loss) from operations 50,929$ (145,633)$ (286,074)$ (110,710)$ (35,085)$ 97,497$ Plus: Amortization of purchased intangibles 79,558 154,973 146,535 88,171 67,319 19,668 Stock-based expenses 290,339 564,765 503,280 379,350 229,258 120,429 Operating lease termination resulting from purchase of 50 Fremont, net (36,617) 0 0 0 0 0 Non-GAAP operating profit 384,209$ 574,105$ 363,741$ 356,811$ 261,492$ 237,594$ As Margin % Revenue 3,145,851$ 5,373,586$ 4,071,003$ 3,050,195$ 2,266,539$ 1,657,139$ GAAP gross margin 75.0% 76.0% 76.2% 77.6% 78.4% 80.5% Non-GAAP gross margin 77.3% 78.7% 80.0% 81.2% 81.9% 82.1% GAAP operating margin 1.6% -2.7% -7.0% -3.6% -1.5% 5.9% Non-GAAP operating margin 12.2% 10.7% 8.9% 11.7% 11.5% 14.3%


