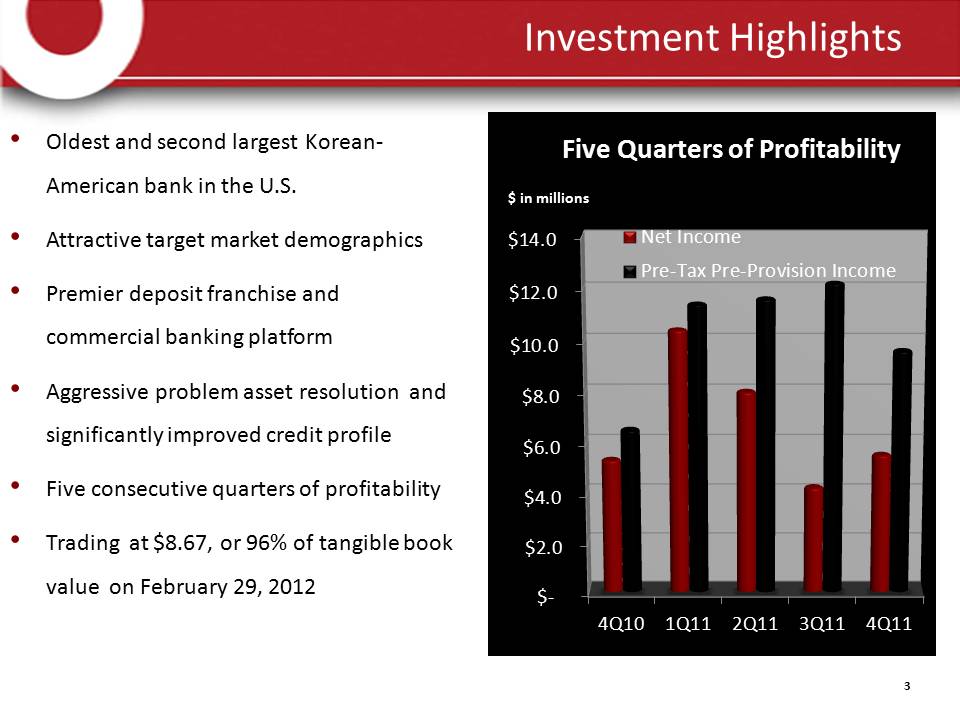
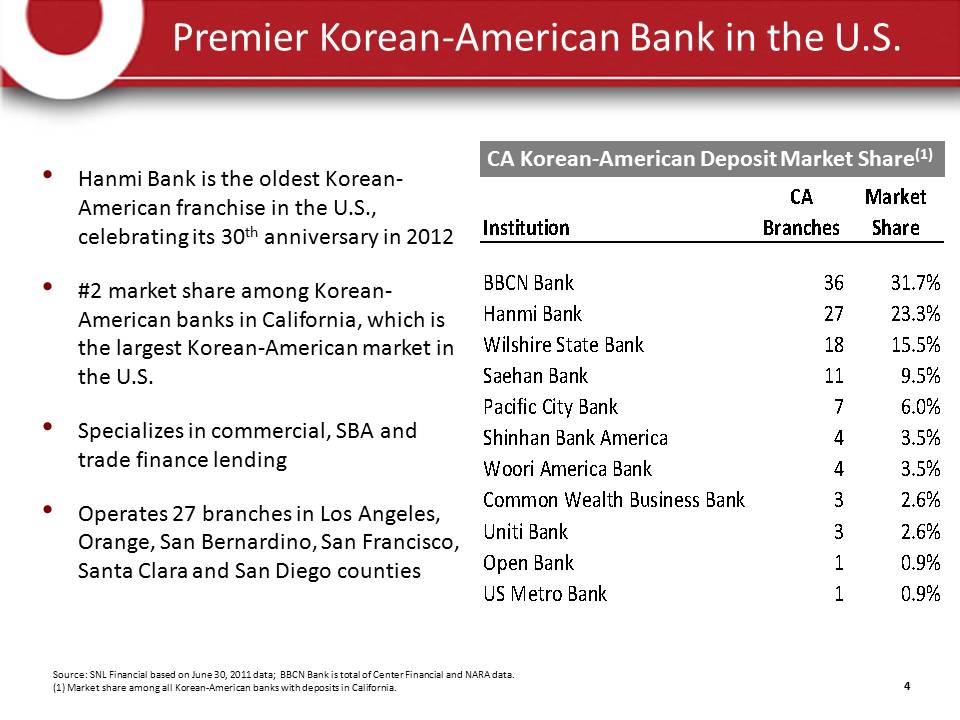
Hanmi Financial Corporation 2012 West Coast Financial Services Conference March 6, 2012 Please read the following information before reviewing the information contained herein: This presentation contains forward-looking statements, which are included in accordance with the “safe harbor” provisions of the Private Securities Litigation Reform Act of 1995. In some cases, you can identify forward-looking statements by terminology such as “may,” “will,” “should,” “could,” “expects,” “plans,” “intends,” “anticipates,” “believes,” “estimates,” “predicts,” “potential,” or “continue,” or the negative of such terms and other comparable terminology. Although we believe that the expectations reflected in the forward-looking statements are reasonable, we cannot guarantee future results, levels of activity, performance or achievements. All statements other than statements of historical fact are “forward-looking statements” for purposes of federal and state securities laws, including, but not limited to, statements about anticipated future operating and financial performance, financial position and liquidity, business strategies, regulatory and competitive outlook, investment and expenditure plans, capital and financing needs and availability, plans and objectives of management for future operations, developments regarding our capital plans and other similar forecasts and statements of expectation and statements of assumption underlying any of the foregoing. These statements involve known and unknown risks, uncertainties and other factors that may cause our actual results, levels of activity, performance or achievements to differ from those expressed or implied by the forward-looking statement. These factors include the following: inability to continue as a going concern; inability to raise additional capital on acceptable terms or at all; failure to maintain adequate levels of capital and liquidity to support our operations; the effect of regulatory orders we have entered into and potential future supervisory action against us or Hanmi Bank; general economic and business conditions internationally, nationally and in those areas in which we operate; volatility and deterioration in the credit and equity markets; changes in consumer spending, borrowing and savings habits; availability of capital from private and government sources; demographic changes; competition for loans and deposits and failure to attract or retain loans and deposits; fluctuations in interest rates and a decline in the level of our interest rate spread; risks of natural disasters related to our real estate portfolio; risks associated with Small Business Administration loans; failure to attract or retain key employees; changes in governmental regulation, including, but not limited to, any increase in FDIC insurance premiums; ability to receive regulatory approval for Hanmi Bank to declare dividends to Hanmi Financial; adequacy of our allowance for loan losses, credit quality and the effect of credit quality on our provision for credit losses and allowance for loan losses; changes in the financial performance and/or condition of our borrowers and the ability of our borrowers to perform under the terms of their loans and other terms of credit agreements; our ability to successfully integrate acquisitions we may make; our ability to control expenses; and changes in securities markets. In addition, we set forth certain risks in our reports filed with the U.S. Securities and Exchange Commission (“SEC”), including, in particular Item 1A of our Form 10K for the year ended December 31, 2010, as well as current and periodic reports filed with the U.S. Securities and Exchange Commission hereafter, which could cause actual results to differ from those projected. We undertake no obligation to update such forward-looking statements except as required by law. Forward Looking Statement Disclaimer 2 Investment Highlights •Oldest and second largest Korean- American bank in the U.S. •Attractive target market demographics •Premier deposit franchise and commercial banking platform •Aggressive problem asset resolution and significantly improved credit profile •Five consecutive quarters of profitability •Trading at $8.67, or 96% of tangible book value on February 29, 2012 3 $- $2.0 $4.0 $6.0 $8.0 $10.0 $12.0 $14.0 4Q10 1Q11 2Q11 3Q11 4Q11 $ in millions Five Quarters of Profitability Net Income Pre-Tax Pre-Provision Income Premier Korean-American Bank in the U.S. •Hanmi Bank is the oldest Korean- American franchise in the U.S., celebrating its 30th anniversary in 2012 •#2 market share among Korean- American banks in California, which is the largest Korean-American market in the U.S. •Specializes in commercial, SBA and trade finance lending •Operates 27 branches in Los Angeles, Orange, San Bernardino, San Francisco, Santa Clara and San Diego counties CA Korean-American Deposit Market Share(1) Source: SNL Financial based on June 30, 2011 data; BBCN Bank is total of Center Financial and NARA data. (1) Market share among all Korean-American banks with deposits in California. 4 Korean-American Banking Opportunity •Large Korean-American population in the U.S. with concentration in key markets oLos Angeles is home to the largest Korean-American population in the U.S. oOther key markets include New York, New Jersey, Chicago, Texas, Seattle and Atlanta •Continuing influx of Korean immigrants and funds from the ratification of the Visa Waiver Program and Korea's liberal foreign investment policies •Business ownership among Korean-Americans is 60% greater than the national average(1) •Aging of first generation Korean-Americans creates substantial fee-based revenue opportunities: retirement planning and wealth management •Recently ratified by the U.S., the Free Trade Agreement with Korea may bolster trade between the two countries providing opportunities for increased trade finance lending 5 (1) U.S. Census and Marcus Noland Paper “The Impact of Korean Immigration to the U.S. Economy.” Premier Management Team 6 Executive / Director Years w/ Bank Years in Industry Relevant Experience Joseph K. Rho Chairman of the Board 27 27 .Prominent and well-respected business executive in the Korean-American community .Significant financial services experience including Principal at J&S Investment and Joseph K. Rho Insurance Company, among others Jay S. Yoo President, CEO & Director 3 41 .Former President, CEO and Chairman of the Board of Woori America Bank in New York .Led Woori America’s expansion effort in the U.S. with four consecutive years of very strong regulatory ratings Premier Management Team 7 Executive / Director Years w/ Bank Years in Industry Relevant Experience Lonny Robinson Executive VP & CFO <1 25 .Former Executive Vice President and Chief Financial Officer of Center Financial Corp. and Opportunity Bancshares .Previously served as a Project Consultant for Resources Global Professionals and a CPA with Ernst & Young .Extensive M&A and capital raising experience Jung Hak Son Executive VP & CCO 11 24 .Formerly served as Senior Vice President and District Leader at Pacific Union Bank (acquired by Hanmi) and Hanmi Bank .Spearheaded the credit turnaround at Hanmi upon assuming the position of CCO in 2009 Mark Yoon Senior VP & Chief Strategy Officer 3 15 .Formerly served as Deputy CFO, Treasurer, and Senior Planning Officer at Hanmi .Former Controller at First Standard Bank (now Open Bank) .Previously served in various accounting and strategy consulting positions at Deloitte & Touche, Effectuare and IGS Consulting Group 2011 Developments •Hanmi’s 4Q11 earnings were its fifth consecutive profitable quarter, earning 9.50% ROE while maintaining a 10.36% tangible equity ratio •Continued core earnings expansion for the year oNIM increased 13bps to 3.68% in 2011 oEfficiency ratio(1) declined to 67.22% from 73.74% •Dramatically improved credit quality oNPAs declined 64% to $52.6 million year-over-year oNPL outflows, driven by note sales and principal paydowns, declined to 2.70% of gross loans oReserves / NPLs increased to 171.7% from 102.5% a year ago •Further enhancements to management team oLonny Robinson named CFO oEstablished a new corporate strategy department and appointed Mark Yoon as Chief Strategy Officer 8 Source: Derived from Company’s 10-Q and earnings release. (1) Calculated as noninterest expense / (net interest income + noninterest income). 3.30% 3.35% 3.40% 3.45% 3.50% 3.55% 3.60% 3.65% 3.70% 3.75% 4Q10 1Q11 2Q11 3Q11 4Q11 Net Interest Margin •Earned $5.5 million in 4Q11, bringing 2011 net income to $28.1 million •Return on Assets was 0.81% in 4Q11 and 1.01% in 2011 •Generated Return on Tangible Equity of 9.58% and 14.24% in Q4 and 2011, respectively •Operating efficiencies improved with total overhead costs down 13% in 2011 from 2010 Fifth Consecutive Quarter of Profitability Source: Derived from Company’s 10-K, 10-Q’s and earnings releases. (1) Pre-tax pre-provision earnings calculated as pre-tax income + OREO expense + provision expense. Adjusted for $2.2 million of offering expenses for Q2 2011. See news release of January 19, 2012 for reconciliation of non-GAAP financial measures. 9 0.00% 2.00% 4.00% 6.00% 8.00% 10.00% 12.00% 14.00% 4Q10 1Q11 2Q11 3Q11 4Q11 Tangible Equity/Tangible Assets Bank Holding Company Improving Operating Efficiency Source: Derived from Company’s 10-K, 10-Q’s and earnings releases. (1) Calculated as noninterest expense / (net interest income + noninterest income). See news release of 1/19/2012 for reconciliation of non-GAAP financial measures. 10 •Downward trend in efficiency ratio due to continued alignment of expense base to revenues •Current platform will benefit from improvements driven by: oRevenue growth oLower overhead expenses oElimination of non-recurring charges •Returning non-performing assets to productive status 0.00% 10.00% 20.00% 30.00% 40.00% 50.00% 60.00% 70.00% 80.00% 4Q10 1Q11 2Q11 3Q11 4Q11 Efficiency Ratio Dramatic Credit Improvement •Hanmi has aggressively managed its problem assets in the past two years •Executed note sales rather than time consuming and labor intensive foreclosures •This aggressive asset resolution strategy has resulted in a 82% and 53% decline in NPAs and classified loans, respectively, from peak levels •NPAs declined 64.1% year-over-year to $52.6 million or 1.91% of total assets, from $146.5 million, or 5.04% of total assets at the end of 2010 11 Source: Derived from Company’s 10-K and 10-Q’s. (Classified loans are adjusted for $50.4 million NPLs current on payments and $12.5 million SBA-guaranteed NPLs. 0% 20% 40% 60% 80% 100% 120% 4Q10 1Q11 2Q11 3Q11 4Q11 Classified Loans/Tier1 + ALLL Conservatively Marked Portfolio •As of 4Q11, NPLs have been charged down to 69% of original principal balances •Net of specific reserves, NPLs are being carried at approximately 59% of original principal balances •Hanmi has sold approximately $321 million of NPLs at 57% of original principal balances in the past eight quarters Source: Derived from Company’s 10-K and 10-Q’s. (1) Original principal balance excludes loan pay downs. 12 $0 $20 $40 $60 $80 $100 $120 $140 $160 4Q10 1Q11 2Q11 3Q11 4Q11 $ in millions Nonperforming Loans and Reserves NPLs Reserves Strong Reserves •Reserves / NPLs of 171% is significantly higher than national averages •Reserves / Gross Loans of 4.6% is also much higher than national averages Source: Company data derived from 10-K and 10-Q filings. Peer data from SNL Financial. 13 0% 20% 40% 60% 80% 100% 120% 140% 160% 180% 4Q10 1Q11 2Q11 3Q11 4Q11 Reserves/NPAs HAFC SNL US Bank Index Attractive Deposit Funding Base Source: Derived from Company’s 10-K and 10-Q filings. Cost of deposits declined to 90 bps in 4Q11 from 266 bps four years ago Demand - Noninterest- Bearing 27% Savings 5% Money Market and Now 19% Time Deposits of $100,000+ 35% Retail Time Deposits 14% Brokered 0% Strategic Objectives •Expand Profitability oReallocate excess liquidity oContinue to expand NIM oLower adjusted efficiency ratio •Pursue Growth Opportunities oAbility to attract customers as a result of two competitors merging oOther strategic opportunities both in- market and selected target markets 15 $0 $5 $10 $15 $20 $25 $30 $35 $40 4Q10 1Q11 2Q11 3Q11 4Q11 $ in millions SBA Loan Originations Capitalization •In November, raised new capital of $77.1 million in net proceeds, further solidifying its balance sheet •Issued 12.6 million shares (adjusted for a 1-for-8 reverse split) •The Bank’s tangible common equity to tangible assets ratio at December 31, 2011, was 12.48% up from 10.63% at September 30, 2011 • At the holding company level, the tangible common equity ratio was 10.36% •Tangible book value was $9.04 per share 16 Investment Highlights •Oldest and second largest Korean American bank in the U.S. •Well positioned branch network in Southern California’s Korean American neighborhoods. •Premier deposit franchise and commercial banking platform •Aggressive problem asset resolution resulting in significantly improved credit profile •Substantial capital position and reserves •Five consecutive quarters of profitability •Trading at $8.67, or 96% of tangible book value on February 29, 2012 17 Stock Price Performance