UNITED STATES
SECURITIES AND EXCHANGE COMMISSION
Washington, D.C. 20549
Form 10-K
☒ ANNUAL REPORT PURSUANT TO SECTION 13 OR 15(d) OF THE SECURITIES EXCHANGE ACT of 1934
For the fiscal year ended December 31, 2024
or
☐ TRANSITION REPORT PURSUANT TO SECTION 13 OR 15(d) OF THE SECURITIES EXCHANGE ACT OF 1934
For the transition period from _________ to __________
Commission File Number 000-30833
BRUKER CORPORATION
(Exact name of registrant as specified in its charter)
| |
Delaware | 04-3110160 |
(State or other jurisdiction of
Incorporation or organization) | (I.R.S. Employer
Identification No.) |
|
|
40 Manning Road, Billerica, MA | 01821 |
(Address of principal executive offices) | (Zip Code) |
Registrant’s telephone number, including area code:
(978) 663-3660
Securities registered pursuant to Section 12(b) of the Act:
| | |
Title of each class
| Trading Symbols(s)
| Name of each exchange on which registered
|
Common Stock | BRKR | Nasdaq Global Select Market |
Securities registered pursuant to Section 12(g) of the Act: None
Indicate by check mark if the registrant is a well-known seasoned issuer, as defined in Rule 405 of the Securities Act. Yes ☒ No ☐
Indicate by check mark if the registrant is not required to file reports pursuant to Section 13 or Section 15(d) of the Act. Yes ☐ No ☒
Indicate by check mark whether the registrant (1) has filed all reports required to be filed by Section 13 or 15(d) of the Securities Exchange Act of 1934 during the preceding 12 months (or for such shorter period that the registrant was required to file such reports), and (2) has been subject to such filing requirements for the past 90 days. Yes ☒ No ☐
Indicate by check mark whether the registrant has submitted electronically every Interactive Data File required to be submitted pursuant to Rule 405 of Regulation S-T (§ 232.405 of this chapter) during the preceding 12 months (or for such shorter period that the registrant was required to submit such files). Yes ☒ No ☐
Indicate by check mark whether the registrant is a large accelerated filer, an accelerated filer, a non-accelerated filer, smaller reporting company, or an emerging growth company. See the definitions of “large accelerated filer,” “accelerated filer,” “smaller reporting company,” and “emerging growth company” in Rule 12b-2 of the Exchange Act.
| | | |
Large accelerated filer | ☒ | Accelerated filer | ☐ |
|
|
|
|
Non-accelerated filer | ☐ | Smaller reporting company | ☐ |
|
|
|
|
|
| Emerging growth company | ☐ |
If an emerging growth company, indicate by check mark if the registrant has elected not to use the extended transition period for complying with any new or revised financial accounting standards provided pursuant to Section 13(a) of the Exchange Act. ☐
Indicate by check mark whether the registrant has filed a report on and attestation to its management’s assessment of the effectiveness of its internal control over financial reporting under Section 404(b) of the Sarbanes-Oxley Act (15 U.S.C. 7262(b)) by the registered public accounting firm that prepared or issued its audit report. ☒
If securities are registered pursuant to Section 12(b) of the Act, indicate by check mark whether the financial statements of the registrant included in the filing reflect the correction of an error to previously issued financial statements. ☐
Indicate by check mark whether any of those error corrections are restatements that required a recovery analysis of incentive-based compensation received by any of the registrant’s executive officers during the relevant recovery period pursuant to §240.10D-1(b). ☐
Indicate by check mark whether the registrant is a shell company (as defined in Rule 12b-2 of the Act). Yes ☐ No ☒
The aggregate market value of the voting and non-voting stock held by non-affiliates of the registrant as of June 28, 2024 (the last business day of the registrant’s most recently completed second fiscal quarter) was $6,643,131,097.1 based on the reported last sale price on the Nasdaq Global Select Market. The number of shares of the registrant’s common stock outstanding as of February 24, 2025 was 151,705,168.
DOCUMENTS INCORPORATED BY REFERENCE
Portions of the information required by Part III of this report (Items 10, 11, 12, 13 and 14) are incorporated by reference from the registrant’s Definitive Proxy Statement on Schedule 14A for its 2025 Annual Meeting of Shareholders to be filed within 120 days of the close of the registrant’s fiscal year.
BRUKER CORPORATION
ANNUAL REPORT ON FORM 10-K
TABLE OF CONTENTS
Any statements contained in this Annual Report on Form 10-K that are not statements of historical fact may be deemed to be forward-looking statements within the meaning of Section 21E of the Securities Exchange Act of 1934, as amended, and Section 27A of the Securities Act of 1933, as amended. Without limiting the foregoing, the words “believe,” “anticipate,” “plan,” “expect,” “seek,” “may,” “will,” “intend,” “estimate,” “should,” and similar expressions are intended to identify forward-looking statements. Forward-looking statements include, but are not limited to, statements regarding:
•the impact of supply chain challenges on our business and operations, including inventory supply problems, global supply chain challenges, changes to trade policies, financial market volatility and disruption, and other macroeconomic issues, including uncertain economic conditions in the United States and abroad;
•expectations regarding the global economy, inflation, the potential for recession and geopolitical tensions and any resulting sanctions, or wars;
•our intentions regarding our intellectual property;
•the impact of government contracts and government regulation;
•our working capital requirements and sufficiency of cash;
•the seasonality of our business;
•the sufficiency of our facilities;
•our employee relations and ability to attract, develop and retain qualified employees;
•the impact of legal or intellectual property proceedings;
•the impact of changes to tax and accounting rules and changes in law;
•our anticipated tax rate;
•our expectations regarding cash dividends, share repurchases, interest expense, interest rate swap agreements, expenses and capital expenditures;
•the impact of foreign currency exchange rates and changes in commodity prices;
•the impact of our restructuring initiatives;
•our ability to successfully complete significant acquisitions on a timely basis, including the receipt of required regulatory approvals and the satisfaction of required conditions to the completion of prospective acquisitions;
•the level and impact of our M&A activity and our ability to integrate acquired companies;
•our expectations regarding backlog and revenue; and
•any other statements that address events or developments that the Company intends or believes will or may occur in the future.
Any forward-looking statements contained herein are based on current expectations but are subject to a number of risks and uncertainties, and the Company’s actual results may differ significantly from the results discussed in the forward-looking statements. Factors that might cause such differences include, but are not limited to, continued volatility in the capital markets, the impact of increased interest rates, our ability to raise capital to support our operations on favorable terms, product development and market acceptance of our products, competition, rapidly changing technologies and product obsolescence, the effects of climate change, including natural disasters, catastrophic events and other events beyond our control, and those discussed in Part I, Item 1A of this Annual Report on Form 10-K under the heading “Risk Factors.” While we may elect to update forward-looking statements in the future, we specifically disclaim any obligation to do so, even if our estimates change, and readers should not rely on those forward-looking statements as representing our views as of any date subsequent to the date of the filing of this report. References to “we,” “us,” “our,” “management” or the “Company” refer to Bruker Corporation and, in some cases, its subsidiaries, as well as all predecessor entities.
Our principal executive offices are located at 40 Manning Road, Billerica, MA 01821, and our telephone number is (978) 663-3660. Information about Bruker Corporation is available at www.bruker.com. The information on our website is not incorporated by reference into and does not form a part of this report. All trademarks, trade names or copyrights referred to in this report are the property of their respective owners.
PART I
ITEM 1 BUSINESS
Our Business
We are a developer, manufacturer and distributor of high-performance scientific instruments and analytical and diagnostic solutions that enable our customers to explore life and materials at microscopic, molecular and cellular levels. Many of our products are used to detect, measure and visualize structural characteristics of chemical, biological and industrial material samples. Our products and solutions address the rapidly evolving needs of a diverse array of customers in life and materials science research, biopharmaceuticals, applied markets, microbiology, in-vitro diagnostics, and nanotechnology. Our technology platforms include magnetic resonance, mass spectrometry, gas and liquid chromatography, X-ray, microscopy, metrology, and molecular spectroscopy technologies. Bruker is enabling innovation, improved productivity, and customer success in post-genomic life science molecular and cell biology research and offers differentiated, high value life science and diagnostics systems and solutions in preclinical imaging, clinical phenomics research, proteomics and multiomics, spatial and single-cell biology, functional structural and condensate biology, as well as in clinical microbiology and molecular diagnostics. Our corporate headquarters are located in Billerica, Massachusetts. We maintain major technical and manufacturing centers in Europe and North America, and have sales offices located throughout the world.
Business Segments
We have four reportable segments, Bruker Scientific Instruments (BSI) BioSpin, BSI CALID (Chemicals, Applied Markets, Life Science, In Vitro Diagnostics, Detection), BSI NANO, and Bruker Energy & Supercon Technologies (BEST). Our products, which have particular application in structural proteomics, drug discovery, pharmaceutical and biotechnology research and production, and the food and materials science fields, provide customers with the ability to determine the structure, dynamics, and function of specific molecules, such as proteins, and thus allows them to understand fundamental biological processes including the formation and progression of diseases. Furthermore, BSI BioSpin’s product enables the characterization of mixtures and also complex materials, rendering them high value-added tools for a variety of industrial applications.
BSI BioSpin Segment
The BSI BioSpin Segment comprises the following divisions:
•Magnetic Resonance Spectroscopy: Offers innovative nuclear magnetic resonance (NMR) and electron paramagnetic resonance (EPR) products, ranging from benchtop to ultra-high field systems. Magnetic resonance is a natural phenomenon occurring when a molecule placed in a magnetic field emits a signature radio frequency. The signature radio frequency is characteristic of the particular molecule and provides a multitude of precise chemical and structural information.
•Preclinical Imaging: Manufactures and markets solutions for in-vivo processes and drug discovery in fields including oncology, neurology, cardiology, inflammation, infectious diseases, cancer research, functional and anatomical neuroimaging, orthopedics, cardiac imaging, and stroke models. Our imaging portfolio includes single and multiple modality solutions using MRI, PET, SPECT, CT and MPI Technologies (each as defined below).
•Biopharma and Applied: Focuses on innovative solutions for emerging and applied market segments and markets comprehensive services across the entire value chain, from raw materials to finished products, and from innovation to disease prevention in pharma-biotech, cleantech, industrial, and other applied markets, as well as in the clinical market.
•Services and Lifecycle Support: Dedicated to delivering service and aftermarket solutions that complement our advanced instruments.
•Integrated Data Solution: Accelerates scientific results by automating and digitizing workflows. The vendor-agnostic platform integrates across laboratory and manufacturing ecosystems, supporting digital transformation. It offers comprehensive software solutions for workflow integration, automation, and artificial intelligence readiness, adhering to Findability, Accessibility, Interoperability, and Reusability (FAIR) data principles.
•Automation: Provides solutions for lab automation and digitalization in Research & Development and Quality Control. The vendor-agnostic automation complements Bruker BioSpin’s platforms in the pharma-biotech, cleantech, industrial, and other applied markets by automating and digitally transforming laboratories.
The majority of BSI BioSpin’s customers are academic and government research facilities. Other customers include pharmaceutical and biotechnology companies; battery, chemical, food and beverage, clinical and polymer companies; and nonprofit laboratories.
During 2024, we continued our focus on accelerating growth, enhancing customer relationships, and driving innovation with our key initiatives, which include expanding into high-potential markets, leveraging core strengths, and driving recurring revenue through aftermarket and connected services. With three additional successful installations of 1.2 GHz NMR systems, we continue to advance ultra-high field access, supporting studies in structural biology, pharmacology, and cellular biology, aligning with Bruker's mission to provide cutting-edge technology for scientific research.
Furthermore, during 2024, we completed our acquisition of Spectral Instruments Imaging and Chemspeed Technologies AG, and the minority investment in NovAliX, which align with the segment's goals of expanding its technological capabilities, entering new markets, and enhancing its product portfolio.
The acquisition of Spectral Instruments Imaging, a leader in preclinical in-vivo optical imaging systems, augments in the technology and product portfolio of the Bruker BioSpin Preclinical Imaging division, broadening its range of preclinical solutions for disease research. Additionally, the acquisition of Chemspeed Technologies AG provides us entry into lab automation and digitalization, complementing our existing product platform of vendor-agnostic solutions.
Through the minority investment in NovAliX, we have taken a step into the preclinical Contract Research Organization (CRO) space, specializing in drug discovery services. This partnership aims to advance our expertise in structural biology and biophysics.
BSI BioSpin Segment’s instruments are based on the following technology platforms:
•NMR—Nuclear magnetic resonance;
•EPR—Electron paramagnetic resonance;
•MRI—Magnetic resonance imaging;
•MPI—Magnetic particle imaging;
•PET—Positron emission tomography;
•SPECT—Single photon emission tomography;
•Automation—Flexible lab automation solutions; and
•Software—Comprehensive data management suite.
NMR is a qualitative and quantitative analytical technique that is used to determine the molecular structure and purity of a sample. Molecules are placed in a magnetic field and give off a radio frequency signature that is recorded by a sensitive detector. Analysis software helps to determine the molecular structure of the sample. The NMR technique is used in academia, by pharmaceutical, biotechnology, food and beverage and clinical companies, and by other industrial users in life science and material science research.
EPR is a process of absorption of microwave radiation by paramagnetic ions or molecules with at least one unpaired electron that spins in the presence of a static magnetic field. EPR detects unpaired electrons unambiguously, whereas other techniques can only provide indirect evidence of their presence. In addition, EPR can identify the paramagnetic species that are detected, which present information on the molecular structure near the unpaired electron and give insight into dynamic processes such as molecular motions or fluidity. Our EPR instruments are used for a wide range of applications, including advanced materials research, materials analysis and quality control.
MRI is a process of creating an image from the manipulation of hydrogen atoms in a magnetic field. In the presence of an external magnetic field, atoms will align with or against the external magnetic field. Application of a radio frequency causes the atoms to jump between high and low energy states. MRI and magnetic resonance spectroscopy, or MRS, include many methods including diffusion-weighted, perfusion-weighted, molecular imaging and contrast-enhance. MRI offers high resolution morphologic information, as well as functional, metabolic or molecular information. Customers use our MRI systems in pharmaceutical research, including metabolomics, to study a number of diseases, including diabetes, neurology, oncology and cardiovascular disorders.
MPI is a process of creating an image from magnetic particles administered to the body of an animal. The magnetic particles are manipulated in a combination of oscillating magnetic fields exhibiting a field free zone. The response of the particles allows a real time 3D data set acquisition of the whole body of an animal, showing the contrast agent distributing in and flowing through the body. This imaging modality is used to detect cardiovascular disorders.
PET is a process of creating an image from positrons after administration of a positron emitting radionuclide to the body of an animal. Annihilation of the positron produces two photons which show an angle of 180° between them, distinguishing these photons from photons originating from other sources. The PET tracer enriches in certain regions of interest within the body and gains
molecular information from the animal in vivo. This has widespread applications, most importantly for oncology, inflammation, neurology and cardiovascular disorders, as well as metabolic disease, drug discovery and bone disease.
SPECT uses a contrast agent containing radionuclides which directly emit single photons. The contrast agent enriches in certain parts of the body of an animal and generates images of the radionuclide distribution in the body. SPECT has widespread application in animal investigations in vivo, most importantly in oncology, neurology and cardiovascular disorders.
CT is a technology based on X-rays which are used to generate a complete 3D data set. The most important applications are tissue sample analysis or non-invasive in vivo animal imaging. CT offers the highest spatial resolution of all preclinical imaging modalities and is especially useful to generate morphological information about the object or animal under investigation. CT is being used in a wide range of preclinical investigations in the fields of bone-orthopedics, cardiology, pulmonology, oncology and metabolism among others.
The Automation portfolio offers platforms and digital tools for research and development and quality control labs, supporting various applications including synthesis, NMR, XRD, and IR. These solutions are designed for scalability, modularity, and flexibility, enhancing lab connectivity, saving time and costs, and boosting outcomes. Rooted in scientific expertise, the technology provides compliance-ready and configurable systems to fit exact workflows.
The comprehensive Software suite of data management solutions is designed to facilitate digitalization and readiness for artificial intelligence and automation. It includes tools for experiment design, data analysis, and process management, enabling real-time understanding, monitoring, and control of processes. Additionally, it integrates robotics and automation technologies to provide transformative solutions, supporting the automation and digitalization of labs and factories under a unified platform.
The BSI BioSpin Segment also offers a range of services, product lifecycle support, scientific software and workflow solutions to customers who use BSI BioSpin products.
BSI CALID Segment
The BSI CALID Segment comprises the following Divisions:
•Bruker Life Sciences Mass Spectrometry: Primarily designs, manufactures and distributes life science mass spectrometry, or MS, instruments that can be integrated and used along with sample preparation or chromatography instruments to design an analytical workflow and mass spectrometry-based solutions including informatics software. Bruker Life Science Mass Spectrometry products are used in research, pharmaceutical and biotechnology development.
•Bruker Applied Mass Spectrometry: Primarily designs solutions based on mass spectrometry for the food, environmental, forensics, clinical research, and industrial markets. Analytical areas such as toxicology, safety, authenticity, adulteration, quality control of starting and finished goods are amongst the applications covered and are used across industrial, government and academic institutes. Mass spectrometers are sophisticated devices that measure the mass or weight of a molecule, and with the addition of trapped ion mobility spectrometry (TIMS) and collision cross section (CCS), can provide accurate information on the identity, quantity, and primary structure of a molecule. We offer advanced mass spectrometry solutions combining automated robotics for sample preparation and handling, reagent kits and other disposable products used in conducting tests, or assays, with applications specific software packages.
•Bruker Microbiology and Infection Diagnostics: Develops, manufactures and distributes innovative solutions for microbial identification, antibiotic resistance and susceptibility testing, polymerase chain reaction (PCR) based molecular diagnostic solutions for culture-free infectious disease diagnostics, histology, cellular staining, osmolarity testing as well as monoclonal antibodies and recombinant proteins as raw materials for diagnostic assays. Bruker Microbiology and Diagnostics solutions are used primarily in clinical microbiology, food microbiology, pharma microbiology, veterinary medicine and infectious disease testing. In accordance with the respective market segments the products are either labeled for in-vitro diagnostic (IVD) use, general purpose (GP) or research-use only (RUO). Our mass spectrometry solution and test kits, DNA test strips and fluorescence-based PCR technologies are designed for IVD use in clinical microbiology markets in certain configurations and certain countries, where regulatory approvals have been achieved. Our Genotype and Fluorotype molecular diagnostics (MDx) kits enable a culture-free detection and analysis of microbes and viruses directly from patient samples with a special focus on tuberculosis, HIV viral load, viral hepatitis and sexually transmitted diseases. Molecular Diagnostics utilize PCR assays and systems to provide diagnostic solutions for a number of different disease states, including respiratory, mycobacteria (including tuberculosis), virology, safety of immunocompromised patients, sexually transmitted infections, gastroenteric diseases as well as other microbiology tests. Depending on the assay being used, the technology enables users to ascertain basic identification of a certain infection, distinguish infections which can cause similar symptoms and detect specific microbial resistance, all from a single sample. Our portfolio includes FluoroType®, using fluorescence-based real-time PCR technology, and more recently we have also developed LiquidArray® assays based on melt curve analysis for optimized asymmetrical PCR technology. LiquidArray® uses light-on-off probes, providing a powerful technology to identify a broad number of indicators for different infections or
resistance markers from a single sample, providing greater depth of information. Following the acquisition of ELITechGroup, our portfolio now includes InGenius and BeGenius systems which are integrated Sample-to-Answer PCR systems that perform automated nucleic acid extraction, specific PCR reaction and data interpretation without user interaction.
•Bruker Optics: Primarily designs, manufactures and distributes research, analytical and process analysis instruments and solutions based on infrared and Raman molecular spectroscopy and imaging technologies. These products are utilized in industry, government and academia for a wide range of applications and solutions for life science, pharmaceutical, food and agricultural analysis, quality control and process analysis applications. Infrared and Raman spectroscopies are widely used in both research and industry as simple, rapid, nondestructive and reliable techniques for applications ranging from basic sample identification and quality control to advanced research and also in remote sensing setups for environmental control. The technologies and instruments of the division are also used for military and civil purposes in the field of detection of chemical, biological, radioactive, nuclear substances and explosives (CBRNE). The Bruker Optics Division also utilizes Fourier transform and dispersive Raman measurement techniques on an extensive range of laboratory and process spectrometers. The Bruker Optics Division’s products are complemented by a wide range of sampling accessories and techniques, which include, among others, microanalysis and high-throughput screening to help users find suitable solutions to analyze their samples effectively.
Customers of our BSI CALID Segment include pharmaceutical, biotechnology and diagnostics companies, contract research organizations, academic institutions, medical schools, nonprofit or for-profit forensic laboratories, agriculture, food and beverage safety, environmental and clinical microbiology laboratories, hospitals, and government departments and agencies.
During 2024, we continued our focus on accelerating growth, enhancing customer relationships, and driving innovation through the launch of our new NIR-spectrometer BEAM, the first dedicated single-point spectrometer utilizing the full power of FT-NIR spectroscopy as well as introducing our next-generation version of its Multi-Purpose Analyzer (MPA-III). We also introduced several other new technologies and workflows such as Novor V2.0, a machine learning algorithm trained on HLA peptides for immunopeptidomics; TwinScape™ a cloud-based liquid chromatography and mass spectrometry quality control application; lyco-PASEF® a glycopeptide analysis mode; a discovery service for deep plasma proteomics, with optional integration of Alamar Bio's NULISA® panels for inflammation and CNS studies; and we released the neoFLEX benchtop MALDI TOF for spatial biology application and the timsTOF Ultra 2 mass spectrometer, with enhanced sensitivity for low input and single cell applications.
Furthermore, during 2024, we completed our acquisition of Tornado Spectral Systems Inc. (Toronto, Canada), Nanophoton Corporation (Osaka, Japan), Dynamic Biosensors GmbH (Munich, Germany and Massachusetts, U.S.A.) as well as ELITechGroup in various locations.
The acquisition of Tornado Spectral Systems Inc., a Canadian company specializing in process Raman instruments, complemented the segments Raman spectrometers products with its patented High-Throughput Virtual Slit (HTVS™) technology and Raman analyzers such as the HyperFlux™ PRO Plus, Process Guardian™ and SuperFlux™ for more accurate chemical identification and quantification in mixtures and at low concentrations. The acquisition of Nanophoton Corporation augmented our Bruker Optics division with its broad portfolio of advanced Raman microscopes, capable of reducing measurement time by several hundred times and employing a unique beam-scanning method based on stochastic process and information theories. The acquisition of Dynamic Biosensors GmbH expanded our biophysical analytics portfolio including measurement of molecular interactions and kinetics. The acquisition of ELITechGroup which is active in the molecular diagnostics, microbiology and biomedical testing equipment field, complemented the segments MALDI BioTyper® platform for bacterial and fungal identification and establish Bruker as an innovative and growing infectious disease specialist in the IVD market.
The BSI CALID Segment’s instruments are based on the following technology platforms:
•MALDI-TOF—Matrix-assisted laser desorption ionization time-of-flight mass spectrometry, including tandem time-of-flight systems (MALDI-TOF);
•ESI-TOF—Electrospray ionization time-of-flight spectrometry, including trapped ion mobility (TIMS) based on ESI-quadrupole-TOF mass spectrometry (timsTOF);
•MRMS—Magnetic resonance mass spectrometry, including hybrid systems with a quadrupole front end (Q-q-MRMS);
•ITMS—Ion trap mass spectrometry;
•IMS – Ion mobility spectrometry;
•GC-MS—Gas chromatography-mass spectrometry systems utilizing triple-quadrupole time-of-flight mass spectrometry;
•LC-MS—Liquid chromatography-mass spectrometry systems utilizing triple-quadrupole time-of flight mass spectrometry;
•FT-IR—Fourier transform-infrared spectroscopy;
•NIR—Near-infrared spectroscopy;
•PCR—Polymerase chain reaction;
•Raman—Raman spectroscopy and microscopy, and
•QCL IR – Quantum Cascade LASER Infrared spectroscopy and microscopy.
MALDI-TOF mass spectrometers utilize an ionization process to analyze solid samples using a laser that combines high sample throughput with high mass range and sensitivity. Our MALDI-TOF mass spectrometers are particularly useful for applications in clinical diagnostics, environmental and taxonomical research and food processing and quality control. Specific applications include: oligonucleotide and synthetic polymer analysis; protein identification and quantification; peptide de novo sequencing; determination of post-translational modifications of proteins; interaction proteomics and protein function analysis; drug discovery and development; and fast body fluid and tissue peptide or protein biomarker detection. MALDI mass spectrometry allows users to classify and identify microorganisms quickly and reliably with minimal sample preparation efforts and life cycle costs. Our MALDI BioTyper solution, which serves the clinical microbiology market, enables identification, taxonomical classification or dereplication of microorganisms like bacteria, yeasts and fungi.
ESI-TOF mass spectrometers utilize an electrospray ionization process to analyze liquid samples. This ionization process, which does not dissociate the molecules, allows for rapid data acquisition and analysis of large biological molecules as well as complex biosamples. ESI-TOF mass spectrometers are particularly useful for: identification, protein analysis and functional complex analysis in proteomics and protein function; molecular identification in metabolomics, natural product and drug metabolite analysis; combinatorial chemistry high throughput screening; and fast liquid chromatography mass spectrometry, or liquid chromatography mass spectrometry (LC-MS), in drug discovery and development.
MRMS systems utilize high-field superconducting magnets to offer the highest resolution, selectivity, and mass accuracy currently achievable in mass spectrometry. Our systems based on this technology often eliminate the need for time-consuming separation techniques in complex mixture analyses. In addition, our systems can fragment molecular ions to perform exact mass analysis on all fragments to determine molecular structure. MRMS systems are particularly useful for: the study of the structure and function of biomolecules, including proteins, DNA and natural products; complex mixture analysis including body fluids or combinatorial libraries; high-throughput proteomics and metabolomics; and top-down proteomics of intact proteins without the need for enzymatic digestion of the proteins prior to analysis. We offer next-generation hybrid MRMS systems that combine a traditional external quadrupole mass selector and hexapole collision cell with a high-performance MRMS for further ion dissociation, top-down proteomics tools and ultra high-resolution detection.
IMS systems utilize Ion-mobility spectrometry (IMS) is an analytical technique used to separate and identify ionized molecules in the gas phase based on their mobility in a carrier buffer gas. Though heavily employed for military or security purposes, such as detecting chemical warfare agents and explosives (explosive trace detection, ETD), the technique also has many laboratory and analytical applications.
ITMS systems collect all ions simultaneously, which improves sensitivity relative to previous quadrupole mass spectrometers. Ion trap mass spectrometers are particularly useful for sequencing and identification based on peptide structural analysis, quantitative liquid chromatography mass spectrometry, identification of combinatorial libraries and generally enhancing the speed and efficiency of the drug discovery and development process.
GC-MS systems combine the features of gas chromatography and mass spectrometry to identify different substances within a test sample. The two components, used together, allow for a finer degree of substance identification than either system when used separately. The result is a quantitative analysis of the components and the mass spectrum of each component. Our GC-MS systems are available in triple quadrupole configurations and can be configured with a variety of options to suit a range of applications. Our GC-MS systems have applications in food and product safety, forensics, clinical and toxicology testing and environmental, pharmaceutical and chemical analysis.
LC-MS systems combine the separation features of liquid chromatography with the molecular identification features of mass spectrometry to separate, identify and quantify different substances within a test sample. As a complementary technique to GC-MS, which analyzes volatile compounds, LC-MS can be used to analyze a wide range of non-volatile compounds in complex samples. Our LC-MS systems are available in a wide range of configurations to suit a user’s specific needs. Although primarily used for life science applications, our LC-MS systems also have applications in food and product safety, forensics and clinical and toxicology testing, as well as environmental, pharmaceutical and chemical analysis.
FT-IR spectrometers utilize the mid- and far-infrared regions of the electromagnetic spectrum. Our FT-IR systems are commonly used for various quality control and materials research applications.
NIR spectrometers utilize the near-infrared region of the electromagnetic spectrum. Our NIR instruments are primarily used for quality and process control applications in the pharmaceutical, food and agriculture and chemical industries. The pharmaceutical industry is the leading user of NIR instruments, and applications include quality control, research and development and process analytical technology. The food and agricultural industry is the second largest user of NIR instrumentation, with an increasing demand for food, feed and beverage quality control.
PCR the innovative LiquidArray® technology optimizes asymmetrical multiplex PCR for creating excess single-stranded amplicons with detection by lights-on/-off probes that contain a quencher (lights-off) or both fluorophore and quencher (lights-on). During melting curve analysis, lights-on/-off probes detach from the amplicon at specific temperatures and as fluorescence is either emitted or suppressed, specific fluorescence signatures are generated by the unique FluoroCycler®XT thermocycler for the LiquidArray® multiplex PCR technology. The LiquidArray® technology supports multiplexed assays where a large number of targets is analyzed simultaneously from single samples. For example, the LiquidArray®-powered, WHO-endorsed FluoroType®MTDBR VER 2.0 assay detects more than 500 genotypes by the combined analysis of up to 45 different mutations in mycobacteria.
Raman spectroscopy provides information on molecular structure. The mechanism of Raman scattering is different from that of infrared absorption, in that Raman and IR spectra provide complementary information. Raman is useful for the identification of both organic and inorganic compounds and functional groups. It is a nondestructive technique and can be used for the analysis of both liquids and solids. Raman is well suited for use in the polymer and pharmaceutical industries, and has applications in the metals, electronics and semiconductors industries. The technique also has applications in life sciences, forensics and artwork authentication.
QCL IR spectroscopy utilizes a different source for generating Infrared (IR) light, which is a quantum cascade LASER which constitutes a tunable (mid-)IR LASER. Quantum cascade lasers are fundamentally different from the conventional thermal sources which are used for FT-IR. QCL exhibits a spectral power density which is typically orders of magnitudes higher than that of a thermal source, therefore providing advantages in terms of applicability of samples and speed of measurement particularly for microscopy or imaging experiments. This technique is applied in life sciences, forensics, semiconductor industries and others.
Additionally, the Bruker Detection product line offers a wide range of portable analytical and bioanalytical detection systems and related products for CBRNE detection. Our customers use these devices for nuclear, biological agent and chemical agent defense applications, anti-terrorism, law enforcement and process and facilities monitoring. Our CBRNE detection products use many of the same technology platforms as our life science products, as well as additional technologies, including infrared stand-off detection and ion mobility spectrometry, for handheld chemical detectors. We also provide integrated, comprehensive detection suites that include our multiple detection systems, consumables, training and simulators.
BSI NANO Segment
The BSI NANO Segment comprises of the following:
•The Bruker AXS Division: Designs, manufactures and distributes advanced X-ray instruments that use electromagnetic radiation with extremely short wavelengths to determine the characteristics of matter and the three-dimensional structure of molecules. This includes a product portfolio of instruments based on X-ray fluorescence spectroscopy (XRF), X-ray diffraction (XRD) and X-ray micro computed tomography (µCT), or X-ray microscopy, as well as spark optical emission spectroscopy systems (S-OES) used to analyze the concentration of elements in metallic samples.
•The Bruker Nano Analytics Division: Manufactures and markets analytical tools for electron microscopes, including energy-dispersive X-ray spectrometers (EDS), electron backscatter diffraction systems (EBSD) and µCT accessories, as well as mobile and bench top micro X-ray fluorescence (µXRF), total reflection X-ray fluorescence spectrometers (TXRF) and handheld, portable and mobile X-ray fluorescence (HMP-XRF) spectrometry instruments.
•The Bruker Nano Surfaces and Metrology Division: This division's products include atomic force microscopy instrumentation (AFM). Such instruments provide atomic or near atomic resolution of surface topography and nanoscale, mechanical, electrical and chemical information using nano scale probes. The Bruker Nano Surfaces and Metrology Division also provides non-contact nanometer resolution solution topography through white light interferometry and stylus profilometry. In addition, the division manufacturers and markets automated X-ray metrology, automated AFM defect-detection and photomask repair and cleaning equipment for semiconductor process control.
•Bruker Spatial Biology Division: Provides the CosMx Spatial Molecular Imager and GeoMx Digital Spatial Profiler technologies for interrogating spatial transcriptomics, the nCounter technology for quantitation of gene expression, and the Cellscape technology for precision spatial proteomics. These technologies allow researchers to elucidate gene and protein expression in a spatial context, which is useful for characterizing the underlying biology of organs and tissues, as well as for deriving deep biological insight into gene and protein expression for the development of biomarkers. In addition, Bruker Spatial Biology offers a variety of services for transcriptional profiling and multiomic analysis, spanning the spectrum from early discovery research to translational research and clinical trials.
•The Consolidated Fluorescence Microscopy Business Unit: Provides advanced optical fluorescence microscopy instruments with multi-photon, multipoint scanning confocal, miniature head-mount, 3D super-resolution, light-sheet modalities for studies in life science applications.
•The Bruker Cellular Analysis Business Unit: Provides single-cell biology research tools to deliver deep insights into cellular function and new perspectives on phenomes and genotype-to-phenotype.
Customers of our BSI NANO Segment include academic institutions, governmental customers, nanotechnology companies, semiconductor companies, raw material manufacturers, industrial companies, biotechnology and pharmaceutical companies, and other businesses involved in materials analysis.
During 2024 we acquired substantially all of the assets and rights associated with NanoString Technologies, a leading provider of life-science research solutions for spatial transcriptomics and gene expression analysis. We subsequently created the Bruker Spatial Biology division, as described above, consisting of NanoString Technologies and Canopy Biosciences, along with Bruker Spatial Genomics. Furthermore, during 2024, we acquired Nion LLC, a manufacturer of innovative high-end scanning transmission electron microscopes, enhancing Bruker’s product offerings in materials science research and providing the technology base for applications in electron diffraction crystallography. Subsequently the Nion operations were integrated into the Bruker AXS division.
The BSI NANO Segment systems are based on the following technology platforms:
•XRD—Polycrystalline X-ray diffraction, often referred to as X-ray diffraction;
•XRF—X-ray fluorescence, also called X-ray spectrometry, including handheld XRF systems;
•SC-XRD—Single crystal X-ray diffraction, often referred to as X-ray crystallography;
•µCT—X-ray micro computed tomography, X-ray microscopy;
•EDS—Energy dispersive X-ray spectroscopy on electron microscopes;
•EBSD—Electron backscatter diffraction on electron microscopes;
•S-OES—Spark optical emission spectroscopy;
•CS/ONH—Combustion analysis for carbon, sulfur, oxygen, nitrogen, and hydrogen in solids;
•STEM—scanning transmission electron microscopes
•AFM—Atomic force microscopy;
•FM—Fluorescence microscopy;
•SOM—Stylus and optical metrology;
•TMT—Tribology and mechanical test systems for analysis of friction and wear;
•NanoIR—Nanoscale infrared spectroscopy;
•Alicona—Focus variation optical technology for non-contact dimensional metrology;
•BCA—Optofluidic platforms and Proteomic Barcoding platforms;
•Canopy—Multiplexed fluorescence-based single cell imaging as well as multi-omics sample characterization; and
•NanoString – platforms for spatial transcriptomic analysis and for the measurement of gene expression through detection of RNA abundance
XRD systems investigate polycrystalline samples or thin films with single wavelength X-rays. The atoms in the polycrystalline sample scatter the X-rays to create a unique diffraction pattern recorded by a detector. Computer software processes the pattern and produces a variety of information, including stress, texture, qualitative and quantitative phase composition, crystallite size, percent crystallinity and layer thickness, composition, defects and density of thin films and semiconductor material. Our XRD systems contribute to a reduction in the development cycles for new products in the catalyst, polymer, electronic, optical material and semiconductor industries. Customers also use our XRD systems in academic and government research, as well as in a variety of other fields, including forensics, art and archaeology.
XRF systems determine the elemental composition of a material and provide a full qualitative and quantitative analysis. Our XRF systems direct X-rays at a sample, and the atoms in the sample absorb the X-ray energy. The elements in the sample then emit X-rays that are characteristic for each element. The system collects the X-rays, and the software analyzes the resulting data to determine the elements that are present. Our XRF products provide automated solutions on a turn-key basis for industrial users that require
automated, controlled production processes that reduce product and process cost, increase output and improve product quality. Our XRF products cover substantially all of the periodic table and can analyze solid, powder or liquid samples.
SC-XRD systems determine the three-dimensional structures of molecules in a chemical, mineral, or biological substance being analyzed. SC-XRD systems have the capability to determine structure in both small chemical molecules and larger biomolecules. SC-XRD systems direct an X-ray beam at a solid, single crystal sample. The atoms in the crystal sample scatter the X-rays to create a precise diffraction pattern recorded by an electronic detector. Software then reconstructs a model of the structure and provides the unique arrangement of the atoms in the sample. This information on the exact arrangement of atoms in the sample is a critical part of molecular analysis and can provide insight into a variety of areas, including how a protein functions or interacts with a second molecule. Our SC-XRD systems are designed for use in the life sciences industry, academic research and a variety of other applications.
µCT is X-ray imaging in 3D, by the same method used in hospital CT scans, but on a small scale with massively increased resolution. 3D microscopy allows users to image the internal structure of objects non-destructively on a very fine scale. Bruker µCT is available in a range of easy-to-use desktop instruments, which generate 3D images of the sample’s morphology and internal microstructure with resolution down to the sub-micron level. Our µCT systems are used for numerous applications in materials research and in the life sciences industry.
EDS systems analyze the chemical composition of materials under investigation in electron microscopes by utilizing the fact that atoms of different chemical elements, when exposed to the high energy electron beam generated by the microscope, irradiate X-rays of different characteristic energy. The evaluation of the energy spectrum collected by our spectrometer allows the determination of the qualitative and quantitative chemical sample composition at the current beam position. EDS systems allow for simultaneous analysis of all elements in the periodic table, beginning with atomic number 4 (beryllium). Our EDS systems are used for a range of applications, including nanotechnology and advanced materials research, as well as materials analysis and quality control. Customers for EDS systems include industrial customers, academia and government research facilities.
EBSD systems are used to perform quantitative microstructure analysis of crystalline samples in electron microscopes. The microscope’s electron beam strikes the tilted sample and diffracted electrons form a pattern on a fluorescent screen. This pattern is characteristic of the crystal structure and orientation of the sample region from which it was generated. It provides the absolute crystal orientation with sub-micron resolution. EBSD can be used to characterize materials with regard to crystal orientation, texture, stress, strain, and grain size. EBSD also allows the identification of crystalline phases and their distribution and is applied to many industries such as metals processing, aerospace, automotive, microelectronics and earth sciences.
S-OES instruments are used for analyzing metals. S-OES covers a broad range of applications for metals analysis from pure metals trace analysis to high alloyed grades and allows for analysis of a complete range of relevant elements simultaneously. S-OES instruments pass an electric spark onto a sample, which burns the surface of the sample and causes atoms to jump to a higher orbit. Our detectors quantify the light emitted by these atoms and help our customers to determine the elemental composition of the material. This technique is widely used in production control laboratories of foundries and steel mills.
CS/ONH carrier gas systems incorporate a furnace and infrared or thermal conductivity detection to analyze inorganic materials for the determination of carbon, sulfur, nitrogen, oxygen and hydrogen. Combustion and inert gas fusion analyzers are used for applications in metal production and processing, chemicals, ceramics and cement, coal processing, oil refining and semiconductors.
STEM provides atomic-resolution information about physical and electronic structure, chemical identity, and local bonding environments by passing an atom-sized beam of electrons through a sample. The beam is raster scanned, and a series of different detectors are used to make atomic-resolutions maps showing atomic locations, chemical species, shifts in valence states, and even vibrational modes (phonons). Our STEM systems are used primarily in academic and national lab settings for basic science, advancing our fundamental understanding of the materials that will drive the next generation of technologies such as batteries, computer chips, and quantum information.
AFM systems provide atomic or near-atomic resolution of material surface topography using a nano-scale probe that is brought into light contact with the sample being investigated. In addition to presenting a surface image, AFM can also provide quantitative nano-scale measurements of feature sizes, material properties, electrical information, chemical properties and other sample characteristics. Our AFM systems are used for applications in academic and governmental materials and biological research and semiconductor, data storage hard drive, LED, battery, solar cells, polymers, and pharmaceutical product development and manufacturing.
FM products use fluorescence microscopy to determine the structure and composition of life science samples. Our products include two-photon microscopes, multipoint scanning confocal microscopes, miniature head-mounted microscopes, super-resolution microscopes, light-sheet microscopes, laser illumination sources, photoactivation, photostimulation and photoablation accessories and synchronization and analysis software. Two-photon microscopes allow imaging deep into tissues and cells and are used widely in neuroscience. Multipoint scanning confocal systems allow live cell imaging with rapid acquisition of images for structural and composition analysis. Miniature head-mount microscopes allow monitoring of animal brain activity during free-roaming, naturalistic
behavior at cellular level. Super-resolution and single-molecule localization microscopy products allow imaging below the optical diffraction limit by an order of magnitude. Light-sheet based products allow fast 3D volume imaging with very low phototoxicity and photo-damage effects enabling live cell and large volume imaging.
SOM systems provide atomic or near-atomic two dimensional and three-dimensional surface resolution using white light interferometry, confocal optical and stylus profilometry methods. SOM profilers range from low-cost manual tools for single measurements to advanced, highly automated systems for production line quality assurance and quality control applications where the combination of throughput, repeatability and reproducibility is essential. SOM profilers support a range of applications in research, product development, tribology, quality control and failure analysis related to materials and machining in the automotive, orthopedic, ophthalmic, high brightness LED, semiconductor, data storage, optics and other markets.
TMT systems provide a platform for all types of common mechanical, friction, durability, scratch and indentation tests for a wide spectrum of materials. Tribology systems are utilized for both academic research of the fundamental material properties and industrial applications in the semiconductor, aerospace, petroleum, automotive and other industries.
NanoIR systems perform infrared (IR) spectroscopy at the nanoscale. Our systems use nanoprobe technology similar to what is used in our atomic force microscopes to deliver quantitative chemical information from the nanoscale to the sub-micron and macro scales. The NanoIR measurement gives the user varying physical and chemical properties with nanoscale spatial resolution in a diverse range of fields, including polymers, 2D materials, materials science, life science and the micro-electronics industry. Our systems allow nanoscale IR absorption spectroscopy with interpretable IR spectra that directly correlates to FTIR as well as the complementary technique of nanoscale s-SNOM. With our broadband sources, these systems allow broadband scientific spectroscopy.
Alicona systems combine the functionalities of a micro coordinate measurement machine (CMM) with those of a surface measurement system. These dimensional metrology systems are based on the pioneering development of optical focus-variation measurement algorithms and provide the noncontact measurement of form and roughness of complex, miniaturized geometries. These systems serve many quality assurance application areas requiring precision measurement and dimensional metrology, including aerospace, automotive, precision medical products, additive manufacturing, and micro precision manufacturing.
Canopy provides spatial profiling services and instruments which include both our Cellscape instrument and ChipCytometry service for quantitative, high plex, targeted spatial proteomics in single cell and tissues. These technologies, along with Canopy’s more basic IHC and FISH services, allow researchers to elucidate gene and protein expression in a spatial context, which is useful for deep biological insight into gene expression and for the development of biomarkers. Canopy also provides transcriptional and multi-omic profiling services covering a variety of assays, including RNASeq and qPCR.
BCA provides customers with, among other offerings, Optofluidic platforms such as the Beacon and Beacon Select as well as Proteomic Barcoding platforms, such as the IsoLight System and the IsoSpark System. These platforms provide scientists with opportunities to perform cell biology research through experiments using our proprietary consumables.
NanoString provides the CosMx Spatial Molecular Imager and GeoMx Digital Spatial Profiler for interrogating spatial transcriptomics; and the nCounter Analysis System for quantitation of RNA-based gene expression. These technologies allow researchers to measure gene expression in a spatial context at the regional and single-cell level, and to quantify RNA gene expression in a targeted manner, respectively. Together, these tools are useful for characterizing the underlying biology of organs and tissues, the spatial gene expression associated with various disease states, and for deriving insights to drive the development of biomarkers.
BEST Segment
The BEST Segment designs, manufactures and distributes superconducting materials, such as metallic low temperature superconductors (LTS) and high temperature superconductors (HTS), for use in magnetic resonance imaging, nuclear magnetic resonance, fusion energy research and other applications in medical, clinical, pharmaceutical, high energy physics, renewable energy and environmental research.
BEST Segment offers a range of multifilament round and rectangular LTS wires in both monolithic and wire-in-channel formats, as well as customization to precise specifications for individual applications including radio frequency accelerator cavities and modules, power couplers and linear accelerators. The Bruker Rod-Restack Process (RRP®) conductor portfolio is designed for fusion and high-energy physics applications that demand the highest magnetic fields. The BEST Segment HTS solutions support high field and ultra-high field applications using round cross-section conductor design and solenoid applications for the electrical and healthcare industries.
Additionally, BEST designs and manufactures Cuponal™ which is an engineered alternative to copper wire and busbar. Cuponal high conductivity copper-clad aluminum (CCA) retains all the surface properties of copper and provides a cost-effective and weight-saving alternative to solid copper primarily in the aerospace industry providing weight savings and improved fuel efficiency.
BEST also manufactures and sells non-superconducting high technology tools, such as synchrotron and beamline instrumentation, principally to customers engaged in materials research and high energy physics research.
Sales and Marketing
We maintain direct sales forces throughout North America, Europe, China, Japan, and elsewhere in the Asia Pacific region. We also utilize indirect sales channels to reach customers. We have various international distributors and independent sales representatives in parts of Asia, Latin America, Africa, the Middle East and Eastern Europe. These entities augment our direct sales force and provide coverage in areas where we do not have direct sales personnel. The sales cycle for our products is dependent on the size and complexity of the system and budgeting cycles of our customers. Our sales cycle is typically three to twenty-four months for academic and high-end research products and two weeks to six months for industrial products. The sales cycle of our low temperature superconducting materials is typically four to twelve months, with cycles of certain high-end materials exceeding one year. Sales of our high-end NMR and superconducting devices typically take more than one year and certain large, complex contracts can take more than two years to complete.
We have well-equipped applications and demonstration facilities and qualified application personnel who assist customers and provide product demonstrations in specific application areas. We maintain our primary demonstration facilities at our production facilities, as well as in other key market locations.
Seasonal Nature of Business
Historically, we have higher levels of revenue in the fourth quarter and lower levels of revenues in the first quarter of the year, which we believe is influenced by our customers’ budgeting cycles.
Major Customers
We have a broad and diversified customer base and we do not depend on any single customer. No single customer accounted for more than 10% of revenue in any of the last three fiscal years through December 31, 2024, nor more than 10% of accounts receivable as of December 31, 2024, and 2023.
Competition
Our existing products and solutions and any products and solutions that we develop in the future may compete in multiple, highly competitive markets. In addition, there has been a trend towards consolidation in our industries and some of our competitors have substantially greater financial, technical and marketing resources than we do. Our competitors may succeed in developing and offering products that could render our products or those of our strategic partners obsolete or noncompetitive. Our competitors may also have cost and price advantages based upon the value of their currencies compared with the U.S. Dollar or Euro. In addition, some of these competitors have significantly more experience in the life sciences, chemical and materials markets. Our ability to compete successfully will depend on our ability to develop proprietary products that reach our target markets in a timely manner and are technologically superior to and/or less expensive, or more cost effective, than products marketed by our competitors. Current competitors or other companies may possess or develop technologies and products that are more effective than ours. Our technologies and products may be rendered obsolete or uneconomical by technological advances or by entirely different approaches developed by one or more of our competitors.
We also compete with companies that provide analytical, or automation tools based on technologies other than those we offer. These technologies may prove to be more successful in meeting demands in the markets that our products and solutions are intended to serve. In addition, other companies may choose to enter our fields in the future. We believe that the principal competitive factors in our markets are technology-based applications expertise, product specifications, functionality, reliability, marketing expertise, distribution capability, proprietary patent portfolios and cost effectiveness.
Our significant competitors (by segment) are as follows:
BSI BioSpin
The BSI BioSpin Segment competes with companies that offer magnetic resonance spectrometers, mainly JEOL, QOne Instruments, Quad, Ciqtek, Magritek, Nanalysis and Oxford Instruments. In the field of preclinical imaging, BioSpin competes with PerkinElmer Inc., Mediso, Trifoil, MR Solutions and others.
BSI CALID
The BSI CALID Segment competes with a variety of companies that offer mass spectrometry-based and molecular spectrometry-based systems. BSI CALID’s competitors in the life science markets and chemical and applied markets include Danaher, Agilent, GE-Healthcare, Waters, Thermo Fisher Scientific, Shimadzu, Hitachi and JEOL. In the microbiology market, CALID competes with Biomerieux. In molecular diagnostics, CALID competes with a number of companies offering products for infectious disease diagnostics. CALID also competes with a variety of companies that offer molecular spectrometry-based systems, including Thermo Fisher Scientific, PerkinElmer, Agilent, Foss, ABB Bomem, Buchi, Shimadzu, Horiba, Rigaku and Jasco. CALID’s CBRNE detection customers are highly fragmented, and it competes with a number of companies in this area, of which the most significant competitor is Smiths Detection.
BSI NANO
The BSI NANO Segment competes with companies that offer analytical X-ray solutions, OES systems, AFM and SOM systems and optical fluorescence systems, primarily Rigaku, Oxford Instruments, Agilent, Thermo Fisher Scientific, Ametek’s Spectro and Edax divisions, PANalytical, Park Systems, Olympus, Nikon, Zeiss and Danaher’s Leica business.
BEST
BEST competes with Western Superconducting Technologies Co., Ltd. (WST), Luvata, and Jastec Co., Ltd. in low temperature superconducting materials. BEST further competes with Zanon, Mitsubishi Electric and AES in the development and supply of accelerator cavities, with Thales, Toshiba and CPI International in the development and supply of radio frequency couplers, with Mitsubishi Heavy Industries in the development and supply of superconducting accelerator modules and with AES and Thales for electron linear accelerators.
Manufacturing and Suppliers
Several of our manufacturing facilities are certified under ISO 9001:2008 international quality standards. We manufacture and test our magnetic resonance products at our facilities in Faellanden, Switzerland; Wissembourg, France; and Karlsruhe, Germany. We manufacture and test our preclinical imaging products at our facilities in Ettlingen, Germany; Wissembourg, France; Kontich, Belgium; and Faellanden, Switzerland. We manufacture and test our automation solutions at our facility in Basel, Switzerland. We manufacture and test our mass spectrometry products at our facilities in Bremen, Germany. We principally manufacture and test our molecular spectroscopy products, including CBRNE detection products, at our facilities in Ettlingen, Leipzig and Erlangen, Germany as well as Mississauga, Canada, Wallisellen, Switzerland and Osaka, Japan. We manufacture and test our X-Ray products at our facilities in Karlsruhe, Berlin and Geesthacht, Germany; Migdal HaEmek, Israel; Durham, UK; Kontich, Belgium; Kirkland, Washington, USA, and Penang, Malaysia. Our S-OES products are manufactured at our sites in Karlsruhe, Germany and Penang, Malaysia. AFM instruments and components are manufactured at Santa Barbara and Camarillo, California, USA; Berlin, Germany; and Penang, Malaysia. We manufacture and test the majority of our energy and superconducting products at our facilities in Hanau, Germany; Bergisch Gladbach, Germany; Perth, Scotland; and Carteret, New Jersey, U.S.A. Manufacturing processes at our facilities in Europe, Israel and California, U.S.A. include all phases of manufacturing, such as machining, fabrication, subassembly, system assembly, and final testing. Our other facilities primarily perform high-level assembly, system integration and final testing. We typically manufacture critical components in-house to ensure key competence and outsource to third party manufacturers non-critical components.
We purchase materials and components from various suppliers that are either standard products or built to our specifications. We obtain some of the components included in our products from a limited group of suppliers or from a single-source supplier for items such as ceramics, charge coupled device area detectors, X-ray tubes, robotics, infrared optics and others. BEST has an ongoing collaboration and a joint technology development agreement with Allegheny Technologies Incorporated to advance state-of-the-art niobium-based superconductors, including those used in MRI magnets for the medical industry, and preclinical MRI magnets used in the life-science tools industry.
Research and Development
We commit substantial capital and resources to internal and collaborative research and development projects in order to provide innovative products and solutions to our customers. We conduct research primarily to enhance system performance and improve the reliability of existing products, and to develop revolutionary new products and solutions. Our research and development efforts are conducted for the relevant products within each of the operating segments, as well as in collaboration with others on areas such as microfluidics, automation and workflow management software. We have been the recipient of government grants from Germany and the United States for various projects related to early-stage research and development. We have generally retained, at a minimum, non-exclusive rights to any items or enhancements we develop under these grants. The German government requires that we use, and market technology developed under grants in order to retain our rights to the technology. We have also accepted some sponsored
research contracts from private sources. Additionally, the Company has been able to gain access to research and development capabilities through acquisitions, acquiring the intellectual property, technology and expertise of the acquired companies.
Our significant research and development activities (by segment) are as follows:
BSI BioSpin Segment:
The research and development performed in the BSI BioSpin Segment is primarily conducted at our facilities in Ettlingen, Germany; Faellanden, Switzerland and Wissembourg, France. The BSI BioSpin Segment maintains technical competencies in core magnetic resonance technologies and single- and multimodal imaging technologies and capabilities, including NMR, EPR, MRI, MPI, PET and CT. The most recent technological innovations included Bruker’s ultra-high-field class (1GHz and above) in the NMR and MRI product lines and the benchtop Fourier NMR platform. As part of our continuous development of systems and software, we have achieved major milestones in 2023 to make NMR and MRI technologies accessible to more labs, such as reduced siting requirements.
BSI CALID Segment:
The research and development performed in the BSI CALID Segment is primarily conducted at our facilities in Bremen, Ettlingen, Leipzig and Erlangen, Germany; Faellanden and Wallisellen, Switzerland; Toronto, Canada; Osaka, Japan, Wissembourg, France; Athens, Greece; and Torino, Italy. The BSI CALID Segment maintains technical competencies in core mass spectrometry technologies and capabilities, including: MALDI, ESI and EI/CI ion source, TOF, TOF/TOF, ion traps, MRMS, quadrupole and IMS analyzers and bioinformatics. Recent projects include the innovative timsTOF mass spectrometer for separation and analysis of unresolved compounds and conformations and further enhanced instrument sensitivity. In addition, new sample preparation and automation workflows were developed for deep plasma proteomics (Biognosys P2 workflow and Preomics ENRICHplus kit). The BSI CALID Segment also maintains technical competencies in core vibrational spectroscopy technologies and capabilities, including FT-IR, NIR and Raman.
BSI NANO Segment:
The research and development performed in the BSI NANO Segment is primarily conducted at our facilities in Karlsruhe, Berlin and Leipzig, Germany; Penang, Malaysia; Madison, Wisconsin, Eden Prairie, Minnesota, San Jose, Santa Barbara and Emeryville, California, Bothell, Washington, and St. Louis, Missouri, U.S.A. The BSI NANO Segment maintains technical competencies in core X-ray technologies and capabilities, including detectors used to sense X-ray and X-ray diffraction patterns, X-ray sources and optics that generate and focus the X-rays, robotics and sample handling equipment that holds and manipulates the experimental material, and software that generates the structural data. Recent projects include fluorescence microscopy with simultaneous, all-optical stimulation and imaging platforms for optogenetics neuroscience research and light sheet cell microscopy systems, which enable brain research and high-resolution live cell research and single-cell biology research tools to deliver deep insights into cellular function and new perspectives on phenomes and genotype-to-phenotype linkages. The BSI NANO Segment also has competencies in AFM technology, which involve sub-angstrom level position and motion control, as well as sub-pico newton force control. The BSI NANO Segment technologies also include 3D optical inference-based microscopy, stylus profilometry, tribology testing, nano-indentation, optical fluorescence two-photon microscopy, multipoint scanning microscopy, high-speed, 3D super-resolution florescence microscopy and spatial biology and single-cell targeted proteomics technologies. Recent innovations include elemental analyzer systems for advanced applications and research and simultaneous, all-optical stimulation and imaging platforms for neuroscience applications.
BEST Segment:
The research and development performed in the BEST Segment is primarily conducted at our facilities in Hanau and Bergisch Gladbach, Germany; and Carteret, New Jersey, U.S.A. BEST maintains technical competencies in the production and development of low and high temperature superconducting materials and devices.
Intellectual Property
Our intellectual property consists of patents, copyrights, trade secrets, know-how, and trademarks. Protection of our intellectual property is a strategic priority for our businesses because of the length of time and expense associated with bringing new products through the development process and to the marketplace. We have a substantial patent portfolio, and we intend to file additional patent applications as appropriate. We believe our owned and licensed patent portfolio provides us with a competitive advantage. This portfolio permits us to maintain access to a number of key technologies. We license our owned patent rights where appropriate. We intend to enforce our patent rights against infringers, if necessary. The patent positions of life sciences tools companies involve complex legal and factual questions. As a result, we cannot predict the enforceability of our patents with certainty. In addition, we are
aware of the existence from time to time of patents in certain countries, which, if valid, could impair our ability to manufacture and sell products in these countries.
We also rely upon trade secrets, know-how, trademarks, copyright protection and licensing to develop and maintain our competitive position. We generally require the execution of confidentiality agreements by our employees, consultants, and other scientific advisors. These agreements provide that all confidential information made known during the course of a relationship with us will be held in confidence and used only for our benefit. In addition, these agreements provide that we own all inventions generated during the course of the relationship.
Government Contracts
We are a party to various government contracts. Under some of these government contracts, the government may receive a license or similar rights to intellectual property developed under the contract. However, under the government contracts we enter, we generally receive at least non-exclusive rights to any items or technologies we develop. Although we transact business with various government agencies, we believe that no government contract is of such magnitude that a renegotiation of profits or termination of the contract or subcontracts at the election of the government would have a material adverse effect on our financial results.
Government Regulation
We are required to comply with federal, state, and local environmental protection regulations. We do not expect this compliance to have a significant impact on our capital spending, earnings or competitive position.
Certain of our products are subject to the U.S. Food and Drug Administration’s, or the FDA’s, requirements for electronic radiation emitting products, which include requirements related to record-keeping and reporting; labeling; notification; product repairs, replacements and refunds; importation; and performance standards. For example, prior to introducing a product in the United States, our Bruker AXS subsidiary provides notice to the FDA in the form of a Radiation Safety Initial Product Abbreviated Report, which provides identification information and operating characteristics of the product. If the FDA finds that the report is complete, it provides approval in the form of what is known as an accession number. Bruker AXS may not market a product in the U.S. until it has received an accession number. In addition, Bruker AXS submits an annual report to the FDA that includes the radiation safety history of all products it sells in the United States. Bruker AXS is required to report to the FDA incidents of accidental exposure to radiation arising from the manufacture, testing, or use of any of its products. Bruker AXS also reports installations of its products to state government regulatory agencies responsible for the regulation of radiation emitting devices. For sales in Germany, Bruker AXS registers each product with the local authorities. In some countries where Bruker AXS sells systems, Bruker AXS uses the certificate that Bruker AXS obtained from the federal authorities in Germany to assist it in obtaining a license, registration or certificate, as applicable, from the country or its relevant authorities in which the sale occurs.
Our Bruker AXS subsidiary possesses low-level radiation materials licenses from the local radiation safety authority, Gewerbeaufsichtsamt Karlsruhe, for its facility in Karlsruhe, Germany, and from the local radiation safety authority, Kanagawa Prefecture, for its facility in Yokohama, Japan, as well as from various other countries in which it sells its products. Our Bruker Optics subsidiary possesses low-level radiation licenses for facilities in Billerica, Massachusetts and Ettlingen and Leipzig, Germany. The U.S. Nuclear Regulatory Commission also has regulations concerning the exposure of our employees to radiation.
Certain of our products are subject to regulation as medical devices in the United States by the FDA and by similar regulatory bodies in other countries where such products are sold. The regulatory requirements imposed by the FDA and other regulatory bodies govern a wide variety of product-related activities, from quality management, design and development to labeling, manufacturing, promotion, sales, and distribution. As such, we continually invest in our manufacturing infrastructure to gain and maintain certifications and registrations necessary for the relevant level of regulatory clearance. We also are required to maintain processes and systems for medical device product submissions. For example, our MALDI BioTyper CA system is subject to regulation by the FDA as a medical device and requires FDA premarket review and clearance via the 510(k) premarket notification process and our IVD-CE Certified MALDI BioTyper system is subject to regulation in the European Union under the provisions of Directive 98/79/EC and Regulation (EU) 2017/746. In addition, certain product changes, including changes to the product indications or label claims, could trigger the requirement for a new 510(k) or other FDA or foreign regulatory premarket submission. The process of preparing a premarket submission to, and obtaining marketing approval, authorization, or clearance from the FDA and comparable foreign regulatory authorities (including notified bodies in the EU) for new products, or for enhancements or modifications to existing products, could take a significant amount of time, require the expenditure of substantial financial and other resources, and require rigorous and expensive pre-clinical and clinical testing. Additionally, the FDA or comparable foreign regulatory authorities could impose limitations on the indications for use of our products. Should we pursue an FDA or comparable foreign regulatory authority clearance, authorization, or approval for a new device or device modification, we cannot be certain that we will receive required clearance, authorization, or approval on a timely basis or at all. The failure to receive clearance, authorization, or approval for
significant new products or modifications to existing products on a timely basis or at all could have a material, adverse effect on our financial condition and results of operations.
Both before and after a medical device product is commercially released, we have ongoing responsibilities under FDA and foreign regulations. For example, we are required to comply with the FDA’s Quality System Regulation, which sets forth the good manufacturing requirements for medical devices. These include requirements related to design controls, production and process controls, process validation, purchasing controls, supplier oversight, complaint handling and investigation, corrective and preventative actions, and record-keeping. In addition, the FDA’s medical device reporting regulation requires us to provide information to the FDA whenever we become aware that there is evidence that reasonably suggests that a device may have caused or contributed to a death or serious injury or, that a malfunction occurred which would be likely to cause or contribute to a death or serious injury upon recurrence. We are also required to report to the FDA if we initiate a device removal (recall) or correction to reduce a risk to health posed by the device or to remedy a violation which may present a risk to health. The FDA and comparable foreign regulatory authorities also regulate the promotion and marketing of medical devices and require that manufacturers only make promotional claims or statements that are consistent with the indications and labeling cleared, authorized, or approved by the FDA or other regulatory authorities. The FDA and comparable foreign regulatory authorities may take enforcement action against us, should the FDA determine we have engaged in “off-label” promotion or other violative marketing activities. In addition, FDA and comparable foreign regulatory authorities may take enforcement action should they determine that we have marketed any of our other (non-medical device) products for FDA-regulated purposes without obtaining the required regulatory clearances, authorizations, or approvals or ensuring such products comply with other FDA and comparable foreign regulatory requirements.
The European Union Directive 98/97/EC (IVDD) was replaced by the Regulation (EU) 2017/746 of April 5, 2017, on in vitro diagnostic medical devices (IVDR). The IVDR became applicable in May 2022. The regime changes significantly with the IVDR. In comparison to the IVDD, the IVDR requires, among other things, more clinical evidence to demonstrate the claimed benefits and safety of the device in relation to its stated purpose, stricter classification and CE-marking requirements and ongoing post-market follow-up to ensure conformity. The IVDR also requires new databases to be set up to track which devices are CE marked and to register clinical studies and post-market monitoring. In addition, tracing is enhanced by a Unique Device Identification (UDI) System and through requirements on other economic operators in the supply chain. Our products that are currently approved under the IVDD, and not already placed on the market or put into service, must be recertified under the IVDR.
Backlog
Our backlog consists of firm orders under non-cancelable purchase orders received from customers. Total remaining performance obligations as of December 31, 2024, and 2023 was approximately $2,090.4 million and $2,226.7 million, respectively. The decrease in our backlog in 2024 compared to 2023 was primarily driven by lower BEST order bookings. We generally experience varying revenue levels in the first three quarters of the year, while our fourth quarter revenues have historically been stronger than the rest of the year. As a result, backlog on any particular date is not necessarily a reliable indicator of long-term revenue performance.
Human Capital
We are committed to enabling scientists to make breakthrough discoveries and develop new applications that improve the quality of human life. Our employees are a critical component of that mission. We endeavor to attract, develop and retain top talent by offering our employees a challenging but rewarding work experience, as well as competitive compensation and benefits. Further, we strive to create a work environment that promotes integrity, respect and trust among our employees.
Workforce Composition
As of December 31, 2024, and 2023, Bruker employed the following full-time employees:
| | | | | | | | |
| | Number of Employees | |
| | 2024 | | | 2023 | |
Full-time employees in the United States | | | 2,408 | | | | 1,792 | |
Full-time employees in other countries | | | 8,988 | | | | 7,915 | |
Total employees | | | 11,396 | | | | 9,707 | |
The table below provides a breakdown of Bruker’s employees by functional area.
| | | | | | | | |
| | Number of Employees | |
| | 2024 | | | 2023 | |
Production and distribution employees | | | 5,221 | | | | 4,469 | |
Selling and marketing employees | | | 2,692 | | | | 2,313 | |
General and administrative employees | | | 1,437 | | | | 1,174 | |
Research and development employees | | | 2,046 | | | | 1,751 | |
Total employees | | | 11,396 | | | | 9,707 | |
Talent, Development and Workforce Strategy
Bruker is committed to providing a variety of learning opportunities to advance the personal and professional goals of our global teams. Our talent and development programs cover a variety of topics including those focused on technical expertise, leadership and communication skills.
A global performance management process promotes regular feedback and coaching by managers to develop employees. Throughout the year, managers and employees engage in annual objective setting, mid-year reviews of performance as well as a year-end performance evaluation. Managers and employees also participate in career conversations throughout the year. These discussions are critical tools that reinforce the alignment of employee activities and career goals throughout the year and provide employees opportunities to grow. Performance assessments also support the identification of our high performers and high potential employees based on merit. These employees are encouraged to continue their professional development with additional coaching and on the job learning opportunities to enhance their readiness for future advancement.
In 2024, we continued with our supervisor training program for newly hired or promoted first line leadership. This program is expanding to other employee groups within Bruker to provide a consistent foundation of knowledge and expectations for our leaders. Additionally, our robust leadership program brings together participants from across the globe to provide education aimed to enhance their skills in business acumen, leadership, and communication. A practical opportunity to apply these skills is included as part of the program under the mentorship of experienced leaders. The coaching from internal leaders is supported also by professional external mentorship ensuring a comprehensive learning experience.
Employee Engagement
Bruker is committed to fostering a culture of continuous learning and knowledge sharing to support development and retention, and also recognizes the importance of inclusion. Inclusion is an essential element of our core values and is crucial to the dynamic, entrepreneurial working environment our employees thrive in, and aligns with our mission to innovate responsibly and with integrity.
We support several initiatives that promote inclusion at Bruker:
•Cross-functional collaboration and teamwork, encouraging employees to build relationships across different business units and geographies.
•Employee engagement programs, including professional networking opportunities, internal mentorship, and knowledge sharing platforms.
•Global team-building events, providing employees with opportunities to interact and strengthen connections.
Our employees play active roles in these initiatives, often creating and facilitating them directly. Bruker has continued to support events such as Germany’s nationwide Girls’ Day and celebration of the festival of colors, HOLI, in India. These programs and events help employees develop their skills, expand their networks, and contribute meaningfully to our business objectives. They also provide critical connections for new hires and establish internal networks across functions for employees who may not otherwise have opportunity to interact.
Employee Health and Safety
Bruker prioritizes the safety and wellbeing of its employees. Bruker accomplishes this through compliance with applicable laws and regulations regarding workplace safety, including recognition and control of workplace hazards, the elimination of unsafe manufacturing and workplace practices, tracking injury and illness rates, utilizing a global travel health program and maintaining detailed emergency and disaster recovery plans. We are committed to reducing safety risks across our business groups and at our
corporate and manufacturing sites worldwide. The following are examples of initiatives and programs designed with employee health and safety in mind:
•One of our German facilities has a robust accident prevention program and contributes to active environmental protection. This has been recognized with an ISO 45001 certification.
•A confidential Employee Assistance Program has been implemented at several new sites providing no-cost support to employees and offering assistance on several personal topic areas.
•Many locations throughout the globe encourage employees to be mindful of a healthy lifestyle such as organized group exercise activities. These activities not only enhance employee physical health, but emotional and mental health as well through increasing camaraderie among colleagues.
Available Information
We maintain a website at www.bruker.com. We make available on our website documents describing our corporate governance and our Code of Conduct. We are not including the information contained on our website as a part of, or incorporating it by reference into, this Annual Report on Form 10-K. We make available free of charge through our website our annual reports on Form 10-K, our proxy statements, quarterly reports on Form 10-Q, current reports on Form 8-K, and amendments to these reports filed with or furnished to the SEC pursuant to Sections 13(a) or 15(d) of the Securities Exchange Act of 1934, as amended, as soon as reasonably practicable after they are electronically filed with or furnished to the SEC. The SEC also maintains a website site that contains periodic reports, proxy and information statements and other information regarding our filings at www.sec.gov.
ITEM 1A RISK FACTORS
The following risk factors should be considered in conjunction with the other information included in this Annual Report on Form 10-K. This report may include forward-looking statements that involve risks and uncertainties. In addition to those risk factors discussed elsewhere in this report, we identify the following risk factors, which could affect our actual results and cause actual results to differ materially from those in the forward-looking statements.
Risk Factor Summary
Our business is subject to numerous risks and uncertainties, including those described in Item 1A “Risk Factors.” These risks include, but are not limited to, the following:
•Supply chain issues, including increasing demand for certain components used in our products and production delays, has and could continue to result in significant additional costs and manufacturing inefficiencies, which could adversely impact our revenue, increase our manufacturing costs and have a material adverse effect on our operating results;
•Unfavorable economic or political conditions in the countries in which we operate may have an adverse impact on our business results or financial condition;
•Adverse global economic conditions, and geopolitical tensions, including in Ukraine, the Middle East, China and other regions, and other conditions that impact our increasingly global operations could have a negative effect on our business, results of operations and financial condition and liquidity;
•New U.S. Tariffs Imposed or Threatened Could Result in Increased Costs;
•A meaningful portion of our revenue is derived from U.S. academic institutions, research organizations and other entities that rely in part on U.S. academic and government funding, including NIH grants, and any reduction in, modification of the terms and allowable overhead rates of, or delay in such research funding, could adversely affect our U.S. academic and governmental customers, and our revenues and financial performance;
•We derive a significant portion of our revenue from international sales and are subject to the operational risks of doing business in foreign countries due to potential macroeconomic effects, including financial market volatility and disruption, inflationary concerns, changes in tax laws and regulations, interest and currency exchange rates, uncertain economic conditions in the United States and abroad, and additional tariffs, including those imposed or that may be imposed by the new presidential administration in the U.S.;
•If our products fail to achieve and sustain sufficient market acceptance across their broad intended range of applications, we will not generate expected revenue;
•Our products compete in markets that are subject to rapid technological change, and one or more of the technologies underlying our products could be made obsolete by new technology;
•If investment in life and material science research spending declines, our ability to generate revenue may suffer;
•Any reduction or shift in the capital resources, including as a result of changes to governmental policies and programs, or government funding of our customers could reduce our sales and impede our ability to generate revenue;
•Disruptions at any of our manufacturing facilities could adversely affect our business;
•In addition to the risks applicable to our life science and materials analysis products, our CBRNE detection products are subject to a number of additional risks, including lengthy product development and contract negotiation periods and certain risks inherent in long-term government contracts;
•Our debt may adversely affect our cash flow and may restrict our investment opportunities or limit our activities;
•If we lose our strategic partners, our marketing and sales efforts could be impaired;
•We face risks related to sales through distributors and other third parties that we do not control, which could harm our business;
•Our operations are dependent upon a limited number of suppliers and contract manufacturers;
•Supply shortages and increasing prices of raw materials could adversely affect the gross profit;
•If we are unable to effectively protect our intellectual property, third parties may use our technology, which would impair our ability to compete in our markets;
•We may be involved in lawsuits to protect or enforce our patents that are brought by us which could be expensive and time consuming and, if determined adversely, could adversely affect our patent position;
•Our manufacture and sale of products could lead to product liability claims for which we could have substantial liability;
•We are subject to environmental laws and regulations, which may impose significant compliance or other costs on us; and
•We operate as an entrepreneurial, decentralized company, which presents both benefits and certain risks. In particular, significant growth in a decentralized operating model may put strain on certain business group resources and our corporate functions, which could materially and adversely affect our business, financial condition and results of operations.
If any of the risks described above actually occur, our business, revenues, profitability, results of operations, financial condition, cash flows, reputation and stock price could be materially adversely affected. Additional risks and uncertainties not currently known to us or that we currently do not view as material may also become materially adverse to our business in future periods or if circumstances change.
Risks Related to Our Business and Industry
Supply chain issues, including increasing demand for certain components used in our products and production delays, has and could continue result in significant additional costs and manufacturing inefficiencies, which could adversely impact our revenue, increase our manufacturing costs and have a material adverse effect on our operating results.
We have experienced supply chain interruptions or increased costs as a result of general global economic conditions, including economic instability, changes to governmental policies and programs, changes in tax laws and regulations, export controls, economic sanctions and trade restrictions, including those related to the ongoing conflict between Russia and Ukraine or conflict in the Middle East and surrounding areas, changes to trade policies, including higher tariff rates and customs duties imposed or that may be imposed by the new presidential administration in the U.S., continued threat of terrorism and heightened security and military action in response thereto, or any other current or future acts of terrorism, war (such as the ongoing geopolitical tensions and military conflicts in China and other regions between the U.S. and China ), a tight labor market and other factors, including natural events and disasters. Various factors, including increased demand for certain components and production delays, are contributing to shortages of certain components used in our products including microelectronic components and increased difficulties in our ability to obtain a consistent supply of materials at stable pricing levels. Supply shortages and longer lead times for components used in our products, including limited source components, have and can result in significant additional costs and inefficiencies in manufacturing. A shortage of key components has in the past and may in the future cause a significant disruption to our production activities, which could have a substantial adverse effect on our financial condition or results of operations. If we are unsuccessful in resolving any such component shortages in a timely manner, we could experience a significant adverse impact on the timing of our revenue, a possible loss of revenue, or an increase in manufacturing costs, any of which could have a material adverse impact on our operating results.
Unfavorable economic or political conditions in the countries in which we operate may have an adverse impact on our business results or financial condition.
Our businesses and results of operations are affected by international, national and regional economic and political conditions. Our businesses or financial results may be adversely impacted by unfavorable changes in economic or political conditions in the countries and markets in which we operate, including, among others, adverse changes in interest rates or tax rates, volatility in financial and commodity markets, contraction in the availability of credit in the marketplace, higher tariffs, including those that have been or may be imposed by the new presidential administration in the U.S., armed hostilities, such as the ongoing conflict between Russia and Ukraine or conflict in the Middle East and surrounding areas, and other events related thereto, such as economic sanctions and trade restrictions, geopolitical tensions, including tensions in China and other regions, changes in capital spending patterns, and renegotiation of existing trade agreements in the United States or countries that could adversely affect our supply chain and our business.
Our revenue from U.S. operations represented approximately 28% and 26% of total consolidated revenue for fiscal 2024 and 2023, respectively. Our revenue from operations in Europe represented approximately 35% and 33% of total consolidated revenue for fiscal years 2024 and 2023 respectively. Our revenue from operations in the Asia Pacific region represented approximately 29% and 33% of total consolidated revenue for fiscal years 2024 and 2023 respectively. Economic factors that could adversely influence demand for our products include the impact of geopolitical tensions and any related sanctions implemented, continued uncertainty about global economic conditions, including as a result of any natural disasters, pandemics, or epidemics, leading to ongoing
reductions in investment, changes in government spending levels and/or priorities, the size and availability of government budgets, customers’ and suppliers’ access to credit and other macroeconomic factors affecting government, academic or industrial spending behavior. Slower economic growth or a deterioration in economic conditions could result in a decrease in government funding for scientific research, a delay in orders from current or potential customers or a reduction in purchases of our products.
We cannot predict how changes in economic conditions or political instability will affect our customers and suppliers or how any negative impact on our customers and suppliers might adversely impact our business results or financial condition.
Adverse global economic conditions, and geopolitical tensions, including in Ukraine, the Middle East, China and other regions, and other conditions that impact our increasingly global operations could have a negative effect on our business, results of operations and financial condition and liquidity.
As a global company, our performance is affected by global economic conditions as well as geopolitical tensions and other conditions with global reach. In recent years, concerns about the global economic outlook have adversely affected market and business conditions in general. Macroeconomic weakness and uncertainty make it more difficult for us to manage our operations and accurately forecast revenue, gross margin and expenses. Geopolitical tensions, including the conflict between Russia and Ukraine and related economic sanctions, the conflict in the Middle East and surrounding areas, the possible expansion of such conflicts and potential geopolitical consequences, the ongoing tensions between the United States and China, tariff and trade policy changes, and increasing potential of conflict involving countries in Asia that are significant to the Company’s supply chain operations, such as Taiwan and China, have resulted in increasing global tensions and create uncertainty for global commerce. As a result of the adverse economic impacts resulting from the conflict between Russia and Ukraine, such as increased prices for and a reduced supply of key metals used in our products, the Company has ceased its Russian operations. Sustained or worsening of global economic conditions and increasing geopolitical tensions may increase our cost of doing business, materially disrupt our supply chain operations, cause our customers to reduce or delay spending and intensify pricing pressures. We have recently experienced an increase in inflationary pressures in many of the jurisdictions in which we operate. We have and may continue to offset the effect of these inflationary pressures by increasing the prices of our products to customers. However, we may not be fully able to pass additional costs on to our customers, which could have a negative impact on our results of operations and financial condition. Any or all of these factors could negatively affect demand for our products and our business, financial condition and result of operations.
New U.S. Tariffs Imposed or Threatened Could Result in Increased Costs.
The new U.S. presidential administration has imposed or threatened to impose tariffs ranging from 10-25% on a variety of countries, including China, Mexico, Canada and the EU, and products, including steel, aluminum, copper, automobiles, and digital services, and is likely to continue to do so in the future. In addition, the U.S. has threatened the imposition of reciprocal tariffs on those countries who impose unequal tariffs or taxes on U.S. exports. While to date, the only tariff increase in effect is the additional 10% tariff on U.S. imports from China, which is potentially increasing to 20% on March 4, 2025, there is no guarantee that other threatened tariff increases will not become effective in the future. Given the current uncertainty around the threat of tariff increases, it is not possible to estimate the potential effect or to determine the level of materiality to the Company. Such tariff increases, if adopted and applicable to U.S. imports by the Company or its suppliers, could result in increased costs, including potential costs related to shifting more production to the U.S. or other countries, that might be material to the Company.
A meaningful portion of our revenue is derived from U.S. academic institutions, research organizations and other entities that rely in part on U.S. academic and government funding, including NIH grants, and any reduction in, modification of the terms and allowable overhead rates of, or delay in such research funding, could adversely affect our U.S. academic and governmental customers, and our revenues and financial performance.
A substantial portion of our revenue in the United States is derived from academic and governmental institutions, research organizations and other entities that may rely in part on academic and government funding, including grants from the U.S. National Institutes of Health (NIH) and other U.S. government agencies. Government funding may fluctuate and is subject to annual appropriations and budgetary constraints, and there is no assurance that such funding will continue at current levels. If U.S, academic and governmental researchers experience reductions or delays in government funding, or modifications of the terms or conditions of funding, including allowable overhead rates, they may reduce or delay their purchases of our products and services, which could have a material effect on our revenues and financial performance.
We derive a significant portion of our revenue from international sales and are subject to the operational risks of doing business in foreign countries.
International sales account, and are expected to continue to account, for a significant portion of our total revenues. Our revenue from non-U.S. operations represented approximately 72% and 74%, respectively, of our total consolidated revenue for fiscal 2024 and 2023, respectively. Our international operations are, and will continue to be, subject to a variety of risks associated with conducting business internationally, many of which are beyond our control. These risks, which may adversely affect our ability to achieve and maintain profitability and our ability to sell our products internationally, include:
•changes in foreign currency translation rates;
•changes in regulatory requirements;
•legislation and regulation, including tariffs imposed or that may be imposed by the new presidential administration in the U.S., relating to the import or export of high technology products, which legislation and regulation may conflict with U.S. law and may have an adverse impact on our business results;
•the imposition of government controls;
•political and economic instability, the possibility of an economic recession in certain key markets such as Germany, international hostilities and resulting sanctions, acts of terrorism and governmental restrictions, inflation, trade relationships and military and political alliances;
•costs and risks of deploying systems in foreign countries;
•compliance with export laws and controls and trade embargoes in multiple jurisdictions, which may conflict with U.S. law and may have an adverse impact on our business results;
•limited intellectual property rights;
•the burden of complying with a wide variety of complex foreign laws and treaties, including unfavorable labor regulations, specifically those applicable to our European operations; and
•compliance with U.S. and local laws affecting the activities of U.S. companies abroad, including the United States Foreign Corrupt Practices Act, or FCPA, and local anti-bribery laws.
The United States has implemented tariffs on certain imported goods and the new presidential administration in the US has imposed or threatened to impose additional tariffs on certain imported products, including reciprocal tariffs. These additional tariffs could include items imported by us from China or other countries. In addition, China has imposed tariffs on a wide range of American products in retaliation for these new American tariffs. As a result, there is a concern that the imposition of additional tariffs by the United States could result in the adoption of additional tariffs by China and other countries as well. Any resulting trade war could negatively impact the global market for scientific instruments and could have a significant adverse effect on our business. The imposition of tariffs on items imported by us from China or other countries could increase our costs and could result in lowering our gross margin on products sold. Conversely, any imposition by China of tariffs on items that we export to China could adversely impact our customers’ ability to purchase our products and our competitive position in China or increase our costs, which could have a material adverse effect on our business and results of operations.
We must also comply with the European Union General Data Protection Regulation (GDPR) and other similar regulations in other countries, including the UK Data Protection Act 2018. These laws include strong protections for individual privacy rights of residents of the European Economic Area (“EEA”) and UK. GDPR purports to apply extraterritorially such that it can apply to businesses that are not established within the EEA, but that process personal data of individuals located within the European Union in connection with the offering of goods and services within the EEA. There are significant fines associated with non-compliance. In 2020, the Court of Justice of the European Union invalidated the EU-US Privacy Shield Framework, a key mechanism for transfers of personal data from the European Union to the United States and altered the international data transfer under GDPR. Even though Bruker did not rely on the EU-US Privacy Shield for its transfers to the United States, Bruker has conducted a transfer impact assessment to understand the risks of its EU-US persona data transfers and implemented the new EU Standard Contractual Clauses (including the UK addendum). More recently, the European Commission and United States have agreed on a new EU-US Transatlantic Data Privacy Framework that may stabilize rules for transfers of personal data from the EU to the United States. However, ongoing litigation and challenges relating to such transfers could cause disruption of data transfers and have a material adverse effect on our business.
While the impact of these factors is difficult to predict, any one or more of these factors could adversely affect our operations in the future.
Our competitive position and reported financial results may be adversely affected when we exchange foreign currency received from international sales into U.S. Dollars and by fluctuations in currency exchange rates.
A significant portion of our business is conducted in currencies other than the U.S. Dollar, which is our reporting currency. As a result, currency fluctuations among the U.S. Dollar and the currencies in which we do business could cause the price of our products to be more or less competitive than our principal competitors’ products. Currency fluctuations will increase or decrease our cost structure relative to those of our competitors, which could lessen the demand for our products and affect our competitive position. From time to time, we enter into certain hedging transactions and/or option and foreign currency exchange contracts which are intended to offset some of the market risk associated with our sales denominated in foreign currencies. We cannot predict the effectiveness of these transactions or their impact upon our future operating results, and from time to time they may negatively affect our quarterly earnings.
In addition to the foreign currency exposure associated with differences between where our products are manufactured and sold by us and our competitors, our exposure to currency exchange rate fluctuations results from the currency translation exposure associated with the preparation of our consolidated financial statements, as well as from the exposure associated with transactions of our subsidiaries that are denominated in a currency other than the respective subsidiary’s functional currency. While our financial results are reported in U.S. Dollars, the financial statements of many of our subsidiaries outside the U.S. are prepared using the local currency as the functional currency. During consolidation, these results are translated into U.S. Dollars by applying appropriate exchange rates. As a result, fluctuations in the exchange rate of the U.S. Dollar relative to the local currencies in which our foreign subsidiaries report could cause significant fluctuations in our reported results. Moreover, as exchange rates vary, revenue and other operating results may differ materially from our expectations. The effects of changes in currency exchange rates decreased our 2024 revenue by approximately $13.1 million, or 0.4%, increased our 2023 revenue by approximately $11.2 million, or 0.4%, and decreased our 2022 revenue by approximately $168.0 million, or 6.9%. Adjustments resulting from financial statement translations are included as a separate component of shareholders' equity. We recorded net losses from currency translation adjustments of $79.6 million during the year ended December 31, 2024, and net gains of $76.2 million during the year ended December 31, 2023.
Additionally, to the extent monetary assets and liabilities, including cash and debt, are held in a different currency than the reporting subsidiary’s functional currency, fluctuations in currency exchange rates may have a significant impact on our reported financial results, and may lead to increased earnings volatility. We may record significant gains or losses related to both the translation of assets and liabilities held by our subsidiaries into local currencies and the re-measurement of inter-company receivables and loan balances.
Goodwill, intangible assets and other long-lived assets are subject to impairment which could negatively impact our operating results.
We have recorded goodwill, intangible assets and other long-lived assets that must be periodically evaluated for potential impairment. We assess the realizability of the reported goodwill, intangible assets and other long-lived assets annually, as well as whenever events or changes in circumstances indicate that the assets may be impaired. These events or circumstances generally include operating losses or a significant decline in the earnings associated with the reporting unit these assets are reported within. A decline in our stock price and market capitalization may also cause us to consider whether goodwill, intangible assets and other long-lived assets may require an impairment assessment. Our ability to realize the value of these assets will depend on the future cash flows of the reporting unit in addition to how well we integrate the businesses we acquire. In connection with certain restructuring activities during fiscal 2024, the Company performed impairment assessments of its long-lived assets comparing the carrying values to the sum of their undiscounted future cash flows. Based on the results of these analyses, the Company determined there were no impairments to goodwill for the years ended December 31, 2024, 2023, and 2022. However, the Company recorded an impairment loss for intangible assets and certain right of use assets as disclosed in Note 12, Restructuring and asset impairments to our consolidated financial statements included in Item 8 of this Annual Report on Form 10-K.
If our products fail to achieve and sustain sufficient market acceptance across their broad intended range of applications, we will not generate expected revenue.
Our business strategy depends on our ability to successfully commercialize a broad range of products based on our technology platforms, including magnetic resonance technology, pre-clinical imaging technology, mass spectrometry technology, X-ray technology, atomic force microscopy technology, spatial biology technologies, stylus and optical metrology technology, fluorescence microscopy technology, infrared technology and superconducting magnet technologies for use in a variety of life science, chemistry and materials analysis applications. Some of our products have only recently been commercially launched and have achieved only limited sales to date. The commercial success of our products depends on obtaining and expanding market acceptance by a diverse array of industrial, academic, clinical, pharmaceutical, biotechnology, applied, medical research and governmental customers around the world. We may fail to achieve or sustain substantial market acceptance for our products across the full range of our intended applications or in one or more of our principal intended applications. Any such failure could decrease our sales and revenue. To
succeed, we must convince substantial numbers of potential customers to invest in new systems or replace their existing techniques with techniques employing our systems. Limited funding available for capital acquisitions by our customers, as well as our customers’ own internal purchasing approval policies, could hinder market acceptance of our products. Our intended customers may be reluctant to make the substantial capital investment generally needed to acquire our products or to incur the training and other costs involved with replacing their existing systems with our products. We also may not be able to convince our intended customers that our systems are an attractive and cost-effective alternative to other technologies and systems for the acquisition, analysis and management of molecular, cellular and microscopic information. Because of these and other factors, our products may fail to gain or sustain market acceptance.
Our products compete in markets that are subject to rapid technological change, and one or more of the technologies underlying our products could be made obsolete by new technology.
The market for discovery and analysis tools is characterized by rapid technological change and frequent new product introductions. Rapidly changing technology could make some or all of our product lines obsolete unless we are able to continually improve our existing products and develop new products. Because substantially all of our products are based on our technology platforms, including magnetic resonance technology, mass spectrometry technology, X-ray technology, atomic force microscopy technology, fluorescence microscopy technology, spatial biology technologies, stylus and optical metrology technology and infrared technology, we are particularly vulnerable to any technological advances that would make these techniques obsolete as the basis for analytical systems in any of our markets. To meet the evolving needs of our customers, we must rapidly and continually enhance our current and planned products and services and develop and introduce new products and services. In addition, our product lines are based on complex technologies that are subject to rapid change as new technologies are developed and introduced in the marketplace. We may have difficulty in keeping abreast of the rapid changes affecting each of the different markets we serve or intend to serve. If we fail to develop and introduce products in a timely manner in response to changing technology, market demands or the requirements of our customers, our product sales may decline, and we could experience significant losses.
We face substantial competition. If we fail to compete effectively, it could harm our business results and materially impact the value of our company.
We face substantial competition in our industries, and we expect that competition in all of our markets will increase further. Currently, our principal competition comes from established companies providing products using existing technologies that perform many of the same functions for which we market our products. A number of our competitors have expanded their market share in recent years through business combinations. Other companies also may choose to enter our fields in the future. Our competitors may develop or market products that are more effective or commercially attractive than our current or future products or that may render our products obsolete. Competition has in the past subjected, and is likely in the future to subject, our products to pricing pressure. Certain competitors have more experience in the market and substantially greater financial, operational, marketing and technical resources than we do, which could give them a competitive advantage in areas such as research and development, production, marketing and distribution. Our ability to compete successfully will depend, in part, on our ability to develop proprietary products that reach the market in a timely manner and are technologically superior to, less expensive than, or more cost-effective than, other currently marketed products.
If investment in life and material science research spending declines, our ability to generate revenue may suffer.
We are dependent, both directly and indirectly, upon general investment in life science research, particularly in the research and development budgets of the pharmaceutical and biotechnology industries, and in material science research as well as upon the financial condition and funding priorities of various governments and government agencies. Since our inception, both we and our academic collaborators and customers have benefited from various government contracts and grants, such as funding from the U.S. National Institutes of Health (NIH) and similar government agencies. Whether we or our academic collaborators will continue to be able to attract these grants and funding from these sources depends not only on the quality of our products, but also on general spending patterns of public institutions, changes to governmental policies and programs, including loans, grants, guarantees and other subsidies, and disruptions or changes in government funding of other government agencies.
Any reduction or shift in the capital resources or government funding of our customers, including as a result of changes to governmental policies and programs, could reduce our sales and impede our ability to generate revenue.
A significant portion of our sales are capital purchases by our customers. The spending policies of our customers could have a significant effect on the demand for our products. These policies are based on a wide variety of factors, including the resources available to make purchases, the spending priorities among various types of equipment, policies regarding spending during recessionary periods, changes in the political climate, including disruptions or changes to funding of other government agencies,
changes to governmental policies and programs, including loans, grants, guarantees and other subsidies, and changes to government spending policies, including shifts in funding priorities.
Any changes in capital spending or changes in the capital budgets of our customers could significantly reduce demand for our products. The capital resources of our life science and other corporate customers may be limited by the availability of equity or debt financing. Any significant decline in research and development expenditures by our life science and material science customers as a result of shifting governmental support for capital projects or disruptions or changes to funding of other government agencies could significantly decrease our sales. In addition, a substantial portion of our sales are to non-profit and government entities, which are dependent on government support for scientific research. Any decline in this support could decrease the ability of these customers to purchase our products.
Disruptions at any of our manufacturing facilities could adversely affect our business.
We have manufacturing facilities located in Austria, Belgium, Canada, France, Germany, Israel, Italy, Switzerland, United States, and United Kingdom. Many of our products are developed and manufactured at single locations, with limited alternate facilities. If we experience any significant disruption of those facilities for any reason, such as war or other geopolitical conflicts, strikes or other labor unrest, power interruptions, fire, earthquakes, or other events beyond our control, we may be unable to manufacture the relevant products at previous levels or at all. A reduction or interruption in manufacturing could harm our customer relationships, impede our ability to generate revenues from our backlog or obtain new orders and could have a material adverse effect on our business, results of operations, financial condition and cash flows.
If employees were to engage in a strike or other work stoppage or interruption, our business, results of operations, financial condition and liquidity could be materially adversely affected.
Many of our employees are represented by workers’ councils and labor unions in certain jurisdictions, primarily in Germany and France. If disputes with these employees arise, or if our workers engage in a strike or other work stoppage or interruption, we could experience a significant disruption of, or inefficiencies in, our operations or incur higher labor costs, which could have a material adverse effect on our business, results of operations, financial condition and liquidity.
In addition to the risks applicable to our life science and materials analysis products, our CBRNE detection products are subject to a number of additional risks, including lengthy product development and contract negotiation periods and certain risks inherent in long-term government contracts.
Our CBRNE detection products are subject to many of the same risks associated with our life science products, including vulnerability to rapid technological change, dependence on mass spectrometry and other technologies and substantial competition. In addition, our CBRNE detection products sold to government agencies under long-term contracts. These contracts generally involve lengthy pre-contract negotiations and product development. We may be required to devote substantial working capital and other resources prior to obtaining product orders. As a result, we may incur substantial costs before we recognize revenue from these products. Moreover, in return for larger, longer-term contracts, our customers for these products often demand more stringent acceptance criteria. These criteria may also cause delays in our ability to recognize revenue from sales of these products. Furthermore, we may not be able to accurately predict in advance our costs to fulfill our obligations under these long-term contracts. If we fail to accurately predict our costs, due to inflation or other factors, we could incur significant losses. Also, the presence or absence of such contracts may cause substantial variation in our results of operations between fiscal periods and, as a result, our results of operations for any given fiscal period may not be predictive of our results for subsequent fiscal periods. The resulting uncertainty may have an adverse impact on our stock price.
We rely on information technology to support our operations and reporting environments. A security failure of that technology, including with respect to cybersecurity, could impact our ability to operate our businesses effectively, adversely affect our financial results, damage our reputation and expose us to potential liability or litigation.
We use information systems to carry out our operations and maintain our business records. Some systems are internally managed, and some are maintained by third-party service providers. Our ability to conduct business could be materially and adversely affected if these systems or resources are compromised, damaged or fail. This could be a result of a cyber-incident, social engineering scam, hacking, phishing attempts, malware, natural disaster, hardware or software corruption, failure or error, telecommunications system failure, service provider error or failure, intentional or unintentional personnel actions or other disruption.
In the ordinary course of business, we collect and store sensitive data, including intellectual property, other proprietary information and personally identifiable information. Despite our security measures, our information technology and infrastructure may be vulnerable to cyber-attacks by hackers, including intrusions designed to access and exfiltrate information and to disrupt and lock-up access to systems for the purpose of demanding ransom payments, or breached due to employee error, malfeasance, or other
disruptions. Further, a breach of our security systems or infrastructure, or those of our customers, suppliers and other business partners, could result in the disclosure, misuse, corruption or loss of confidential information, including intellectual property, personally identifiable information and other critical data of the Company and our employees, customers suppliers and other business partners. If this data is compromised, destroyed or inappropriately disclosed, it could have a material adverse effect, including damage to our reputation, and our relationships with our employees, customers, suppliers and other business partners, decrease the value of our investments in research, development and engineering, disrupt our manufacturing processes, result in significant expenses to address and resolve the issues, fines or litigation or other proceedings by affected individuals, customers, suppliers, business partners or regulatory authorities.
Our debt may adversely affect our cash flows and may restrict our investment opportunities or limit our activities.
As of December 31, 2024, we had an outstanding aggregate principal amount of debt totaling approximately $2.1 billion. We also had the ability to borrow an additional $872.2 million available under our existing credit facility. Most of our outstanding debt is in the United States and there are substantial cash requirements in the United States to service debt interest obligations, fund operations, capital expenditures and our declared dividends and finance potential acquisitions or share repurchases. Our ability to satisfy our debt obligations and meet our other liquidity needs depends on our future operating performance and on economic, financial, competitive and other factors beyond our control. Our business may not generate sufficient cash flow to meet our debt obligations or provide sufficient funds for our other objectives. If we are unable to service our debt or obtain additional financing, we may be forced to delay minority acquisitions, capital expenditures or research and development expenditures or suspend our dividend payments and share repurchases. We may not be able to obtain additional financing on terms acceptable to us or at all. Furthermore, a majority of our cash, cash equivalents and short-term investments is generated from foreign operations, with $419.3 million held by foreign subsidiaries as of December 31, 2024. We may incur certain tax consequences relocating cash from our foreign operations to the United States. Our financial condition and results of operations could be adversely impacted if we are unable to maintain a sufficient level of cash flow in the United States to address our funding requirements through cash from operations and timely repatriation of cash from overseas or other sources obtained at an acceptable cost.
Additionally, the agreements governing our debt require that we maintain certain financial ratios related to maximum leverage and minimum interest coverage and contain affirmative and negative covenants, including among others, timely provision of audited consolidated financial statements, restrictions on liens, indebtedness of the Company and its subsidiaries, asset sales, dividends and transactions with affiliates. Our ability to comply with these financial restrictions and covenants is dependent on our operations and performance, which is subject to prevailing economic conditions and other factors, including factors that are beyond our control such as foreign currency translation rates and interest rates. Our failure to comply with any of these restrictions or covenants may result in an event of default under the applicable debt instrument, which could permit acceleration of the debt under the facility and require us to prepay the debt before its scheduled due date. Additionally, changes to governmental policies and programs, and disruptions or changes to funding of other government agencies could increase our cash and financing needs and adversely affect our customers, business, or results of operation.
Changes in our effective income tax rate could adversely affect our results of operations.
We are subject to income taxes in both the United States and various foreign jurisdictions and our domestic and international tax liabilities are largely dependent upon the distribution of income among these different jurisdictions. Various factors may have favorable or unfavorable effects on our effective income tax rate. These factors include interpretations of existing tax laws, the accounting for stock options and other share-based compensation, changes in tax laws and rates, future levels of research and development spending, changes in accounting standards, changes in the mix of earnings in the various tax jurisdictions in which we operate, the outcome of examinations by the U.S. Internal Revenue Service and other tax authorities, the accuracy of our estimates for unrecognized tax benefits and realization of deferred tax assets and changes in overall levels of pre-tax earnings. A change in tax laws, treaties or regulations, or their interpretation, of any country in which we operate could result in a higher tax rate on our earnings, which could result in a significant negative impact on our earnings and cash flow from operations. For example, on August 16, 2022, the President of the United States signed into law the Inflation Reduction Act of 2022 (the “IRA”), a tax and spending package that introduces several tax-related provisions, including a 15% corporate alternative minimum tax (“CAMT”) on certain large corporations and a 1% excise tax on certain corporate stock repurchases. The IRA provisions, which became effective for the Company beginning on January 1, 2023, did not have a material impact on the Company during the year ended December 31, 2024.
In December 2021, the Organization for Economic Co-operation and Development (OECD)/G20 Inclusive Framework, agreed to implement a global minimum tax regime for multinationals known as ‘Pillar Two’. The OECD has released the Pillar Two model rules (the Global Anti-Base Erosion Proposal, or ‘GloBE’) to reform international corporate taxation. The Pillar Two model rules provide guidance for a global minimum tax. This guidance lays out a common approach for adopting the global minimum tax and enacting local legislation codifying the provisions that all 142 countries in the Inclusive Framework agreed to by consensus. The EU member states have agreed to adopt these rules in two stages with the first component effective on January 1, 2024, while the second
component will be effective January 1, 2025. Non-EU countries have enacted or are expected to enact legislation on various timelines. Certain countries in which we operate have already enacted legislation to adopt the Pillar Two framework, while several other countries are expected to also implement similar legislation with varying effective dates in the future. When and how this framework is adopted or enacted by the various countries in which we do business will increase tax complexity and may increase uncertainty and adversely affect our provision for income taxes in the U.S. and non-U.S. jurisdictions.
We also assess the impact of various international tax reform proposals and modifications to existing tax treaties in all jurisdictions where we have operations that could result in a material impact on our income taxes. However, if such proposals were enacted, or if modifications were made to certain existing treaties, the consequences could have a materially adverse impact on us, including increasing our tax burden, increasing costs of our tax compliance or otherwise adversely affecting our financial condition, results of operations and cash flows.
Various international tax risks could adversely affect our earnings and cash flows.
We are subject to international tax risks. We could be subject to double taxation on income related to operations in certain countries that do not have tax treaties with the country of the trading partner. In addition, we may have a higher effective income tax rate than that of other companies in our industry if losses incurred by one operating company are not available to offset the income of an operating company located in another country. Also, distributions of earnings and other payments received from our subsidiaries may be subject to withholding taxes imposed by the countries where they are operating or are incorporated. If these foreign countries do not have income tax treaties with the United States or the countries where our subsidiaries are incorporated, we could be subject to high rates of withholding taxes on these distributions and payments. Additionally, the amount of the credit that we may claim against our U.S. federal income tax for foreign income taxes paid or accrued is subject to many limitations which may significantly restrict our ability to claim a credit for all of the foreign taxes we pay.
The unpredictability and fluctuation of our quarterly results may adversely affect the trading price of our common stock.
Our revenues and results of operations have in the past and will in the future vary from quarter to quarter due to a number of factors, many of which are outside our control and any of which may cause our stock price to fluctuate. The primary factors that may affect us include the following:
•the timing of sales of our products and services;
•the timing of recognizing revenue and deferred revenue under GAAP;
•changes in our pricing policies or the pricing policies of our competitors;
•increases in sales and marketing, product development or administration expenses;
•the mix of services provided by us and third-party contractors;
•our ability to attain and maintain quality levels for our products; and
•costs related to acquisitions of technology or businesses.
We can experience quarter to quarter fluctuations in our operating results as a result of various factors, some of which are outside our control, such as:
•the timing of governmental stimulus programs and academic research budgets;
•changes to governmental policies and programs, including loans, grants, guarantees and other subsidies;
•the time it takes between the date customer orders and deposits are received, systems are shipped and accepted by our customers and full payment is received;
•foreign currency exchange rates;
•the time it takes for us to receive critical materials to manufacture our products;
•general economic conditions, geopolitical tensions and other conditions that impact our global operations;
•the time it takes to satisfy local customs requirements and other export/import requirements;
•the time it takes for customers to construct or prepare their facilities for our products; and
•the time required to obtain governmental licenses.
These factors have in the past affected the amount and timing of revenue recognized on sales of our products and receipt of related payments and will likely continue to do so in the future. Accordingly, our operating results in any particular quarter may not necessarily be an indication of any future quarter’s operating performance.
Historically we have higher levels of revenue in the fourth quarter of the year compared to the first, second and third quarters, which we believe is primarily the result of our customers’ budgeting cycles. Quarter to quarter comparisons of our results of operations should not be relied upon as an indication of our future performance. It is likely that in some future quarters, our results of operations may be below the expectations of public market analysts and investors. In this event, the price of our common stock may fall.
Our ability to manage and grow our business successfully can be impeded by systems and other technological limitations.
Our continued success in effectively managing and growing our business depends on our ability to integrate our varied accounting, financial, information, and operational systems on a global basis. Moreover, adapting or developing the existing technology systems we use to meet our internal needs, as well as client needs, industry demands and new regulatory requirements, is also critical for our business. The introduction of new technologies presents new challenges to us. We must be proactive and prepared to implement new technology when growth opportunities present themselves, whether as a result of a business acquisition or rapidly increasing business activities in particular markets or regions. These needs could present operational issues or require significant capital spending, and may require us to reevaluate the current value and/or expected useful lives of the technology we use, which could negatively impact our results of operations.
In addition, technology is subject to rapid advancements and changes and our competitors may, from time to time, implement newer technologies or more advanced platforms for their services and products, including platforms based on artificial intelligence. If we do not effectively anticipate and avail ourselves of new technologies, our competitive position may suffer, and these impacts would adversely affect our business, financial condition and results of operations. In addition, our efforts to utilize technological advancements such as artificial intelligence may result in substantial integration and maintenance costs, and may expose us to additional risks. In particular, personal information within any data set collected from our business is vulnerable to unauthorized acquisition or access, compromise or loss, which could lead to heightened business and security costs, reputational damage, administrative penalties, significant legal and financial exposure. The content, analyses, or recommendations generated by artificial intelligence programs, if deficient, inaccurate, or biased, could adversely impact our business, financial condition, and operational results, as well as our reputation. Moreover, ethical concerns associated with artificial intelligence could lead to brand damage, competitive disadvantages, or legal repercussions. Any problems with our implementation or use of artificial intelligence or other technological advancements could also negatively impact our business or results of our operations.
Climate change and natural disasters, or legal, regulatory or market measures to address climate change, could adversely affect our business, financial condition or results of operations.
Climate change, allegedly resulting from increased concentrations of carbon dioxide and other greenhouse gases (“GHG”) in the atmosphere, may present risks to our business and operations. Extreme weather events and natural disasters, such as tornadoes, tsunamis, tropical storms (including hurricanes), earthquakes, volcanic eruptions, windstorms, hailstorms, heat waves, floods, droughts, severe thunderstorms, wildfires, and other fires, which may or may not result from climate change or natural disasters, could adversely impact our operations and supply chain, including the availability and cost of raw materials and components required for the operation of our business.
There has been increased focus by federal, international, state and local regulatory and legislative bodies to combat and/or limit the effects of climate change through a variety of means, including regulating GHG emissions (and requirements to disclose climate-related risks and metrics, including GHG emissions), policies mandating or promoting the use of renewable or zero-carbon energy and sustainability initiatives, and additional taxes on fuel and energy. These regulations, and changes to them, could increase our cost of compliance, and our failure to comply could result in the imposition of significant fines, suspension of production, alteration of product processes, cessation of operations or other actions which could materially and adversely affect our business, financial condition and results of operation.
Additionally, the impacts of climate change may further influence customer and other stockholder preferences and requirements. This includes increased demand for more sustainable products, including products with lower environmental footprints, and for companies to produce and demonstrate progress against sustainability goals and GHG reduction targets, including product-level GHG emissions data. Failure to meet stockholder expectations or our own goals or commitments relating to sustainability or GHG emissions reductions, provide sustainable products or demonstrate GHG reductions could potentially result in loss of market share, reputational impacts, or an inability to attract and retain customers.
The ownership of our shares is highly concentrated, which could cause or exacerbate volatility in our share price as well as have significant influence over us.
As of February 19, 2025, Laukien family members, including our Chairman, President and Chief Executive Officer (“CEO”) Frank Laukien and his brother, Joerg Laukien, owned, in the aggregate, approximately 32% of our outstanding common stock. We may also repurchase shares in the future, which could further increase the concentration of our share ownership. Because of this reduced liquidity, the trading of relatively small quantities of shares by our shareholders could disproportionately influence the price of those shares in either direction. The price for our shares could, for example, decline precipitously if a large number of our shares were sold on the market without commensurate demand, as compared to a company with greater trading liquidity that could better absorb those sales without adverse impact on its share price. These shareholders may also exercise substantial influence over all matters requiring shareholder approval, including the election of directors and approval of significant corporate transactions. This could have the effect of delaying or preventing a change in control of our company and will make some transactions difficult to accomplish without the support of these shareholders.
The loss of key personnel or an inability to attract and retain additional personnel could affect our ability to successfully grow our business.
We are highly dependent upon the continued service and performance of our CEO and other members of senior management and key finance, technical, scientific and production personnel, any of whom may cease their employment with us at any time with minimal advance notice. Because the expertise of these individuals is highly specific and takes years to develop, we face intense competition for these individuals from many other companies. The loss of one or more of our key employees may significantly delay or prevent the achievement of our business objectives, and our failure to attract and retain suitably qualified individuals or to adequately plan for succession could have an adverse effect on our ability to implement our business plan.
Dividends on our common stock could be reduced or eliminated in the future.
In recent years, we have paid dividends on our common stock. In February 2025, we announced that our Board of Directors (“Board”) had declared a quarterly dividend of $0.05 per share that will be payable in March 2025. There is no guarantee that such dividends will continue indefinitely. In the future, our Board may determine to reduce or eliminate our common stock dividend in order to fund investments for growth, repurchase shares or conserve capital resources.
Risks Related to Our Dependence on Third Parties
If we lose our strategic partners, our marketing and sales efforts could be impaired.
A substantial portion of our sales of selected products consists of sales to third parties who incorporate our products into their systems. These third parties are responsible for the marketing and sales of their systems. We have little or no control over their marketing and sales activities or how they use their resources. Our present or future strategic partners may or may not purchase sufficient quantities of products from us or perform appropriate marketing and sales activities. In addition, if we are unable to maintain our relationships with strategic partners, our businesses may suffer. Failures by our present or future strategic partners, or our inability to maintain existing or enter into new arrangements with strategic partners for product distribution, could materially impede the growth of our businesses and our ability to generate sufficient revenue and profits.
We face risks related to sales through distributors and other third parties that we do not control, which could harm our business.
We sell some products through third party agents, including distributors and value-added resellers. This exposes us to various risks, including competitive pressure, concentration of sales volumes, credit risks, and compliance risks. We may rely on one or a few key distributors for a product or market, and the loss of these distributors could reduce our revenue and net earnings. Distributors may also face financial difficulties, including bankruptcy, which could harm our collection of accounts receivable. Risks related to our use of distributors may reduce sales, increase expenses, and weaken our competitive position. Moreover, violations of the FCPA or similar anti-bribery laws by distributors or other third-party agents could materially and adversely impact our business, reputation and results of operations.
Dependence on contract manufacturing may adversely affect our ability to bring products to market and damage our reputation.
As part of our efforts to streamline our operations and reduce our operating costs, we outsource certain aspects of our manufacturing processes and continue to evaluate additional outsourcing. If our contract manufacturers fail to perform their obligations in a timely manner or at satisfactory quality levels, our ability to bring products to market and our reputation could suffer. For example, during a market upturn, our contract manufacturers may be unable to meet our demand requirements, which may
preclude us from fulfilling our customers’ orders on a timely basis. The ability of these manufacturers to perform is largely outside our control. Additionally, changing or replacing our contract manufacturers could cause disruptions or delays. Problems with outsourced manufacturing could result in lower revenues and unexecuted efficiencies, and adversely affect our financial condition and results of operations.
Our operations are dependent upon a limited number of suppliers and contract manufacturers.
We currently purchase components used in our products from a limited number of outside suppliers. Our reliance on a limited number of suppliers could result in time delays associated with redesigning a product due to an inability to obtain an adequate supply of required components and reduced control over pricing, quality and timely delivery. Any of these factors could adversely affect our revenues and profitability. As an example, BSI CALID purchases detectors and power supplies from sole or limited source suppliers and it purchases focal plane array detectors from a single supplier, Teledyne Scientific & Imaging. Additionally, our superconducting magnets or our electronics are partially dependent on cooperation from larger manufacturers like Electronic Manufacturing Services or High Temperature Superconductors suppliers. The existence of shortages of these components or the failure of delivery with regard to these components could have a material adverse effect upon our revenues and margins. In addition, price increases from these suppliers or contract manufacturers could have a material adverse effect upon our gross margins.
Because of the scarcity of some components and raw material, we may be unable to obtain an adequate supply of components, or we may be required to pay higher prices or to purchase components of lesser quality. Any delay or interruption in the supply of these or other components could impair our ability to manufacture and deliver our products, harm our reputation and cause a reduction in our revenues. In addition, any increase in the cost of the components that we use in our products could make our products less competitive and decrease our gross profits. We may not be able to obtain sufficient quantities of required components on the same or substantially the same terms. Additionally, consolidation among our suppliers could result in other sole source suppliers for us in the future. Other events that could affect our ability to source materials, manufacture or distribute our products include fire, natural disaster or extreme weather or a pandemic and the impact of those events on our and our suppliers’ and contract manufacturers’ operations.
Supply shortages and increasing prices of raw materials could adversely affect our gross profit.
The last few years have seen periodic supply shortages and strong fluctuations in the prices for various raw materials, in part due to high demand from developing countries, the war between Russia and Ukraine, on-going conflicts between the United States and China and other geopolitical tensions. Supply shortages may also be impacted by demand increases from green transition, military or space/aerospace industry. We rely on some of these materials for the production of our products. For example, in our superconducting magnet production, both for the horizontal and vertical magnet series, we rely on the availability of copper, and other metallic raw materials as well as niobium titanium for the production of traditional low-temperature superconducting magnets, wires and devices. Higher prices for these commodities will increase the production cost of superconducting wires and superconducting magnets and may adversely affect gross profits.
The prices of copper and certain other raw materials used for superconductors have increased significantly over the last decade. Since copper is a main constituent of low temperature superconductors, this may affect the price of superconducting wire. This type of increase would have an immediate effect on the production costs of superconducting magnets and may negatively affect the profit margins for those products.
In order to operate superconducting magnets, we and our customers rely on liquid helium. Helium is subject to price changes and shortages of liquid helium associated with federal price controls or depleted natural reserves could drive increases in helium pricing and have an adverse impact on producing and operating our superconducting magnets, which may negatively impact the profit margins of those products.
Risks Related to Our Intellectual Property Rights
Our success depends on our ability to operate without infringing or misappropriating the proprietary rights of others.
Our commercial success depends on avoiding the infringement of other parties’ patents and proprietary rights as well as avoiding the breach of any licenses relating to our technologies and products. Given that there may be patents of which we are unaware, particularly in the United States where patent applications are confidential, avoidance of patent infringement may be difficult. Various third parties hold patents which may relate to our technology, and we may be found in the future to infringe these or other patents or proprietary rights of third parties, either with products we are currently marketing or developing or with new products which we may develop in the future. If a third-party holding rights under a patent successfully asserts an infringement claim with respect to any of our current or future products, we may be prevented from manufacturing or marketing our infringing product in the country or countries covered by the patent we infringe, unless we can obtain a license from the patent holder. We may not be able to
obtain such a license on commercially reasonable terms, if at all, especially if the patent holder is a competitor. In addition, even if we can obtain a license, it may be non-exclusive, which will permit others to practice the same technology licensed to us. We also may be required to pay substantial damages to the patent holder in the event of infringement. Under some circumstances in the United States these damages could include damages equal to triple the actual damages the patent holder incurs. If we have supplied infringing products to third parties for marketing by them or licensed third parties to manufacture, use or market infringing products, we may be obligated to indemnify these third parties for any damages they may be required to pay to the patent holder and for any losses the third parties may sustain themselves as the result of lost sales or license payments they are required to make to the patent holder. Any successful infringement action brought against us may also adversely affect marketing of the infringing product in other markets not covered by the infringement action, as well as our marketing of other products based on similar technology. Furthermore, we will suffer adverse consequences from a successful infringement action against us even if the action is subsequently reversed on appeal, nullified through another action or resolved by settlement with the patent holder. The damages or other remedies awarded, if any, may be significant. As a result, any successful infringement action against us may harm our business.
If we are unable to effectively protect our intellectual property, third parties may use our technology, which would impair our ability to compete in our markets.
Our continued success will depend in significant part on our ability to obtain and maintain meaningful patent protection for our products throughout the world. We rely on patents to protect a significant part of our intellectual property and to enhance our competitive position. However, our presently pending or future patent applications may not issue as patents, and any patent previously issued to us may be challenged, invalidated, held unenforceable or circumvented. Furthermore, the claims in patents which have been issued, or which may be issued to us in the future, may not be sufficiently broad to prevent third parties from producing competing products similar to our products. In addition, the laws of various foreign countries in which we compete may not protect our intellectual property to the same extent as do the laws of the United States. Failure to obtain adequate patent protection for our proprietary technology could materially impair our ability to be commercially competitive.
In addition to patent protection, we also rely on the protection of trade secrets, know-how and confidential and proprietary information. To maintain the confidentiality of trade secrets and proprietary information, we generally seek to enter into confidentiality agreements with our employees, consultants and strategic partners upon the commencement of a relationship with us. However, we may not obtain these agreements in all circumstances. In the event of unauthorized use or disclosure of this information, these agreements, even if obtained, may not provide meaningful protection for our trade secrets or other confidential information. In addition, adequate remedies may not exist in the event of unauthorized use or disclosure of this information. The loss or exposure of our trade secrets and other proprietary information would impair our competitive advantages and could have a material adverse effect on our operating results, financial condition and future growth prospects. Furthermore, others may have, or may in the future independently develop, substantially similar or superior know-how and technology.
We may be involved in lawsuits to protect or enforce our patents that are brought by us which could be expensive and time consuming and, if determined adversely, could adversely affect our patent position.
In order to protect or enforce our patent rights, we may initiate patent litigation against third parties, and we may be similarly sued by others. We may also become subject to interference proceedings conducted in the patent and trademark offices of various countries to determine the priority of inventions. The defense and prosecution, if necessary, of intellectual property suits, interference proceedings and related legal and administrative proceedings is costly and diverts our technical and management personnel from their normal responsibilities. We may not prevail in any of these suits. An adverse determination of any litigation or defense proceedings could put our patents at risk of being invalidated or interpreted narrowly and could put our patent applications at risk of not issuing.
Furthermore, because of the substantial amount of discovery required in connection with intellectual property litigation, there is a risk that some of our confidential information could be compromised by disclosure during this type of litigation. In addition, during the course of this kind of litigation, there could be public announcements of the results of hearings, motions or other interim proceedings or developments in the litigation. If securities analysts or investors perceive these results to be negative, it could have a substantial negative effect on the trading price of our common stock. Refer to Note 26, Commitment and Contingencies for further information on our Litigation and Related Contingencies.
Risks Related to Legal, Regulatory and Compliance
Our manufacture and sale of products could lead to product liability claims for which we could have substantial liability.
The manufacture and sale of our products expose us to product liability claims if any of our products cause injury or are found otherwise unsuitable or defective as a consequence of product design, manufacturing, marketing, sale or customer use. In particular, if one of our CBRNE detection products malfunctions, this could lead to civilian or military casualties in a time of unrest, exposing us to
increased potential for high-profile liability. Additionally, the nuclear magnetic resonance, research magnetic resonance imaging, Fourier transform mass spectrometry and certain electron paramagnetic resonance magnets of BSI BioSpin utilize high magnet fields and cryogenics to operate at approximately 4 Kelvin, the temperature of liquid helium. There is an inherent risk of potential product liability due to the existence of these high magnetic fields, associated stray fields outside the magnet, and the handling of the cryogens associated with superconducting magnets. In addition, our MALDI BioTyper product has an IVD-CE mark and U.S. FDA approval and is used for the identification of microorganisms. Misidentification or a false-negative of certain viruses, bacteria, yeasts or fungi could lead to inappropriate treatment for patients and could expose us to product liability claims.
A successful product liability claim brought against us in excess of, or outside the coverage of, our insurance coverage could have a material adverse effect on our business, financial condition and results of operations. We may not be able to maintain product liability insurance on acceptable terms, if at all, and insurance may not provide adequate coverage against potential liabilities.
We are subject to environmental laws and regulations, which may impose significant compliance or other costs on us.
Our manufacturing, product development and research and development operations and processes involve the controlled use of certain hazardous materials. In addition, we own and/or lease a number of facilities, some of which have been in operation for many decades, where we or others may have used substances or generated and disposed of wastes which are considered hazardous or may be considered hazardous in the future. We also have acquired various companies which historically may have used certain hazardous materials, and which may have owned and/or leased facilities at which hazardous materials have been used. For all of these reasons, we are subject to federal, state, foreign, and local laws and regulations governing the use, manufacture, storage, transportation, handling, treatment, remediation, and disposal of hazardous materials and certain waste products. We have potential liability under these laws and regulations with respect to the remediation of past contamination in certain of the facilities we now own or lease. Additionally, in the future our facilities and the disposal sites owned by others to which we send or sent waste, may be identified as contaminated and require remediation. Accordingly, we may become subject to additional compliance costs or environmental liabilities which may be significant and could materially harm our results of operations or financial condition.
Specifically, we use controlled hazardous and radioactive materials in our business and generate wastes that are regulated as hazardous wastes under U.S. federal, and Massachusetts, California, New Jersey, Washington and Wisconsin state environmental and atomic energy regulatory laws and under equivalent provisions of law in those and other jurisdictions in which our research and manufacturing facilities are located. Our use of these substances and materials is subject to stringent, and periodically changing, regulation that can impose costly compliance obligations on us and has the potential to adversely affect our manufacturing activities. The risk of accidental contamination or injury from these materials cannot be completely eliminated. If an accident with these substances occurs, we could be held liable for any damages that result, in addition to incurring clean-up costs and liabilities, which can be substantial. Additionally, an accident could damage our research and manufacturing facilities resulting in delays and increased costs.
We are subject to existing and potential additional regulation and government inquiry, which can impose burdens on our operations and narrow the markets for our products.
We are subject, both directly and indirectly, to the adverse impact of existing and potential future government regulation of our operations and markets. For example, the export of our products is subject to U.S. and non-U.S. export control, sanctions, customs, import and anti-boycott laws and regulations, including, as applicable, the International Traffic in Arms Regulations, the Export Administration Regulations and the sanctions laws, regulations and executive orders administered and enforced by the U.S. Department of the Treasury’s Office of Foreign Assets Control, and other laws and regulations adopted by the governments or agencies of other countries relating to the same subject matter as the U.S. laws and regulations described above.
The failure to satisfy export control criteria or obtain necessary clearances could delay or prevent shipment of products, which could adversely affect our revenues and profitability. Failure by the Company, our employees or others working on our behalf to comply with these laws and regulations could result in administrative, civil or criminal liabilities, including suspension, debarment from bidding for or performing government contracts, or suspension of our export privileges, which could have a material adverse effect on us. We frequently team with international subcontractors and suppliers who are also exposed to similar risks. In some cases, compliance with the laws and regulations of one country could violate the laws and regulations of another country. Violations of these laws and regulations could materially adversely affect our brand, international growth efforts and business.
In addition, as a result of our international operations, we are subject to compliance with various laws and regulations, including the FCPA and local anti-bribery laws in the jurisdictions in which we do business (including some higher risk countries according to the Transparency International Corruption Index), which generally prohibit companies and their intermediaries or agents from engaging in bribery or making improper payments to foreign officials or their agents. The FCPA also requires proper record keeping and characterization of such payments in our reports filed with the SEC. Despite maintaining policies and procedures that require our employees to comply with these laws and our standards of ethical conduct, we cannot ensure that these policies and procedures will always protect us from intentional, reckless or negligent acts committed by our employees or third-party agents.
Moreover, the life sciences industry, which is the market for our principal products, has historically been heavily regulated. Given the evolving nature of this industry, legislative bodies or regulatory authorities may adopt additional regulation or governmental policies that adversely affects our market opportunities. Our business is also directly affected by a wide variety of government regulations applicable to business enterprises generally and to companies operating in the life sciences industry in particular.
Our products are subject to the FDA’s requirements for electronic radiation emitting products, which include requirements related to record-keeping and reporting; labeling; notification; product repairs, replacements, and refunds; importation; and performance standards. In addition, our clinical products are subject to regulation as medical devices in the United States by the FDA and by similar regulatory bodies in other countries where such products are sold. These regulations govern a wide variety of product related activities, from quality management, design, development, and testing to labeling, manufacturing, complaint handling, reporting, promotion, sales and distribution. Compliance with applicable regulatory requirements is subject to continual review and is monitored rigorously through periodic inspections by the FDA and other regulatory authorities, which may result in written inspectional observations. The FDA and comparable foreign regulatory authorities also monitor product promotion and marketing materials and activities. If we or any of our suppliers or distributors fail to comply with FDA or other applicable regulatory requirements, or are perceived to potentially have failed to comply, we may face, among other things, warning letters; adverse publicity affecting both us and our customers; investigations or notices of non-compliance, fines, injunctions, and civil or criminal penalties; import or export restrictions; partial suspensions or total shutdown of production facilities or the imposition of operating restrictions; increased difficulty in obtaining required FDA clearances or approvals or foreign equivalents; seizures or recalls of our products or those of our customers; or the inability to sell such products. Any such FDA or comparable foreign regulatory actions could disrupt our business and operations, lead to significant remedial costs and have a material adverse impact on our financial position and results of operations. In addition, negative publicity and product liability claims resulting from any adverse regulatory action could have a material, adverse effect on our financial condition and results of operations. Further, the replacement of the European Union IVD Directive by the IVD Regulation (EU) 2017/746 in May 2022 has resulted in a stricter regime on manufacturers of IVDs and under transitional arrangements our products currently approved under the Directive must be recertified under the Regulation by May 2025.
We have been, are, and expect to be in the future, subject to inquiries from the government agencies that enforce these regulations, including the U.S. Department of State, the U.S. Department of Commerce, the U.S. FDA, the U.S. Internal Revenue Service, the U.S. Department of Labor, the U.S. Department of Homeland Security, the U.S. Department of Justice, the SEC, the Federal Trade Commission, U.S. Customs and Border Protection and the U.S. Department of Defense, among others, as well as from state or foreign governments and their departments and agencies. As a result, from time to time, the attention of our management and other resources may be diverted to attend to these inquiries. In addition, failure to comply with these regulations or obtain or maintain necessary permits and licenses could result in a variety of fines or other censures or an interruption in our business operations which may have a negative impact on our ability to generate revenues and could adversely affect our financial condition and results of operations.
Failure to maintain effective internal controls may cause a loss of investor confidence in the reliability of our financial statements or cause us to delay filing our periodic reports with the SEC and adversely affect our stock price.
The SEC, as directed by Section 404 of the Sarbanes-Oxley Act of 2002, adopted rules requiring public companies to include a report of management on internal control over financial reporting in their annual reports on Form 10-K that contain an assessment by management of the effectiveness of our internal control over financial reporting. In addition, our independent registered public accounting firm must attest to and report on the effectiveness of our internal control over financial reporting. Although we test our internal control over financial reporting in order to ensure compliance with the Section 404 requirements, our failure to maintain adequate internal controls over financial reporting could result in an adverse reaction in the financial marketplace due to a loss of investor confidence in the reliability of our financial statements or a delay in our ability to timely file our periodic reports with the SEC, which ultimately could negatively impact our stock price.
We operate as an entrepreneurial, decentralized company, which presents both benefits and certain risks. In particular, significant growth in a decentralized operating model may put strain on certain business group resources and our corporate functions, which could materially and adversely affect our business, financial condition and results of operations.
Decentralization necessarily places significant control and decision-making powers in the hands of local management, which presents certain risks, including the risk that we may be slower to detect or react to compliance-related matters and that “company-wide” business initiatives may be more challenging or costly to implement, and the risk of noncompliance or failures higher than they may be in a more centralized operating environment. In addition, key business group resources and our corporate functions responsible for supporting our decentralized operations, may also not be able to detect or resolve financial, operational, and compliance matters on a timely basis. Our failure to adapt our financial, operational and compliance controls and systems to effectively manage our decentralized business and comply with our obligations as a public company could materially and adversely affect our business, financial condition or results of operations.
General Risk Factors
If we are not able to successfully integrate the businesses we acquire through mergers, acquisitions or strategic alliances, we may not be able to realize all of the cost savings and other benefits that we expect to result from the transactions and our financial results may be different than expected.
Our strategy includes expanding our technology base and product offerings through selected mergers, acquisitions and strategic alliances. For example, from January 1, 2022, to December 31, 2024, we acquired 28 businesses to expand our technologies and product offerings.
Successful integration of the businesses we acquire involves a number of risks, including, among others, risks related to:
•coordinating or consolidating geographically separate organizations and integrating personnel with different business backgrounds and corporate cultures;
•integrating previously autonomous departments in sales and marketing, distribution, accounting and administrative functions;
•integrating financial information and management systems;
•the pace of our acquisition activity and the related diversion of already limited resources and management time;
•disruption of our ongoing business;
•potential impairment of relationships with customers as a result of changes in management or otherwise arising out of such transactions; and
•retention of key employees of the acquired businesses within the first one to two years after the acquisition, including the risk that they may compete with us subsequently.
We may have difficulty developing, manufacturing and marketing the products of a newly acquired company or business in a way that enhances the performance of our combined businesses or product lines. As a result, we may not realize the value from expected synergies. Acquisitions have resulted, and may in the future result, in unexpected significant costs and expenses, including disputes over contingent consideration and complicated accounting for complex transaction structures. In the future, we may be required to record charges to earnings during the period if we determine there is an impairment of goodwill or intangible assets, up to the full amount of the remaining carrying value of the assets.
We generally assume the liabilities of businesses we acquire, which could include liability for an acquired business’ violation of law that occurred before we acquired it. We frequently acquire smaller, privately held companies that may not have the same culture of compliance or the same level of internal control of a larger, publicly traded company. Any failure to implement adequate training, controls, and monitoring of any acquired company could cause us to be liable for post-acquisition legal or accounting violations.
Other companies may have difficulty acquiring us, even if doing so would benefit our shareholders, due to provisions under our corporate charter and bylaws, as well as Delaware law.
Provisions in our restated certificate of incorporation, and our amended and restated bylaws, as well as Delaware law could make it more difficult for other companies to acquire us, even if doing so would benefit our shareholders. Our restated certificate of incorporation, and amended and restated bylaws contain the following provisions, among others, which may inhibit an acquisition of our company by a third party:
•a staggered Board of Directors, where shareholders elect only a minority of the board each year;
•advance notification procedures for matters to be brought before shareholder meetings;
•a limitation on who may call shareholder meetings; and
•the ability of our Board of Directors to issue up to 5,000,000 shares of preferred stock without a shareholder vote.
ITEM 1B UNRESOLVED STAFF COMMENTS
Not applicable.
ITEM 1C CYBERSECURITY
The Board’s Audit Committee oversees risks relating to cybersecurity threats and the steps management takes to monitor and control such exposures. In addition to other written policies and procedures, the Company has instituted an Information Security Incident Response Plan (“IRP”) which provides a framework to assist the Company in responding to actual or potential cybersecurity incidents. Our IRP includes detailed response procedures to be followed in the event of a cybersecurity incident, which outline steps to be executed from detection to assessment to notification and recovery, including internal notifications to the Audit Committee as appropriate. These incidents may consist of any actual, threatened, suspected, or reported event or occurrence that may affect the confidentiality, integrity, or availability of Company systems or data, or of any such event affecting a third party that may affect Company systems or data. The objective of the IRP is to facilitate a timely and coordinated enterprise-level response to such incidents to mitigate impact on the Company and its employees, stockholders, customers, business partners, and other stakeholders. The Audit Committee receives regular reporting from senior officers (such as the Chief Information Security Officer and the Director of Risk Management & Insurance) on operational risk and the steps management has taken to monitor and control these risks. Such reporting includes updates on the Company’s IRP, the external threat environment, and the Company’s programs to address and mitigate the risks associated with the cybersecurity threat environment. The IRP and internal controls around cybersecurity are periodically evaluated by external experts and the results of those reviews are reported to the Audit Committee.
The Company has established a corporate-level global Information Security Incident Response Team (“ISIRT”), which provides a centralized, coordinated response to, and management of, cybersecurity incidents that may present significant risk to the Company’s operations, valuation, brand or reputation, employees, and customer or business relationships. The Company’s cybersecurity response team is comprised of multiple subject-matter experts, including information technology, cybersecurity and risk management members with a combined experience of well over 60 years. Core members of the ISIRT consist of the Vice President, Financial Operations and Project Management (“Financial Ops”); Senior Vice President, General Counsel, and Corporate Secretary (“General Counsel”); Chief Information Security Officer (“CISO”) who reports to the Chief Information Officer (“CIO”); Chief Privacy Officer (“CPO”); Vice President, Corporate Treasurer (“Treasury”); Director, Risk Management & Insurance (“Risk Management”); and Cyber Security Manager (“Information Security”). If a cybersecurity incident warrants activation of the ISIRT, the Company’s Financial Ops and the General Counsel will notify, as appropriate, the Company’s executive leadership and the Audit Committee. We also engage specialized third-party consultants to proactively support our cybersecurity efforts, which include but are not limited to, application and network security, information risk management, as well as business continuity and disaster recovery.
Cybersecurity incidents may occur at, or be reported to, any of the Company’s facilities worldwide. The Company has an IT Service Desk which acts as the single point of contact for cybersecurity incident reporting. Employees can notify the IT Service Desk of any event that they observe or is reported to them that may constitute a cybersecurity incident. Once notified, the IT Service Desk team conducts an initial classification and escalates, when needed, to the CISO and other members of ISIRT as per the Company’s IRP. Financial Ops, in consultation with the General Counsel, CPO and CISO, decide whether to activate the ISIRT in connection with any escalated incident. When activated, the ISIRT coordinates and directs all aspects of the response, including, as applicable, investigation, containment, business continuity and recovery, remediation, notifications, communications, and post-incident activities with executive leadership, including the CIO, and the Audit Committee and/or Board of Directors, as appropriate in the circumstances. As of December 31, 2024, no identified risk has required activation of the ISIRT.
In addition, our third-party service providers play a role in our risk management and strategy as well as with the investigation of cybersecurity incidents. Based upon the assessment of the type of incident and risk presented, the ISIRT engages outside counsel and/or external resources, such as forensic consultants, to conduct or assist with cybersecurity investigations in order to provide advice to the Company. The vendors we engage with are globally recognized companies with expertise in cybersecurity. We conduct due diligence before onboarding new vendors and maintain ongoing evaluations to ensure compliance with our security standards. The Company also conducts appropriate cybersecurity exercises and training. For example, employees must complete cybersecurity training on at least an annual basis, which educates our employees on the Company’s policies and procedures for handling personal data, incident reporting, and avoiding common cybersecurity threats such as phishing attacks.
For a discussion of information technology rights that may materially impact us, see Item 1A “Risk Factors—We rely on information technology to support our operations and reporting environments. A security failure of that technology, including with respect to cybersecurity, could impact our ability to operate our businesses effectively, adversely affect our financial results, damage our reputation and expose us to potential liability or litigation.”
ITEM 2 PROPERTIES
We believe that our existing principal facilities are well maintained and in good operating condition and that they are adequate for our foreseeable business needs.
In addition to the principal facilities noted below, we lease additional facilities for sales, applications and service support in various countries throughout the world including Australia, Austria, Belgium, Brazil, Canada, China, Czech Republic, France, Germany, Greece, Hong Kong, India, Israel, Italy, Japan, Kenya, Malaysia, Mexico, Netherlands, New Zealand, Poland, Portugal, Republic of Korea, Singapore, Saudi Arabia, South Africa, Spain, Sweden, Switzerland, Taiwan, Thailand, Turkey, United Arab Emirates, the United Kingdom and the United States. If we should require additional or alternative facilities, we believe that such facilities can be obtained on short notice at competitive rates.
The location and primary use of our principal properties used in current operations are as follows:
| | | | | | | | | | | | | | | |
| | | | | | | Principal Use |
Segment | Location | | Approximate
Square Feet | | Owned/Leased | | Manufacturing | | Research & Development | | Application & Development | | Marketing | | Sales & Administration |
BSI BioSpin | Wissembourg, France | | 272,000 | | Owned | | X | | X | | X | | X | | X |
| Ettlingen, Germany | | 188,000 | | Owned | | X | | X | | X | | X | | X |
| Faellanden, Switzerland | | 456,000
84,000 | | Owned/
Leased | | X | | X | | X | | X | | X |
BSI CALID | Bremen, Germany | | 298,000 | | Owned | | X | | X | | X | | X | | X |
| Ettlingen, Germany | | 182,000 | | Owned | | X | | X | | X | | X | | X |
| Nehren, Germany | | 89,000 | | Owned/
Leased | | X | | X | | X | | X | | X |
| Faellanden, Switzerland | | 14,600 | | Leased | | X | | X | | | | X | | X |
BSI NANO | Graz, Austria | | 30,000 | | Leased | | X | | X | | | | X | | X |
| Karlsruhe, Germany | | 145,000 | | Owned | | X | | X | | X | | X | | X |
| Berlin, Germany | | 134,550 | | Owned | | X | | X | | | | X | | X |
| Migdal HaEmek, Israel | | 22,000 | | Leased | | X | | X | | | | X | | X |
| Penang, Malaysia | | 100,000 | | Leased | | X | | X | | X | | X | | X |
| Bothell, WA, U.S.A. | | 59,000 | | Leased | | X | | | | | | | | |
| Del Ray Beach, FL, U.S.A. | | 30,100 | | Leased | | X | | X | | X | | X | | X |
| Emeryville, CA, U.S.A. | | 37,000 | | Leased | | | | X | | X | | X | | X |
| Santa Barbara, CA, U.S.A. | | 100,000 | | Owned | | X | | X | | X | | X | | X |
BEST | Bergisch Gladbach, Germany | | 85,000
49,000 | | Owned/
Leased | | X | | X | | X | | X | | X |
| Hanau, Germany | | 138,000 | | Owned | | X | | X | | X | | X | | X |
| Carteret, NJ, U.S.A. | | 115,000 | | Leased | | X | | X | | X | | X | | X |
| Perth, Scotland | | 47,000 | | Owned | | X | | X | | X | | X | | X |
Shared Use | Billerica, MA, U.S.A. | | 200,000 | | Owned | | | | X | | X | | X | | X |
ITEM 3 LEGAL PROCEEDINGS
For a discussion of legal matters as of December 31, 2024, please refer to Note 26, Commitments and Contingencies, to our consolidated financial statements included in this report, which is incorporated into this item by reference.
ITEM 4 MINE SAFETY DISCLOSURES
Not applicable.
PART II
ITEM 5 MARKET FOR REGISTRANT’S COMMON EQUITY, RELATED SHAREHOLDER MATTERS AND ISSUER PURCHASES OF EQUITY SECURITIES
Market Prices
Our common stock is traded on the Nasdaq Global Select Market under the symbol “BRKR.”
As of February 19, 2025, there were approximately 62 holders of record of our common stock. This number does not include individual beneficial owners of shares held in nominee name or within clearinghouse positions of brokerage firms and banks.
Dividends
In February 2016, we announced the establishment of a dividend policy and the declaration by our Board of Directors of an initial quarterly cash dividend in the amount of $0.04 per share of our issued and outstanding common stock. Beginning in 2022, we increased the quarterly cash dividend to our shareholders in the amount of $0.05 per share of our issued and outstanding common stock. In February 2025, we announced that our Board had approved a quarterly dividend for the first quarter of 2025 of $0.05 per share, payable in March. Future dividend payments, if any, are subject to approval of our Board of Directors.
Stock Price Performance Graph
The graph below compares Bruker Corporation’s annual percentage change in cumulative total return on common shares over the past five years ended December 31, 2024 with the cumulative total return of companies comprising the Nasdaq US Benchmark TR Index and the SIC Code 3826 Laboratory Analytical Instruments Index. This presentation assumes that $100 was invested in shares of the relevant issuers on December 31, 2019, and that dividends received were immediately invested in additional shares. The graph plots the value of the initial $100 investment at one-year intervals for the fiscal years shown.
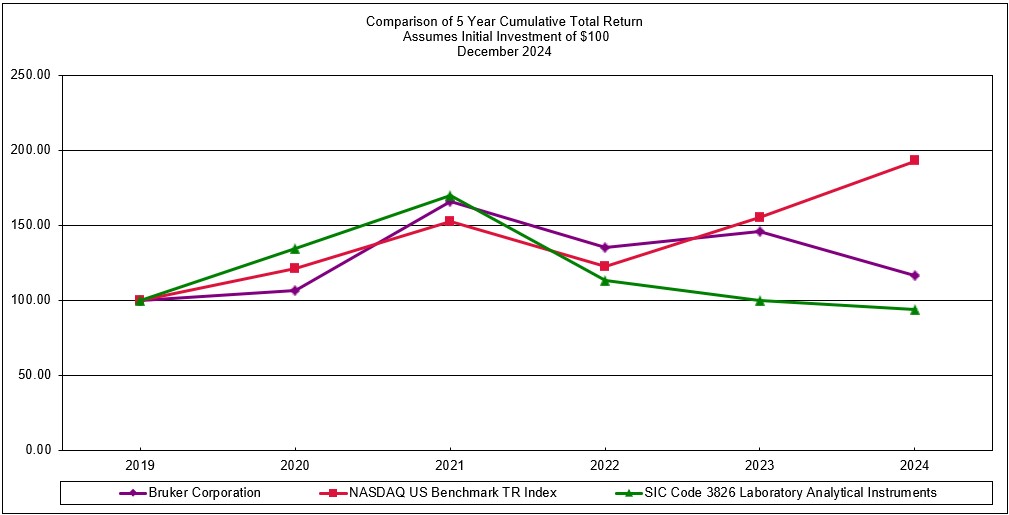
| | | | | | | | | | | | | | | | | | | | | | | | |
Cumulative Total Return Index for: | | 12/31/2019 | | | 12/31/2020 | | | 12/31/2021 | | | 12/31/2022 | | | 12/31/2023 | | | 12/31/2024 | |
Bruker Corporation | | $ | 100.0 | | | $ | 106.58 | | | $ | 165.58 | | | $ | 135.30 | | | $ | 145.89 | | | $ | 116.73 | |
Nasdaq US Benchmark TR Index | | | 100.0 | | | | 121.27 | | | | 152.67 | | | | 122.55 | | | | 154.93 | | | | 192.86 | |
SIC Code 3826 Laboratory Analytical Instruments | | | 100.0 | | | | 134.62 | | | | 169.92 | | | | 112.96 | | | | 100.00 | | | | 93.96 | |
The data for this performance graph was compiled by Zack’s Investment Research, Inc. and is used with its permission.
Issuer Purchases of Securities
Pursuant to a share repurchase program approved by the Board of Directors and announced on May 12, 2023 (the “2023 Repurchase Program”), the Company is permitted to purchase up to $500 million of shares of its common stock over a two-year period. As of December 31, 2024, $369.9 million remains available for future purchase under the 2023 Repurchase Program. The Company did not make any purchases of its common stock during the year ended December 31, 2024.
ITEM 6 RESERVED
ITEM 7 MANAGEMENT’S DISCUSSION AND ANALYSIS OF FINANCIAL CONDITION AND RESULTS OF OPERATIONS
The following Management’s Discussion and Analysis of Financial Condition and Results of Operations, or MD&A, describes the principal factors affecting the results of our operations, financial condition and changes in financial condition, as well as our critical accounting policies and estimates. You should read the following discussion and analysis of our financial condition and results of operations in conjunction with our consolidated financial statements and notes to those statements, appearing elsewhere in this report.
Any statements other than statements of historical fact contained in Management’s Discussion and Analysis of Financial Condition and Results of Operations and elsewhere in this Annual Report on Form 10-K may be deemed to be forward-looking statements within the meaning of Section 27A of the Securities Act of 1933, as amended, and Section 21E of the Securities Exchange Act of 1934, as amended. Without limiting the foregoing, the words “believe,” “anticipate,” “plan,” “expect,” “seek,” “may,” “will,” “intend,” “estimate,” “should” and similar expressions are intended to identify forward-looking statements.
Forward-looking statements include, but are not limited to, statements regarding:
•the impact of supply chain challenges on our business and operations;
•our working capital requirements and the sufficiency of our cash, borrowings and proceeds of indebtedness to fund our operations and investment activities;
•our plans to make capital investments;
•the impact of changes to tax and accounting rules and changes in law;
•fluctuations in estimates impacting costs related to our self-funded health insurance plan;
•our expectations regarding backlog and revenue;
•our expectations and the impact of our restructuring initiatives;
•the impact of our global IT transformation activities;
•the impact of foreign currency exchange rates and changes in commodity prices; and
•any other statements that address events or developments that the Company intends or believes will or may occur in the future.
Actual results may differ from those referred to in any forward-looking statements due to a number of factors, including, but not limited to, the risks described in Part I, Item 1A “Risk Factors” in this Annual Report on Form 10-K. We expressly disclaim any intent or obligation to update these forward-looking statements other than as required by law.
We can experience quarter-to-quarter fluctuations in our operating results as a result of various factors, some of which are outside our control, such as:
•general economic conditions, including inflation, uncertainties caused by recent banking industry volatility, the threat of recession, financial liquidity, currency volatility or devaluation, supply chain or manufacturing capabilities, and uncertain economic conditions in the United States and abroad, and additional tariffs, including those imposed or that may be imposed by the new presidential administration in the U.S.;
•geopolitical tensions, including those on our customers, such as the conflict between Russia and Ukraine and related economic sanctions, the conflict in the Middle East and surrounding areas, the possible expansion of such conflicts and potential geopolitical consequences, the ongoing tensions between the United States and China, tariff and trade policy changes, and increasing potential of conflict involving countries in Asia that are significant to the Company’s supply chain operations, such as Taiwan and China;
•potential energy shortages in Europe where the Company has significant operations and overall higher energy and transportation costs;
•the impacts of climate change and certain weather-related disruptions;
•the timing of governmental stimulus programs and academic research budgets;
•the time it takes between the date customer orders and deposits are received, systems are shipped and accepted by our customers and full payment is received;
•foreign currency exchange rates;
•the worldwide shortage of semiconductor chips, components and raw materials, such as copper;
•changes in raw material, component and logistics costs;
•the time it takes for us to receive critical materials to manufacture our products;
•the time it takes to satisfy local customs requirements and other export/import requirements;
•the time it takes for customers to construct or prepare their facilities for our products;
•the time required to obtain governmental licenses;
•our ability to identify suitable acquisition targets and successfully integrate and manage acquired business; and
•costs related to acquisitions of technology or businesses.
Several of these factors have in the past affected and may continue to affect the amount and timing of revenue recognized on sales of our products and receipt of related payments and will likely continue to do so in the future. Accordingly, our operating results in any particular quarter may not necessarily be an indication of any future quarter’s operating performance.
OVERVIEW
We are a developer, manufacturer and distributor of high-performance scientific instruments and analytical and diagnostic solutions that enable our customers to explore life and materials at microscopic, molecular and cellular levels. Our corporate headquarters are located in Billerica, Massachusetts. We maintain major research and development and manufacturing centers in Europe, Asia and North America and we have commercial offices located throughout the world. Bruker is organized into four reportable segments: the Bruker Scientific Instruments (BSI) BioSpin Segment, the BSI CALID Segment, the BSI NANO Segment and the Bruker Energy & Supercon Technologies (BEST) Segment.
During the fiscal year ended December 31, 2024, Bruker made several acquisitions including ELITechGroup, NanoString and Chemspeed. These acquisitions enable Bruker to extend our capabilities in molecular diagnostics (ELITechGroup), life science analytical instruments (NanoString) and to provide new capabilities in lab automation (Chemspeed). Refer to Note 4, Acquisitions in the consolidated financial statements.
Consolidated Results
The following table presents a summary of our consolidated results as of the year ended December 31, 2024 and 2023 (dollars in millions):
| | | | | | | | |
| | Year ended December 31, | |
| | 2024 | | | 2023 | |
GAAP Financial Measures: | | | | | | |
Revenue | | $ | 3,366.4 | | | $ | 2,964.5 | |
Revenue Growth Rate | | | 13.6 | % | | | 17.1 | % |
Gross Profit | | | 1,649.5 | | | | 1,513.3 | |
Gross Profit Margin | | | 49.0 | % | | | 51.0 | % |
Operating Income | | | 253.1 | | | | 436.9 | |
Operating Income Margin | | | 7.5 | % | | | 14.7 | % |
Net cash provided by operating activities | | | 251.3 | | | | 350.1 | |
Non-GAAP Financial Measures (see 'Non-GAAP Measures' below): | | | | | | |
Non-GAAP Constant-exchange rate (CER) currency revenue | | | 3,379.5 | | | | 2,953.3 | |
Non-GAAP Constant-exchange rate (CER) currency revenue growth rate | | | 14.0 | % | | | 16.7 | % |
Non-GAAP Gross Profit | | | 1,736.9 | | | | 1,547.6 | |
Non-GAAP Gross Profit Margin | | | 51.6 | % | | | 52.2 | % |
Non-GAAP Operating Income | | | 518.0 | | | | 546.3 | |
Non-GAAP Operating Income Margin | | | 15.4 | % | | | 18.4 | % |
Non-GAAP Free Cash Flow | | | 136.0 | | | | 243.2 | |
Discussion of GAAP financial measures follows in the Results of Operations paragraphs.
Non-GAAP Measures
Uses and definitions:
Although our consolidated financial statements have been prepared in accordance with GAAP, we believe that describing revenue excluding the effects of foreign currency, and expenses excluding costs related to restructuring actions, acquisition and related integration expenses, amortization of acquired intangible assets, costs associated with our global information technology transition initiatives, and other costs (“non-GAAP adjustments”), provides meaningful supplemental information regarding our performance. We rely internally on certain measures that are not calculated according to GAAP. These measures include constant exchange rate (“CER”) currency revenue growth, non-GAAP gross profit, non-GAAP gross profit margin, non-GAAP operating income, non-GAAP operating margin, and free cash flow.
Our management believes that these financial measures provide relevant and useful information that is widely used by equity analysts, investors and competitors in our industry, as well as by our management, in assessing both consolidated and business unit performance and are useful measures to evaluate our continuing business. Additionally, management believes free cash flow is a useful measure to evaluate our business as it indicates the amount of cash generated after additions to property, plant, and equipment which is available for, among other things, investments in our business, acquisitions, share repurchases, dividends and repayment of debt.
We regularly use these non-GAAP financial measures internally to understand, manage, and evaluate our business results and make operating decisions. We also measure our employees and compensate them, in part, based on such non-GAAP measures and use this information for our planning and forecasting activities. These measures may also be useful to investors in evaluating the underlying operating performance of our business. The presentation of these non-GAAP financial measures is not intended to be a substitute for, or superior to, the financial information prepared and presented in accordance with GAAP, and it may be different from non-GAAP financial measures used by other companies, and therefore, may not be comparable among companies.
We define our non-GAAP financial measures as follows:
•CER currency revenue growth as GAAP revenue excluding the effect of changes in foreign currency translation rates.
•Non-GAAP gross profit as GAAP gross profit excluding non-GAAP adjustments.
•Non-GAAP gross profit margin as GAAP gross profit margin excluding the impact of non-GAAP adjustments.
•Non-GAAP operating income as GAAP operating income excluding non-GAAP adjustments.
•Non-GAAP operating income margin as GAAP operating income margin excluding the impact of non-GAAP adjustments.
•Free cash flow as GAAP net cash provided by operating activities less additions to property, plant, and equipment.
Reconciliations of GAAP to Non-GAAP financial measures:
The amounts listed below are in millions of dollars. Where relevant, we have also included the associated percentage margins.
GAAP revenue to non-GAAP CER currency revenue:
| | | | | | | | |
| | Year ended December 31, | |
| | 2024 | | | 2023 | |
GAAP revenue | | $ | 3,366.4 | | | $ | 2,964.5 | |
Effect of changes in foreign currency translation rates | | | 13.1 | | | | (11.2 | ) |
Non-GAAP CER currency revenue | | $ | 3,379.5 | | | $ | 2,953.3 | |
GAAP Revenue growth rate | | | 13.6 | % | | | 17.1 | % |
Non-GAAP CER currency revenue growth rate | | | 14.0 | % | | | 16.7 | % |
The decrease in non-GAAP CER revenue growth was driven primarily by lower growth in our academic, government, and industrial markets against difficult high growth comparables in 2023. China was also a significant contributor to our slower growth in 2024 compared to the prior year. These markets were offset by revenue from acquisitions and organic growth.
GAAP Gross Profit to non-GAAP Gross Profit:
| | | | | | | | | | | | | | | | |
| | Year Ended December 31, | |
| | 2024 | | | 2023 | |
Gross profit | | $ | 1,649.5 | | | | 49.0 | % | | $ | 1,513.3 | | | | 51.0 | % |
Non-GAAP adjustments: | | | | | | | | | | | | |
Restructuring costs | | | 11.6 | | | | 0.3 | % | | | 3.5 | | | | 0.1 | % |
Acquisition-related costs | | | 22.0 | | | | 0.7 | % | | | 2.5 | | | | 0.1 | % |
Purchased intangible amortization | | | 47.8 | | | | 1.4 | % | | | 24.3 | | | | 0.9 | % |
Other costs | | | 6.0 | | | | 0.2 | % | | | 4.0 | | | | 0.1 | % |
Non-GAAP gross profit | | $ | 1,736.9 | | | | 51.6 | % | | $ | 1,547.6 | | | | 52.2 | % |
The decrease in non-GAAP gross margin was primarily due to the mix impact of our 2024 acquisitions combined with a modest headwind from foreign currency.
GAAP Operating income to non-GAAP Operating income:
| | | | | | | | | | | | | | | | |
| | Year Ended December 31, | |
| | 2024 | | | 2023 | |
Operating income | | $ | 253.1 | | | | 7.5 | % | | $ | 436.9 | | | | 14.7 | % |
Non-GAAP adjustments: | | | | | | | | | | | | |
Restructuring costs | | | 24.7 | | | | 0.7 | % | | | 22.3 | | | | 0.8 | % |
Acquisition-related costs | | | 76.0 | | | | 2.3 | % | | | 19.3 | | | | 0.7 | % |
Purchased intangible amortization | | | 99.1 | | | | 2.9 | % | | | 47.1 | | | | 1.6 | % |
Acquisition-related litigation charges | | | 46.0 | | | | 1.4 | % | | | — | | | | 0.0 | % |
Other costs | | | 19.1 | | | | 0.6 | % | | | 20.7 | | | | 0.6 | % |
Non-GAAP operating income | | $ | 518.0 | | | | 15.4 | % | | $ | 546.3 | | | | 18.4 | % |
The decrease in our non-GAAP operating margins in 2024 was primarily due to lower margin mix and increased costs related to 2024 acquisitions.
GAAP Net operating cash flow to non-GAAP Free cash flow:
| | | | | | | | |
| | Year Ended
December 31, | |
| | 2024 | | | 2023 | |
Net cash provided by operating activities | | $ | 251.3 | | | $ | 350.1 | |
Less: purchases of property, plant and equipment | | | (115.3 | ) | | | (106.9 | ) |
Free cash flow | | $ | 136.0 | | | $ | 243.2 | |
For the year ended December 31, 2024, our free cash flow was $107.2 million lower than the same period in 2023, primarily due to lower net income and significant acquisition-related expenses.
RESULTS OF OPERATIONS
A discussion regarding our results of operations for the fiscal year ended December 31, 2023 compared to 2022 can be found under Item 7 of our Annual Report on Form 10-K for the fiscal year ended December 31, 2023, filed with the SEC on February 29, 2024, which is available on the SEC’s website at www.sec.gov and our Investor Relations website at https://.ir.bruker.com under the “Financial Info” section.
Year Ended December 31, 2024, Compared to the Year Ended December 31, 2023
Consolidated Results
The following table presents our results for the periods presented (dollars in millions):
| | | | | | | | | | | | | | | | |
| | Year Ended December 31, | | | | | | | |
| | 2024 | | | 2023 | | | Dollar
Change | | | Percentage
Change | |
Product revenue | | $ | 2,759.2 | | | $ | 2,457.6 | | | $ | 301.6 | | | | 12.3 | % |
Service and other revenue | | | 607.2 | | | | 506.9 | | | | 100.3 | | | | 19.8 | % |
Total revenue | | | 3,366.4 | | | | 2,964.5 | | | | 401.9 | | | | 13.6 | % |
Cost of product revenue | | | 1,364.5 | | | | 1,165.2 | | | | 199.3 | | | | 17.1 | % |
Cost of service and other revenue | | | 352.4 | | | | 286.0 | | | | 66.4 | | | | 23.2 | % |
Total cost of revenue | | | 1,716.9 | | | | 1,451.2 | | | | 265.7 | | | | 18.3 | % |
Gross profit | | | 1,649.5 | | | | 1,513.3 | | | | 136.2 | | | | 9.0 | % |
Operating expenses: | | | | | | | | | | | | |
Selling, general and administrative | | | 893.8 | | | | 729.4 | | | | 164.4 | | | | 22.5 | % |
Research and development | | | 376.5 | | | | 294.8 | | | | 81.7 | | | | 27.7 | % |
Other charges, net | | | 126.1 | | | | 52.2 | | | | 73.9 | | | | 141.6 | % |
Total operating expenses | | | 1,396.4 | | | | 1,076.4 | | | | 320.0 | | | | 29.7 | % |
Operating income | | | 253.1 | | | | 436.9 | | | | (183.8 | ) | | | (42.1 | )% |
Bargain purchase gain and associated measurement period adjustments | | | (8.0 | ) | | | 144.1 | | | | (152.1 | ) | | | (105.6 | )% |
Interest and other income (expense), net | | | (38.2 | ) | | | (36.8 | ) | | | (1.4 | ) | | | 3.8 | % |
Income before income taxes, equity in income (losses) of
unconsolidated investees, net of tax, and noncontrolling
interests in consolidated subsidiaries | | | 206.9 | | | | 544.2 | | | | (337.3 | ) | | | (62.0 | )% |
Income tax provision | | | 91.4 | | | | 117.7 | | | | (26.3 | ) | | | (22.3 | )% |
Equity in income (losses) of unconsolidated investees, net of tax | | | (1.7 | ) | | | 2.0 | | | | (3.7 | ) | | | (185.0 | )% |
Consolidated net income | | | 113.8 | | | | 428.5 | | | | (314.7 | ) | | | (73.4 | )% |
Net income attributable to noncontrolling interests in
consolidated subsidiaries | | | 0.7 | | | | 1.3 | | | | (0.6 | ) | | | (46.2 | )% |
Net income attributable to Bruker Corporation | | $ | 113.1 | | | $ | 427.2 | | | $ | (314.1 | ) | | | (73.5 | )% |
Revenue
The following table presents revenue, change in revenue, and revenue growth by reportable segment for the periods presented (dollars in millions):
| | | | | | | | | | | | | | | | |
| | Year Ended December 31, | | | | | | | |
| | 2024 | | | 2023 | | | Dollar
Change | | | Percentage
Change | |
BSI BioSpin | | $ | 905.7 | | | $ | 798.5 | | | $ | 107.2 | | | | 13.4 | % |
BSI CALID | | | 1,093.5 | | | | 960.4 | | | | 133.1 | | | | 13.9 | % |
BSI NANO | | | 1,098.3 | | | | 941.9 | | | | 156.4 | | | | 16.6 | % |
BEST | | | 283.0 | | | | 280.7 | | | | 2.3 | | | | 0.8 | % |
Eliminations (a) | | | (14.1 | ) | | | (17.0 | ) | | | 2.9 | | | | (17.1 | )% |
| | $ | 3,366.4 | | | $ | 2,964.5 | | | $ | 401.9 | | | | 13.6 | % |
(a)Represents product and service revenue between reportable segments.
Revenue increases were driven by strong demand for our differentiated instruments and solutions and revenue growth from acquisitions. The BSI BioSpin Segment revenue increase was primarily due to demand for our instruments across academia, government and biopharma markets. The BSI BioSpin Segment also saw increased revenue from the Chemspeed acquisition. We had revenue from four gigahertz-class NMR systems each in fiscal 2024 and fiscal 2023. The BSI CALID Segment revenue increase reflected strong demand for our differentiated instruments, primarily, in our Microbiology & Infection Diagnostics, driven by the MALDI BioTyper and the ELITechGroup molecular diagnostics business, which was acquired in 2024, as well as our Optics IR/NIR/Raman businesses. This was partially offset by softness in academia and government markets as well as our China market. The BSI NANO Segment revenue increase was driven by strong demand in its semiconductor metrology market as well as revenue increases from the NanoString and Bruker Cellular acquisitions offset by soft demand from biopharma. BEST revenue increased slightly by growth in accelerator and fusion technologies at our Research Instruments (“RI”) business which is gaining traction in extreme ultraviolet lithography technologies for next-gen semiconductors, and was mostly offset by softness in clinical MRI superconductors.
For more detail on our revenue by geography, see “Foreign Currency Risk” in Item 7A Quantitative And Qualitative Disclosures About Market Risk on page 49 of this Annual Report on Form 10-K.
Gross Profit
The following table presents gross profit and gross profit margins by reportable segment for the years ended December 31, 2024 and 2023 (dollars in millions):
| | | | | | | | | | | | | | | | |
| | Year Ended December 31, | |
| | 2024 | | | 2023 | |
| | Gross Profit | | | Percentage of
Segment
Revenue | | | Gross Profit | | | Percentage of
Segment
Revenue | |
BSI BioSpin | | $ | 453.9 | | | | 50.1 | % | | $ | 419.9 | | | | 52.6 | % |
BSI CALID | | | 593.9 | | | | 54.3 | % | | | 554.6 | | | | 57.7 | % |
BSI NANO | | | 540.4 | | | | 49.2 | % | | | 486.0 | | | | 51.6 | % |
BEST | | | 61.3 | | | | 21.7 | % | | | 52.8 | | | | 18.8 | % |
Total gross profit | | $ | 1,649.5 | | | | 49.0 | % | | $ | 1,513.3 | | | | 51.0 | % |
The increase in gross profit was a result of pricing and volume leverage, marginally offset by net unfavorable impact of foreign exchange rate movements compared to 2023. The decrease in gross profit margin was primarily due to mix impact of our 2024 acquisitions combined, and unfavorable foreign exchange rate movements.
Selling, General and Administrative
Our selling, general and administrative expenses for the year ended December 31, 2024, increased to 26.6% of total revenue from 24.6% of total revenue for the comparable period in 2023. The year over year increase as a percentage of revenue was a result of increased mix of sales and marketing costs from 2024 acquisitions, increased spending related to additional headcount and personnel expenses, as well as increased consulting and professional fees related to acquisitions, tax, audit and audit-related fees.
Research and Development
Our research and development expenses for the year ended December 31, 2024, increased to 11.2% of total revenue from 9.9% of total revenue for the comparable period in 2023. The increase as a percentage of revenue is a result of our increased investment in research and development capabilities, and the mix of research and developments costs from 2024 acquisitions. Investments are primarily related to additional headcount and personnel expenses as well as increased consulting and professional fees related to research and development activities.
Other Charges, Net
Other charges, net for the year ended December 31, 2024, increased to $126.1 million compared to $52.2 million for the comparable period in 2023. The year over year increase was primarily due to $44.9 million of acquisition-related litigation charges primarily related to the acquisitions of BCA and NanoString as well as an increase of $38.1 million in acquisition-related expenses due to costs from 2024 acquisitions. Please refer to Note 11, Other Charges, net for more details on our other charges, net costs.
Operating Income
The following table presents operating income and operating margins on revenue by reportable segment for the periods presented (dollars in millions):
| | | | | | | | | | | | | | | | |
| | Year Ended December 31, | |
| | 2024 | | | 2023 | |
| | Operating
Income (Loss) | | | Percentage of
Segment
Revenue | | | Operating
Income (Loss) | | | Percentage of
Segment
Revenue | |
BSI BioSpin | | $ | 157.8 | | | | 17.4 | % | | $ | 195.9 | | | | 24.5 | % |
BSI CALID | | | 180.0 | | | | 16.5 | % | | | 209.3 | | | | 21.8 | % |
BSI NANO | | | 2.3 | | | | 0.2 | % | | | 109.1 | | | | 11.6 | % |
BEST | | | 34.9 | | | | 12.3 | % | | | 32.3 | | | | 11.5 | % |
Corporate, eliminations and other (a) | | | (121.9 | ) | | | | | | (109.7 | ) | | | |
Total operating income | | $ | 253.1 | | | | 7.5 | % | | $ | 436.9 | | | | 14.7 | % |
(a)Represents corporate costs and eliminations not allocated to the reportable segments.
The decrease in operating income and operating income margin was primarily due to unfavorable margin mix and increased costs related to 2024 acquisitions, and unfavorable foreign exchange rate movements.
Bargain purchase gain and associated measurement period adjustments
In 2023, the Company recorded a gain of $144.1 million, in connection with the PhenomeX acquisition, which closed on October 2, 2023. This bargain purchase gain reflected the excess of identifiable net assets acquired, including deferred tax assets related to acquired tax NOLs, over the purchase consideration paid.
In 2024, following the finalization of a review of income tax positions related to change in ownership limitations assessments on NOL/R&D credits at the end of the business combination measurement period in connection with the PhenomeX acquisition, the Company recorded a charge of $8.0 million
Interest and Other Income (Expense), Net
The increase in interest and other income (expense), net during the year ended December 31, 2024, as compared to the same period in 2023 was primarily due to higher interest expense of $47.9 million due to increased borrowings, and impairment of certain minority investments of $24.6 million, offset by higher foreign currency exchange gains of 23.7 million driven by strengthening of the U.S. dollar against other currencies.
Income Tax Provision
The effective tax rates for years ended 2024 and 2023, were 44.2% and 21.6%, respectively. The increase in the Company's effective tax rate was primarily due to changes in jurisdictional mix, an increase in tax reserves, and unfavorable return to provision adjustments.
Net Income Attributable to Bruker Corporation
The decrease in net income and earnings per diluted share was primarily driven by lower gross and operating margins, higher tax rate, as well as the bargain purchase gain recognized in 2023 in connection with the PhenomeX acquisition.
LIQUIDITY AND CAPITAL RESOURCES
Cash flows
We anticipate that our existing cash and credit facilities will be sufficient to support our operating and investing needs for at least the next twelve months. Our future cash requirements could be affected by acquisitions that we may complete, purchases of our common stock or the payment of dividends in the future. Historically, we have financed our growth and liquidity needs through cash flow generation from operations and a combination of debt financings and issuances of common stock. In the future, there are no assurances that we will continue to generate cash flow from operations or that additional financing alternatives will be available to us, if required, or, if available, will be obtained on terms favorable to us.
Effective in the quarter ended June 30, 2024, the Company entered into a multi-currency notional cash pooling agreement with a financial institution to manage cash flow more efficiently and optimize liquidity. Refer to Note 2, Summary of Significant Accounting policies for more information on our notional cash pooling agreement.
Cash and cash equivalents at December 31, 2024, and 2023 totaled $183.4 million and $488.3 million, respectively, of which $419.3 million and $398.4 million, respectively, related to cash, cash equivalents and short-term investments is held outside of the United States in our foreign subsidiaries, most significantly in the Netherlands, Switzerland, and Hong Kong. These balances include positive positions under our cash pooling arrangements.
The following table presents our cash flows from operating activities, investing activities and financing activities for the periods presented (in millions):
| | | | | | | | |
| | Year Ended December 31, | |
| | 2024 | | | 2023 | |
Net cash provided by operating activities | | $ | 251.3 | | | $ | 350.1 | |
Net cash used in investing activities | | | (1,757.3 | ) | | | (326.0 | ) |
Net cash provided by (used in) financing activities | | | 1,229.8 | | | | (193.4 | ) |
Effect of exchange rate changes on cash, cash equivalents and restricted cash | | | (28.7 | ) | | | 12.2 | |
Net change in cash, cash equivalents and restricted cash | | $ | (304.9 | ) | | $ | (157.1 | ) |
Net cash provided by operating activities during the year ended December 31, 2024, resulted primarily from consolidated net income adjusted for non-cash items of $329.5 million, partially offset by a change in operating assets and liabilities, net of acquisitions of $78.2 million. Net Cash provided by operating activities during the year ended December 31, 2023, resulted from consolidated net income adjusted for non-cash items of $437.9 million, including the non-cash bargain purchase gain from the acquisition of PhenomeX, partially offset by a change in operating assets and liabilities, net of acquisitions and divestitures of $87.8 million.
The decrease in consolidated net income adjusted for non-cash items was primarily due to lower income as result of unfavorable margin mix and increased costs related to 2024 acquisitions. The decrease in the change in operating assets and liabilities, net of acquisitions was due to higher inventory balances to handle supply chain challenges, higher accounts receivable and lower deferred revenue and customer advances, partially offset by increases in accounts payable and accrued expenses
Net cash used in investing activities during the year ended December 31, 2024, resulted primarily from the acquisitions of $1,599.6 million, purchases of property, plant and equipment of $115.3 million, and cash paid for minority investments of $48.3 million. Net cash used in investing activities during the year ended December 31, 2023, resulted primarily from acquisitions of $226.6 million, purchases of property, plant and equipment of $106.9 million, and cash paid for minority investments of $24.8 million, partially offset by net proceeds from sales of property, plant and equipment of $11.1 million.
We currently expect capital expenditures in 2025 to be approximately $100.0 million.
Net cash provided by financing activities during the year ended December 31, 2024, was primarily from proceeds from long-term debt of $973.7 million (refer to Note 21, Debt), proceeds from our public offering of common stock of $403.0 million (refer to Note 27, Shareholders’ Equity), and net proceeds from our revolving line of credit of $37.6 million (refer to Note 21, Debt). These inflows were primarily offset by the repayment of our 2012 Note Purchase Agreement of $100.0 million and the payment of dividends to common shareholders of $30.2 million. The increase in equity financing and the net increase in debt financing was primarily due to acquisition activity. Net cash used in financing activities during the year ended December 31, 2023, was primarily attributable to cash payments made for shares of common stock under our repurchase program of $152.3 million, and $29.4 million for the payment of dividends.
Share Repurchase Program
During the year ended December 31, 2024, we did not purchase any shares under the 2023 Repurchase Program. Please refer to Note 27, Shareholder's Equity, in the Notes to our Consolidated Financial Statements for more information on our share repurchase program. Subsequent to December 31, 2024 and prior to the date of filing this annual report on From 10K, the Company purchased 200,731 shares at an aggregate cost of $10 million.
Public Offering
In May 2024, we completed an underwritten public offering. Please refer to Note 27, Shareholder's Equity, in the Notes to our Consolidated Financial Statements for more information on this public offering.
Income Taxes
At December 31, 2024 and in accordance with the U.S. tax laws we recorded state and foreign withholding taxes, as well as subsequent foreign currency translations on these withholding taxes as they are an obligation of the parent company, on the cash and liquid assets portion of the unremitted earnings and profits (E&P) of foreign subsidiaries expected to be repatriated from our foreign subsidiaries to the United States. We continue to be indefinitely reinvested in the amount of $1.8 billion of non-cash E&P that is subject to the 2017 Tax Act deemed repatriation. If this E&P is ultimately distributed to the United States in the form of dividends or otherwise, we would likely be subject to additional withholding tax. We will continue to evaluate our assertions on the cumulative historical outside basis differences in our foreign subsidiaries as of December 31, 2024. The amount of unrecognized deferred withholding taxes on the undistributed E&P was $104.2 million at December 31, 2024.
As of December 31, 2024, the Company has approximately $593.5 million of U.S. federal net operating loss carryforwards, of which $33.8 million begin to expire at various dates beginning in 2033 and the remainder $559.7 million will be carried forward indefinitely. The Tax Cuts and Jobs Act (TCJA) enacted on December 22, 2017, limits a taxpayer’s ability to utilize NOL deduction in a year to 80% taxable income for federal NOL arising in tax years beginning after 2017. The Company has approximately $184.6 million of state net operating loss carryforwards available to reduce state taxable income that are expected to expire at various times beginning in 2024 to the extent that they cannot be utilized. The Company also has approximately $107.3 million of German Trade Tax and Corporate Income Tax net operating losses that are carried forward indefinitely.
In December 2021, the Organization for Economic Co-operation and Development (OECD) introduced its Pillar Two Framework Model Rules (“Pillar 2”) and provided guidance for a global minimum tax. Certain aspects of Pillar 2 took effect on January 1, 2024, while other aspects go into effect on January 1, 2025. The Company has evaluated the potential impact of Pillar 2 on its business and as a result, the Company has recorded a tax provision of $1.3 million for the period ended December 31, 2024. The Company continues to monitor the countries in which it operates as they enact legislation implementing Pillar 2.
Refer to Note 14, Income taxes for additional details of our loss carryforwards.
Debt and Credit Facilities
We have a total outstanding debt of $2.1 billion as of December 31, 2024, and a revolving credit facility that provides for up to $900.0 million of additional liquidity to finance working capital needs, refinance or reduce existing indebtedness, and for general corporate use of which $872.2 million is undrawn. In addition, the facility provides for an uncommitted incremental facility whereby, under certain circumstances, we may, at our option, increase the amount of the revolving facility or incur term loans in an aggregate amount not to exceed $400 million. As of December 31, 2024, we were in compliance with all covenants of our debt agreements.
Refer to Note 21, Debt in this annual report for additional information on our outstanding debt and credit facility as well as a summary of the fair and carrying values of our outstanding debt as of December 31, 2024.
CRITICAL ACCOUNTING POLICIES AND ESTIMATES
Our consolidated financial statements have been prepared in conformity with accounting principles generally accepted in the United States of America, or U.S. GAAP, and are disclosed in Note 2, Summary of Significant Accounting Policies in the notes the consolidated financial statements. U.S. GAAP requires us to make estimates and assumptions that affect the reported amounts of assets and liabilities and the disclosure of contingent assets and liabilities at the date of the financial statements and reported amounts of revenues and expenses during the reporting period.
We consider our accounting estimates to be critical to the consolidated financial statements if (i) the estimate requires significant judgment or is complex in nature and (ii) if different estimates and assumptions were used, the results could have a material impact on our consolidated financial statements. We evaluate our estimates and the application of our policies on an ongoing basis.
We base our estimates and judgments on our historical experience, current market and economic conditions, industry trends, and other assumptions that we believe are reasonable. Actual results could differ from these estimates. Changes in estimates are recorded in the period in which they become known.
We believe the following critical accounting policies and estimates to be both those most important to the portrayal of our financial position and results of operations and those that require the most estimation and subjective judgment. The full accounting policies are disclosed in Note 2, Summary of Significant Accounting Policies in the notes the consolidated financial statements.
Revenue Recognition:
We recognize revenue in accordance with Accounting Standards Codification (ASC) 606, Revenue from Contracts with Customers. The standard results in significant management judgment and estimates as a result of inherent uncertainties in the following areas:
Multiple Performance Obligations: Many of our contracts include multiple performance obligations, such as systems, installation, accessories, parts, and services. Allocating the transaction price to these obligations requires us to estimate the standalone selling price for each distinct good or service. While we primarily rely on observable prices from standalone sales, in cases where such evidence is unavailable, we use an expected cost-plus-margin approach, and this estimate requires judgments and is subject to potential variability if our assumptions about cost or margin change.
Timing of Revenue Recognition: We recognize revenue when control transfers to the customer in an amount that reflects the consideration we expect to receive. For most of our performance obligations, this occurs at a point in time, such as upon shipment or customer acceptance. However, for certain customized systems or services, revenue is recognized over time based on progress toward completion, typically measured using a cost-to-cost method based on cost incurred to date relative to total estimated costs. This method requires us to make reasonable estimates of total contract costs and assess progress. Revisions to cost estimates could significantly affect the timing and amount of revenue recognized, particularly for complex, long-term arrangements. Losses are recorded immediately when we estimate that contracts will ultimately result in a loss.
For systems with customer-specific acceptance criteria, management evaluates whether the customer assessment criteria have been satisfied, which may involve judgment in determining whether successful factory acceptance testing or customer sign-off has been achieved. Changes in customer requirements or delays in acceptance can impact the timing of revenue recognition.
Collectability assessment: Differing assessments of the probability of collection could impact the amount and timing of revenue recognition. However, based on our customer profile combined with an established practice of requiring advances for certain larger product sales, we have not historically experienced significant adjustments to revenue.
Income taxes
Deferred tax assets and liabilities are recognized for temporary differences between the financial statement carrying amounts and their respective tax bases, measured using enacted tax rates expected to apply when these differences reverse. The realizability of deferred tax assets is evaluated based on historical taxable income, current tax liabilities, and projected future taxable income, with the latter involving inherent uncertainty. A valuation allowance is established if it is more likely than not that some or all of the deferred tax assets will not be realized. Changes in estimates or assumptions regarding taxable income may require adjustments to the valuation allowance, which could materially impact our financial position and results of operations.
Liabilities for uncertain tax positions are recorded based on a minimum recognition threshold, requiring significant judgment to determine if it is more likely than not that a tax position will be sustained.
Business Combinations
We account for business combinations under the acquisition method of accounting. Accordingly, at the date of each acquisition, we measure the fair value of all identifiable assets acquired (including intangible assets), liabilities assumed and any remaining noncontrolling interests and allocate the amounts paid to all items measured. Any excess of fair value of acquired net assets, including identifiable intangible assets over the acquisition consideration, results in a bargain purchase gain.
The determination of the fair value of identifiable assets and liabilities is based on valuations that reflect management’s best estimates of inputs and assumptions, consistent with those a market participant would utilize. These valuations rely significantly on estimated future cash flows, which are critical inputs in the valuation models. The preparation of these estimates involves substantial judgment and incorporates information from multiple sources, including historical data of the acquired entity, insights obtained through due diligence, and industry publications available to us and all of which are subject to their own inherent limitations when estimating future outcomes.
Impairment
Goodwill and indefinite-lived intangible assets arising from our acquisitions, are not amortized, but are evaluated for impairment on an annual basis, or on an interim basis when events or changes in circumstances indicate that the carrying value may
not be recoverable. We typically identify other amortizing intangible assets as part of the acquisition accounting, and the amount and amortization period are determined at the time of the acquisition. In assessing the recoverability of goodwill and other indefinite-lived or amortizing intangible assets, we must make assumptions regarding the estimated future cash flows, including forecasted revenue growth and the discount rate to determine the fair value of these assets. If these estimates or their related assumptions adversely change after the acquisition date, we may be required to record impairment charges against these assets in the reporting period in which the impairment is determined. Refer to Note 6, Goodwill and Intangible Assets, for more information on goodwill and indefinite-lived intangible assets impairment assessment for current year acquisitions.
RECENT ACCOUNTING PRONOUNCEMENTS
Information regarding recently issued accounting pronouncements may be found in Note 3, Recent Accounting Pronouncements to our consolidated financial statements included in Item 8 of this Annual Report on Form 10-K.
ITEM 7A QUANTITATIVE AND QUALITATIVE DISCLOSURES ABOUT MARKET RISK
We are potentially exposed to market risks associated with changes in foreign currency translation rates, interest rates and commodity prices. See also Note 23, Derivative Instruments and Hedging Activities for more information on these risks. We selectively use financial instruments to reduce these risks. All transactions related to risk management techniques are authorized and executed pursuant to our policies and procedures. Analytical techniques used to manage and monitor foreign currency translation and interest rate risk include market valuations and sensitivity analysis.
We have estimated our market risk exposure using sensitivity analysis. To test the sensitivity of our market risk exposure, we have estimated the changes in fair value of market risk sensitive instruments assuming a hypothetical 10 percent adverse change in market prices or rates. The results of the sensitivity analyses are summarized below.
Foreign Currency Risk
We generate a substantial portion of our revenues in international markets, principally Germany and other countries in the European Union, Switzerland and Japan, which exposes our operations to the risk of exchange rate fluctuations. The impact of currency exchange rate movement can be positive or negative in any period. Our costs related to sales in foreign currencies are largely denominated in the same respective currencies, reducing our transaction risk exposure. However, for foreign currency denominated sales in certain regions, such as Japan, where we do not incur significant costs denominated in Japanese Yen, we are more exposed to the impact of foreign currency fluctuations.
For sales not denominated in U.S. Dollars, if there is an increase in the rate at which a foreign currency is exchanged for U.S. Dollars, it will require more of the foreign currency to equal a specified amount of U.S. Dollars than before the rate increase. In such cases, if we price our products in the foreign currency, we will receive less in U.S. Dollars than we would have received before the rate increase went into effect. If we price our products in U.S. Dollars and competitors price their products in local currency, an increase in the relative strength of the U.S. Dollar could result in our prices not being competitive in a market where business is transacted in the local currency. For example, if the U.S. Dollar strengthened against the Japanese Yen, our Japanese-based competitors would have a greater pricing advantage over us.
Our revenue by geography was as follows for the periods presented (dollars in millions):
| | | | | | | | | | | | | | | | |
| | Year Ended December 31, | |
| | 2024 | | | 2023 | |
| | Revenue | | | Percentage of
Revenue | | | Revenue | | | Percentage of
Revenue | |
United States | | $ | 938.5 | | | | 27.9 | % | | $ | 777.7 | | | | 26.2 | % |
Germany | | 310.7 | | | | 9.2 | % | | | 281.5 | | | | 9.5 | % |
Rest of Europe | | | 873.0 | | | | 25.9 | % | | | 699.7 | | | | 23.6 | % |
China | | 471.2 | | | | 14.0 | % | | | 528.1 | | | | 17.8 | % |
Rest of Asia Pacific | | 518.5 | | | | 15.4 | % | | | 460.9 | | | | 15.5 | % |
Other | | 254.5 | | | | 7.6 | % | | | 216.6 | | | | 7.4 | % |
Total revenue | | $ | 3,366.4 | | | | 100.0 | % | | $ | 2,964.5 | | | | 100.0 | % |
Changes in foreign currency exchange rates decreased our revenue by approximately 0.4% during the year ended December 31, 2024, and increased our revenue by approximately 0.4% during the year ended December 31, 2023.
Assets and liabilities of our foreign subsidiaries, where the functional currency is the local currency, are translated into U.S. Dollars using period-end exchange rates. Revenues and expenses of foreign subsidiaries are translated at the average exchange rates in effect during the year. Adjustments resulting from financial statement translations are included as a separate component of shareholders’ equity. We recorded a net loss of $79.6 million and a net gain of $76.2 million, during the years ended December 31, 2024, and 2023, respectively, from currency translation adjustments. A 10% depreciation in functional currencies, relative to the U.S. Dollar, at December 31, 2024, would have resulted in a reduction of shareholders’ equity of approximately $763.2 million. As of December 31, 2024, we have several cross-currency and interest rate swap agreements with a notional value of $131.6 million of U.S. Dollar to Swiss Franc and a notional value of $131.6 million of U.S. Dollar to Euro to hedge the variability in the movement of foreign currency exchange rates on portions of our Euro and Swiss Franc denominated net asset investments. Under the U.S. GAAP hedge accounting guidance, changes in fair value of the derivative that relates to changes in the foreign currency spot rate are recorded in the currency translation adjustment in comprehensive income (loss) and remain in accumulated comprehensive income (loss) in shareholders’ equity until the sale or substantial liquidation of the foreign operation. The before tax gains and losses related to hedges of net asset investments in international operations that were recorded within the cumulative translation adjustment section of other comprehensive income were loss of $89.1 for the year ended December 31, 2024, and gains of $100.9 million, and $58.0 million for the years ended December 31, 2023, and 2022 respectively. The difference between the interest rate received and paid under the cross-currency swap derivative agreement is recorded in interest income in the statement of income.
Gains and losses resulting from foreign currency transactions are reported in interest and other income (expense), net in the consolidated statements of income and comprehensive income. Our foreign currency transaction gain (loss), net were net gains of $23.7 million and net losses of $13.3 million for years ended December 31, 2024, and 2023, respectively.
From time to time, we have entered into forward currency contracts designed to minimize the volatility that fluctuations in foreign currency have on our cash flows related to purchases and sales denominated in foreign currencies. Under these arrangements, we agree to purchase a fixed amount of a foreign currency in exchange for a fixed amount of U.S. Dollars or other currencies on specified dates typically with maturities of less than twelve months with some agreements extending to longer periods. These transactions are recorded at fair value with the corresponding gains and losses recorded in interest and other income (expense), net in the consolidated statements of income and comprehensive income. The impact of currency exchange rate movement can be positive or negative in any period. We will continue to evaluate our currency risks, and in the future, may utilize foreign currency contracts more frequently.
Interest Rate Risk
We regularly invest excess cash in short-term investments that are subject to changes in interest rates. We believe that the market risk arising from holding these financial instruments is minimal because of our policy of investing in money market funds and short-term financial instruments issued by highly rated financial institutions.
Our exposure related to adverse movements in interest rates is derived primarily from outstanding floating rate debt instruments that are indexed to short-term market rates. We currently have a higher level of fixed rate debt than variable rate debt, which limits the exposure to adverse movements in interest rates.
Commodity Price Risk
We are exposed to certain commodity risks associated with prices for various raw materials. The prices of copper and certain other raw materials, particularly niobium-tin, used to manufacture superconductors have increased significantly over the last decade. Copper and niobium-tin are the main components of low temperature superconductors and continued commodity price increases for copper and niobium, as well as other raw materials, may negatively affect our profitability. Periodically, we enter into commodity forward purchase contracts to minimize the volatility that fluctuations in the price of copper have on our sales of these products. At December 31, 2024, and 2023, the fair value of the fixed price commodity contracts was de minimis. As commodity contracts settle, gains (losses) as a result of changes in fair values are adjusted to the contracts with the customers through revenues. We will continue to evaluate our commodity risks and may utilize commodity forward purchase contracts more frequently in the future.
Inflation Risk
We are subject to inflationary cost pressures across global operating supply networks. Certain components, parts, or materials are experiencing significant cost pressures that have impacted or may impact our cost of operations in future periods. Further, inflation has increased our selling, general and administrative expenses and may vary between countries in which we operate. We continue to evaluate these cost increases in relation to our new orders and may continue to see a negative impact on our financial results for a period of time.
ITEM 8 FINANCIAL STATEMENTS AND SUPPLEMENTARY DATA
Index of Consolidated Financial Statements
| |
| |
| Page
|
Report of Independent Registered Public Accounting Firm (PCAOB ID 238) | 52 |
Consolidated Balance Sheets as of December 31, 2024, and 2023 | 55 |
Consolidated Statements of Income for the years ended December 31, 2024, 2023, and 2022 | 56 |
Consolidated Statements of Comprehensive Income for the years ended December 31, 2024, 2023, and 2022 | 57 |
Consolidated Statements of Redeemable Noncontrolling Interests and Shareholders’ Equity for the years ended December 31, 2024, 2023, and 2022 | 58 |
Consolidated Statements of Cash Flows for the years ended December 31, 2024, 2023, and 2022 | 59 |
Notes to Consolidated Financial Statements | 60 |
Report of Independent Registered Public Accounting Firm
To the Board of Directors and Shareholders of Bruker Corporation
Opinions on the Financial Statements and Internal Control over Financial Reporting
We have audited the accompanying consolidated balance sheets of Bruker Corporation and its subsidiaries (the “Company”) as of December 31, 2024 and 2023, and the related consolidated statements of income, of comprehensive income, of redeemable noncontrolling interests and shareholders’ equity and of cash flows for each of the three years in the period ended December 31, 2024, including the related notes (collectively referred to as the “consolidated financial statements”). We also have audited the Company’s internal control over financial reporting as of December 31, 2024, based on criteria established in Internal Control - Integrated Framework (2013) issued by the Committee of Sponsoring Organizations of the Treadway Commission (COSO).
In our opinion, the consolidated financial statements referred to above present fairly, in all material respects, the financial position of the Company as of December 31, 2024 and 2023, and the results of its operations and its cash flows for each of the three years in the period ended December 31, 2024 in conformity with accounting principles generally accepted in the United States of America. Also in our opinion, the Company maintained, in all material respects, effective internal control over financial reporting as of December 31, 2024, based on criteria established in Internal Control - Integrated Framework (2013) issued by the COSO.
Basis for Opinions
The Company's management is responsible for these consolidated financial statements, for maintaining effective internal control over financial reporting, and for its assessment of the effectiveness of internal control over financial reporting, included in Management’s Report on Internal Control over Financial Reporting appearing under Item 9A. Our responsibility is to express opinions on the Company’s consolidated financial statements and on the Company’s internal control over financial reporting based on our audits. We are a public accounting firm registered with the Public Company Accounting Oversight Board (United States) (PCAOB) and are required to be independent with respect to the Company in accordance with the U.S. federal securities laws and the applicable rules and regulations of the Securities and Exchange Commission and the PCAOB.
We conducted our audits in accordance with the standards of the PCAOB. Those standards require that we plan and perform the audits to obtain reasonable assurance about whether the consolidated financial statements are free of material misstatement, whether due to error or fraud, and whether effective internal control over financial reporting was maintained in all material respects.
Our audits of the consolidated financial statements included performing procedures to assess the risks of material misstatement of the consolidated financial statements, whether due to error or fraud, and performing procedures that respond to those risks. Such procedures included examining, on a test basis, evidence regarding the amounts and disclosures in the consolidated financial statements. Our audits also included evaluating the accounting principles used and significant estimates made by management, as well as evaluating the overall presentation of the consolidated financial statements. Our audit of internal control over financial reporting included obtaining an understanding of internal control over financial reporting, assessing the risk that a material weakness exists, and testing and evaluating the design and operating effectiveness of internal control based on the assessed risk. Our audits also included performing such other procedures as we considered necessary in the circumstances. We believe that our audits provide a reasonable basis for our opinions.
As described in Management’s Report on Internal Control over Financial Reporting, management has excluded Chemspeed Technologies AG, Dynamic Biosensors GmbH, ELITechGroup, Nanophoton Corporation, NanoString Technologies, Nion LLC, Phasefocus Holdings Limited, Spectral Instruments Imaging LLC, and Tornado Spectral Systems Inc., from its assessment of internal control over financial reporting as of December 31, 2024 because they were acquired by the Company in purchase business combinations during 2024. We have also excluded Chemspeed Technologies AG, Dynamic Biosensors GmbH, ELITechGroup, Nanophoton Corporation, NanoString Technologies, Nion LLC, Phasefocus Holdings Limited, Spectral Instruments Imaging LLC, and Tornado Spectral Systems Inc. from our audit of internal control over financial reporting. The total assets and total revenues of these acquired entities excluded from management’s assessment and our audit of internal control over financial reporting collectively represent approximately 7% and 7%, respectively, of the related consolidated financial statement amounts as of and for the year ended December 31, 2024.
Definition and Limitations of Internal Control over Financial Reporting
A company’s internal control over financial reporting is a process designed to provide reasonable assurance regarding the reliability of financial reporting and the preparation of financial statements for external purposes in accordance with generally
accepted accounting principles. A company’s internal control over financial reporting includes those policies and procedures that (i) pertain to the maintenance of records that, in reasonable detail, accurately and fairly reflect the transactions and dispositions of the assets of the company; (ii) provide reasonable assurance that transactions are recorded as necessary to permit preparation of financial statements in accordance with generally accepted accounting principles, and that receipts and expenditures of the company are being made only in accordance with authorizations of management and directors of the company; and (iii) provide reasonable assurance regarding prevention or timely detection of unauthorized acquisition, use, or disposition of the company’s assets that could have a material effect on the financial statements.
Because of its inherent limitations, internal control over financial reporting may not prevent or detect misstatements. Also, projections of any evaluation of effectiveness to future periods are subject to the risk that controls may become inadequate because of changes in conditions, or that the degree of compliance with the policies or procedures may deteriorate.
Critical Audit Matters
The critical audit matters communicated below are matters arising from the current period audit of the consolidated financial statements that were communicated or required to be communicated to the audit committee and that (i) relate to accounts or disclosures that are material to the consolidated financial statements and (ii) involved our especially challenging, subjective, or complex judgments. The communication of critical audit matters does not alter in any way our opinion on the consolidated financial statements, taken as a whole, and we are not, by communicating the critical audit matters below, providing separate opinions on the critical audit matters or on the accounts or disclosures to which they relate.
Revenue Recognition – System Sales
As described in Note 2 to the consolidated financial statements, the Company recognizes revenue from systems sales upon transfer of control in an amount that reflects the consideration it expects to receive. Transfer of control generally occurs upon shipment, or for certain systems, based upon customer acceptance for a system once delivered and installed at a customer facility. For systems that include customer-specific acceptance criteria, management is required to assess when the Company can demonstrate the acceptance criteria has been met, which generally is upon successful factory acceptance testing or customer acceptance and evidence of installation. The Company’s consolidated product revenue for the year ended December 31, 2024 was $2,759.2 million, of which a significant portion relates to system sales.
The principal consideration for our determination that performing procedures relating to revenue recognition for system sales is a critical audit matter is a high degree of auditor effort in performing procedures related to the Company’s system sales revenue recognition.
Addressing the matter involved performing procedures and evaluating audit evidence in connection with forming our overall opinion on the consolidated financial statements. These procedures included testing the effectiveness of controls relating to system sales revenue recognition. These procedures also included, among others, testing revenue recognized for a sample of system sales transactions by obtaining and inspecting source documents, such as invoices, customer purchase orders, shipping or delivery documents, acceptance documents, and cash receipts, where applicable.
Acquisition of ELITechGroup – Valuation of Customer Relationships and Technology
As described in Note 4 to the consolidated financial statements, on April 30, 2024, the Company completed the acquisition of ELITechGroup for total consideration transferred, net of cash acquired, of $931.2 million. Of the acquired intangible assets, $236.3 million of customer relationships and $193.3 million of technology were recorded. Fair value is estimated by management using a multi-period excess earnings method for the customer relationships and a relief from royalty method for technology. Management’s cash flow projections for the intangible assets acquired included significant judgments and assumptions related to customer attrition rates, contributory asset charges, and discount rates for the customer relationships and revenue growth rates, royalty rates, obsolescence rates, and discount rates for the technology.
The principal considerations for our determination that performing procedures relating to the valuation of customer relationships and technology acquired in the acquisition of ELITechGroup is a critical audit matter are (i) the significant judgment by management when developing the fair value estimate of the customer relationships and technology acquired; (ii) a high degree of auditor judgment, subjectivity, and effort in performing procedures and evaluating management’s significant assumptions related to customer attrition rates, contributory asset charges, and discount rates for the customer relationships and revenue growth rates, royalty rates, obsolescence rates, and discount rates for the technology; and (iii) the audit effort involved the use of professionals with specialized skill and knowledge.
Addressing the matter involved performing procedures and evaluating audit evidence in connection with forming our overall opinion on the consolidated financial statements. These procedures included testing the effectiveness of controls relating to the acquisition accounting, including controls over management’s valuation of the customer relationships and technology acquired. These procedures also included, among others (i) reading the securities purchase agreement; (ii) testing management’s process for developing the fair value estimate of the customer relationships and technology acquired; (iii) evaluating the appropriateness of the multi-period excess earnings and relief from royalty methods used by management; (iv) testing the completeness and accuracy of the underlying data used in the multi-period excess earnings and relief from royalty methods; and (v) evaluating the reasonableness of the significant assumptions used by management related to customer attrition rates, contributory asset charges, and discount rates for the customer relationships and revenue growth rates, royalty rates, obsolescence rates, and discount rates for the technology. Evaluating management’s assumptions related to revenue growth rates for the technology involved considering (i) the current and past performance of the ELITechGroup business; (ii) the consistency with external market and industry data; and (iii) whether the assumptions were consistent with evidence obtained in other areas of the audit. Professionals with specialized skill and knowledge were used to assist in evaluating (i) the appropriateness of the multi-period excess earnings and relief from royalty methods and (ii) the reasonableness of the assumptions related to customer attrition rates, contributory asset charges, and discount rates for the customer relationships and the assumptions related to royalty rates, obsolescence rates, and discount rates for the technology.
/s/ PricewaterhouseCoopers LLP
Boston, Massachusetts
March 3, 2025
We have served as the Company’s auditor since 2016.
BRUKER CORPORATION
CONSOLIDATED BALANCE SHEETS
(in millions, except share and per share data)
| | | | | | | | |
| | December 31, | |
| | 2024 | | | 2023 | |
ASSETS | | | | | | |
Current assets: | | | | | | |
Cash and cash equivalents | | $ | 183.4 | | | $ | 488.3 | |
Accounts receivable, net | | | 565.5 | | | | 492.0 | |
Inventories | | | 1,067.8 | | | | 968.3 | |
Other current assets | | | 236.5 | | | | 215.6 | |
Total current assets | | | 2,053.2 | | | | 2,164.2 | |
| | | | | | |
Property, plant and equipment, net | | | 669.3 | | | | 599.7 | |
Goodwill | | | 1,507.3 | | | | 582.6 | |
Intangible assets, net | | | 912.5 | | | | 330.5 | |
Operating lease assets | | | 145.5 | | | | 91.7 | |
Deferred tax assets, net | | | 286.2 | | | | 297.2 | |
Other long-term assets | | | 232.7 | | | | 184.0 | |
Total assets | | $ | 5,806.7 | | | $ | 4,249.9 | |
LIABILITIES, REDEEMABLE NONCONTROLLING INTERESTS AND
SHAREHOLDERS’ EQUITY | | | | | | |
Current liabilities: | | | | | | |
Current portion of long-term debt and finance lease obligations | | $ | 32.5 | | | $ | 121.2 | |
Accounts payable | | | 234.1 | | | | 202.7 | |
Deferred revenue and customer advances | | | 438.2 | | | | 400.0 | |
Other current liabilities | | | 576.5 | | | | 478.2 | |
Total current liabilities | | | 1,281.3 | | | | 1,202.1 | |
| | | | | | |
Long-term debt | | | 2,061.8 | | | | 1,160.3 | |
Long-term deferred revenue and customer advances | | | 100.0 | | | | 91.5 | |
Deferred tax liabilities | | | 118.5 | | | | 67.7 | |
Operating lease liabilities | | | 118.9 | | | | 74.8 | |
Other long-term liabilities | | | 311.0 | | | | 240.2 | |
Total liabilities | | $ | 3,991.5 | | | $ | 2,836.6 | |
| | | | | | |
Commitments and contingencies (Note 26) | | | | | | |
Redeemable noncontrolling interests | | | 18.1 | | | | 18.7 | |
Shareholders’ equity: | | | | | | |
Preferred stock, $0.01 par value 5,000,000 shares authorized, none issued or
outstanding at December 31, 2024 and 2023 | | | — | | | | — | |
Common stock, $0.01 par value 260,000,000 shares authorized, 182,456,831
and 175,943,705 shares issued, and 151,677,952 and 145,164,826 outstanding
at December 31, 2024 and 2023, respectively | | | 1.8 | | | | 1.7 | |
Treasury stock at cost, 30,778,879 shares at December 31, 2024
and 2023 | | | (1,237.2 | ) | | | (1,237.2 | ) |
Additional paid-in capital | | | 713.4 | | | | 282.9 | |
Retained earnings | | | 2,406.7 | | | | 2,323.8 | |
Accumulated other comprehensive income (loss), net of tax | | | (103.5 | ) | | | 6.0 | |
Total shareholders’ equity attributable to Bruker Corporation | | | 1,781.2 | | | | 1,377.2 | |
Noncontrolling interests in consolidated subsidiaries | | | 15.9 | | | | 17.4 | |
Total shareholders’ equity | | | 1,797.1 | | | | 1,394.6 | |
Total liabilities, redeemable noncontrolling interests and shareholders’ equity | | $ | 5,806.7 | | | $ | 4,249.9 | |
The accompanying notes are an integral part of these consolidated financial statements.
BRUKER CORPORATION
CONSOLIDATED STATEMENTS OF INCOME
(in millions, except per share data)
| | | | | | | | | | | | |
| | Year Ended December 31, | |
| | 2024 | | | 2023 | | | 2022 | |
Product revenue | | $ | 2,759.2 | | | $ | 2,457.6 | | | $ | 2,109.9 | |
Service and other revenue | | | 607.2 | | | | 506.9 | | | | 420.8 | |
Total revenue | | | 3,366.4 | | | | 2,964.5 | | | | 2,530.7 | |
Cost of product revenue | | | 1,364.5 | | | | 1,165.2 | | | | 984.0 | |
Cost of service and other revenue | | | 352.4 | | | | 286.0 | | | | 241.0 | |
Total cost of revenue | | | 1,716.9 | | | | 1,451.2 | | | | 1,225.0 | |
Gross profit | | | 1,649.5 | | | | 1,513.3 | | | | 1,305.7 | |
Operating expenses: | | | | | | | | | |
Selling, general and administrative | | | 893.8 | | | | 729.4 | | | | 607.4 | |
Research and development | | | 376.5 | | | | 294.8 | | | | 235.9 | |
Other charges, net | | | 126.1 | | | | 52.2 | | | | 29.7 | |
Total operating expenses | | | 1,396.4 | | | | 1,076.4 | | | | 873.0 | |
Operating income | | | 253.1 | | | | 436.9 | | | | 432.7 | |
Bargain purchase gain and associated measurement period adjustments | | | (8.0 | ) | | | 144.1 | | | | — | |
Interest and other income (expense), net | | | (38.2 | ) | | | (36.8 | ) | | | (18.8 | ) |
Income before income taxes, equity in income (losses) of unconsolidated
investees, net of tax, and noncontrolling interests in consolidated
subsidiaries | | | 206.9 | | | | 544.2 | | | | 413.9 | |
Income tax provision | | | 91.4 | | | | 117.7 | | | | 116.4 | |
Equity in income (losses) of unconsolidated investees, net of tax | | | (1.7 | ) | | | 2.0 | | | | 1.0 | |
Consolidated net income | | | 113.8 | | | | 428.5 | | | | 298.5 | |
Net income attributable to noncontrolling interests in
consolidated subsidiaries | | | 0.7 | | | | 1.3 | | | | 1.9 | |
Net income attributable to Bruker Corporation | | $ | 113.1 | | | $ | 427.2 | | | $ | 296.6 | |
Net income attributable to Bruker
Corporation shareholders per common share: | | | | | | | | | |
Basic | | $ | 0.76 | | | $ | 2.92 | | | $ | 2.00 | |
Diluted | | $ | 0.76 | | | $ | 2.90 | | | $ | 1.99 | |
Weighted average common shares outstanding: | | | | | | | | | |
Basic | | | 149.0 | | | | 146.4 | | | | 148.6 | |
Diluted | | | 149.5 | | | | 147.2 | | | | 149.4 | |
The accompanying notes are an integral part of these consolidated financial statements.
BRUKER CORPORATION
CONSOLIDATED STATEMENTS OF COMPREHENSIVE INCOME
(in millions)
| | | | | | | | | | | | |
| | Year Ended December 31, | |
| | 2024 | | | 2023 | | | 2022 | |
Consolidated net income | | $ | 113.8 | | | $ | 428.5 | | | $ | 298.5 | |
| | | | | | | | | |
Other comprehensive income (loss): | | | | | | | | | |
| | | | | | | | | |
Foreign currency translation: | | | | | | | | | |
Foreign currency translation gain (loss) before income taxes | | | (160.0 | ) | | | 96.5 | | | | (66.0 | ) |
Income tax expense (benefit) on foreign currency translation adjustments | | | (1.1 | ) | | | 3.2 | | | | 1.4 | |
Foreign currency translation gain (loss) after income taxes | | | (158.9 | ) | | | 93.3 | | | | (67.4 | ) |
| | | | | | | | | |
Designated hedging instruments: | | | | | | | | | |
Unrealized gain (loss) on designated hedging instruments | | | 105.0 | | | | (82.6 | ) | | | 66.6 | |
Reclassification of (gain) on cashflow hedges to statements of income | | | (15.8 | ) | | | (18.3 | ) | | | (8.6 | ) |
Gain (loss) on designated hedging instruments before income taxes | | | 89.2 | | | | (100.9 | ) | | | 58.0 | |
Income tax expense (benefit) related to designated hedging instruments | | | 21.0 | | | | (23.8 | ) | | | 13.8 | |
Gain (loss) on designated hedging instruments after income taxes | | | 68.2 | | | | (77.1 | ) | | | 44.2 | |
| | | | | | | | | |
Pension and other postretirement plans: | | | | | | | | | |
Pension and other postretirement benefit liability adjustments gain (loss) arising during the period | | | (25.4 | ) | | | (28.3 | ) | | | 55.6 | |
Amortization of actuarial gain (loss) and prior service credits included in net periodic pension cost | | | (0.5 | ) | | | (0.7 | ) | | | 1.2 | |
Total pension and other postretirement benefit liability adjustments gain (loss) before income taxes | | | (25.9 | ) | | | (29.0 | ) | | | 56.8 | |
Income tax benefit expense (benefit) related to total pension and other postretirement benefit liability adjustments | | | (5.0 | ) | | | (5.1 | ) | | | 11.8 | |
Total pension and other postretirement benefit liability adjustments gain (loss) after income taxes | | | (20.9 | ) | | | (23.9 | ) | | | 45.0 | |
| | | | | | | | | |
Total other comprehensive income (loss) | | | (111.6 | ) | | | (7.7 | ) | | | 21.8 | |
Total Comprehensive income | | | 2.2 | | | | 420.8 | | | | 320.3 | |
Less: Comprehensive income (loss) attributable to noncontrolling interests | | | (0.7 | ) | | | 2.5 | | | | 1.6 | |
Less: Comprehensive loss attributable to redeemable noncontrolling
interests | | | (0.7 | ) | | | (0.1 | ) | | | (0.9 | ) |
Total Comprehensive income attributable to Bruker Corporation | | $ | 3.6 | | | $ | 418.4 | | | $ | 319.6 | |
The accompanying notes are an integral part of these consolidated financial statements.
BRUKER CORPORATION
CONSOLIDATED STATEMENTS OF REDEEMABLE NONCONTROLLING INTERESTS AND SHAREHOLDERS’ EQUITY
(in millions, except share data)
| | | | | | | | | | | | | | | | | | | | | | | | | | | | | | | | | | | | | | | | | | | | |
| | Redeemable
Noncontrolling
Interests | | | Number of Common
Shares Outstanding | | | Common
Stock
Amount | | | Number of Treasury
Shares | | | Treasury
Stock
Amount | | | Additional
Paid-In
Capital | | | Retained
Earnings | | | Accumulated
Other
Comprehensive
Income (Loss), net of tax | | | Total
Shareholders’
Equity
Attributable to
Bruker
Corporation | | | Noncontrolling
Interests in
Consolidated
Subsidiaries | | | Total
Shareholders’
Equity | |
Balance at December 31, 2021 | | $ | 0.2 | | | | 150,753,687 | | | $ | 1.7 | | | | 24,151,348 | | | $ | (820.3 | ) | | $ | 237.8 | | | $ | 1,659.5 | | | $ | (8.2 | ) | | $ | 1,070.5 | | | $ | 14.1 | | | $ | 1,084.6 | |
Stock options exercised | | | — | | | | 251,006 | | | | — | | | | — | | | | — | | | | 5.8 | | | | — | | | | — | | | | 5.8 | | | | — | | | | 5.8 | |
Restricted stock units vested | | | — | | | | 233,545 | | | | — | | | | — | | | | — | | | | (3.0 | ) | | | — | | | | — | | | | (3.0 | ) | | | — | | | | (3.0 | ) |
Stock-based compensation | | | — | | | | — | | | | — | | | | — | | | | — | | | | 15.7 | | | | — | | | | — | | | | 15.7 | | | | — | | | | 15.7 | |
Shares repurchased | | | — | | | | (4,215,094 | ) | | | — | | | | 4,215,094 | | | | (264.7 | ) | | | — | | | | — | | | | — | | | | (264.7 | ) | | | — | | | | (264.7 | ) |
Distributions to noncontrolling
interests | | | | | | | | | | | | | | | | | | | | | | | | | | | — | | | | (1.2 | ) | | | (1.2 | ) |
Cash dividends paid to common
shareholders ($0.20 per share) | | | — | | | | — | | | | — | | | | — | | | | — | | | | — | | | | (29.8 | ) | | | — | | | | (29.8 | ) | | | — | | | | (29.8 | ) |
Consolidated net income (loss) | | | (0.6 | ) | | | — | | | | — | | | | — | | | | — | | | | — | | | | 296.6 | | | | — | | | | 296.6 | | | | 2.5 | | | | 299.1 | |
Other shareholders of majority
owned acquisitions | | | 6.8 | | | | — | | | | | | | | | | | | | | | | — | | | | | | | — | | | | — | | | | — | |
Acquisition of minority interest | | | — | | | | — | | | | | | | | | | | | | | | | (0.3 | ) | | | (0.2 | ) | | | (0.5 | ) | | | (2.6 | ) | | | (3.1 | ) |
Other comprehensive income (loss) | | | (0.3 | ) | | | — | | | | — | | | | — | | | | — | | | | — | | | | — | | | | 23.2 | | | | 23.2 | | | | (0.9 | ) | | | 22.3 | |
Balance at December 31, 2022 | | $ | 6.1 | | | | 147,023,144 | | | $ | 1.7 | | | $ | 28,366,442 | | | $ | (1,085.0 | ) | | $ | 256.3 | | | $ | 1,926.0 | | | $ | 14.8 | | | $ | 1,113.8 | | | $ | 11.9 | | | $ | 1,125.7 | |
Stock options exercised | | | — | | | | 285,030 | | | | — | | | | — | | | | — | | | | 9.7 | | | | — | | | | — | | | | 9.7 | | | | — | | | | 9.7 | |
Restricted stock units vested | | | — | | | | 215,959 | | | | — | | | | — | | | | — | | | | (3.4 | ) | | | — | | | | — | | | | (3.4 | ) | | | — | | | | (3.4 | ) |
Stock-based compensation | | | 0.1 | | | | — | | | | — | | | | — | | | | — | | | | 17.6 | | | | — | | | | — | | | | 17.6 | | | | — | | | | 17.6 | |
Shares repurchased | | | — | | | | (2,412,437 | ) | | | | | | 2,412,437.0 | | | | (152.2 | ) | | | (1.2 | ) | | | — | | | | — | | | | (153.4 | ) | | | — | | | | (153.4 | ) |
Employee stock purchase plan | | | — | | | | 53,130 | | | | — | | | | — | | | | — | | | | 3.9 | | | | — | | | | — | | | | 3.9 | | | | — | | | | 3.9 | |
Cash dividends paid to common
shareholders ($0.20 per share) | | | — | | | | — | | | | — | | | | — | | | | — | | | | — | | | | (29.4 | ) | | | — | | | | (29.4 | ) | | | — | | | | (29.4 | ) |
Proceeds from the sale of non-
controlling interests, net of loan
receivable of $0.3 | | | | | | | | | | | | | | | | | | | | | | | | | | | | | | 5.0 | | | | 5.0 | |
Other shareholders of majority
owned acquisitions | | | 12.6 | | | | — | | | | — | | | | — | | | | — | | | | — | | | | — | | | | — | | | | — | | | | | | | - | |
Distributions to noncontrolling interest | | | — | | | | — | | | | — | | | | — | | | | — | | | | — | | | | — | | | | — | | | | — | | | | (2.0 | ) | | | (2.0 | ) |
Consolidated net income (loss) | | | (0.7 | ) | | | — | | | | — | | | | — | | | | — | | | | — | | | | 427.2 | | | | — | | | | 427.2 | | | | 2.0 | | | | 429.2 | |
Other comprehensive income (loss) | | | 0.6 | | | | | | | | | | | | | | | | | | | — | | | | (8.8 | ) | | | (8.8 | ) | | | 0.5 | | | | (8.3 | ) |
Balance at December 31, 2023 | | $ | 18.7 | | | | 145,164,826 | | | $ | 1.7 | | | $ | 30,778,879 | | | $ | (1,237.2 | ) | | $ | 282.9 | | | $ | 2,323.8 | | | $ | 6.0 | | | $ | 1,377.2 | | | $ | 17.4 | | | $ | 1,394.6 | |
Stock options exercised | | | — | | | | 208,700 | | | | — | | | | — | | | | — | | | | 4.6 | | | | — | | | | — | | | | 4.6 | | | | — | | | | 4.6 | |
Restricted stock units vested | | | — | | | | 217,576 | | | | — | | | | — | | | | — | | | | (3.3 | ) | | | — | | | | — | | | | (3.3 | ) | | | — | | | | (3.3 | ) |
Stock-based compensation | | | 0.1 | | | | — | | | | — | | | | — | | | | — | | | | 20.3 | | | | — | | | | — | | | | 20.3 | | | | — | | | | 20.3 | |
Employee stock purchase plan | | | — | | | | 86,850 | | | | — | | | | — | | | | — | | | | 6.0 | | | | — | | | | — | | | | 6.0 | | | | — | | | | 6.0 | |
Public Offering, net of issuance costs of
$0.8 million | | | — | | | | 6,000,000 | | | | 0.1 | | | | — | | | | — | | | | 402.9 | | | | | | | | | | 403.0 | | | | | | | 403.0 | |
Cash dividends paid to common
shareholders ($0.20 per share) | | | — | | | | — | | | | — | | | | — | | | | — | | | | — | | | | (30.2 | ) | | | — | | | | (30.2 | ) | | | — | | | | (30.2 | ) |
Loans to noncontrolling interest | | | | | | | | | | | | | | | | | | | | | | | | | | | | | | (0.8 | ) | | | (0.8 | ) |
Consolidated net income | | | 0.3 | | | | — | | | | — | | | | — | | | | — | | | | — | | | | 113.1 | | | | — | | | | 113.1 | | | | 0.4 | | | | 113.5 | |
Other comprehensive (loss) | | | (1.0 | ) | | | — | | | | — | | | | — | | | | — | | | | — | | | | — | | | | (109.5 | ) | | | (109.5 | ) | | | (1.1 | ) | | | (110.6 | ) |
Balance at December 31, 2024 | | $ | 18.1 | | | | 151,677,952 | | | $ | 1.8 | | | $ | 30,778,879 | | | $ | (1,237.2 | ) | | $ | 713.4 | | | $ | 2,406.7 | | | $ | (103.5 | ) | | $ | 1,781.2 | | | $ | 15.9 | | | $ | 1,797.1 | |
The accompanying notes are an integral part of these consolidated financial statements.
BRUKER CORPORATION
CONSOLIDATED STATEMENTS OF CASH FLOWS
(in millions)
| | | | | | | | | | | | |
| | Year Ended December 31, | |
| | 2024 | | | 2023 | | | 2022 | |
Cash flows from operating activities: | | | | | | | | | |
Consolidated net income | | $ | 113.8 | | | $ | 428.5 | | | $ | 298.5 | |
Adjustments to reconcile consolidated net income to cash flows from
operating activities: | | | | | | | | | |
Depreciation and amortization | | | 183.8 | | | | 114.9 | | | | 88.8 | |
Stock-based compensation expense | | | 25.3 | | | | 24.0 | | | | 27.7 | |
Deferred income taxes | | | (63.8 | ) | | | (24.4 | ) | | | (14.8 | ) |
Bargain purchase gain on acquisition and associated measurement period adjustments | | | 8.0 | | | | (144.1 | ) | | | — | |
Impairment of minority investments and other long-lived assets | | | 28.5 | | | | 22.2 | | | | 1.6 | |
Loss on sale of minority investment | | | — | | | | (6.8 | ) | | | — | |
Gain (loss) on sale of property, plant and equipment | | | 4.6 | | | | (8.5 | ) | | | (10.1 | ) |
Other non-cash expenses, net | | | 29.3 | | | | 32.1 | | | | 26.8 | |
Changes in operating assets and liabilities, net of acquisitions: | | | | | | | | | |
Accounts receivable | | | (40.6 | ) | | | (0.9 | ) | | | (67.9 | ) |
Inventories | | | (69.8 | ) | | | (125.0 | ) | | | (137.9 | ) |
Accounts payable | | | 20.8 | | | | 1.2 | | | | 33.3 | |
Income taxes payable, net | | | (15.3 | ) | | | 43.7 | | | | (6.8 | ) |
Deferred revenue and customer advances | | | (52.8 | ) | | | (0.6 | ) | | | 52.7 | |
Other changes in operating assets and liabilities, net | | | 79.5 | | | | (6.2 | ) | | | (17.5 | ) |
Net cash provided by operating activities | | | 251.3 | | | | 350.1 | | | | 274.4 | |
Cash flows from investing activities: | | | | | | | | | |
Purchases of property, plant and equipment | | | (115.3 | ) | | | (106.9 | ) | | | (129.2 | ) |
Maturity of short-term investments | | | — | | | | — | | | | 100.0 | |
Proceeds from sale of minority investment | | | — | | | | 14.8 | | | | — | |
Cash paid for minority investments | | | (48.3 | ) | | | (24.8 | ) | | | (60.2 | ) |
Cash paid for acquisitions, net of cash acquired | | | (1,599.6 | ) | | | (226.6 | ) | | | (182.3 | ) |
Proceeds from sales of property, plant and equipment | | | 1.1 | | | | 11.1 | | | | 13.9 | |
Net proceeds from cross-currency swap agreements | | | 4.8 | | | | 6.4 | | | | 6.2 | |
Net cash used in investing activities | | | (1,757.3 | ) | | | (326.0 | ) | | | (251.6 | ) |
Cash flows from financing activities: | | | | | | | | | |
Repayments of revolving lines of credit | | | (1,212.7 | ) | | | — | | | | — | |
Proceeds from revolving lines of credit | | | 1,250.3 | | | | — | | | | — | |
Repayment of long-term debt | | | (135.4 | ) | | | (23.5 | ) | | | (111.0 | ) |
Proceeds from long-term debt | | | 973.7 | | | | 2.0 | | | | 0.3 | |
Payment of deferred financing costs | | | (5.5 | ) | | | — | | | | — | |
Proceeds from Public Offering of common stock, net of issuance costs | | | 403.0 | | | | — | | | | — | |
Proceeds from issuance of common stock under employee stock plans, net | | | 6.0 | | | | 9.5 | | | | 2.8 | |
Payment of contingent consideration | | | (4.7 | ) | | | (2.7 | ) | | | (2.7 | ) |
Payment of dividends to common shareholders | | | (30.2 | ) | | | (29.4 | ) | | | (29.8 | ) |
Repurchase of common stock | | | — | | | | (152.3 | ) | | | (263.1 | ) |
Proceeds from the sale (payment for the purchase) of noncontrolling interests | | | (14.7 | ) | | | 3.0 | | | | (11.8 | ) |
Net cash provided by (used in) financing activities | | | 1,229.8 | | | | (193.4 | ) | | | (415.3 | ) |
Effect of exchange rate changes on cash, cash equivalents and restricted cash | | | (28.7 | ) | | | 12.2 | | | | (30.5 | ) |
Net change in cash, cash equivalents and restricted cash | | | (304.9 | ) | | | (157.1 | ) | | | (423.0 | ) |
Cash, cash equivalents and restricted cash at beginning of year | | | 491.6 | | | | 648.7 | | | | 1,071.7 | |
Cash, cash equivalents and restricted cash at end of year | | $ | 186.7 | | | $ | 491.6 | | | $ | 648.7 | |
| | | | | | | | | |
Supplemental cash flow information: | | | | | | | | | |
Cash paid for interest | | $ | 54.6 | | | $ | 33.7 | | | $ | 24.3 | |
Cash paid for taxes | | $ | 153.9 | | | $ | 96.6 | | | $ | 147.4 | |
Restricted cash period beginning balance | | $ | 3.3 | | | $ | 3.2 | | | $ | 3.5 | |
Restricted cash period ending balance | | $ | 3.3 | | | $ | 3.3 | | | $ | 3.2 | |
The accompanying notes are an integral part of these consolidated financial statements.
NOTES TO CONSOLIDATED FINANCIAL STATEMENTS
1. Description of Business
Bruker Corporation, together with its consolidated subsidiaries (Bruker or the Company), develops, manufactures and distributes high-performance scientific instruments and analytical and diagnostic solutions that enable its customers to explore life and materials at microscopic, molecular and cellular levels. Many of the Company’s products are used to detect, measure and visualize structural characteristics of chemical, biological and industrial material samples.
The Company has four reportable segments:
•Bruker Scientific Instruments (BSI) BioSpin:
Designs, manufactures and distributes enabling life science tools based on magnetic resonance technology and provides automated laboratory research and development and quality control workflow solutions in a wide range of chemical research fields. Revenues are generated by academic and government research customers, pharmaceutical and biotechnology companies and nonprofit laboratories, as well as chemical, food and beverage, clinical and other industrial companies.
•BSI CALID (Chemicals, Applied Markets, Life Science, In Vitro Diagnostics, Detection):
Designs, manufactures and distributes life science mass spectrometry, applied spectrometry and ion mobility spectrometry solutions, analytical and process analysis instruments and solutions based on infrared and Raman molecular spectroscopy technologies, provides systems and assays for molecular diagnostics (MDx), biomedical systems/specialty IVD and microbiology, and radiological/nuclear detectors for Chemical, Biological, Radiological, Nuclear and Explosive (CBRNE) detection. Revenues are generated from academic institutions and medical schools; pharmaceutical, biotechnology and diagnostics companies; contract research organizations; nonprofit and for-profit forensics laboratories; agriculture, food and beverage safety laboratories; environmental and clinical microbiology laboratories; hospitals and government departments and agencies.
Designs, manufactures and distributes advanced X-ray instruments, atomic force microscopy instrumentation, advanced fluorescence optical microscopy instruments, analytical tools for electron microscopes and X-ray metrology, defect-detection equipment for semiconductor process control, handheld, portable and mobile X-ray fluorescence spectrometry instruments, spark optical emission spectroscopy systems, chip cytometry products and services for targeted spatial proteomics, multi-omic services, optofluidic and proteomic barcoding platforms, and products and services for spatial genomics research and spatial biology. Revenues are generated from academic institutions, governmental customers, nanotechnology companies, semiconductor companies, raw material manufacturers, industrial companies, biotechnology and pharmaceutical companies and other businesses involved in materials research and life science research analysis.
•Bruker Energy & Supercon Technologies (BEST):
Develops and manufactures superconducting and non-superconducting materials and devices for use in renewable energy, energy infrastructure, healthcare and high energy physics research. The segment focuses on metallic low temperature superconductors for use in magnetic resonance imaging, nuclear magnetic resonance, fusion energy research and other applications.
The preparation of consolidated financial statements in accordance with generally accepted accounting principles in the United States (U.S. GAAP) requires that the Company make estimates and judgments that may affect the reported amounts of assets, liabilities, revenues, expenses and related disclosure of contingent assets and liabilities. On an on-going basis, the Company evaluates its estimates, judgments, and methodologies. The Company bases its estimates on historical experience and on various other assumptions that are believed to be reasonable, the results of which form the basis for making judgments about the carrying values of assets and liabilities. Actual results may differ from these estimates under different assumptions or conditions. Changes in estimates are reflected in reported results in the period in which they become known.
As of the date of issuance of these consolidated financial statements, the Company is not aware of any specific event or circumstance that would require the Company to update estimates, judgments or revise the carrying value of any assets or liabilities. These estimates may change, as new events occur and additional information is obtained, and are recognized in the consolidated financial statements as soon as they become known. Actual results could differ from those estimates and any such differences may be material to the Company’s consolidated financial statements.
2. Summary of Significant Accounting Policies
Principles of Consolidation
The accompanying consolidated financial statements include the accounts of the Company and all majority and wholly owned subsidiaries. All intercompany accounts and transactions have been eliminated.
Noncontrolling Interests
Noncontrolling interests represents the minority shareholders’ proportionate share of the Company’s majority-owned subsidiaries. The portion of net income or net loss attributable to non-controlling interests is presented as net income attributable to noncontrolling interests in consolidated subsidiaries in the consolidated statements of income and comprehensive income, and the portion of other comprehensive income of these subsidiaries is presented in the consolidated statements of shareholders’ equity.
Redeemable Noncontrolling Interests
The Company has agreements with noncontrolling interest holders that provide the Company with the right to purchase, and the noncontrolling interest holders with the right to sell, their remaining minority interest at a contractually defined redemption value. These rights can be accelerated in certain events. As the redemptions are contingently redeemable at the option of the noncontrolling interest shareholders, the Company classifies the carrying amount of the redeemable noncontrolling interest in the mezzanine section on the consolidated balance sheet, which is presented above the equity section and below liabilities. The redeemable noncontrolling interests are measured at the greater of the amount that would be paid if settlement occurred as of the balance sheet date based on the contractually defined redemption value and its carrying amount adjusted for net income (loss) attributable to the noncontrolling interest. Adjustments to the carrying value of the redeemable noncontrolling interest are recorded through earnings.
Business Combinations
The Company accounts for business combinations under the acquisition method of accounting. Accordingly, the Company measures the fair value of all identifiable assets acquired (including intangible assets), liabilities assumed and any remaining noncontrolling interests and allocates the amounts paid to all items measured at the date of each acquisition. The Company records a provisional determination of the fair value of the identifiable assets acquired and liabilities assumed based on the information available as of the time of the issuance of the financial statements. Therefore, the values recognized are subject to change until the Company finalizes the allocation of consideration transferred during the measurement period, which is no later than one year from the acquisition date. The final determination may result in asset and liability values that are different than the preliminary estimates.
The fair value of identifiable intangible assets acquired is based on valuations that use information and assumptions determined by management and which consider management’s best estimates of inputs and assumptions that a market participant would use. The Company estimates the fair value of identifiable intangible assets using the income approach through a discounted cash flow analysis. The discounted cash flow analysis is based on the forecasts used by the Company to price the acquisition, and the discount rates applied are benchmarked by referencing the implied rate of return of the Company’s pricing model and the weighted average cost of capital, reflecting a market discount rate. Using a residual method, any excess between the consideration paid and the fair value of net assets acquired is recorded as goodwill. The Company believes any positive goodwill represents the future economic benefits of the acquisition that are not individually identifiable, such as synergies between the acquired assets and the Company’s existing businesses.
The amortization period for the intangible assets acquired is calculated based on the estimated recovery of future cash flows.
Cash and Cash Equivalents
Cash and cash equivalents primarily include cash on hand, money market funds and time deposits with original maturities of three months or less at the date of acquisition. Time deposits represent amounts on deposit in banks and temporarily invested in instruments with maturities of three months or less at the time of purchase. Cash equivalents are carried at cost, which approximates fair value.
Short-term investments represent time and call deposits maturing within twelve months and with original maturities of greater than three months at the date of acquisition. Short-term investments are classified as available-for-sale and are reported at fair value.
Restricted cash consists of cash balances that are pledged or committed for specified contractual obligations of the Company and are therefore restricted from withdrawal or usage. The Company has certain subsidiaries that are required by local laws and regulations to maintain restricted cash balances to cover future employee benefit payments. Restricted cash balances are classified as non-current unless, under the terms of the applicable agreements, the funds will be released from restrictions within one year from the balance sheet date. The current and non-current portion of restricted cash is recorded within other current assets and other long-term assets, respectively, in the accompanying consolidated balance sheets. Restricted cash is included as a component of cash, cash equivalents, and restricted cash on the Company’s consolidated statement of cash flows.
Multi-Currency Notional Cash Pooling
In June 2024, the Company entered into a master netting arrangement with a third-party financial institution whereby certain subsidiaries participate in a notional cash pooling arrangement to manage global liquidity requirements. As part of the master netting arrangement, the participating subsidiaries combine their cash balances in pooling accounts at the same financial institution with the ability to offset bank overdrafts of one participant against positive cash account balances held by another participant. Amounts in each of the accounts are unencumbered and unrestricted with respect to use. At December 31, 2024, the net positive cash balance related to this pooling arrangement is included in cash, and cash equivalents in the consolidated balance sheets.
Accounts Receivable, net
Accounts receivable have been reduced by an allowance for credit losses. The allowance for credit losses represents the Company’s best estimate of the amount of probable credit losses in our accounts receivable. The Company’s allowance is based on a number of factors, including an evaluation of customer credit worthiness, the age of the outstanding receivable, economic trends and historical experience. Provisions for credit losses are recorded in selling, general and administrative expenses in the accompanying consolidated statements of income and comprehensive income. The risk with respect to accounts receivables is minimized by the creditworthiness and diversity of the Company’s customers.
Derivative Financial Instruments and Hedging Activities
All derivatives, whether designated in a hedging relationship or not, are recorded on the consolidated balance sheets at fair value. The accounting for changes in fair value of a derivative instrument depends on whether it has been designated and qualifies as part of a hedging relationship and further, on the type of hedging relationship. For those derivative instruments that are designated and qualify as hedging instruments, the Company must designate the hedging instrument, based on the exposure being hedged, as a fair value hedge, cash flow hedge, foreign currency hedge or a hedge of a net investment in a foreign operation. If a derivative is designated as a hedge, depending on the nature of the hedge, changes in the fair value of the derivative are either offset against the change in fair value of the hedged item through earnings or recognized in other comprehensive income until the hedged item is recognized in earnings. Derivatives that are not designated as hedges are recorded at fair value through earnings. The Company presents the cross-currency swap periodic settlements in investing activities and the interest rate swap periodic settlements in operating activities in the consolidated statements of cash flows. The Company records derivative assets and liabilities on a gross basis in the consolidated balance sheets.
Fair Value of Financial Instruments
The Company measures certain assets and liabilities at fair value with changes in fair value recognized in earnings. Fair value treatment may be elected either upon initial recognition of an eligible asset or liability or, for an existing asset or liability, if an event triggers a new basis of accounting. The Company did not elect to remeasure any of its existing financial assets or liabilities and did not elect the fair value option for any financial assets or liabilities which originated during the years ended December 31, 2024 and 2023. The Company applies the following hierarchy to determine the fair value of financial instruments, which prioritizes the inputs used to measure fair value into three levels and bases the categorization within the hierarchy upon the lowest level of input that is available and significant to the fair value measurement. The levels in the hierarchy are defined as follows:
•Level 1: Inputs to the valuation methodology are quoted prices (unadjusted) for identical assets or liabilities in active markets.
•Level 2: Inputs to the valuation methodology include quoted prices for similar assets and liabilities in active markets, and inputs that are observable for the asset or liability, either directly or indirectly, for substantially the full term of the financial instrument.
•Level 3: Inputs to the valuation methodology are unobservable and significant to the fair value measurement.
The fair value hierarchy level is determined by asset and class based on the lowest level of significant input. The observability of inputs may change for certain assets or liabilities. This condition could cause an asset or liability to be reclassified between levels. The Company recognizes transfers between levels within the fair value hierarchy, if any, at the end of each quarter.
Valuation methodologies used for assets and liabilities measured or disclosed at fair value are as follows:
•Time deposits and money market funds - Valued at market prices determined through third-party pricing services and classified as Level 2;
•Interest rate and cross currency swap agreements - Valued using market observable inputs, such as interest rate yield curves and classified as Level 2;
•Contingent consideration - Valued based on a probability weighting of the future cash flows associated with the potential outcomes and certain option pricing models and classified as Level 3. Contingent consideration recorded within other current and other long-term liabilities represents the estimated fair value of future payments to the former shareholders as part of certain acquisitions. The contingent consideration is primarily based on the applicable acquired company achieving annual revenue and gross margin targets in certain years as specified in the relevant purchase and sale agreement. The Company initially values the contingent consideration on the acquisition date by using a Monte Carlo simulation or an income approach method. The Monte Carlo method models future revenue and costs of goods sold projections and discounts the average results to present value. The income approach method involves calculating the earnout payment based on the forecasted cash flows, adjusting the future earnout payment for the risk of reaching the projected financials, and then discounting the future payments to present value by the counterparty risk. The counterparty risk considers the risk of the buyer having the cash to make the earnout payments and is commensurate with a cost of debt over an appropriate term. Changes in fair value subsequent to acquisition are recognized in “Acquisition-related expenses, net” included in Other charges, net, in the Consolidated Statements of Income;
•Hybrid instruments liabilities – As part of certain majority owned acquisitions, the Company entered into agreements with the noncontrolling interest holders that provide the Company with the right to purchase, and the noncontrolling interest holders with the right to sell, the remaining ownerships for cash at contractually defined redemption values. These rights (embedded derivatives) can be accelerated, at discounted redemption values, upon certain events related to post combination employment services. As the options are tied to continued employment, the Company classified the hybrid instruments (noncontrolling interests with an embedded derivatives) as liabilities on the consolidated balance sheet. Subsequent to the acquisition dates, the carrying value of each hybrid instrument is remeasured to fair value with changes recorded to acquisition expense in proportion to the respective requisite service period. They are valued using discounted cash flows discounted at risk-adjusted discount rates, utilizing various unobservable inputs and are classified as Level 3;
•Equity interest purchase option liability – Valued using a discounted cash flow approach which compares the difference between the credit-adjusted excess present value of the option price in relation to the share ratio of the adjusted equity value at each exercise date, utilizing various unobservable inputs, and are classified as Level 3.
•Long-term fixed interest rate debt – Valued based on market and observable sources with similar maturity dates and classified as Level 2 within the fair value hierarchy. The remaining long-term debt has variable interest rates and the carrying value approximates fair value accordingly.
Concentration of Credit Risk
Financial instruments that subject the Company to credit risk consist of cash, cash equivalents, derivative instruments, accounts receivables and restricted cash. The risk with respect to cash, cash equivalents and restricted cash is generally minimized by the Company’s policy of investing in short-term financial instruments issued by highly rated financial institutions. The risk with respect to derivative instruments is minimized by the Company’s policy of entering into arrangements with highly rated financial institutions. The Company performs periodic credit evaluations of its customers’ financial condition and generally requires an advanced deposit for a portion of the purchase price. As of December 31, 2024 and 2023, no single customer represented 10% or more of the Company’s total revenue or 10% or more of the Company’s accounts receivable.
Inventories
Components of inventory include raw materials, work-in-process, demonstration units and finished goods. Demonstration units include systems which are located in the Company’s demonstration laboratories or installed at the sites of potential customers and are considered available for sale. Finished goods include in-transit systems that have been shipped to the Company’s customers, but not yet installed and accepted by the customer. All inventories are stated at the lower of cost and net realizable value. Cost is determined principally by the first-in, first-out method for a majority of subsidiaries and by average-cost for certain other subsidiaries. The Company reduces the carrying value of its inventories for differences between cost and estimated net realizable value, taking into
consideration usage in the preceding twelve months, expected demand, technological obsolescence and other information including the physical condition of demonstration inventories. Costs associated with the procurement of inventories, such as inbound freight charges and purchasing and receiving costs, are capitalized as part of inventory and are also included in the cost of product revenue line item within the consolidated statements of income and comprehensive income. Inventory costs are reported in cost of revenue in the statement of income in the period the products are sold to an external party.
Property, Plant and Equipment
Property, plant and equipment are stated at cost less accumulated depreciation and amortization. Major improvements that extend the useful lives are capitalized while expenditures for maintenance, repairs and minor improvements are charged to expense as incurred. When assets are retired or otherwise disposed of, the assets and related accumulated depreciation and amortization are eliminated from the accounts and any resulting gain or loss is reflected in the consolidated statements of income and comprehensive income. Depreciation and amortization are calculated on a straight-line basis over the estimated useful lives of the assets as follows:
| | |
| | Estimated Useful Life |
Buildings | | 25 to 40 years |
Machinery and equipment | | 3 to 10 years |
Computer and fixtures | | 3 to 5 years |
Furniture and fixtures | | 3 to 10 years |
Leasehold improvements | | Lesser of 15 years or the remaining lease term |
Goodwill and Intangible Assets
Goodwill and indefinite-lived intangible assets are not amortized, but are evaluated for impairment on an annual basis, or on an interim basis when events or changes in circumstances indicate that the carrying value may not be recoverable.
The Company tests goodwill for impairment annually as of October 1 or more frequently if impairment indicators arise at the reporting unit level, which is the operating segment or one level below an operating segment. The Company has the option of performing a qualitative assessment to determine whether further impairment testing is necessary before performing the quantitative assessment. If as a result of the qualitative assessment, it is more-likely-than-not that the fair value of a reporting unit is less than its carrying amount, a quantitative impairment test will be required. Otherwise, no further testing will be required. If a quantitative impairment test is performed, the Company compares the fair values of the applicable reporting units with their aggregate carrying values, including goodwill. The Company determines the fair value of reporting units using a weighting of both the market and the income methodologies and has classified it as Level 3 in the fair value hierarchy. Estimating the fair value of the reporting units requires significant judgment by management. If the carrying amount of a reporting unit exceeds the fair value of the reporting unit, an impairment charge is recognized for the amount by which the carrying value amount exceeds the reporting unit’s fair value up to the total amount of goodwill allocated to the reporting unit. No impairment of goodwill or indefinite-lived assets was recognized during the years ended December 31, 2024, 2023, or 2022.
Intangible assets with a finite useful life are amortized on a straight-line basis over their estimated useful lives as follows:
| | |
| | Estimated Useful Life |
Existing technology and related patents | | 1 to 15 years |
Customer relationships | | 5 to 15 years |
Trade names | | 1 to 15 years |
Impairment of Long-Lived Assets
On a quarterly basis, the Company reviews long-lived assets, including intangible assets with finite useful lives, to determine if there have been any triggering events that could indicate an impairment. Impairment losses are recorded on long-lived assets used in operations when indicators of impairment are present and the quoted market price, if available or the estimated fair value of those assets are less than the assets’ carrying value and are not recoverable. Determination of recoverability is based on an estimate of undiscounted future cash flows resulting from the use of the asset and its eventual disposition. Impairment losses are charged to the consolidated statements of income for the difference between the fair value and carrying value of the asset.
Based on the results of these analyses, the Company determined there were no material impairments to its long-lived assets, including intangible assets. Refer to Note 12, Restructuring and asset impairment for discussion related to the impairment of other long-lived assets in connection with the BCA restructuring plan.
Warranty Costs and Deferred Revenue
The Company typically provides a one-year parts and labor warranty with the purchase of equipment. The anticipated cost for this warranty is accrued upon recognition of the sale and is included as a current liability on the accompanying consolidated balance sheets. The Company’s warranty reserve reflects estimated material and labor costs for potential product issues for which the Company expects to incur an obligation. The Company’s estimates of anticipated rates of warranty claims and costs are primarily based on historical information. The Company assesses the adequacy of the warranty reserve on a quarterly basis and adjusts the amount as necessary. If the historical data used to calculate the adequacy of the warranty reserve is not indicative of future requirements, additional or reduced warranty reserves may be required.
The Company also offers to its customers extended warranty and service agreements extending beyond the initial warranty for a fee. These fees are recorded as deferred revenue and recognized ratably into income over the life of the extended warranty contract or service agreement.
Income Taxes
The provision for income taxes includes federal, state, local and foreign taxes. Income taxes are accounted for under the asset and liability method. Deferred tax assets and liabilities are recognized for the estimated future tax consequences of temporary differences between the financial statement carrying amounts and their respective tax bases. Deferred tax assets and liabilities are measured using enacted tax rates expected to apply to taxable income in the year in which the temporary differences are expected to be recovered or settled. The Company evaluates the realizability of its deferred tax assets and establishes a valuation allowance when it is more likely than not that all or a portion of deferred tax assets will not be realized.
The ultimate realization of deferred tax assets is dependent upon the generation of future taxable income during the periods in which those temporary differences become deductible. Based upon the level of historical taxable income and income tax liability and projections for future taxable income over the periods in which the deferred tax assets are utilizable, we believe it is more likely than not that we will realize the net benefits of the deferred tax assets of our wholly owned subsidiaries, net of the recorded valuation allowance. In the event that actual results differ from our estimates, or we adjust our estimates in future periods, we may need to adjust or establish a valuation allowance, which could materially impact our consolidated financial position and results of operations.
The Company records liabilities related to uncertain tax positions in accordance with the guidance that clarifies the accounting for uncertainty in income taxes recognized in a Company’s financial statements. This guidance prescribes a minimum recognition threshold and measurement attribute for the financial statement recognition and measurement of a tax position taken or expected to be taken in a tax return. The Company includes accrued interest and penalties related to unrecognized tax benefits and income tax liabilities, when applicable, in income tax provision.
Customer Advances
The Company commonly requires an advance deposit under the terms and conditions of contracts with customers. These deposits are recorded as a current or long-term liability until revenue is recognized on the specific contract.
Revenue Recognition
The Company recognizes revenue in accordance with Accounting Standards Codification (“ASC”) 606, Revenue from Contracts with Customers. The key elements of ASC 606 are: 1) identifying a contract with the customer; 2) identifying the performance obligations in the contract; 3) determining the transaction price; 4) allocating the transaction price to the performance obligations in the contract; and 5) recognizing revenue when (or as) each performance obligation is satisfied.
A performance obligation is a promise in a contract to transfer a distinct good or service to the customer. A contract’s transaction price is allocated to each distinct performance obligation and recognized as revenue when, or as, the performance obligation is satisfied. Some of the Company’s contracts have multiple performance obligations, most commonly due to providing additional goods or services along with a system, such as installation, accessories, parts and services. For contracts with multiple performance obligations, the Company allocates the contract’s transaction price to each performance obligation using the best estimate of the standalone selling price of each distinct good or service being provided to the customer. The Company’s best evidence of standalone selling price is its normal selling pricing and discounting practices for the specific product or service when sold on a
standalone basis. Alternatively, when not sold separately, the Company may determine standalone selling price using an expected cost plus a margin approach.
The Company’s performance obligations are typically satisfied at a point in time, most commonly either on shipment, or customer acceptance. Certain performance obligations, such as maintenance contracts and extended warranty, are recognized over time based on the contractual obligation period. In addition, certain arrangements to provide more customized deliverables may be satisfied over time based on the extent of progress towards completion. For performance obligations recognized over time, revenue is measured by progress toward completion of the performance obligation that reflects the transfer of control. Typically, progress is measured using a cost-to-cost method based on cost incurred to date relative to total estimated costs upon completion as this best depicts the transfer of control to the customer. Application of the cost-to-cost method requires the Company to make reasonable estimates of the extent of progress toward completion and the total costs the Company expects to incur. Losses are recorded immediately when the Company estimates that contracts will ultimately result in a loss. Changes in the estimates could affect the timing of revenue recognition.
The Company recognizes revenue from systems sales upon transfer of control in an amount that reflects the consideration it expects to receive. Transfer of control generally occurs upon shipment, or for certain systems, based upon customer acceptance for a system once delivered and installed at a customer facility. For systems that include customer-specific acceptance criteria, the Company is required to assess when it can demonstrate the acceptance criteria has been met, which generally is upon successful factory acceptance testing or customer acceptance and evidence of installation. For systems that require installation and where system revenue is recognized upon shipment, the standalone selling price of installation is deferred until customer acceptance. Revenue from accessories and parts is generally recognized based on shipment. Service revenue is recognized as the services are performed or ratably over the contractual obligation and includes maintenance contracts, extended warranties, training, application support and on-demand services.
Revenues from instrument rental and reagent agreements provide customers with the right to use the Company’s instruments upon entering into multi-year agreements to purchase annual minimum amounts of reagents. These types of agreements include an embedded lease relating to the customer’s right to use the Company’s instruments over the period of the agreement. The agreement transaction price is allocated between the instrument and the reagents based on their relative standalone selling prices. When collectability of payments due is probable, reagent rental programs that effectively transfer control of instruments to customers are classified as sales-type leases and instrument revenue and cost of revenue are recognized upon the transfer of control to the customer which is often in advance of billings to the customer. The Company’s right to future consideration from reagent purchases under the agreement is allocated to instrument revenue and is recorded as a lease receivable within other current and long-term assets. Agreements that do not meet the criteria to be classified as a sales-type lease are classified as operating leases. Lease revenue is presented in product revenue in the consolidated statements of income and consisted of less than 1% of total product revenue in each of the years ended December 31, 2024, 2023 and 2022 respectively.
When products are sold through an independent distributor or a strategic distribution partner, the Company recognizes the system sale upon transfer of control which is typically on shipment. When the Company is responsible for installation, the standalone selling price of installation is deferred until customer acceptance. The Company’s distributors do not have price protection rights or rights of return; however, the Company’s products are typically warranted to be free from defect for a period of one year.
The Company includes costs incurred in connection with shipping and handling of products within selling, general and administrative costs in the consolidated statements of income. Amounts billed to customers in connection with these costs are included in total revenues. When control of the goods transfers prior to the completion of the Company’s obligation to ship the products to its customers, the Company has elected the practical expedient to account for the shipping services as a fulfillment cost. The Company expenses incremental costs of obtaining a contract as and when incurred if the expected amortization period is one year or less or the amount is immaterial. The Company excludes from the transaction price all taxes assessed by a governmental authority on revenue-producing transactions that are collected by the Company from a customer.
The Company requires an advance deposit based on the terms and conditions of contracts with customers for many of its contracts. Typically, revenue is recognized within one year of receiving an advance deposit. Excluding reagent agreements, the Company does not have any material payment terms that extend beyond one year and there is minimal variable consideration included in the transaction price of the Company’s contracts.
Other revenues are primarily comprised of development arrangements recognized on a cost-plus-fixed-fee basis and licensing arrangements recognized either when the licenses are provided or ratably over the contract term depending on the nature of the arrangement.
Contract Assets and Liabilities
Contract assets represent unbilled receivables when revenue recognized exceeds the amount billed to the customer, and the right to payment is not just subject to the passage of time. Contract assets typically result from system revenue recorded where a portion of
the transaction price is not billable until a future event, such as customer acceptance, or from contracts recognized on a cost-to-cost or cost-plus-fixed-fee basis as revenue exceeds the amount billed to the customer. Amounts may not exceed their net realizable value. Contract assets are generally classified as current.
Contract liabilities consist of customer advances, deferred revenue and billings in excess of revenue from contracts recognized on a cost-to-cost or cost-plus-fixed-fee basis. Contract liabilities are classified as current or long-term based on the timing of when the Company expects to recognize revenue. Contract assets and liabilities are reported in a net position on a contract-by-contract basis at the end of each reporting period.
Leases
At the inception of an arrangement, the Company determines whether the arrangement is or contains a lease based on the unique facts and circumstances present. Leases with a term greater than 12 months are recognized on the balance sheet as Right-of-use (“ROU”) assets with a corresponding lease liability. The Company has elected not to recognize on the consolidated balance sheets leases with an initial term of 12 months or less. Leases with an initial term of 12 months or less are directly expensed as incurred. Leases are classified as either operating or finance depending on the specific terms of the arrangement.
The Company’s leases mainly consist of facilities, office equipment, and vehicles. The majority of leases are classified as operating. The remaining lease term ranges from 2025 to 2043, with some leases including an option to extend the lease for varying periods of time or to terminate prior to the end of the lease term. Certain lease agreements contain provisions for future rent increases. Lease payments included in the measurement of the lease liability comprise fixed payments, future rent increases tied to an index or rate, and the exercise price of a Company option to purchase the underlying asset if the Company is reasonably certain to exercise the option. Future rent increases dependent on an index or rate are initially measured at the index or rate at the commencement date. The Company’s leases typically do not contain residual value guarantees.
At the commencement date, operating and finance lease liabilities, and their corresponding ROU assets, are recorded based on the present value of lease payments over the expected lease term. The lease term includes the non-cancelable period of the lease, plus any additional periods covered by either a Company option to extend (or not to terminate) the lease that the Company is reasonably certain to exercise, or an option to extend (or not to terminate) the lease controlled by the lessor. The interest rate implicit in lease contracts is typically not readily determinable, therefore an incremental borrowing rate is used to calculate the lease liability. The incremental borrowing rate is the rate incurred to borrow on a collateralized basis over a similar term an amount equal to the lease payments in a similar economic environment. Certain adjustments to the ROU asset may be required for items such as prepayments, lease incentives received, or initial direct costs paid.
The Company conducts research primarily to enhance system performance and improve the reliability of existing products, and to develop revolutionary new products and solutions. Research and development costs are expensed as incurred and include salaries, wages and other personnel related costs, material costs and depreciation, consulting costs and facility costs.
Purchased software licenses are capitalized at cost and are amortized over the estimated useful life, which is generally three years. Software developed for use in the Company’s products is expensed as incurred to research and development expense until technological feasibility is achieved. Subsequent to the achievement of technological feasibility, amounts are capitalizable; however, to date such amounts have not been material.
The Company expenses advertising costs as incurred. Advertising expenses were $27.8 million, $23.7 million and $19.3 million during the years ended December 31, 2024, 2023 and 2022, respectively.
Stock-Based Compensation
The Company recognizes stock-based compensation expense in the consolidated statements of income and comprehensive income based on the fair value of the share-based award at the grant date. The Company’s primary types of share-based compensation are stock options, restricted stock awards and restricted stock units.
Compensation expense is amortized on a straight-line basis over the underlying vesting terms of the share-based award. Stock options to purchase the Company’s common stock and restricted stock units are periodically awarded to executive officers and other
employees of the Company subject to a vesting period of three to four years. The fair value of each option award is estimated on the date of grant using the Black-Scholes option-pricing model.
The determination of the fair value of stock-based payment awards using the Black-Scholes model is affected by our stock price and a number of assumptions, including expected volatility, expected life, risk-free interest rates and expected dividends. Risk-free interest rates are based on the yield on zero-coupon U.S. Treasury securities for a period that is commensurate with the expected life assumption. Expected life is determined through a calculation based on historical experience. Expected volatility is based the Company’s historical volatility results. Expected dividend yield is based on the estimated annualized dividend yield on our stock based on our history of paying dividends. The Company utilizes an estimated forfeiture rate derived from an analysis of historical forfeiture data.
Assumptions regarding volatility, expected term, dividend yield and risk-free interest rates are required for the Black-Scholes model and are presented in the table below:
| | | | | | | | | | | | |
| | 2024 | | | 2023 | | | 2022 | |
Risk-free interest rates | | | 3.82 | % | | | 4.28 | % | | | 3.03 | % |
Expected life | | 4.5 years | | | 4.5 years | | | 4.4 years | |
Volatility | | | 38 | % | | | 37 | % | | | 36 | % |
Expected dividend yield | | | 0.32 | % | | | 0.30 | % | | | 0.32 | % |
Weighted-average fair value per share | | $ | 21.31 | | | $ | 23.02 | | | $ | 19.68 | |
Stock-based compensation for restricted stock awards and restricted stock units is expensed ratably over the vesting period based on the grant date fair value.
Net income per common share attributable to Bruker Corporation shareholders is calculated by dividing net income attributable to Bruker Corporation, adjusted to reflect changes in the redemption value of the redeemable noncontrolling interest, by the weighted-average shares outstanding during the period. The diluted net income per share computation includes the effect of shares which would be issuable upon the exercise of outstanding stock options and the vesting of restricted stock, reduced by the number of shares which are assumed to be purchased by the Company under the treasury stock method on a weighted average basis. There was no redemption value adjustment of the redeemable noncontrolling interest for the years ended December 31, 2024, 2023 and 2022.
Post Retirement Benefit Plans
The Company measures its benefit obligation and the fair value of plan assets as of December 31st each year. The Company recognizes the over-funded or under-funded status of defined benefit pension and other post-retirement defined benefit plans as an asset or liability, respectively, in its consolidated balance sheets and recognizes changes in the funded status in the year in which the changes occur through other comprehensive income. The Company records pension service cost within cost of sales, selling, general and administrative, and research and development expenses according to the designated department of the pension eligible employees, while non-service related pension costs are recorded within interest and other income (expense), net in the consolidated statements of income. For the defined benefit pension plans, the Company uses a corridor approach to amortize actuarial gains and losses. Under this approach, net actuarial gains or losses in excess of ten percent of the larger of the projected benefit obligation or the fair value of plan assets are amortized over the average remaining service of active participants who are expected to receive benefits under the plans.
Assets and liabilities of the Company’s foreign subsidiaries, where the functional currency is not the U.S. dollar, are translated into U.S. Dollars using the current exchange rate as of the consolidated balance sheet date and shareholders’ equity is translated using historical rates. Revenues and expenses of foreign subsidiaries are translated at the average exchange rates in effect during the year. Adjustments resulting from financial statement translations are included as a separate component of shareholders’ equity. Gains and losses resulting from translation of foreign currency monetary transactions are reported in interest and other income (expense), net in the consolidated statements of income and comprehensive income for all periods presented. The Company has certain intercompany foreign currency transactions that are deemed to be of a long-term investment nature. Exchange adjustments related to those transactions are made directly to a separate component of shareholders’ equity.
Equity-method investments
The Company accounts for investments in common stock under the equity method if the Company has the ability to exercise significant influence, but not control, over an investee. Investments in equity-method investees are included within “Other long-term assets” in the consolidated balance sheets. The Company’s proportional share of the earnings or losses as reported by equity-method investees are classified as “Equity in income of unconsolidated investees, net of tax” in the consolidated statements of income and comprehensive income. The Company records investments, including incremental investments, of common shares in equity-method investees at cost. In the event the Company no longer has the ability to exercise significant influence over an equity-method investee, the Company would discontinue accounting for the investment under the equity method. The Company regularly evaluates these investments, which are not carried at fair value, for other-than-temporary impairment and records any impairment charge in earnings when the decline in value below the carrying amount of its equity method investment is determined to be other-than-temporary.
Minority investments
When the Company does not have control or the ability to exercise significant influence over an investee, it accounts for its minority investments in equity interests without a readily determinable fair value using the measurement alternative. The equity interest is initially recorded at cost, less impairment. The carrying amount is subsequently remeasured to its fair value when observable price changes occur or it is impaired. Any adjustments to the carrying amount are recorded in earnings.
Any impairment charges related to minority investments are included in “Interest and other income (expense), net” in the Consolidated Statements of Income and Comprehensive Income.
Risks and Uncertainties
The Company is subject to risks common to its industry including, but not limited to, global economic conditions, such as increasing inflation, uncertainties caused by banking industry volatility, rapid technological change, government and academic funding levels, geopolitical uncertainties, changes in commodity prices, spending patterns of its customers, protection of its intellectual property, availability of key raw materials and components and other supply chain challenges, compliance with existing and future regulation by government agencies and fluctuations in foreign currency exchange rates and interest rates. Historically, the Company has higher levels of revenue in the fourth quarter and lower levels of revenues in the first quarter of the year, which the Company believes is influenced by its customers’ budgeting cycles.
The Company has experienced supply chain interruptions as a result of general global economic conditions, including economic instability, a tight labor market and other factors including natural events and disasters. Various factors, including increased demand for certain components and production delays, are contributing to shortages of certain components used in the Company’s products and increased difficulties in the Company’s ability to obtain a consistent supply of materials at stable pricing levels. Supply shortages and longer lead teams for components used in the Company's products, including limited source components, has resulted and may continue to cause disruptions to the Company’s production activities, which has had and may continue to have an adverse effect on the Company’s financial condition or result of operations. These factors have impacted and may continue to impact the timing of the Company’s revenue, and have also resulted, and may result in a delay of revenue, and an increase in manufacturing costs, all of which have adversely impacted and may continue to adversely impact the Company's operating results.
Additionally, world events, such as the conflict between Russia and Ukraine and related economic sanctions, the conflict in the Middle East and surrounding areas, the possible expansion of such conflicts and potential geopolitical consequences, the ongoing tensions between the United States and China, tariff and trade policy changes, and increasing potential of conflict involving countries in Asia that are significant to the Company’s supply chain operations, such as Taiwan and China, have resulted in increasing global tensions and create uncertainty for global commerce. As a result of the adverse economic impacts resulting from the conflict between Russia and Ukraine, such as increased prices for and a reduced supply of key metals used in our products, the Company has ceased its Russian operations. Sustained or worsening global economic conditions and increasing inflation and geopolitical tensions have increased the Company's cost of doing business, impacted the Company's supply chain operations, caused some of the Company's customers to reduce or delay spending and further intensified pricing pressures. Combined with increased inflation, potential energy shortages in Europe where the Company has significant operations, and overall higher energy and transportation costs, these factors have affected and may continue to affect the Company's financial condition and results of operations.
The preparation of the consolidated financial statements requires the Company to make estimates, judgments and assumptions that may affect the reported amounts of assets, liabilities, equity, revenues and expenses and related disclosure of contingent assets and liabilities. On an ongoing basis the Company evaluates estimates, judgments and methodologies.
3. Recent Accounting Pronouncements
In November 2024, the Financial Accounting Standards Board (“FASB”) issued ASU No. 2024-04 – Debt – Debt with Conversion and Other Options (Subtopic 470-20): Induced Conversions of Convertible Debt Instruments. This new guidance clarifies the accounting treatment of whether the settlement of convertible debt should be accounted for as an induced conversion or extinguishment of convertible debt. This guidance is effective for annual reporting periods beginning after December 15, 2025. The Company is evaluating the potential impact this adoption on the consolidated financial statements and related disclosures.
In November 2024, the FASB issued ASU No. 2024-03 – Income Statement - Reporting Comprehensive Income – Expense Disaggregation Disclosures (Subtopic 220-40): Disaggregation of Income Statement Expenses. This new guidance requires additional disclosure of the nature of expenses in the income statement. The new standard requires disclosures about specific types of expenses included in the expense captions presented on the face of the income statement, as well as disclosures about selling expenses. This guidance is effective for annual reporting periods beginning after December 15, 2026 and interim reporting periods beginning after December 15, 2027. The Company is evaluating the potential impact of this adoption on the consolidated financial statements and related disclosures.
In December 2023, the FASB issued ASU No. 2023-09 – Income Taxes (Topic 740): Improvements to Income Tax Disclosures, which requires enhanced income tax disclosures, including disaggregation of information in the rate reconciliation table and disaggregation of information related to income taxes paid as presented on the Cash Flow Statement. This new guidance is effective for annual reporting periods beginning after December 15, 2024. The Company is evaluating the impact of this adoption on the consolidated financial statements and related disclosures.
In November 2023, the FASB issued ASU No. 2023-07, Segment Reporting (Topic 280): Improvements to Reportable Segments Disclosures (“ASU 2023-07”). The ASU expands public entities’ segment disclosures by requiring disclosure of significant segment expenses that are regularly provided to the chief operating decision maker. These significant segment expenses are included within each reported measure of segment profit or loss, an amount and description of its composition for other segment items, and interim disclosures of a reportable segment’s profit or loss and assets. This guidance is effective for annual reporting periods beginning after December 15, 2023, and interim periods after December 15, 2024. The Company adopted ASU 2023-07 and applied the guidance retrospectively to all periods presented in the consolidated financial statements.
4. Acquisitions
During the years ended December 31, 2024 and 2023, the Company completed various acquisitions that collectively complemented its existing product offerings of the Company’s existing businesses.
The valuation methodology used to determine the fair value of the identifiable assets acquired and liabilities assumed, unless otherwise noted, is consistent with that described in Note 2, Summary of Significant Accounting Policies.
2024 acquisitions:
The following table reflects the consideration transferred and the allocation to the identifiable assets acquired and liabilities assumed for the 2024 acquisitions (in millions):
| | | | | | | | | | | | | | | | |
| | NanoString Technologies | | ELITechGroup | | Chemspeed Technologies AG | | Other | | Total | |
Consideration Transferred: | | | | | | | | | | | |
Cash paid | | $ | 392.6 | | $ | 951.9 | | $ | 175.4 | | $ | 128.9 | | $ | 1,648.8 | |
Cash acquired | | | (0.5 | ) | | (43.4 | ) | | (0.6 | ) | | (8.1 | ) | | (52.6 | ) |
Fair value of contingent consideration | | | — | | | — | | | — | | | 13.4 | | | 13.4 | |
Working capital and other closing adjustments | | | — | | | 22.7 | | | — | | | 3.5 | | | 26.2 | |
Total consideration transferred, net of cash acquired | | $ | 392.1 | | $ | 931.2 | | $ | 174.8 | | $ | 137.7 | | $ | 1,635.8 | |
Allocation of Consideration Transferred: | | | | | | | | | | | |
Accounts receivable | | $ | 16.8 | | $ | 30.6 | | $ | 7.0 | | $ | 3.9 | | $ | 58.3 | |
Inventories | | | 38.5 | | | 31.6 | | | 46.6 | | | 31.2 | | | 147.9 | |
Other current assets | | | 8.9 | | | 15.7 | | | 1.4 | | | 3.1 | | | 29.1 | |
Property, plant and equipment | | | 31.0 | | | 36.2 | | | 1.8 | | | 1.4 | | | 70.4 | |
Other assets | | | 23.1 | | | 41.3 | | | 17.3 | | | 9.7 | | | 91.4 | |
Intangible assets: | | | | | | | | | | | |
Technology | | | 53.0 | | | 193.3 | | | 27.9 | | | 42.6 | | | 316.8 | |
Customer relationships | | | 39.0 | | | 236.3 | | | 51.5 | | | 8.5 | | | 335.3 | |
Backlog | | | — | | | 0.5 | | | 9.4 | | | 4.9 | | | 14.8 | |
Trade name | | | 14.0 | | | 12.3 | | | 4.8 | | | 3.1 | | | 34.2 | |
Goodwill | | | 253.8 | | | 501.1 | | | 127.8 | | | 75.6 | | | 958.3 | |
Deferred taxes (net) | | | 4.8 | | | (100.8 | ) | | (14.0 | ) | | (3.2 | ) | | (113.2 | ) |
Liabilities assumed | | | (90.8 | ) | | (66.9 | ) | | (106.7 | ) | | (43.1 | ) | | (307.5 | ) |
Total consideration allocated | | $ | 392.1 | | $ | 931.2 | | $ | 174.8 | | $ | 137.7 | | $ | 1,635.8 | |
Acquisitions material to the Company’s financial statements
The table below summarizes information on acquisitions material to the Company’s financial statements in 2024:
| | | |
| NanoString Technologies | ELITechGroup | Chemspeed Technologies AG |
Acquisition date | May 6, 2024 | April 30, 2024 | March 6, 2024 |
Bruker segment | BSI NANO | BSI CALID | BSI BBIO |
Activity of acquired business | End-to-end research solutions in the spatial biology field and provides life-science research solutions for spatial transcriptomics and gene expression analysis which have been critical in enabling scientists and medical researchers to advance vital discovery, translational, and pre-clinical disease research. The acquisition complements the Company's spatial proteomics platform and contribute to further its leadership in the post-genomic era. | Molecular diagnostics, microbiology and biomedical testing equipment. The acquisition expands the segment’s portfolio with the addition of pioneering innovation in molecular diagnostics which combined with the Segment's existing offerings establish Bruker as an innovative and growing infectious disease specialist in the in-vitro diagnostics market. | Automated laboratory research and development and quality control workflow solutions in a wide range of chemical research fields. The acquisition expands the segment’s portfolio in vendor-agnostic scientific software, R&D, and laboratory automation. |
Location | Washington, U.S.A. | Various - Primarily Torino, Italy and Washington and Utah, U.S.A. | Füllinsdorf, Switzerland |
Acquired interest | 100% | 100% | 100% |
Business/technology acquired | Substantially all of the assets and rights associated with the business of NanoString Technologies including the equity interests of the six subsidiaries (collectively, “NanoString”). The Company also assumed certain of its liabilities, including potential liabilities associated with ongoing litigations. Included in the liabilities assumed as of the acquisition date is $44.7M determined in accordance with ASC Topic 450. Refer to Note 26, Commitments and Contingencies for more details on these litigations. | Outstanding share capital of TecInvest S.à r.l, Eliman 1 S.à r.l,, and Eliman 2 S.à r.l, and their 100% interests in 18 subsidiaries (collectively “ELITech” or “ELITech Group”). | Outstanding share capital of Chemspeed Technologies AG and its three wholly owned subsidiaries (collectively “Chemspeed”). |
In the acquisitions above, customer relationships and technology intangible assets were the most significant identifiable assets acquired. The fair value of the intangible assets is estimated using a multi-period excess earnings method for customer relationships and a relief from royalty method for technology. For the acquisition of ELITechGroup, the cash flow projections for the customer relationships included significant judgments and assumptions related to customer attrition rates, contributory asset charges, and discount rates and the cash flow projections for the technology included significant judgments and assumptions related to revenue growth rates, royalty rates, obsolescence rates and discount rates.
The following table presents estimated useful life for the acquired intangible assets as determined by the Company:
| | | | | | |
| | NanoString Technologies | | ELITechGroup | | Chemspeed Technologies AG (a) |
Intangible Asset — Technology | | 12 years | | 4 to 14 years | | 7 years |
Intangible Asset — Tradenames | | 12 years | | 6 years | | 10 years |
Intangible Asset — Customer relationships | | 15 years | | 5 to 15 years | | 15 years |
(a)The Company expects to amortize backlog through the first quarter of 2026.
The Company believes goodwill to represent future economic benefits of the acquisitions that are not individually identifiable, primarily expected synergies from combining the businesses such as the elimination of surplus facilities and headcount, and the utilization of the Company’s existing commercial infrastructure to expand sales of the acquired businesses’ products and services. The Company does not expect the amounts allocated to goodwill for ELITechGroup or Chemspeed to be deductible for tax purposes. The Company expects the amounts allocated to goodwill for NanoString to be deductible for tax purposes
In the acquisitions above, the Company recorded the provisional determination of the fair value of the identifiable assets acquired and liabilities assumed based on the information available as of the time of the acquisitions. For ELITechGroup, as a result of the finalization of the contractual net working capital adjustment, the Company recorded an immaterial measurement period adjustment to the carrying amount of goodwill. For Chemspeed, the Company recorded certain immaterial measurement period adjustments relating the provisional amounts recorded for accounts receivable, inventory, deferred revenue, intangible assets and goodwill relating to updates to the Company’s valuation and other assumptions. For NanoString, the Company recorded certain measurement period adjustments relating to the provisional amounts recorded for intangible assets and goodwill relating to updates to the Company’s valuation and other assumptions. The related impact to the consolidated statements of income that would have been
recognized in previous periods if the adjustments were recognized as of the acquisition date was a reduction of $2.8 million in amortization expense recorded during the fourth quarter of 2024.
The Company is in the process of finalizing its valuation of the assets acquired and liabilities assumed related to these acquisitions. The final fair value of the net assets acquired may result in adjustments to these assets and liabilities, including goodwill.
Other 2024 Acquisitions
During the year ended December 31, 2024, the Company acquired other businesses which were accounted for under the acquisition method that complemented the Company’s existing product offerings.
The following table reflects the consideration transferred and the respective reportable segment for the acquisitions (in millions):
| | | | | | | | | | | | | |
Name of Acquisition | | Date Acquired | | Segment | | Total
Consideration, net of Cash Acquired | | | Cash
Consideration | | |
Nion, LLC | | January 2, 2024 | | BSI NANO | | $ | 42.9 | | | $ | 37.4 | | |
Spectral Instruments Imaging LLC | | February 1, 2024 | | BSI BBIO | | | 28.8 | | | | 29.0 | | |
Other (In aggregate) | | Various | | Various | | | 66.0 | | | | 62.5 | | |
| | | | | | $ | 137.7 | | | $ | 128.9 | | |
For the period from the date of acquisition through December 31, 2024, the revenues and results of operations included in the consolidated financial statements of the Company from the other acquisitions listed in table above were not material, therefore, additional pro forma information combining the results of operations of the Company and these acquisitions have not been included.
The table below summarizes information on certain of the Company’s other acquisitions in 2024:
| | |
| Spectral Instruments Imaging LLC | Nion, LLC |
Activity of acquired business | Manufacturer of preclinical optical systems for bioluminescent, fluorescent and x-ray imaging to fit the workflows of animal scientists. | Designer and manufacturer of high-end electron-optical instruments with diverse application to the needs of its customers. |
Location | Arizona, U.S.A. | Washington, U.S.A. |
Acquired interest | 100% | 100% |
Business/technology acquired | Outstanding share capital of Spectral Instruments Imaging, LLC (“Spectral”). | Outstanding share capital of Nion, LLC (“Nion”). |
Contingent consideration | Cash consideration is subject to adjustments of up to $10.0 million if certain revenue and EBITDA targets are met through 2025. | Cash consideration is subject to adjustments of up to $23.0 million if certain revenue and non-revenue milestones are achieved through 2026. |
The following table presents estimated useful life for the acquired intangible assets for the material other acquisitions in 2024 as determined by the Company:
| | | | |
| | Spectral Instruments Imaging LLC | | Nion, LLC (a) |
Intangible Asset — Technology | | 6 years | | 7 years |
Intangible Asset — Tradenames | | not applicable | | 7 years |
Intangible Asset — Customer relationships | | 14 years | | 15 years |
(a) The Company expects to amortize backlog through the fourth quarter of 2027.
The amortization period for the intangible assets acquired for the Company’s other acquisitions is seven to eleven years for the technology, eleven to fifteen for customer relationships and twelve years for tradenames. The fair values of the trade name and technology of certain acquisitions were not material and were expensed in full during 2024.
The Company believes goodwill to represent future economic benefits of the acquisitions that are not individually identifiable, primarily expected synergies from combining the businesses such as the elimination of surplus facilities and headcount, and the utilization of the Company’s existing commercial infrastructure to expand sales of the acquired businesses’ products and services. The Company does not expect the amounts allocated to goodwill to be deductible for tax purposes.
In the acquisitions above, the Company recorded the provisional determination of the fair value of the identifiable assets acquired and liabilities assumed based on the information available as of the time of the acquisitions. For Spectral Instruments Imaging LLC, the Company finalized the net working capital adjustment in the second and fourth quarter of 2024, and it resulted in an
immaterial additional purchase consideration. For Nion, LLC, the Company finalized the net working capital adjustment in the second quarter of 2024 and it resulted in no additional purchase consideration.
The Company is in the process of finalizing its valuation of the assets acquired and liabilities assumed related to these acquisitions which may result in adjustments to these assets and liabilities, including goodwill.
Results of operations for 2024 acquired businesses
Results from the 2024 acquisitions included in the consolidated financial statements of the Company from the acquisition dates through December 31, 2024 include revenues of $259.5 million and pre-tax losses totaling $108 million. Pre-tax losses include purchased intangible amortization and step up inventory costs related to the acquisitions as well as acquisition related expenses, which are recorded within "Other charges, net" in the consolidated statements of income. Acquisition related expenses primarily relate to pre-close services, legal and professional services associated with integration activities, and other transaction costs. The tax effect of pre-tax losses incurred will be included in the related jurisdictional tax returns of its subsidiaries.
2023 acquisitions:
The following table reflects the consideration transferred and the allocation to the identifiable assets acquired and liabilities assumed for the 2023 acquisitions (in millions):
| | | | | | | | | | | | | | | | |
| | PhenomeX Inc. | | | Biognosys, AG | | | Other | | | Total | |
Consideration Transferred: | | | | | | | | | | | | |
Cash paid | | $ | 121.2 | | (a) | $ | 73.6 | | (b) | $ | 47.8 | | | $ | 242.6 | |
Cash acquired | | | (11.8 | ) | | | (9.5 | ) | | | (1.6 | ) | | | (22.9 | ) |
Holdback | | | — | | | | 0.2 | | | | 1.0 | | | | 1.2 | |
Fair value of hybrid financial instruments – founders | | | — | | | | — | | | | 36.1 | | | | 36.1 | |
Fair value of redeemable noncontrolling interest – other shareholders | | | — | | | | 2.5 | | | | 10.1 | | | | 12.6 | |
Fair value of contingent consideration | | | — | | | | — | | | | 2.9 | | | | 2.9 | |
Total consideration transferred | | $ | 109.4 | | | $ | 66.8 | | | $ | 96.3 | | | $ | 272.5 | |
Allocation of Consideration Transferred: | | | | | | | | | | | | |
Accounts receivable | | $ | 5.6 | | | $ | 3.6 | | | $ | 1.9 | | | $ | 11.1 | |
Inventories | | | 42.1 | | | | 0.4 | | | | 2.5 | | | | 45.0 | |
Other current assets | | | 7.6 | | | | 0.9 | | | | 2.1 | | | | 10.6 | |
Property, plant and equipment | | | 33.5 | | | | 8.0 | | | | 0.6 | | | | 42.1 | |
Deferred tax assets | | | 182.7 | | | | — | | | | — | | | | 182.7 | |
Other assets | | | 24.3 | | | | 4.3 | | | | 4.3 | | | | 32.9 | |
Intangible assets: | | | | | | | | | | | | |
Technology | | | 24.0 | | | | 10.2 | | | | 27.6 | | | | 61.8 | |
Customer relationships | | | 8.0 | | | | 13.8 | | | | 7.5 | | | | 29.3 | |
Trade name | | | — | | | | 2.7 | | | | 2.7 | | | | 5.4 | |
Backlog | | | — | | | | 0.8 | | | | 0.2 | | | | 1.0 | |
Goodwill | | | — | | | | 47.5 | | | | 66.7 | | | | 114.2 | |
Liabilities assumed | | | (74.3 | ) | | | (25.4 | ) | (b) | | (19.8 | ) | | | (119.5 | ) |
Total consideration allocated | | $ | 253.5 | | | $ | 66.8 | | | $ | 96.3 | | | $ | 416.6 | |
Bargain purchase gain | | $ | 144.1 | | | | — | | | | — | | | $ | 144.1 | |
(a)Total cash consideration consisted of $107.2 million for the acquisition of the outstanding stock including an $8.0 million payment to settle an employee award, and settlement of a $14.0 million note previously issued by the Company to PhenomeX during 2023.
(b)This amount includes an assumed liability for vested employee awards of $6.3 million on the acquisition date which was settled in the post-closing period ended March 31, 2023, for Biognosys, AG.
Acquisitions material to the Company’s financial statements
The table below summarizes information on the acquisition material to the Company’s financial statements in 2023:
| |
| PhenomeX Inc. (a) |
Acquisition date | October 2, 2023 |
Bruker segment | BSI NANO |
Activity of acquired business | PhenomeX is a life science tools company with a focus on functional cell biology. Their products and services provide customers with, among other offerings, Optofluidic platforms such as the Beacon, Beacon Select and Beacon Quest as well as Proteomic Barcoding Platforms, such as the IsoLight System and the IsoSpark System. The acquisition complements the Company's cellular and sub-cellular analysis tools including our high-performance spatial biology platform. |
Location | California, U.S.A. |
Acquired interest | 100% |
Business/technology acquired | Outstanding stock of PhenomeX Inc. (“PhenomeX”) |
(a)The Company renamed PhenomeX to Bruker Cellular Analytics (“BCA”) following acquisition.
The following table presents estimated useful life for the acquired intangible assets as determined by the Company:
| | |
| | PhenomeX Inc. |
Intangible Asset — Technology | | 12 years |
Intangible Asset — Customer relationships | | 15 years |
The PhenomeX acquisition resulted in a gain on bargain purchase due to the estimated fair value of the identifiable net assets acquired exceeding the purchase consideration transferred by $144.1 million and is shown as a gain on bargain purchase on our consolidated statement of income for the year ended December 31, 2023. Prior to recognizing the gain, the Company reassessed the measurement and recognition of identifiable assets acquired, and liabilities assumed and concluded that the valuation procedures and resulting measures were appropriate. The acquisition resulted in a bargain purchase gain due to the following factors: (i) the sellers were motivated and were looking for new management to lead the strategic direction of the company, create economies of scale and return the company to profitable operations, (ii) recurring operating losses resulted in a valuation of PhenomeX that significantly affected its market capitalization that resulted in a sustained decrease in stock price and fair value and (iii) PhenomeX has accumulated significant NOL’s that can be utilized by the Company, subject to annual limitations, to reduce its US taxable income which could not be benefited by PhenomeX. During 2024 the Company finalized the Section 382(h) study on NOL and R&D credits at the end of the measurement period, and as a result, the Company recorded a charge to the bargain purchase of $8.0 million.
Results of acquired operations of BCA
The results of the acquired operations of BCA have been included in the consolidated financial statements of the Company since its acquisition date of October 2, 2023. For the period from October 2, 2023, through December 31, 2023, BCA had total revenues of $7.0 million and pre-tax net loss of $43.4 million. The tax effect on pre-tax net loss of BCA is included in the consolidated US tax return of Bruker Corporation. Shortly after acquiring PhenomeX, the Company initiated a restructuring plan. Refer to Note 11, Other Charges, Net.
The Company did not expect the amounts allocated to goodwill to be deductible for tax purposes.
Other 2023 Acquisitions
During the year ended December 31, 2023, the Company acquired other businesses which were accounted for under the acquisition method that complemented the Company’s existing product offerings.
The table below summarizes information on the Company’s certain other acquisitions in 2023:
| |
| Biognosys, AG |
Acquisition date | January 3, 2023 |
Bruker segment | BSI CALID |
Activity of acquired business | Mass spectrometry based next-generation proteomics contract research services as well as proprietary proteomics software and laboratory consumables to support academic, pharma and biotech research and clinical development. |
Location | Zurich, CH |
Acquired interest | 97.15% |
Business/technology acquired | Outstanding stock of Biognosys, AG and its wholly owned subsidiary (collectively, “Biognosys”) |
Additional acquisition agreements | Concurrent with the acquisition, the Company entered into an agreement with the noncontrolling interest holders that provides the Company with the right to purchase, and the noncontrolling interest holders with the right to sell, the remaining 2.85% of Biognosys for cash to the founders at a contractually defined redemption value exercisable beginning in 2028. The option price to acquire the remaining 2.85% equity interest will have a minimum redemption, or floor, value at each purchase or sell date, subject to post combination employment. The fair value at acquisition date of these put option rights has been bifurcated into two financial instruments to separately account for the amounts attributable to the put option rights to sell the non-controlling interests on exercise dates at (1) above the minimum redemption value and (2) the minimum redemption value or floor value that is subject to post combination employment (the hybrid instrument) services. |
The following table presents estimated useful life for the acquired intangible assets for the material other acquisitions in 2023 as determined by the Company:
| | |
| | Biognosys, AG (a) |
Intangible Asset — Technology | | 7 years |
Intangible Asset — Tradenames | | indefinite |
Intangible Asset — Customer relationships | | 9 years |
a)The Company expects to amortize backlog through the end of 2025.
The following table reflects the consideration transferred and the respective reportable segment for certain other acquisitions (in millions):
| | | | | | | | | | | | |
| | Date Acquired | | Segment | | Total Consideration, net of Cash Acquired | | | Cash Consideration | |
Zontal Inc. | | May 4, 2023 | | BSI BioSpin | | $ | 33.5 | | | $ | 14.8 | |
Other (In aggregate) | | Various | | Various | | | 62.8 | | | | 33.0 | |
| | | | | | $ | 96.3 | | | $ | 47.8 | |
For the period from the date of acquisition through December 31, 2023, the revenues and results of operations included in the consolidated financial statements of the Company were not material, therefore, additional pro forma information combining the results of operations of the Company and these acquisitions have not been included.
The amortization period of the intangibles acquired for the Company’s other acquisitions is seven to eleven years for technology, one to twelve years for tradenames, and seven to fourteen years for customer relationships. The fair values of technology for certain acquisitions were not material and were expensed in full during 2023.
The Company does not expect the amounts allocated to goodwill to be deductible for tax purposes.
Supplemental Pro Forma Information (unaudited):
The unaudited pro forma financial information in the table below summarizes the combined GAAP revenue and net income (loss) results of the Company as though the material acquisitions of PhenomeX, ELITechGroup and Chemspeed had been completed on January 1, 2023 (in millions):
| | | | | | | | | | | | | | | | | | | | | | | | |
| | Year ended
December 31, 2024 | | | Year ended
December 31, 2023 | |
| | Before Adjustments | | | Pro forma
Adjustments | | | After Adjustments | | | Before Adjustments | | | Pro forma
Adjustments | | | After Adjustments | |
Revenue | | $ | 3,426.0 | | | $ | — | | | $ | 3,426.0 | | | $ | 3,318.5 | | | $ | — | | | $ | 3,318.5 | |
Net income (loss) | | $ | 115.3 | | | $ | (15.7 | ) | | $ | 99.6 | | | $ | 168.4 | | | $ | (88.3 | ) | | $ | 80.1 | |
The pro forma financial information above for the year ended December 31, 2023 also include the results of NanoString as though this acquisition had been completed on January 1, 2023.
NanoString was unable to file its Annual Report on Form 10-K for the year ended December 31, 2023, under the Securities and Exchange Act of 1934, as amended, following NanoString and certain of its subsidiaries filing voluntary petitions under Chapter 11 of the United States Bankruptcy Code in the United States Bankruptcy Court for the District of Delaware on February 4, 2024. Further, management considers that results of NanoString for the period from October 1, 2023, through May 6, 2024, are unlikely to be meaningful to users of these financial statements given the operations and financial results of NanoString were inherently materially impacted by the bankruptcy declaration. Accordingly, the pro forma financial information does not include the results of NanoString from October 1, 2023, through its acquisition date of May 6, 2024, as the historical financial statements after the quarter ended September 30, 2023 are not meaningful.
On March 21, 2023, pursuant to a merger agreement (“IsoPlexis Merger”), Berkeley Lights, Inc. (“BLI”) acquired and merged with IsoPlexis Corporation (“IsoPlexis”) with IsoPlexis surviving the merger as a wholly owned subsidiary of BLI. The newly merged company was renamed PhenomeX Inc. Historical financial statements of PhenomeX for periods prior to the IsoPlexis Merger are the historical financial statements of BLI. As a result, it would not be meaningful and would be impracticable to present comparative pro forma financial information as though the acquisition of PhenomeX had occurred as of the beginning of the comparable prior annual reporting period as if the business combination with PhenomeX had been completed on January 1, 2022.
The pro forma adjustments that impact net income (loss) include the following (in millions):
| | | | | | | | |
| | Year ended
December 31, 2024 | |
| | 2024 | | | 2023 | |
Net (increase) in amortization and depreciation expense associated with tangible and intangible assets | | $ | (2.4 | ) | | $ | (48.3 | ) |
Net (increase) in interest expense | | | (13.3 | ) | | | (40.0 | ) |
Total pro forma adjustments - net income (loss) | | $ | (15.7 | ) | | $ | (88.3 | ) |
The supplemental pro forma financial information presented above is for illustrative purposes only and does not include the pro forma adjustments that would be required under Article 11 of Regulation S-X for pro forma financial information. This supplemental pro forma financial information is not necessarily indicative of the financial position or results of operations that would have been realized if the PhenomeX, NanoString, ELITechGroup and Chemspeed acquisitions had been completed on January 1, 2023. No effect has been given for synergies, if any, that may have been achieved through the acquisitions nor is it indicative of future operating results or financial position. The pro forma adjustments are based upon currently available information and certain assumptions that the Company believes are reasonable under the circumstances.
5. Minority and Equity-method Investments
2024
As of December 31, 2024, the aggregate amount of investments in equity interests without a readily determinable fair value using the measurement alternative is $35.6 million. During the year ended December 31, 2024, the Company completed several minority investments. The following table reflects the consideration transferred (in millions):
| | | | | | | | | | | | |
Name | | Financial
Statement
Classification | | Date Acquired | | Total
Consideration | | | Cash
Consideration | |
NovAliX | | Other long-term assets | | July 31, 2024 | | $ | 50.1 | | | $ | 34.1 | |
Other minority investments | | Other long-term assets | | Various | | | 14.2 | | | | 14.2 | |
| | | | | | $ | 64.3 | | | $ | 48.3 | |
On July 31, 2024, the Company acquired a minority equity interest in NovAliX a preclinical contract research organization specializing in expert drug discovery services, headquartered in Strasbourg, France. The Company obtained a 30% interest in NovAliX’s common stock in exchange for consideration of EUR 31.5 million (approximately $34.1 million). The Company accounts for its investment in NovAliX using the equity-method of accounting. Concurrent with the transaction, the Company entered into an agreement with the remaining shareholders that provides the Company with the right to purchase, and the shareholders with the right to sell, the remaining ownership of NovAliX for cash at a contractually defined redemption value exercisable beginning in 2029 and ending in 2034. The Company recognized a liability, classified in other long-term liabilities in the consolidated balance sheet, related to the potential obligation to acquire the remaining equity interests if the purchase option is exercised, estimated at EUR 14.4 million (approximately $16.0 million) using the discounted cash flow method.
During the year ended December 31, 2024, the Company recognized $24.6 million in impairment charges, to write down the carrying value of certain minority investments which are accounted for under the measurement alternative. Included in these impairment charges are changes in value of certain investments based on established pricing for additional financing rounds. The impairment charges are included in “Interest and other income (expense), net” in the consolidated statements of income.
2023
During the year ended December 31, 2023, the Company completed several minority investments. The following table reflects the consideration transferred for the investments (in millions):
| | | | | | | | | | | | |
Name | | Financial
Statement
Classification | | Date Acquired | | Total
Consideration | | | Cash
Consideration | |
Other Investments | | Other long-term assets | | Various | | $ | 24.8 | | | $ | 24.8 | |
| | | | | | $ | 24.8 | | | $ | 24.8 | |
During the year ended December 31, 2023, the Company recorded a realized gain of $6.8 million from the sale of a minority investment and recognized $18.2 million in impairment charges to write down the carrying value of certain minority investments. The realized gain and impairment are included in “Interest and other income (expense), net” in the Consolidated Statements of Income.
6. Goodwill and Intangible Assets
Goodwill
The following table sets forth the changes in the carrying amount of goodwill by segment (in millions):
| | | | | | | | | | | | | | | | | | | | |
| | BSI BioSpin | | | BSI CALID | | | BSI NANO | | | BEST | | | Total | |
Balance at December 31, 2021 | | $ | 42.4 | | | $ | 57.9 | | | $ | 238.9 | | | $ | 0.3 | | | $ | 339.5 | |
Current period additions | | | 18.6 | | | | 55.3 | | | | 58.0 | | | | — | | | | 131.9 | |
Foreign currency impact | | | (3.2 | ) | | | (5.8 | ) | | | (4.8 | ) | | | — | | | | (13.8 | ) |
Balance at December 31, 2022 | | | 57.8 | | | | 107.4 | | | | 292.1 | | | | 0.3 | | | | 457.6 | |
Current period additions | | | 25.8 | | | | 83.8 | | | | 4.5 | | | | — | | | | 114.1 | |
Current period adjustments | | | — | | | | — | | | | (5.0 | ) | | | — | | | | (5.0 | ) |
Foreign currency impact | | | 2.9 | | | | 10.3 | | | | 2.7 | | | | — | | | | 15.9 | |
Balance at December 31, 2023 | | | 86.5 | | | | 201.5 | | | | 294.3 | | | | 0.3 | | | | 582.6 | |
Current period additions | | | 141.3 | | | | 536.0 | | | | 281.0 | | | | — | | | | 958.3 | |
Foreign currency impact | | | (6.6 | ) | | | (21.5 | ) | | | (5.5 | ) | | | — | | | | (33.6 | ) |
Balance at December 31, 2024 | | $ | 221.2 | | | $ | 716.0 | | | $ | 569.8 | | | $ | 0.3 | | | $ | 1,507.3 | |
During 2024, there were two new reporting units, Automation and NanoString, that were created from the Chemspeed Technologies, AG and NanoString acquisitions, respectively. Automation and NanoString are included in the BBIO and BNANO segments, respectively.
For Automation, there was $127.8 million allocated to goodwill. The fair value of Automation was calculated to be $186.3 million, which was $13.0 million (7.5%) over the carrying value of the reporting unit as of the most recent Step 1 performed as of October 1, 2024. The valuation was conducted using both the income approach (which estimates fair value based on the future cash flows) and the market approach (which estimates fair value based on similar companies). The reporting unit fair value measurement is classified as Level 3 in the fair value hierarchy because they involve significant unobservable inputs. Significant assumptions inherent in the valuation methodologies for goodwill include, but are not limited to, prospective financial information, growth rates, terminal value, discount rates, and comparable multiples from publicly traded companies in our industry. The fair value excess is expected given the arms-length transaction of Chemspeed that occurred just six months prior to the analysis. The Company is not aware of any potential events or trends which could have a negative impact on the estimated fair value. As of the date of these financial statements, the Company believes goodwill to be recoverable.
For NanoString, there was $253.8 million allocated to goodwill. The fair value of NanoString was calculated to be $392.6 million based on the initial purchase price allocation. Given the proximity of the close date between the acquisition date and the valuation date, the Company did not include NanoString in its Step 1 analysis. The valuation methodology used to determine the fair value of the identifiable assets acquired and liabilities assumed in determining the initial purchase price allocation is consistent with that described in Note 2, Summary of Significant Accounting Policies. Furthermore, NanoString is facing certain litigation matters related to its GeoMx Digital Spatial Profiler products and CosMx Spatial Molecular Imager products, refer to Note 26, Commitments and Contingencies for more information. As of the date of these financial statements, the Company believes the goodwill to be recoverable.
Intangible Assets
The following is a summary of intangible assets (in millions):
| | | | | | | | | | | | | | | | | | | | | | | | |
| | 2024 | | | 2023 | |
| | Gross | | | | | | Net | | | Gross | | | | | | Net | |
| | Carrying | | | Accumulated | | | Carrying | | | Carrying | | | Accumulated | | | Carrying | |
| | Amount | | | Amortization | | | Amount | | | Amount | | | Amortization | | | Amount | |
Existing technology and related patents (a) | | $ | 724.5 | | | $ | (291.3 | ) | | $ | 433.2 | | | $ | 428.3 | | | $ | (250.4 | ) | | $ | 177.9 | |
Customer relationships | | | 550.6 | | | | (125.6 | ) | | | 425.0 | | | | 227.4 | | | | (93.5 | ) | | | 133.9 | |
Trade names (b) | | | 60.9 | | | | (16.1 | ) | | | 44.8 | | | | 28.4 | | | | (10.1 | ) | | | 18.3 | |
Other | | | 16.5 | | | | (7.0 | ) | | | 9.5 | | | | 2.2 | | | | (1.8 | ) | | | 0.4 | |
Intangible assets | | $ | 1,352.5 | | | $ | (440.0 | ) | | $ | 912.5 | | | $ | 686.3 | | | $ | (355.8 | ) | | $ | 330.5 | |
a)Included in existing technology and related patents, there is in process research and development of $2.7 million and $3.5 million as of December 31, 2024 and 2023, respectively.
b)Included in trade names, there are indefinite lived assets of $2.8 million and $3.0 million as of December 31, 2024 and 2023, respectively.
For the years ended December 31, 2024, 2023 and 2022, the Company incurred amortization expense of $99.1 million, $47.1 million and $37.1 million, respectively.
The estimated future amortization expense related to amortizable intangible assets is as follows (in millions):
| | | | |
2025 | | $ | 111.8 | |
2026 | | | 106.8 | |
2027 | | | 98.9 | |
2028 | | | 93.9 | |
2029 | | | 88.1 | |
Thereafter | | | 407.5 | |
Total | | $ | 907.0 | |
7. Revenue
The following table presents the Company’s revenue by End Customer Geography for the years ended December 31 (in millions):
| | | | | | | | | | | | |
| | 2024 | | | 2023 | | | 2022 | |
United States | | $ | 938.5 | | | $ | 777.7 | | | $ | 696.1 | |
Germany | | | 310.7 | | | | 281.5 | | | | 247.4 | |
Rest of Europe | | | 873.0 | | | | 699.7 | | | | 591.9 | |
China | | | 471.2 | | | | 528.1 | | | | 396.5 | |
Rest of Asia Pacific | | | 518.5 | | | | 460.9 | | | | 408.4 | |
Other | | | 254.5 | | | | 216.6 | | | | 190.4 | |
Total revenue | | $ | 3,366.4 | | | $ | 2,964.5 | | | $ | 2,530.7 | |
The following table presents revenue for the Company recognized at a point in time versus over time for the years ended December 31 (in millions):
| | | | | | | | | | | | |
| | 2024 | | | 2023 | | | 2022 | |
Revenue recognized at a point in time | | $ | 2,894.9 | | | $ | 2,575.3 | | | $ | 2,204.7 | |
Revenue recognized over time | | | 471.5 | | | | 389.2 | | | | 326.0 | |
Total revenue | | $ | 3,366.4 | | | $ | 2,964.5 | | | $ | 2,530.7 | |
For the years ended December 31 (in millions) the following balances were associated with revenue:
| | | | | | | | |
| | 2024 | | | 2023 | |
Contract assets | | $ | 105.2 | | | $ | 85.8 | |
Contract liabilities (a) | | | 538.2 | | | | 491.4 | |
Remaining performance obligations (b) | | $ | 2,090.4 | | | $ | 2,226.7 | |
a)Approximately $348.6 million of the contract liability balance on December 31, 2023, was recognized as revenue during the year ended December 31, 2024.
b)Bruker’s mix of remaining performance obligations, or backlog, consists of firm orders under non-cancelable purchase orders received from customers and the timing of revenue recognition can vary significantly due to a variety of factors. Bruker manufactures innovative scientific instruments and diagnostic solutions which can result in varying production and installation timing due to components, customization, manufacturing, assembly, testing processes, and customer site availability or readiness. Our expected completion of performance obligation can vary from year to year based on these and other factors. As a result, backlog on any particular date can be indicative of our short-term revenue performance but is not necessarily a reliable indicator of long-term revenue performance. The Company will recognize revenues for these performance obligations as they are satisfied, the majority of which is expected to occur within the next twelve months.
Shipping and handling costs were $45.7 million, $40.3 million and $39.4 million during the years ended December 31, 2024, 2023 and 2022, respectively. Amounts billed to customers in connection with these costs are included in total revenues.
8. Business Segment Information
The Company's CEO is the chief operating decision maker. The accounting policies of the segments are the same as those described in the summary of significant accounting policies. We exclude from segment expenses and segment operating income (loss) certain corporate-related expenses and certain transactions or adjustments, such as costs related to restructuring actions, acquisition and related integration expenses, amortization of acquired intangible assets, and costs associated with our global information technology transition initiatives. The Company's intersegment sales and transfers are accounted for at discounted market-based prices based on intersegment agreements. The chief operating decision maker uses segment operating income (loss) to assess the performance for each segment by comparing the results of each segment with one another, comparing actual results to budget and prior year, as well as to allocate resources.
The following tables present segment results for the years ended December 31, 2024, 2023 and 2022 (in millions):
| | | | | | | | | | | | | | | | | | | | |
| | Year Ended December 31, 2024 | |
| | BSI BioSpin | | | BSI CALID | | | BSI NANO | | | BEST | | | Total | |
| | | | | | | | | | | | | | | |
Segment revenue from external customers | | $ | 905.7 | | | $ | 1,093.5 | | | $ | 1,098.3 | | | $ | 268.9 | | | $ | 3,366.4 | |
Intersegment revenue | | | — | | | | — | | | | — | | | | 14.1 | | | | 14.1 | |
Total segment revenue | | $ | 905.7 | | | $ | 1,093.5 | | | $ | 1,098.3 | | | $ | 283.0 | | | $ | 3,380.5 | |
| | | | | | | | | | | | | | | |
Segment expenses: | | | | | | | | | | | | | | | |
Cost of revenue | | $ | 437.7 | | | $ | 465.4 | | | $ | 518.9 | | | $ | 222.5 | | | $ | 1,644.5 | |
Selling, general and administrative | | | 158.9 | | | | 270.2 | | | | 290.8 | | | | 21.5 | | | | 741.4 | |
Research and development | | | 92.5 | | | | 111.7 | | | | 164.7 | | | | 3.9 | | | | 372.8 | |
Segment Operating income | | $ | 216.6 | | | $ | 246.2 | | | $ | 123.9 | | | $ | 35.1 | | | $ | 621.8 | |
| | | | | | | | | | | | | | | |
Reconciliation of Total operating income: | | | | | | | | | | | | | | | |
Corporate, elimination and other (a) | | | | | | | | | | | | | | | 103.8 | |
Unallocated expenses (b) | | | | | | | | | | | | | | | 264.9 | |
Total consolidated operating income | | | | | | | | | | | | | | $ | 253.1 | |
| | | | | | | | | | | | | | | |
Interest and other income (expense), net | | | | | | | | | | | | | | | (46.2 | ) |
| | | | | | | | | | | | | | | |
Income before income taxes, equity in income (losses) of unconsolidated investees, net of tax, and noncontrolling interests in consolidated subsidiaries | | | | | | | | | | | | | | $ | 206.9 | |
| | | | | | | | | | | | | | | | | | | | |
| | Year Ended December 31, 2023 | |
| | BSI BioSpin | | | BSI CALID | | | BSI NANO | | | BEST | | | Total | |
| | | | | | | | | | | | | | | |
Revenue | | $ | 798.5 | | | $ | 960.4 | | | $ | 941.9 | | | $ | 263.7 | | | $ | 2,964.5 | |
Intersegment revenue | | | — | | | | — | | | | — | | | | 17.0 | | | | 17.0 | |
Total segment revenue | | $ | 798.5 | | | $ | 960.4 | | | $ | 941.9 | | | $ | 280.7 | | | $ | 2,981.5 | |
| | | | | | | | | | | | | | | |
Segment expenses: | | | | | | | | | | | | | | | |
Cost of revenue | | $ | 374.8 | | | $ | 393.2 | | | $ | 438.2 | | | $ | 225.9 | | | $ | 1,432.1 | |
Selling, general and administrative | | | 134.7 | | | | 238.7 | | | | 228.0 | | | | 19.3 | | | | 620.7 | |
Research and development | | | 77.8 | | | | 96.4 | | | | 117.3 | | | | 3.0 | | | | 294.5 | |
Segment Operating income | | $ | 211.2 | | | $ | 232.1 | | | $ | 158.4 | | | $ | 32.5 | | | $ | 634.2 | |
| | | | | | | | | | | | | | | |
Reconciliation of Total operating income: | | | | | | | | | | | | | | | |
Corporate, elimination and other (a) | | | | | | | | | | | | | | $ | 87.9 | |
Unallocated expenses (b) | | | | | | | | | | | | | | | 109.4 | |
Total consolidated operating income | | | | | | | | | | | | | | $ | 436.9 | |
| | | | | | | | | | | | | | | |
Interest and other income (expense), net | | | | | | | | | | | | | | | 107.3 | |
| | | | | | | | | | | | | | | |
Income before income taxes, equity in income (losses) of unconsolidated investees, net of tax, and noncontrolling interests in consolidated subsidiaries | | | | | | | | | | | | | | $ | 544.2 | |
| | | | | | | | | | | | | | | | | | | | |
| | Year Ended December 31, 2022 | |
| | BSI BioSpin | | | BSI CALID | | | BSI NANO | | | BEST | | | Total | |
| | | | | | | | | | | | | | | |
Revenue | | $ | 696.7 | | | $ | 822.2 | | | $ | 787.0 | | | $ | 224.8 | | | $ | 2,530.7 | |
Intersegment revenue | | | — | | | | — | | | | — | | | | 12.3 | | | | 12.3 | |
Total segment revenue | | $ | 696.7 | | | $ | 822.2 | | | $ | 787.0 | | | $ | 237.1 | | | $ | 2,543.0 | |
| | | | | | | | | | | | | | | |
Segment expenses: | | | | | | | | | | | | | | | |
Cost of revenue | | $ | 320.6 | | | $ | 330.8 | | | $ | 373.2 | | | $ | 186.2 | | | $ | 1,210.8 | |
Selling, general and administrative | | | 121.0 | | | | 200.0 | | | | 185.2 | | | | 18.0 | | | | 524.2 | |
Research and development | | | 67.4 | | | | 75.0 | | | | 90.5 | | | | 2.5 | | | | 235.4 | |
Segment Operating income | | $ | 187.7 | | | $ | 216.4 | | | $ | 138.1 | | | $ | 30.4 | | | $ | 572.6 | |
| | | | | | | | | | | | | | | |
Reconciliation of Total operating income: | | | | | | | | | | | | | | | |
Corporate, elimination and other (a) | | | | | | | | | | | | | | $ | 67.0 | |
Unallocated costs (b) | | | | | | | | | | | | | | | 72.9 | |
Total consolidated operating income | | | | | | | | | | | | | | $ | 432.7 | |
| | | | | | | | | | | | | | | |
Interest and other income (expense), net | | | | | | | | | | | | | | $ | (18.8 | ) |
| | | | | | | | | | | | | | | |
Income before income taxes, equity in income (losses) of unconsolidated investees, net of tax, and noncontrolling interests in consolidated subsidiaries | | | | | | | | | | | | | | $ | 413.9 | |
a)Represents corporate costs and intersegment eliminations not allocated to the reportable segments. Unallocated costs include general and administrative expenses not directly incurred by the segments such as professional fees incurred for the quarterly reviews and annual audit of the consolidated financial statements, personnel costs of corporate accounting, finance, legal and IT resources, and other expense items.
b)Unallocated expenses consist of costs related to restructuring actions, acquisition and related integration expenses, amortization of acquired intangible assets, costs associated with our global information technology transition initiatives, and other costs
Refer to Note 7, Revenue for information on revenue by geographical area.
Total assets by segment are as follows for the years ended December 31, (in millions):
| | | | | | | | |
| | 2024 | | | 2023 | |
BSI BioSpin, BSI CALID, BSI NANO & Corporate | | $ | 5,648.4 | | | $ | 4,110.6 | |
BEST | | | 199.8 | | | | 186.0 | |
Eliminations and other (a) | | | (41.5 | ) | | | (46.7 | ) |
Total assets | | $ | 5,806.7 | | | $ | 4,249.9 | |
a)Assets not allocated to the reportable segments and eliminations of intercompany transactions.
The Company is unable, without unreasonable effort or expense, to disclose the amount of total assets by the BSI BioSpin, BSI CALID and BSI NANO Segments as well as the Corporate function and further, the Company’s chief operating decision maker does not receive long-lived asset information individually by these reportable segments and Corporate.
Long-lived assets (which include property, plant and equipment, net and operating lease right of use assets) by geographical area are as follows for the years ended December 31, (in millions):
| | | | | | | | | | | | |
| | 2024 | | | 2023 | | | 2022 | |
Germany | | $ | 370.0 | | | $ | 350.2 | | | $ | 309.6 | |
United States | | | 188.0 | | | | 124.9 | | | | 58.8 | |
Switzerland | | | 134.1 | | | | 127.0 | | | | 98.5 | |
Rest of Europe | | | 91.8 | | | | 57.4 | | | | 42.5 | |
Asia Pacific | | | 22.2 | | | | 22.1 | | | | 22.1 | |
Other | | | 8.7 | | | | 9.8 | | | | 6.7 | |
Total long-lived assets | | $ | 814.8 | | | $ | 691.4 | | | $ | 538.2 | |
Total capital expenditures and depreciation and amortization by segment are presented below for the years ended December 31, (in millions):
| | | | | | | | | | | | |
| | 2024 | | | 2023 | | | 2022 | |
Capital Expenditures: | | | | | | | | | |
BSI BioSpin | | $ | 22.8 | | | $ | 23.9 | | | $ | 14.5 | |
BSI CALID | | | 34.1 | | | | 31.4 | | | | 33.9 | |
BSI NANO | | | 19.3 | | | | 13.9 | | | | 20.2 | |
Corporate | | | 14.8 | | | | 10.2 | | | | 9.1 | |
BEST | | | 24.3 | | | | 27.5 | | | | 51.5 | |
Total capital expenditures | | $ | 115.3 | | | $ | 106.9 | | | $ | 129.2 | |
Depreciation and Amortization: | | | | | | | | | |
BSI BioSpin | | $ | 41.0 | | | $ | 25.7 | | | $ | 22.6 | |
BSI CALID | | | 67.0 | | | | 29.3 | | | | 20.7 | |
BSI NANO | | | 61.7 | | | | 48.0 | | | | 35.6 | |
Corporate | | | 5.7 | | | | 4.7 | | | | 3.9 | |
BEST | | | 8.4 | | | | 7.2 | | | | 6.0 | |
Total depreciation and amortization | | $ | 183.8 | | | $ | 114.9 | | | $ | 88.8 | |
9. Earnings Per Share
The following table sets forth the computation of basic and diluted weighted average shares outstanding and net income per common share attributable to Bruker shareholders (in millions, except per share amounts):
| | | | | | | | | | | | |
| | 2024 | | | 2023 | | | 2022 | |
Net income attributable to Bruker Corporation | | $ | 113.1 | | | $ | 427.2 | | | $ | 296.6 | |
Weighted average common shares outstanding: | | | | | | | | | |
Weighted average common shares outstanding - basic | | | 149.0 | | | | 146.4 | | | | 148.6 | |
Effect of dilutive securities: | | | | | | | | | |
Stock options, restricted stock awards, restricted
stock units and ESPP | | | 0.5 | | | | 0.8 | | | | 0.8 | |
Weighted average common shares outstanding - diluted | | | 149.5 | | | | 147.2 | | | | 149.4 | |
Net income per common share attributable to Bruker
Corporation shareholders: | | | | | | | | | |
Basic | | $ | 0.76 | | | $ | 2.92 | | | $ | 2.00 | |
Diluted | | $ | 0.76 | | | $ | 2.90 | | | $ | 1.99 | |
The following common share equivalents have been excluded from the computation of diluted weighted-average shares outstanding, as their effect would have been anti-dilutive (in millions of shares):
| | | | | | | | | | | | |
| | 2024 | | | 2023 | | | 2022 | |
Stock options and ESPP purchase rights | | | 0.3 | | | | 0.2 | | | | 0.1 | |
10. Post Retirement Benefit Plans
Defined Contribution Plans
The Company sponsors various defined contribution plans that cover certain domestic and international employees. The Company may make contributions to these plans at its discretion. The Company contributed $17.7 million, $13.7 million and $11.0 million to such plans during the years ended December 31, 2024, 2023 and 2022, respectively.
Defined Benefit Plans
Substantially all of the Company’s employees in Switzerland, France, Japan, and Thailand, as well as certain employees in Germany, and Italy, are covered by Company-sponsored defined benefit pension plans. Retirement benefits are generally earned based on years of service and compensation during active employment. Eligibility is generally determined in accordance with local statutory requirements; however, the level of benefits and terms of vesting varies among plans.
The following amounts were recognized in the accompanying consolidated balance sheets for the Company’s defined benefit plans (in millions):
| | | | | | | | |
| | 2024 | | | 2023 | |
Current liabilities | | $ | (2.5 | ) | | $ | (2.1 | ) |
Non-current liabilities | | | (103.0 | ) | | | (76.6 | ) |
Net benefit obligation | | $ | (105.5 | ) | | $ | (78.7 | ) |
The changes in benefit obligations and plan assets under the defined benefit pension plans, projected benefit obligation and funded status of the plans were as follows (in millions):
| | | | | | | | |
| | 2024 | | | 2023 | |
Change in benefit obligation: | | | | | | |
Benefit obligation at beginning of year | | $ | 256.1 | | | $ | 197.8 | |
Service cost | | | 7.1 | | | | 5.5 | |
Interest cost | | | 4.4 | | | | 5.2 | |
Plan participant contributions | | | 7.5 | | | | 6.4 | |
Plan amendments | | | 12.6 | | | | (2.4 | ) |
Plan settlements | | | (1.3 | ) | | | — | |
Benefits paid | | | (5.0 | ) | | | (6.8 | ) |
Actuarial gain | | | 11.6 | | | | 27.5 | |
Premiums paid | | | (2.5 | ) | | | (2.3 | ) |
Plan combinations / acquisitions | | | 24.1 | | | | 6.1 | |
Impact of foreign currency exchange rates | | | (20.0 | ) | | | 19.1 | |
Benefit obligation at end of year | | | 294.6 | | | | 256.1 | |
| | | | | | |
Change in plan assets: | | | | | | |
Fair value of plan assets at beginning of year | | $ | 177.4 | | | $ | 150.3 | |
Return on plan assets | | | 2.6 | | | | 1.5 | |
Plan participant and employer contributions | | | 17.3 | | | | 14.4 | |
Benefits paid | | | (5.0 | ) | | | (6.8 | ) |
Plan settlements | | | (1.3 | ) | | | — | |
Premiums paid | | | (2.5 | ) | | | (2.3 | ) |
Plan combinations / acquisitions | | | 14.4 | | | | 4.8 | |
Impact of foreign currency exchange rates | | | (13.8 | ) | | | 15.5 | |
Fair value of plan assets at end of year | | | 189.1 | | | | 177.4 | |
Net under-funded status | | $ | (105.5 | ) | | $ | (78.7 | ) |
Plan amendments relate to further reductions in the mandatory conversion rates for the pension plan in Switzerland that will be effective from 2026 onwards. The accumulated benefit obligation for the defined benefit pension plans is $270.2 million and $226.4 million at December 31, 2024 and 2023, respectively. All defined benefit pension plans have an accumulated benefit obligation and projected benefit obligation in excess of plan assets at December 31, 2024, and 2023.
The following pre-tax amounts were recognized in accumulated other comprehensive income for the Company’s defined benefit plans (in millions):
| | | | | | | | | | | | |
| | 2024 | | | 2023 | | | 2022 | |
Reconciliation of amounts recognized in the consolidated balance sheets: | | | | | | | | | |
Prior service cost | | $ | 0.2 | | | $ | 14.6 | | | $ | 12.0 | |
Net actuarial gain (loss) | | | (38.9 | ) | | | (27.4 | ) | | | 4.2 | |
Accumulated other comprehensive gain (loss) | | | (38.7 | ) | | | (12.8 | ) | | | 16.2 | |
Accumulated contributions in excess of net periodic benefit cost | | | (66.8 | ) | | | (65.9 | ) | | | (63.7 | ) |
Net amount recognized | | $ | (105.5 | ) | | $ | (78.7 | ) | | $ | (47.5 | ) |
The amount in accumulated other comprehensive income at December 31, 2024, expected to be recognized as amortization of net loss within net periodic benefit cost in 2025 is $0.4 million.
The components of net periodic benefit costs included in the accompanying consolidated statements of income were as follows (in millions):
| | | | | | | | | | | | |
| | 2024 | | | 2023 | | | 2022 | |
Components of net periodic benefit costs: | | | | | | | | | |
Service cost | | $ | 7.1 | | | $ | 5.5 | | | $ | 6.5 | |
Interest cost | | | 4.4 | | | | 5.2 | | | | 1.0 | |
Expected return on plan assets | | | (5.2 | ) | | | (4.4 | ) | | | (1.7 | ) |
Settlement (gain) recognized | | | — | | | | — | | | | (0.3 | ) |
Amortization of prior service (credit) | | | (0.8 | ) | | | (0.8 | ) | | | (0.2 | ) |
Amortization of actuarial losses | | | 0.3 | | | | 0.1 | | | | 2.2 | |
Net periodic benefit costs | | $ | 5.8 | | | $ | 5.6 | | | $ | 7.5 | |
The assumptions used to determine the net periodic benefit costs and the projected benefit obligations are as follows:
| | | | | | | | | | | | | | | | | | | | |
2024 | | Japan | | | France | | | Switzerland | | | Germany | | | Italy | |
Annual discount rate—defined benefit obligation | | | 1.4 | % | | | 3.3 | % | | | 1.0 | % | | | 3.1 | % | | | 3.4 | % |
Annual discount rate—defined benefit cost | | | 1.1 | % | | | 3.2 | % | | | 1.4 | % | | | 3.6 | % | | | 3.6 | % |
Expected return on plan assets | | | — | % | | | 3.0 | % | | | 2.8 | % | | | — | % | | | — | % |
Expected rate of compensation increase | | | 3.0 | % | | | 3.0 | % | | | 2.0 | % | | | 2.6 | % | | | 3.0 | % |
| | | | | | | | | | | | | | | |
2023 | | Japan | | | France | | | Switzerland | | | Germany | | | Italy | |
Annual discount rate—defined benefit obligation | | | 1.1 | % | | | 3.2 | % | | | 1.4 | % | | | 3.6 | % | | n/a | |
Annual discount rate—defined benefit cost | | | 0.9 | % | | | 3.8 | % | | | 2.4 | % | | | 3.9 | % | | n/a | |
Expected return on plan assets | | | — | % | | | 3.0 | % | | | 2.7 | % | | | — | % | | n/a | |
Expected rate of compensation increase | | | 3.0 | % | | | 3.0 | % | | | 2.2 | % | | | 2.6 | % | | n/a | |
| | | | | | | | | | | | | | | |
2022 | | Japan | | | France | | | Switzerland | | | Germany | | | Italy | |
Annual discount rate—defined benefit obligation | | | 0.9 | % | | | 3.8 | % | | | 2.4 | % | | | 3.9 | % | | n/a | |
Annual discount rate—defined benefit cost | | | 0.4 | % | | | 1.0 | % | | | 0.4 | % | | | 0.8 | % | | n/a | |
Expected return on plan assets | | | — | % | | | 3.0 | % | | | 1.2 | % | | | — | % | | n/a | |
Expected rate of compensation increase | | | 3.0 | % | | | 3.0 | % | | | 2.3 | % | | | 2.6 | % | | n/a | |
To determine the expected long-term rate of return on pension plan assets, the Company considers current asset allocations, as well as historical and expected returns on various asset categories of plan assets. For the defined benefit pension plans, the Company applies the expected rate of return to a market-related value of assets, which stabilizes variability in assets to which the expected return is applied.
Asset Allocations by Asset Category
The fair value of the Company’s pension plan assets by asset category and by level in the fair value hierarchy, is as follows (in millions):
| | | | | | | | | | | | | | | | |
December 31, 2024 | | Total | | | Quoted Prices in
Active Markets
Available (Level 1) | | | Significant Other
Observable Inputs
(Level 2) | | | Significant
Unobservable Inputs
(Level 3) | |
Plan Assets: | | | | | | | | | | | | |
Swiss Pension Plan assets (a) | | $ | 189.1 | | | $ | — | | | $ | — | | | $ | 189.1 | |
Total plan assets | | $ | 189.1 | | | $ | — | | | $ | — | | | $ | 189.1 | |
| | | | | | | | | | | | |
December 31, 2023 | | Total | | | Quoted Prices in
Active Markets
Available (Level 1) | | | Significant Other
Observable Inputs
(Level 2) | | | Significant
Unobservable Inputs
(Level 3) | |
Plan Assets: | | | | | | | | | | | | |
Swiss Pension Plan assets (a) | | $ | 177.4 | | | $ | — | | | $ | — | | | $ | 177.4 | |
Total plan assets | | $ | 177.4 | | | $ | — | | | $ | — | | | $ | 177.4 | |
(a)The Company’s pension plan in Switzerland is outsourced to Swiss Life AG for Bruker Switzerland AG and PMOD under a fully insured plan, Profond for Biognosys under a partially insured plan and Axa Stiftung Berufliche Vorsorge for Chemspeed under a partially insured plan. Starting January 1, 2025 the pension plan for Bruker Switzerland AG is outsourced to Profond under a partially insured plan. Members for the Bruker Switzerland AG and PMOD Plans are guaranteed an interest of 1.25% on mandatory retirement withdrawals and another 0.50% on the non-mandatory portion of the withdrawal benefit for the year 2024. Members for the Chemspeed Plan are guaranteed an interest of 1.75% on mandatory retirement withdrawals and another 3.50% on the non-mandatory portion of the withdrawal benefit for the year 2024. Members for the Biognosys plan are guaranteed an 8% interest for the overall account balance. The insurers utilize plan administrators and investment managers to oversee the investment allocation process, set long-term strategic targets and monitor asset allocations. Should the return be greater than the guaranteed amounts, the Company, according to Swiss law, shall receive 90% of the additional return with the insurers retaining 10%.
Contributions and Estimated Future Benefit Payments
The estimated future benefit payments are based on the same assumptions used to measure the Company’s benefit obligation at December 31, 2024. The following benefit payments reflect future employee service as appropriate (in millions):
| | | | |
2025 | | $ | 12.9 | |
2026 | | | 11.7 | |
2027 | | | 13.5 | |
2028 | | | 15.8 | |
2029 | | | 16.3 | |
2030-2034 | | $ | 83.5 | |
11. Other Charges, Net
The components of Other charges, net, were as follows (in millions):
| | | | | | | | | | | | |
| | 2024 | | | 2023 | | | 2022 | |
Acquisition-related expenses, net (a) | | $ | 54.9 | | | $ | 16.8 | | | $ | 19.3 | |
Acquisition-related litigation charges | | | 44.9 | | | | — | | | | — | |
Information technology transformation costs (b) | | | 7.2 | | | | 5.0 | | | | 3.0 | |
Restructuring | | | 13.1 | | | | 18.8 | | | | 3.9 | |
Long-lived asset impairments | | | 2.2 | | | | 5.7 | | | | 0.3 | |
Other | | | 3.8 | | | | 5.9 | | | | 3.2 | |
Other charges, net | | $ | 126.1 | | | $ | 52.2 | | | $ | 29.7 | |
(a)Acquisition-related expenses relate primarily to transaction costs on potential and consummated acquisitions, integration costs of newly acquired entities, and stock-based compensation expense related to the fair value changes of hybrid instruments.
(b)The Information technology (“IT”) transformation costs are related to an IT transformation initiative that is a multi-year project aimed at updating and integrating our global enterprise resource planning and human resource information systems.
12. Restructuring and Asset Impairments
The Company has undertaken restructuring actions impacting the reportable segments at various locations across North America, Europe and Asia. This includes workforce right-sizing actions resulting in severance and transition costs; and costs related to the consolidation of facilities resulting in asset impairment and accelerated depreciation charges.
The following table presents restructuring costs by segment as included within the Company’s consolidated statements of income for the years ended December 31, 2024, 2023 and 2022 (in millions):
| | | | | | | | | | | | |
| | 2024 | | | 2023 | | | 2022 | |
Cost of revenues: | | | | | | | | | |
BSI BioSpin | | $ | 1.0 | | | $ | — | | | $ | 0.7 | |
BSI CALID | | | 1.0 | | | | 1.5 | | | | 0.3 | |
BSI NANO | | | 9.6 | | | | 2.0 | | | | (0.1 | ) |
Total Cost of revenues | | $ | 11.6 | | | $ | 3.5 | | | $ | 0.9 | |
Other charges, net: | | | | | | | | | |
BSI BioSpin | | $ | 1.6 | | | $ | 1.7 | | | $ | 1.3 | |
BSI CALID | | | 2.2 | | | | 1.9 | | | | 0.3 | |
BSI NANO | | | 8.8 | | | | 14.4 | | | | 0.2 | |
Corporate | | | 0.5 | | | | 0.8 | | | | 2.1 | |
Total Other charges, net | | | 13.1 | | | | 18.8 | | | | 3.9 | |
Total | | $ | 24.7 | | | $ | 22.3 | | | $ | 4.8 | |
The following table sets forth the changes in the restructuring reserves (in millions):
| | | | | | | | | | | | | | | | |
| | Total | | | Severance | | | Exit Costs | | | Provisions for
Excess
Inventory | |
Balance at December 31, 2021 | | $ | 6.4 | | | $ | 3.5 | | | $ | 0.3 | | | $ | 2.6 | |
Restructuring charges | | | 4.8 | | | | 2.4 | | | | 2.3 | | | | 0.1 | |
Cash payments | | | (7.8 | ) | | | (5.4 | ) | | | (2.4 | ) | | | — | |
Non-cash adjustments | | | (1.4 | ) | | | — | | | | — | | | | (1.4 | ) |
Foreign currency impact | | | (0.2 | ) | | | (0.1 | ) | | | — | | | | (0.1 | ) |
Balance at December 31, 2022 | | $ | 1.8 | | | $ | 0.4 | | | $ | 0.2 | | | $ | 1.2 | |
Restructuring charges | | | 22.3 | | | | 20.5 | | | | 0.8 | | | | 1.0 | |
Cash payments | | | (13.1 | ) | | | (12.3 | ) | | | (0.8 | ) | | | — | |
Non-cash adjustments | | | (1.6 | ) | | | — | | | | — | | | | (1.6 | ) |
Acquired | | | 3.6 | | | | 0.9 | | | | 2.7 | | | | — | |
Foreign currency impact | | | 0.1 | | | | 0.1 | | | | — | | | | — | |
Balance at December 31, 2023 | | $ | 13.1 | | | $ | 9.6 | | | $ | 2.9 | | | $ | 0.6 | |
Restructuring charges | | | 24.7 | | | | 13.1 | | | | 6.1 | | | | 5.5 | |
Cash payments | | | (24.2 | ) | | | (17.8 | ) | | | (6.4 | ) | | | — | |
Non-cash adjustments | | | (5.6 | ) | | | — | | | | — | | | | (5.6 | ) |
Foreign currency impact | | | (0.3 | ) | | | (0.3 | ) | | | 0.0 | | | | — | |
Balance at December 31, 2024 | | $ | 7.7 | | | $ | 4.6 | | | $ | 2.6 | | | $ | 0.5 | |
Bruker Cellular Analysis or BCA:
In October 2023, the Company announced a restructuring plan associated with BCA (formerly PhenomeX), a component of the NANO reportable segment, to optimize costs and to facilitate integration efforts. The restructuring plan includes a reduction in headcount, consolidation of leased facilities, and a planned change in future product offerings. The restructuring plan is expected to be completed during 2025.
During the years ended December 31, 2024 and 2023, in connection with the BCA restructuring plan, the Company recorded and accrued severance and termination charges of $9.0 million and $14.9 million respectively, and made payments of $15.1 million $9.8 respectively.
Furthermore, during the years ended December 31, 2024 and 2023, the Company recorded an impairment charge against operating lease right of use assets of $1.5 million and $3.2 million respectively as it relates to the consolidation of leased BCA facilities. During the year ended December 31, 2023, the Company recorded an impairment charge against various equipment of $2.3 million in connection with the planned change of future product offerings. No impairment charge against equipment was recorded in 2024.
Certain inventories that are expiring or have expired will no longer be usable for the manufacture of products. During the year ended December 31, 2024, the Company charged $4.7 million to product restructuring costs due to scrapping of expired or expiring inventories.
Other:
In April 2024, the Company announced a global restructuring program to reduce personnel costs affecting the BBIO, NANO and CALID Segments. The Company recorded and accrued severance and termination charges of $4.6 million and made payments of $3.4 million during the year ended December 31, 2024. The remaining balance of accrued severance at December 31, 2024 is expected to be paid during the first half of 2025. In connection with this restructuring plan, the Company closed one of its R&D facilities and recorded an impairment charge of $0.4 million for one of its technology intangible assets for the year ended December 31, 2024.
Other restructuring programs relating to reductions in workforce recorded by the BSI NANO, BSI BioSpin, BSI CALID and Corporate segments in 2024 and 2023 were not material.
13. Interest and Other Income (Expense), Net
The components of interest and other income (expense), net, were as follows (in millions):
| | | | | | | | | | | | |
| | 2024 | | | 2023 | | | 2022 | |
Interest income | | $ | 9.3 | | | $ | 7.5 | | | $ | 2.8 | |
Interest expense | | | (47.9 | ) | | | (16.4 | ) | | | (16.1 | ) |
Impairment of minority investments | | | (24.6 | ) | | | (18.2 | ) | | | — | |
Exchange gains (losses) on foreign currency transactions, net | | | 23.7 | | | | (13.3 | ) | | | (5.8 | ) |
Defined benefit pension components, excluding service cost | | | 1.3 | | | | (0.1 | ) | | | (1.0 | ) |
Other income (expense) | | | — | | | | 3.7 | | | | 1.3 | |
Interest and other income (expense), net | | $ | (38.2 | ) | | $ | (36.8 | ) | | $ | (18.8 | ) |
14. Income Taxes
The domestic and foreign components of income (loss) before income taxes for the years ended December 31 (in millions):
| | | | | | | | | | | | |
| | 2024 | | | 2023 | | | 2022 | |
Domestic | | $ | (250.2 | ) | | $ | 0.7 | | | $ | (13.3 | ) |
Foreign | | | 457.1 | | | | 543.5 | | | | 427.2 | |
Total income before provision for income taxes | | $ | 206.9 | | | $ | 544.2 | | | $ | 413.9 | |
The components of the income tax provision for the years ended December 31 (in millions):
| | | | | | | | | | | | |
| | 2024 | | | 2023 | | | 2022 | |
Current income tax expense (benefit): | | | | | | | | | |
Federal | | $ | 7.3 | | | $ | 2.3 | | | $ | (10.4 | ) |
State | | | 3.7 | | | | 2.4 | | | | 2.5 | |
Foreign | | | 144.2 | | | | 138.7 | | | | 135.3 | |
Total current income tax expense | | | 155.2 | | | | 143.4 | | | | 127.4 | |
Deferred income tax (benefit) expense : | | | | | | | | | |
Federal | | | (45.2 | ) | | | (18.1 | ) | | | (3.1 | ) |
State | | | (4.3 | ) | | | (4.8 | ) | | | (1.7 | ) |
Foreign | | | (14.3 | ) | | | (2.8 | ) | | | (6.2 | ) |
Total deferred income tax benefit | | | (63.8 | ) | | | (25.7 | ) | | | (11.0 | ) |
Income tax provision | | $ | 91.4 | | | $ | 117.7 | | | $ | 116.4 | |
The income tax provision differs from the tax provision computed at the U.S. federal statutory rate due to the following significant components:
| | | | | | | | | | | | |
| | 2024 | | | 2023 | | | 2022 | |
Statutory tax rate | | | 21.0 | % | | | 21.0 | % | | | 21.0 | % |
Foreign tax rate differential | | | 6.6 | % | | | 3.5 | % | | | 5.2 | % |
Permanent differences | | | 3.3 | % | | | 2.1 | % | | | 1.1 | % |
Contingent liability | | | 4.8 | % | | | — | | | | — | |
U.S. tax on foreign earnings | | | 5.4 | % | | | 1.0 | % | | | (0.1 | )% |
Stock compensation | | | (0.6 | )% | | | (0.3 | )% | | | (0.6 | )% |
Tax contingencies | | | 2.2 | % | | | — | | | | 3.3 | % |
Change in tax rates | | | (1.0 | )% | | | 0.1 | % | | | 0.1 | % |
Repatriation of foreign earnings | | | 1.7 | % | | | 1.0 | % | | | 0.2 | % |
State income taxes, net of federal benefits | | | (1.0 | )% | | | (0.6 | )% | | | 0.2 | % |
Research and development credits | | | (8.6 | )% | | | (2.0 | )% | | | (2.1 | )% |
Tax impact on bargain purchase gain | | | 0.8 | % | | | (5.6 | )% | | | — | |
Return to provision adjustments | | | 3.1 | % | | | 0.3 | % | | | (0.5 | )% |
Withholding taxes and other taxes | | | 3.2 | % | | | — | | | | 0.3 | % |
Other | | | 1.1 | % | | | (0.2 | )% | | | 0.1 | % |
Change in valuation allowance | | | 2.2 | % | | | 1.3 | % | | | (0.1 | )% |
Effective tax rate | | | 44.2 | % | | | 21.6 | % | | | 28.1 | % |
The tax effect of temporary items that give rise to significant portions of the deferred tax assets and liabilities are as follows (in millions):
| | | | | | | | |
| | 2024 | | | 2023 | |
Deferred tax assets: | | | | | | |
Accrued expenses | | $ | 9.8 | | | $ | 5.8 | |
Compensation | | | 32.7 | | | | 20.5 | |
Section 174 capitalization | | | 68.2 | | | | 50.5 | |
Disallowed interest carryforwards | | | 56.7 | | | | 20.7 | |
Net operating loss carryforwards | | | 200.8 | | | | 180.5 | |
Foreign tax and other tax credit carryforwards | | | 24.3 | | | | 16.7 | |
Unrealized currency gain/loss | | | 24.4 | | | | 18.6 | |
Inventory | | | 3.3 | | | | 5.5 | |
Hedge unrealized FX gain/loss | | | 1.5 | | | | 22.5 | |
Lease liabilities | | | 35.6 | | | | 22.8 | |
Other | | | 10.4 | | | | 7.5 | |
Gross deferred tax assets | | | 467.7 | | | | 371.6 | |
Less valuation allowance | | | (60.4 | ) | | | (13.8 | ) |
Total deferred tax assets | | | 407.3 | | | | 357.8 | |
Deferred tax liabilities: | | | | | | |
Accounts payable | | | — | | | | 6.6 | |
Deferred revenue | | | 0.7 | | | | 2.6 | |
Fixed assets | | | 16.4 | | | | 17.2 | |
Foreign patent reserves | | | 0.8 | | | | 1.8 | |
Intangibles | | | 172.1 | | | | 64.1 | |
Accrued expenses | | | 4.5 | | | | 3.1 | |
Accrued withholding tax | | | 9.6 | | | | 10.2 | |
Right-of-use asset | | | 35.5 | | | | 21.5 | |
Other | | | — | | | | 1.1 | |
Total deferred tax liabilities | | | 239.6 | | | | 128.2 | |
Net deferred tax assets | | $ | 167.7 | | | $ | 229.6 | |
The Company uses the liability method to account for income taxes. Under this method, deferred income taxes are recognized for the future tax consequences of differences between the tax and financial accounting bases of assets and liabilities at each reporting
period. Deferred income taxes are based on enacted tax laws and statutory tax rates applicable to the period in which these differences are expected to affect taxable income. A valuation allowance is established when necessary to reduce deferred tax assets to the expected realizable amounts.
The Company can only recognize a deferred tax asset to the extent this it is “more likely than not” that these assets will be realized. Judgments around realizability depend on the availability and weight of both positive and negative evidence. Changes in the valuation allowance for deferred tax assets were as follows (in millions):
| | | | |
Balance at December 31, 2021 | | $ | 7.1 | |
Decreases recorded for valuation allowance release | | | (0.5 | ) |
Balance at December 31, 2022 | | | 6.6 | |
Increases recorded as an expense to income tax provision | | | 7.2 | |
Balance at December 31, 2023 | | | 13.8 | |
Increases recorded as an expense to income tax provision | | | 3.8 | |
Increases recorded through purchase accounting | | | 42.8 | |
Balance at December 31, 2024 | | $ | 60.4 | |
During 2024, the Company recorded a valuation allowance of $42.8 million through purchase accounting on cumulative losses that were not likely to be realized. The majority of the $42.8 million relates to the acquisition of the ELITechGroup.
As of December 31, 2024, the Company has approximately $593.5 million of U.S. federal net operating loss carryforwards, of which $33.8 million begin to expire at various dates beginning in 2033 and the remainder $559.7 million will be carried forward indefinitely. The Tax Cuts and Jobs Act (TCJA) enacted on December 22, 2017, limits a taxpayer’s ability to utilize NOL deduction in a year to 80% taxable income for federal NOL arising in tax years beginning after 2017. The Company has approximately $184.6 million of state net operating loss carryforwards available to reduce state taxable income that are expected to expire at various times beginning in 2025. The Company also has approximately $107.3 million of German Trade Tax and Corporate Income Tax net operating losses that are carried forward indefinitely. Additionally, the Company has $122.8 million of other foreign net operating losses that are expected to expire at various times in the future. The Company has U.S. federal foreign tax credit carried forwards in the amount of $3.1 million. The Company also has U.S. federal and state research and development tax credit of $7.7 million and $11.2 million respectively. Utilization of these credits and net operating losses may be subject to annual limitations due to the ownership percentage change limitations provided by the Code Section 382 and similar state provisions. In the event of a deemed change in control under Code Section 382, an annual limitation on the utilization of net operating losses and credits may result in the expiration of all or a portion of the net operating loss and credit carryforwards. Additionally, the Company has $152.4 million of gross interest expense carryforward as provided by Code Section 163(j) that can be carried forward indefinitely.
At December 31, 2024 the Company recorded state income and foreign withholding taxes on the cash and liquid assets portion of the unremitted earnings and profits (E&P) of foreign subsidiaries expected to be repatriated from its foreign subsidiaries to the United States, except for amounts from certain subsidiaries, which the Company has asserted to be indefinitely reinvested. Specifically, the Company asserts that a total of $4.1 billion of unremitted foreign earnings is indefinitely reinvested. This figure is comprised of $2.3 billion in unremitted earnings as well as $1.8 billion of non-cash E&P in all jurisdictions not indefinitely reinvested. If this E&P is ultimately distributed to the United States in the form of dividends the Company would likely be subject to additional withholding tax. The Company estimates the amount of unrecognized deferred withholding taxes on the undistributed E&P to be approximately $104.2 million at December 31, 2024.
The Company had gross unrecognized tax benefits, excluding interest, of approximately $63.7 million as of December 31, 2024, that if recognized, would reduce the Company’s effective tax rate. In the next twelve months it is reasonably possible that the
Company will reduce its unrecognized tax benefits by an immaterial amount due to the expiration of statutes of limitations. A tabular reconciliation of the Company’s gross unrecognized tax benefits is as follows (in millions):
| | | | |
Gross unrecognized tax benefits at December 31, 2021 | | $ | 51.4 | |
Gross decreases—tax positions in prior periods | | | (8.2 | ) |
Gross increases—current period tax positions | | | 11.7 | |
Gross unrecognized tax benefits at December 31, 2022 | | | 54.9 | |
Gross decreases—tax positions in prior periods | | | (3.8 | ) |
Gross increases—current period tax positions | | | 7.4 | |
Gross unrecognized tax benefits at December 31, 2023 | | | 58.5 | |
Gross decreases—tax positions in prior periods | | | (1.8 | ) |
Gross increases—current period tax positions | | | 7.0 | |
Gross unrecognized tax benefits at December 31, 2024 | | $ | 63.7 | |
The Company’s policy is to include accrued interest and penalties related to unrecognized tax benefits and income tax liabilities, when applicable, in income tax expense. At December 31, 2024 and 2023, the Company had approximately $5.3 million and $5.8 million, respectively, of accrued interest and penalties related to uncertain tax positions included in other long-term liabilities in the consolidated balance sheets. The Company recorded expense of $1.1 million and $1.3 million during the years ended December 31, 2024 and 2023, respectively, for penalties and interest related to unrecognized tax benefits in the provision for income taxes.
The Company files tax returns in the United States, which includes federal, state and local jurisdictions, and many foreign jurisdictions with varying statutes of limitations. The Company considers Germany, the United States and Switzerland to be its significant tax jurisdictions. The majority of the Company’s earnings are derived in Germany and Switzerland. Accounting for the various federal and local taxing authorities, the statutory rates for 2024 were approximately 30.0% and 20.0% for Germany and Switzerland, respectively. The mix of earnings in those two jurisdictions resulted in an increase of 9.4% from the U.S. statutory rate of 21% in 2024.
The Company has been subject to tax examinations for the years 2013-2017 with Germany taxing authorities and for the years 2013-2023 in various taxing authorities.
In 2020, the Company was granted an income tax holiday for the manufacturing facility in Malaysia through February 28, 2024. The tax holiday ranges between 100% to 70% with the option to extend the tax holiday if certain conditions are met. During 2024, the Company has applied for an extension. The effect of the tax holiday in Malaysia increased the Company's net income by $5.1 million, $7.6 million and $2.5 million and increased the Company's net income per diluted share by $0.03, $0.05 and $0.01 for the years ended December 31, 2024, 2023 and 2022, respectively.
In connection with the Tax Cuts and Jobs Act (“TCJA”) of 2017, the Company recorded a toll charge liability of $35.4 million and the liability decreased to $20.5 million due to its amended 2017 tax return filed in 2023. Of the $20.5 million liability, approximately $26.5 million has already been paid. As a result, the Company has recorded a receivable in the amount of $6 million as of December 31, 2024.
In August 2022, the President of the United States signed into law the Inflation Reduction Act of 2022 (the “IRA”), a tax and spending package that introduced several tax provisions, including a 15% corporate alternative minimum tax (“CAMT”) on certain large corporations and a 1% excise tax on certain corporate stock repurchases. The IRA provisions, which became effective for the Company beginning on January 1, 2023, did not have a material impact on the Company during the year ended December 31, 2024.
The Organization for Economic Co-operation and Development (OECD) introduced its Pillar Two Framework Model Rules (“Pillar Two”), which provides guidance for a global minimum tax. This framework has been implemented by several jurisdictions, with effect January 1, 2024. The effect of enacted Pillar Two legislation has been included in the results disclosed and did not have a significant impact to the Company’s 2024 income tax provision. The Company continues to monitor jurisdictions that are expected to implement Pillar Two in the future and it is in the process of evaluating the potential impact of the enactment of Pillar Two by such jurisdictions on its consolidated financial statements.
15. Accounts Receivable, Net
Accounts receivable on the consolidated balance sheets are presented net of allowance for doubtful accounts. The following is a summary of the components for allowance for doubtful accounts (in millions):
| | | | |
| | | |
Balance at December 31, 2021 | | $ | 4.2 | |
Additions | | | 1.9 | |
Deductions | | | (0.8 | ) |
Balance at December 31, 2022 | | | 5.3 | |
Additions | | | 1.3 | |
Deductions | | | (2.0 | ) |
Balance at December 31, 2023 | | | 4.6 | |
Additions | | | 3.9 | |
Deductions | | | (2.2 | ) |
Foreign currency impact | | | 0.2 | |
Balance at December 31, 2024 | | $ | 6.5 | |
16. Inventories
Inventories consisted of the following (in millions):
| | | | | | | | |
| | 2024 | | | 2023 | |
Raw materials | | $ | 388.7 | | | $ | 371.2 | |
Work-in-process | | | 348.9 | | | | 314.9 | |
Finished goods | | | 228.5 | | | | 183.9 | |
Demonstration units | | | 101.7 | | | | 98.3 | |
Total Inventories | | $ | 1,067.8 | | | $ | 968.3 | |
Finished goods include in-transit systems that have been shipped to the Company’s customers but not yet installed and accepted by the customer. At December 31, 2024, and 2023, finished goods inventory-in-transit was $53.6 million and $48.6 million, respectively.
17. Other Current and Long-term Assets
Other current assets consisted of the following (in millions):
| | | | | | | | |
| | December 31,
2024 | | | December 31,
2023 | |
Unbilled receivables | | $ | 93.6 | | | $ | 82.6 | |
Income and other taxes receivable (note 14) | | | 34.5 | | | | 45.9 | |
Prepaid expenses | | | 35.1 | | | | 26.7 | |
Deposits with vendors | | | 26.1 | | | | 28.8 | |
Interest rate cross-currency swap agreements (note 23) | | | 10.7 | | | | 12.0 | |
Lease receivable | | | 7.6 | | | | 1.2 | |
Other assets | | | 28.9 | | | | 18.4 | |
Other current assets | | $ | 236.5 | | | $ | 215.6 | |
Other long-term assets consisted of the following (in millions):
| | | | | | | | |
| | December 31,
2024 | | | December 31,
2023 | |
Minority and equity method investments (note 5) | | $ | 113.6 | | | $ | 81.0 | |
Income and other taxes receivable (note 14) | | | 82.5 | | | | 77.2 | |
Interest rate cross-currency swap agreements (note 23) | | | 11.1 | | | | 8.3 | |
Lease receivable | | | 4.3 | | | | 1.9 | |
Other assets | | | 21.2 | | | | 15.6 | |
Other long-term assets | | $ | 232.7 | | | $ | 184.0 | |
18. Property, Plant and Equipment, Net
The following is a summary of property, plant and equipment, net by major asset class (in millions):
| | | | | | | | |
| | 2024 | | | 2023 | |
Land | | $ | 47.5 | | | $ | 38.9 | |
Building and leasehold improvements | | | 540.7 | | | | 498.1 | |
Machinery, equipment, software and furniture and fixtures | | | 640.1 | | | | 586.9 | |
| | | 1,228.3 | | | | 1,123.9 | |
Less accumulated depreciation and amortization | | | (559.0 | ) | | | (524.2 | ) |
Property, plant and equipment, net | | $ | 669.3 | | | $ | 599.7 | |
Depreciation expense, which includes the amortization of finance lease right-of-use assets and leasehold improvements, for the years ended December 31, 2024, 2023 and 2022 was $84.7 million, $67.8 million and $51.6 million, respectively.
19. Leases
Operating lease cost is recognized over the lease term on a straight-line basis, while finance lease cost is amortized over the expected term on a straight-line basis. Variable lease costs, not dependent on an index or rate, are recognized when incurred and typically consists of amounts owed by the Company to a lessor that are not fixed, such as reimbursement for common area maintenance and utilities cost.
The components of lease expense were as follows (in millions):
| | | | | | | | | | | | |
| | 2024 | | | 2023 | | | 2022 | |
Amortization of right-of-use assets | | $ | 4.6 | | | $ | 4.1 | | | $ | 3.3 | |
Interest on lease liabilities | | | 0.9 | | | | 1.0 | | | | 0.6 | |
Total finance lease cost | | | 5.5 | | | | 5.1 | | | | 3.9 | |
Operating lease cost | | | 45.4 | | | | 31.4 | | | | 20.4 | |
Short term lease cost | | | 5.7 | | | | 4.4 | | | | 5.6 | |
Variable lease cost | | | 8.1 | | | | 6.2 | | | | 5.0 | |
Impairment expense | | | 1.3 | | | | 3.2 | | | | — | |
Sublease income | | | (2.3 | ) | | | (2.0 | ) | | | (1.7 | ) |
Total lease cost | | $ | 63.7 | | | $ | 48.3 | | | $ | 33.2 | |
Supplemental balance sheet information related to leases was as follows (in millions of dollars unless otherwise noted):
| | | | | | | | |
| | December 31, | |
| | 2024 | | | 2023 | |
Operating leases | | | | | | |
Operating lease assets | | $ | 145.5 | | | $ | 91.7 | |
Other current liabilities | | | 32.1 | | | | 23.3 | |
Operating lease liability - long term | | | 118.9 | | | | 74.8 | |
Weighted average remaining lease term | | 6.9 years | | | 5.5 years | |
Weighted average discount rate | | | 5.7 | % | | | 5.3 | % |
Finance leases | | | | | | |
Property, plant and equipment, net | | $ | 18.8 | | | $ | 21.9 | |
Current portion of long-term debt | | | 4.6 | | | | 5.1 | |
Long-term debt | | | 12.9 | | | | 15.8 | |
Weighted average remaining lease term | | 6.9 years | | | 7.4 years | |
Weighted average discount rate | | | 4.7 | % | | | 4.6 | % |
Supplemental cash flow information related to leases was as follows (in millions):
| | | | | | | | | | | | |
| | 2024 | | | 2023 | | | 2022 | |
Cash paid for amounts included in the measurement of lease liabilities | | | | | | | | | |
Operating cash flows from finance leases | | $ | 0.9 | | | $ | 0.9 | | | $ | 0.6 | |
Operating cash flows from operating leases | | | 36.7 | | | | 24.0 | | | | 20.1 | |
Financing cash flows from finance leases | | | 5.5 | | | | 5.0 | | | | 3.3 | |
Right-of-use assets obtained in exchange for lease liabilities | | | | | | | | | |
Operating leases | | $ | 94.7 | | | $ | 73.5 | | | $ | 22.8 | |
Finance leases | | | 3.8 | | | | 11.3 | | | | 13.6 | |
Future lease payments under operating leases and finance leases as follows (in millions):
| | | | | | | | |
| | Operating Leases | | | Finance Leases | |
Twelve months ended December 31: | | | | | | |
2025 | | $ | 39.2 | | | $ | 5.3 | |
2026 | | | 30.8 | | | | 3.9 | |
2027 | | | 24.4 | | | | 2.2 | |
2028 | | | 19.8 | | | | 1.4 | |
2029 | | | 15.9 | | | | 1.0 | |
Thereafter | | | 58.1 | | | | 6.0 | |
Total undiscounted lease payments | | | 188.2 | | | | 19.8 | |
Less: imputed interest | | | (37.2 | ) | | | (2.3 | ) |
Total lease liabilities | | $ | 151.0 | | | $ | 17.5 | |
20. Other Current and Long-term Liabilities
The following is a summary of other current liabilities (in millions):
| | | | | | | | |
| | 2024 | | | 2023 | |
Accrued compensation | | $ | 187.8 | | | $ | 166.5 | |
Income taxes payable (note 14) | | | 119.6 | | | | 138.7 | |
Accrued warranty | | | 32.6 | | | | 30.0 | |
Other taxes payable (note 14) | | | 22.9 | | | | 18.7 | |
Distributor commissions | | | 6.3 | | | | 8.4 | |
Operating lease liabilities (note 19) | | | 32.1 | | | | 23.3 | |
Legal and professional fees | | | 20.2 | | | | 17.1 | |
Hybrid instruments liability (note 25) | | | — | | | | 14.1 | |
Acquisition-related litigation costs (note 26) | | | 86.0 | | | | 4.3 | |
Accrued interest | | | 10.0 | | | | 4.3 | |
Other accrued expenses | | | 59.0 | | | | 52.8 | |
Other current liabilities | | $ | 576.5 | | | $ | 478.2 | |
The following table sets forth the changes in accrued warranty (in millions):
| | | | |
| | | |
Balance at December 31, 2021 | | $ | 23.8 | |
Accruals for warranties issued during the year | | | 12.9 | |
Settlements of warranty claims | | | (10.9 | ) |
Foreign currency impact | | | (1.1 | ) |
Balance at December 31, 2022 | | | 24.7 | |
Accruals for warranties issued during the year | | | 16.8 | |
Settlements of warranty claims | | | (12.4 | ) |
Foreign currency impact | | | 0.9 | |
Balance at December 31, 2023 | | | 30.0 | |
Accruals for warranties issued during the year | | | 20.4 | |
Settlements of warranty claims | | | (16.0 | ) |
Foreign currency impact | | | (1.8 | ) |
Balance at December 31, 2024 | | $ | 32.6 | |
The following is a summary of other long-term liabilities (in millions):
| | | | | | | | |
| | 2024 | | | 2023 | |
Income and other taxes payable (note 14) | | $ | 73.9 | | | $ | 64.4 | |
Hybrid instruments liability (note 25) | | | 78.1 | | | | 56.5 | |
Accrued Pension (note 10) | | | 103.0 | | | | 76.6 | |
Other | | | 56.0 | | | | 42.7 | |
Other long-term liabilities | | $ | 311.0 | | | $ | 240.2 | |
21. Debt
The Company’s debt obligations consist of the following (in millions):
| | | | | | | | |
| | 2024 | | | 2023 | |
2024 term loan agreements: | | | | | | |
CHF loan due 2027 | | $ | 162.1 | | | $ | — | |
CHF loan due 2029 | | | 162.1 | | | | — | |
CHF loan due 2031 (b) | | | 165.2 | | | | — | |
2019 term loan agreement: | | | | | | |
USD loan annual payments of $15.0 and balloon payment due December 2026 | | | 263.3 | | | | 278.3 | |
Note Purchase Agreements (NPA – Senior notes): | | | | | | |
2024 notes due April 15, 2034 - CHF 50 million 2.56% (b) | | | 55.1 | | | | — | |
2024 notes due April 15, 2036 - CHF 146 million 2.62% and CHF 50 million 2.60% (b) | | | 215.9 | | | | — | |
2024 notes due April 15, 2039 - CHF 135 million 2.71% and CHF 50 million 2.62% (b) | | | 203.8 | | | | — | |
2021 notes due December 8, 2031 - CHF 300 million 0.88% (b) | | | 330.5 | | | | 356.9 | |
2019 notes due December 11, 2029 - CHF 297 million 1.01% (b) | | | 327.2 | | | | 353.3 | |
2021 notes due December 8, 2031 - EUR 150 million 1.03% (b) | | | 155.3 | | | | 165.8 | |
2012 notes due January 18, 2024 - $300 million 4.46% (b) | | | — | | | | 100.0 | |
CHF revolving loan (in U.S. Dollars) under the 2024 Revolving Credit Agreement (c) | | | 27.5 | | | | — | |
Other loans | | | 11.9 | | | | 7.6 | |
Unamortized debt issuance costs | | | (3.1 | ) | | | (1.3 | ) |
Total notes and loans outstanding (a) | | $ | 2,076.8 | | | $ | 1,260.6 | |
Finance lease obligations | | | 17.5 | | | | 20.9 | |
Total debt | | $ | 2,094.3 | | | $ | 1,281.5 | |
Current portion of long-term debt and finance lease obligations | | | (32.5 | ) | | | (121.2 | ) |
Total long-term debt, less current portion | | $ | 2,061.8 | | | $ | 1,160.3 | |
(a)As of December 31, 2024 the annual maturities of notes and loans outstanding excluding the impact of unamortized debt issuance costs, are as follows (in millions): 2025: $29.2; 2026: $266.3; 2027: $163.5; 2028: $17.8; 2029: $498.5; and thereafter: $1,104.6.
(b)As of December 31, 2024 and 2023, the fair value of the Company's long-term fixed interest rate debt was $1,278.9 million and $883.3 million as of December 31, 2024, and December 31, 2023, respectively.
(c)Subsequent to December 31, 2024 and up until the date of filing this Annual Report on Form 10K, the Company borrowed CHF 100 million (approximately $109.9 million) and repaid CHF 125 million (approximately $137.9 million) of debt outstanding under the 2024 Amended and Restated Revolving Credit Agreement.
Significant borrowings and repayments:
The following tables summarize the Company’s debt borrowings and repayments for the years ended December 31 (amounts in millions):
| | | | | | | | | | | | | |
| | Year Ended December 31, |
| | 2024 | | | 2023 | | | 2022 | | |
Proceeds from revolving lines of credit: | | | | | | | | | | |
2024 Amended and Restated Credit Agreement | | $ | 981.4 | | | $ | — | | | $ | — | | |
2019 Amended and Restated Credit Agreement (a) | | | 268.9 | | | | — | | | | — | | |
Proceeds from revolving lines of credit - Total | | $ | 1,250.3 | | | $ | — | | | $ | — | | |
| | | | | | | | | | |
Repayments of revolving lines of credit: | | | | | | | | | | |
2024 Amended and Restated Credit Agreement | | $ | (1,212.7 | ) | | $ | — | | | $ | — | | |
Repayments of revolving lines of credit - Total | | $ | (1,212.7 | ) | | $ | — | | | $ | — | | |
| | | | | | | | | | |
Proceeds from long-term debt: | | | | | | | | | | |
CHF notes under various 2024 Note Purchase Agreements | | $ | 472.1 | | | $ | — | | | $ | — | | |
CHF notes under the 2024 Term Loan Agreement | | | 495.6 | | | | — | | | | — | | |
Other | | | 6.0 | | | | 2.0 | | | | 0.3 | | |
Proceeds from long-term debt - Total | | $ | 973.7 | | | $ | 2.0 | | | $ | 0.3 | | |
| | | | | | | | | | |
Repayment of long-term debt: | | | | | | | | | | |
USD notes under the 2012 Note Purchase Agreement | | $ | (100.0 | ) | | $ | — | | | $ | (105.0 | ) | |
USD notes under the 2019 Term Loan Agreement | | | (15.0 | ) | | | (15.0 | ) | | | (6.0 | ) | |
CHF notes under the 2024 Term Loan Agreement | | | (6.4 | ) | | | — | | | | — | | |
Other | | | (14.0 | ) | | | (8.5 | ) | | | — | | |
Repayment of long-term debt - Total | | $ | (135.4 | ) | | $ | (23.5 | ) | | $ | (111.0 | ) | |
a)As detailed below the 2024 Amended and Restated Credit Agreement amended and restated the 2019 Revolving Credit Agreement on January 18, 2024. All balances were transferred to the 2024 Amended and Restated Credit Agreement
Covenants:
As of December 31, 2024, the Company was in compliance with all financial covenants of all debt agreements. The Company’s debt agreements’ covenants consist of customary affirmative and negative covenants, including, among others, restrictions on the Company’s ability to incur liens, transfer or sell equity or assets, engage in certain mergers and consolidations, enter into transactions with affiliates, and engage or permit any subsidiary to engage in certain lines of business. They also include customary representations and warranties and events of default. The events of default include, among others, payment defaults, defaults in the performance of affirmative and negative covenants, the inaccuracy of representations and warranties, bankruptcy and insolvency related events, certain ERISA events, material judgments, and the occurrence of a change of control.
Interest expense:
Interest expense for the year ended December 31, 2024, 2023 and 2022 was $47.9 million, $16.4 million, and $16.1 million respectively.
During 2022, the Company adopted the practical expedient for Reference Rate Reform related to its debt arrangements and as such, these amendments are treated as a continuation of the existing debt agreement and no gain or loss on the modification was recorded. The Company did not record any gains or losses on the conversion of the reference rate for Borrowings under the Term Loan Agreement from LIBOR to SOFR.
Hedging:
As of December 31, 2024, the Company has several cross-currency and interest rate swap agreements with a notional value of $131.6 million of U.S. to Swiss Franc and a notional value of $131.6 million of U.S. to Euro to hedge the variability in the movement of foreign currency exchange rates on portions of our Euro and Swiss Franc denominated net asset investments. Refer to Note 23, Derivative Instruments and Hedging Activities for more information.
Revolving Credit Facility:
As of December 31, 2024, the maximum commitments and net amounts available under (i) the 2024 Revolving Credit Agreement and (ii) other lines of credit with various financial institutions located primarily in Germany and Switzerland that are unsecured and typically due upon demand are as follows (dollars in millions):
| | | | | | | | | | | | | | | | | | | | |
| | Weighted
Average
Interest Rate | | | Total Amount
Committed by
Lenders | | | Outstanding
Borrowings | | | Outstanding
Letters of
Credit | | | Total
Committed
Amounts
Available | |
2024 Amended and Restated Credit
Agreement | | | 0.69 | % | | $ | 900.0 | | | $ | 27.5 | | | $ | 0.3 | | | $ | 872.2 | |
Bank guarantees and working capital line | | varies | | | | 159.3 | | | | — | | | | 159.3 | | | | — | |
Total revolving lines of credit | | | | | $ | 1,059.3 | | | $ | 27.5 | | | $ | 159.6 | | | $ | 872.2 | |
Key terms:
An overview of the key terms of each of the term loan agreements, note purchase agreements and revolving credit agreements are described below.
2024 Term Loan Agreements
On March 29, 2024, the Company, as borrower, entered into (i) a term loan agreement (the “Three- and Five-Year Term Loan Agreement”) and (ii) another term loan agreement (the “Seven-Year Term Loan Agreement” and together with the Three- and Five-Year Term Loan Agreement, the “Term Loan Agreements”) with a group of bank lenders.
Each term loan facility has a delayed draw component allowing for up to two borrowings under the relevant loan facility during the period from and including the effective date to the earlier of (i) September 30, 2024 and (ii) the date of termination of the commitments by the Administrative Agent during the continuance of an Event of Default as defined in the applicable Term Loan Agreement.
Amounts outstanding under the 2024 Term Loan Agreements bear interest at a rate equal to (a) the Swiss Average Rate Overnight (SARON), plus a margin ranging from (i) 1.000% to 1.500% in the case of the three- and five-year term loan facilities and (ii) 1.250% to 1.750% in the case of the seven-year term loan facilities, in each case, based on the Company’s leverage ratio, provided, however, that if the loans are required to bear interest determined by reference to an Alternate Base Rate (“ABR Loans”), then such ABR Loans shall bear interest equal to (i) the federal funds effective rate plus ½ of 1%, (ii) the prime rate announced by Bank of America, N.A., and (iii) 1%, plus a margin ranging from 0.100% to 0.200%, based on the Company’s leverage ratio.
Loans under the 2024 Term Loan Agreements will be repayable in full at maturity, subject to scheduled quarterly amortization payments on (i) the three-year and five-year term loan facilities beginning in June 2024 and (ii) the seven-year term loan facility beginning in June 2026, and, in each case, may also be prepaid at the Company’s option in whole or in part without premium or penalty. In addition, obligations are unsecured and are fully and unconditionally guaranteed by certain of the Company’s subsidiaries.
The other terms of the 2024 Term Loan Agreements are substantially similar to the terms of the 2024 Revolving Credit Agreement, including representations and warranties, affirmative, negative and financial covenants, events of default, and leverage and interest coverage ratio.
2019 Term Loan Agreement
On December 11, 2019, the Company, together with certain of its subsidiaries, as borrowers, entered into a term loan agreement for a $300 million seven-year term loan facility. Loans under the 2019 Term Loan Agreement will be repayable in full at maturity, December 11, 2026), subject to scheduled amortization that began in 2022, and may also be prepaid at the Company’s option in whole or in part without premium or penalty. In addition, obligations under are unsecured and are fully and unconditionally guaranteed by certain of the Company’s subsidiaries.
Amounts outstanding under the 2019 Term Loan Agreement bear interest at a rate equal to, at the Company’s option, (a) the U.S. Dollar London Interbank Offered Rate (USD LIBOR), plus a margin ranging from 1.000% to 1.500%, based on the Company’s leverage ratio, or (b) the highest of (i) the federal funds effective rate plus 1⁄2 of 1%, (ii) the prime rate announced by Bank of America, N.A., and (iii) USD LIBOR, as adjusted, plus 1%, plus a margin ranging from 0.100% to 0.500%, based on the Company’s leverage ratio.
The other terms of the 2019 Term Loan Agreements are substantially similar to the terms of the 2024 Revolving Credit Agreement, including representations and warranties, affirmative, negative and financial covenants, events of default, and leverage and interest coverage ratio.
Notes Purchase Agreements (“NPAs” or “Notes”)
The Company has entered into several NPAs with groups of accredited institutional investors including on February 1, 2024, and February 8, 2024 (“2024 Note Purchase Agreements”), December 7, 2021 (“2021 Note Purchase Agreement”) and on December 11, 2019 (“2019 Note Purchase Agreement”).
The key terms associated with these NPAs are as follows:
•Interest is payable semi-annually;
•The Notes are unsecured obligations of the Company and are fully and unconditionally guaranteed by certain of the Company’s subsidiaries.
•The Company may prepay some or all of the Notes at any time in an amount not less than 10% of the aggregate principal amount of the Notes then outstanding at a price equal to the sum of (a) the principal amount to be prepaid, plus accrued and unpaid interest, (b) any applicable “make-whole” amount, and (c) certain other fees and expenses. In the event of a change in control (as defined in the NPAs) of the Company, the Company may be required to prepay the Notes at a price equal to 100% of the principal amount thereof, plus accrued and unpaid interest and certain other fees and expenses.
The other terms of the NPAs are substantially similar to the terms of the 2024 Revolving Credit Agreement, including representations and warranties, affirmative, negative and financial covenants, events of default, and leverage and interest coverage ratio.
2024 Amended and Restated Credit Agreement:
On January 18, 2024, the Company and certain subsidiaries entered into an agreement that amended and restated the 2019 Revolving Credit Agreement which was entered into on December 11, 2019. This resulted in the aggregate amount available to draw increasing to $900 million from $600 million and an extension of the maturity date to January 18, 2029, as may be further extended by the Company for the periods and on the terms set forth in the 2024 Amended and Restated Credit Agreement (‘2024 RCA’).
In addition, the 2024 RCA increases the uncommitted incremental facility whereby, under certain circumstances, the Company may, at its option, increase the amount of the revolving facility or incur term loans in an aggregate amount not to exceed $400 million. Amounts outstanding under the 2024 RCA bear interest at a rate equal to, at the Company’s option, (a) the Secured Overnight Financing Rate (“SOFR”) applicable to the relevant currency, plus a margin ranging from 1.000% to 1.500%, based on the Company’s leverage ratio, or (b) the highest of (i) the federal funds effective rate plus 0.5%, (ii) the prime rate announced by Bank of America, N.A., and (iii) SOFR, as adjusted, plus 1.00%, plus a margin rate ranging from 0.000% to 0.500%, based on the Company’s leverage ratio. The Company has also agreed to pay a quarterly facility fee based on the aggregate amount available under the 2019 Revolving Credit Agreement ranging from 0.100% to 0.200%, based on the Company’s leverage ratio.
The 2024 RCA includes affirmative, negative and financial covenants and events of default customary for financings of this type. The negative covenants include, among others, restrictions on liens, indebtedness of the Company and its subsidiaries, asset sales, dividends, and transactions with affiliates not approved under the agreements. The financial covenants require the Company to maintain a maximum leverage ratio of 3.50 to 1.00 (the “Stated Leverage Ratio” or “SLR”) and a minimum interest coverage of 2:50 to 1.00. In accordance with the terms of the 2024 RCA, the Company can elect to increase the maximum leverage ratio to 4.00 to 1.00, the “Adjusted Leverage Ratio” or “ALR” provided that it shall (1) step down the ALR by 0.25x after two full fiscal quarters following the date of a Material Acquisition, and (2) return to the otherwise SLR after four full fiscal quarters following the date of such Material Acquisition, provided, that the Company may not elect to increase the maximum leverage ratio to the ALR unless there shall be at least one full fiscal quarter immediately prior to such election during which the SLR is in effect.
Proceeds of the 2024 RCA may be used by the Company and its subsidiaries to finance working capital needs, refinance or reduce existing indebtedness and for general corporate purposes, including acquisitions.
22. Fair Value of Financial Instruments
The Company measures the following financial assets and liabilities at fair value on a recurring basis. The following tables set forth the Company’s financial instruments and presents them within the fair value hierarchy using the lowest level of input that is significant to the fair value measurement (in millions):
| | | | | | | | | | | | | | | | |
December 31, 2024 | | Total | | | Quoted Prices
in Active
Markets
Available
(Level 1) | | | Significant
Other
Observable
Inputs
(Level 2) | | | Significant
Unobservable
Inputs
(Level 3) | |
Assets: | | | | | | | | | | | | |
Time deposits and money market funds | | $ | 17.2 | | | $ | — | | | $ | 17.2 | | | $ | — | |
Interest rate and cross-currency swap agreements (note 23) | | | 21.8 | | | | — | | | | 21.8 | | | | — | |
Forward currency contracts | | | 6.0 | | | | — | | | | 6.0 | | | | — | |
Total assets recorded at fair value | | $ | 45.0 | | | $ | — | | | $ | 45.0 | | | $ | — | |
Liabilities: | | | | | | | | | | | | |
Contingent consideration (note 24) | | $ | 17.3 | | | $ | — | | | $ | — | | | $ | 17.3 | |
Hybrid instruments liabilities (note 25) | | | 78.1 | | | | — | | | | — | | | | 78.1 | |
Interest rate and cross-currency swap agreements (note 23) | | | 17.2 | | | | — | | | | 17.2 | | | | — | |
Forward currency contracts | | | 0.5 | | | | — | | | | 0.5 | | | | — | |
Equity interest purchase option liability (a) | | | 14.9 | | | | — | | | | — | | | | 14.9 | |
Total liabilities recorded at fair value | | $ | 128.0 | | | $ | — | | | $ | 17.7 | | | $ | 110.3 | |
a)Equity interest purchase option liability is related to NovAliX, refer to Note 5, Minority and equity-method investments for more information
| | | | | | | | | | | | | | | | |
December 31, 2023 | | Total | | | Quoted Prices
in Active
Markets
Available
(Level 1) | | | Significant
Other
Observable
Inputs
(Level 2) | | | Significant
Unobservable
Inputs
(Level 3) | |
Assets: | | | | | | | | | | | | |
Time deposits and money market funds | | $ | 226.9 | | | $ | — | | | $ | 226.9 | | | $ | — | |
Interest rate and cross-currency swap agreements (note 23) | | | 20.3 | | | | — | | | | 20.3 | | | | — | |
Forward currency contracts | | | 1.3 | | | | — | | | | 1.3 | | | | — | |
Total assets recorded at fair value | | $ | 248.5 | | | $ | — | | | $ | 248.5 | | | $ | — | |
Liabilities: | | | | | | | | | | | | |
Contingent consideration (note 24) | | $ | 12.3 | | | $ | — | | | $ | — | | | $ | 12.3 | |
Hybrid instruments liabilities (note 25) | | | 70.5 | | | | — | | | | — | | | | 70.5 | |
Interest rate and cross-currency swap agreements (note 23) | | | 26.8 | | | | — | | | | 26.8 | | | | — | |
Forward currency contracts | | | 0.6 | | | | — | | | | 0.6 | | | | — | |
Total liabilities recorded at fair value | | $ | 110.2 | | | $ | — | | | $ | 27.4 | | | $ | 82.8 | |
23. Derivative Instruments and Hedging Activities
The Company's major exposures relate to foreign exchange rate, interest rate and commodity price risks. Risk management activities related to these risks are as follows:
Foreign Exchange Rate Risk:
The Company’s exposure to foreign exchange rate risk includes translation risk as a result of non-U.S. operations having functional currencies other than the U.S. dollar, which is managed by cross-currency interest rate swap agreements and long-term debt designated as net investment hedges. As of December 31, 2024, the Company had several cross-currency interest rate swap agreements that qualify for hedge accounting with a notional value of $131.6 million of U.S. to Swiss Franc and a notional value of $131.6 million of U.S. to Euro to hedge the variability in the movement of foreign currency exchange rates on portions of our Euro and Swiss Franc denominated net asset investments. The before tax gains and losses related to hedges of net asset investments in international operations that were recorded within the cumulative translation adjustment section of other comprehensive income were loss of $89.1 for the year ended December 31, 2024, and gains of $100.9 million, and $58.0 million for the years ended December 31, 2023, and 2022 respectively.
In addition, the Company has foreign currency exposure at a transaction level and this is addressed by forward currency contracts for significant exposures, which have not been designated as accounting hedges.
Interest Rate Risk:
The Company’s exposure to interest rate risk relates primarily to outstanding variable rate debt under the U.S. dollar denominated 2019 Term Loan and adverse movements in the related market rates. This exposure is managed as part of a cross-currency interest rate swap which involves the Company paying-fixed receiving-floating. The objective of this designated cash flow hedge is to offset the variability of cash flows on term loan debt interest payments attributable to changes in SOFR, a contractually specified rate. The difference between the interest rate received and paid under the interest rate and cross-currency swap agreements is recorded in interest and other income (expense), net in the consolidated statements of income and comprehensive income.
Commodity Price Risk:
The Company has arrangements with certain customers under which it has a firm commitment to deliver copper-based superconductors at a fixed price. In order to minimize the volatility that fluctuations in the price of copper have on the Company’s sales of these commodities, the Company enters into commodity hedge contracts. As commodity contracts settle, gains (losses) related to changes in fair values are included within revenues.
The Company had the following notional amounts outstanding under foreign exchange contracts, cross-currency interest rate swap agreements and long-term debt designated as net investment hedges and the respective fair value of the instruments recorded in the consolidated balance sheets as follows (in millions):
| | | | | | | | | | | | | | | | |
| | December 31, 2024 | | | December 31, 2023 | |
| | Notional
(in USD) | | | Fair Value | | | Notional
(in USD) | | | Fair Value | |
Derivatives designated as hedging instruments | | | | | | | | | | | | |
Interest rate cross-currency swap agreements | | | | | | | | | | | | |
Other current assets | | | | | $ | 10.7 | | | | | | $ | 12.0 | |
Other assets | | | | | | 11.1 | | | | | | | 8.3 | |
Other long-term liabilities | | | | | | (17.2 | ) | | | | | | (26.8 | ) |
| | $ | 263.3 | | | $ | 4.6 | | | $ | 378.3 | | | $ | (6.5 | ) |
Long-term debt | | | | | | | | | | | | |
Long-term debt | | | 1,453.0 | | | | (8.5 | ) | | | 876.0 | | | | (85.3 | ) |
Total derivatives designated as hedging instruments | | $ | 1,716.3 | | | $ | (3.9 | ) | | $ | 1,254.3 | | | $ | (91.8 | ) |
Derivatives not designated as hedging instruments | | | | | | | | | | | | |
Forward currency contracts | | | | | | | | | | | | |
Other current assets | | $ | 841.9 | | | $ | 6.0 | | | $ | 177.8 | | | $ | 1.3 | |
Other current liabilities | | | 78.6 | | | | (0.5 | ) | | | 311.7 | | | | (0.6 | ) |
Total derivatives not designated as hedging instruments | | $ | 920.5 | | | $ | 5.5 | | | $ | 489.5 | | | $ | 0.7 | |
Total derivatives | | $ | 2,636.8 | | | $ | 1.6 | | | $ | 1,743.8 | | | $ | (91.1 | ) |
The following is a summary of the gain (loss) included in Interest and other income (expense), net in the consolidated statements of income and comprehensive income related to the derivative instruments described above (in millions):
| | | | | | | | | | | | |
| | Year Ended December 31, | |
| | 2024 | | | 2023 | | | 2022 | |
Derivatives not designated as
hedging instruments | | | | | | | | | |
Forward currency contracts | | $ | (1.3 | ) | | $ | 12.4 | | | $ | (3.2 | ) |
Embedded derivatives in purchase and
delivery contracts | | | (1.4 | ) | | | 1.1 | | | | (0.1 | ) |
| | | (2.7 | ) | | | 13.5 | | | | (3.3 | ) |
Derivatives designated as cash flow
hedging instruments | | | | | | | | | |
Interest rate cross-currency swap agreements | | | 10.2 | | | | 10.4 | | | | 0.1 | |
Derivatives designated as net
investment hedging instruments | | | | | | | | | |
Interest rate cross-currency swap agreements | | | 5.6 | | | | 7.9 | | | | 8.5 | |
Total | | $ | 13.1 | | | $ | 31.8 | | | $ | 5.3 | |
The following is a summary of the gain (loss) included in Accumulated other comprehensive income, net of tax in the consolidated statements of income and comprehensive income related to the derivative instruments described above (in millions):
| | | | | | | | | | | | |
| | Year Ended December 31, | |
| | 2024 | | | 2023 | | | 2022 | |
Derivatives designated as cash flow hedging instruments | | | | | | | | | |
Interest rate cross-currency swap agreements | | $ | (3.5 | ) | | $ | (5.5 | ) | | $ | 21.2 | |
Derivatives designated as net investment hedging instruments | | | | | | | | | |
Interest rate cross-currency swap agreements | | | 12.9 | | | | (19.5 | ) | | | 9.1 | |
Long-term debt | | | 58.8 | | | | (52.1 | ) | | | 13.9 | |
| | | 71.7 | | | | (71.6 | ) | | | 23.0 | |
Total | | $ | 68.2 | | | $ | (77.1 | ) | | $ | 44.2 | |
24. Contingent consideration
The following table sets forth the changes in contingent consideration liabilities (in millions):
| | | | |
Balance at December 31, 2022 | | $ | 9.6 | |
Current period additions | | | 2.8 | |
Current period adjustments | | | 7.6 | |
Current period settlements | | | (8.1 | ) |
Foreign currency effect | | | 0.4 | |
Balance at December 31, 2023 | | | 12.3 | |
Current period additions | | | 13.4 | |
Current period adjustments | | | 3.2 | |
Current period settlements | | | (11.2 | ) |
Foreign currency effect | | | (0.4 | ) |
Balance at December 31, 2024 | | $ | 17.3 | |
Changes in fair value subsequent to acquisition are recognized in Acquisition-related expenses, net included in Other Charges, net, in the consolidated statements of income and comprehensive income. Contingent consideration payments in excess of the acquisition date fair value are included in net cash provided by (used in) operating activities, and the remaining amounts are included in net cash provided by (used in) financing activities in the consolidated statements of cash flows. Refer to Note 2, Summary of Significant Accounting Policies for more information on the Company’s policy on contingent consideration.
25. Hybrid instruments liabilities
As part of the 2018 Mestrelab Research, S.L. (“Mestrelab”), 2022 PreOmics, 2023 Biognosys, 2023 Zontal and certain other majority owned acquisitions, the Company entered into agreements with the noncontrolling interest holders that provide the Company with the right to purchase, and the noncontrolling interest holders with the right to sell, the remaining ownerships for cash at contractually defined redemption values. Refer to Note 2, Summary of Significant Accounting Policies for more information on the Company’s policy on hybrid instruments liabilities.
The following table sets forth the changes in hybrid instruments liability (in millions):
| | | | |
Balance at December 31, 2022 | | $ | 34.2 | |
Current period additions | | | 36.1 | |
Current period adjustments | | | (2.1 | ) |
Foreign currency effect | | | 2.3 | |
Balance at December 31, 2023 | | | 70.5 | |
Current period additions | | | — | |
Current period adjustments | | | 24.1 | |
Current period settlements (a) | | | (13.8 | ) |
Foreign currency effect | | | (2.7 | ) |
Balance at December 31, 2024 | | $ | 78.1 | |
(a)On October 1, 2024, the call option for Mestrelab was executed, and Bruker acquired the remaining 19.03% of Mestrelab. As a result of the transaction, Bruker has obtained 100% ownership interest in Mestrelab
The Level 3 fair value measurements of our hybrid instrument liabilities include the following significant unobservable inputs:
| | | | | |
Hybrid Instrument Liabilities | Fair Value as of December 31, 2024 (millions) | Valuation Technique | Unobservable Input | Range | Weighted Average (a) |
Put / Call Options | 78.1 | Option Pricing Model | Revenue Risk Premium | 1.6% - 12.6% | 10.70% |
| | | EBITDA Risk Premium | 10.1% - 25.1% | 21.70% |
a)Unobservable inputs were weighted by the relative fair value of the hybrid instrument liabilities.
26. Commitments and Contingencies
Litigation and Related Contingencies
The Company’s product offerings include technology that is either developed or acquired, and these intellectual property rights, particularly patents, are a significant part of ongoing product development and differentiation. Lawsuits, claims and proceedings of a nature that claim infringement on patent licenses owned by others are considered normal to the business and may be pending from time to time against the Company. Intellectual property litigation is inherently complex and unpredictable. Although monetary and injunctive relief is typically sought, remedies and restitution are generally not determined until the conclusion of the trial court proceedings and can be modified on appeal. Accordingly, the outcomes of individual cases are difficult to time, predict or quantify.
Loss contingency provisions are recorded if the potential loss from any claim, asserted or unasserted, or legal proceeding related to patents, products and other matters, is considered probable and the amount can be reasonably estimated, or a range of loss can be determined. If the estimate of a probable loss is a range and no amount within the range is more likely, management’s best estimate is represented by the minimum amount of the range. Disclosure is provided when a loss is considered probable, but the loss is not reasonably estimable and when a material loss is reasonably possible but not probable. The outcome of any of these proceedings cannot be accurately predicted, and the ultimate resolution of any of these existing matters, net of amounts accrued in the Company's balance sheet, may have a material adverse effect on the Company's business or financial condition.
Third parties might allege that the Company or its collaborators are infringing their patent rights or that the Company is otherwise violating their intellectual property rights. An adverse outcome in any of these proceedings could result in one of more of the following and have material impact on our business or consolidated results of operations and financial position: (i) loss of patent protection; (ii) inability to continue to engage in certain activities; (iii) payment of significant damages, royalties, penalties and/or license fees to third parties; and, (iv) with respect to products acquired through acquisitions accounted for as business combinations, potentially significant intangible asset impairment charges.
At December 31, 2024 and 2023, the accrual for several legal matters that are probable and estimable was $86.0 million and $4.3 million, respectively. In management’s opinion, the Company is not currently involved in any legal proceedings other than those specifically identified below, individually or in the aggregate, that could materially adversely impact our operating results and cash flows. Unless included in our legal accrual or otherwise indicated below, a range of loss associated with any individual material legal proceeding cannot be reasonably estimated. While the Company believes it has meritorious defenses for the matters described below, the ultimate resolution of, or increase in accruals for, one or more of these matters in any reporting period may have a material adverse effect on the Company's results of operations and cash flows for that period.
In connection with the Company’s acquisition of PhenomeX Inc. (“PhenomeX”) on October 2, 2023, the Company’s wholly owned subsidiary, Bruker Cellular Analysis, Inc. (“BCA”), was substituted as a party into the existing patent litigation between PhenomeX and AbCellera Biologics Inc (“AbCellera”) related to PhenomeX’s Beacon instruments and Opto products. The University of British Columbia (“UBC”), the owner and licensor to AbCellera of the asserted patents, is a co-plaintiff in the litigation. The plaintiffs’ complaint seeks unspecified damages and injunctive relief.
In connection with the acquisition of NanoString on May 6, 2024, the Company assumed certain of its liabilities, including the liabilities associated with the litigation matters related to NanoString’s GeoMx Digital Spatial Profiler products (the “GeoMx Matter”) and CosMx Spatial Molecular Imager products (the “CosMx Matter”). In the GeoMx Matter, in November 2023, a jury verdict in the U.S. District Court for the District of Delaware was entered in favor of the plaintiffs, 10x Genomics, Inc. (“10x”) and Prognosys Biosciences, Inc. (collectively, the “Plaintiffs”) awarding damages. On December 23, 2024, the Court issued an order upholding the jury’s damages award, plus interest and a damages true-up for GeoMx sales since the November 2023 verdict, while declining 10x’s request for enhanced damages and attorneys’ fees. The Court stated that it would grant 10x’s request for an injunction against GeoMx products in the United States, while noting that the proposed injunction would include a carve out for sales of consumables to the installed base of GeoMx customers. The Court has not yet issued a final judgment. Once a final judgment is issued, the Company intends to appeal the case to the U.S. Court of Appeals for the Federal Circuit and to seek a stay of any injunction that is ordered while the case is being appealed. The CosMx Matter complaint concerns claims by 10x and the President and Fellows of Harvard College (“Harvard”) of patent infringement with respect to CosMx Spatial Molecular Imager products as well as counterclaims against 10x and Harvard for antitrust and unfair competition violations. The CosMx Matter complaint seeks unspecified damages and injunctive relief.
Governmental Investigations
The Company is subject to regulation by national, state and local government agencies in the United States and other countries in which it operates. From time to time, the Company is the subject of governmental investigations often involving regulatory, marketing and other business practices. These governmental investigations may result in the commencement of civil and criminal
proceedings, fines, penalties and administrative remedies which could have a material adverse effect on the Company’s financial position, results of operations and/or liquidity.
At December 31, 2024, and 2023, no material accruals have been recorded for potential contingencies related to these regulatory matters. However, the resolution of, or increase in accruals for, one or more of these matters in any reporting period may have a material adverse effect on the Company's results of operations and cash flows for that period.
Unconditional Purchase Commitments
The Company has entered into unconditional purchase commitments, in the ordinary course of business, that include agreements to purchase goods, services or fixed assets and to pay royalties that are enforceable and legally binding and that specify all significant terms including: fixed or minimum quantities to be purchased; fixed, minimum or variable price provisions; and the approximate timing of the transaction. Purchase commitments exclude agreements that are cancelable at any time without penalty.
Unconditional purchase commitments that are fixed and determinable are as follows (in millions):
| | | | |
2025 | | $ | 186.2 | |
2026 | | | 26.6 | |
2027 | | | 11.4 | |
2028 | | | 10.0 | |
2029 | | | 13.0 | |
Thereafter | | | — | |
Total | | $ | 247.2 | |
License Agreements
The Company has entered into license agreements allowing it to utilize certain patents. If these patents are used in connection with a commercial product sale, the Company pays royalties on the related product revenues. Licensing fees for the years ended December 31, 2024, 2023, and 2022, were $10.1 million, $7.5 million and $6.4 million, respectively, and are recorded in cost of product revenue in the consolidated statements of income and comprehensive income.
Letters of Credit and Guarantees
At December 31, 2024, and 2023, the Company had bank guarantees of $159.3 million and $153.6 million, respectively, related primarily to customer advances. These arrangements guarantee the refund of advance payments received from customers in the event that the merchandise is not delivered, or warranty obligations are not fulfilled in compliance with the terms of the contract. These guarantees affect the availability of the Company’s lines of credit.
Indemnifications
The Company enters into standard indemnification arrangements in the Company’s ordinary course of business. Pursuant to these arrangements, the Company indemnifies, holds harmless, and agrees to reimburse the indemnified parties for losses suffered or incurred by the indemnified party. These parties are generally the Company’s directors, officers, business partners or customers, in connection with any patent, or any copyright or other intellectual property infringement claim by any third party with respect to its products. The term of these indemnification agreements is generally perpetual any time after the execution of the agreement. The maximum potential amount of future payments the Company could be required to make under these agreements is unlimited. The Company believes the estimated fair value of these agreements is minimal based on historical experiences.
27. Shareholders’ Equity
Share Repurchase Program
In May 2021, the Company’s Board of Directors approved a share repurchase program (the “2021 Repurchase Program”) authorizing the purchase of up to $500.0 million of the Company’s common stock over a two-year period, in amounts, at prices, and at such times as management deems appropriate, subject to market conditions, legal requirements and other considerations. Authorization for the remaining $94.4 million on the 2021 Repurchase Program expired in May 2023.
In May 2023, the Company’s Board of Directors approved a share repurchase program (the “2023 Repurchase Program”) authorizing the purchase of up to $500.0 million of the Company’s common stock over a two-year period, in amounts, at prices, and at
such times as management deems appropriate, subject to market conditions, legal requirements and other considerations. At December 31, 2024, $369.9 million remains available for future purchase under the 2023 Repurchase Program.
During the year ended December 31, 2024, the Company did not purchase any shares under the 2023 Repurchase Program. Subsequent to December 31, 2024 and prior to the date of filing this annual report on Form 10K, the Company purchased 200,731 shares at an aggregate cost of $10 million.
During the year ended December 31, 2023, the Company purchased a total of 2,097,119 shares at an aggregate cost of $130.1 million under the 2023 Repurchase Program.
Public Offering
In May 2024, the Company completed an underwritten public offering (the “Offering”) in which the Company issued and sold 6,000,000 shares of its common stock at a public offering price of $67.29 per share. The Company received net proceeds of approximately $403.0 million after deducting underwriting discounts, commissions and other offering expenses. The net proceeds of this Offering were used to partially fund our strategic acquisitions in 2024.
The Offering was made pursuant to an automatically effective registration statement on Form S-3 and accompanying prospectus filed with the SEC on May 29, 2024 and a final prospectus relating to the Offering, filed with the SEC on May 31, 2024.
Stock Compensation Plans
In May 2016, the Bruker Corporation 2016 Incentive Compensation Plan (the “2016 Plan”) was approved by the Company’s shareholders. With the approval of the 2016 Plan, no further grants will be made under the existing Bruker Corporation 2010 Incentive Compensation Plan (the “2010 Plan”). As of December 31, 2024, 5,545,090 options and 570,011 restricted stock awards have been granted under the 2010 Plan. At December 31, 2024, 134,796 options were outstanding under the 2010 Plan. The 2016 Plan provides for the issuance of up to 9,500,000 shares of the Company’s common stock and permits the grant of awards of non-qualified stock options, incentive stock options, stock appreciation rights, restricted stock, unrestricted stock, restricted stock units, performance shares and performance units, as well as cash-based awards. The 2016 Plan is administered by the Compensation Committee. The Compensation Committee has the authority to determine which employees will receive awards, the amount of any awards, and other terms and conditions of such awards. Stock option awards granted under the 2016 Plan typically vest over a period of one to four years. As of December 31, 2024, 1,765,006 options and 3,199,623 restricted stock units have been granted under the 2016 Plan. At December 31, 2024, 751,897 options and 853,238 restricted stock units were outstanding under the 2016 Plan.
In June 2022, the Company's shareholders approved the 2022 Employee Stock Purchase Plan, under which eligible employees may contribute up to 10% of their earnings toward the semi-annual purchase of the Company's stock. The plan makes available 2,500,000 shares. Each plan enrollment period covers six months beginning June 1 and December 1 of each year. The purchase price per share of the Company's stock is equal to 90% of the lower of (1) the fair market value per share of the Company's stock on the first day of the applicable purchase period or (2) the fair market value per share of the Company's stock on the applicable purchase date, unless otherwise specified by the Plan Administrator before the start of any purchase period.
Members of the Company’s Board of Directors receive an annual award of restricted stock units which vest over a one-year service period. Stock options to purchase the Company’s common stock are periodically awarded to executive officers and other employees of the Company subject to a vesting period of three to four years. Restricted shares of the Company’s common stock were periodically awarded to executive officers, directors and certain key employees of the Company, subject to service restrictions, which vested ratably over periods of one to four years. The restricted shares of common stock may not be sold or transferred during the restriction period. Restricted stock units of the Company’s common stock are periodically awarded to executive officers, directors and certain employees of the Company which vest ratably over service periods of one to four years.
Stock-based Compensation
The following presents the impact of stock-based compensation expense on our consolidated statements of income (in millions):
| | | | | | | | | | | | |
| | 2024 | | | 2023 | | | 2022 | |
Stock options | | $ | 1.9 | | | $ | 1.6 | | | $ | 1.5 | |
Restricted stock units | | | 18.6 | | | | 16.0 | | | | 14.1 | |
Employee Stock Purchase Plan | | | 1.2 | | | | 0.8 | | | | 0.1 | |
Total stock-based compensation | | $ | 21.7 | | | $ | 18.4 | | | $ | 15.7 | |
| | | | | | | | | |
| | 2024 | | | 2023 | | | 2022 | |
Cost of product revenue | | $ | 1.9 | | | $ | 1.4 | | | $ | 1.1 | |
Selling, general and administrative | | | 17.1 | | | | 15.1 | | | | 13.3 | |
Research and development | | | 2.7 | | | | 1.9 | | | | 1.3 | |
Total stock-based compensation | | $ | 21.7 | | | $ | 18.4 | | | $ | 15.7 | |
In addition to the awards above, the Company recorded stock-based compensation within other charges, net of $3.6 million, $5.6 million and $12.0 million at December 31, 2024, 2023, and 2022, respectively, related to the Mestrelab, PreOmics, Biognosys, Zontal, and other majority owned acquisitions.
At December 31, 2024, the Company expects to recognize pre-tax stock-based compensation expense of $4.5 million associated with outstanding stock option awards granted under the Company’s stock plans over the weighted average remaining service period of 2.8 years. The Company also expects to recognize additional pre-tax stock-based compensation expense of $45.9 million associated with outstanding restricted stock units granted under the Company’s 2016 Incentive Compensation Plan over the weighted average remaining service period of 2.8 years.
Stock Option Awards
Stock option activity for the year ended December 31, 2024, is as follows:
| | | | | | | | | | | | | | | | |
| | Number of
Options | | | Weighted-
Average Price
Per Share | | | Weighted -
Average
Remaining
Contractual
Term (in Years) | | | Aggregate
Intrinsic Value
(in millions) (b) | |
Outstanding at December 31, 2023 | | | 967,560 | | | $ | 37.78 | | | | 3.7 | | | $ | 35.5 | |
Granted | | | 128,099 | | | | 66.40 | | | | | | | |
Exercised (c) | | | (208,700 | ) | | | 22.22 | | | | | | | |
Forfeited/Expired | | | 266 | | | | — | | | | | | | |
Outstanding at December 31, 2024 | | | 887,225 | | | $ | 45.58 | | | | 3.7 | | | $ | 16.0 | |
Exercisable at December 31, 2024 | | | 643,705 | | | $ | 36.93 | | | | 2.8 | | | $ | 16.0 | |
Exercisable and expected to vest at
December 31, 2024 (a) | | | 886,693 | | | $ | 45.58 | | | | 3.7 | | | $ | 16.0 | |
(a)Represents the number of vested options at December 31, 2024, plus the number of unvested options at December 31, 2024, that are ultimately expected to vest based on our estimated forfeiture rate.
(b)The aggregate intrinsic value is calculated as the positive difference between the exercise price of the underlying options and the quoted price of our common stock on December 31, 2024.
(c)The total intrinsic value of options exercised was $12.0 million, $9.4 million and $10.7 million for the years ended December 31, 2024, 2023 and 2022, respectively.
Restricted Stock Units
Restricted stock unit activity is presented below:
| | | | | | | | |
| | Shares
Subject to
Restriction | | | Weighted-
Average Grant
Date Fair
Value Per
Share | |
Outstanding at December 31, 2023 | | | 702,047 | | | $ | 64.68 | |
Granted | | | 453,762 | | | | 63.61 | |
Vested (a) | | | (271,477 | ) | | | 62.21 | |
Forfeited | | | (31,094 | ) | | | 65.59 | |
Outstanding at December 31, 2024 | | | 853,238 | | | $ | 64.91 | |
a)The total fair value of restricted stock vested for the years ended December 31, 2024, 2023 and 2022 was $16.9 million, $17.8 million and $17.7 million, respectively.
ITEM 9 CHANGES IN AND DISAGREEMENTS WITH ACCOUNTANTS ON ACCOUNTING AND FINANCIAL DISCLOSURE
None.
ITEM 9A CONTROLS AND PROCEDURES
Disclosure Controls and Procedures
We have established disclosure controls and procedures (as such term is defined in Rules 13a-15(e) and 15d-15(e) under the Securities Exchange Act of 1934, as amended (the “Exchange Act”)) that are designed to provide reasonable assurance that information required to be disclosed in the reports that we file or submit under the Exchange Act is recorded, processed, summarized and reported within the time periods specified in the rules and forms of the SEC and to ensure that such information is accumulated and communicated to management, including our Chief Executive Officer (principal executive officer) and Chief Financial Officer (principal financial officer), to allow timely decisions regarding required disclosures. Under the supervision and with the participation of our management, including our Chief Executive Officer and Chief Financial Officer, we conducted an evaluation of the effectiveness of our disclosure controls and procedures as of December 31, 2024. Based on this evaluation, our Chief Executive Officer and Chief Financial Officer concluded that our disclosure controls and procedures were effective at a reasonable assurance level as of December 31, 2024.
Management’s Report on Internal Control over Financial Reporting
Our management is responsible for establishing and maintaining adequate internal control over financial reporting. Under the supervision and with the participation of our management, including our Chief Executive Officer and Chief Financial Officer, we conducted an evaluation of the effectiveness of our internal control over financial reporting as of December 31, 2024, based on the criteria set forth by the Committee of Sponsoring Organizations of the Treadway Commission (COSO) in Internal Control—Integrated Framework (2013). Based on this evaluation, management concluded that our internal control over financial reporting was effective as of December 31, 2024.
We excluded Chemspeed Technologies AG, Dynamic Biosensors GmbH, ELITechGroup, Nanophoton Corporation, NanoString Technologies, Nion LLC, Phasefocus Holdings Limited, Spectral Instruments Imaging LLC, and Tornado Spectral Systems Inc., from our assessment of internal control over financial reporting as of December 31, 2024, because they were acquired by the Company in business combinations during 2024. The total assets and total revenues of the acquired entities collectively represent approximately 7% and 7%, respectively, of the related consolidated financial statement amounts as of and for the year ended December 31, 2024.
The effectiveness of our internal control over financial reporting as of December 31, 2024, has been audited by PricewaterhouseCoopers LLP, an independent registered public accounting firm, as stated in their report, which appears in this Annual Report on Form 10-K.
Changes in Internal Control over Financial Reporting
There were no changes in our internal control over financial reporting that occurred during the quarter ended December 31, 2024, that materially affected, or are reasonably likely to materially affect, our internal control over financial reporting.
ITEM 9B OTHER INFORMATION
On November 25, 2024, Dr. Cynthia Friend, a member of the Company’s Board of Directors, terminated a trading plan she had previously adopted with respect to the sale of securities of the Company’s common stock, intended to satisfy the affirmative defense of Rule 10b5-1(c) of the Exchange Act (“Rule 10b5-1 Trading Plan”). Dr. Friend’s Rule 10b5-1 Trading Plan was adopted on March 11, 2024, and provided for the sale of up to 1,785 shares of the Company’s common stock through December 31, 2024. As of the date of termination of her Rule 10b5-1 Trading Plan, Dr. Friend did not sell any shares of common stock under the terms of the Rule 10b5-1 Trading Plan.
Other than as disclosed above, none of our directors or officers (as defined in Rule 16a-1(f) of the Exchange Act) adopted, modified or terminated any contract, instruction, or written plan for the purchase or sale of our securities that was intended to satisfy the affirmative defense conditions of Rule 10b5-1(c) of the Exchange Act or any non-Rule 10b5-1 trading arrangement (as defined in Item 408(c) of Regulation S-K) during the three months ended December 31, 2024.
ITEM 9C DISCLOSURE REGARDING FOREIGN JURISDICTIONS THAT PREVENT INSPECTIONS
Not applicable.
PART III
ITEM 10 DIRECTORS, EXECUTIVE OFFICERS AND CORPORATE GOVERNANCE
The full text of our code of conduct, which applies to our Principal Executive Officer, Principal Financial Officer, Principal Accounting Officer and Board of Directors is published on our Investor Relations website at www.bruker.com. We intend to disclose future amendments to certain provisions of our Code, or waivers of such provisions granted to executive officers and directors, on the website within four business days following the date of such amendment or waiver.
The information required by this item of Form 10-K is incorporated by reference to our definitive proxy statement (which will be filed with the SEC pursuant to Regulation 14A under the Exchange Act) relating to our 2025 Annual Meeting of Shareholders.
ITEM 11 EXECUTIVE COMPENSATION
The information required by this item of Form 10-K is incorporated by reference to our definitive proxy statement (which will be filed with the SEC pursuant to Regulation 14A under the Exchange Act) relating to our 2025 Annual Meeting of Shareholders.
ITEM 12 SECURITY OWNERSHIP OF CERTAIN BENEFICIAL OWNERS AND MANAGEMENT AND RELATED SHAREHOLDER MATTERS
The information required by this item of Form 10-K is incorporated by reference to our definitive proxy statement (which will be filed with the SEC pursuant to Regulation 14A under the Exchange Act) relating to our 2025 Annual Meeting of Shareholders.
ITEM 13 CERTAIN RELATIONSHIPS AND RELATED TRANSACTIONS, AND DIRECTOR INDEPENDENCE
The information required by this item of Form 10-K is incorporated by reference to our definitive proxy statement (which will be filed with the SEC pursuant to Regulation 14A under the Exchange Act) relating to our 2025 Annual Meeting of Shareholders.
ITEM 14 PRINCIPAL ACCOUNTANT FEES AND SERVICES
Our independent registered public accounting firm is PricewaterhouseCoopers LLP, New York, NY, PCAOB ID 238.
The information required by this item of Form 10-K is incorporated by reference to our definitive proxy statement (which will be filed with the SEC pursuant to Regulation 14A under the Exchange Act) relating to our 2025 Annual Meeting of Shareholders.
PART IV
ITEM 15 EXHIBITS, FINANCIAL STATEMENTS AND SCHEDULES
(a)Financial Statements and Schedules
The financial statements required by this item are filed as part of this report under Item 8—Financial Statements and Supplementary Data.
(2)Financial Statement Schedules
The financial statements required by this item are filed as part of this report under Item 8—Financial Statements and Supplementary Data.
EXHIBIT INDEX
| | | |
| | | |
|
| Incorporated by Reference |
Exhibit
Number
| Description
| Form
| Filing Date
|
|
|
|
|
3.1 | Restated Certificate of Incorporation of Bruker Corporation | Form 10-K | March 27, 2020 |
|
|
|
|
3.2 | Amended and Restated Bylaws of Bruker Corporation | Form 8-K | May 30, 2024 |
|
|
|
|
4.1 | Specimen Stock Certificate Representing Shares of Common Stock of Bruker Corporation | Form 10-K | March 1, 2017 |
|
|
|
|
4.2 | Description of the Registrant’s Securities registered pursuant to Section 12 of the Securities Exchange Act of 1934 | Form 10-K | March 27, 2020 |
|
|
|
|
10.1† | Bruker Corporation 2010 Incentive Compensation Plan | Schedule 14A | April 14, 2010 |
|
|
|
|
10.2† | Bruker Corporation 2010 Incentive Compensation Plan Form of Incentive Stock Option Agreement | Form 10-Q | August 9, 2010 |
|
|
|
|
10.3† | Bruker Corporation 2010 Incentive Compensation Plan Form of Non-Qualified Stock Option Agreement | Form 10-Q | August 9, 2010 |
|
|
|
|
10.4† | Bruker Corporation 2010 Incentive Compensation Plan Form of Restricted Stock Agreement | Form 10-Q | August 9, 2010 |
|
|
|
|
10.5† | Bruker Corporation 2016 Incentive Compensation Plan | Schedule 14A | April 22, 2016 |
|
|
|
|
10.6† | Bruker Corporation 2016 Incentive Compensation Plan Form of Incentive Stock Option Agreement | Form 10-Q | August 9, 2019 |
|
|
|
|
10.7† | Bruker Corporation 2016 Incentive Compensation Plan Form of Non-Qualified Stock Option Agreement | Form 10-Q | August 9, 2019 |
|
|
|
|
10.8† | Bruker Corporation 2016 Incentive Compensation Plan Form of Restricted Stock Unit Agreement | Form 10-Q | August 9, 2019 |
|
|
|
|
10.9† | Bruker Corporation 2016 Incentive Compensation Plan Form of Director Restricted Stock Unit Agreement | Form 10-K | March 1, 2017 |
|
|
|
|
10.10† | Bruker Corporation Employee Stock Purchase Plan | Form S-8 | June 3, 2022 |
| | | |
|
|
|
|
10.11* | Note Purchase Agreement, dated January 18, 2012 | Form 8-K | January 19, 2012 |
|
|
|
|
10.12 | First Amendment to the Note Purchase Agreement, date January 18, 2012 | Form 10-Q | August 7, 2020 |
|
|
|
|
| | | |
10.13† | Bruker Corporation 2019 Short-Term Incentive Compensation Program | Form 8-K | February 21, 2019 |
|
|
|
|
10.14†** | Bruker Corporation 2022 Short-Term Incentive Compensation Program |
|
|
|
|
|
|
10.15† | Offer Letter, dated June 4, 2018, by and between the Company and Gerald N. Herman | Form 10-Q | August 9, 2018 |
|
|
|
|
10.16† | Contract of Employment, dated May 1, 2018, by and between the Company and Falko Busse | Form 10-Q | August 9, 2018 |
|
|
|
|
10.17† | Employment Offer Letter Agreement, dated June 25, 2012, by and between the Company and Juergen Srega | Form 10-Q | May 9, 2013 |
|
|
|
|
10.18† | Managing Director Employment Contract, dated as of June 28, 2012, by and between Bruker Daltonik GmbH and Juergen Srega, as amended pursuant to the Supplement to the Managing Director Employment Contract, dated as of December 12, 2019 | Form 10-K | March 27, 2020 |
|
|
|
|
10.19† | Form of Indemnification Agreement of Officers and Directors | Form 8-K | February 11, 2019 |
|
|
|
|
10.20 | Term Loan Agreement, dated December 11, 2019, by and among the Company and certain of its subsidiaries, and Bank of America, N.A. as Administrative Agent, TD Bank, N.A. and the other banks or other financial institutions or entities from time to time party thereto as lenders | Form 8-K | December 12, 2019 |
|
|
|
|
10.21 | Note Purchase Agreement dated as of December 11, 2019 | Form 8-K | December 12, 2019 |
|
|
|
|
10.22 | First Amendment to the Note Purchase Agreement, dated as of December 11, 2019 | Form 10-Q | August 7, 2020 |
|
|
|
|
10.23 | First Amendment to Term Loan Agreement, dated as of May 12, 2021 | Form 10-Q | August 5, 2021 |
|
|
|
|
10.24 | Note Purchase Agreement dated as of December 7, 2021 | Form 8-K | December 8, 2021 |
|
|
|
|
10.25 | First Amendment to Credit Agreement, dated December 11, 2019, by and among the Company and certain of its subsidiaries as borrowers, Deutsche Bank Securities Inc. and Wells Fargo Bank, National Association, as Co-Syndication Agents, Citizens Bank, N.A., Credit Suisse (Switzerland) Ltd., TD Bank, N.A. and U.S. Bank National Association, as Co-Documentation Agents, Bank of America, N.A., as Administrative Agent, Swing Line Lender and Issuing Bank, and the several banks or other financial institutions or entities from time to time party thereto as lenders | Form 10-Q | August 5, 2022 |
| | | |
| | | |
10.26 | Second Amendment to Credit Agreement dated December 11, 2019, by and among the Company and certain of its subsidiaries as borrowers, Deutsche Bank Securities Inc. and Wells Fargo Bank, National Association, as Co-Syndication Agents, Citizens Bank, N.A., Credit Suisse (Switzerland) Ltd., TD Bank, N.A. and U.S. Bank National Association, as Co-Documentation Agents, Bank of America, N.A., as Administrative Agent, Swing Line Lender and Issuing Bank, and the several banks or other financial institutions or entities from time to time party thereto as lenders | Form 10-Q | November 4, 2022 |
| | | |
10.27 | Second Amendment to Term Loan Agreement dated December 11, 2019, by and among the Company and certain of its subsidiaries, and Bank of America, N.A. as Administrative Agent, TD Bank, N.A. and the other banks or other financial institutions or entities from time to time party thereto as lenders | Form 10-Q | November 4, 2022 |
| | | |
| | | |
| | | |
10.28 | Amended and Restated Credit Agreement, dated January 18, 2024, by and among the Company and certain of its subsidiaries as borrowers and guarantors, Deutsche Bank Securities Inc., JPMorgan Chase Bank, N.A., TD Bank, N.A., and Wells Fargo Bank, National Association, as Co-Syndication Agents, BofA Securities, Inc., Deutsche Bank Securities Inc., JPMorgan Chase Bank, N.A., TD Bank, N.A. and Wells Fargo Securities, LLC, as Joint Bookrunners and Joint Lead Arrangers, Citizens Bank, N.A., Credit Suisse (Switzerland) Ltd., and U.S. Bank, N.A., as Co-Documentation Agents, ING Bank B.V. and PNC Bank, N.A., as Managing Agents, Bank of America, N.A., as Administrative Agent, Swing Line Lender and Issuing Bank, and the several banks or other financial institutions or entities from time to time party thereto as lenders. | Form 8-K | January 19, 2024 |
| | | |
10.29* | Note Purchase Agreement dated as of February 1, 2024. | Form 8-K | February 2, 2024 |
| | | |
10.30* | Note Purchase Agreement dated as of February 8, 2024 | Form 8-K | February 12, 2024 |
| | | |
10.31 | Share Purchase Agreement, dated as of February 27, 2024, by and between Bruker Invest AG, and Tecfin S.à r.l., Christoph Gauer, Eliman 1 and Eliman 2. | Form 10-K | February 29, 2024 |
| | | |
10.32 | Warranty Agreement, dated as of February 27, 2024, by and among Bruker Invest AG, Tecfin S.à r.l., Christoph Gauer, Eliman 1 and Eliman 2. | Form 10-K | February 29, 2024 |
| | | |
10.33 | Three- and Five-Year Term Loan Agreement dated as of March 29, 2024. | Form 8-K | April 2, 2024 |
| | | |
10.34 | Seven-Year Term Loan Agreement dated as of March 29, 2024. | Form 8-K | April 2, 2024 |
| | | |
10.35* | Asset Purchase Agreement, dated as of April 17, 2024, by and between Bruker Corporation and NanoString Technologies. | Form 8-K | April 22, 2024 |
| | | |
10.36 | Underwriting Agreement, dated May 29, 2024, by and among Bruker Corporation and BofA Securities, Inc. and J.P. Morgan Securities LLC. | Form 8-K/A | June 5, 2024 |
| | | |
19.1 ** | Insider Trading Policy of Bruker Corporation. | | |
| | | |
| | | |
21.1 ** | Subsidiaries of the Company |
|
|
|
|
|
|
23.1 ** | Consent of PricewaterhouseCoopers LLP, Independent Registered Public Accounting Firm |
|
|
| |
|
|
24.1 ** | Power of attorney (included on signature page hereto) |
|
|
|
|
|
|
31.1 ** | Certification by Principal Executive Officer pursuant to Section 302 of the Sarbanes-Oxley Act of 2002 |
|
|
|
|
|
|
31.2 ** | Certification by Principal Financial Officer pursuant to Section 302 of the Sarbanes-Oxley Act of 2002 |
|
|
|
|
|
|
32.1 ** | Certification by Chief Executive Officer and Chief Financial Officer pursuant to 18 U.S.C. Section 1350, as adopted pursuant to Section 906 of the Sarbanes-Oxley Act of 2002 |
|
|
| | | |
97.1 ** | Bruker Corporation Compensation Recoupment Policy | | |
| g |
|
|
101.INS ** | Inline XBRL Instance Document - the instance document does not appear in the Interactive Data File because XBRL tags are embedded within the Inline XBRL document |
|
|
|
|
|
|
101.SCH ** | Inline XBRL Taxonomy Extension Schema With Embedded Linkbase Documents |
|
|
|
|
|
|
101.CAL ** | Inline XBRL Taxonomy Extension Calculation Linkbase Document |
|
|
|
|
|
|
101.DEF ** | Inline XBRL Taxonomy Extension Definition Linkbase Document |
|
|
|
|
|
|
101.LAB ** | Inline XBRL Taxonomy Extension Label Linkbase Document |
|
|
|
|
|
|
101.PRE** | Inline XBRL Taxonomy Extension Presentation Linkbase Document |
|
|
|
|
|
|
104** | Cover Page Interactive Data File (formatted as inline XBRL and contained in Exhibit 101) |
|
|
* Certain portions have been omitted pursuant to an order granting confidential treatment and have been filed separately with the Securities and Exchange Commission.
† Designates management contract or compensatory plan or arrangement.
** Filed or furnished herewith.
No other instruments defining the rights of holders of long-term debt of the registrant or its subsidiaries have been filed as Exhibits because no such instruments met the threshold materiality requirements under Regulation S-K. The registrant agrees, however, to furnish a copy of any such instruments to the Commission upon request.
ITEM 16 FORM 10-K SUMMARY
Not Applicable.
SIGNATURES
Pursuant to the requirements of Section 13 or 15(d) of the Securities Exchange Act of 1934, the registrant has duly caused this report to be signed on its behalf by the undersigned, thereunto duly authorized.
| | | |
|
| BRUKER CORPORATION |
|
|
|
|
Date: March 3, 2025 |
| By: | /s/ FRANK H. LAUKIEN, PH.D.
|
|
|
| Name: Frank H. Laukien, Ph.D. |
|
|
| Title: President, Chief Executive Officer and Chairman |
We, the undersigned officers and directors of Bruker Corporation, hereby severally constitute and appoint Frank H. Laukien, Ph.D. to sign for us and in our names in the capacities indicated below, the report on Form 10-K filed herewith and any and all amendments to such report, and to file the same, with all exhibits thereto and other documents in connection therewith, in each case, with the Securities and Exchange Commission, and generally to do all such things in our names and on our behalf in our capacities consistent with the provisions of the Securities Exchange Act of 1934, as amended, and all requirements of the Securities and Exchange Commission.
Pursuant to the requirements of the Securities Exchange Act of 1934, this report has been signed below by the following persons on behalf of the registrant and in the capacities and on the dates indicated.
| | |
Name | Title | Date |
| | |
/S/ FRANK H. LAUKIEN, PH.D. | President, Chief Executive Officer and Chairman
(Principal Executive Officer) | March 3, 2025 |
Frank H. Laukien, Ph.D. | | |
| | |
/S/ GERALD N. HERMAN | Executive Vice President and Chief Financial Officer
(Principal Financial Officer) | March 3, 2025 |
Gerald N. Herman | | |
| | |
/S/ THOMAS BURES | Chief Accounting Officer
(Principal Accounting Officer) | March 3, 2025 |
Thomas Bures | | |
| | |
/S/ BONNIE H. ANDERSON | Director | March 3, 2025 |
Bonnie H. Anderson | | |
| | |
/S/ CYNTHIA M. FRIEND, PH.D. | Director | March 3, 2025 |
Cynthia Friend, Ph.D. | | |
| | |
/S/ WILLIAM A. LINTON | Director | March 3, 2025 |
William A. Linton | | |
| | |
/S/ JOHN ORNELL | Director | March 3, 2025 |
John Ornell | | |
| | |
/S/ RICHARD A. PACKER | Director | March 3, 2025 |
Richard A. Packer | | |
| | |
/S/ ADELENE Q. PERKINS | Director | March 3, 2025 |
Adelene Q. Perkins | | |
| | |
/S/ HERMANN REQUARDT, PH.D. | Director | March 3, 2025 |
Hermann Requardt, Ph.D. | | |
| | |
/S/ ROBERT ROSENTHAL, PH.D. | Director | March 3, 2025 |
Robert Rosenthal, Ph.D. | | |
| | |
/S/ LAURA FRANCIS | Director | March 3, 2025 |
Laura Francis | | |