UNITED STATES | |||
SECURITIES AND EXCHANGE COMMISSION | |||
Washington, D.C. 20549 | |||
| |||
SCHEDULE 14A | |||
| |||
Proxy Statement Pursuant to Section 14(a) of | |||
| |||
Filed by the Registrant ý | |||
| |||
Filed by a Party other than the Registrant o | |||
| |||
Check the appropriate box: | |||
o | Preliminary Proxy Statement | ||
o | Confidential, for Use of the Commission Only (as permitted by Rule 14a-6(e)(2)) | ||
o | Definitive Proxy Statement | ||
ý | Definitive Additional Materials | ||
o | Soliciting Material Pursuant to §240.14a-12 | ||
| |||
Bruker BioSciences Corporation | |||
(Name of Registrant as Specified In Its Charter) | |||
| |||
| |||
(Name of Person(s) Filing Proxy Statement, if other than the Registrant) | |||
| |||
Payment of Filing Fee (Check the appropriate box): | |||
o | No fee required. | ||
o | Fee computed on table below per Exchange Act Rules 14a-6(i)(1) and 0-11. | ||
| (1) | Title of each class of securities to which transaction applies: | |
|
|
| |
| (2) | Aggregate number of securities to which transaction applies: | |
|
|
| |
| (3) | Per unit price or other underlying value of transaction computed pursuant to Exchange Act Rule 0-11 (set forth the amount on which the filing fee is calculated and state how it was determined): | |
|
|
| |
| (4) | Proposed maximum aggregate value of transaction: | |
|
|
| |
| (5) | Total fee paid: | |
|
|
| |
ý | Fee paid previously with preliminary materials. | ||
o | Check box if any part of the fee is offset as provided by Exchange Act Rule 0-11(a)(2) and identify the filing for which the offsetting fee was paid previously. Identify the previous filing by registration statement number, or the Form or Schedule and the date of its filing. | ||
| (1) | Amount Previously Paid: | |
|
|
| |
| (2) | Form, Schedule or Registration Statement No.: | |
|
|
| |
| (3) | Filing Party: | |
|
|
| |
| (4) | Date Filed: | |
|
|
| |
[The following materials were provided to certain stockholders of Bruker BioSciences Corporation beginning on June 5, 2006.]
2

Link to searchable text of slide shown above
Link to searchable text of slide shown above
Link to searchable text of slide shown above
Link to searchable text of slide shown above
Link to searchable text of slide shown above

Link to searchable text of slide shown above
Link to searchable text of slide shown above
Link to searchable text of slide shown above
Link to searchable text of slide shown above

Link to searchable text of slide shown above

Link to searchable text of slide shown above
Link to searchable text of slide shown above
Link to searchable text of slide shown above
Link to searchable text of slide shown above
Link to searchable text of slide shown above
Link to searchable text of slide shown above
Link to searchable text of slide shown above

Link to searchable text of slide shown above
Link to searchable text of slide shown above

Link to searchable text of slide shown above

Link to searchable text of slide shown above
Link to searchable text of slide shown above
Link to searchable text of slide shown above
Link to searchable text of slide shown above

Link to searchable text of slide shown above

Link to searchable text of slide shown above
Link to searchable text of slide shown above
Link to searchable text of slide shown above
Link to searchable text of slide shown above
Link to searchable text of slide shown above
Searchable text section of graphics shown above
[LOGO]
Bruker BioSciences Corporation (BRKR)
[GRAPHIC]
Presentation for BRKR Shareholders on Planned Acquisition of Bruker Optics Inc. June 5 & 6, 2006
[GRAPHIC]
Bruker BioSciences:
Frank Laukien, CEO
Bill Knight, CFO
Brian Monahan, Controller
Bruker Optics:
Dirk Laukien, CEO
Dan Klevisha, VP
Safe Harbor Statement of BRKR
Any statements contained in this presentation that do not describe historical facts may constitute forward-looking statements as that term is defined in the Private Securities Litigation Reform Act of 1995. Any forward-looking statements contained herein are based on current expectations, but are subject to a number of risks and uncertainties. The factors that could cause actual future results to differ materially from current expectations include, but are not limited to, risks and uncertainties relating to the companies’ reorganization strategies, integration risks, failure of conditions, technological approaches, product development, market acceptance, cost and pricing of the companies’ products, changes in governmental regulations, capital spending and government funding policies, FDA and other regulatory approvals to the extent applicable, competition, the intellectual property of others, patent protection and litigation. We do not undertake, and expressly disclaim, any obligation to update this forward-looking information except as required by law. For details regarding factors that could cause actual results to differ materially from those anticipated, please refer to our SEC filings, including our Annual Report on Form 10-K for the year ended December 31, 2005.
Please read BRKR Definitive Proxy Statement filed with the SEC on May 25, 2006.
2
Overview of Presentation
• | Transaction Overview and Rationale |
|
|
|
|
• | Bruker Optics Highlights |
|
|
|
|
• | Bruker BioSciences Today & Tomorrow |
|
|
|
|
[GRAPHIC] |
| |
3
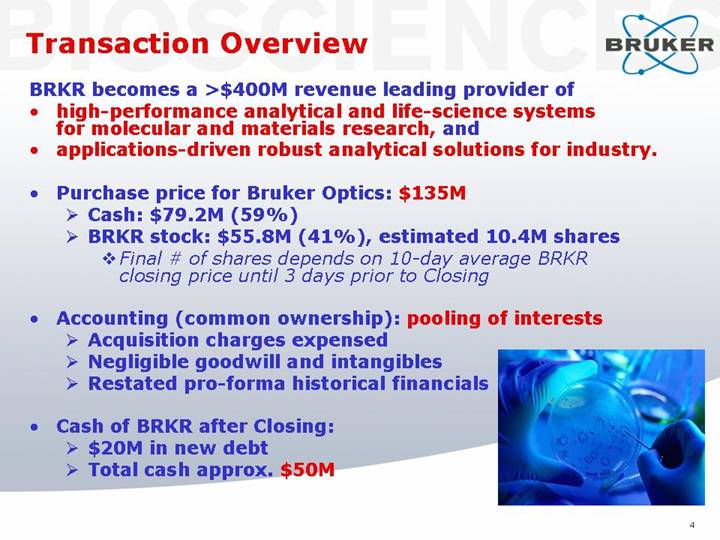
Transaction Overview
BRKR becomes a >$400M revenue leading provider of
• high-performance analytical and life-science systems for molecular and materials research, and
• applications-driven robust analytical solutions for industry.
• Purchase price for Bruker Optics: $135M
• Cash: $79.2M (59%)
• BRKR stock: $55.8M (41%), estimated 10.4M shares
• Final # of shares depends on 10-day average BRKR closing price until 3 days prior to Closing
• Accounting (common ownership): pooling of interests
• Acquisition charges expensed
• Negligible goodwill and intangibles
• Restated pro-forma historical financials
• Cash of BRKR after Closing:
• $20M in new debt
• Total cash approx. $50M
4
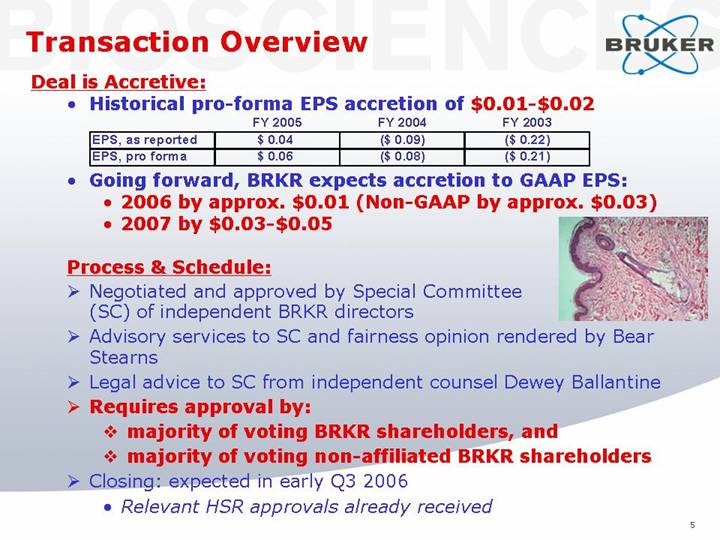
Transaction Overview
Deal is Accretive:
• Historical pro-forma EPS accretion of $0.01-$0.02
|
| FY 2005 |
| FY 2004 |
| FY 2003 |
| |||
EPS, as reported |
| $ | 0.04 |
| $ | (0.09 | ) | $ | (0.22 | ) |
EPS, pro forma |
| $ | 0.06 |
| $ | (0.08 | ) | $ | (0.21 | ) |
• Going forward, BRKR expects accretion to GAAP EPS:
• 2006 by approx. $0.01 (Non-GAAP by approx. $0.03)
• 2007 by $0.03-$0.05
[GRAPHIC]
Process & Schedule:
• Negotiated and approved by Special Committee (SC) of independent BRKR directors
• Advisory services to SC and fairness opinion rendered by Bear Stearns
• Legal advice to SC from independent counsel Dewey Ballantine
• Requires approval by:
• majority of voting BRKR shareholders, and
• majority of voting non-affiliated BRKR shareholders
• Closing: expected in early Q3 2006
• Relevant HSR approvals already received
5
Transaction Rationale
• Increased market access
• additional >$500M accessible markets, >$80M revenue
• access to fast growth markets PAT, pharma forensics
• better demand diversification, higher industrial revenue
• Expanded technology base and product line
• adds molecular spectroscopy technology: IR, NIR, Raman
• adds broad product line with applications solution
• adds time-domain NMR analyzer distribution
• Broader marketing footprint
• enhanced global distribution and customer support
• increased brand leverage
• cross-selling opportunities
• Financial expectations (supported by historical 2005 pro forma)
• improved gross, operating and net income margins
• increased operating cash flows
• immediately accretive
• Good partial use of BRKR $100M balance sheet cash
6
Bruker Optics Highlights
[GRAPHIC]
Bruker Optics Inc.
A leading provider of molecular spectroscopy tools and solutions
FT-IR |
| FT-NIR |
| Raman |
| TD-NMR |
7
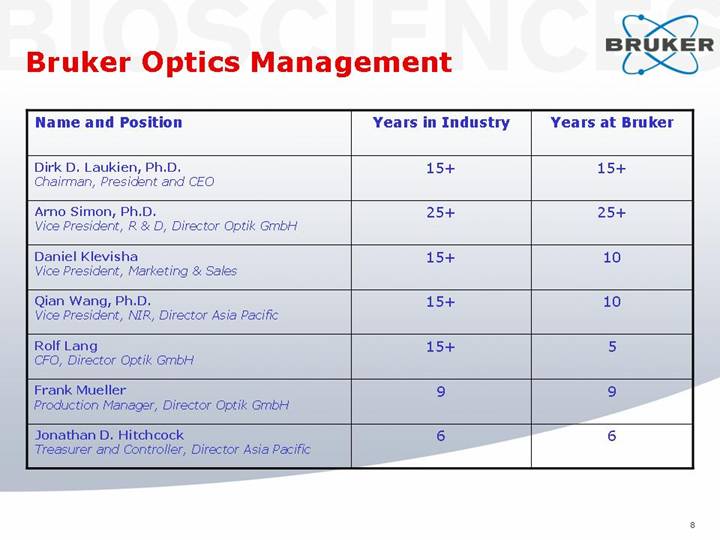
Bruker Optics Management
Name and Position |
| Years in Industry |
| Years at Bruker |
|
Dirk D. Laukien, Ph.D. |
| 15 | + | 15 | + |
Arno Simon, Ph.D. |
| 25 | + | 25 | + |
Daniel Klevisha |
| 15 | + | 10 |
|
Qian Wang, Ph.D. |
| 15 | + | 10 |
|
Rolf Lang |
| 15 | + | 5 |
|
Frank Mueller |
| 9 |
| 9 |
|
Jonathan D. Hitchcock |
| 6 |
| 6 |
|
8
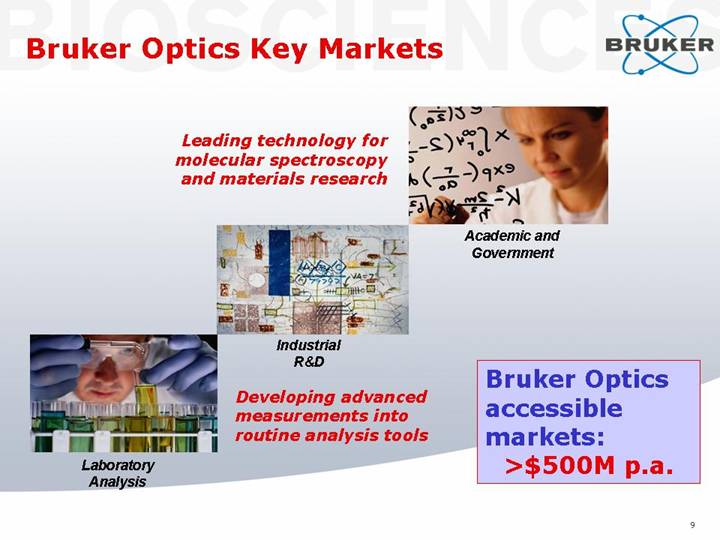
Bruker Optics Key Markets
|
| Leading technology for molecular spectroscopy and materials research |
| [GRAPHIC] |
|
|
|
|
|
| Academic and Government |
|
|
|
| [GRAPHIC] |
|
|
|
|
|
| Industrial R&D |
|
|
|
|
|
|
|
|
|
|
|
[GRAPHIC] |
| Developing advanced measurements into routine analysis tools |
| Bruker Optics accessible markets: >$500M p.a. |
|
|
9
| Enabling real-time science-based control of pharmaceutical manufacturing process |
|
|
|
| |
|
|
|
|
|
|
|
Pharmaceutical Process Analytical Technologies (PAT) |
| [GRAPHIC] |
|
|
|
|
|
| Chemical, Polymer Analysis |
| [GRAPHIC] |
|
|
|
|
|
|
|
|
|
|
| Rapid analysis for food quality traits & feed optimization |
| Food, Feed and |
|
|
10
Bruker Optics Customers Include:
Life Science |
| Analytical |
| Process |
|
|
|
|
|
[LOGO] |
| [LOGO] |
| [LOGO] |
In addition, Bruker Optics has a significant presence in most large academic and national research laboratories.
11
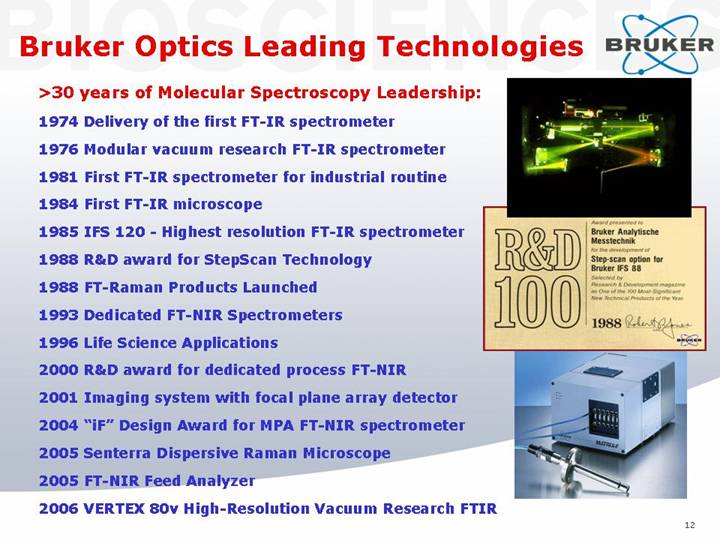
Bruker Optics Leading Technologies
>30 years of Molecular Spectroscopy Leadership:
1974 Delivery of the first FT-IR spectrometer
1976 Modular vacuum research FT-IR spectrometer
1981 First FT-IR spectrometer for industrial routine
1984 First FT-IR microscope
1985 IFS 120 - Highest resolution FT-IR spectrometer
1988 R&D award for StepScan Technology
1988 FT-Raman Products Launched
1993 Dedicated FT-NIR Spectrometers
1996 Life Science Applications
2000 R&D award for dedicated process FT-NIR
2001 Imaging system with focal plane array detector
2004 “iF” Design Award for MPA FT-NIR spectrometer
2005 Senterra Dispersive Raman Microscope
2005 FT-NIR Feed Analyzer
2006 VERTEX 80v High-Resolution Vacuum Research FTIR
[GRAPHIC]
12
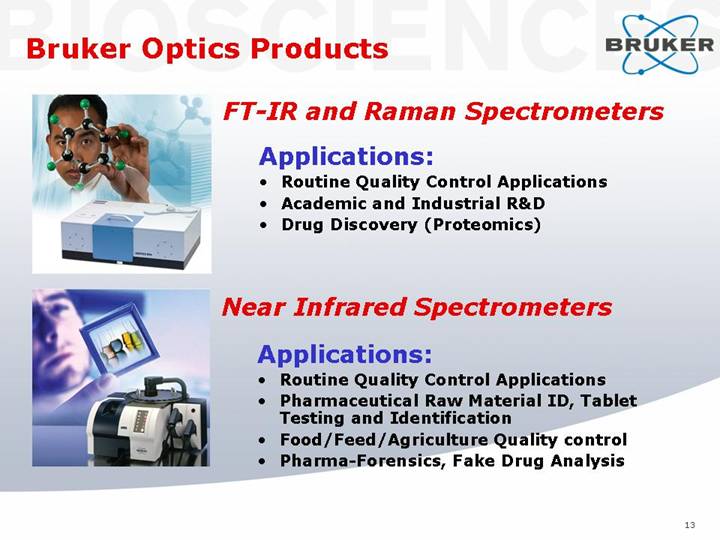
Bruker Optics Products
[GRAPHIC]
FT-IR and Raman Spectrometers
Applications:
• Routine Quality Control Applications
• Academic and Industrial R&D
• Drug Discovery (Proteomics)
[GRAPHIC]
Near Infrared Spectrometers
Applications:
• Routine Quality Control Applications
• Pharmaceutical Raw Material ID, Tablet Testing and Identification
• Food/Feed/Agriculture Quality control
• Pharma-Forensics, Fake Drug Analysis
13
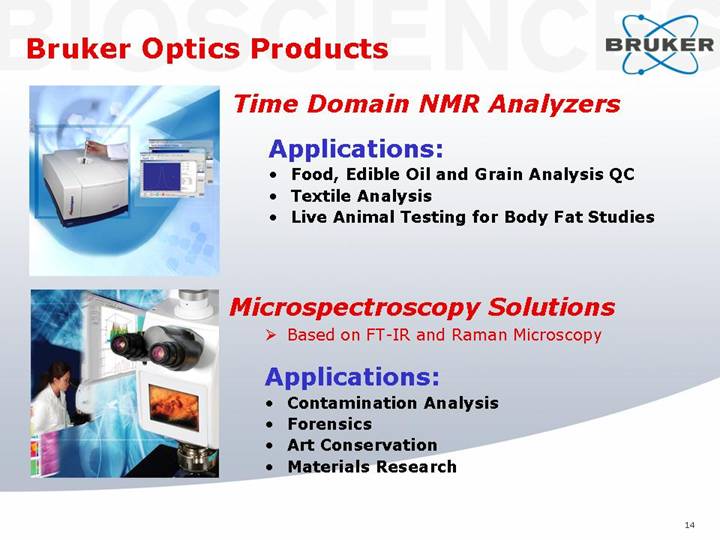
[GRAPHIC]
Time Domain NMR Analyzers
Applications:
• Food, Edible Oil and Grain Analysis QC
• Textile Analysis
• Live Animal Testing for Body Fat Studies
[GRAPHIC]
Microspectroscopy Solutions
• Based on FT-IR and Raman Microscopy
Applications:
• Contamination Analysis
• Forensics
• Art Conservation
• Materials Research
14
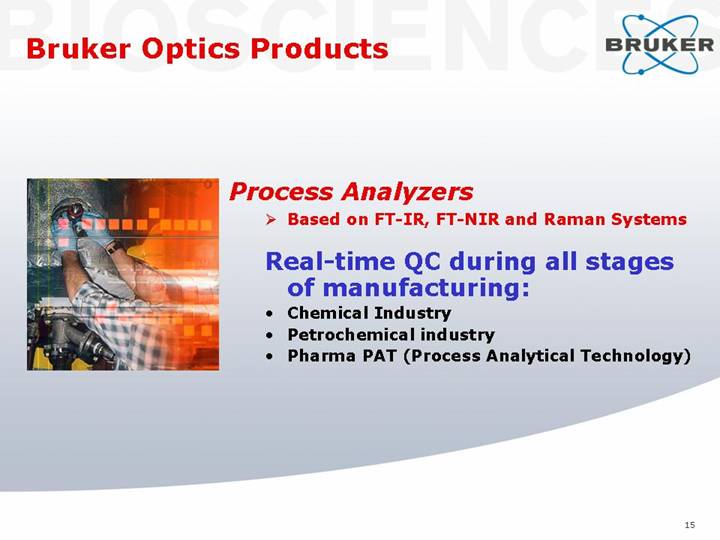
[GRAPHIC]
Process Analyzers
• Based on FT-IR, FT-NIR and Raman Systems
Real-time QC during all stages of manufacturing:
• Chemical Industry
• Petrochemical industry
• Pharma PAT (Process Analytical Technology)
15
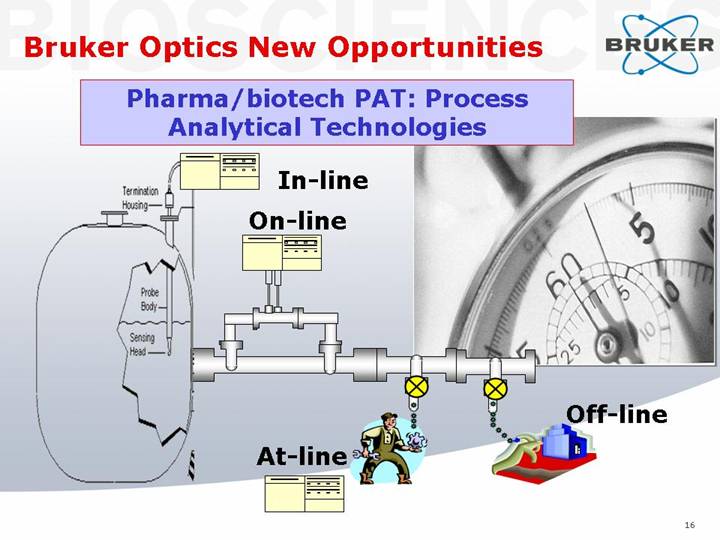
Bruker Optics New Opportunities
Pharma/biotech PAT: Process Analytical Technologies
[GRAPHIC]
16
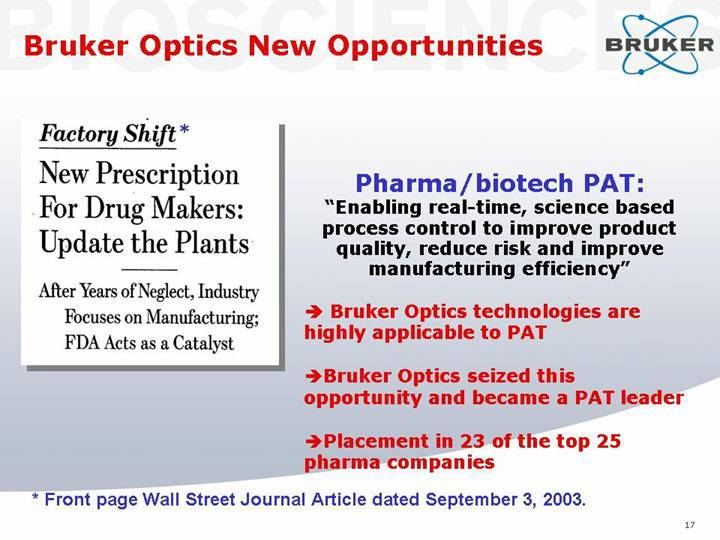
Factory Shift *
New Prescription |
|
For Drug Makers: |
|
Update the Plants |
|
|
|
After Years of Neglect, Industry |
|
Focuses on Manufacturing; |
|
FDA Acts as a Catalyst |
|
Pharma/biotech PAT:
“Enabling real-time, science based
process control to improve product
quality, reduce risk and improve
manufacturing efficiency”
• Bruker Optics technologies are highly applicable to PAT
• Bruker Optics seized this opportunity and became a PAT leader
• Placement in 23 of the top 25 pharma companies
* Front page Wall Street Journal Article dated September 3, 2003.
17
“Pharma Forensics”:
Chinese SFDA Battling Fake Drugs
[GRAPHIC]
Front page Wall Street Journal Article in 2006.
Bruker Optics SFDA order in 2006:
• 300+ Unit Order valued at >$15M in revenue
• Largest project of its kind in China
• Largest single order for Bruker Optics
• Good chances for follow-up business globally
18
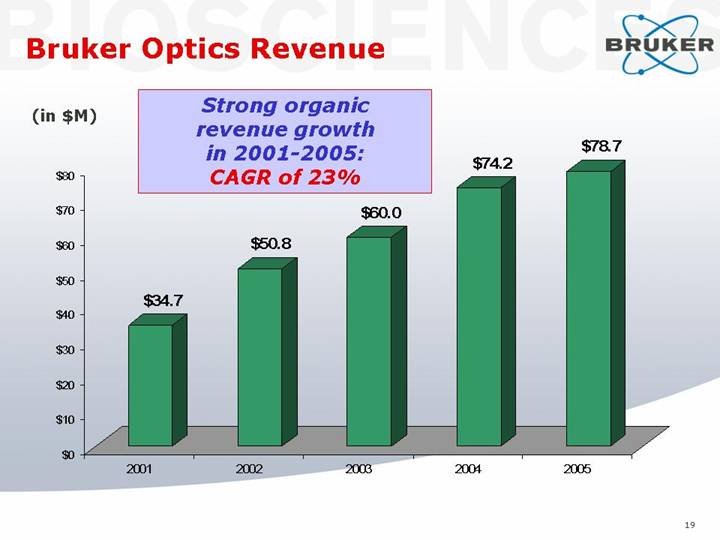
Bruker Optics Revenue
Strong organic
revenue growth
in 2001-2005:
CAGR of 23%
[CHART]
19
Bruker Optics Margins & Income
[CHART]
|
| 2005 |
| ‘01 - ‘05 |
|
|
| % of Revenue |
| CAGR |
|
Adjusted EBITDA |
| 19 | % | 44 | % |
Operating Income |
| 15 | % | 46 | % |
Net Income |
| 8 | % | 47 | % |
20
Bruker Optics Adjusted EBITDA
(in $M)
|
|
|
|
|
|
|
|
|
|
|
| |||||
|
| 2001 |
| 2002 |
| 2003 |
| 2004 |
| 2005 |
| |||||
|
|
|
|
|
|
|
|
|
|
|
| |||||
Operating Income |
| $ | 2.7 |
| $ | 3.7 |
| $ | 4.0 |
| $ | 7.7 |
| $ | 12.0 |
|
|
|
|
|
|
|
|
|
|
|
|
| |||||
Depreciation and amortization |
| 0.5 |
| 0.8 |
| 1.7 |
| 1.4 |
| 1.9 |
| |||||
Write-down of demonstration equipment |
| 0.3 |
| 0.5 |
| 1.2 |
| 1.4 |
| 1.2 |
| |||||
|
|
|
|
|
|
|
|
|
|
|
| |||||
Adjusted EBITDA |
| $ | 3.5 |
| $ | 5.0 |
| $ | 6.9 |
| $ | 10.5 |
| $ | 15.1 |
|
USE OF NON-GAAP FINANCIAL MEASURES: In addition to the financial measures prepared in accordance with generally accepted accounting principles (GAAP), we use the non-GAAP measure of Adjusted EBITDA, defined as US GAAP operating income excluding depreciation and amortization expense and the write-down of demonstration equipment to net realizable value. We believe that the inclusion of this non-GAAP measure helps investors gain a better understanding of our core operating results and future prospects, consistent with how management measures and forecasts the Company’s performance, especially when comparing such results to previous periods or forecasts.
21
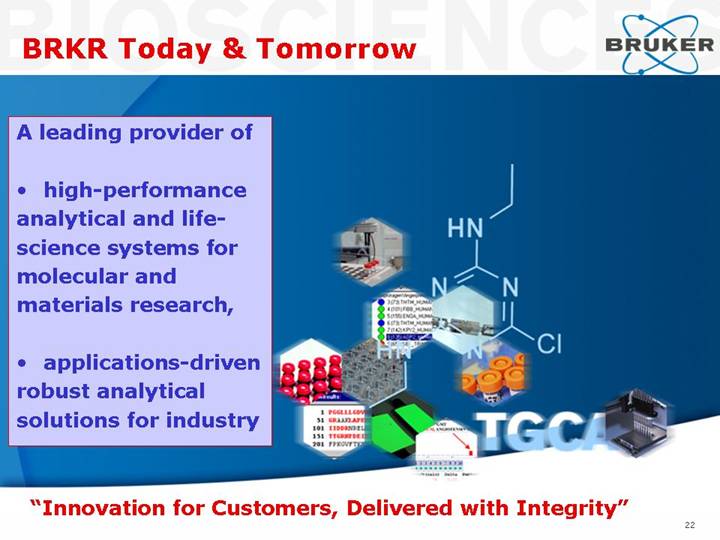
BRKR Today & Tomorrow
[GRAPHIC]
A leading provider of
• high-performance analytical and life-science systems for molecular and materials research,
• applications-driven robust analytical solutions for industry
“Innovation for Customers, Delivered with Integrity”
22
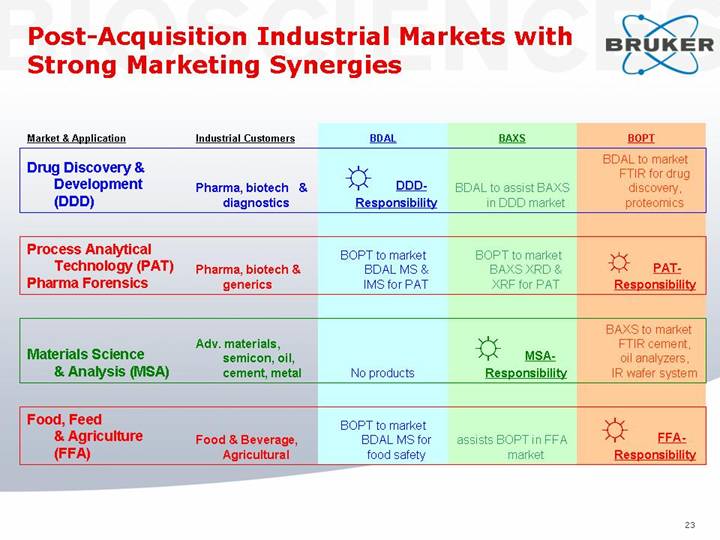
Post-Acquisition Industrial Markets with Strong Marketing Synergies
Market & Application |
| Industrial Customers |
| BDAL |
| BAXS |
| BOPT |
|
|
|
|
|
|
|
|
|
Drug Discovery & Development (DDD) |
| Pharma, biotech & diagnostics |
| [GRAPHIC] DDD-Responsibility |
| BDAL to assist BAXS in DDD market |
| BDAL to market FTIR for drug discovery, proteomics |
|
|
|
|
|
|
|
|
|
Process Analytical Technology (PAT) Pharma Forensics |
| Pharma, biotech & generics |
| BOPT to market BDAL MS & IMS for PAT |
| BOPT to market BAXS XRD & XRF for PAT |
| [GRAPHIC] PAT-Responsibility |
|
|
|
|
|
|
|
|
|
Materials Science & Analysis (MSA) |
| Adv. materials, semicon, oil, cement, metal |
| No products |
| [GRAPHIC] MSA-Responsibility |
| BAXS to market FTIR cement, oil analyzers, IR wafer system |
|
|
|
|
|
|
|
|
|
Food, Feed & Agriculture (FFA) |
| Food & Beverage, Agricultural |
| BOPT to market BDAL MS for food safety |
| assists BOPT in FFA |
| [GRAPHIC] FFA-Responsibility |
23
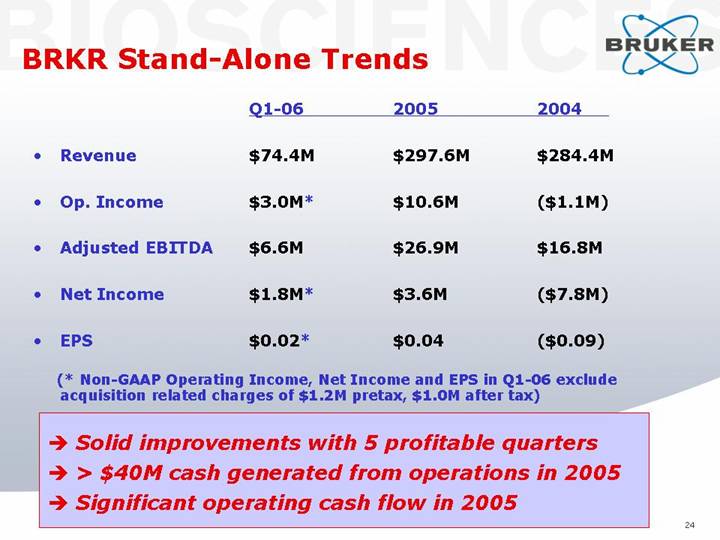
BRKR Stand-Alone Trends
|
|
| Q1-06 |
| 2005 |
| 2004 |
| |||
|
|
|
|
|
|
|
|
| |||
• | Revenue |
| $ | 74.4 | M | $ | 297.6 | M | $ | 284.4 | M |
|
|
|
|
|
|
|
|
| |||
• | Op. Income |
| $ | 3.0 | M* | $ | 10.6 | M | $ | (1.1 | )M |
|
|
|
|
|
|
|
|
| |||
• | Adjusted EBITDA |
| $ | 6.6 | M | $ | 26.9 | M | $ | 16.8 | M |
|
|
|
|
|
|
|
|
| |||
• | Net Income |
| $ | 1.8 | M* | $ | 3.6 | M | $ | (7.8 | )M |
|
|
|
|
|
|
|
|
| |||
• | EPS |
| $ | 0.02 | * | $ | 0.04 |
| $ | (0.09 | ) |
(* Non-GAAP Operating Income, Net Income and EPS in Q1-06 exclude acquisition related charges of $1.2M pretax, $1.0M after tax)
• Solid improvements with 5 profitable quarters
• > $40M cash generated from operations in 2005
• Significant operating cash flow in 2005
24
BRKR 2005 Actual vs. Pro-Forma
|
|
| 2005 |
| 2005 Pro-Forma |
| ||
|
|
| Actual |
| Combined |
| ||
|
|
|
|
|
|
| ||
• | Revenue |
| $ | 297.6 | M | $ | 372.3 | M |
|
|
|
|
|
|
| ||
• | Op. Income |
| $ | 10.6 | M | $ | 21.7 | M |
|
|
|
|
|
|
| ||
• | Adjusted EBITDA |
| $ | 26.9 | M | $ | 41.1 | M |
|
|
|
|
|
|
| ||
• | Net Income |
| $ | 3.6 | M | $ | 5.6 | M |
|
|
|
|
|
|
| ||
• | EPS |
| $ | 0.04 |
| $ | 0.06 |
|
|
|
|
|
|
|
| ||
• | Op. Cash Flow |
| $ | 42.2 | M | $ | 49.7 | M |
Unaudited Pro-Forma Combined Financials give effect to the acquisition as if it had been completed on January 1, 2005.
• Acquisition creates larger, more profitable BRKR with increased margins and operating cash flows.
25
BRKR Adjusted EBITDA
(in $M)
|
| Q1-06 |
| 2005 |
| 2004 |
| 2005Pro-Forma |
| ||||
|
|
|
|
|
|
|
|
|
| ||||
Operating Income |
| $ | 1.8 |
| $ | 10.6 |
| $ | (1.1 | ) | $ | 21.7 |
|
|
|
|
|
|
|
|
|
|
| ||||
Depreciation and amortization |
| 2.1 |
| 8.6 |
| 9.5 |
| 10.5 |
| ||||
Write-down of demonstration equipment |
| 1.5 |
| 7.7 |
| 8.4 |
| 8.9 |
| ||||
Acquisition related charges |
| 1.2 |
| — |
| — |
| — |
| ||||
|
|
|
|
|
|
|
|
|
| ||||
Adjusted EBITDA |
| $ | 6.6 |
| $ | 26.9 |
| $ | 16.8 |
| $ | 41.1 |
|
USE OF NON-GAAP FINANCIAL MEASURES: In addition to the financial measures prepared in accordance with generally accepted accounting principles (GAAP), we use the non-GAAP measure of Adjusted EBITDA, defined as US GAAP operating income excluding depreciation and amortization expense, the write-down of demonstration equipment to net realizable value and acquisition related charges. We believe that the inclusion of this non-GAAP measure helps investors gain a better understanding of our core operating results and future prospects, consistent with how management measures and forecasts the Company’s performance, especially when comparing such results to previous periods or forecasts.
26
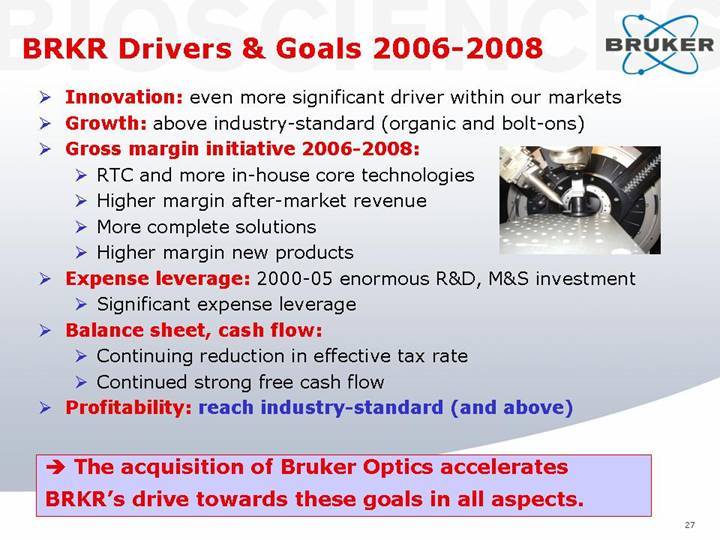
BRKR Drivers & Goals 2006-2008
• Innovation: even more significant driver within our markets
• Growth: above industry-standard (organic and bolt-ons)
• Gross margin initiative 2006-2008:
• RTC and more in-house core technologies
• Higher margin after-market revenue
• More complete solutions
• Higher margin new products
• Expense leverage: 2000-05 enormous R&D, M&S investment
• Significant expense leverage
• Balance sheet, cash flow:
• Continuing reduction in effective tax rate
• Continued strong free cash flow
• Profitability: reach industry-standard (and above)
• The acquisition of Bruker Optics accelerates BRKR’s drive towards these goals in all aspects.
27
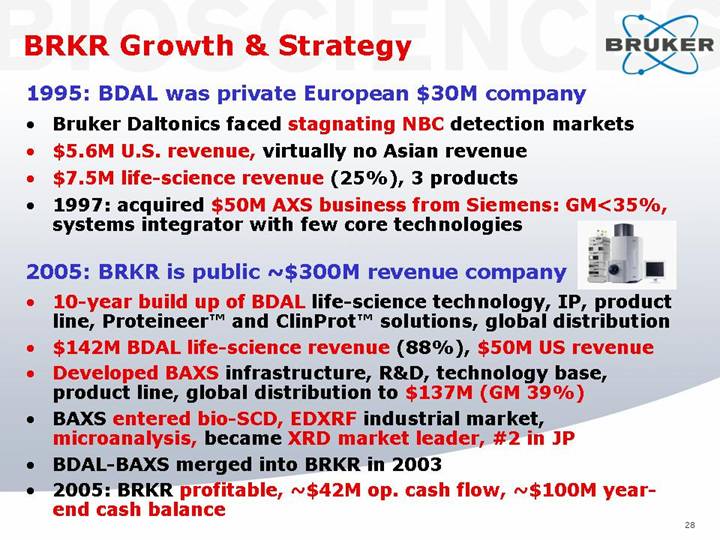
BRKR Growth & Strategy
[GRAPHIC]
1995: BDAL was private European $30M company
• Bruker Daltonics faced stagnating NBC detection markets
• $5.6M U.S. revenue, virtually no Asian revenue
• $7.5M life-science revenue (25%), 3 products
• 1997: acquired $50M AXS business from Siemens: GM<35%, systems integrator with few core technologies
2005: BRKR is public ~$300M revenue company
• 10-year build up of BDAL life-science technology, IP, product line, Proteineer™ and ClinProt™ solutions, global distribution
• $142M BDAL life-science revenue (88%), $50M US revenue
• Developed BAXS infrastructure, R&D, technology base, product line, global distribution to $137M (GM 39%)
• BAXS entered bio-SCD, EDXRF industrial market, microanalysis, became XRD market leader, #2 in JP
• BDAL-BAXS merged into BRKR in 2003
• 2005: BRKR profitable, ~$42M op. cash flow, ~$100M year-end cash balance
28
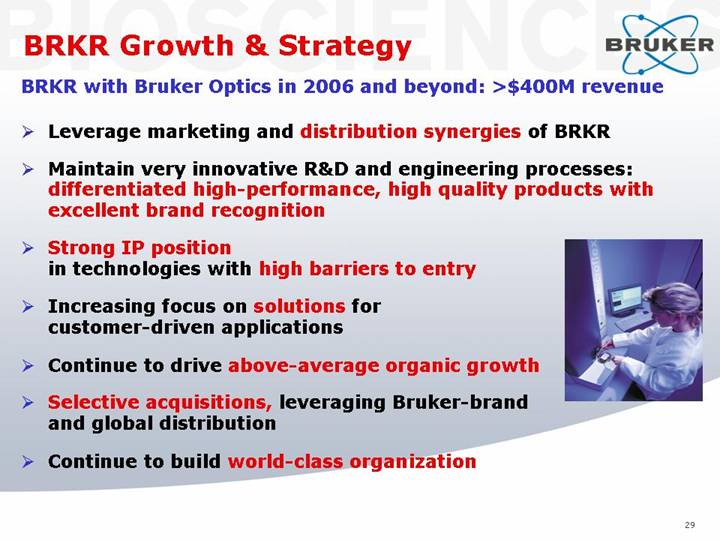
BRKR Growth & Strategy
[GRAPHIC]
BRKR with Bruker Optics in 2006 and beyond: >$400M revenue
• Leverage marketing and distribution synergies of BRKR
• Maintain very innovative R&D and engineering processes: differentiated high-performance, high quality products with excellent brand recognition
• Strong IP position in technologies with high barriers to entry
• Increasing focus on solutions for customer-driven applications
• Continue to drive above-average organic growth
• Selective acquisitions, leveraging Bruker-brand and global distribution
• Continue to build world-class organization
29
BRKR Growth & Strategy
[GRAPHIC]
Combined Opportunities for Dramatic Growth:
• Molecular tools: chemistry, metabolomics, proteomics, structural biology
• Clinical research tools: biomarkers, molecular imaging, IVD, personalized medicine, theranostics, infectious disease
• Pharma/biotech: drug discovery, drug development, biomarkers, pharmacoproteomics, PAT, pharma forensics
• Materials research: advanced materials, composites, thin films, nanotechnology
• Industrial analysis: semicon research and FABs, petroleum, polymers, metals industry, cement industry
• Food, beverage and agricultural analysis
• New NBC detection opportunities in homeland security
30