Earnings Conference Call 4th Quarter 2007 January 23, 2008 Exhibit 99.2 |
2 Forward-Looking Statements This presentation includes forward-looking statements within the meaning of the Private Securities Litigation Reform Act of 1995, that are subject to risks and uncertainties. The factors that could cause actual results to differ materially from these forward-looking statements include those discussed herein as well as those discussed in (1) Exelon’s 2006 Annual Report on Form 10-K in (a) ITEM 1A. Risk Factors, (b) ITEM 7. Management’s Discussion and Analysis of Financial Condition and Results of Operations and (c) ITEM 8. Financial Statements and Supplementary Data: Note 18; (2) Exelon’s Third Quarter 2007 Quarterly Report on Form 10-Q in (a) Part II, Other Information, ITEM 1A. Risk Factors and (b) Part I, Financial Information, ITEM 1. Financial Statements: Note 13; and (3) other factors discussed in filings with the Securities and Exchange Commission by Exelon Corporation, Exelon Generation Company, LLC, Commonwealth Edison Company, and PECO Energy Company (Companies). Readers are cautioned not to place undue reliance on these forward-looking statements, which apply only as of the date of this presentation. None of the Companies undertakes any obligation to publicly release any revision to its forward-looking statements to reflect events or circumstances after the date of this presentation. This presentation includes references to adjusted (non-GAAP) operating earnings that exclude the impact of certain factors. We believe that these adjusted operating earnings are representative of the underlying operational results of the company. Please refer to the attachments to the earnings release and the appendix to this presentation for a reconciliation of adjusted (non-GAAP) operating earnings to GAAP earnings. |

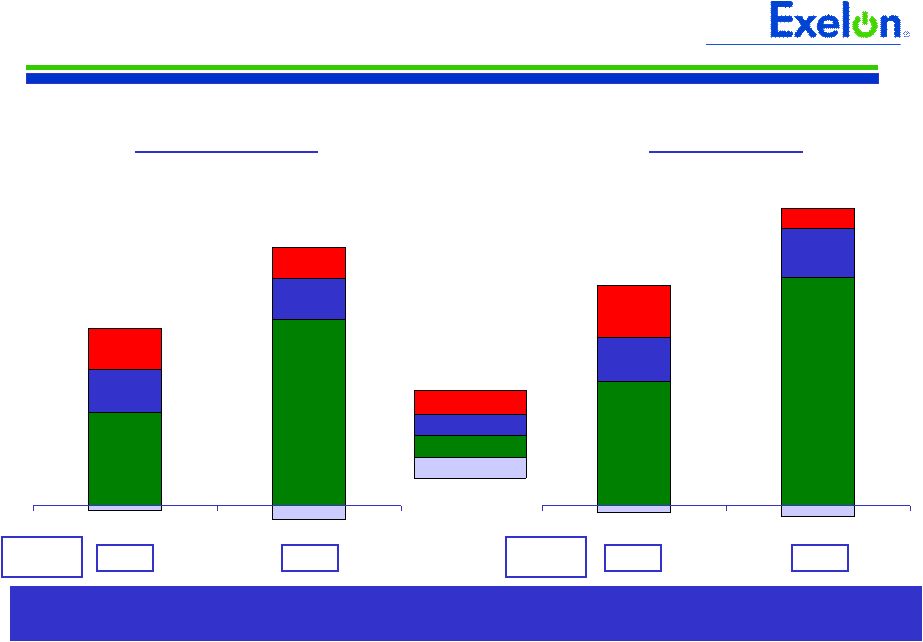
3 $0.39 $0.78 $0.18 $0.17 $0.17 $0.13 2006 2007 Exelon Operating EPS $1.02 Exelon’s strong performance in the fourth quarter was driven primarily by increased earnings at Exelon Generation, which were partially offset by the expected decrease in ComEd earnings HoldCo/Other ExGen PECO ComEd 4th Quarter (Q4) $1.88 $3.45 $0.67 $0.75 $0.78 $0.30 2006 2007 $3.22 $4.32 $0.72 Full Year (FY) Refer to Earnings Release Attachments for additional details on Q4 and FY earnings and to the Appendix for a reconciliation of adjusted (non- GAAP) operating EPS to GAAP EPS. $0.87 GAAP EPS $0.84 $2.35 $4.05 GAAP EPS |
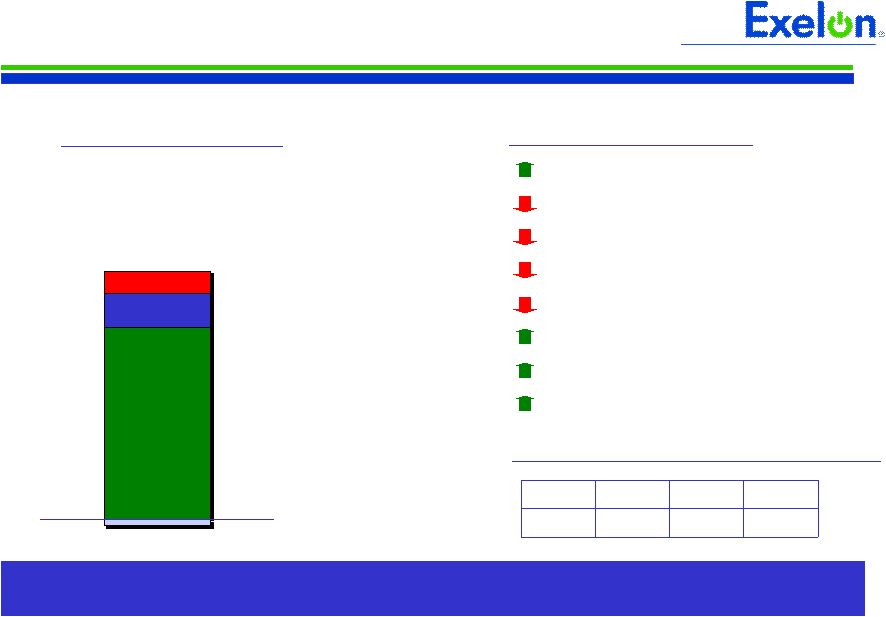
4 Exelon Generation Operating EPS Contribution Q4 FY $0.39 $0.78 Key Drivers – Q4 ’07 vs. Q4 ’06* Higher wholesale margins • Favorable market and portfolio conditions • End of the below-market PPA with ComEd • Contractual price increase associated with the PECO PPA Rebalancing of nuclear decommissioning trust funds Labor-related inflation and nuclear plant development costs $3.45 $1.88 2007 2006 *Refer to the Earnings Release Attachments for additional details and to the Appendix for a reconciliation of adjusted (non-GAAP) operating EPS to GAAP EPS |
5 Q4 FY ComEd Operating EPS Contribution $0.17 $0.13 Key Drivers – Q4 ’07 vs. Q4 ’06* End of the regulatory transition period in IL Labor-related inflation and uncollectible accounts expense Increased distribution revenues (December 2006 ICC Rate Order) Increased transmission revenues (2007 Transmission Rate Case) Income tax settlements $0.30 $0.78 2007 2006 *Refer to the Earnings Release Attachments for additional details and to the Appendix for a reconciliation of adjusted (non-GAAP) operating EPS to GAAP EPS |
6 Q4 FY PECO Operating EPS Contribution $0.18 $0.17 Key Drivers – Q4 ’07 vs. Q4 ’06* Scheduled CTC amortization Uncollectible accounts expense Favorable weather and load growth $0.75 $0.67 2007 2006 *Refer to the Earnings Release Attachments for additional details and to the Appendix for a reconciliation of adjusted (non-GAAP) operating EPS to GAAP EPS |
7 2008 Outlook 2008 (1) $0.55 - $0.60 $3.15 - $3.45 $4.00 - $4.40 $0.35 - $0.40 2008 EPS Guidance (1) Operating EPS: $4.00 - $4.40 GAAP EPS: $3.70 - $4.10 ComEd PECO Exelon Generation HoldCo/Other ~$(0.10) Exelon (1) Refer to “Key Assumptions” slide on Form 8-K filed on 12/19/07 for key assumptions supporting 2008 earnings guidance and for expected 2008 earnings drivers for Exelon Generation, ComEd and PECO. Operating Company ranges do not add to Exelon guidance of $4.00 - $4.40/share due to rounding. Key Drivers 2007 – 2008 Market conditions Nuclear volume Inflationary pressures PECO CTC amortization Weather Load growth ComEd transmission settlement ComEd distribution rate case 26-29% 26-29% 21-24% 21-24% 4Q08 3Q08 2Q08 1Q08 Expected Quarterly EPS Distribution We expect first quarter 2008 operating earnings to represent 21-24% of Exelon’s 2008 full year operating earnings. |
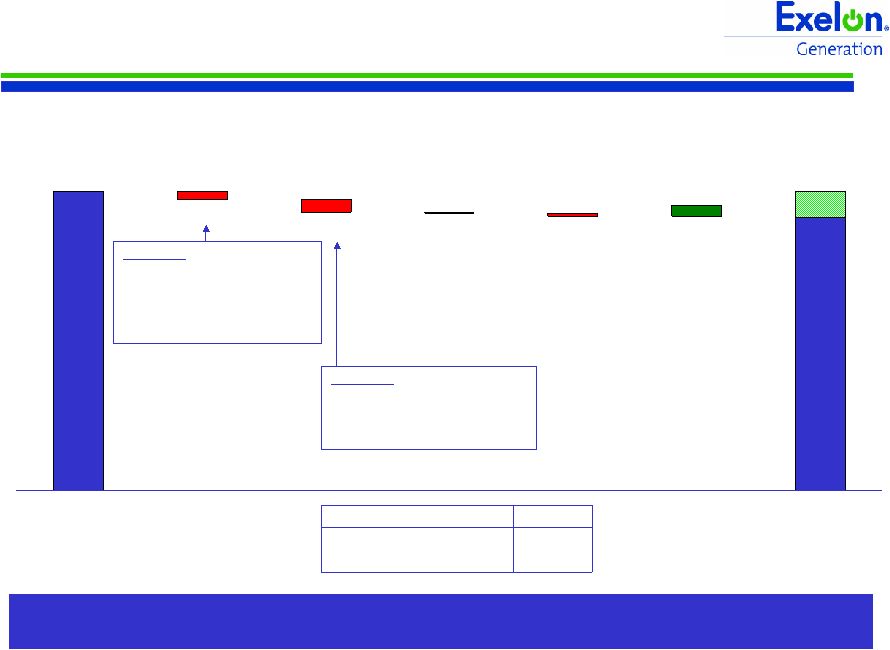
8 Exelon Generation 2008 EPS Contribution Exelon Generation’s 2008 earnings are impacted primarily by increased planned refueling outages and higher nuclear fuel expense 2007 $2,331M 2008 (1) $2,060M - $2,260M ($0.09) $(0.15) $0.13 $3.15 - $3.45 RNF O&M Other (2) $30M +/- 500 Btu/KWh ATC Heat Rate $5.5M +/- $1/mmBtu Gas 2008 Market Sensitivities (After-Tax) Depreciation $(0.02) $3.45 $ / Share NOTE: Refer to “Key Assumptions” slide on Form 8-K filed on 12/19/07. (1) Estimated contribution to Exelon’s operating earnings guidance. (2) Primarily reflects the change in shares outstanding. Key Items: Nuclear volume: $(0.10) Nuclear fuel expense: $(0.06) State Line buyout: $(0.03) Market / portfolio: $0.12 Interest Expense $(0.03) Key Items: Inflation: $(0.07) Add’l refueling outages: $(0.06) Nuclear security: $(0.02) |
9 ComEd 2008 EPS Contribution ComEd’s operating earnings are expected to increase in 2008 primarily due to execution of its Regulatory Recovery Plan 2007 $200M RNF O&M Depreciation / Amortization Interest Expense Other $0.35 - $0.40 $0.30 $0.19 $0.04 ($0.02) $(0.03) 2008 (1) $220M - $260M (2) $(0.08) Storms: $0.03 Uncollectible accounts: $0.02 ($0.04) Weather $ / Share NOTE: Refer to “Key Assumptions” slide on Form 8-K filed on 12/19/07. (1) Estimated contribution to Exelon’s operating earnings guidance. (2) Assumes full $361M revenue increase granted in current distribution rate case and effective 10/1/08. Key Items: Distribution case (2) : $0.09 Transmission revenue: $0.04 Load growth: $0.03 Key Items: Income tax settlements: $(0.07) |
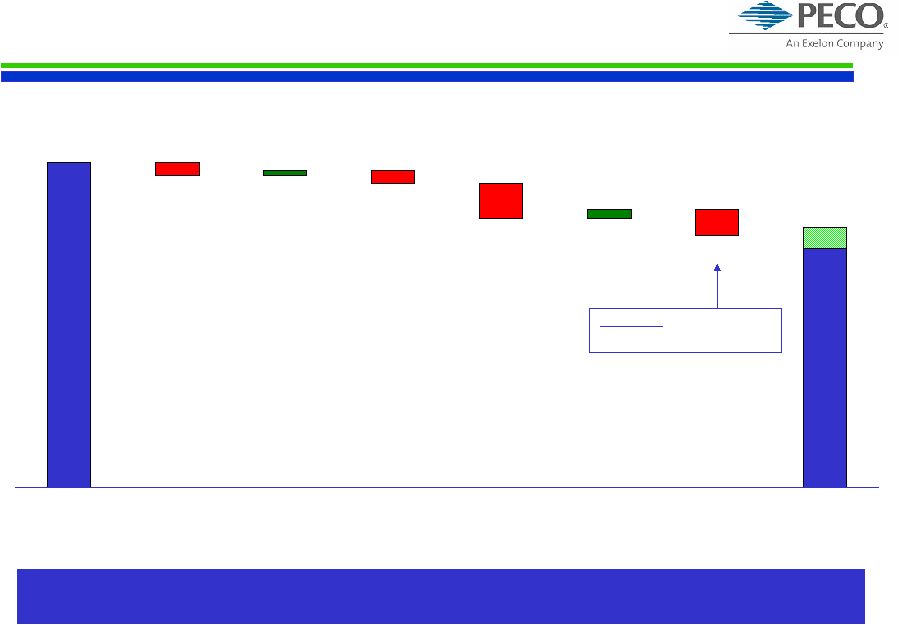
10 PECO 2008 EPS Contribution PECO’s operating earnings are expected to decrease in 2008 primarily due to increasing CTC amortization expense 2007 $507M 2008 (1) $360M - $400M $0.75 ($0.08) $0.01 ($0.03) ($0.06) $0.55 - $0.60 RNF O&M CTC Amortization / Depreciation Other NOTE: Refer to “Key Assumptions” slide on Form 8-K filed on 12/19/07. (1) Estimated contribution to Exelon’s operating earnings guidance. ($0.03) Weather $0.02 Interest Expense $ / Share Key Items: Tax settlements: $(0.08) |
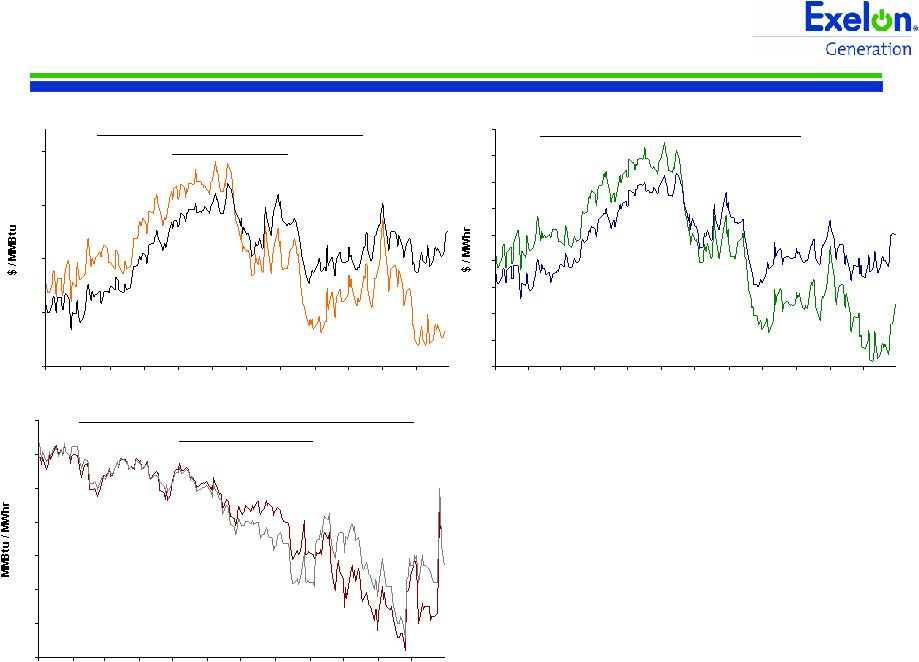
11 11 7 7.2 7.4 7.6 7.8 8 8.2 8.4 8.6 8.8 Jan- 07 Feb- 07 Mar- 07 Apr- 07 May- 07 Jun- 07 Jul- 07 Aug- 07 Sep- 07 Oct- 07 Nov- 07 Dec- 07 55 60 65 70 75 80 85 90 Jan- 07 Feb- 07 Mar- 07 Apr- 07 May- 07 Jun- 07 Jul- 07 Aug- 07 Sep- 07 Oct- 07 Nov- 07 Dec- 07 7.4 7.6 7.8 8 8.2 8.4 8.6 8.8 9 9.2 9.4 Jan- 07 Feb- 07 Mar- 07 Apr- 07 May- 07 Jun- 07 Jul- 07 Aug- 07 Sep- 07 Oct- 07 Nov- 07 Dec- 07 Market Price Snapshot As of December 31, 2007. Source: OTC quotes and electronic trading system. Quotes are daily. Forward NYMEX Natural Gas PJM-West and Ni-Hub On-Peak Forward Prices PJM-West On-Peak Implied Heat Rate Ni-Hub On-Peak Implied Heat Rate 8.84 9.04 9.24 9.44 9.64 9.84 10.04 10.24 10.44 10.64 10.84 Jan- 07 Feb- 07 Mar- 07 Apr- 07 May- 07 Jun- 07 Jul- 07 Aug- 07 Sep- 07 Oct- 07 Nov- 07 Dec- 07 2008 2009 2009 2008 2008 PJM-West 2009 PJM-West 2009 Ni-Hub 2008 Ni-Hub 2008 2009 |
12 12 7.7 7.8 7.9 8 8.1 8.2 8.3 8.4 Jan- 07 Feb- 07 Mar- 07 Apr- 07 May- 07 Jun- 07 Jul- 07 Aug- 07 Sep- 07 Oct- 07 Nov- 07 Dec- 07 56 58 60 62 64 66 68 70 72 74 Jan- 07 Feb- 07 Mar- 07 Apr- 07 May- 07 Jun- 07 Jul- 07 Aug- 07 Sep- 07 Oct- 07 Nov- 07 Dec- 07 7 7.5 8 8.5 9 Jan- 07 Feb- 07 Mar- 07 Apr- 07 May- 07 Jun- 07 Jul- 07 Aug- 07 Sep- 07 Oct- 07 Nov- 07 Dec- 07 Market Price Snapshot 2008 2009 2008 2009 As of December 31, 2007. Source: OTC quotes and electronic trading system. Quotes are daily. 2008 2009 Houston Ship Channel Natural Gas Forward Prices ERCOT North ATC Forward Prices ERCOT North ATC v. Houston Ship Channel Implied Heat Rate |
13 Appendix – GAAP Reconciliation |
14 GAAP EPS Reconciliation Three Months Ended December 31, 2006 $0.72 $(0.02) $0.18 $0.17 $0.39 2006 Adjusted (non-GAAP) Operating Earnings (Loss) Per Share (0.14) - - (0.14) - Recovery of severance charges at ComEd (0.04) (0.04) - - - Investments in synthetic fuel-producing facilities 0.03 - - - 0.03 Mark-to-market adjustments from economic hedging activities $0.87 $0.02 $0.18 $0.31 $0.36 Q4 2006 GAAP Earnings Per Share Exelon Other (1) PECO (1) ComEd (1) ExGen (1) (1) Amounts shown per Exelon share and represent contributions to Exelon's EPS |
15 GAAP EPS Reconciliation Three Months Ended December 31, 2007 (1) Amounts shown per Exelon share and represent contributions to Exelon's EPS 0.28 - - 0.01 0.27 2007 Illinois electric rate settlement 0.02 - - 0.02 - City of Chicago settlement 0.11 - - - 0.11 Georgia Power tolling agreement 0.03 - - - 0.03 Mark-to-market adjustments from economic hedging activities $1.02 $(0.06) $0.17 $0.13 $0.78 2007 Adjusted (non-GAAP) Operating Earnings (Loss) Per Share (0.04) (0.08) - - 0.04 Non-cash deferred tax items (0.19) - - - (0.19) Termination of State Line PPA (0.03) (0.03) - - - Investments in synthetic fuel-producing facilities $0.84 $0.05 $0.17 $0.10 $0.52 Q4 2007 GAAP Earnings Per Share Exelon Other (1) PECO (1) ComEd (1) ExGen (1) |
16 GAAP EPS Reconciliation Year Ended December 31, 2006 $3.22 $(0.11) $0.67 $0.78 $1.88 2006 Adjusted (non-GAAP) Operating Earnings (Loss) Per Share $2.35 $(0.21) $0.65 $(0.17) $2.08 2006 GAAP Earnings (Loss) Per Share - - - - - 0.06 0.04 - Other (1) (0.14) 1.15 (0.08) - 0.01 0.01 - - ComEd (1) - - - (0.13) 0.01 0.01 - (0.09) ExGen (1) - - - - 0.01 0.01 - - PECO (1) Exelon 1.15 Impairment of ComEd’s goodwill (0.08) Recovery of debt costs at ComEd 0.03 Severance charges (0.13) Nuclear decommissioning obligation reduction (0.14) Recovery of severance costs at ComEd 0.09 Charges related to now terminated merger with PSEG 0.04 Investments in synthetic fuel-producing facilities (0.09) Mark-to-market adjustments from economic hedging activities (1) Amounts shown per Exelon share and represent contributions to Exelon's EPS |
17 GAAP EPS Reconciliation Year Ended December 31, 2007 (1) Amounts shown per Exelon share and represent contributions to Exelon's EPS (0.01) - - - (0.01) Settlement of a tax matter at Generation related to Sithe (0.04) (0.08) - - 0.04 Non-cash deferred tax items (0.14) (0.14) - - - Investments in synthetic fuel-producing facilities 0.41 - - 0.03 0.38 2007 Illinois electric rate settlement (0.19) - - - (0.19) Termination of State Line PPA 0.11 - - - 0.11 Georgia Power tolling agreement Exelon Other (1) PECO (1) ComEd (1) ExGen (1) $4.32 $(0.18) $0.75 $0.30 $3.45 2007 Adjusted (non-GAAP) Operating Earnings (Loss) Per Share (0.01) - - - (0.01) Sale of Generation's investments in TEG and TEP 0.02 - - 0.02 - City of Chicago settlement (0.03) - - - (0.03) Nuclear decommissioning obligation reduction 0.15 - - - 0.15 Mark-to-market adjustments from economic hedging activities $4.05 $0.04 $0.75 $0.25 $3.01 2007 GAAP Earnings Per Share |