 Sustainable Value Merrill Lynch 2008 Power & Gas Leaders Conference New York, NY September 23, 2008 Matthew Hilzinger Senior Vice President & Chief Financial Officer Exhibit 99.1 |
 2 Forward-Looking Statements This presentation includes forward-looking statements within the meaning of the Private Securities Litigation Reform Act of 1995, that are subject to risks and uncertainties. The factors that could cause actual results to differ materially from these forward-looking statements include those discussed herein as well as those discussed in (1) Exelon’s 2007 Annual Report on Form 10-K in (a) ITEM 1A. Risk Factors, (b) ITEM 7. Management’s Discussion and Analysis of Financial Condition and Results of Operations and (c) ITEM 8. Financial Statements and Supplementary Data: Note 19; (2) Exelon’s Second Quarter 2008 Quarterly Report on Form 10-Q in (a) Part II, Other Information, ITEM 1A. Risk Factors and (b) Part I, Financial Information, ITEM 1. Financial Statements: Note 12; and (3) other factors discussed in filings with the Securities and Exchange Commission by Exelon Corporation, Exelon Generation Company, LLC, Commonwealth Edison Company, and PECO Energy Company (Companies). Readers are cautioned not to place undue reliance on these forward-looking statements, which apply only as of the date of this presentation. None of the Companies undertakes any obligation to publicly release any revision to its forward-looking statements to reflect events or circumstances after the date of this presentation. This presentation includes references to adjusted (non-GAAP) operating earnings that exclude the impact of certain factors. We believe that these adjusted operating earnings are representative of the underlying operational results of the Companies. Please refer to the appendix to this presentation for a reconciliation of adjusted (non-GAAP) operating earnings to GAAP earnings. |
 3 Key Messages • Rock solid in these turbulent financial times – Operations are stronger than ever – Strong balance sheet and ample access to liquidity – Fiscally disciplined with rigorous risk management and hedging programs • 2009 operating EPS range is expected to be generally flat relative to 2008 – Driven by a higher anticipated contribution at ComEd, offset by a lower forecasted contribution at Exelon Generation – Pursuing initiatives to address rising O&M and other costs • Uniquely positioned to create sustainable value – Largest nuclear fleet in the country – low-cost, low-emission – Operating at world-class levels – All in competitive markets |
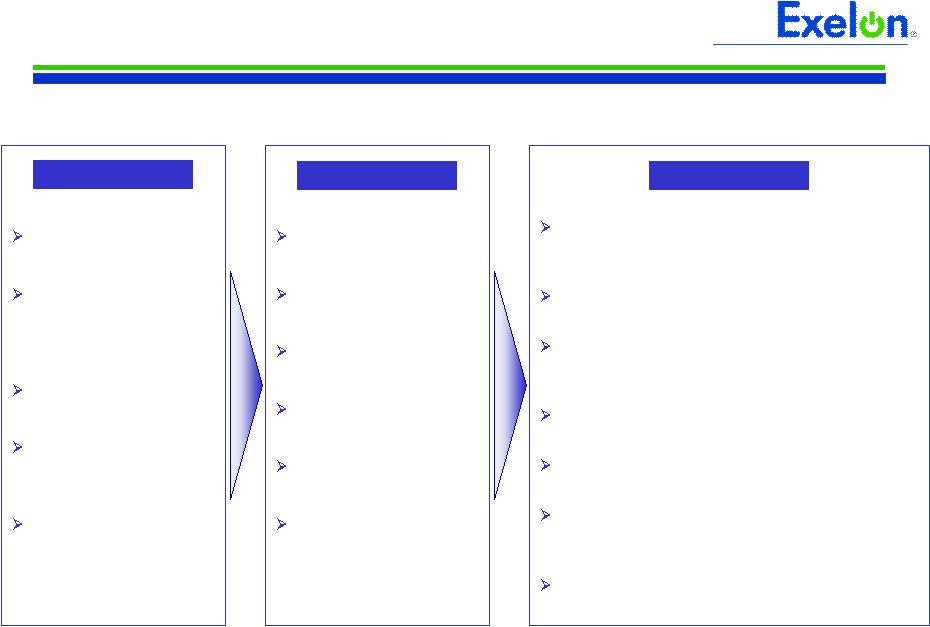
 4 Rock Solid in These Turbulent Times • Nuclear – profitable under almost any conceivable set of market conditions • Hedging program largely protects against commodity movements in the near term – ~96% financially hedged in 2008 Hedged Against Short-Term Volatility in Commodities • Maintaining and committed to strong investment grade ratings (Moody’s Baa1 issuer rating and S&P BBB+ corporate credit rating) • $7.3 billion in aggregate credit facility commitments that extend largely through 2012 – $6.9 billion available as of 9/18/08 – Over 20 banks committed to the facility – no bank has more than 10% of the aggregate commitments Ample Liquidity • Power marketing activities are governed by tight risk management policies – proprietary trading activities are minimal • Diversified, high quality counterparties • Daily monitoring of positions, exposure and financial condition of counterparties • Collateral required from non-investment grade counterparties Financially Disciplined • World-class nuclear operations – 92.4% capacity factor in 1 st half 2008 • Constructive rate cases at ComEd and PECO – Final ComEd rate order provides for $273.6 million increase in annual distribution revenues – Preliminary PECO agreement provides for $76.5 million increase in annual gas revenues, if approved Strong Operations Exelon Position Market turmoil may present more attractive M&A opportunities and Exelon’s strong position allows us to be opportunistic about growth |
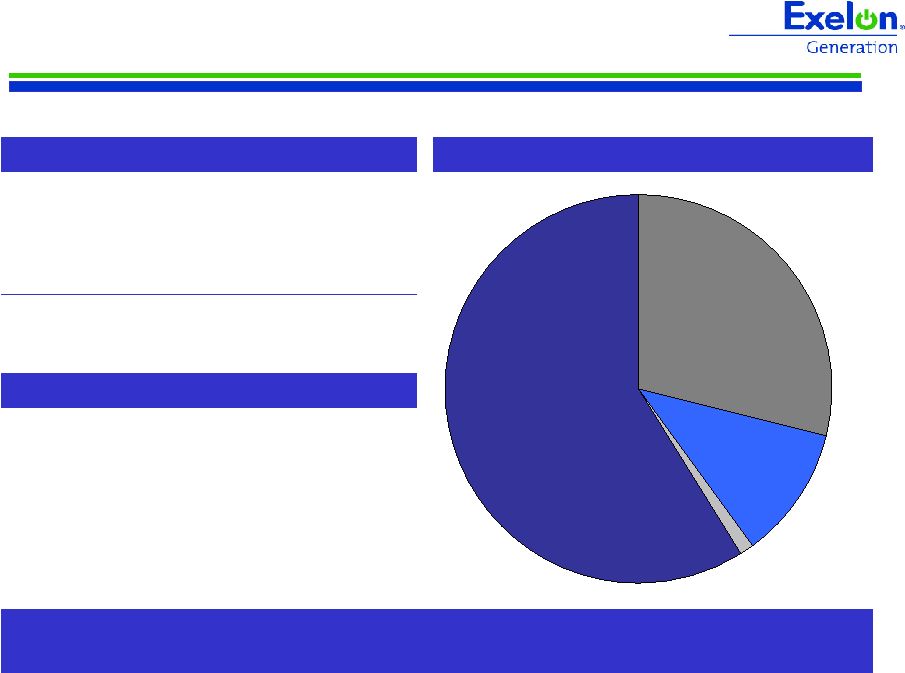 5 Exelon Generation Credit Exposure Net Exposure After Credit Collateral (1) (in millions) Investment grade $341 Non-investment grade 108 No external ratings 53 Total $502 Exelon Generation transacts with a diverse group of counterparties, predominantly all investment grade, and has ample liquidity to support its operations Exelon Generation - Ample Liquidity • Aggregate credit facility commitments of $4.8 billion that extend through 2012 – $4.7 billion available as of 9/18/08 • Strong balance sheet – A3/BBB+ Senior Unsecured Rating Net Exposure by Type of Counterparty (1) Coal 29% Financial Institutions 11% Investor-Owned Utilities, Marketers, and Power Producers 59% Other 1% (1) As of June 30, 2008. Does not include credit risk exposure from uranium procurement contracts or exposure through Regional Transmission Organizations and Independent System Operators. Additionally, does not include receivables related to the supplier forward agreement with ComEd and the PPA with PECO. |
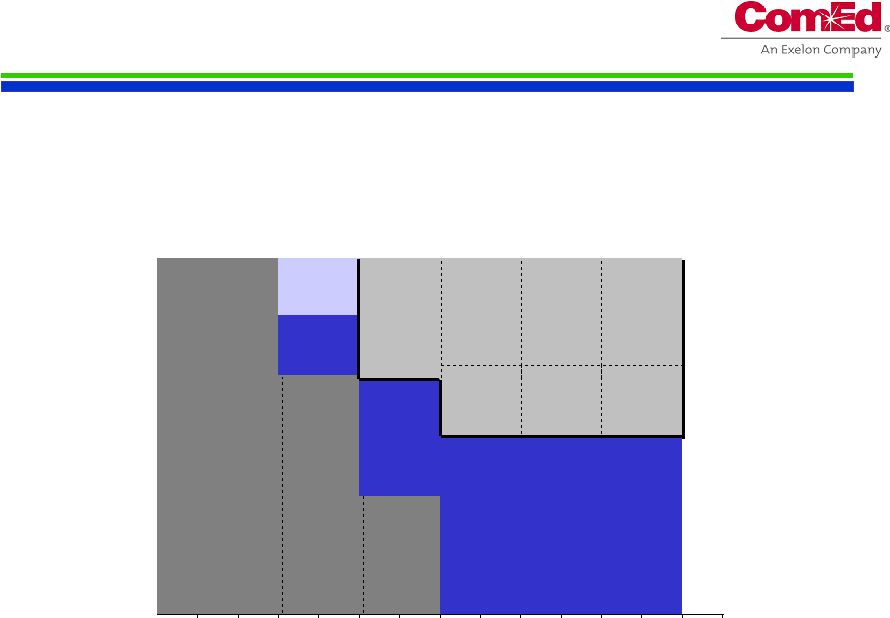
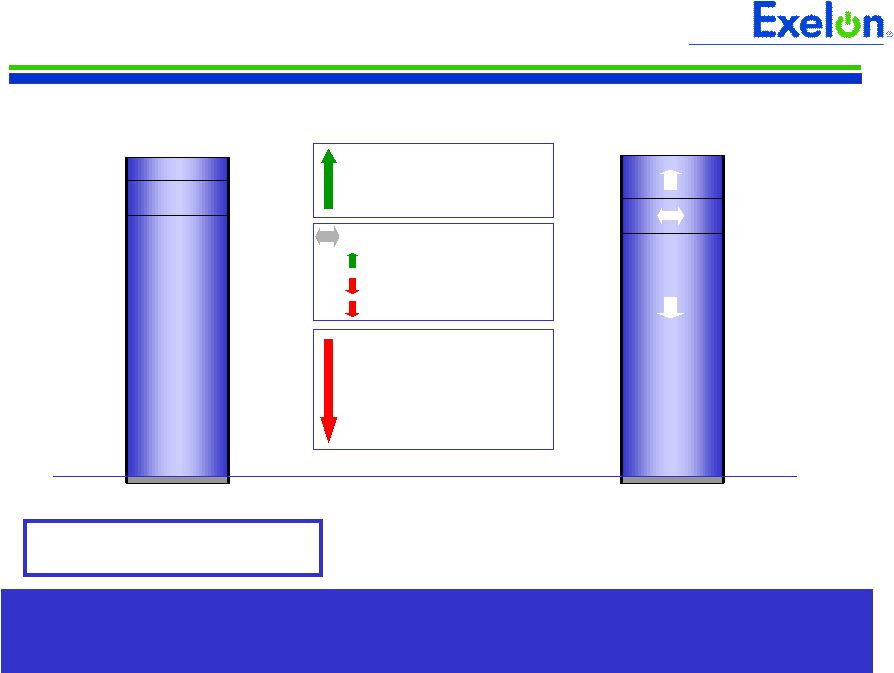    6 2008 - 2009 Operating EPS Drivers 2009E 2008E $0.45 - $0.50 $3.45 - $3.55 $4.15 - $4.30 ComEd PECO Exelon Generation + + 2009 Earnings Drivers Exelon’s 2009 operating EPS range is forecasted to be generally flat relative to 2008, driven by a higher expected ComEd contribution offset by a lower expected ExGen contribution ComEd PECO Exelon Generation Holdco Holdco Exelon (1) Primarily reflects 2008 option and uranium settlement gains at Exelon Generation. 3Q08 operating EPS forecasted to be at the bottom of 26-29% range $0.30 - $0.35 Market conditions ComEd distribution revenue PECO gas revenue Cost initiatives Pension/OPEB Inflation Higher nuclear fuel costs Nuclear volume Higher depreciation / amortization PECO CTC Discrete ExGen gains (1) O&M and other |
 7 Environmental / climate change concerns Slowing US economy and increasing inflationary cost pressures Energy dependence / geopolitical concerns Continued strong global growth in energy consumption Declining US reserve margins Massive capital investment Tightening regulatory environments Increasing cost of new build Technology improvements Increasing commodity prices Increasing capacity prices Macro Trends Market Response Well Positioned to Provide Sustainable Value Continued strong financial and operating performance, and long-term earnings growth driven by unregulated generation Largest, lowest-cost nuclear fleet in the US, all in competitive markets Executing regulatory recovery plan to put ComEd on a path toward appropriate returns and solid credit metrics Managing transition to competitive markets in Pennsylvania Increasingly strong cash flows and investment- grade balance sheet Alignment of and consistency between value return, hedging, capital structure and capital investment policies Well-positioned to capture growth opportunities and pursue low carbon energy strategy Exelon’s Position |
 8 Appendix |
 9 ComEd Executing on Regulatory Recovery Plan The ICC issued a final Order in ComEd’s distribution rate case – granting a revenue increase of $273.6 million to take effect on September 16, 2008: (14) 345 359 Depreciation and Amortization $(87) 274 361 Total Revenue Increase 3 129 132 Other Revenues (11) 987 998 O&M Expenses (22) 10.30% ROE / 45.04% Equity 10.75% ROE / 45.11% Equity ROE / Cap Structure $(43) $6,694 $7,071 Rate Base Impact on Revenue Increase ICC Order ComEd Original Request ($ in millions) |
 10 Illinois Power Agency Proposes ComEd Procurement Plan In September 2008, the Illinois Power Agency proposed its first ComEd procurement plan, which will provide for base-load energy procurement for up to a three-year period Auction Contracts Financial Swap 3/08 RFP Jun 2007 Jun 2008 Jun 2009 Jun 2010 Jun 2011 Jun 2012 Jun 2013 NOTE: For illustrative purposes only. Assumes constant load profile each year. 2009 2009 Future Procurement by Illinois Power Agency 2010 2010 2011 2012 2011 |
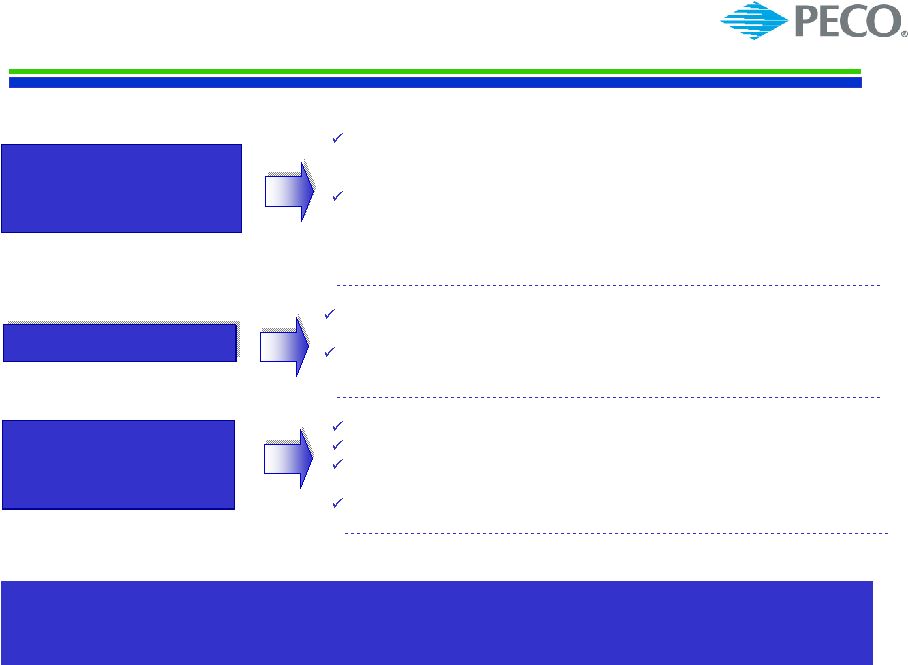   11 PECO Pursuing Regulatory Path PECO’s procurement plan for obtaining default service Post 2010 includes a portfolio of full requirements and spot products competitively procured through multiple RFP solicitations Mitigation plan includes early staggered procurement, post-rate cap phase-in, gradual phase-out of declining block rate design, customer education, enhanced retail choice program, and low-income rate design changes A Compact Fluorescent Light bulb rebate program for over 3 million bulbs An enhanced web-based energy audit / bill analyzer program Voluntary Residential Direct Load Control (air conditioning cycling) program for 75,000 customers Full and current cost recovery for the 3 programs Early phase-in proposal provides a voluntary opt-in program for customers to pre-pay towards 2011 prices Requested expedited PA PUC approval to allow for implementation July 1, 2009 PECO’s 3Q08 regulatory filings address procurement, rate mitigation, and energy efficiency – allowing PECO to execute on its regulatory strategy while continuing to support comprehensive energy legislation Early Phase-in Filing Energy Efficiency and Demand Side Response Default Service Procurement and Mitigation Filing |
 12 Large and Diverse Bank Group Exelon has a large and diverse bank group with over $7.3 billion in aggregate credit facility commitments – over 20 banks committed to the facility with no bank having more than 10% of bank commitments. • Bank of America, N.A. / Merrill Lynch USA (2) • The Royal Bank of Scotland PLC (RBS) • Barclays Bank PLC • JP Morgan Chase Bank, N.A. • The Bank of Nova Scotia (Scotia) • Wachovia Bank, N.A. • Citibank, N.A. • Commerzbank AG • BNP Paribas • Deutsche Bank AG, New York Branch • Credit Suisse, Cayman Islands Branch • Morgan Stanley Bank • UBS Loan Finance LLC • The Bank of New York / Mellon Bank, N.A. • Mizuho Corporate Bank, LTD • Goldman Sachs (3) • The Bank of Tokyo-Mitsubishi UFJ, LTD • KeyBank N.A. • U.S. Bank, N.A. • SunTrust Bank • Union Bank of California, N.A. • The Northern Trust Company • Malayan Banking Berhad (May Bank) • National City Bank Banks Committed to Exelon’s Facilities (1) (1) As of September 18, 2008. (2) Assumes that Bank of America assumes Merrill Lynch’s previous commitment. (3) Includes funding commitments by Williams Street Commitment Corporation, Williams Street Credit Corporation, Goldman Sachs Credit Partners, L.P. |
 13 Projected 2008 Key Credit Measures A3 A2 Baa2 Baa1 Moody’s Credit Ratings (3) BBB+ A BBB+ BBB S&P Credit Ratings (3) 3.2x 3.2x FFO / Interest ComEd: 16% 14% FFO / Debt 55% 58% Rating Agency Debt Ratio 4.7x 4.6x FFO / Interest PECO: 22% 19% FFO / Debt 50% 54% Rating Agency Debt Ratio 53% 66% Rating Agency Debt Ratio 71% 43% FFO / Debt 17.3x 8.4x FFO / Interest Exelon Generation: 65% 32% 6.5x Without PPA & Pension / OPEB (2) 71% Rating Agency Debt Ratio 25% FFO / Debt 5.3x FFO / Interest Exelon Consolidated: With PPA & Pension / OPEB (1) Notes: Projected credit measures reflect impact of Illinois electric rates and policy settlement. Exelon, ComEd and PECO metrics exclude securitization debt. See following slide for FFO (Funds from Operations)/Interest, FFO/Debt and Adjusted Book Debt Ratio reconciliations to GAAP. (1) Reflects S&P updated guidelines, which include imputed debt and interest related to purchased power agreements (PPA), unfunded pension and other postretirement benefits (OPEB) obligations, capital adequacy for energy trading, operating lease obligations, and other off-balance sheet debt. Debt is imputed for estimated pension and OPEB obligations by operating company. (2) Excludes items listed in note (1) above. (3) Current senior unsecured ratings for Exelon and Generation and senior secured ratings for ComEd and PECO as of 9/18/08. |
 14 FFO Calculation and Ratios FFO Calculation = FFO - PECO Transition Bond Principal Paydown + Gain on Sale, Extraordinary Items and Other Non-Cash Items (3) + Change in Deferred Taxes + Depreciation, amortization (including nucl fuel amortization), AFUDC/Cap. Interest Add back non-cash items: Net Income Adjusted Interest FFO + Adjusted Interest = Adjusted Interest + 7% of Present Value (PV) of Operating Leases + Interest on imputed debt related to PV of Purchased Power Agreements (PPA), unfunded Pension and Other Postretirement Benefits (OPEB) obligations, and Capital Adequacy for Energy Trading (2) , as applicable - PECO Transition Bond Interest Expense Net Interest Expense (Before AFUDC & Cap. Interest) FFO Interest Coverage + Capital Adequacy for Energy Trading (2) FFO = Adjusted Debt + PV of Operating Leases + 100% of PV of Purchased Power Agreements (2) + Unfunded Pension and OPEB obligations (2) + A/R Financing Add off-balance sheet debt equivalents: - PECO Transition Bond Principal Balance + STD + LTD Debt: Adjusted Debt (1) FFO Debt Coverage Rating Agency Capitalization Rating Agency Debt Total Adjusted Capitalization Adjusted Book Debt = Total Rating Agency Capitalization + Off-balance sheet debt equivalents (2) - Goodwill Total Adjusted Capitalization = Rating Agency Debt + ComEd Transition Bond Principal Balance + Off-balance sheet debt equivalents (2) Adjusted Book Debt = Total Adjusted Capitalization + Adjusted Book Debt + Preferred Securities of Subsidiaries + Total Shareholders' Equity Capitalization: = Adjusted Book Debt - Transition Bond Principal Balance + STD + LTD Debt: Debt to Total Cap Note: Reflects S&P guidelines and company forecast. FFO and Debt related to non-recourse debt are excluded from the calculations. (1) Uses current year-end adjusted debt balance. (2) Metrics are calculated in presentation unadjusted and adjusted for debt equivalents and related interest for PPAs, unfunded Pension and OPEB obligations, and Capital Adequacy for Energy Trading. (3) Reflects depreciation adjustment for PPAs and decommissioning interest income and contributions. |
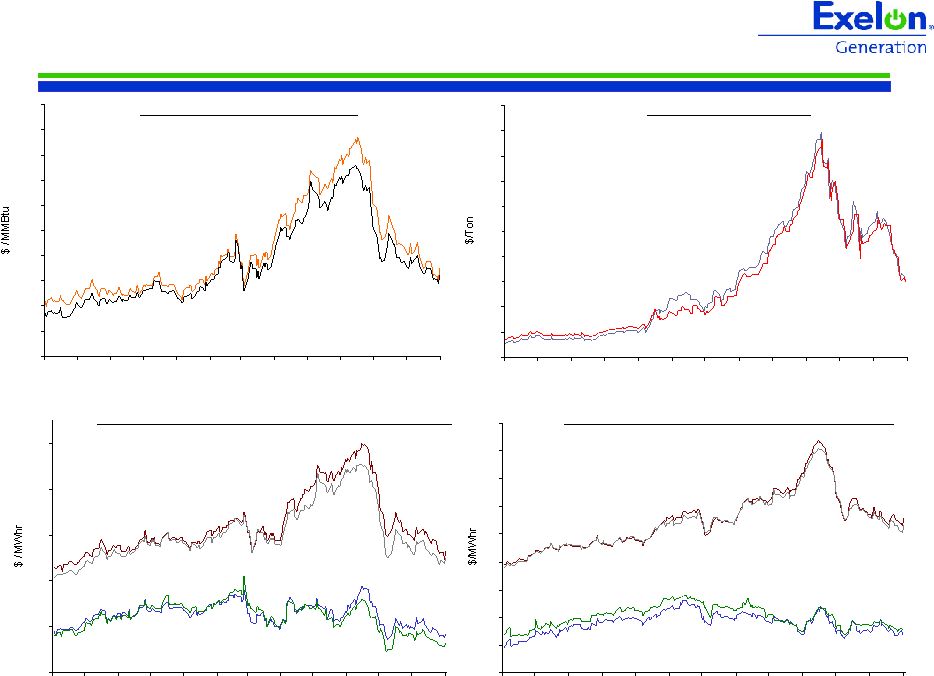 15 30 35 40 45 50 55 60 65 70 75 9/07 10/07 11/07 12/07 1/08 2/08 3/08 4/08 5/08 6/08 7/08 8/08 9/08 Forward NYMEX Natural Gas PJM-West and Ni-Hub On-Peak Forward Prices PJM-West and Ni-Hub Wrap Forward Prices 2010 Ni-Hub 2011 Ni-Hub 2011 PJM-West 2010 PJM-West 2010 2011 Market Price Snapshot Rolling 12 months, as of September 17, 2008. Source: OTC quotes and electronic trading system. Quotes are daily. 2010 Ni-Hub 2011 Ni-Hub 2011 PJM-West 2010 PJM-West Forward NYMEX Coal 2010 2011 55 65 75 85 95 105 9/07 10/07 11/07 12/07 1/08 2/08 3/08 4/08 5/08 6/08 7/08 8/08 9/08 7 7.5 8 8.5 9 9.5 10 10.5 11 11.5 12 9/07 10/07 11/07 12/07 1/08 2/08 3/08 4/08 5/08 6/08 7/08 8/08 9/08 50 60 70 80 90 100 110 120 130 140 150 9/07 10/07 11/07 12/07 1/08 2/08 3/08 4/08 5/08 6/08 7/08 8/08 9/08 |
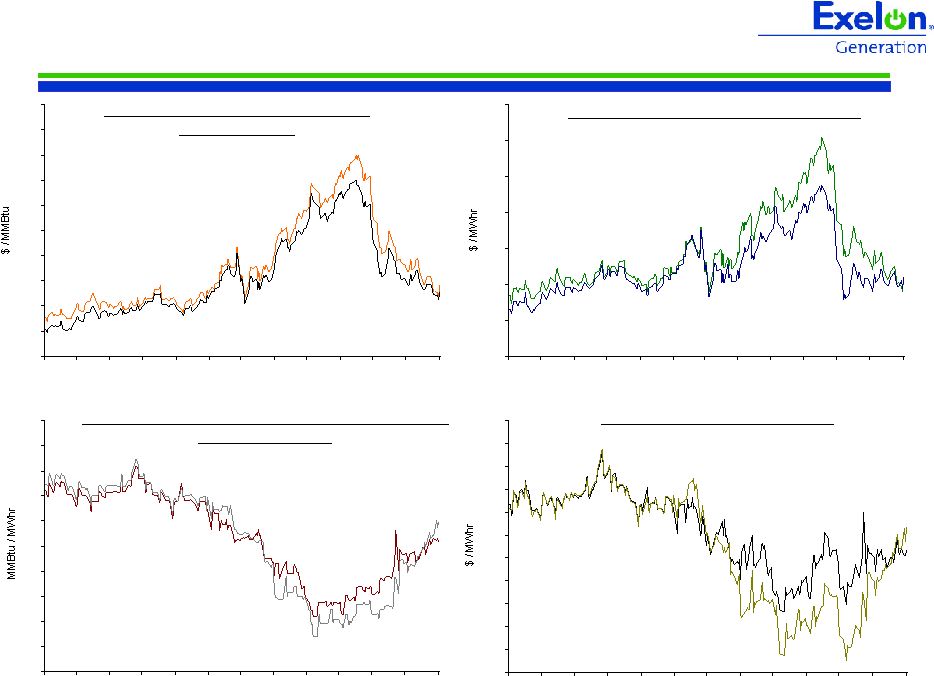 2011 2010 2010 2011 2010 2011 Houston Ship Channel Natural Gas Forward Prices ERCOT North On-Peak Forward Prices ERCOT North On-Peak v. Houston Ship Channel Implied Heat Rate 2010 2011 ERCOT On Peak Spark Spread Assumes a 7.2 Heat Rate, $1.50 O&M, and $.15 adder Market Price Snapshot Rolling 12 months, as of September 17, 2008. Source: OTC quotes and electronic trading system. Quotes are daily. 8 8.2 8.4 8.6 8.8 9 9.2 9.4 9.6 9.8 10 9/07 10/07 11/07 12/07 1/08 2/08 3/08 4/08 5/08 6/08 7/08 8/08 9/08 65 70 75 80 85 90 95 100 9/07 10/07 11/07 12/07 1/08 2/08 3/08 4/08 5/08 6/08 7/08 8/08 9/08 7 7.5 8 8.5 9 9.5 10 10.5 11 11.5 12 9/07 10/07 11/07 12/07 1/08 2/08 3/08 4/08 5/08 6/08 7/08 8/08 9/08 7.5 8.5 9.5 10.5 11.5 12.5 13.5 14.5 15.5 16.5 17.5 18.5 9/07 10/07 11/07 12/07 1/08 2/08 3/08 4/08 5/08 6/08 7/08 8/08 9/08 16 |
 17 2008/2009 Earnings Outlook • Exelon’s outlook for 2008/2009 adjusted (non-GAAP) operating earnings excludes the earnings impacts of the following: • Mark-to-market adjustments from economic hedging activities • Unrealized gains and losses from nuclear decommissioning trust fund investments • Significant impairments of assets, including goodwill • Significant changes in decommissioning obligation estimates • Costs associated with the Illinois electric rate settlement agreement, including ComEd’s previously announced customer rate relief programs • Costs associated with ComEd’s settlement with the City of Chicago • Other unusual items • Significant future changes to GAAP • Both our operating earnings and GAAP earnings guidance are based on the assumption of normal weather for the remainder of 2008 and for full year 2009 |