1 Macquarie Global Infrastructure Conference May 25, 2010 Exhibit 99.1 |
2 Forward-Looking Statements This presentation includes forward-looking statements within the meaning of the Private Securities Litigation Reform Act of 1995, that are subject to risks and uncertainties. The factors that could cause actual results to differ materially from these forward-looking statements include those discussed herein as well as those discussed in (1) Exelon’s 2009 Annual Report on Form 10-K in (a) ITEM 1A. Risk Factors, (b) ITEM 7. Management’s Discussion and Analysis of Financial Condition and Results of Operations and (c) ITEM 8. Financial Statements and Supplementary Data: Note 18; (2) Exelon’s First Quarter 2010 Quarterly Report on Form 10-Q in (a) Part II, Other Information, Item 1A. Risk Factors, (b) Part 1, Financial Information, Item 2. Management’s Discussion and Analysis of Financial Condition and Results of Operations and (c) Part I , Financial Information, Item 1. Financial Statements: Note 12 and (3) other factors discussed in filings with the Securities and Exchange Commission (SEC) by Exelon Corporation, Commonwealth Edison Company, PECO Energy Company and Exelon Generation Company, LLC (Companies). Readers are cautioned not to place undue reliance on these forward-looking statements, which apply only as of the date of this presentation. None of the Companies undertakes any obligation to publicly release any revision to its forward- looking statements to reflect events or circumstances after the date of this presentation. |
3 Table of Contents • Exelon Generation 4 • ComEd 32 • PECO 37 |
4 |
5 Exelon Generation Consistently Delivers Top-Tier Results Exelon Generation has ability to replicate best practices on a large scale 2009 • 93.6% capacity factor – the 7 th consecutive year exceeding 93% • Clinton and Quad Cities 1 units - new continuous run records of 596 and 594 days, respectively • TMI 1 unit set a new PWR world record for a 705-day continuous run 2010 YTD • Limerick 1 unit set a new continuous run record of 727 days (second longest in the US) • Byron 2 unit – new continuous run record of 541 days Nuclear Fleet Achievements • Premier merchant generator of electricity • Largest nuclear operator in U.S. with 18% of nuclear output; third largest in the world • Ownership interest in 19 operating nuclear reactors • Top quartile performance in capacity factors and generating cost among nuclear fleets in U.S. • Geographically well-situated in competitive markets and part of PJM, the largest RTO Exelon Generation Highlights 0 200 400 600 800 Byron 2 Quad Cities 1 Clinton Three Mile Island 1 Three Mile Island 1 LaSalle 2 Three Mile Island 1 LaSalle 1 Three Mile Island 1 Three Mile Island 1 Peach Bottom-3 Peach Bottom-3 LaSalle 2 Limerick 1 LaSalle 1 (Days) Source: Platts News Flashes and Company Press Releases, 4/26/10 Nuclear Reliability 30 Longest Continuous U.S. Runs |
6 Nuclear Uprates Offer Sustainable Value Key component of Exelon 2020 low carbon roadmap Creates additional low- carbon generation capacity Uprates equivalent in size to a new nuclear plant but significantly lower cost, shorter timeline, and more predictable expenditures No ongoing incremental O&M expense Capitalizes on Exelon’s proven track record of uprate execution Dedicated project management team Proven technology design Allows us to adjust timing to respond to market conditions Straightforward regulatory and environmental licenses, permits and approvals Potential for uprates to meet state alternative energy standards Uprate projects enable cost-effective growth and leverage Exelon’s operational excellence Strategic Value Regulatory Feasibility Execution Feasibility |
7 Three Major Categories of Exelon Uprates Uprates Overnight Cost (1) MUR (Measurement Uncertainty Recapture) • Through the use of advanced techniques and more precise instrumentation, reactor power can be more accurately calculated • Can achieve up to 1.7% additional output • Requires NRC approval 187–234 MW $300M 2 years 899–1,016 MW $2,400M EPU (Extended Power Uprate) • Through a combination of more sophisticated analysis and upgrades to plant equipment, uprates can increase output by as much as 20% of original licensed power level • Requires NRC approval 3 - 6 years 237–266 MW $800M Megawatt Recovery and Component Upgrades • Replacement of major components in the plant occur in the normal life cycle process – with newer technology, replacements result in increased efficiency • Equipment includes generators, turbines, motors and transformers • Megawatt Recovery and Component Upgrades must conform to NRC standards, but do not require additional NRC approval 3-4 years ~1,300–1,500 MW $3,500M Project Duration Refined scenario analysis highlights that uprates continue to be economic (1) In 2007 dollars. Overnight costs do not include financing costs or cost escalation. Estimated Internal Rate of Return 11-13% 14-16% 11-14% |
8 Multi-Regional Nuclear Uprate Program 73 2 12 59 MW Online to Date 2011 / 2012 32 25 Peach Bottom 2011 / 2010 110 95 Quad Cities 2014 15 12 TMI 2014 / 2013 31 25 Dresden 2013 / 2013 23 19 Quad Cities 2012 / 2012 42 34 Byron 2012 / 2012 42 34 Braidwood 2011 / 2011 41 33 Limerick 2011 / 2011 40 32 LaSalle 2014 / 2015 3 3 Peach Bottom MUR: 2012 / 2013 6 6 Limerick 2012 / 2013 110 103 Dresden 2011 / 2012 5 5 Dresden EPU: MW Recovery & Component Upgrades: 2016 / 2017 340 306 Limerick 1,516 1,323 Total 172 336 17 148 3 Max Potential MW 2016 138 TMI 2016 / 2015 303 LaSalle 2016 17 Clinton 2015 / 2016 134 Peach Bottom 2010 2 Clinton Year of Full Operation by Unit Base Case MW Station Executing uprate projects across our geographically diverse nuclear fleet TMI Limerick Peach Bottom Total Midwest Uprates: 666-759 MW Total Mid-Atlantic Uprates: 657-757 MW Quad Cities Dresden Byron LaSalle Clinton Braidwood Notes: MW shown at ownership. |
9 Phased Execution Lowers Risk Approximately 80 MW scheduled to be completed in 2009 and 2010; total expenditures expected to be $4,400 million from 2008 – 2017 (1) (1) Dollars shown are nominal, reflecting 6% escalation, in millions. $150 $350 $550 $675 $625 $725 $725 $400 $150 $ millions • Highest return projects are being completed in the early years • Leverages Exelon’s substantial experience managing successful uprate projects – 1,100 MW completed between 1999 - 2008 $50 Exelon's Uprate Plan Expenditures $0 $100 $200 $300 $400 $500 $600 $700 $800 2008A 2009A 2010E 2011E 2012E 2013E 2014E 2015E 2016E 2017E 0 200 400 600 800 1,000 1,200 1,400 1,600 Megawatt Recovery MUR EPU MW Online (Cumulative) Note: MW shown at ownership. Data contained in this slide is rounded. |
10 Quad Cities Uprate Program • MW Recovery – Unit 2 Low Pressure Turbine Retrofit completed April 2010, increase of 48 MW achieved – Unit 1 Low Pressure Retrofit planned for Spring 2011 – Partial completion of Unit 1 work has resulted in an increase of 11 MW • MUR – Planned start date of project will be in 2011 – Timing of uprate will be dependent on NRC approval of license amendment • EPU – Completed in 2002 Scheduled start in 2011 1Q2013 9 2Q2013 9 MUR * Capital investment and MW uprate numbers represent Exelon’s 75% ownership stake in Quad Cities Station. In progress 2Q2010 48 3Q2011 47 MW Recovery (Low Pressure Turbine Retrofit) Status Online Date MW Increase* Online Date MW Increase* Uprate Project Unit 2 Unit 1 Quad Cities Uprate Projects are underway – additional MWs will come on line between 2010 and 2013 Capital Investment $M* $0 $50 $100 2009 2010 2011 2012 2013 2014 2015 2016 MW Recovery and Component Upgrade MUR |
11 Peach Bottom Uprate Program • MW Recovery – Project in progress with Low Pressure Turbine Retrofit installations expected in 2011 and 2012 – Replace Reactor Recirculation Pump Motor Generator sets with energy efficient Adjustable Speed Drives in 2014 and 2015 • MUR – Completed in 2003 • EPU – Funding approved for design work – Will review in 2011 before authorizing installation funding for physical plant modifications and purchase of materials Peach Bottom Uprate Projects are underway – additional MWs will come online between 2011 and 2016 Capital Investment $M* $0 $50 $100 $150 2009 2010 2011 2012 2013 2014 2015 2016 2017 MW Recovery and Component Upgrade EPU * Capital investment and MW uprate numbers represent Exelon’s 50% ownership stake in Peach Bottom Station. In progress 4Q2011 11 4Q2012 14 MW Recovery (Low Pressure Turbine Retrofit) Design phase in progress 1Q2016 67 1Q2015 67 EPU Scheduled to start in 2012 4Q2015 2 4Q2014 2 MW Recovery (Adjustable Speed Drives) Status Online Date MW Increase* Online Date MW Increase* Uprate Project Unit 3 Unit 2 |
12 Dresden Uprate Program • MW Recovery – Project in progress with Low Pressure Turbine Retrofit installations expected in 2011 and 2012 – Partial completion of Unit 2 work has resulted in an increase of 12 MW – Replace Reactor Recirculation Pump Motor Generator sets with energy efficient Adjustable Speed Drives in 2011 and 2012 • MUR – Planned start date of project will be in 2011 – Timing of uprate will be dependent on NRC approval of license amendment • EPU – Completed in 2002 Dresden Uprate Projects are underway – additional MWs will come online between 2011 and 2014 Capital Investment $M $0 $50 $100 $150 $200 2009 2010 2011 2012 2013 2014 2015 2016 2017 MW Recovery and Component Upgrade MUR In progress 4Q2012 3 4Q2011 3 MW Recovery (Adjustable Speed Drives) Scheduled start in 2011 1Q2013 12 1Q2014 12 MUR In progress 1Q2013 51 1Q2012 52 MW Recovery (Low Pressure Turbine Retrofit) Status Online Date MW Increase Online Date MW Increase Uprate Project Unit 3 Unit 2 |
13 13 13 13 13 13 13 13 13 Nuclear Assets Levered to Economic Recovery – 2011 & Beyond Exelon uniquely captures any margin upside from increasing power prices given our low-cost nuclear generation (1) Both supply and demand include effects of First Energy’s generation and forecasted load, respectively, joining PJM. Illustrated unit costs are of existing PJM generation using 2011 fuel prices as of 4/30/2010. Sources: CEMS, Energy Velocity, SNL, Exelon Proprietary Information 2009 – Exelon Generation Owned Output (MWh) Nuclear 93% Coal 5% Oil <1% Gas 1% Renewables 1% PJM Supply Curve (1) |
14 111.91 148.80 102.04 191.32 174.29 110.00 16.46 133.37 139.73 27.73 226.15 245.00 2008/2009 2009/2010 2010/2011 2011/2012 2012/2013 2013/2014 RTO MAAC + APS MAAC Eastern MAAC Only shown if cleared at separate price and generation is located in that zone (1) Reliability Pricing Model (RPM) Auction PJM RPM Auction ($/MW-day) Exelon Generation Eligible Capacity within PJM Reliability Pricing Model (2) Note: Data contained on this slide is rounded. (1) MAAC = Mid-Atlantic Area Council; APS = Allegheny Power System. (2) All generation values are approximate and not inclusive of wholesale transactions. (3) All capacity values are in installed capacity terms (summer ratings) located in the areas. (4) Obligation represents the remainder of the ComEd auction load that ends in May 2010. (5) Obligation consists of load obligations from PECO. PECO PPA expires December 2010. (6) Elwood contract expires on 12/31/12 and Kincaid contract expires on 2/28/13. (7) Reflects decision in December 2010 to permanently retire Cromby Station and Eddystone Units 1&2 as of 5/31/11. None of these 933 MW cleared in the 2011/2012 or 2012/2013 auctions. (8) Weighted average $/MW-Day would apply if all generation cleared in the highlighted zones. $134.46 1,500 8,700 (7) 10,300 (6) Capacity (3) 2013/2014 2009/2010 2010/2011 2011/2012 2012/2013 in MW Capacity (3) Obligation Capacity (3) Obligation Capacity (3) Capacity (3) RTO 12,800 3,800 - 4,100 (5) 23,900 9,300 - 9,400 (4) 23,200 12,100 (6) EMAAC 9,500 MAAC + APS 11,100 9,300 – 9,400 (5) MAAC 1,500 Avg ($/MW-Day) (8) $143.90 $174.29 $110.00 $74.75 |
15 Retiring Cromby Station and Eddystone Units 1&2 • Agreed to delay deactivation of two units to maintain reliability (1) , provided receipt of required environmental permits and adequate cost-based compensation – Maintained scheduled retirement date of 5/31/11 for Cromby 1 and Eddystone 1 – Revised retirement dates for Cromby 2 to 12/31/11 and Eddystone 2 to 12/31/12 • RMR to be filed with FERC in 2Q10 to compensate for cost of maintaining and operating units beyond 5/31/11 – Reimburses Exelon for costs to keep units running and allows for a reasonable rate of return on investment, which is estimated at $2.6 million per RMR-month for Cromby Unit 2 and $8.0 million per RMR-month for Eddystone Unit 2, plus $19.3 million in project investment – Targeting final approval by 4Q10 • Retirements yield ~$165-200 million incremental NPV vs. continuing to operate the units – Avoids ongoing operating and capital costs on aging units – Cromby and Eddystone have not cleared in the past two RPM capacity auctions (2011/12 and 2012/13) – Anticipates more stringent environmental regulations and avoids related capital investment $80 $85 $40 Capital Expenditure Reduction $40 $18 $24 Incremental Pre-Tax Operating Income 45 22 0 Depreciation Savings 75 46 24 Operating O&M Savings $(80) $(50) $0 Revenue Net Fuel 2012 2011 2010 ($ in millions) Smaller, less efficient coal plants are challenged by economic and environmental considerations Ongoing Savings Impact (1) See PJM’s website (http://www.pjm.com/planning/generation-retirements/gr-study-results.aspx) for additional details regarding PJM’s Deactivation Study and Exelon’s response. Note: RMR = reliability must-run agreement |
16 Effectively Managing Nuclear Fuel Costs Components of Fuel Expense in 2009 Projected Total Nuclear Fuel Spend Projected Exelon Average Uranium Cost vs. Market Projected Exelon Uranium Demand Note: At Ownership. Excludes costs reimbursed under the settlement agreement with the DOE. 2010–2012, 2014: 100% hedged in volume 2013: ~92% hedged in volume All charts exclude Salem 0.0 2.0 4.0 6.0 8.0 10.0 2009A 2010 2011 2012 2013 2014 0 200 400 600 800 1,000 1,200 1,400 2009A 2010 2011 2012 2013 2014 Nuclear Fuel Expense (Amortization + Spent Fuel) Nuclear Fuel Capex 0% 10% 20% 30% 40% 50% 60% 70% 80% 90% 100% 2009A 2010 2011 2012 2013 2014 Exelon Average Reload Price Projected Market Price (Spot) Enrichment 38% Fabrication 16% Nuclear Waste Fund 19% Tax/Interest 1% Conversion 3% Uranium 23% Long-term equilibrium price expected to be $40-$60/lb |
17 0 10 20 30 40 50 60 2000 2001 2002 2003 2004 2005 2006 2007 2008 2009 Industry (w/o Exelon) Exelon Impact of Refueling Outages Note: Data includes Salem. Net nuclear generation data based on ownership interest. • Generally, every 18 months (PWRs) or 24 months (BWRs) • Average Outage Duration: ~28 days (1) Nuclear Refueling Cycle • Based on the refueling cycle, we will conduct 10 refueling outages in 2010, the same number of refueling outages conducted in 2009 2010 Refueling Outage Impact • Output reflected TMI extended steam generator replacement outage • Based on the refueling cycle, we conducted 10 refueling outages in 2009, versus 12 in 2008 2009 Refueling Outage Impact (1) Average Outage Duration for refueling outages from 2008 – 2009, excluding Salem. 125 127 129 131 133 135 137 139 141 143 145 2004 2005 2006 2007 2008 2009 2010 2011 2012 2013 2014 7 8 9 10 11 12 13 Refueling Outage Duration Nuclear Output Actual Target # of Outages Note: Exelon data includes Salem. 2009 average includes 23 days of TMI outage that extended into 2010 reflecting steam generator replacement. |
18 18 Total Portfolio Characteristics 101,700 102,441 40,500 39,897 5,500 16,830 22,700 13,897 0 50,000 100,000 150,000 200,000 2009A 2010E ComEd Swap IL Auction PECO Load Actual Forward Hedges & Open Position Expected Total Supply (GWh) Expected Total Sales (GWh) 91,800 91,804 48,000 47,866 24,800 29,840 5,800 3,555 0 50,000 100,000 150,000 200,000 2009A 2010E Forward / Spot Purchases Fossil & Hydro Mid-Atlantic Nuclear Midwest Nuclear 173,065 173,065 170,400 170,400 (1) As of March 31, 2010. (1) (1) |
19 Exelon Nuclear Fleet Overview Note: Fleet also includes 4 shutdown units: Peach Bottom 1, Dresden 1, Zion 1 & 2. Average in-service time = 29 years 2011 42.6% Exelon, 57.4% PSEG In process (decision in 2011- 2012): 2016, 2020 503, 500 (2) W PWR 2 Salem, NJ 2025 100% Renewed: 2034 837 B&W PWR 1 TMI-1, PA Dry cask 100% Renewed: 2029 625 GE BWR 1 Oyster Creek, NJ Dry cask 50% Exelon, 50% PSEG Renewed: 2033, 2034 574, 571 (2) GE BWR 2 Peach Bottom, PA Dry cask 75% Exelon, 25% Mid- American Holdings Renewed: 2032 655, 662 (2) GE BWR 2 Quad Cities, IL Dry cask 100% Renewed: 2029, 2031 869, 871 GE BWR 2 Dresden, IL 2010 100% 2022, 2023 1138, 1150 GE BWR 2 LaSalle, IL Dry cask 100% 2024, 2029 1148, 1145 GE BWR 2 Limerick, PA 2018 2011 2013 Spent Fuel Storage/ Date to lose full core discharge capacity (3) GE W W Vendor BWR PWR PWR Type 1 2 2 Units 100% 2026 1065 Clinton, IL 100% 2024, 2026 1183, 1153 Byron, IL 100% 2026, 2027 1194, 1166 Braidwood, IL Ownership License Status / Expiration (1) Net Annual Mean Rating MW 2009 Plant, Location License extensions will be pursued for all units not already renewed (1) Operating license renewal process takes approximately 4-5 years from commencement until completion of NRC review. (2) Capacity based on ownership interest. (3) The date for loss of full core reserve identifies when the on-site storage pool will no longer have sufficient space to receive a full complement of fuel from the reactor core. Dry cask storage will be in operation at those sites prior to the closing of their on-site storage pools. |
20 20 20 Exelon Generation Hedging Disclosures (As disclosed on April 23, 2010) |
21 21 21 Important Information The following slides are intended to provide additional information regarding the hedging program at Exelon Generation and to serve as an aid for the purposes of modeling Exelon Generation’s gross margin (operating revenues less purchased power and fuel expense). The information on the following slides is not intended to represent earnings guidance or a forecast of future events. In fact, many of the factors that ultimately will determine Exelon Generation’s actual gross margin are based upon highly variable market factors outside of our control. The information on the following slides is as of March 31, 2010. Going forward, we plan to update the information on a quarterly basis. Certain information on the following slides is based upon an internal simulation model that incorporates assumptions regarding future market conditions, including power and commodity prices, heat rates, and demand conditions, in addition to operating performance and dispatch characteristics of our generating fleet. Our simulation model and the assumptions therein are subject to change. For example, actual market conditions and the dispatch profile of our generation fleet in future periods will likely differ – and may differ significantly – from the assumptions underlying the simulation results included in the slides. In addition, the forward- looking information included in the following slides will likely change over time due to continued refinement of our simulation model and changes in our views on future market conditions. |
22 22 22 Portfolio Management Objective Align Hedging Activities with Financial Commitments • Power Team utilizes several product types and channels to market • Wholesale and retail sales • Block products • Load-following products and load auctions • Put/call options • Exelon’s hedging program is designed to protect the long-term value of our generating fleet and maintain an investment-grade balance sheet • Hedge enough commodity risk to meet future cash requirements if prices drop • Consider: financing policy (credit rating objectives, capital structure, liquidity); spending (capital and O&M); shareholder value return policy • Consider market, credit, operational risk • Approach to managing volatility • Increase hedging as delivery approaches • Have enough supply to meet peak load • Purchase fossil fuels as power is sold • Choose hedging products based on generation portfolio – sell what we own • Heat rate options • Fuel products • Capacity • Renewable credits % Hedged High End of Profit Low End of Profit Open Generation with LT Contracts Portfolio Optimization Portfolio Management Portfolio Management Over Time |
23 23 23 23 Percentage of Expected Generation Hedged • How many equivalent MW have been hedged at forward market prices; all hedge products used are converted to an equivalent average MW volume • Takes ALL hedges into account whether they are power sales or financial products Equivalent MWs Sold Expected Generation = • Our normal practice is to hedge commodity risk on a ratable basis over the three years leading to the spot market • Carry operational length into spot market to manage forced outage and load-following risks • By using the appropriate product mix, expected generation hedged approaches the mid-90s percentile as the delivery period approaches • Participation in larger procurement events, such as utility auctions, and some flexibility in the timing of hedging may mean the hedge program is not strictly ratable from quarter to quarter Exelon Generation Hedging Program |
24 24 24 24 2010 2011 2012 Estimated Open Gross Margin ($ millions) (1,2) $5,050 $4,900 $4,750 Open gross margin assumes all expected generation is sold at the Reference Prices listed below Reference Prices (1) Henry Hub Natural Gas ($/MMBtu) NI-Hub ATC Energy Price ($/MWh) PJM-W ATC Energy Price ($/MWh) ERCOT North ATC Spark Spread ($/MWh) (3) $4.48 $29.73 $39.69 $0.43 $5.34 $30.71 $42.04 $(0.42) $5.79 $32.19 $43.47 $0.14 (1) Based on March 31, 2010 market conditions. (2) Gross margin is defined as operating revenues less fuel expense and purchased power expense, excluding the impact of decommissioning and other incidental revenues. Open gross margin is estimated based upon an internal model that is developed by dispatching our expected generation to current market power and fossil fuel prices. Open gross margin assumes there is no hedging in place other than fixed assumptions for capacity cleared in the RPM auctions and uranium costs for nuclear power plants. Open gross margin contains assumptions for other gross margin line items such as various ISO bill and ancillary revenues and costs and PPA capacity revenues and payments. The estimation of open gross margin incorporates management discretion and modeling assumptions that are subject to change. (3) ERCOT North ATC spark spread using Houston Ship Channel Gas, 7,200 heat rate, $2.50 variable O&M. Exelon Generation Open Gross Margin and Reference Prices |
25 25 25 25 (1) 2010 2011 2012 Expected Generation (GWh) (1) 164,600 161,700 161,200 Midwest 98,600 98,100 97,000 Mid-Atlantic 58,000 56,600 56,600 South 8,000 7,000 7,600 Percentage of Expected Generation Hedged (2) 95-98% 79-82% 48-51% Midwest 92-95 79-82 52-55 Mid-Atlantic 96-99 81-84 44-47 South 97-100 68-71 41-44 Effective Realized Energy Price ($/MWh) (3) Midwest $46.50 $44.50 $44.50 Mid-Atlantic $36.00 $58.00 $51.50 ERCOT North ATC Spark Spread $0.50 $0.50 $(6.50) Generation Profile Expected generation represents the amount of energy estimated to be generated or purchased through owned or contracted for capacity. Expected generation is based upon a simulated dispatch model that makes assumptions regarding future market conditions, which are calibrated to market quotes for power, fuel, load following products, and options. Expected generation assumes 10 refueling outages in 2010 and 11 refueling outages in 2011 and 2012 at Exelon-operated nuclear plants and Salem. Expected generation assumes capacity factors of 93.5%, 92.8% and 92.8% in 2010, 2011 and 2012 at Exelon-operated nuclear plants. These estimates of expected generation in 2011 and 2012 do not represent guidance or a forecast of future results as Exelon has not completed its planning or optimization processes for those years. Percent of expected generation hedged is the amount of equivalent sales divided by the expected generation. Includes all hedging products, such as wholesale and retail sales of power, options, and swaps. Uses expected value on options. Reflects decision to permanently retire Cromby Station and Eddystone Units 1&2 as of May 31, 2011. Effective realized energy price is representative of an all-in hedged price, on a per MWh basis, at which expected generation has been hedged. It is developed by considering the energy revenues and costs associated with our hedges and by considering the fossil fuel that has been purchased to lock in margin. It excludes uranium costs and RPM capacity revenue, but includes the mark-to-market value of capacity contracted at prices other than RPM clearing prices including our load obligations. It can be compared with the reference prices used to calculate open gross margin in order to determine the mark-to-market value of Exelon Generation's energy hedges. (2) (3) |
26 26 26 26 Gross Margin Sensitivities with Existing Hedges ($ millions) (1) Henry Hub Natural Gas + $1/MMBtu - $1/MMBtu NI-Hub ATC Energy Price +$5/MWH -$5/MWH PJM-W ATC Energy Price +$5/MWH -$5/MWH Nuclear Capacity Factor +1% / -1% 2010 $40 $(20) $20 $(15) $5 $ - +/- $30 2011 $125 $(110) $125 $(115) $75 $(70) +/- $40 2012 $320 $(315) $235 $(225) $175 $(170) +/- $45 Exelon Generation Gross Margin Sensitivities (with Existing Hedges) (1) Based on March 31, 2010 market conditions and hedged position. Gas price sensitivities are based on an assumed gas-power relationship derived from an internal model that is updated periodically. Power prices sensitivities are derived by adjusting the power price assumption while keeping all other prices inputs constant. Due to correlation of the various assumptions, the hedged gross margin impact calculated by aggregating individual sensitivities may not be equal to the hedged gross margin impact calculated when correlations between the various assumptions are also considered. |
27 27 27 27 95% case 5% case $6,500 $6,200 $4,800 $7,200 $6,300 $6,600 Exelon Generation Gross Margin Upside / Risk (with Existing Hedges) $3,000 $4,000 $5,000 $6,000 $7,000 $8,000 $9,000 2010 2011 2012 (1) Represents an approximate range of expected gross margin, taking into account hedges in place, between the 5th and 95th percent confidence levels assuming all unhedged supply is sold into the spot market. Approximate gross margin ranges are based upon an internal simulation model and are subject to change based upon market inputs, future transactions and potential modeling changes. These ranges of approximate gross margin in 2011 and 2012 do not represent earnings guidance or a forecast of future results as Exelon has not completed its planning or optimization processes for those years. The price distributions that generate this range are calibrated to market quotes for power, fuel, load following products, and options as of March 31, 2010. |
28 28 28 28 Midwest Mid-Atlantic ERCOT Step 1 Start with fleetwide open gross margin $5.05 billion Step 2 Determine the mark-to-market value of energy hedges 98,600GWh * 93% * ($46.50/MWh-$29.73/MWh) = $1.54 billion 58,000GWh * 97% * ($36.00/MWh-$39.69/MWh) = $(0.21 billion) 8,000GWh * 98% * ($0.50/MWh-$0.43/MWh) = $0.00 billion Step 3 Estimate hedged gross margin by adding open gross margin to mark-to- market value of energy hedges Open gross margin: $5.05 billion MTM value of energy hedges: $1.54 billion + $(0.21 billion) + $0.00 billion Estimated hedged gross margin: $6.38 billion Illustrative Example of Modeling Exelon Generation 2010 Gross Margin (with Existing Hedges) |
29 29 29 Market Price Snapshots Rolling 12 Months as of May 17, 2010 |
30 30 30 30 30 30 30 50 55 60 65 70 75 80 85 90 5/09 6/09 7/09 8/09 9/09 10/09 11/09 12/09 1/10 2/10 3/10 4/10 5/10 20 25 30 35 40 45 50 55 5/09 6/09 7/09 8/09 9/09 10/09 11/09 12/09 1/10 2/10 3/10 4/10 5/10 35 40 45 50 55 60 65 70 75 80 85 5/09 6/09 7/09 8/09 9/09 10/09 11/09 12/09 1/10 2/10 3/10 4/10 5/10 5 5.5 6 6.5 7 7.5 8 8.5 9 5/09 6/09 7/09 8/09 9/09 10/09 11/09 12/09 1/10 2/10 3/10 4/10 5/10 30 Market Price Snapshot Forward NYMEX Natural Gas PJM-West and Ni-Hub On-Peak Forward Prices PJM-West and Ni-Hub Wrap Forward Prices 2011 $5.57 2012 $5.98 Rolling 12 months, as of May 17, 2010. Source: OTC quotes and electronic trading system. Quotes are daily. Forward NYMEX Coal 2011 $66.66 2012 $73.55 2011 Ni-Hub $41.01 2012 Ni-Hub $42.45 2012 PJM-West $55.88 2011 PJM-West $54.09 2011 Ni-Hub $24.25 2012 Ni-Hub $25.73 2012 PJM-West $40.56 2011 PJM-West $39.38 |
31 5.5 6.5 7.5 8.5 9.5 10.5 11.5 12.5 13.5 5/09 6/09 7/09 8/09 9/09 10/09 11/09 12/09 1/10 2/10 3/10 4/10 5/10 8 8.2 8.4 8.6 8.8 9 9.2 9.4 9.6 9.8 10 5/09 6/09 7/09 8/09 9/09 10/09 11/09 12/09 1/10 2/10 3/10 4/10 5/10 40 45 50 55 60 65 70 75 80 5/09 6/09 7/09 8/09 9/09 10/09 11/09 12/09 1/10 2/10 3/10 4/10 5/10 5 5.5 6 6.5 7 7.5 8 8.5 9 5/09 6/09 7/09 8/09 9/09 10/09 11/09 12/09 1/10 2/10 3/10 4/10 5/10 Market Price Snapshot 2012 $9.06 2011 $8.89 2011 $48.70 2012 $53.22 2011 $5.48 2012 $5.87 Houston Ship Channel Natural Gas Forward Prices ERCOT North On-Peak Forward Prices ERCOT North On-Peak v. Houston Ship Channel Implied Heat Rate 2011 $6.68 2012 $8.34 ERCOT North On Peak Spark Spread Assumes a 7.2 Heat Rate, $1.50 O&M, and $.15 adder Rolling 12 months, as of May 17, 2010. Source: OTC quotes and electronic trading system. Quotes are daily. |
32 |
33 -10.0% -7.5% -5.0% -2.5% 0.0% 2.5% 5.0% 7.5% 10.0% 1Q09 2Q09 3Q09 4Q09 1Q10 2Q10E 3Q10E 4Q10E -10.0% -7.5% -5.0% -2.5% 0.0% 2.5% 5.0% 7.5% 10.0% All Customer Classes Large C&I Residential Gross Metro Product ComEd Load Trends Weather-Normalized Load Key Economic Indicators Note: C&I = Commercial & Industrial Weather-Normalized Load Year-over-Year (4) Chicago Unemployment rate (1) 10.9% 2010 annualized growth in gross domestic/metro product (2) 2.9% 1/10 Home price index (3) (4.4)% (1) Source: Illinois Dept. of Employment Security (February 2010) (2) Source: Global Insight (March 2010) (3) Source: S&P Case-Shiller Index (4) Not adjusted for leap year effect 2009 (4) 1Q10 2010E Average Customer Growth (0.4)% (0.1)% 0.1% Average Use-Per-Customer (1.0)% 0.2% 0.1% Total Residential (1.4)% 0.1% 0.2% Small C&I (2.2)% (1.7)% 0.4% Large C&I (6.7)% (1.1)% 1.7% All Customer Classes (3.3)% (0.8)% 0.8% |
34 6.1 6.9 2.0 2.0 7.3 6.4 2.0 2.2 Transmission Distribution ComEd Building Strength Producing Results with Regulatory Recovery Plan ~46% ~47% 8.5% 46.4% Earned ROE Equity (1) 5.5% 45.4% $8.1 $8.4 $9.4 2008 2009 2011 (Illustrative) (2) Average Annual Rate Base ($ in billions) (1) Equity based on definition provided in most recent Illinois Commerce Commission (ICC) distribution rate case order (book equity less goodwill). (2) Provided solely to illustrate possible future outcomes that are based on a number of different assumptions, including an ROE target, all of which are subject to uncertainties and should not be relied upon as a forecast of future results. Note: Amounts may not add due to rounding. 2010E $8.9 ComEd executing on regulatory recovery plan resulting in healthy increases in earned ROE 10% 10% • Significant improvement in earned ROE, from 5.5% in 2008 to 8.5% in 2009, targeting at least 10% in 2010 • Continued strong operational performance • Anticipate electric distribution rate filing in 2Q10 • Benefiting from regular transmission updates through a formula rate plan, filed formula rate update on May 14, 2010 • Illinois Power Agency’s 2010 procurement approved by the ICC on April 30 • Uncollectibles expense rider tariff approved by ICC in February 2010 • Smart Meter pilot program and rider approved by ICC and underway • Standard & Poor’s raised credit ratings in 3Q09 and Fitch in 1Q10 |
35 Illinois Power Agency (IPA) RFP Procurement • On April 30, 2010, the ICC approved the bids from the RFP Procurement held on April 28, 2010, for the remaining ComEd 2010-2011 load (~25% of the total) and a portion of its 2011-2012 load (~7% of the total) – Contracts were awarded to 12 successful bidders – $32.54 Around-the-Clock (ATC) price for 2010-2011 planning year, in addition to: • Financial Swap price (ATC baseload energy only) of $50.15 for June 2010 – December 2010 and $51.26 for January 2011 – December 2011; increase in notional quantity to 3,000 MW on June 1, 2010 Delivery Period Peak Off-Peak June 2010 - May 2011 5,528 4,344 June 2011 - May 2012 1,980 549 Volume procured in the 2010 IPA Procurement Event (GWh) Note: Chart is for illustrative purposes only. Data on this slide is rounded. 2009 RFP 2009 RFP 2010 RFP 2010 RFP 2011 RFP 2011 RFP 2011 RFP 2012 RFP 2012 RFP 2013 RFP Financial Swap Auction Contract June 2009 June 2010 June 2011 June 2012 June 2013 June 2014 |
36 Financial Swap Agreement with Exelon Generation 3,000 $53.48 January 1, 2013 - May 31, 2013 3,000 $52.37 January 1, 2012 - December 31, 2012 3,000 $51.26 January 1, 2011 - December 31, 2011 3,000 $50.15 June 1, 2010 - December 31, 2010 2,000 $50.15 January 1, 2010 - May 31, 2010 2,000 $49.04 June 1, 2009 - December 31, 2009 1,000 $49.04 January 1, 2009 - May 31, 2009 1,000 $47.93 June 1, 2008 - December 31, 2008 Notional Quantity (MW) Fixed Price ($/MWH) Portion of Term • Market-based contract for ATC baseload energy only – Does not include capacity, ancillary services, or congestion • Supplies ~67% of ComEd’s Residential/Small C&I load for 2010/11 • Represents long-term contract with stable pricing for ComEd’s customers Note: C&I = Commercial & Industrial |
37 |
38 PECO Load Trends Weather-Normalized Electric Load Key Economic Indicators Weather-Normalized Load Year-over-Year (3) Philadelphia Unemployment rate (1) 9.2% 2010 annualized growth in gross domestic/metro product (2) 0.8% (1) Source: U.S Dept. of Labor (PHL - February 2010) (2) Source: Moody’s Economy.com (March 2010) (3) Not adjusted for leap year effect -10.0% -7.5% -5.0% -2.5% 0.0% 2.5% 5.0% 7.5% 10.0% 1Q09 2Q09 3Q09 4Q09 1Q10 2Q10E 3Q10E 4Q10E -10.0% -7.5% -5.0% -2.5% 0.0% 2.5% 5.0% 7.5% 10.0% All Customer Classes Large C&I Residential Gross Metro Product Note: C&I = Commercial & Industrial 2009 (3) 1Q10 2010E Average Customer Growth (0.2)% (0.2)% (0.0)% Average Use-Per-Customer (2.1)% 2.1% 1.2% Total Residential (2.3)% 1.8% 1.1% Small C&I (2.7)% (0.9)% (0.2)% Large C&I (3.0)% 0.1% (0.3)% All Customer Classes (2.6)% 0.5% 0.3% |
39 2.7 2.8 3.0 3.2 0.5 0.5 0.5 1.1 1.1 1.1 1.2 0.6 2.0 1.3 0.5 Gas Competitive Transition Charge (CTC) Electric Transmission Electric Distribution PECO Executing on Transition Plan Actively Engaged in Transition • Targeted earned ROE of ~11% in 2010; 9- 11% post transition • Electric and gas rate cases filed on 3/31/10 • Selected as 1 of 6 companies to receive maximum Federal stimulus award of $200 million for smart grid / smart meter investment • PA Public Utility Commission approved Smart Meter Plan under Pennsylvania Act 129 in April 2010 • Fixed price Power Purchase Agreement (PPA) with ExGen ends 12/31/10 • Three of four procurement events for electricity supply beginning Jan. 1, 2011 have been conducted, including 72% of 2011 residential load ~9 – 11% Not applicable due to transition rate structure Rate Making ROE Equity ~50-53% $6.3 $5.7 $5.0 Average Annual Rate Base (1) ($ in billions) 2008 2009 2011 (Illustrative) (2) (1) Rate base as determined for rate-making purposes. (2) Provided solely to illustrate possible future outcomes that are based on a number of different assumptions, all of which are subject to uncertainties and should not be relied upon as a forecast of future results. $5.1 2010E PECO is managing through its transition period and is positioned for continued strong financial performance post-2010 |
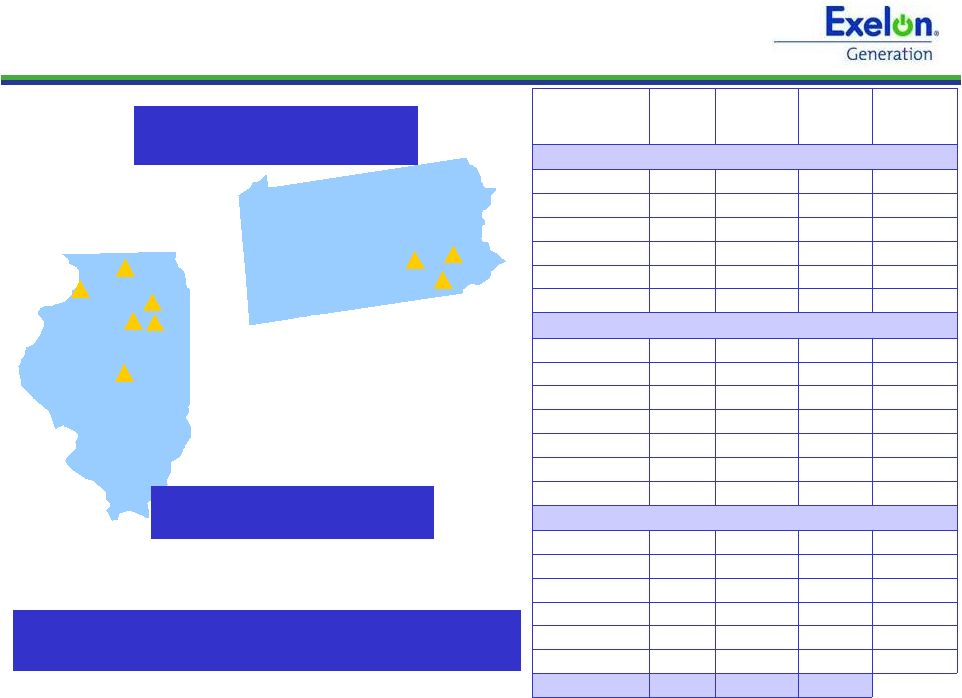
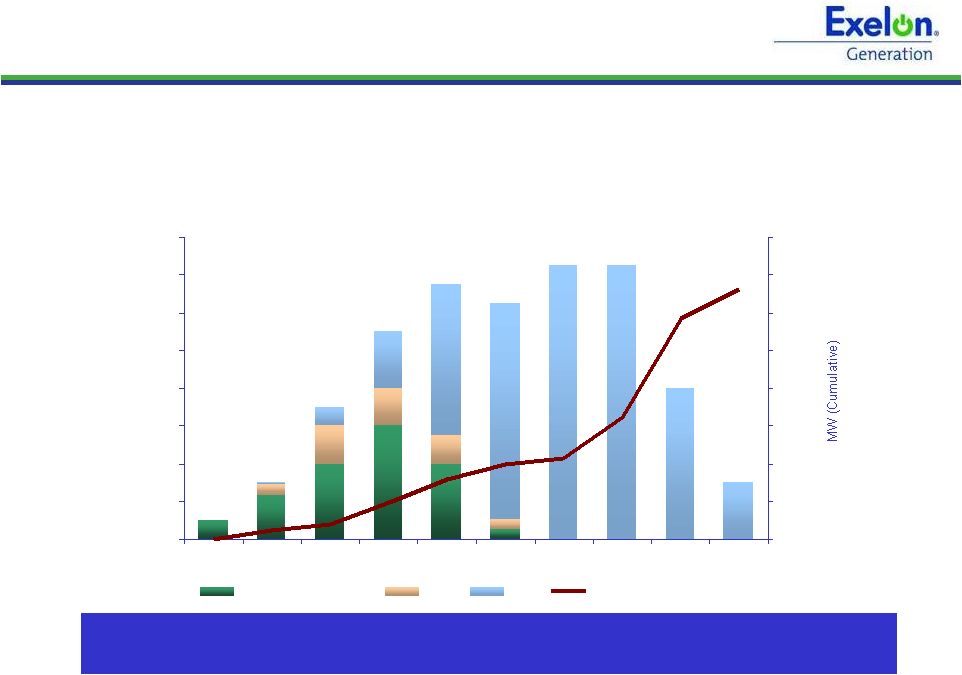
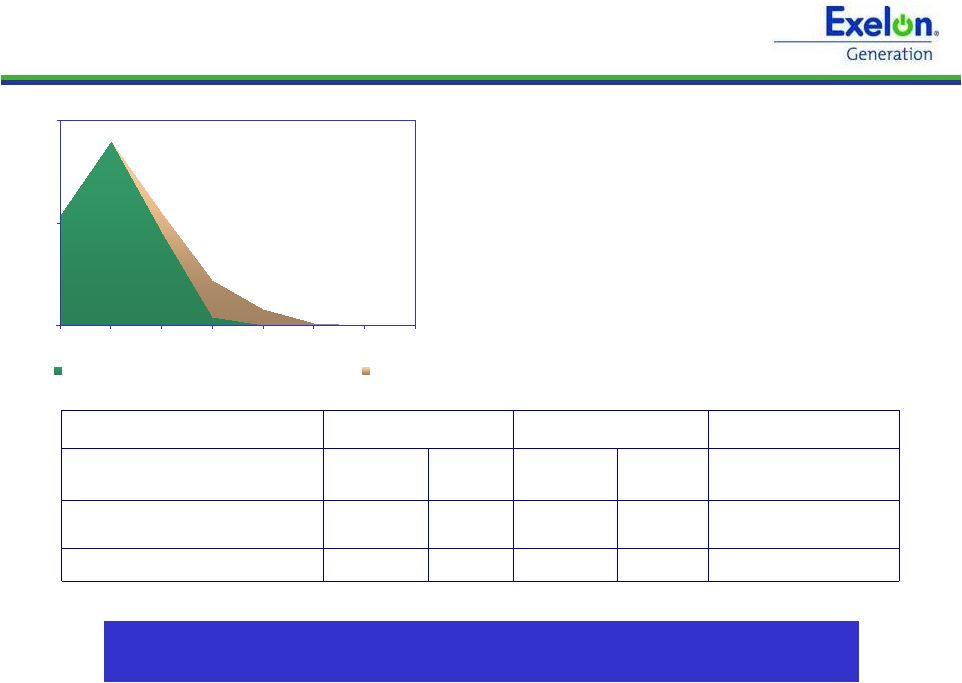
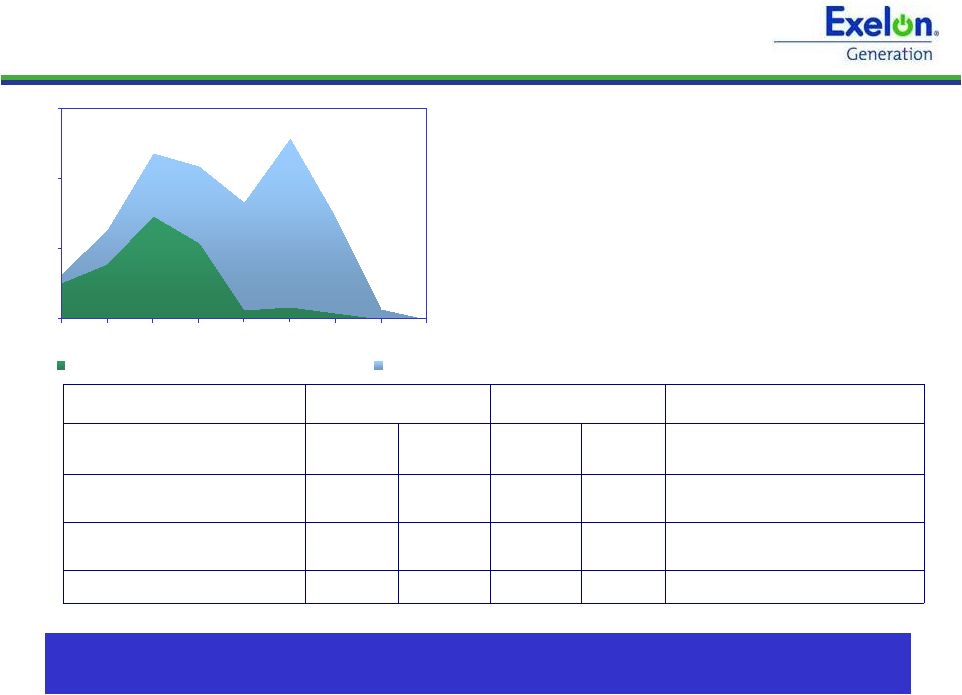
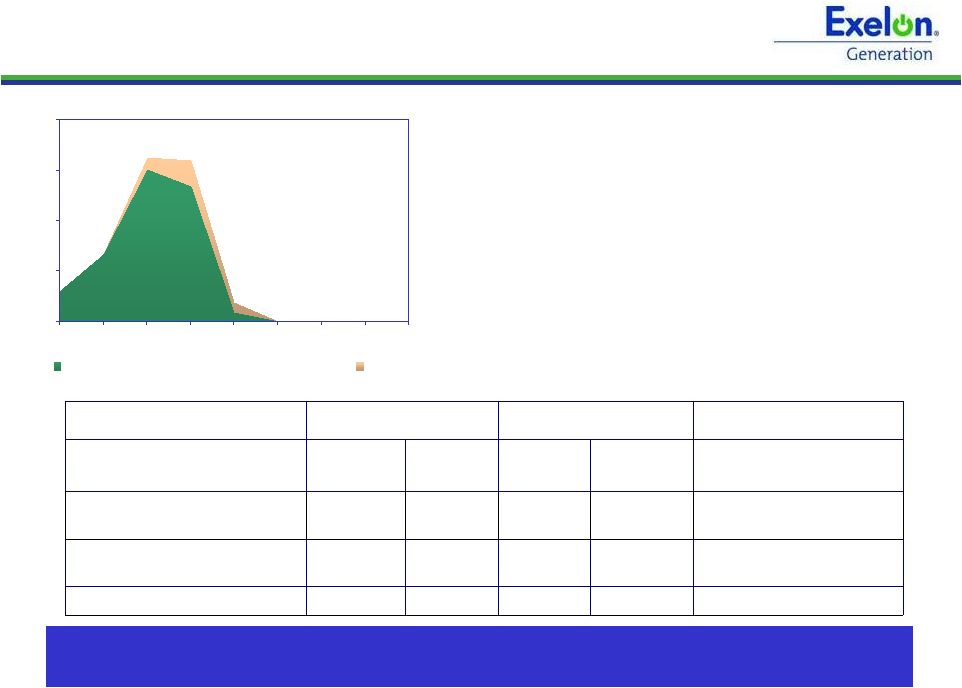
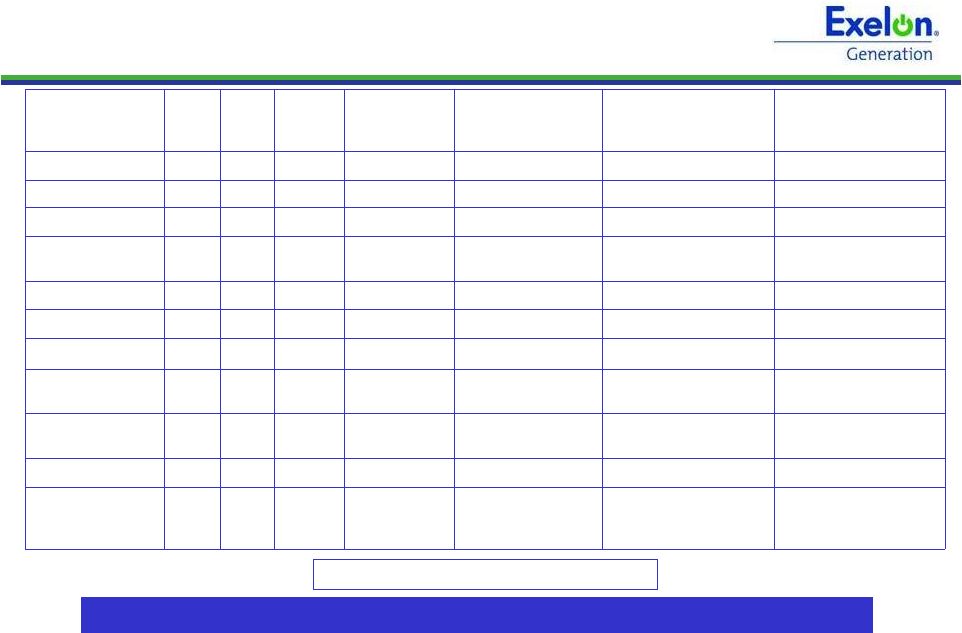
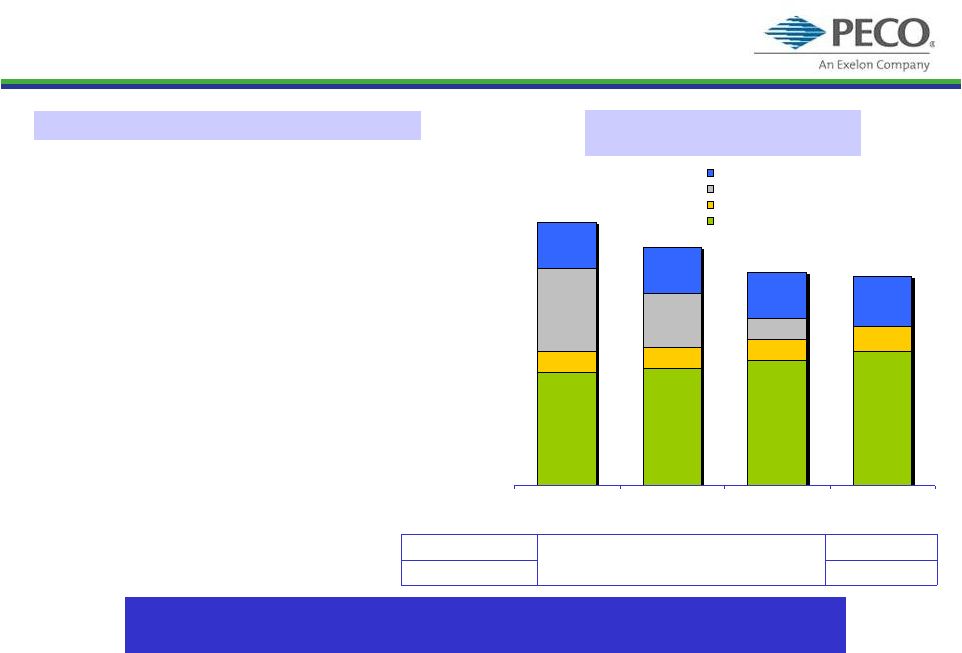
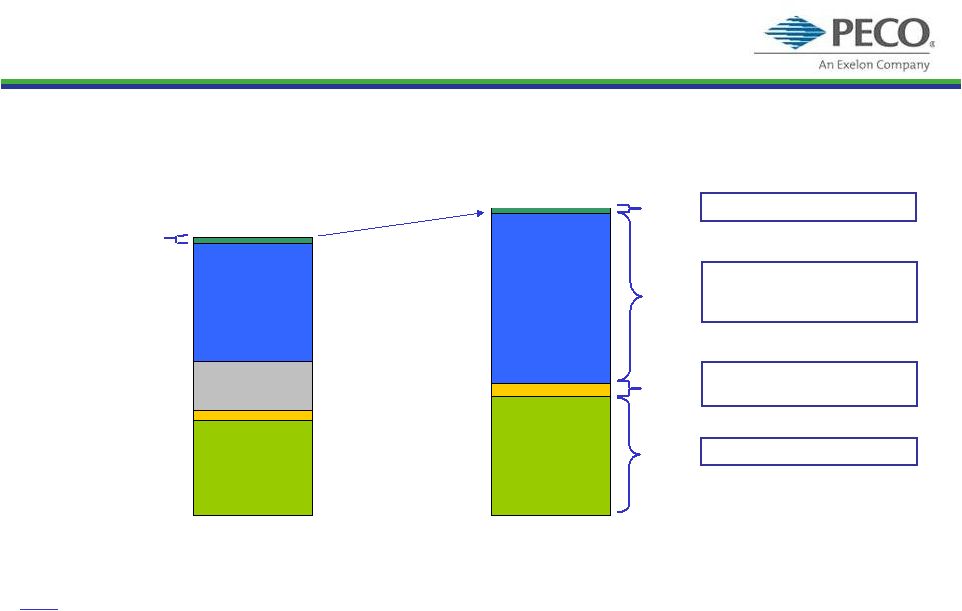
40 PECO Procurement RFP being held on May 24, 2010, results will be public 30 days thereafter; next RFP to be held on September 20, 2010 (1) See PECO Procurement website (http://www.pecoprocurement.com) for additional details regarding PECO’s procurement plan and RFP results. (2) Wholesale prices; no Small/Medium Commercial products were procured in the June 2009 RFP. (3) For Large C&I customers who have opted to participate in the fixed-priced full requirements product. Residential Sept ’09 RFP average price of $79.96/MWh (2) June ’09 RFP average price of $88.61/MWh (2) 49% of full requirements product procured 80 MW of block energy procured Small and Medium Commercial Sept ’09 RFP average blended price of $85.85/MWh (2) 24% of Small Commercial full requirements product procured 16% of Medium Commercial full requirements product procured 85% full requirements 15% full requirements spot Medium Commercial (peak demand >100 kW but <= 500 kW) fixed-priced full requirements (3) Hourly full requirements Large Commercial & Industrial (peak demand >500 kW) 90% full requirements 10% full requirements spot 75% full requirements 20% block energy 5% energy only spot Products Small Commercial (peak demand <100 kW) Residential Customer Class PECO Procurement Plan (1) 2011 Supply procured to date (including June and September 2009 RFPs) Large Commercial and Industrial 100% of planned fixed - price full requirements contracts (12-mo. term) Residential 23% of planned full requirements contracts (17 and 29-mo. terms) 140 MW of baseload (24x7) block energy products (12, 24 and 60-mo. duration) 40 MW of Jan-Feb 2011 on-peak block energy Small Commercial 36% of planned full requirements contracts (17 and 29-mo. term) Medium Commercial 42% of planned full requirements contracts (17-mo. term) May 24, 2010 RFP |
41 PECO – Electric & Gas Distribution Rate Case Filings On March 31, PECO filed electric and gas distribution rate cases • First electric distribution rate case since 1989 – Act 129 energy efficiency and smart meter costs recovered separately through rider • Last gas delivery rate case in 2008 53.18% 53.18% Common Equity Ratio R-2010-216-1592 R-2010-216-1575 Docket # 2010 (1) 2010 (1) Test Year ROE: 11.75% ROR: 8.95% ROE: 11.75% ROR: 8.95% Requested Returns $1,100 million $3,236 million Rate Base 6.94% (2) $316 million Electric $44 million Revenue Requirement Increase 5.28% 2011 Proposed Distribution Price Increase as % of Overall Customer Bill Gas Rate Case Request PECO executing its post-transition regulatory plan to secure fair and reasonable returns on its distribution investment (1) With pro forma adjustments. (2) Excluding Alternative Energy Portfolio Standards (AEPS) and default service surcharge. Note: Electric and gas rate case filings available on Pennsylvania Public Utility Commission (PAPUC) website or www.peco.com/know. |
42 PECO – Timeline for Rate Cases • Filed: March 31, 2010 • Opposing Parties’ Testimony: June 2010 • Rebuttal Testimony: July 2010 • Hearings: August 2010 • Administrative Law Judge (ALJ) Orders: October 2010 • Final Orders Expected: December 2010 • New Rates Effective: January 1, 2011 Note: Dates are based on typical approach to rate cases but the PAPUC will set the actual schedule. Expect schedule to be set at pre-hearing with ALJ in early June. The PAPUC has a nine-month process for litigation of the rate case filings |
43 5.03 6.26 6.23 0.51 0.70 2.57 9.01 PECO Electric Residential Rate Increases 2010 to 2011 January 1, 2011 January 1, 2010 Total = 14.7¢ Unit Rates (¢/kWh) Proposed Total Bill Increase ~11 % Total = 16.3¢ AEPS ~0.6% Default Service Surcharge Mechanism based on results of first two procurements ~1.2% Transmission surcharge mechanism ~1.3% Energy / Capacity Competitive Transition Charge Transmission Distribution Distribution rate case ~8.2% 0.38 Energy Efficiency Surcharge Breakdown of 2010 to 2011 ~11% Increase (On Total Bill) Notes: • Rates effective January 1, 2010 include Act 129 Energy Efficiency surcharge of 2%. • A Smart Meter surcharge, which will likely be effective 3Q10, is expected to be less than 1% and is not expected to increase until 2Q/3Q of 2011. As a result, the Smart Meter surcharge will have a minimal impact on rate increases effective January 1, 2011. • Low income discounted rates were subsidized in the PPA in 2010 and will be recovered through distribution rates in 2011. 0.29 |
44 PECO Smart Grid/Smart Meter • PECO intends to spend up to $650 million on its Smart Grid/Smart Meter Infrastructure – $550 million Advanced Metering Infrastructure over 10 – 15 years – ~$300 million in 2010-2012 period – $100 million for Smart Grid over 3 years with stimulus funding • Awarded $200 million Federal Stimulus Grant in October 2009, contract with DOE was finalized on April 12, 2010 • Smart Meter Plan was approved by the PAPUC on April 22, 2010 • Smart Meter investment required by Act 129, which provides for recovery through surcharge including a return on capital investment • Smart Grid investment to be recovered through transmission and distribution rates ($ millions pre-tax) 2010 2011 2012 Total Act 129 Smart Meter Expanded Initial Deployment (600K meters by 2012) 40 $ 150 $ 100 $ 290 $ Smart Grid Stimulus Case 50 45 15 110 Total Stimulus Case 90 195 115 400 Stimulus Grant Request (45) (100) (55) (200) Total Expenditures net of Stimulus grant 45 $ 95 $ 60 $ 200 $ (1) Timing of expenditures may vary as project plans are refined Data contained in this slide is rounded. 2010-2012 Expenditures With Federal Stimulus Grant (1) : |
45 Exelon Investor Relations Contacts Exelon Investor Relations 10 South Dearborn Street Chicago, Illinois 60603 312-394-2345 312-394-4082 (Fax) For copies of other presentations, annual/quarterly reports, or to be added to our email distribution list please contact: Martha Chavez, Executive Admin Coordinator 312-394-4069 Martha.Chavez@ExelonCorp.com Investor Relations Contacts: Stacie Frank, Vice President 312-394-3094 Stacie.Frank@ExelonCorp.com Paul Mountain, Manager 312-394-2407 Paul.Mountain@ExelonCorp.com Marybeth Flater, Manager 312-394-8354 Marybeth.Flater@ExelonCorp.com Sandeep Menon, Principal Analyst 312-394-7279 Sandeep.Menon@ExelonCorp.com |