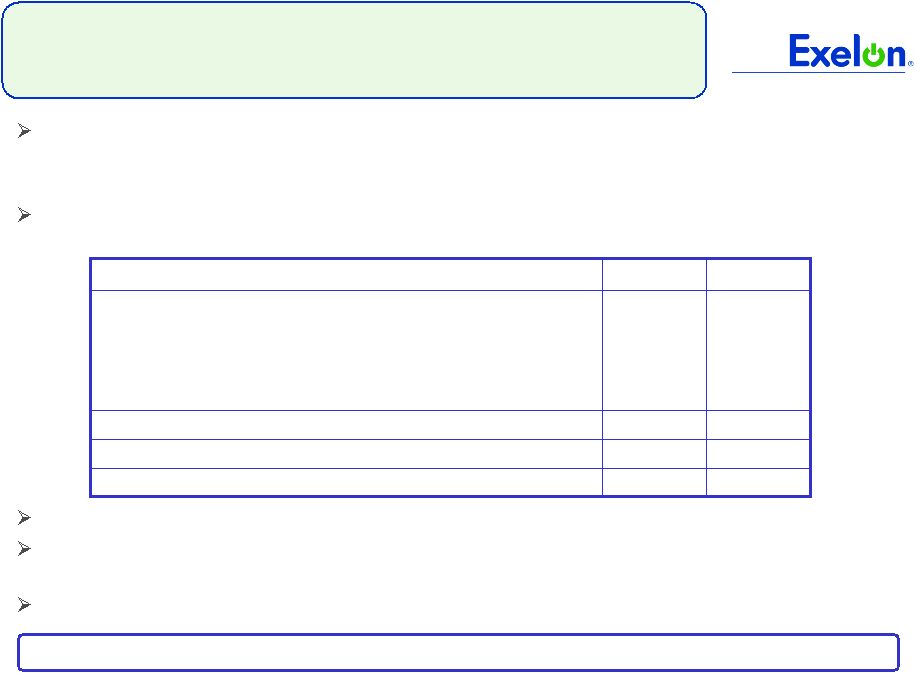
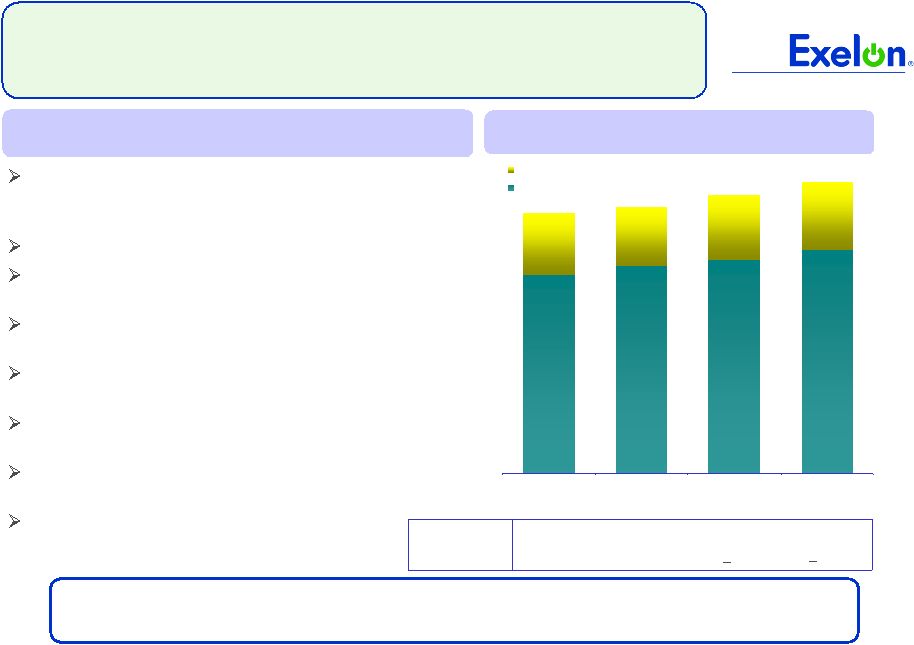
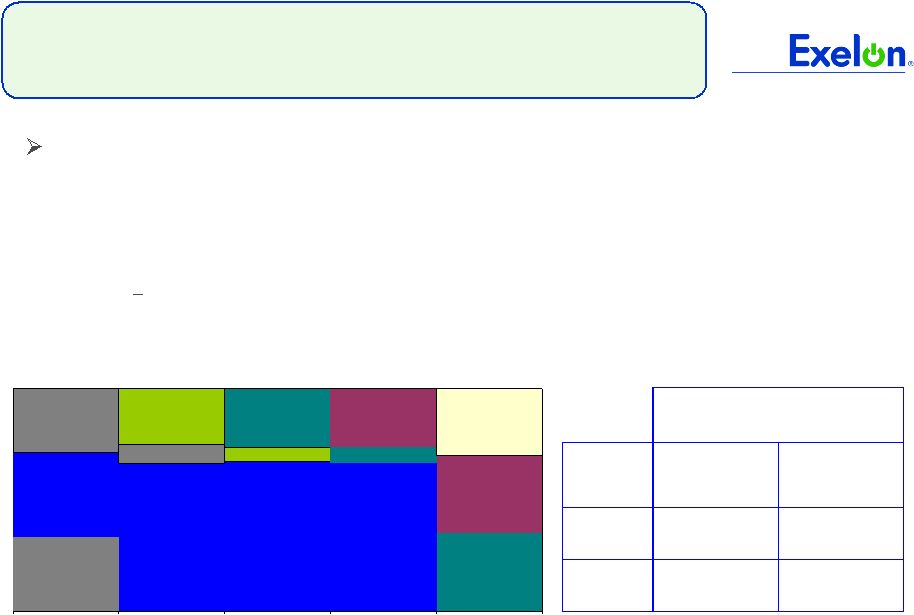
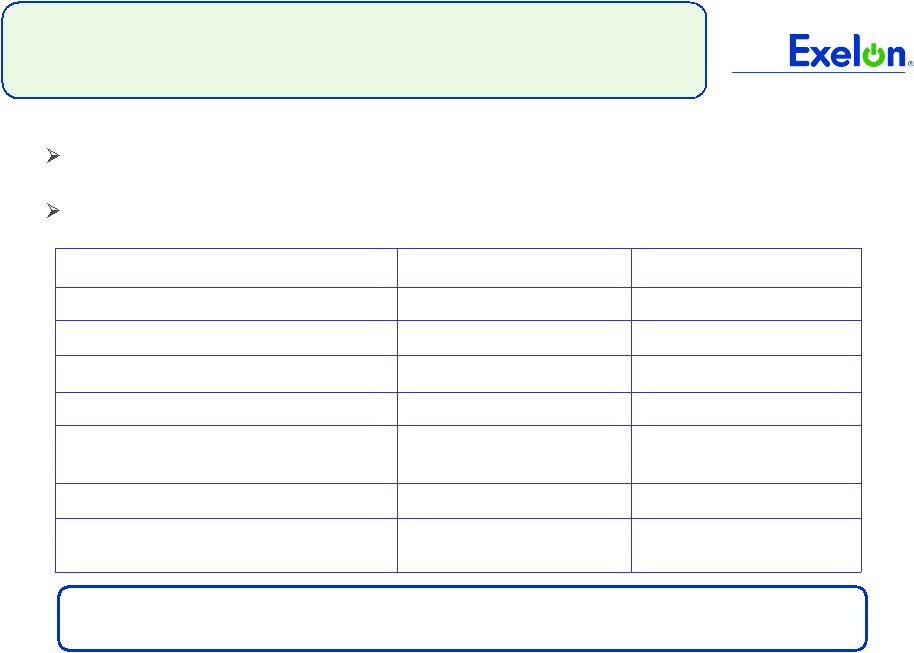
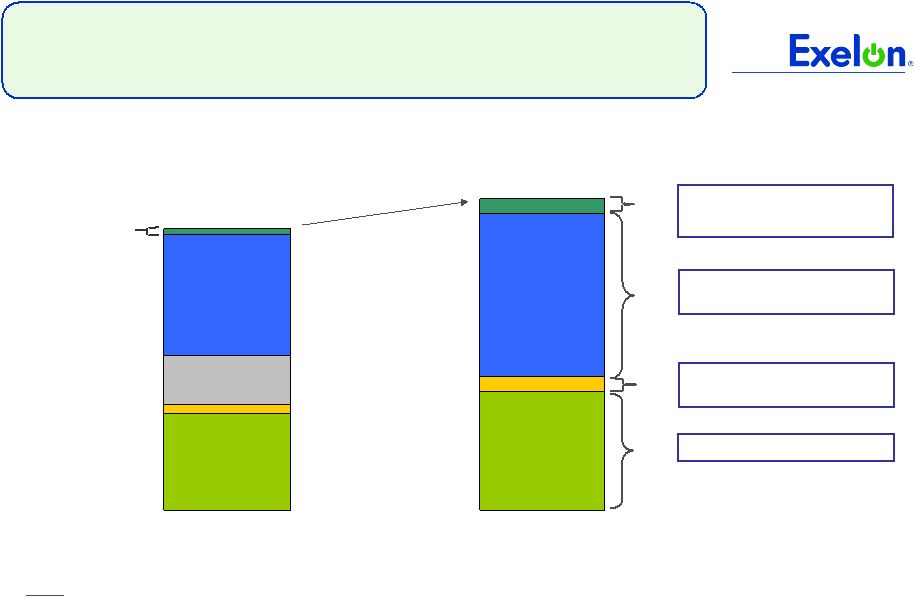
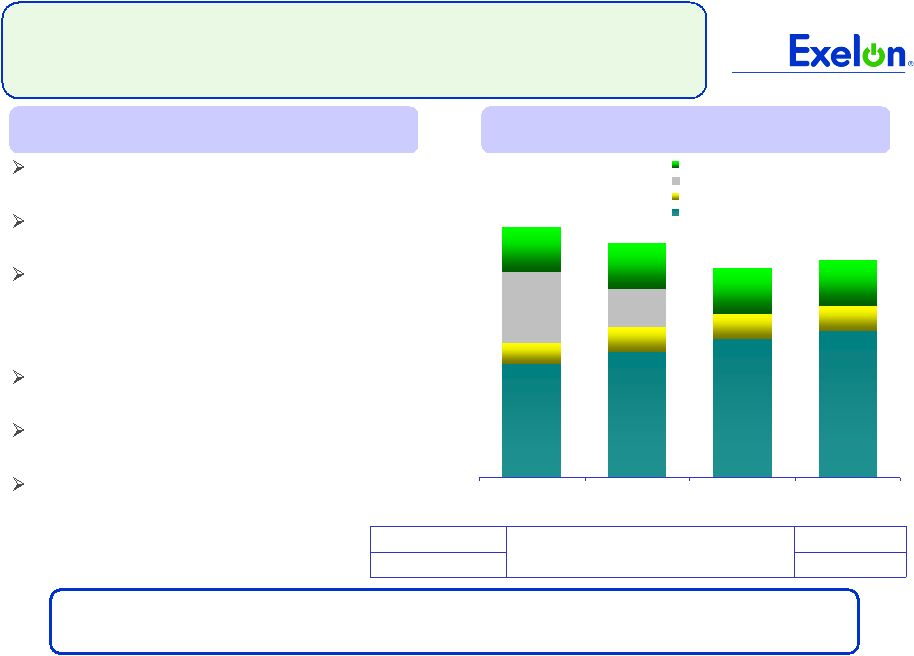
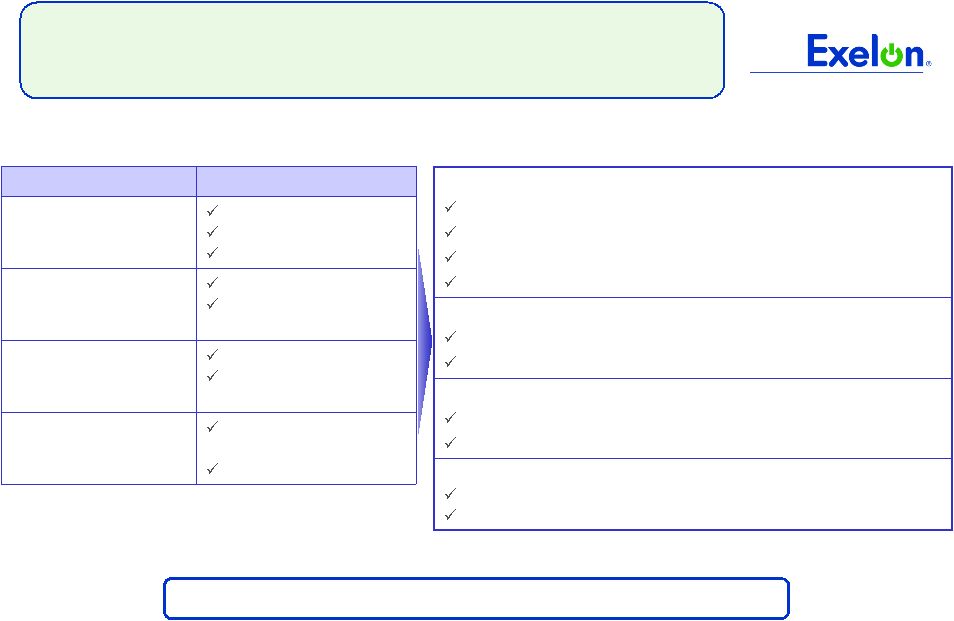
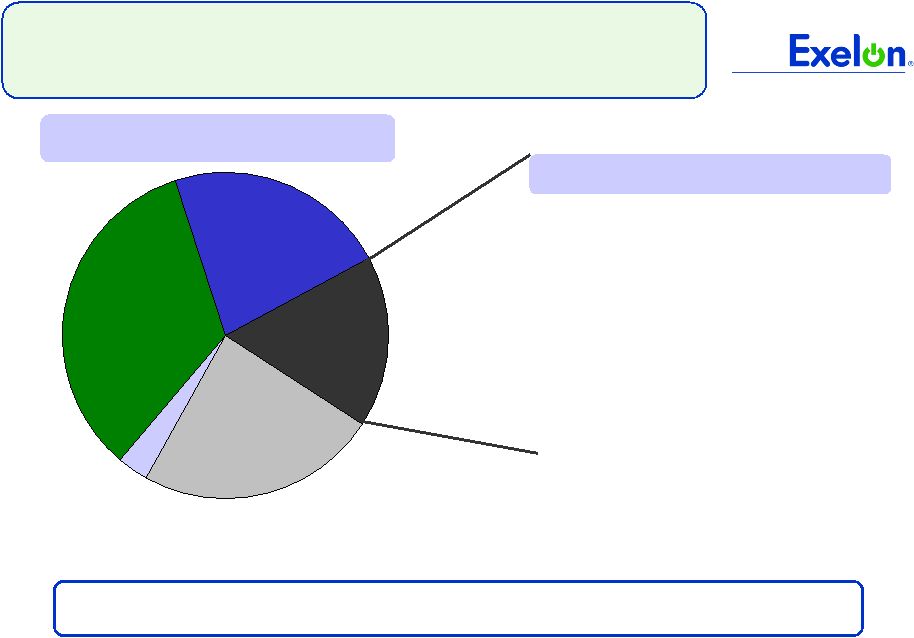
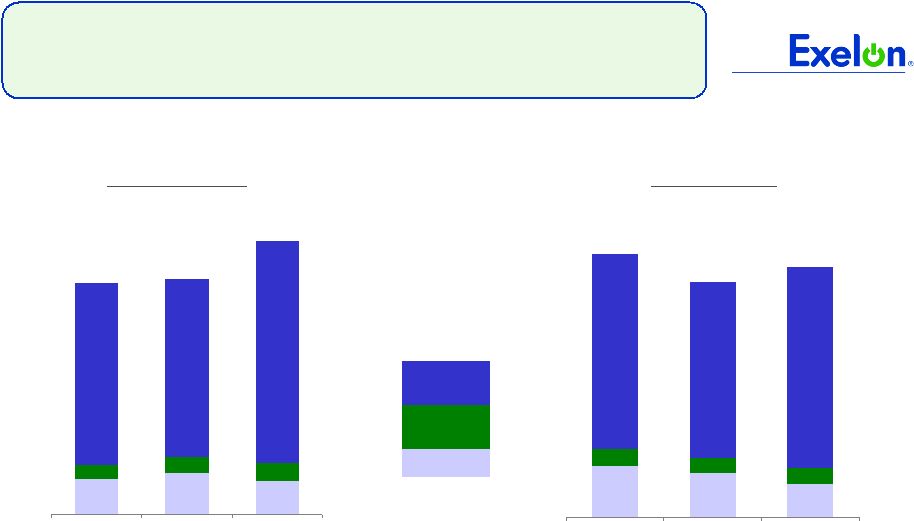
22 2010 2011 2012 Expected Generation (GWh) (1) 167,500 163,000 162,600 Midwest 100,000 98,700 97,500 Mid-Atlantic 58,900 57,000 57,000 South 8,600 7,300 8,100 Percentage of Expected Generation Hedged (2) 96-99% 86-89% 57-60% Midwest 96-99 86-89 54-57 Mid-Atlantic 96-99 90-93 59-62 South 97-100 66-69 51-54 Effective Realized Energy Price ($/MWh) (3) Midwest $46.00 $43.50 $44.50 Mid-Atlantic $36.50 $57.50 $51.00 ERCOT North ATC Spark Spread $0.00 $(2.00) $(5.50) Generation Profile (1) Expected generation represents the amount of energy estimated to be generated or purchased through owned or contracted for capacity. Expected generation is based upon a simulated dispatch model that makes assumptions regarding future market conditions, which are calibrated to market quotes for power, fuel, load following products, and options. Expected generation assumes 10 refueling outages in 2010 and 11 refueling outages in 2011 and 2012 at Exelon-operated nuclear plants and Salem. Expected generation assumes capacity factors of 94.1%, 93.2% and 92.9% in 2010, 2011 and 2012 at Exelon-operated nuclear plants. These estimates of expected generation in 2011 and 2012 do not represent guidance or a forecast of future results as Exelon has not completed its planning or optimization processes for those years. (2) Percent of expected generation hedged is the amount of equivalent sales divided by the expected generation. Includes all hedging products, such as wholesale and retail sales of power, options, and swaps. Uses expected value on options. Reflects decision to permanently retire Cromby Station and Eddystone Units 1&2 as of May 31, 2011. Current RMR discussions do not impact metrics presented in the hedging disclosure. (3) Effective realized energy price is representative of an all-in hedged price, on a per MWh basis, at which expected generation has been hedged. It is developed by considering the energy revenues and costs associated with our hedges and by considering the fossil fuel that has been purchased to lock in margin. It excludes uranium costs and RPM capacity revenue, but includes the mark-to-market value of capacity contracted at prices other than RPM clearing prices including our load obligations. It can be compared with the reference prices used to calculate open gross margin in order to determine the mark-to-market value of Exelon Generation's energy hedges. |