Performance that Drives Progress Analyst Meeting June 7, 2012 Exhibit 99.1 |
Welcome JaCee Burnes Vice President, Investor Relations |
Cautionary Statements Regarding Forward-Looking Information This presentation contains certain forward-looking statements within the meaning of the Private Securities Litigation Reform Act of 1995, that are subject to risks and uncertainties. The factors that could cause actual results to differ materially from the forward-looking statements made by Exelon Corporation, Commonwealth Edison Company, PECO Energy Company, Baltimore Gas and Electric Company and Exelon Generation Company, LLC (Registrants) include those factors discussed herein, as well as the items discussed in (1) Exelon’s 2011 Annual Report on Form 10-K in (a) ITEM 1A. Risk Factors, (b) ITEM 7. Management’s Discussion and Analysis of Financial Condition and Results of Operations and (c) ITEM 8. Financial Statements and Supplementary Data: Note 18; (2) Constellation Energy Group’s 2011 Annual Report on Form 10-K in (a) ITEM 1A. Risk Factors, (b) ITEM 7. Management’s Discussion and Analysis of Financial Condition and Results of Operations and (c) ITEM 8. Financial Statements and Supplementary Data: Note 12; (3) the Registrant’s First Quarter 2012 Quarterly Report on Form 10-Q in (a) Part II, Other Information, ITEM 1A. Risk Factors and (b) Part I, Financial Information, ITEM 1. Financial Statements: Note 15; and (4) other factors discussed in filings with the SEC by the Registrants. Readers are cautioned not to place undue reliance on these forward-looking statements, which apply only as of the date of this presentation. None of the Registrants undertakes any obligation to publicly release any revision to its forward-looking statements to reflect events or circumstances after the date of this presentation. 2 2012 Analyst Meeting – Performance that Drives Progress |
Agenda 3 Time (ET) Presentation Topic Presenter Total Time 9:00 – 9:10 Welcome & Introductions JaCee Burnes 10 minutes 9:10 – 9:30 Exelon Overview Chris Crane 20 minutes 9:30 – 9:45 Financial Update Jack Thayer 15 minutes 9:45 – 10:15 Constellation Ken Cornew 30 minutes 10:15 – 10:25 Competitive Markets Bill Von Hoene 10 minutes 10:25 – 10:55 Q&A Panel Q&A (1) 30 minutes 10:55 – 11:15 BREAK 20 minutes 11:15 – 11:30 Exelon Utilities Denis O’Brien 15 minutes 11:30 – 11:40 Power Generation Chip Pardee 10 minutes 11:40 – 11:55 Q&A Panel Q&A (2) 15 minutes 11:55 – 12:00 Closing Chris Crane 5 minutes 12:00 – 1:30 RECEPTION/LUNCH 90 minutes 2012 Analyst Meeting – Performance that Drives Progress (1) First panel for Q&A to include Chris Crane, Bill Von Hoene, Ken Cornew, Jack Thayer, Joe Glace. (2) Second panel for Q&A to include Denis O’Brien, Chip Pardee, Anne Pramaggiore, Craig Adams, Ken DeFontes, Jack Thayer. |
Exelon Overview Chris Crane President & Chief Executive Officer |
5 Exelon Overview Power Generation Constellation ComEd, PECO & BGE Competitive Business Regulated Business Exelon is the largest competitive integrated energy company in the U.S. • Largest merchant fleet in the nation (~35 GW of capacity), with unparalleled upside • One of the largest and best managed nuclear fleets in the world (~19 GW) • Significant gas generation capacity (~10 GW) • Renewable portfolio (~1 GW), mostly contracted • Leading competitive energy provider in the U.S. • Customer-facing business, with ~1.1 M competitive customers and large wholesale business • Top-notch portfolio and risk management capabilities • Extensive suite of products including Load Response, RECs, Distributed Solar • One of the largest electric and gas distribution companies in the nation ~6.6 M customers • Diversified across three utility jurisdictions – Illinois, Maryland and Pennsylvania • Significant investments in Smart Grid technologies • Transmission infrastructure improvement at utilities Exelon Generation Exelon Utilities ComEd, PECO & BGE Exelon Utilities 2012 Analyst Meeting – Performance that Drives Progress |
6 National Scope National presence gives us a unique platform to perform and grow Power Generation Constellation Operations in seven RTOs, with strong positions across PJM, ERCOT & New England Serves more than 2/3 rds of the Fortune 100 companies in the U.S. Large urban presence with operations in three states – IL, PA and MD 2012 Analyst Meeting – Performance that Drives Progress Coast-to-coast presence with operations in 47 states and Canada Exelon Utilities 2012 Analyst Meeting – Performance that Drives Progress |
7 Diversified Platform and Revenue Growth Exelon’s portfolio is well diversified and positioned for long-term growth ~50% ~50% Regulated Business Competitive Businesses • Upside from tightening power markets from significant amount of coal retirements • Strong pipeline of organic generation growth opportunities, including nuclear uprates, wind & solar • Leverage Constellation brand, network and relationships to grow customer-facing business across the country • Low-risk investment through contracted renewables fleet and load matched with generation • Investment grade credit ratings to support operations and growth • Stable income and cash flow from utility operations • Significant investment in infrastructure upgrades, including next generation technology enhancements (Smart Grid) • Diversification across three utility jurisdictions • Leverage utility structure to drive best practices • Investments to improve reliability and operations Competitive Business Diversification of revenue, earnings and cash flows (1) Based on 2012 thru 2014 average operating EBITDA estimate as of 4/30/2012 and adjusting for ComEd rate order. Regulated Business 2012 Analyst Meeting – Performance that Drives Progress Balanced EBITDA Contribution (1) |
8 Multiple Merger Benefits • Matches Exelon’s clean generation fleet with Constellation’s customer- facing leading retail and wholesale platform • Creates economies of scale through expansion across the value chain • Regional and technological diversification • Maintain clean generation profile • More competitive product offerings and enhanced margins • Scalable commercial platform • Earnings and cash flow accretive • Stronger balance sheet than standalone financials • Significant cost synergies and gross margin expansion • Maintains a regulated earnings profile • Enables operational enhancements from sharing best practices This merger creates incremental strategic and financial value 2012 Analyst Meeting – Performance that Drives Progress Strategic Fit Financial Benefits Competitive Operations Utility Benefits |
Exelon’s Transformation The merger enhances scale, scope and flexibility across the value chain Exelon Pre Merger Exelon Post Merger Financials $55.1 billion Assets (1) $74.5 billion $18.9 billion Revenues (1) $32.7 billion $26.4 billion Market Capitalization (2) $33.9 billion Power Generation (3) ~26 GW Total Capacity (4) ~35 GW 175 TWh Expected Generation (5) 220 TWh ~4 GW Natural Gas Capacity (5) ~10 GW Constellation (3) ~40 TWh / 50 BCF Competitive Load & Gas (6) ~170 TWh / 465 BCF 3,500 Customer Count More than 1 million Minimal Load Response Load Response Portfolio ~2,000 MW No projects Energy Efficiency Projects Over 4,000 projects across U.S. Exelon Utilities (3) 5.4 million Customers 6.6 million $13 billion 2011 Combined Rate Base $17 billion (1) Represents 2011 actuals. (2) As of 3/12/2012. (3) 2012 estimate as of 4/30/2012. (4) Represents owned capacity, net of mitigation (~2,648 MW). (5) Represents owned or contracted capacity, net of mitigation. (6) Represents fixed price or indexed load, including retail and wholesale. 9 2012 Analyst Meeting – Performance that Drives Progress |
• Lower energy costs reflected in prices paid by customers • Expanded set of products and services backed by a large, diverse portfolio of generation assets, including several low carbon options • Lower collateral costs with reduction in size of liquidity facilities and collateral postings • Savings on transaction costs with less need for Over-the-Counter hedging • Competitive pricing that enables volume and/or margin growth • Improved risk profile, with asset-backed hedging of load position • Natural hedge between what we own and what we sell 10 Generation and Load Match Benefits of a well-matched generation and load footprint are realized across the board Strategic, financial and customer value from combining generation and load portfolios Strategic Benefits Financial Benefits Customer Benefits 2012 Analyst Meeting – Performance that Drives Progress |
Committed to Making the Merger Successful Tasks Accomplished Closed the merger in less than a year Effective integration planning and execution for seamless day 1 operations Appointed leadership and management teams Ongoing Focus • Employ Exelon’s management model to enhance profitability by realizing efficiencies and reducing costs • Enterprise-wide synergy realization (O&M, CapEx) • Efficient and optimal use of capital to pursue highest value projects and opportunities • Grow and diversify our business in a deliberate and sustainable manner • Focus on both process and innovation to protect and grow the business We are well on our way to realizing the value from this merger Merger Checklist / Scorecard Item Target Cost Synergies $500 million run rate (1) Liquidity Reduction $4.2 billion year-end 2012 Gross Margin Opportunities $100 million run rate (2) Asset Sales Process Complete by August 2012 Commercial Load Volume Growth ~6% CAGR on volumes (3) BGE File rate case in 2 half of 2012 Confident in ability to achieve or exceed targets in a timely and efficient manner Clearly defined plans to make this merger successful (1) Run rate target for O&M synergies from 2014 onwards. (2) Gross Margin opportunities on a run rate basis from 2014 onwards from combining the two commercial portfolios. (3) Represents Compounded Annual Growth Rate (CAGR) until 2014 using 2011 as the base year. 11 2012 Analyst Meeting – Performance that Drives Progress nd |
12 Financial Discipline • Committed to maintain investment grade credit rating • Rigorous and comprehensive capital allocation process among competing uses and growth projects • Align commodity hedging program to financial policies, including dividend and investment grade credit rating • Hedge enough commodity risk to meet future cash requirements • Achieve or exceed synergy targets (O&M, CapEx) • Eliminate inefficiencies and contain costs Continue to execute a well-aligned financial policy framework and maintain dividend Enterprise Risk Management Cost Containment Strategic Policy Alignment Investment Grade Rating • Holistic view on company-wide risk, recognition of natural hedges and offsets as part of decision making process • Small, well-managed proprietary trading function 2012 Analyst Meeting – Performance that Drives Progress |
13 Exelon: Vision, Strategy, Values and Goals VALUES • We are dedicated to safety • We actively pursue excellence • We innovate to better serve our customers • We act with integrity and are accountable to each other, our communities, and the environment • We succeed as a diverse and inclusive team GOALS • Keep the lights on and the gas flowing • Run generation fleet at world class levels • Foster a work environment that is safe, productive, learning-focused and engaging • Capitalize on clean energy as a competitive advantage • Build sustained value through disciplined financial management • Be a top-tier competitor in our key markets • Advance competitive markets VISION – Performance that Drives Progress STRATEGIC DIRECTION – Sustainable Growth 2012 Analyst Meeting – Performance that Drives Progress |
14 Strategic Direction: Sustainable Growth Key focus areas as we diversify and grow our business Sustainable Growth – Focused on creating value for our shareholders by leveraging our strength in operations and financial management to grow our business 2012 Analyst Meeting – Performance that Drives Progress Operational Excellence Financial Discipline Drive Competition & Choice Advance Clean Energy 2012 Analyst Meeting – Performance that Drives Progress Operational Excellence We capitalize on reliability and efficiency in our operations as a competitive advantage Financial Discipline We are committed to investment grade ratings and maintaining the dividend Drive Competition & Choice We champion competitive energy markets Advance Clean Energy We believe clean energy creates value |
Financial Update Jack Thayer, EVP & Chief Financial Officer |
2012 Earnings Guidance • Expect to deliver full-year 2012 adjusted (non-GAAP) operating EPS within guidance range of $2.55 - $2.85/share (1) Guidance includes CEG earnings from merger close date ExGen guidance reflects gross margins for combined company portfolio Lower PJM capacity revenues as expected ComEd earnings reflect impact from recent ICC formula rate order Merger cost synergies of $0.12/share Purchase accounting adjustments largely excluded from operating earnings $0.30 - $0.40 $0.05 - $0.15 $0.40 - $0.50 FY 2012 $2.55 - $2.85 (1) HoldCo ExGen ComEd PECO BGE 16 $1.75 - $1.95 2012 Analyst Meeting – Performance that Drives Progress (1) 2012 guidance includes Constellation Energy and BGE earnings for March 12 – December 31. Based on expected 2012 average outstanding shares of 819M. Earnings guidance for OpCos may not add up to consolidated EPS guidance. Confident of achieving earnings within range of $2.55 - $2.85/share |
Achievable Merger Synergies Run Rate O&M Synergies Breakdown Gross Margin Opportunities ($M) • Run rate gross margin opportunities of $100M (2) starting in 2014 Matching load and generation Retail growth opportunities Portfolio optimization $500 $305 $170 2015+ 2014 2013 2012 Merger O&M synergies Higher run rate O&M synergies of ~$500M • Key Drivers of run rate O&M synergies include Labor savings from corporate and commercial consolidations Reduced collateral requirements IT systems consolidation Supply chain savings Other non-labor corporate synergies Fully committed to achieving merger synergies (1) O&M synergies include cost savings of ~$40M from lower liquidity requirements. (2) Gross margin opportunities included in Total Gross Margin shown on slide 45. Unregulated 75% BGE 7% PECO 7% ComEd 11% 17 O&M Savings ($M) (1) 2012 Analyst Meeting – Performance that Drives Progress |
Operating O&M Forecast Lower than Inflation • 2012 O&M forecast of $6.45B (1) Includes merger synergies of $170M for ~9.5 months Excludes costs to achieve which are considered non-operating • Maintain O&M CAGR of ~1% (2) for 2012-2014 2012E (Combined Company) $6,775 (2) (3) -50 4,100 1,200 675 525 2011 Actuals (Standalone EXC + Standalone CEG) 3,000 1,100 725 650 1,250 (in $M) ExGen ComEd ComEd PECO PECO BGE Corp • ExGen O&M includes costs of maintaining a larger retail platform • Higher O&M at ComEd mainly driven by EIMA related costs of ~$70M • PECO costs lower due to higher than normal storm costs in 2011 (1) O&M included in 2012 EPS guidance includes CEG and BGE costs from merger close date. (2) O&M Compound Annual Growth Rate (CAGR) calculated after normalizing 2012 O&M to include CEG and BGE costs for 12 months. (3) O&M for utilities excludes regulatory O&M that are P&L neutral. ExGen O&M excludes decommissioning costs. EIMA = Energy Infrastructure Modernization Act ~1% CAGR for 2012-2014 ExGen BGE Constellation 2012 EPS guidance includes $6.45B (1) of O&M costs Stub O&M 18 $6,725 (3) 2012 Analyst Meeting – Performance that Drives Progress |
Capital Expenditure Expectations 400 375 475 50 100 2014 3,325 1,100 1,050 50 425 175 2013 3,200 1,025 925 25 75 675 2012 (1) 3,925 975 1,175 650 625 100 Base Capex Nuclear Fuel MD Commitments Wind Solar Upstream Gas Nuclear Uprates 2014 2,950 1,700 550 225 475 2013 2,875 1,650 625 200 400 2012 (1) 2,300 1,475 400 175 250 Electric Distribution Electric Transmission Gas Delivery Smart Grid/Smart Meter Growth CapEx Diversified balance of utility capex recoverable through rates and generation growth capex that are largely contracted (in $M) (in $M) (1) 2012 CapEx includes CEG and BGE from merger close date. 19 2012 Analyst Meeting – Performance that Drives Progress Exelon Utilities Exelon Generation |
2012 Projected Sources and Uses of Cash (1) Exelon beginning cash balance as of 12/31/11. Excludes counterparty collateral activity. (2) Includes $675 million of Constellation net collateral paid to counterparties prior to merger completion. (3) Cash Flow from Operations primarily includes net cash flows provided by operating activities, estimated proceeds from Maryland clean coal fleet divestitures and net cash flows used in investing activities other than capital expenditures. (4) Dividends are subject to declaration by the Board of Directors. (5) Excludes PECO’s $225 million Accounts Receivable (A/R) Agreement with Bank of Tokyo. PECO’s A/R Agreement was extended in accordance with its terms through August 31, 2012. (6) “Other” includes proceeds from options and expected changes in short-term debt. (7) Includes cash flow activity from Holding Company, eliminations, and other corporate entities. Represents Constellation cash flows from merger close through December 31, 2012. 20 (7) ($ in Millions) Beginning Cash Balance (1) $550 Cash acquired from Constellation (2) 150 n/a n/a 1,375 1,650 Cash Flow from Operations (3) 300 1,425 825 3,600 5,925 CapEx (excluding other items below): (475) (1,225) (350) (975) (3,100) Nuclear Fuel n/a n/a n/a (1,175) (1,175) Dividend (4) (1,725) Nuclear Uprates n/a n/a n/a (400) (400) Wind n/a n/a n/a (650) (650) Solar n/a n/a n/a (625) (625) Upstream n/a n/a n/a (100) (100) Utility Smart Grid/Smart Meter (75) (100) (75) n/a (250) Net Financing (excluding Dividend): Planned Debt Issuances (5) 300 -- 250 775 1,325 Planned Debt Retirements (175) (450) (375) (75) (1,075) Project Finance/Federal Financing Bank Loan n/a n/a n/a 350 350 Other (6) -- 225 -- -- 175 Ending Cash Balance (1) $875 2012 Analyst Meeting – Performance that Drives Progress |
Credit Metrics Support Investment-Grade Ratings Moody’s Credit Ratings (1)(2) S&P Credit Ratings (1)(2) Fitch Credit Ratings (1)(2) FFO / Debt Target Range Exelon Corp Baa2 BBB- BBB+ ComEd A3 A- BBB+ 15-18% PECO A1 A- A 15-18% BGE Baa1 BBB+ BBB+ 15-18% Generation Baa1 BBB BBB+ 25-27% (3) (1) Current senior unsecured ratings for Exelon, Exelon Generation and BGE and senior secured ratings for ComEd and PECO as of April 16, 2012. (2) Moody’s downgraded Exelon and Generation and upgraded BGE upon completion of the merger with Constellation Energy. Moody’s currently has Exelon and Generation on Negative Outlook. S&P and Fitch affirmed ratings of Exelon and subsidiaries upon completion of the merger. (3) FFO/Debt Target Range reflects Generation FFO/Debt in addition to the debt obligations of Exelon Corp. Range represents FFO/Debt to maintain current ratings at current business risk. • Committed to maintaining investment-grade ratings • 2012-2016 credit metrics for Exelon Generation/HoldCo at or above target range — S&P target of 25-27% for Exelon Generation/HoldCo based on current market conditions 21 2012 Analyst Meeting – Performance that Drives Progress Metrics sufficient to maintain investment-grade rating in 5-year financial plan |
Levers Provide Additional Flexibility Lever Summary Operational Efficiencies Cost Management • Identify additional cost management opportunities within the combined company Financial Tools Project Financing • Use project financing for renewable opportunities as deemed fit Defer Growth Projects • Maintain flexibility on timing of generation growth projects — LaSalle EPU 2-year deferral provides additional cash flow headroom and maintains ability to add 303 - 336 MWs by 2017/18 22 EPU = Extended Power Uprate 2012 Analyst Meeting – Performance that Drives Progress Exelon has levers available to maintain balance sheet strength, sustain the dividend and maintain investment-grade ratings |
23 Appendix 2012 Analyst Meeting – Performance that Drives Progress |
$ / Share ComEd Operating EPS Bridge 24 $0.61 $0.03 Depreciation & Amortization $(0.04) O&M $(0.08) RNF $(0.03) Share Count Change $(0.12) 2011 2012 $0.30 - $0.40 Other $(0.02) Interest Note: Drivers add up to mid-point of 2012 EPS range. AMP = Advanced Metering Program RNF = Revenue Net Fuel (1) O&M for utilities excludes regulatory O&M that are P&L neutral. ($0.05) EIMA O&M ($0.02) Pension/OPEB ($0.01) Tax Rate Change $0.03 Decrease in Long-Term Debt $0.02 DST Revenue $0.03 Transmission Revenue ($0.03) Weather ($0.01) Rider AMP ($0.02) Other RNF ($0.03) Depreciation Expense ($0.01) Amortization 2012 Analyst Meeting – Performance that Drives Progress |
PECO Operating EPS Bridge $0.58 2012 $0.40 - $0.50 O&M $0.03 RNF $(0.05) Share Count Change $(0.11) 2011 25 Note: Drivers add up to mid-point of 2012 EPS range RNF = Revenue Net Fuel (1) O&M for utilities excludes regulatory O&M that are P&L neutral. ($0.04) Weather ($0.02) Load $0.03 Primarily Storm Costs 2012 Analyst Meeting – Performance that Drives Progress |
BGE Operating EPS Bridge $0.70 2012 $0.05 - $0.15 Other $0.01 Interest $(0.01) Depreciation & Amortization $(0.02) O&M $0.00 RNF $(0.01) Stub $(0.05) Share Count Change $(0.52) 2011 26 Note: Drivers add up to mid-point of 2012 EPS range. RNF = Revenue Net Fuel (1) O&M for utilities excludes regulatory O&M that are P&L neutral. $0.04 Storm ($0.02) PSC Mandated Reliability Spend ($0.01) Reg Asset Capitalization ($0.01) Other ($0.01) Weather ($0.01) Issuance of long-term debt 2012 Analyst Meeting – Performance that Drives Progress |
Credit Facility Update • Constellation liquidity facilities (excluding BGE) of $4.2B to be eliminated by end of year 2012 — Reduced Constellation $2.5B revolver by $1.0B at merger close and plan to eliminate balance revolver by end of 2012 — End state liquidity capacity of $6.1B starting in 2013 Expected Liquidity Facility (excl. utilities) on 12/31/12 $6.1 Expected Liquidity Reduction $4.2 Liquidity Facilities (excl. utilities) as of 1/1/2012 $10.3 $6.1 Exelon $4.2 Constellation Expect to realize $40M in annual cost savings beginning in 2013 (in $B) 27 2012 Analyst Meeting – Performance that Drives Progress |
Merger CapEx Synergies & Costs To Achieve $80 2012 $60 2013 $40 2014 $8 $325 Capital O&M Costs to Achieve ($M) CapEx Synergies ($M) $70 $55 $35 2015+ 2014 2013 2012 Run rate CapEx synergies of ~$75M 28 • Run rate CapEx synergies mainly driven by: – Information Technology (IT) systems consolidation – Supply Chain capital synergies • Costs to achieve excluded from operating earnings • Key areas of costs to achieve: – IT systems consolidation – Transaction costs (banker, legal costs, etc.) – Employee-related costs 2012 Analyst Meeting – Performance that Drives Progress |
Merger Purchase Accounting P&L Impacts Preliminary Exelon Generation Pre-Tax GAAP P&L Impacts (1) ($M) 2012 Item Q1 Q2 Q3 Q4 Total 2013 2014 Description Earnings Treatment Unamortized energy contracts, net (Revenue net Fuel) ~($125) ~($450) (~$275) ~($300) ~($1,150) ~($475) ~($100) Non-cash amortization of intangible assets, net, for acquired power supply and fuel contracts recognized at fair value at the merger date. Excluded from operating earnings in 2012-14 Depreciation & Amortization ~($1) ~($6) ~($6) ~($6) ~($20) ~($30) ~($30) Net incremental depreciation and amortization based on fair value of generation station and upstream assets, trade name, and retail relationships. Excludes plant divestitures. Included in operating earnings Amortization of adjustment to recognize the unregulated long-term debt at fair value (Interest Expense) ~$3 ~$8 ~$8 ~$8 ~$28 ~$25 ~$15 Non-cash amortization of fair value adjustment for long-term debt. Included in operating earnings except for $17M and $12M hybrid amortization in 2012-13, respectively (2) 29 2012 Analyst Meeting – Performance that Drives Progress (1) Amounts shown in table above are based on the preliminary valuation underlying the disclosures in the first quarter Form 10-Q. These amounts are subject to revision and any changes could be material. Numbers represent increase / (decrease) to GAAP earnings. This list of purchase accounting adjustments is not all inclusive. Other minor adjustments have minimal impact on earnings. (2) Exclusion from operating earnings for amortization related to hybrid instrument expected to be retired in 2013. |
Pension and OPEB for Combined Company Plan Design and Funding Strategy: • Exelon is evaluating benefit plan design changes for the combined company, but does not anticipate merging the Exelon and Constellation plans until 2013 at the earliest • Exelon and Constellation plans will maintain their stand-alone funding strategies in 2012; the funding strategy for the combined company will be reevaluated once the future state plan design is established Both companies’ pension funding strategy is to contribute the minimum amounts required under ERISA, including amounts necessary to avoid benefit restrictions and at-risk status as defined by the Pension Protection Act of 2006 Unlike qualified pension plans, OPEB plans are not subject to regulatory minimum contribution requirements and are, therefore, voluntary. The contribution strategy for Exelon’s OPEB plans is determined based on benefit claims paid and regulatory implications (amounts deemed prudent to meet regulator expectations and best assure continued recovery), while Constellation’s plans are unfunded Current Forecast: • The table below provides the combined company’s 2012 and forecasted 2013 pension and OPEB expense and contributions assuming 2012 asset returns of 7.50% and 6.68% (after-tax) for pension and OPEB, respectively, a projected 12/31/12 pension discount rate of 4.70% and 4.52% for Exelon and Constellation, respectively, and a projected 12/31/12 OPEB discount rate of 4.78% and 4.53% for Exelon and Constellation, respectively (1) Pension and OPEB expenses assume a 27.0% and 27.6% capitalization rate for 2012 and 2013, respectively. (2) Contributions shown in the table above are based on the current contribution policy for Exelon and Constellation plans. 30 2012 2013 (in $M) Pre-Tax Expense (1) Contributions (2) Pre-Tax Expense (1) Contributions (2) Pension $350 $160 $350 $150 OPEB $240 $320 $235 $305 Total $590 $480 $585 $455 2012 Analyst Meeting – Performance that Drives Progress |
2013 Pension and OPEB Sensitivities • Tables below provide sensitivities for the combined company’s 2013 pension and OPEB expense and contributions (1) under various discount rate and S&P 500 asset return scenarios 31 2013 Pension Sensitivity (2) (in $M) S&P Returns in Q2 – Q4 2012 (3) 10% 0% -10% Discount Rate at 12/31/12 Pre-Tax Expense (1) Contributions (2) Pre-Tax Expense (1) Contributions (2) Pre-Tax Expense (1) Contributions (2) Baseline Discount Rate (4) $340 $145 $360 $155 $375 $160 +50 bps $310 $150 $325 $155 $345 $160 - 50bps $375 $90 $390 $150 $410 $160 2013 OPEB Sensitivity (2) (in $M) S&P Returns in Q2 – Q4 2012 (3) 10% 0% -10% Discount Rate at 12/31/12 Pre-Tax Expense (1) Contributions (2) Pre-Tax Expense (1) Contributions (2) Pre-Tax Expense (1) Contributions (2) Baseline Discount Rate (4) $220 $285 $230 $300 $245 $320 +50 bps $200 $260 $210 $275 $225 $290 - 50bps $240 $315 $255 $335 $270 $355 (1) Contributions shown in the table above are based on the current contribution policy for Exelon and Constellation plans. (2) Pension and OPEB expenses assume a 27.6% capitalization rate. (3) Final 2012 asset return for pension and OPEB will depend in part on overall equity market returns from Q2 – Q4 2012 as proxied by the S&P 500. The amounts above reflect YTD S&P returns through March 31, 2012. (4) The baseline discount rates reflect a projected 12/31/12 pension discount rate of 4.70% and 4.52% for Exelon and Constellation, respectively, and OPEB discount rate of 4.78% and 4.53% for Exelon and Constellation, respectively. 2012 Analyst Meeting – Performance that Drives Progress |
Debt Maturity Profile (2012-2020) Debt Maturity Schedule 600 173 75 2014 1,585 648 250 617 70 2013 1,019 300 252 467 2012 819 46 2015 1,685 260 800 35 665 379 2020 1,600 1,100 500 550 2019 2018 600 500 840 2017 1,168 1,340 425 41 2016 1,079 702 PECO ComEd Exelon Corp BGE ExGen (in $M) 32 2012 Analyst Meeting – Performance that Drives Progress ~66% of 2012 – 2016 debt maturities consist of regulated utility debt |
2012 Key Assumptions Utility Statistics 2012 Estimate Electric Delivery Growth (%) (3) ComEd (0.3)% PECO (3.3)% BGE 0.7% Effective Tax Rate - Operating (%) ComEd 39.6% PECO 33.6% BGE 37.8% Exelon 37.4% 33 (1) Excludes Salem and CENG. (2) Reflects forward market prices as of April 30, 2012. (3) Weather-normalized load growth. (4) O&M rounded to the nearest $25M. Generation Statistics 2012 Estimate (2) Nuclear Capacity Factor (%) (1) 93.5% Total Expected Generation(GWh) 219,900 Henry Hub Natural Gas ($/MMbtu) $2.47 Midwest: NiHub ATC Price $26.71 Mid-Atlantic: PJM-W ATC Price $32.70 ERCOT-N ATC Spark Spread $11.10 New York: NY Zone A ATC Price $26.99 New England: Mass Hub Spark Spread $5.98 Effective Tax Rate (%) - Operating 37.1% 2012 O&M (4) Reconciliation (in $M) ExGen ComEd PECO BGE Other Exelon GAAP O&M $4,725 $1,350 $700 $575 $175 $7,525 Decommissioning accretion $(75) - - - - $(75) Retirement of Fossil Plants $(25) - - - - $(25) FERC Settlement $(200) - - - - $(200) Regulatory O&M - $(150) $(25) - - $(175) Merger/Integration costs $(325) - - $(50) $(225) $(600) Operating O&M (as shown on slide 18) $4,100 $1,200 $675 $525 $(50) $6,450 2012 Analyst Meeting – Performance that Drives Progress |
GAAP to Operating Adjustments Three Months Ended March 31, 2012 ExGen (1) ComEd PECO BGE (1) Other (1) Exelon (1) 2012 Adjusted (non-GAAP) Operating Earnings (Loss) Per Share $0.58 $0.13 $0.14 $0.02 $(0.02) $0.85 Mark-to-market adjustments from economic hedging activities 0.05 - - - 0.01 0.06 Unrealized gains related to nuclear decommissioning trust funds 0.05 - - - - 0.05 Retirements of fossil generation units (0.01) - - - - (0.01) Constellation merger and integration costs (0.06) (0.00) (0.01) (0.00) (0.09) (0.16) Maryland commitments (0.03) - - (0.12) (0.17) (0.32) Amortization of commodity contract intangibles (0.11) - - - - (0.11) FERC settlement (0.25) - - - - (0.25) Plant divestitures (0.00) - - - - (0.00) Reassessment of state deferred income taxes 0.02 - - - 0.15 0.17 Other acquisition costs (0.00) - - - - (0.00) 1Q 2012 GAAP Earnings (Loss) Per Share $0.24 $0.13 $0.14 $(0.09) $(0.12) $0.28 34 • Exelon’s 2012 adjusted (non-GAAP) operating earnings outlook excludes the earnings effects of the following: - Mark-to-market adjustments from economic hedging activities - Unrealized gains and losses from nuclear decommissioning trust fund investments to the extent not offset by contractual accounting as described in the notes to the consolidated financial statements - Financial impacts associated with the planned retirement of fossil generating units - Certain costs related to the Constellation merger and integration initiatives - Costs incurred as part of Maryland commitments in connection with the merger - Non-cash amortization of intangible assets, net, related to commodity contracts recorded at fair value at the merger date - Costs incurred as part of a March 2012 settlement with the Federal Energy Regulatory Commission (FERC) related to Constellation’s prior period hedging and risk management transactions - Revenues and operating expenses related to three generation facilities required to be sold within 180 days of the merger - Non-cash benefit associated with a change in state deferred tax rates resulting from a reassessment of anticipated apportionment of Exelon’s deferred taxes as a result of the merger - Certain costs incurred associated with other acquisitions - Significant impairments of assets, including goodwill - Other unusual items - Significant changes to GAAP • Operating earnings guidance assumes normal weather for remainder of the year 2012 Analyst Meeting – Performance that Drives Progress (1) For the three months ended March 31, 2012, includes financial results for Constellation and BGE beginning on March 12, 2012, the date the merger was completed. Note: All amounts shown are per Exelon share and represent contributions to Exelon's EPS. Amounts may not add due to rounding. |
Constellation Ken Cornew EVP and Chief Commercial Officer of Exelon and President and CEO of Constellation |
36 Commercial Business Overview Scale, Scope and Flexibility Across the Energy Value Chain Development and exploration of natural gas and liquids properties 11 assets in seven states ~295 BCFe of proved Reserves (1) Largest merchant power generation portfolio in the U.S. ~35 GW of owned generation capacity (2) Clean portfolio, well positioned for evolving regulatory requirements Industry-leading wholesale and retail sales and marketing platform ~170 TWh of load and ~465 BCF of gas delivered (3) ~ 1 million residential and 100,000 business and public sector customers One of the largest and most experienced Energy Management providers ~2,000 MW of Load Response under contract (4) Over 4,000 energy savings projects implemented across the U.S. Benefiting from scale, scope and flexibility across the value chain (1) Estimated proved reserves as of 12/31/2011. Includes Natural Gas (NG), NG Liquids (NGL) and Oil. NGL and Oil are converted to BCFe at a ratio of 6:1. (2) Total owned generation capacity as of 4/30/2012, net of physical market mitigation (Brandon Shores, C.P. Crane and H.A. Wagner ~2,648 MW). (3) Expected for 2012 as of 4/30/2012. Electric load and gas includes fixed price and indexed products. No stub period adjustment for legacy Constellation contribution. (4) Load Response estimate as of 4/30/2012. 2012 Analyst Meeting – Performance that Drives Progress |
37 Commercial Business Transformation PJM, wholesale marketing focus National, customer-facing business Industry-leading retail platform and portfolio management expertise, combined with one of the lowest cost and best managed generation fleets Optimize generation assets/value added forward hedges Leverage relationships with large wholesale customers Monetize risk management expertise ~$8 billion in gross margin per year Low-cost, geographically and technologically diverse generation fleet Unparalleled upside to tightening energy and capacity markets Largest Merchant Generation Fleet Portfolio and Risk Management Electric Load Serving Business Expand into new markets Cross sell new products and services Benefit from matching generation and load Capital and collateral efficiency 2012 Analyst Meeting – Performance that Drives Progress |
38 Portfolio Management Strategy Protect Balance Sheet Ensure Earnings Stability Create Value Exercising Market Views Purely ratable Actual hedge % Market views on timing, product allocation and regional spreads reflected in actual hedge % High End of Profit Low End of Profit % Hedged Open Generation with LT Contracts Portfolio Management & Optimization Portfolio Management Over Time Align Hedging & Financials Establishing Minimum Hedge Targets Credit Rating Capital Structure Capital & Operating Expenditure Dividend 2012 Analyst Meeting – Performance that Drives Progress Strategic Policy Alignment Three-Year Ratable Hedging Bull / Bear Program •Aligns hedging program with financial policies and financial outlook •Establish minimum hedge targets to meet financial objectives of the company (dividend, credit rating) •Hedge enough commodity risk to meet future cash requirements under a stress scenario •Ability to exercise fundamental market views to create value within the ratable framework •Modified timing of hedges versus purely ratable •Cross-commodity hedging (heat rate positions, options, etc.) •Delivery locations, regional and zonal spread relationships •Ensure stability in near-term cash flows and earnings •Disciplined approach to hedging •Tenor aligns with customer preferences and market liquidity •Multiple channels to market that allow us to maximize margins •Large open position in outer years to benefit from price upside |
39 Portfolio Management Approach Block Energy Basis Load Shape Renewable Ancillaries Capacity Transmission Pricing and Portfolio Management Approach Full Requirements Components (1) Hedged primarily with owned or contracted generation – baseload, intermediate & peaking assets Hedged primarily via market based products – blocks, fixed load shapes, options, RECs Transmission & Capacity Block Energy, Basis, Load Shape, Renewables & Ancillaries Constellation's model will be an integrated approach to load management, selling the products that closely tie to its asset portfolio Constellation approach Load Following Pricing Build Up (Illustrative) Integrated Portfolio Pure Play Retail Mostly Fixed 2012 Analyst Meeting – Performance that Drives Progress (1) Full requirements pricing build up is for illustrative purpose and not reflective of any one particular product or zone. Margins are not reflected in the build up. |
Renewables Baseload Intermediate Peaking Generation capacity 40 Generation and Load Match Our generation portfolio is low cost, flexible and diverse Generation and load positions are well balanced across multiple regions Adequate intermediate and peaking capacity within the portfolio for managing peaking load Continue to buy or sell length from market to manage portfolio needs 15 14 4 16 21 17 20 18 56 74 27 101 22 New York 18 New England 30 ERCOT 44 MidAtlantic 113 MidWest 129 The combination establishes an industry-leading platform with regional diversification of the generation fleet and customer-facing load business Generation Capacity, Expected Generation and Expected Load 2012 in TWh (1,2) Expected Load Expected Generation Generation & Load Match: Competitive Advantage South, West & Canada 2012 Analyst Meeting – Performance that Drives Progress (1) Owned and contracted generation capacity converted from MW to MWh assuming 100% capacity factor for all technology types, except for renewable capacity which is shown at estimated capacity factor. (2) Expected generation and load shown in the chart above will not tie out with load volume and ExGen disclosures. Load shown above does not include indexed products and generation reflects a net owned and contracted position. Estimates as of 4/30/2012. |
24% 41 Electric Load Serving Business: Growth Target 0 20 40 60 80 100 120 140 160 180 200 220 170 +20% 2014E 35-45% 200 65-75% 25-35% 2013E 180 65-75% 25-35% 2012E 55-65% 2011A 170 90 80 Retail Load (2) Wholesale Load Total Contracted Commercial Load (1) 2011 – 2014 TWh Load Split by Customer Class (2011 TWh) Well positioned for growth in volumes and margins on the back of a sustainable platform and new opportunities A diverse set of customers enhances margin opportunities from a sales and portfolio management standpoint Mass Markets <1,000 MWhs per year Small C&I 1,001-5,000 MWhs per year Medium C&I 5,001-25,000 MWhs per year Large C&I >25,000 MWhs per year 46% Wholesale Large C&I 15% Medium C&I 8% Small C&I 7% Mass Markets C&I = Commercial & Industrial Load Size Customer Type 2012 Analyst Meeting – Performance that Drives Progress (1) Numbers and percentages are rounded to the nearest 5 (2) Index load expected to be 20% to 30% of total forecasted retail load |
18% 42 Electric Load Serving Business: Strategy Constellation is well positioned in a U.S. market where capacity available for competitive supply has room to grow Total U.S. Power Market in 2012 Estimated Load ~ 3,700 TWh (1) (1) Source: EIA, KEMA and internal estimates. Through retail and wholesale channels, Constellation currently serves 170 TWhs, or approximately 5%, of total U.S. power demand Expected Total Competitive Market Growth • Underlying load growth – More than 1% annual load growth across the U.S. • Switched market expected to grow by approximately 11% in C&I from 2011 to 2014 – Existing markets: PA and OH – New markets: MI and AZ • Switched market expected to grow by approximately 15% in residential from 2011 to 2014 Strategy to Grow • As existing markets grow and new markets open, serve new customers • Improve market share in existing markets • Cross sell suite of products to existing customers – Create more value with customers – Utilize data and technology to expand product offerings – Achieve higher renewal rates – Distinguish our brand • Leverage operational efficiency Eligible Non-Switched 16% Eligible Switched 19% Muni/Co-Op Market Other Ineligible 47% 2012 Analyst Meeting – Performance that Drives Progress |
43 ExGen Disclosure Overview Continue to provide transparency in our ExGen disclosures with a modified and expanded framework that incorporates new business lines and regions • Continue to provide open gross margins, expected generation, hedge %, reference prices and effective realized energy prices (EREP) Also provide Mark-to Market (MtM) value of all hedges on a consolidated basis • Consider retail and wholesale load to be an alternate channel to market our generation. As such, executed sales are regarded as a hedge and thus flow into MtM, EREP and hedge percentage Provide volume targets and track sales execution versus targets on an annual basis • Introduction of new gross margin categories • In addition to Open Gross Margin and MtM of hedges, gross margins will be provided for the following categories - Power New Business: Gross margins from future hedging activity via retail, wholesale or structured transaction/mid-marketing activities. Once power sales are executed, these flow into MtM via EREP Non Power New Business: Gross margins from planned sales from business activities not related to hedging power production, such as Load Response, Energy Efficiency, Retail and Wholesale Gas, Proprietary Trading (1) etc. Once sales are executed, gross margins will flow to “Non Power Executed” category. Non Power Executed: Contracted gross margin associated with business activities not directly linked to production or sale of power • Introduction of new regions To reflect our expanded national presence, New England, New York, and South, West & Canada regions have been added to Midwest, Mid-Atlantic and ERCOT Hedged gross margins for South, West & Canada will be included within the consolidated “Open Gross Margin” estimate The other five regions will have corresponding expected generation, hedge %, reference prices and EREP 2012 Analyst Meeting – Performance that Drives Progress (1) Proprietary trading gross margins will remain within “Non Power” New Business category and not move to “Non power” executed category. – – – – – – – – – – Maintain ability to value generation fleet on an open and hedged basis No separate gross margins for commercial load, but will disclose volume targets and sales execution |
44 Components of Gross Margin Categories Open Gross Margin •Generation Gross Margin at current market prices, including capacity & ancillary revenues •Exploration and Production •PPA Costs & Revenues •Provided at a consolidated level for all regions (includes hedged gross margin for South, West & Canada (1) ) MtM of Hedges (2) •MtM of power, capacity and ancillary hedges, including cross commodity, retail and wholesale load transactions •Provided directly at a consolidated level for five major regions. Provided indirectly for each of the five major regions via EREP, reference price, hedge %, expected generation “Power” New Business •Retail, Wholesale planned electric sales •Portfolio Management new business •Mid marketing new business “Non Power” Executed •Retail, Wholesale executed gas sales •Load Response •Energy Efficiency •BGE Home •Distributed Solar “Non Power” New Business •Retail, Wholesale planned gas sales •Load Response •Energy Efficiency •BGE Home •Distributed Solar •Portfolio Management / origination fuels new business •Proprietary trading (3) Margins move from new business to MtM of hedges over the course of the year as sales are executed Margins move from “Non power new business” to “Non power executed” over the course of the year Gross margin linked to power production and sales Gross margin from other business activities (1) Hedged gross margins for South, West & Canada region will be included with Open Gross Margin, and no expected generation, hedge %, EREP or reference prices provided for this region. (2) MtM of hedges provided directly for the five larger regions. MtM of hedges is not provided directly at the regional level but can be easily estimated using EREP, reference price and hedged MWh. (3) Proprietary trading gross margins will remain within “Non Power” New Business category andnot move to “Non power” executed category. 2012 Analyst Meeting – Performance that Drives Progress |
45 ExGen Disclosures Gross Margin Category ($ MM) 2012 (1) 2013 2014 Open Gross Margin (2,3) (including South, West, Canada hedged gross margin) $4,300 $5,800 $6,250 Mark-to-Market of Hedges $3,150 $1,400 $500 Power New Business / To Go $200 $550 $850 Non-Power Margins Executed $200 $100 $50 Non-Power New Business / To Go $200 $500 $550 Total Gross Margin $8,050 $8,350 $8,200 Generation and Hedges 2012 (1) 2013 2014 Exp. Gen (GWh) 219,900 218,400 210,200 Midwest 101,800 97,900 97,800 Mid-Atlantic (2,3) 71,300 74,100 72,000 ERCOT 19,900 18,800 16,100 New York (3) 13,400 13,400 10,500 New England 13,500 14,200 13,800 % of Expected Generation Hedged 97-100% 73-76% 41-44% Midwest 94-97% 77-80% 44-47% Mid-Atlantic (2,3) 105-108% 74-77% 45-48% ERCOT (4) 89-92% 56-59% 34-37% New York (3) 91-94% 69-72% 20-23% New England (4) 94-97% 66-69% 27-30% Effective Realized Energy Price ($/MWh) Midwest $41.00 $39.50 $37.00 Mid-Atlantic (2,3) $53.00 $49.00 $49.00 ERCOT (4) $8.50 $6.00 $3.00 New York (3) $45.00 $37.00 $37.50 New England (4) $8.00 $8.50 $3.50 (1) Stub period was calculated by excluding Jan 2012 thru mid-March 2012 for Constellation only. (2) Excludes Maryland assets to be divested. (3) Includes Constellation Energy Nuclear Group (CENG) Joint Venture. Reference Prices (ATC -$/MWh) (5) 2012 2013 2014 Henry Hub Natural Gas ($/MMbtu) $2.47 $3.45 $3.87 Midwest: NiHub $26.71 $30.28 $32.45 Mid-Atlantic: PJM-W $32.70 $37.93 $40.37 ERCOT-N ATC Spark Spread $11.10 $9.19 $8.50 New York: NY Zone A $26.99 $31.40 $33.46 New England: Mass Hub Spark Spread $5.98 $4.66 $3.50 2012 Analyst Meeting – Performance that Drives Progress (4) Spark spreads shown for Texas and New England. (5) Based on April 30, 2012 market conditions. |
46 Closing Remarks • RPM PY 2015/2016 Auction Results Results were in line with internal expectations of pricing improvement vs. last year’s auction Moderate growth in cleared Demand Response (DR) signals continued DR bidding discipline • Best Positioned Merchant Generation Portfolio Continue to believe the upside associated with net retirements and higher operational costs in the range of $3-5/MWh in PJM, with a large portion not currently reflected in energy prices • Effective Risk Management Well established criteria and effective oversight to manage and monitor risk Small proprietary trading function and contribution to gross margin • Nation’s Number One Energy Marketer Best positioned to capture additional load as new markets open and existing markets mature Matching generation to load, and an extensive suite of products and services, provides us with a competitive advantage We are well positioned to expand our business across many fronts and deliver on overall commercial business growth 2012 Analyst Meeting – Performance that Drives Progress |
47 Appendix 2012 Analyst Meeting – Performance that Drives Progress |
48 Generation Capacity Market Positions 2011/2012 2012/2013 2013/2014 2014/2015 2015/2016 PJM (1) RTO Capacity 27,400 12,800 11,500 11,500 11,500 Price $110 $16 $28 $126 $136 EMAAC Capacity (2) 9,200 9,200 9,200 9,200 Price $140 $245 $137 $168 MAAC Capacity 2,600 2,700 2,700 2,700 Price $133 $226 $137 $168 SWMAAC Capacity (3) 1,900 1,900 1,900 1,900 Price $133 $226 $137 $168 New England (4) NEMA Capacity 2,100 2,100 2,100 2,100 2,100 Price $104 (5) $85 (5) $85 (5) $107 $114 SEMA Capacity 35 35 35 35 35 Price $104 (5) $85 (5) $85 (5) $95 (5) $104 (5) Rest of Pool Capacity 700 700 700 700 700 Price $104 (5) $85 (5) $85 (5) $95 (5) $104 (5) NYISO (6) Rest of Pool Capacity 1,100 1,100 1,100 1,100 1,100 MISO (7) AMIL Capacity 1,100 1,100 1,100 1,100 1,100 RTO = Regional Transmission Organization, MAAC = Mid-Atlantic Area Council, EMAAC = Eastern Mid-Atlantic Area Council, SWMAAC = South West Mid-Atlantic Area Council, NEMA = North East Massachusetts; SEMA = North East Massachusetts, AMIL = Ameren Illinois. 2012 Analyst Meeting – Performance that Drives Progress (1) Reflects owned and contracted generation installed capacity (ICAP) adjusted for mid – year PPA roll offs. (2) ICAP is net of Eddystone 1&2, Cromby 1&2 (total ~ 933 MW), which are not included PY 11/12 onwards reflecting decision in December 2009 to permanently retire these units. (3) ICAP for all years beginning PY 11/12 excludes capacity for units to be divested (Brandon Shores, Wagner & Crane ~2,648 MW). Constellation offered these units in PY11/12 - PY 15/16 auctions. (4) Reflects Qualified Summer Capacity including owned and contracted units. (5) Price is pro-rated for auctions that clear at the floor price and there is more capacity procured than suggested by the reliability requirement. (6) Reflects 50.01% ownership in CENG; (7) Does not include wind under PPA. |
49 Capacity Market Background PJM Reliability Pricing Model (RPM) • Base Residual Auction is held 3 years in advance for 1-year term 97.5% of Reliability Requirement is targeted to be procured Demand curve based approach to procurement • Three Incremental Auctions are held prior to delivery 2.5% of Reliability Requirement is targeted to be procured ISO-NE Forward Capacity Market (FCM) • Forward Capacity Auction is held 3 years in advance for 1-year term 100% of Installed Capacity Requirement is procured Descending clock auction with administrative floor price • Three Reconfiguration Auctions are held prior to delivery and Monthly Spot Auctions are held during the delivery year NYISO Capacity Auctions • Annual procurement for prompt planning year Split into summer and winter seasonal auctions Demand curve based approach to procurement • Monthly and spot auctions are held during the delivery year 2012 Analyst Meeting – Performance that Drives Progress |
50 Electric Load Serving Business: Background • #1 retail C&I power provider with 17% share of the switched commercial and industrial market (1) • Top 10 provider of residential power • Active in all U.S. power markets and products and serving over 2/3rds of Fortune 100 companies (1) Exelon and Constellation combined retail businesses. Source: KEMA, “The Retailer Yearbook”, December 2011. National Presence Constellation is the leading power supplier in the U.S. with coast to coast presence and a large suite of product offerings Multiple Avenues & Scalable Platform Back Office Systems Experienced Sales Force Innovative Marketing Strong Brand Recognition Scalable Platform Multiple Products Multiple Channels Multiple Customers Multiple Markets 2012 Analyst Meeting – Performance that Drives Progress |
51 Load Response Estimated Total Available Market = 100 GW (1) 30% 30% C&I Switched C&I Available Residential Available 40% National Presence Portfolio Size • Approximately 2 GW of load response under contract Market Potential • Roughly 100 GW total market potential of which 30 GW is located in active ISO Demand Response markets Growth Strategy and Objectives • Share capture in maturing formal ISO demand response capacity programs • Focus on growth opportunities in economics and reserve programs 2012 Analyst Meeting – Performance that Drives Progress (1) Source: FERC/McKinsey. Customer class as % of total market. Not including municipals, cooperatives and utility driven DR programs. |
52 Energy Efficiency National Presence Estimated Total Available Market = 20 GW (1) 6% Residential 94% Non Residential (1) Source: EPRI/McKinsey. Customer class as % of total market. Portfolio Size • Over 4,000 energy savings projects have been implemented to date Market Potential • $5 billion to $6 billion in annualized revenue • Approx. 40% located in non-competitive markets allowing growth beyond key traditional power markets Growth Strategy and Objectives • Focus on government, education, healthcare and multi-family housing sectors • Combined product offering primarily focuses on commercial and industrial customers 2012 Analyst Meeting – Performance that Drives Progress States with Current Constellation EE Presence Regulatory Environment Benefiting EE Projects Lack of Regulation Benefiting EE Projects |
53 Distributed Solar Portfolio Size • Of the company’s 345 MW of solar installations owned or under construction (all expected to be operational by 2013), approximately 59 MW are non-utility scale installations for our commercial, industrial and public sector customers Market Potential (2) • Unsubsidized economic potential for distributed residential and commercial solar PV in the U.S. likely to reach 10 to 12 GW by the end of 2012 Growth Strategy and Objectives • Focus on states with established incentives markets in place – MD, NJ, MA and CA – and where there is potential for new incentive markets – CT and NY • Pursue opportunities in non-Solar REC markets – CO, AZ and NM – where there is increased interest in solar (1) Excludes Antelope Valley Solar Ranch One (230 MW), Sacramento Municipal Utility District (30 MW), City Solar Project (10 MW) and Maryland Generating Clean Horizons (16 MW). (2) Source: McKinsey, “Solar Power: Darkest Before Dawn” published April 2012. 2012 Analyst Meeting – Performance that Drives Progress |
54 Retail and Wholesale Gas Retail Gas (1) (2011 – 2014 Bcf) Retail Gas Portfolio Size • 465 Bcf expected to be served in 2012 • Month by month renewals, with high renewal rates Market Potential • All states are competitive markets with an estimated total market size of 15,000 Bcf, of which 7,000 Bcf is currently switched Growth Strategy and Objectives • Looking to grow Northeast gas markets as well as recently acquired ONEOK territories Wholesale Gas Portfolio Size • 5 Bcf wholesale storage • 300,000 MMBtu’s per day of term transport • Over 1 Bcf/day of plant supply Growth Strategy and Objectives • Expand wholesale presence to complement power assets 385 0 50 100 150 200 250 300 350 400 450 500 550 2014E 530 2013E 505 2012E 465 2011A Retail Gas Contribution from ONEOK Energy Marketing Company acquisition (1) Estimate as of 4/30/2012. 2012 Analyst Meeting – Performance that Drives Progress +14% +21% |
55 ExGen Disclosures April 30, 2012 2012 Analyst Meeting – Performance that Drives Progress |
56 ExGen Disclosures Gross Margin Category ($ MM) 2012 (2) 2013 2014 Open Gross Margin (including South, West & Canada hedged GM) (3,4) $4,300 $5,800 $6,250 Mark to Market of Hedges (5) $3,150 $1,450 $550 Power New Business / To Go $200 $550 $850 Non-Power Margins Executed $200 $100 $50 Non-Power New Business / To Go $200 $500 $550 Total Gross Margin $8,050 $8,350 $8,200 (1) Gross margin rounded to nearest $50M. (2) Stub period calculated by excluding Jan 2012 thru mid-March 2012 for Constellation only. (3) Excludes Maryland assets to be divested. Reference Prices (6) 2012 2013 2014 Henry Hub Natural Gas ($/MMbtu) $2.47 $3.45 $3.87 Midwest: NiHub ATC prices ($/MWh) $26.71 $30.28 $32.45 Mid-Atlantic: PJM-W ATC prices ($/MWh) $32.70 $37.93 $40.37 ERCOT-N ATC Spark Spread ($/MWh) HSC Gas, 7.2HR, $2.50 VOM $11.10 $9.19 $8.50 New York: NY Zone A ($/MWh) $26.99 $31.40 $33.46 New England: Mass Hub ATC Spark Spread($/MWh) ALQN Gas, 7.5HR, $0.50 VOM $5.98 $4.66 $3.50 (4) Includes CENG Joint Venture. (5) Mark to Market of Hedges assumes mid-point of hedge percentages. (6) Based on April 30, 2012 market conditions. 2012 Analyst Meeting – Performance that Drives Progress (1) |
57 ExGen Disclosures Generation and Hedges 2012 (1) 2013 2014 Exp. Gen (GWh) (4) 219,900 218,400 210,200 Midwest 101,800 97,900 97,800 Mid-Atlantic (2,3) 71,300 74,100 72,000 ERCOT 19,900 18,800 16,100 New York (3) 13,400 13,400 10,500 New England 13,500 14,200 13,800 % of Expected Generation Hedged (5) 97-100% 73-76% 41-44% Midwest 94-97% 77-80% 44-47% Mid-Atlantic (2,3) 105-108% 74-77% 45-48% ERCOT 89-92% 56-59% 34-37% New York (3) 91-94% 69-72% 20-23% New England 94-97% 66-69% 27-30% Effective Realized Energy Price ($/MWh) (6) Midwest $41.00 $39.50 $37.00 Mid-Atlantic (2,3) $53.00 $49.00 $49.00 ERCOT 7 $8.50 $6.00 $3.00 New York (3) $45.00 $37.00 $37.50 New England (7) $8.00 $8.50 $3.50 (1) Stub period calculated by excluding Jan 2012 thru mid-March 2012 for Constellation only. (2) Excludes Maryland assets to be divested (3) Includes CENG Joint Venture. (4) Expected generation represents the amount of energy estimated to be generated or purchased through owned or contracted for capacity. Expected generation is based upon a simulated dispatch model that makes assumptions regarding future market conditions, which are calibrated to market quotes for power, fuel, load following products, and options. Expected generation assumes 10 refueling outages in 2012 and 2013 and 11 refueling outages in 2014 at Exelon-operated nuclear plants and Salem but excludes CENG. Expected generation assumes capacity factors of 93.5%, 93.3% and 93.8% in 2012, 2013 and 2014 at Exelon-operated nuclear plants excluding Salem and CENG. These estimates of expected generation in 2012, 2013 and 2014 do not represent guidance or a forecast of future results as Exelon has not completed its planning or optimization processes for those years. (5) Percent of expected generation hedged is the amount of equivalent sales divided by expected generation. Includes all hedging products, such as wholesale and retail sales of power, options and swaps. Uses expected value on options. (6) Effective realized energy price is representative of an all-in hedged price, on a per MWh basis, at which expected generation has been hedged. It is developed by considering the energy revenues and costs associated with our hedges and by considering the fossil fuel that has been purchased to lock in margin. It excludes uranium costs and RPM capacity revenue, but includes the mark-to-market value of capacity contracted at prices other than RPM clearing prices including our load obligations. It can be compared with the reference prices used to calculate open gross margin in order to determine the mark-to-market value of Exelon Generation's energy hedges. (7) Spark spreads shown for ERCOT and New England. 2012 Analyst Meeting – Performance that Drives Progress |
58 ExGen Hedged Gross Margin Sensitivities Gross Margin Sensitivities (With Existing Hedges) (1, 4) 2012 2013 2014 Henry Hub Natural Gas ($/MMbtu) (2) + $1/Mmbtu $(70) $155 $570 - $1/Mmbtu $85 $(130) $(505) NiHub ATC Energy Price + $5/MWh $20 $105 $295 - $5/MWh $(10) $(105) $(290) PJM-W ATC Energy Price (2) + $5/MWh $(20) $90 $205 - $5/MWh $25 $(90) $(200) NYPP Zone A ATC Energy Price + $5/MWh $10 $25 $45 - $5/MWh $(10) $(25) $(45) Nuclear Capacity Factor (3) +/- 1% +/- $25 +/- $40 +/- $40 (1) Based on April 30, 2012 market conditions and hedged position. Gas price sensitivities are based on an assumed gas-power relationship derived from an internal model that is updated periodically. Power prices sensitivities are derived by adjusting the power price assumption while keeping all other prices inputs constant. Due to correlation of the various assumptions, the hedged gross margin impact calculated by aggregating individual sensitivities may not be equal to the hedged gross margin impact calculated when correlations between the various assumptions are also considered. (2) Excludes Maryland assets to be divested. (3) Includes CENG Joint Venture (4) Sensitivities based on commodity exposure which includes open generation and all committed transactions. 2012 Analyst Meeting – Performance that Drives Progress |
59 Exelon Generation Hedged Gross Margin Upside/Risk 6,000 6,500 7,000 7,500 8,000 8,500 9,000 9,500 10,000 2014 2013 2012 $8,200 $7,800 $8,900 $8,000 $9,500 $7,200 2012 Analyst Meeting – Performance that Drives Progress (1) Represents an approximate range of expected gross margin, taking into account hedges in place, between the 5th and 95th percent confidence levels assuming all unhedged supply is sold into the spot market. Approximate gross margin ranges are based upon an internal simulation model and are subject to change based upon market inputs, future transactions and potential modeling changes. These ranges of approximate gross margin in 2013 and 2014 do not represent earnings guidance or a forecast of future results as Exelon has not completed its planning or optimization processes for those years. The price distributions that generate this range are calibrated to market quotes for power, fuel, load following products, and options as of April 30, 2012 (2) Gross Margin Upside/Risk based on commodity exposure which includes open generation and all committed transactions. (3) Excludes Maryland assets to be divested. |
60 Upstream E&P Assets (1) Oil/NGL conversion to gas is 6:1. (2) Constellation does not operate any of its properties. Estimated Net Proved Reserves (as of 12/31/11) Average Net Daily Production (Q1 2012) Forecasted Production 2012 2013 2014 295 Bcfe 67 MMcfe Net Daily Prod (MMcfe / day) 55 - 70 55 - 70 60 - 75 Mississippi lime (OK) Hunton dewatering (OK) Woodford shale (OK) Eagle Ford shale (TX) Fayetteville shale (AR) Haynesville shale (LA) Floyd shale (AL) Ohio shale (OH) Trenton Black River (MI) Current Portfolio of Investments 2012 Analyst Meeting – Performance that Drives Progress |
ExGen Disclosures Guide 61 2012 Analyst Meeting – Performance that Drives Progress |
ExGen Disclosure Overview Continue to provide transparency in our ExGen disclosures with a modified and expanded framework that incorporates new business lines and regions • Continue to provide open gross margins, expected generation, hedge %, reference prices and effective realized energy prices (EREP) Also provide Mark-to Market (MtM) value of all hedges on a consolidated basis • Consider retail and wholesale load to be an alternate channel to market our generation. As such, executed sales are regarded as a hedge and thus flow into MtM, EREP and hedge percentage Provide volume targets and track sales execution versus targets on an annual basis • Introduction of new gross margin categories • In addition to Open Gross Margin and MtM of hedges, gross margins will be provided for the following categories - Power New Business: Gross margins from future hedging activity via retail, wholesale or structured transaction/mid-marketing activities. Once power sales are executed, these flow into MtM via EREP Non Power New Business: Gross margins from planned sales from business activities not related to hedging power production, such as Load Response, Energy Efficiency, Retail and Wholesale Gas, Proprietary Trading (1) etc. Once sales are executed, gross margins will flow to “Non Power Executed” category. Non Power Executed: Contracted gross margin associated with business activities not directly linked to production or sale of power • Introduction of new regions To reflect our expanded national presence, New England, New York, and South, West & Canada regions have been added to Midwest, Mid-Atlantic and ERCOT Hedged gross margins for South, West & Canada will be included within the consolidated “Open Gross Margin” estimate The other five regions will have corresponding expected generation, hedge %, reference prices and EREP Maintain ability to value generation fleet on an open and hedged basis No separate gross margins for commercial load, but will disclose volume targets and sales execution (1) Proprietary trading gross margins will remain within “Non Power” New Business category and not move to “Non power” executed category. 62 2012 Analyst Meeting – Performance that Drives Progress |
63 ExGen Disclosure Overview Gross Margin Categories ($ MM) For all regions, three years forward General Description Open Gross Margin Value of generation at current market prices, excluding the impact of any near- term hedges Mark to Market of Hedges Mark-to-market value of transactions associated with hedging open generation position (power or fuel hedges, including executed retail/wholesale electric load) Power New Business / To Go New category of gross margins for future hedging activity via retail, wholesale or structured transaction / mid marketing activities. Non-Power Margins Executed New category for contracted gross margin associated with business activities not directly linked to production or sale of power Non-Power New Business / To Go New category for gross margins from planned sales from business activities not related to hedging power production Total Gross Margin Sum total of each of the five gross margin categories Generation & Hedges General Description Expected Generation (GWh) Anticipated output from owned or contracted generating capacity % of Expected Generation Hedged Physical or financial hedges against power output Effective Realized Energy Price Close proxy for the hedged power price or spark, and when used in conjunction with the reference price and hedged MWh yields the MtM of hedges. Retail & Wholesale Volumes General Description Electric load target & contracted volumes Estimate of load sales target and sales executed from all load channels Retail gas target Estimate of gas sales target 2012 Analyst Meeting – Performance that Drives Progress |
Components of Gross Margin Categories Margins move from new business to MtM of hedges over the course of the year as sales are executed Margins move from “Non power new business” to “Non power executed” over the course of the year Gross margin linked to power production and sales Gross margin from other business activities Open Gross Margin •Generation Gross Margin at current market prices, including capacity & ancillary revenues •Exploration and Production •PPA Costs & Revenues •Provided at a consolidated level for all regions (includes hedged gross margin for South, West & Canada (1) ) MtM of Hedges (2) •MtM of power, capacity and ancillary hedges, including cross commodity, retail and wholesale load transactions •Provided directly at a consolidated level for five major regions. Provided indirectly for each of the five major regions via EREP, reference price, hedge %, expected generation “Power” New Business •Retail, Wholesale planned electric sales •Portfolio Management new business •Mid marketing new business “Non Power” Executed •Retail, Wholesale executed gas sales •Load Response •Energy Efficiency •BGE Home •Distributed Solar “Non Power” New Business •Retail, Wholesale planned gas sales •Load Response •Energy Efficiency •BGE Home •Distributed Solar •Portfolio Management / origination fuels new business •Proprietary trading (3) (1) Hedged gross margins for South, West & Canada region will be included with Open Gross Margin, and no expected generation, hedge %, EREP or reference prices provided for this region. (2) MtM of hedges provided directly for the five larger regions. MtM of hedges is not provided directly at the regional level but can be easily estimated using EREP, reference price and hedged MWh. (3) Proprietary trading gross margins will remain within “Non Power” New Business category andnot move to “Non power” executed category. 64 2012 Analyst Meeting – Performance that Drives Progress |
Illustrative Example of Modeling Exelon Generation 2013 Gross Margin Row Item Midwest Mid- Atlantic ERCOT New England New York South, West & Canada (A) Start with fleet-wide open gross margin $5.8 billion (B) Expected Generation (TWh) 97.9 74.1 18.8 13.4 14.2 (C) Hedge % (assuming mid-point of range) 78.5% 75.5% 57.5% 70.5% 67.5% (D=B*C) Hedged Volume (TWh) 76.9 55.9 10.8 9.4 9.6 (E) Effective Realized Energy Price ($/MWh) $39.50 $49.00 $6.00 $37.00 $8.50 (F) Reference Price ($/MWh) $30.28 $37.93 $9.19 $31.40 $4.66 (G=E-F) Difference ($/MWh) $9.22 $11.07 ($3.19) $5.60 $3.84 (H=D*G) Mark-to-market value of hedges ($ million) (1) $715 million $625 million ($35) million $55 million $40 million (I=A+H) Hedged Gross Margin ($ million) $7,200 million (J) Power New Business / To Go ($ million) $550 million (K) Non-Power Margins Executed ($ million) $100 million (L) Non- Power New Business / To Go ($ million) $500 million (N=I+J+K+L) Total Gross Margin $8,350 million (1) Mark-to-market rounded to the nearest $5 million. 65 2012 Analyst Meeting – Performance that Drives Progress |
66 Constellation Energy Nuclear Group (CENG) Background As a result of Exelon’s equity interest in CENG, PPA contracts between CENG and 3 parties and the PPA between CENG and ExGen, some background on CENG and how CENG gross margins and earnings are reflected in ExGen disclosures and other financial statements. Calvert 1&2 NMP 1 NMP 2 (1) Ginna (2) Ownership Interest Total Plant Capacity 1, 750 MW 620 MW 1,138 MW 581 MW Ownership Split 100% CENG 100% CENG 82% CENG / 18% LIPA 100% CENG ExGen Ownership (50.01% of CENG) 875 MW 310 MW 466.5 MW 290.5 MW PPA structure (% output) CENG Legacy PPA with Utilities - - See footnote 1 90% < June 2014 0% > June 2014 CENG PPA with Parents 100% 100% 100% 10% < June 2014 100% > June 2014 CENG PPA with Parents 5 year contract extendable at end of each year for additional year - Market based pricing and monthly, rolling 3 year hedge profile (100%, 60%, 30%) 2012 2013 2014 2015 (% of uncommitted output) EDF Trading 15 15 15 N.A. ExGen 85 85 85 N.A. (1) Nine Mile Point 2 (NMP) has a revenue sharing agreement (via a call option type contract) on 80% of the output. (2) Ginna Legacy PPA at $44/MWh; CENG PPA with parents (ExGen, EDF) at close to market prices and designed to maintain a monthly ratable profile for CENG. 2012 Analyst Meeting – Performance that Drives Progress rd |
67 Constellation Energy Nuclear Group (CENG) Background •ExGen forward disclosures reflect the gross position that accrues to ExGen from ownership interest in CENG and PPA with CENG as of a certain date •Open Gross Margin: Reflects proportionate share of CENG revenues and fuel costs, market value of PPA less PPA costs paid by ExGen to CENG •MtM of Hedges: Reflects MtM of any hedges placed by ExGen for managing position arising from ownership interests or PPAs with CENG •Expected Generation: Reflects proportionate ownership in CENG and generation associated with PPA between CENG and ExGen. •Hedge Percentage: Reflects hedges placed by ExGen to hedge exposure arising from CENG position (owned or contracted) •Effective Realized Energy Price: Reflects MtM and hedges from CENG position (owned or contracted) •ExGen actuals reflect equity method accounting treatment for ownership interest in CENG and regular treatment for PPA between ExGen and CENG. •RnF: Includes net PPA gross margin (revenues less costs) between ExGen and CENG. CENG earnings or gross margin are not included, and are instead shown under “CENG equity earnings” on the income statement. •Total Supply: Includes only the generation corresponding to the PPA between ExGen and CENG. •Average Margins ($/MWh): Includes only margins corresponding to PPA between ExGen and CENG as well as any hedges placed by ExGen ExGen Disclosures Forward Estimates Financial Statements (10-Q, 10-K, Earnings Release tables) Actuals 2012 Analyst Meeting – Performance that Drives Progress |
Competitive Markets Bill Von Hoene Senior EVP & Chief Strategy Officer |
Drive Competition and Choice We believe in the value competitive energy markets bring to our customers via choice, innovation and savings Retail Markets Wholesale Markets Perfect Core Markets Support continued growth of competitive retail choice for energy and services in restructured states Defend Open Markets Oppose and defeat efforts to limit competitive retail choice for energy and services Support Transparent Pricing Mechanisms Promote the establishment of market rules that provide transparent price signals for energy and capacity and allow a level playing field for all providers to compete Defend Well Functioning Wholesale Markets Oppose government mandates to subsidize unneeded, uneconomic generation. Challenge illegalities of legislative or regulatory construct and strengthen mitigation measures via FERC (e.g. MOPR) We champion competitive energy markets to empower our customers and enhance value for our shareholders Expand into Restricted or Closed Markets Enable competitive retail choice for energy & services in states that limit or are closed to competition 69 2012 Analyst Meeting – Performance that Drives Progress |
Perfecting Existing Retail Energy Markets • Opportunity to offer savings for residential class continues to support switching – 56% of eligible Illinois load is served by competitive suppliers – Over 200 communities approved ballot measures to allow municipal aggregation – Increased consumer protection encourages residential consumers to pursue retail supply Core retail markets are adopting continuous improvements to enhance shopping and expand customer experience • PAPUC moving steadily toward a fully competitive end state 60% of eligible Pennsylvania load is served by competitive suppliers Retail markets assessment targeting improvements to retail market Reforms of default service likely to stimulate retail shopping • Exelon looking to build partnership with Maryland energy stakeholders 56% of eligible Maryland load is served by competitive suppliers Web portal for residential electricity price comparison • Steadfast commitment to retail competition Market volatility creates opportunities for risk management and enhanced products and services High penetration of smart meter installation and state-wide, standardized customer data interface creates opportunities for increased products and services Note: PAPUC = Pennsylvania Public Utility Commission; AMI = Advanced Metering Infrastructure. Illinois Pennsylvania Maryland Texas 70 2012 Analyst Meeting – Performance that Drives Progress |
Defense of Competitive Markets 71 Our regulatory advocacy efforts are designed to improve the functioning of competitive markets where they exist and protect against attempts to undermine price signals We actively seek opportunities to preserve the integrity of competitive markets We participate in, or if necessary initiate, proceedings at FERC and at state commissions to protect the efficient functioning of wholesale and retail markets and thwart attempts to undermine price signals A current example is our efforts to defend forward capacity markets in PJM from the exercise of buyer market power by states and load interests A key component of energy market regulation is the principle of comparability; all resources, whether existing, new, renewable, fossil or nuclear, should have a level playing field and the ability to compete on a best price basis. Supply and demand resources should be expected to meet the same performance criteria if they receive the same compensation Transmission is a critical element of wholesale market liquidity, so we seek to develop or facilitate the development of transmission upgrades that reduce congestion around our assets We utilize public messaging and are active in coalitions such as COMPETE to inform consumers of the value of competition 2012 Analyst Meeting – Performance that Drives Progress |
Opportunities to Expand Competitive Retail Energy Markets • Considering opening the market to retail choice – Customer/supplier advocacy efforts to encourage policymakers and commission to take action to re-open retail shopping – Recent rate case settlement includes pilot shopping program There is a growing interest to open or expand competition in markets with restricted or non-existent retail choice • Increase existing Direct Access Cap – Existing program fully subscribed – Incremental shopping eligibility fills within seconds – Exit fees remain a challenge – Community Choice Aggregation still an option • Increase or remove existing 10% electric choice cap and enable more customers to select their provider of choice – Current program is fully subscribed – Legislation introduced to raise shopping cap to 19% to accommodate current waiting list • Significant improvement in retail competition with the changes in the Electric Security Plan to phase- in competition but there is room for further enhancements – 50% of eligible Ohio load is served by competitive suppliers – Outlook suggests competitive solicitations for utility standard service offer – Utilities moving assets to participate in PJM RPM market 72 2012 Analyst Meeting – Performance that Drives Progress Arizona California Michigan Ohio |
Asset Divestiture Update Executed purchase and sale agreement expected by August 2012 • Maryland assets to be divested are an attractive investment for potential buyers – Plants are well-positioned to comply with Air Toxics Standards and Cross-State Air Pollution Rule (CSAPR) – Located in Southwestern MAAC region, an attractive region within PJM – Near major urban centers with stable demand Brandon Shores H.A. Wagner C.P. Crane • 1,273 MW capacity • 2 unit coal plant • 976 MW capacity • 5 unit coal/oil/gas plant • 399 MW capacity • 3 unit coal/oil plant 73 2012 Analyst Meeting – Performance that Drives Progress |
Exelon Utilities Denis O’Brien Senior EVP of Exelon and CEO of Exelon Utilities |
Exelon Utilities – Leveraging Operational Expertise Exelon Utilities will deliver best-in-class operational and financial performance, creating greater value for our stakeholders Achieving best-in-class performance: • Set a strategic direction to be among the best • Ensure that each utility performs to the highest standards • Drive for standardization and sharing of best practices • Realize merger synergies across the utilities • 2011 Revenues: $3.0B • Employees: ~3,400 • Electric customers: 1.2 million • Gas customers: 0.7 million • Service Territory: 2,300 square miles • All-Time Peak Load: 7,616 MW Baltimore, Maryland Philadelphia, Pennsylvania • 2011 Revenues: $3.7B • Employees: ~2,400 • Electric customers: 1.6 million • Gas customers: 0.5 million • Service Territory: 2,100 square miles • All-Time Peak Load: 8,983 MW • 2011 Revenues: $6.1B • Employees: ~5,800 • Electric customers: 3.8 million • Service Territory: 11,300 square miles • All-Time Peak Load: 23,753 MW Chicago, Illinois 75 2012 Analyst Meeting – Performance that Drives Progress |
ComEd – Growth through Investment that Benefits Customers Driving innovative legislative and regulatory policy to benefit customers, improve ratemaking process transparency and enable economic development Energy Infrastructure Modernization Act (EIMA) Formula Rate Process • Driving investment in electricity infrastructure and smart meter/smart grid – $2.6B over 10 years • Making investments that benefit customers – Smart meters – Distributed automation – Storm hardening • Monitoring performance standards and metrics • Providing for returns on investment – Performance-based distribution formula rate recovery Distribution: • Nov. 2011 initial filing (2010 calendar year + 2011 net plant additions) proposed $59M decrease in revenue requirement – 10.05% ROE (12-month average of the 30-year US Treasury yield plus 580 basis point risk premium) – May 2012 ICC ordered $168M decrease • April 2012 first annual update (2011 calendar year + 2012 net plant additions) and 2011 reconciliation filing; rates effective following January • Latest annual formula rate update filed in May 2012, increased revenue requirement ~$23M • Rates effective June 2012 • FERC approved 11.50% ROE Economic Development Initiatives • Illinois Economic Development Corporation Act introduced to form public-private partnership supporting business expansion and creating jobs • ComEd’s Economic Development team targeting new facilities in northern Illinois, including expansion of data centers, warehouses and manufacturing Transmission Growth • Several upgrade projects planned – Burnham to Taylor lines will reinforce transmission system and increase capacity to reliably serve the Chicago southern business district – Capital spend estimated at ~$150M – In-service date planned for June 2014 Note: ICC = Illinois Commerce Commission; FERC = Federal Energy Regulatory Commission 76 2012 Analyst Meeting – Performance that Drives Progress Transmission: |
77 PECO – Competitive Market Initiatives Supporting competitive procurement markets and evaluating longer-term opportunities of Act 11 Alternative Ratemaking Rate Case Update Electricity Supply Procurement • Newly enacted Act 11 (HB 1294) provides a distribution system improvement charge (DSIC) to support electric and gas infrastructure investment Provision for use of fully projected future test year in rate cases Requires submission of long-term infrastructure improvement plan DSIC capped at 5% of distribution rates PAPUC DSIC rulemaking underway Distribution: • In Dec. 2010, PAPUC approved settlement of electric and gas rate cases; no allowed ROE specified • Increase in annual service revenue of $225M for electric and $20M for gas effective 1/1/11 • No rate cases currently planned; timing of future filings will depend on load and expense forecasts and implementation of DSIC • PAPUC-approved Default Service Plan (DSP) Program has 29-mo. term that ends 5/31/13 • PECO filed second DSP outlining plan from 6/1/13 through 5/31/15 • As of May 2012, ~28% of total retail customers purchased energy from alternative suppliers, representing ~60% of load • PAPUC evaluating alternative default service models to enhance competition Growth Initiatives • Executing $650M Smart Grid investment plan with surcharge recovery for AMI costs • Support potential sales and repurposing of oil refineries • Convert oil and propane usage to natural gas • Enhance economic development outreach Note: PAPUC = Pennsylvania Public Utility Commission; AMI = Advanced Metering Infrastructure 2012 Analyst Meeting – Performance that Drives Progress |
BGE – Fulfilling Commitments Fulfilling commitments to stakeholders with continued focus on safety and reliability Commitments to Maryland Rate Case Update • Reinforced ring fencing • Maintaining employment and minimum O&M/capital spending levels for 2 years • Rate credit of $100 per residential customer provided in May/June 2012 • $113.5M customer investment fund – First contribution to fund within 90 days from merger close – MD Public Service Commission (MDPSC) set June 15 deadline for parties to submit preliminary proposals for allocating fund MDPSC Service Quality and Reliability Regulations • Effective regulations establish standards in a variety of service quality and reliability areas • Actions expected to add incremental costs beginning in 2012 to achieve compliance and enhance system reliability and customer satisfaction Distribution: • Last electric and gas rate cases filed 5/7/10 • MDPSC approved $31M electric revenue increase with 9.86% ROE and $10M gas increase with 9.56% ROE • New rates effective December 2010 • Plan to file electric and gas cases in 2 half of 2012 with rates effective no more than 210 days after filing Transmission: • Latest annual formula rate update filed in April 2012, increased revenue requirement ~$18M • Rates effective June 2012 • FERC approved 11.3% ROE Transmission Growth • Transmission-related capital spend expected to total ~$690M through 2016 – Majority of spend (~$450M) related to RTEP- mandated projects for system upgrades and enhancements Note: RTEP = PJM’s Regional Transmission Expansion Plan nd 78 2012 Analyst Meeting – Performance that Drives Progress |
Smart Meter / Smart Grid Update Investments will provide customer operational and reliability benefits (1) The $200M DOE grant was the maximum allowable under the Smart Grid Investment Grant Program. Note: ComEd program may be reevaluated given recent ICC rate order. ComEd will invest ~$1.3B over the next 10 years • Installation of nearly 4M smart electric meters to begin Q4 2012 • Smart Grid program to include distribution automation device installations and substation modernization upgrades • ComEd Innovation Corridor will provide a “Test Bed” for smart grid technologies to be demonstrated within a utility scale environment • Investment recovered through formula rate beginning with May 2012 filing BGE will invest up to $500M through 2015 • Installation of more than 1.8M smart electric meters began Q1 2012 • Plans to file request with PAPUC to accelerate deployment completion by 2014 • Awarded $200M under the DOE program (1) , lowering net cost to customers to ~$450M • Investment recovered through surcharge mechanism with 10% ROE • Installation of 2M smart electric and gas meters began in April 2012 • A customer web portal and dynamic pricing (Peak Time Rebates) as the default tariff • Awarded $200M under the DOE program (1) , lowering net cost to customers to ~$300M • Cost recovery on project pending until cost-effectiveness showing at the end of deployment PECO will invest up to $650M through 2014 79 2012 Analyst Meeting – Performance that Drives Progress |
80 Rate Base and ROE Targets 2012E Long-Term Target Equity Ratio ~48% ~53% (3) Earned ROE 5 - 6% 2012E Long-Term Target Equity Ratio ~45% ~53% (1) Earned ROE 6 - 7% Smart meter and smart grid investment will be a key driver of rate base growth Based on 30-yr. US Treasury (2) ($ in billions) 2014E $5.5 $3.6 $0.7 $1.2 2013E $5.2 $3.4 $0.7 $1.1 2012E $5.1 $3.3 $0.7 $1.1 2011A $4.9 $3.2 $0.7 $1.1 Electric Distribution Electric Transmission Gas Delivery 2012E Long-Term Target Equity Ratio ~56% ~53% Earned ROE 11 - 12% 2014E $9.7 $7.1 $2.5 2013E $8.7 $6.5 $2.2 2012E $8.2 $6.1 $2.1 2011A $8.0 $6.1 $2.0 Distribution Transmission 2014E $5.0 $3.1 $0.9 $1.0 2013E $4.6 $2.9 $0.7 $0.9 2012E $4.4 $2.8 $0.6 $0.9 2011A $4.0 $2.6 $0.5 $0.9 Electric Distribution Electric Transmission Gas Delivery 10% 10% (1) Equity component for distribution rates will be the actual capital structure adjusted for goodwill. (2) Earned ROE will reflect the weighted average of 11.5% allowed transmission ROE and distribution ROE resulting from 30-year Treasury plus 580 basis points for each calendar year. (3) Per MDPSC merger commitment, BGE is precluded from paying dividends through 2014. Per MDPSC orders, BGE cannot pay out a dividend to its parent company if said dividend would cause BGE’s equity ratio to fall below 48%. Note: ComEd distribution rate base represents an average and transmission rate base represents end of year; PECO rate base represents end-of-year; and BGE rate base represents a trailing 13-month average. Numbers may not add due to rounding. 2012 Analyst Meeting – Performance that Drives Progress |
81 Exelon Utilities Exelon Utilities will provide opportunities to leverage scale and expertise to achieve improved operational and financial results • Operational Excellence – Achieve top decile safety and top quartile reliability performance – Enhance customer satisfaction experience – Drive continuous cost management and productivity focus • Regulatory and Legislative Stewardship – Support competitive supply procurements – Invest in smart meter/smart grid infrastructure – Secure constructive rate recovery • Financial Discipline – Maintain strong investment grade credit ratings – Obtain appropriate allowed ROEs – Target long-term earned ROEs close to allowed 2012 Analyst Meeting – Performance that Drives Progress |
82 Appendix 2012 Analyst Meeting – Performance that Drives Progress |
83 Capital Expenditures ($ in billions) 2014E $575 $275 $175 $50 $75 2013E $500 $250 $125 $50 $75 2012E $425 $225 $75 $50 $75 2011A $475 $275 $75 $50 $75 Electric Distribution Smart Meter/Smart Grid (1) Electric Transmission Gas Delivery 2014E $1,650 $1,100 $200 $350 2013E $1,650 $1,025 $175 $450 2012E $1,325 $950 $100 $275 2011A $1,025 $750 $25 $250 Electric Distribution Smart Meter/Smart Grid Electric Transmission 2014E $725 $325 $100 $150 $150 2013E $725 $375 $100 $125 $125 2012E (2) $650 $350 $75 $75 $150 2011A $600 $325 $125 $150 Electric Distribution Smart Meter/Smart Grid (1) Electric Transmission Gas Delivery (1) Smart Meter/Smart Grid CapEx net of proceeds from U.S. Department of Energy (DOE) grant. For BGE, includes CapEx from Smart Energy Savers program of ~$10M per year. (2) Represents 2012 full year CapEx; estimated 2012 CapEx from merger close date totals $550M. 2012 Analyst Meeting – Performance that Drives Progress |
ComEd Load Trends 4Q12 3Q12 2Q12 1Q12 4Q11 3Q11 2Q11 1Q11 Gross Metro Product Residential Large C&I All Customer Classes Note: C&I = Commercial & Industrial Chicago U.S. Unemployment rate (1) 8.6% 8.1% 2012 annualized growth in gross domestic/metro product (2) 1.6% 2.1% (1) Source: US Dept. of Labor (April 2012) and Illinois Department of Security (April 2012) (2) Source: Global Insight (February 2012) (3) Not adjusted for leap year 2011 1Q12 2012E (3) Average Customer Growth 0.4% 0.3% 0.4% Average Use-Per-Customer (1.7)% (0.9)% (1.3)% Total Residential (1.3)% (0.6)% (0.9)% Small C&I (0.8)% 1.1% (0.1)% Large C&I 0.6% 0.9% (0.3)% All Customer Classes (0.5)% 0.5% (0.3)% Weather-Normalized Electric Load Year-over-Year Key Economic Indicators Weather-Normalized Electric Load 84 2012 Analyst Meeting – Performance that Drives Progress |
85 ComEd Distribution Formula Rate Plan 2011 Formula Rate Filing (Docket # 11-0721 filed 11/8/11; rates eff. June 2012): • Based on 2010 calendar year costs and 2011 net plant additions • Supported $59M distribution revenue requirement reduction • 10.05% ROE (2010 Treasury yield of 4.25% + 580 basis point risk premium) ICC Final Order (issued 5/30/12): • $168 revenue requirement reduction; incremental reduction includes: ~$50M related to costs ICC determined should be recovered through alternative rate recovery tariffs or reflected in reconciliation proceeding; primarily delays timing of cash flows ~$35M reflects disallowance of return on pension asset ~$10M reflects incentive compensation related adjustments ~$15M reflects various adjustments for cash working capital, operating reserves and other technical items 2012 Formula Rate Filing (Docket # 12-0321 filed 4/30/12) • 2012 plan year based on 2011 actual costs and 2012 net plant additions 9.71% ROE (2011 Treasury yield of 3.91% + 580 basis point risk premium) • Reconciled 2011 revenue requirements in effect to 2011 actual costs incurred 9.81% ROE (3.91% plus 590 basis point risk premium) (1) • Supported $106M distribution revenue requirement increase relative to Dec. 2012 rates as ComEd initially proposed (Revenue requirement and relative increase will be updated to reflect 11-0721 rate order) • ICC order by year end; rates effective January 2013 Financial Statement Impacts of Formula Rate Process Summary of Filings Income Statement: • Revenues are based on forecasted calendar year revenue requirement and are accrued and recorded monthly Cash Flow: • Rate adjustments become effective two years after costs are incurred (one year for net plant additions and depreciation expense) Rate adjustment intended to reconcile revenue requirement and actual costs incurred Adjustment for 2011 costs incurred (April 30, 2012 filing) will take effect January 2013 Adjustment for 2012 costs incurred (Spring 2013 filing) will take effect January 2014 Balance Sheet: • A regulatory asset is recorded (with interest) to reflect the difference between revenue recognized and revenue billed (1) 590 basis point premium applies only to 2011 revenue reconciliation. All subsequent revenue reconciliations will assume a 580 basis point premium. 2012 Analyst Meeting – Performance that Drives Progress 2010 2011 2012 J F M A M J J A S O N D J F M A M J J A S O N D J F M A M J J A S O N D Costs used for filing Plant additions used for filing Formula rate filing Rates in effect 2011 2012 2013 J F M A M J J A S O N D J F M A M J J A S O N D J F M A J J A S O N D Costs used for filing Plant additions used for filing Formula rate filing Rates in effect |
Illinois Power Agency (IPA) RFP Procurement 86 Note: Chart is for illustrative purposes only. ATC = around-the-clock; REC = renewable energy credit; LT Ren = long-term renewable energy; RS = rate stability Financial Swap Agreement with ExGen (ATC baseload energy – notional quantity 3,000 MW) • Results of Rate Stability Standard Product Procurements held February 2012: Effective ATC of $32.57/MWh for 3 winning Standard Product suppliers for the 2013-14 plan-year. Prices increase 2.5% annually beginning 6/1/14 Contracts are for 450MW ATC through 12/31/17 • Results of REC Rate Stability Procurement held February 2012: Procured 2.7M RECs through December 2017 Included solar, wind and other qualified renewables Average price = $1.67/REC • Results of Spring Standard Product Procurement held April 2012: 4 winning Standard Product suppliers for modest volumes within the 2012/13 and 2014/15 plan-years • Results of Spring REC Procurement held May 2012: Procured 1.3M RECs Included wind and other qualified renewables Average price = $0.88/REC Delivery Period Peak Off-Peak June 2011 - May 2012 5,118 4,001 June 2012 - May 2013 1,129 358 June 2013 - May 2014 6,494 6,062 Volume procured in 2011 IPA Procurement (GWh) Delivery Period Peak Off-Peak June 2012 - May 2013 235 176 June 2013 - May 2014 0 0 June 2014 - May 2015 308 60 Volume procured in Spring 2012 IPA Procurement (GWh) Term Fixed Price ($/MWh) 1/1/12-12/31/12 $52.37 1/1/13-5/31/13 $53.48 2012 Analyst Meeting – Performance that Drives Progress |
87 PECO Load Trends Note: C&I = Commercial & Industrial 4Q12 3Q12 2Q12 1Q12 4Q11 3Q11 2Q11 1Q11 Gross Metro Product Residential Large C&I All Customer Classes Philadelphia U.S. Unemployment rate (1) 8.1% 8.1% 2012 annualized growth in gross domestic/metro product (2) 1.6% 2.1% (1) Source: US Dept. of Labor data (April 2012) – US US Dept. of Labor prelim. data (March 2012) – Philadelphia (2) Source: Global Insight (February 2012) (3) Not adjusted for leap year 2011 1Q12 2012E (3) Average Customer Growth 0.3% 0.5% 0.6% Average Use-Per-Customer 1.3% (2.9)% (2.5)% Total Residential 1.7% (2.5)% (1.9)% Small C&I (0.7)% (4.9)% (2.7)% Large C&I (3.3)% (1.8)% (5.6)% All Customer Classes (0.9)% (2.7)% (3.3)% Weather-Normalized Electric Load Year-over-Year Key Economic Indicators Weather-Normalized Electric Load Oil refinery closing estimated direct impact to reduce Large C&I and total load in 2012 by 4.9% and 2.0%, respectively 2012 Analyst Meeting – Performance that Drives Progress |
PECO – Default Service Plan Filing (DSP II) (1) FR = Full Requirements; (2) FPFR = Fixed-Price Full Requirements Retention as of: May 22, 2012 Proposed Procurement Mix Class DSP I (1/1/11 – 5/31/13) DSP II (6/1/13 – 5/31/15) Large C&I Current load retained: 4% • 100% spot-priced FR (1) products • 2011 opt-in FPFR (2) product • 100% of supply procured directly from the PJM spot market Medium Commercial Current load retained: 18% • 85% 1-year FPFR products, 15% spot-priced FR products • 100% 6-month FPFR products Small Commercial Current load retained: 44% • 70% 1-year FPFR products, 20% 2-year FPFR products, 10% spot-priced FR products • 100% 1-year FPFR products Residential Current load retained: 73% • 45% 2-year FPFR products; 30% 1-year FPFR products; targeted 20% block products of 1-yr, 2-yr, 5-yr and seasonal terms; targeted 5% spot market purchases • As block products expire, block and spot is replaced by FPFR products with terms ending 5/31/15 (end of DSP II period) • Remainder of portfolio is a mix of 2-yr and 1-yr FPFR products, with delivery periods overlapping on a semi- annual basis • On 1/13/12, PECO filed a new Default Service Plan with the PAPUC, which outlines how PECO will purchase electricity for customers not purchasing from a competitive generation supplier from 6/1/13 through 5/31/15 • A PAPUC order on the filing is expected in mid-October 2012 • Offers a 6-month opt-in auction program with price at least 5% less than PECO’s expected Price to Compare (PTC) as of 6/1/13 • Establishes a residential customer referral program for 1-year, fixed price at least 7% below PECO PTC • Provides customer information and referral programs for various products; “seamless” moves between properties 88 2012 Analyst Meeting – Performance that Drives Progress Incorporates Retail Market Enhancements suggested by PAPUC Order issued 12/15/11: |
BGE Load Trends 4Q12 3Q12 2Q12 1Q12 4Q11 3Q11 2Q11 1Q11 Gross Metro Product Residential Large C&I All Customer Classes Note: C&I = Commercial & Industrial Baltimore U.S. Unemployment rate (1) 7.1% 8.1% 2012 annualized growth in gross domestic/metro product (2) 1.6% 2.1% 2011 1Q12 2012E (3) Average Customer Growth 0.2% 0.0% 0.4% Average Use-Per-Customer (4.4)% 0.4% 0.0% Total Residential (4.3)% 0.4% 0.3% Small C&I 0.8% (8.3)% (0.7)% Large C&I 2.0% (0.5)% 0.9% All Customer Classes (1.1)% 0.3% 0.7% Weather-Normalized Electric Load Year-over-Year Key Economic Indicators Weather-Normalized Electric Load 89 2012 Analyst Meeting – Performance that Drives Progress Note: As approved by the MDPSC, BGE records a monthly adjustment to residential and the majority of its commercial and industrial customers to eliminate the effect of abnormal weather and usage patterns per customer on distribution volumes, thereby recovering a specified dollar amount of distribution revenues per customer, by customer class, regardless of changes in consumption levels. Therefore, while these revenues are affected by customer growth, they will not be affected by actual weather or usage conditions. (1) Source: US Dept. of Labor data (April 2012) – US US Dept. of Labor prelim. data (March 2012) – Baltimore (2) Source: Global Insight (February 2012) – US Moody’s Analytics (February 2012) – Baltimore (3) Not adjusted for leap year |
90 BGE – Standard Offer Service • BGE provides Standard Offer Service (SOS) as fixed seasonal rates for those electric customers who are not shopping. The costs of providing this service are recovered from customers via an Administrative Charge included in the SOS rate. The Administrative Charge and the Energy & Transmission components of the SOS Rate are subject to periodic true-ups. BGE procures the majority of energy for this product via Full Requirements load auctions as ordered by the MDPSC. See table below: (1) FPFR = Fixed-Price Full Requirements Retention as of: February 2012 Procurement Mix Class 6/1/11 – 5/31/12 6/1/12 – 5/31/13 Large C&I (Hourly) Current load retained: 5% • 100% of supply procured directly from the PJM spot market • 100% of supply procured directly from the PJM spot market Medium Commercial (Type II) Current load retained: 28% • 100% 3-month FPFR (1) products • Auction Apr ’11 for Jun ’11 – Aug ’11 • Auction Jun ’11 for Sep ’11 – Nov ’11 • Auction Oct ’11 for Dec ’11 – Feb ’12 • Auction Jan ’12 for Mar ’12 – May ’12 • 100% 3-month FPFR products • Auction Apr ’12 for Jun ’12 – Aug ’12 • Auction Jun ’12 for Sep ’12 – Nov ’12 • Auction Oct ’12 for Dec ’12 – Feb ’13 • Auction Jan ’13 for Mar ’13 – May ’13 Small Commercial (Type I) Current load retained: 63% • 25% 2-year FPFR products • Auction Apr ’09 for Oct ’09 – Sep ’11 • Auction Oct ’09 for Jun ’10 – May ’12 • Auction Apr ’10 for Oct ’10 – Sep ’12 • Auction Oct ’10 for Jun ’11 – May ’13 • Auction Apr ’11 for Oct ’11 – Sep ’13 • 25% 2-year FPFR products • Auction Apr ’10 for Oct ’10 – Sep ’12 • Auction Oct ’10 for Jun ’11 – May ’13 • Auction Apr ’11 for Oct ’11 – Sep ’13 • Auction Oct ’11 for Jun ’12 – May ’14 • Auction Apr ’12 for Oct ’12 – Sep ’14 Residential Current load retained: 75% • 25% 2-year FPFR products • Auction Apr ’09 for Oct ’09 – Sep ’11 • Auction Oct ’09 for Jun ’10 – May ’12 • Auction Apr ’10 for Oct ’10 – Sep ’12 • Auction Oct ’10 for Jun ’11 – May ’13 • Auction Apr ’11 for Oct ’11 – Sep ’13 • 25% 2-year FPFR products • Auction Apr ’10 for Oct ’10 – Sep ’12 • Auction Oct ’10 for Jun ’11 – May ’13 • Auction Apr ’11 for Oct ’11 – Sep ’13 • Auction Oct ’11 for Jun ’12 – May ’14 • Auction Apr ’12 for Oct ’12 – Sep ’14 2012 Analyst Meeting – Performance that Drives Progress |
91 Regulatory Schedule Q1 Q2 Q3 Q4 Proposed order for initial filing (5/1); Final order (issued 5/30); rates effective June thru Dec. Procurements for ATC supply and RECs for 6/1/13-12/31/17 (Feb.) ComEd Distribution Formula Rate Illinois Power Agency Procurement ComEd Transmission Rate Update Annual update filing with FERC (5/15); rates effective June 2012 thru May 2013 First annual update and reconciliation filing (4/30) Rates effective Jan. thru Dec. Regular annual procurement event (April) Final order (by 12/27) 2013 BGE Distribution Rates PECO Supply Procurement BGE Transmission Rate Update Annual update filing with FERC (4/24); rates effective June 2012 thru May 2013 File case with MDPSC (2 half of 2012) Procure DSP I residential block supply (April) BGE Supply Procurement Regular procurement event (April & June) Regular procurement event (October) Procure DSP I residential block supply (September) Final DSP II order (mid-October) DSIC filing (tentative) PECO DSIC Filing MDPSC order due 210 days after filing 2012 2012 Analyst Meeting – Performance that Drives Progress nd |
92 Energy Efficiency Progress Note: EE = energy efficiency; DR = demand response 2012 Analyst Meeting – Performance that Drives Progress ComEd – Illinois PECO – Pennsylvania BGE – Maryland •Annual savings requirement 0.8% of energy deliveries for year ended 5/31/12; increases annually to 2.0% beginning 6/1/15 and each year thereafter, subject to spending cap of ~2% of revenues •EIMA created process that would allow spending above cap for incremental cost-effective EE approved by the IPA and ICC •Achieved annual savings goal in each of the first three years and is projected to achieve goal in year four •Recovery of EE/DR program costs approved by ICC •Electric consumption required to be reduced by 1% and 3% by 5/31/11 and 5/31/13, respectively (vs. 6/09–5/10 baseline) •Exceeded 1% energy use reduction target and is projected to achieve 3% goal in Q4 2012 •Since program inception, more than 1 million MWh energy reduced and less than 50% of budget target spent •Recovery of EE/DR program costs approved by PAPUC •EmPOWER MD statute 15% by 2015 (vs. 2007 baseline); most ambitious targets of any state •Making good progress to achieving demand reduction and toward energy targets, with further potential from smart grid and recent program filings •Revenue decoupling mechanism implemented to mitigate impact of declines in customer consumption •Recovery of EE/DR program costs approved by MDPSC |
Generation Overview Chip Pardee SVP and Chief Operating Officer of Exelon Generation |
94 Exelon Generation Fleet Generation fleet uniquely diversified across regions and technologies National Scope • Power generation assets in 20 states and Canada Large and Diverse • 35 GW of diverse generation (1) – 19 GW of Nuclear – 10 GW of Gas – 2 GW of Hydro – 2 GW of Oil – 1 GW of Coal – 1 GW of Wind/Solar/Other Clean • One of nation’s cleanest fleets as measured by CO2, SO2 and NOx intensity (1) Total owned generation capacity as of 4/30/2012 for legacy Exelon and legacy Constellation combined, net of physical market mitigation assumed to be 2,648 MW. Nuclear capacity reflects EXC ownership of CENG and Salem. Coal capacity shown does not include Eddystone 2 (309 MW) retired on 6/1/2012. 2012 Analyst Meeting – Performance that Drives Progress |
95 Operational Excellence Continue tradition of operational excellence and continuous improvement Operator 5-Year Average 5-Year Range 12 14 16 18 20 22 24 2007 2008 2009 2010 2011 Industry (Excluding Exelon) Exelon Exelon 5 3 9 9 6 98 2008 96 95 2007 100 95 10 5 0 2011 95 2010 97 2009 Hydro Equivalent Availability (closer to 100% is better) 0 10 20 30 40 50 2002 2011 2010 2009 2008 2007 2006 2005 2004 2003 Industry (w/o Exelon) Exelon Nuclear 2-Yr Production Cost ($/MWh) (3) Fossil and Hydro Fleet Availability (2) Range of Nuclear Fleet 2-Yr Avg Capacity Factor (2007-2011) (1) Industry Leading Refueling Outage Duration (4) (1) Source: Platts Nuclear News, Nuclear Energy Institute and Energy Information Administration (Department of Energy). Exelon metrics exclude CENG & Salem. (2) Excludes legacy Constellation asset performance. (3) Source: 2011 Electric Utility Cost Group (EUCG) survey. Includes Fuel Cost plus Direct O&M divided by net generation. Exelon metrics exclude CENG & Salem. (4) Exelon data excludes Salem & CENG. Exelon’s 2009 average includes 23 days of TMI outage that extended into 2010 for a steam generator replacement. 2012 Analyst Meeting – Performance that Drives Progress Fossil Fleet Equivalent Forced Outage Rate - Demand (closer to 0% is better) |
96 NRC Fukushima Related Orders Working collaboratively with NRC and U.S. Nuclear Industry to invest in long term enhancements resulting from lessons learned Tier 1 Staff Requirements • Mitigating Strategies: – Additional portable equipment purchased to enhance mitigation capability for beyond-design- basis events – Integrated Plan to be submitted to NRC by February 2013 – All actions will be implemented across the Exelon fleet by the end of 2016 • Hardened Vents for Mark I and Mark II Containments: – Conceptual design for Mark II containments is in progress and conceptual design for Mark I containments to begin in August 2012 – Integrated Plan to be submitted to NRC by February 2013 – All actions will be implemented across the Exelon fleet by the end of 2016 • Spent Fuel Pool (SFP) Instrumentation: – Conceptual design for upgraded SFP instrumentation is in progress – Integrated Plan to be submitted to NRC by February 2013 – All actions will be implemented across the Exelon fleet by the end of 2016 Exelon expects the costs to comply with NRC requirements to be manageable 2012 Analyst Meeting – Performance that Drives Progress |
97 Well Positioned for Clean Air Rules A clean and diverse portfolio that is well positioned for environmental upside from EPA regulations (1) Total owned generation capacity as of 4/30/2012 for legacy Exelon and legacy Constellation combined, net of physical market mitigation assumed to be 2,648 MW. (2) Nuclear capacity shown above reflects EXC ownership of CENG and Salem. (3) Coal capacity shown above does not include Eddystone 2 (309 MW) retired on 6/1/2012. • Largest clean merchant generation portfolio in the nation • Less than 5% of combined generation capacity will require capital expenditures to comply with Air Toxic rules • Low-cost generation capacity provides unparalleled leverage to rising commodity prices Total Generation Capacity (1) : ~ 34,660 MW 6% Hydro Wind/Solar/Other Gas 28% Oil 4% Coal (3) 4% Nuclear (2) 55% 2012 Analyst Meeting – Performance that Drives Progress 3% Combined Company Portfolio Approx. $200 million of CapEx, majority of which is at Conemaugh (Exelon ownership share ~31%) – |
98 Executing on Growth Projects Exelon adding material amount of new generation over planning horizon with safe returns • Constructing 404 MWs of wind projects in 2012 • May develop or acquire 500 MWs to 1,000 MWs over the next five years • Future wind development to be backed by PPA and tax benefits • Antelope Valley Solar Ranch One Project adding 80 MW by year end 2012 and 150 MW in 2013 – investment recovered by 2015 • Adding 21 MWs through non-utility scale projects in 2012 (1) • Value driven uprate program has added 247 MWs through the end of 2011 • Adding 85 MWs in 2012 and 850 MWs over the next six years (1) Includes projects signed as of 4/30/12. 2012 Analyst Meeting – Performance that Drives Progress |
99 Appendix 2012 Analyst Meeting – Performance that Drives Progress |
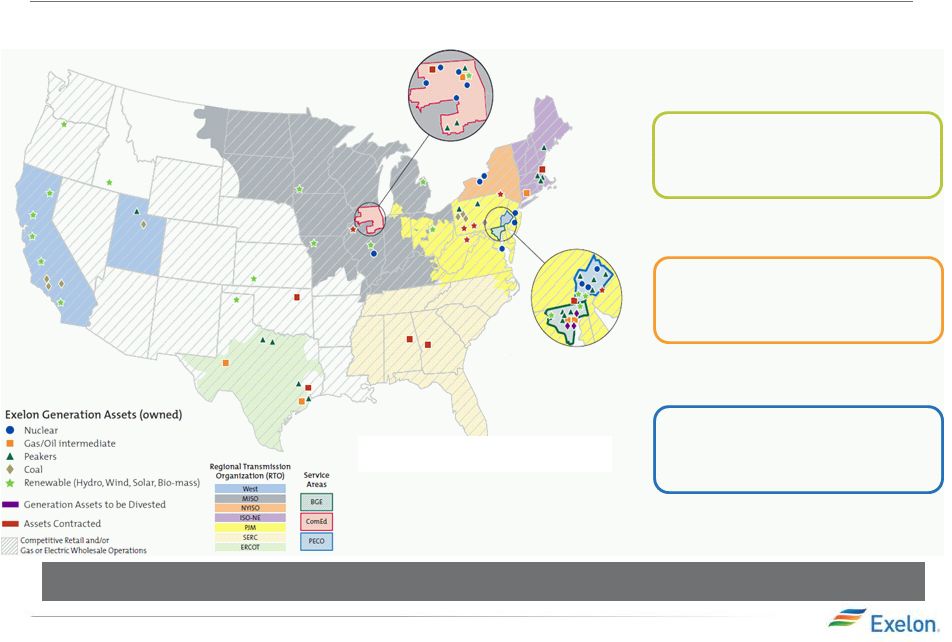
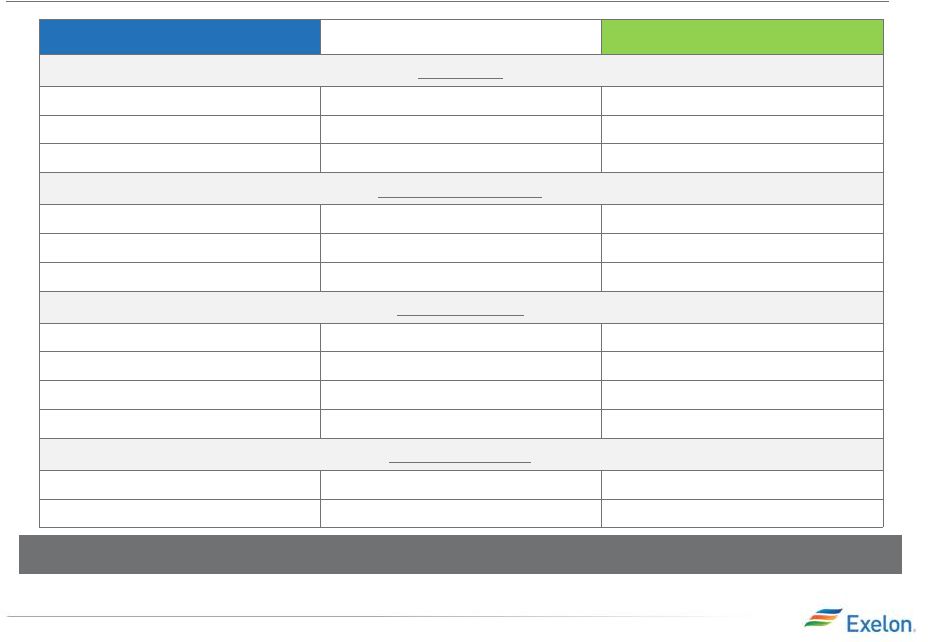
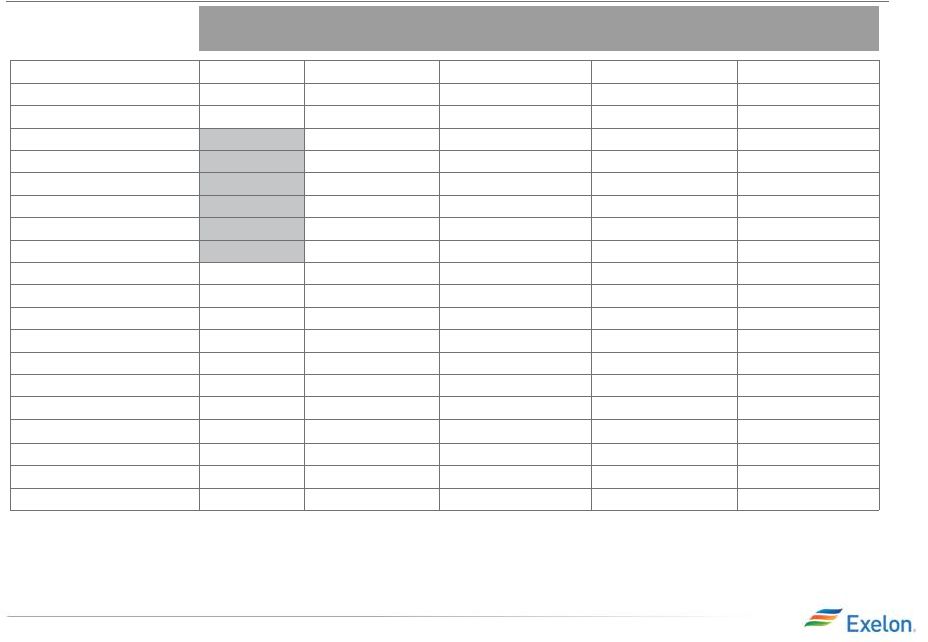
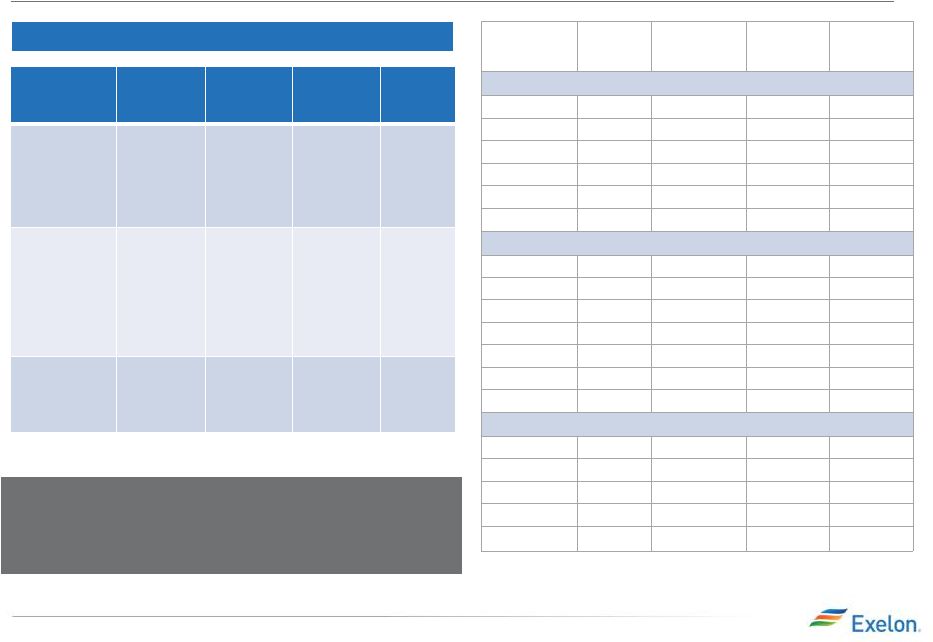
100 Exelon Generation Fleet Overview (1) Plant Location Owned Capacity (MW) LDA Hub/Zone Region for Disclosure Mapping Nuclear Braidwood Braidwood, IL 2,348 Rest of RTO NiHub Midwest Byron Byron, IL 2,323 Rest of RTO NiHub Midwest Calvert Cliffs I and II Calvert Co, MD 853 SWMAAC BGE Mid-Atlantic Clinton Clinton, IL 1,067 n/a Indiana Hub Midwest Dresden Morris, IL 1,753 Rest of RTO NiHub Midwest LaSalle Seneca, IL 2,316 Rest of RTO NiHub Midwest Limerick Limerick Twp.,PA 2,312 EMAAC PECO Zone Mid-Atlantic Nine Mile Point I and II Scriba, NY 782 NYPP Zone C New York Oyster Creek Forked River, NJ 625 EMAAC PECO Zone Mid-Atlantic Peach Bottom Peach Bottom Twp., PA 1,150 EMAAC PECO Zone Mid-Atlantic Quad Cities Cordova, IL 1,380 Rest of RTO NiHub Midwest R.E. Ginna Ontario, NY 291 NYPP Zone B New York Salem Hancock's Bridge, NJ 1,004 EMAAC PECO Zone Mid-Atlantic Three Mile Island Londonderry Twp, PA 837 MAAC Whub/MetEd Zone Mid-Atlantic Coal (2) ACE Trona, CA 32 n/a Other Conemaugh New Florence, PA 533 MAAC Whub/Penelec Zone Mid-Atlantic Jasmin Kern Co, CA 18 n/a Other Keystone Shelocta, PA 716 MAAC Whub/Penelec Zone Mid-Atlantic POSO Kern Co, CA 18 n/a Other Gas Colorado Bend Wharton, TX 550 Houston ERCOT Eddystone 3, 4 Eddystone, PA 760 EMAAC PECO Zone Mid-Atlantic Fore River North Weymouth, MA 688 ROP-NE Hub New England Gould Street Baltimore City, MD 97 SWMAAC BGE Mid-Atlantic Grande Prairie Alberta, Canada 93 n/a Other Handley 3, 4, 5 Fort Worth, TX 1,265 ERCOT N ERCOT Handsome Lake Rockland Twp, PA 268 MAAC Whub/Penelec Zone Mid-Atlantic Hillabee Energy Alexander City, Alabama 740 GTC Other LaPorte Laporte, TX 152 ERCOT ERCOT Medway West Medway, MA 105 ISO-NE Mass Hub New England Mountain Creek 6, 7, 8 Dallas, TX 805 ERCOT N ERCOT Mystic 7 Charlestown, MA 560 ROP-NE Hub New England Mystic 8,9 Charlestown, MA 1,398 NEMA Hub New England Notch Cliff Baltimore Co, MD 101 SWMAAC BGE Mid-Atlantic Perryman -Gas Harford Co, MD 147 SWMAAC BGE Mid-Atlantic Quail Run Energy Odessa, TX 550 West ERCOT Riverside -Gas Baltimore Co, MD 189 SWMAAC BGE Mid-Atlantic Southeast Chicago Chicago, IL 296 Rest of RTO NiHub Midwest West Valley Salt Lake City, UT 200 n/a Other Westport Baltimore Co, MD 116 SWMAAC BGE Mid-Atlantic Wolf Hollow 1, 2, 3 Granbury, TX 705 ERCOT N ERCOT Plant Location Owned Capacity (MW) LDA Hub/Zone Region for Disclosure Mapping Oil Chester Chester, PA 39 EMAAC PECO Zone Mid-Atlantic Conemaugh New Florence, PA 2 MAAC Whub/Penelec Zone Mid-Atlantic Croydon Bristol Twp., PA 391 EMAAC PECO Zone Mid-Atlantic Delaware Philadelphia, PA 56 EMAAC PECO Zone Mid-Atlantic Eddystone Eddystone, PA 60 EMAAC PECO Zone Mid-Atlantic Falls Falls Twp., PA 51 EMAAC PECO Zone Mid-Atlantic Framingham Framingham, MA 28 ISO-NE Mass Hub New England Keystone Shelocta, PA 2 MAAC Whub/Penelec Zone Mid-Atlantic Moser LowerPottsgrove Twp., PA 51 EMAAC PECO Zone Mid-Atlantic Mystic Jet Charlestown, MA 9 ROP-NE Hub New England New Boston South Boston, MA 12 ISO-NE Mass Hub New England Perryman - Oil Harford Co, MD 200 SWMAAC BGE Mid-Atlantic Philadelphia Road Baltimore Co, MD 61 SWMAAC BGE Mid-Atlantic Richmond Philadelphia, PA 98 EMAAC PECO Zone Mid-Atlantic Riverside - Oil Baltimore Co, MD 39 SWMAAC BGE Mid-Atlantic Salem Hancock's Bridge, NJ 16 EMAAC PECO Zone Mid-Atlantic Schuylkill Philadelphia, PA 199 EMAAC PECO Zone Mid-Atlantic Southwark Philadelphia, PA 52 EMAAC PECO Zone Mid-Atlantic Wyman Yarmouth, ME 36 ISO-NE Maine Zone New England Hydro Conowingo Harford Co., MD 572 EMAAC PECO Zone Mid-Atlantic Malacha Muck Valley, CA 16 n/a Other Muddy Run Lancaster, PA 1,070 EMAAC PECO Zone Mid-Atlantic Safe Harbor Safe Harbor, PA 278 MAAC Whub Mid-Atlantic Wind AgriWind Bureau Co., IL 8 IL Hub/Indiana Hub Midwest Blue Breezes Faribault Co., MN 3 MinnHub Midwest Bluegrass Ridge Gentry Co., MO 56 SERC Other Brewster Jackson Co., MN 6 MinnHub Midwest Cassia Twin Falls Co., ID 29 WECC/Mid-C Other Cisco Jackson Co., MN 8 MinnHub Midwest Conception Nodaway Co.,MO 50 SERC Other Cow Branch Atchinson Co.,MO 50 SERC Other Cowell Pipestone Co., MN 2 MinnHub Midwest CP Windfarm Faribault Co., MN 4 MinnHub Midwest Criterion Oakland, MD 70 Whub Mid-Atlantic Echo 1 Umatilla Co., OR 34 WECC/Mid-C Other Echo 2,3 Morrow Co., OR 30 WECC/Mid-C Other Ewington Jackson Co., MN 20 MinnHub Midwest Exelon Wind 1-11 Various Counties, TX 180 SPP Other Greensburg Kiowa Co., KS 13 SPP Other Harvest Huron Co., MI 53 MichHub Midwest (1) Total owned generation capacity as of 4/30/2012 for legacy Exelon and legacy Constellation combined, net of physical market mitigation assumed to be 2,648 MW. (2) Coal capacity shown does not include Eddystone 2 (309 MW) retired on 6/1/2012. 2012 Analyst Meeting – Performance that Drives Progress |
101 Exelon Generation Fleet Overview (cont’d) (1) Plant Location Owned Capacity (MW) LDA Hub/Zone Region for Disclosure Mapping Wind (cont’d) High Plains Moore Co., TX 10 SPP Other Loess Hills Atchinson Co., MO 5 SERC Other Marshall Lyon Co., MN 19 MinnHub Midwest Michigan Wind 1 and 2 Bingham Twp., MI 159 MichHub Midwest Mountain Home Elmore Co., ID 40 WECC/Mid-C Other Norgaard Lincoln Co., MN 9 MinnHub Midwest Threemile Canyon Morrow Co., OR 10 WECC/Mid-C Other Tuana Springs Twin Falls Co., ID 17 WECC Other Wolf Nobles Co., MN 6 n/a Midwest Solar City Solar Chicago, IL 10 Rest of RTO NiHub Midwest Constellation Solar Various 84 n/a Other SEGS IV-VI Kramer Junction, CA 8 n/a Other Biomass Chinese Station Jamestown, CA 10 n/a Other Fresno Fresno, CA 12 n/a Other Rocklin Placer Co, CA 12 n/a Other Landfill Gas Fairless Hills Falls Twp, PA 60 EMAAC PECO Zone Mid-Atlantic Pennsbury Falls Twp., PA 6 EMAAC PECO Zone Mid-Atlantic Waste Coal Colver Colver Township, PA 26 n/a Mid-Atlantic Panther Creek Nesquehoning, PA 40 n/a Mid-Atlantic Sunnyside Sunnyside, UT 26 n/a Other Total, Net of Physical Mitigation (1) 34,662 Physical Market Mitigation Brandon Shores Anne Arundel Co, MD 1,273 SWMAAC BGE Mid-Atlantic H. A. Wagner Anne Arundel Co, MD 976 SWMAAC BGE Mid-Atlantic C. P. Crane Anne Arundel Co, MD 399 SWMAAC BGE Mid-Atlantic (1) Total owned generation capacity as of 4/30/2012 for legacy Exelon and legacy Constellation combined, net of physical market mitigation assumed to be 2,648 MW. 2012 Analyst Meeting – Performance that Drives Progress |
102 Post Fukushima: NRC Requirements and Anticipated Implications Requirement EXC Actions Required Proactive Steps Taken Mitigating strategies for beyond- design-basis events • Develop procedures and plant modifications to implement additional requirements for mitigation of beyond design basis events • Validated existing strategies • Performed preliminary analysis to identify strategy improvements • Purchased additional portable equipment Reliable hardened vents for Mark I and Mark II containment • Install new hardened vents for Mark II containments, upgrade existing Mark I hardened containment vents • Validated existing venting procedures • Began conceptual design for installation of Mark II containment vents Spent Fuel Pool (SFP) instruments • Upgrade existing SFP monitoring capability to meet new requirements • Additional controls established for SFP cooling equipment monitoring and equipment availability Tier 1 Staff Requirements • Significant activity is in progress in preparation for seismic and external flooding walkdowns which are required under additional NRC requests for information and are scheduled to be completed by the end of November 2012 • In March, NRC issued its final Tier 1 requirements based on NRC task force and staff recommendations Exelon’s actions and commitments are aligned with coordination that is taking place across the U.S. nuclear industry 2012 Analyst Meeting – Performance that Drives Progress |
103 Growing Clean Generation with Uprates Station Base Case MW Max Potential MW MW Online to Date Year of Full Operation by Unit MW Recovery & Component Upgrades: Quad Cities 99 99 99 2011 / 2010 Dresden 3 3 2013 / 2012 Peach Bottom 29 30 15 2011 / 2012 Dresden 106 110 62 2011 / 2013 Limerick 6 6 3 2012 / 2013 Peach Bottom 2 2 2014 / 2015 MUR: LaSalle 39 39 39 2010 / 2011 Limerick 30 30 30 2011 / 2011 Braidwood 34 42 2012 / 2012 Byron 34 42 2012 / 2012 Quad Cities 21 23 2014 / 2014 Dresden 28 31 2014 / 2015 TMI 12 15 2014 EPU: Clinton 2 2 2 2010 Peach Bottom 130 137 2015 / 2016 LaSalle 303 336 2018 / 2017 Limerick 306 340 2016 / 2017 Total 1,184 1,287 250 (1) Includes deferral of LaSalle EPU. (2) In 2012 dollars. Overnight costs do not include financing costs or cost escalation. (3) Adjusted for actual MW’s achieved. Estimated IRR Overnight Cost (2) Approval Process Project Duration Megawatt Recovery & Component Upgrades 11-14% $860 M Not required 3-4 Years MUR (Measurement Uncertainty Recapture) 12-16% $340 M Straight forward approval process 2-3 Years EPU (Extended Power Uprate) 9-13% $2,260 M Straight forward approval process 3-6 Years Executing uprate projects across our geographically diverse nuclear fleet – planned to add 85 MW’s in 2012 Nuclear Uprate Program Summary (1) 2012 Analyst Meeting – Performance that Drives Progress (3) (3) (1) |
Phased Execution Lowers Risk (1) Dollars shown are nominal in millions (excludes capitalized interest). (2) Values shown are rounded and at ownership. Data includes deferral of LaSalle EPU. • Highest return projects are being completed in the early years • Leverages Exelon’s substantial experience managing successful uprate projects – 1,100 MW completed prior to 2008 Approximately 134 MWs scheduled to be completed in 2012 and 2013 Total expenditures expected to be $3,825 million from 2008 – 2019 (1) 104 0 50 100 150 200 250 300 350 400 450 500 550 600 650 700 0 200 400 600 800 1,000 1,200 1,400 1,600 2019E 50 2018E 150 2017E 450 2016E 550 2015E 600 2014E 475 2013E 375 2012E 400 2011A 350 2010A 225 2009A 150 2008A 50 MW Online (Cumulative) Megawatt Recovery MUR EPU 2012 Analyst Meeting – Performance that Drives Progress Exelon’s Uprate Plan Expenditures (2) |
Exelon’s Uprate Program Is a Pragmatic Approach to Nuclear Growth Key Considerations Exelon Uprate Program (2) New Merchant Nuclear (3) Overnight cost (1) $2,700 - $2,900 / KW $4,500 - $6,200 / KW Time to market 2 - 6 years At least 9 years O&M cost No additional O&M cost $11 - $15 / MWh Ancillary costs – NDT, maintenance capital, etc Minimal ancillary costs $ 2 - $3 / MWh Asset diversification Operational risk spread amongst several assets Operational risk concentrated to single asset Market diversification Diversify revenue source amongst several power markets / regions Market risk concentrated to one location Market timing risk Lower risk due to phased execution Risk of hitting low commodity cycle Regulatory approval 1 - 2 years review period 3 - year minimum review period Financing Source Leverage balance sheet strength Loan guarantees needed Development flexibility Ability to respond to changing market / financial conditions Much less flexibility to cancel (1) In 2012 dollars. Overnight costs do not include financing costs or cost escalation. (2) Includes deferral of LaSalle EPU. (3) Cost estimates are based on Exelon’s internal projections for new merchant nuclear. Exelon’s uprate program is a proven approach to add clean generation to the portfolio, and it provides flexibility to respond to changing economic and market conditions 105 2012 Analyst Meeting – Performance that Drives Progress |
Peach Bottom Uprate Program • MW Recovery • EPU 106 Unit 2 Unit 3 Uprate Project MW Increase (1) Online Date MW Increase (1) Online Date Status MW Recovery - Low Pressure Turbine Retrofit 14 4Q 2012 15 4Q 2011 Unit 3 complete Unit 2 in progress MW Recovery - Adjustable Speed Drives 2 4Q 2014 2 4Q 2015 Scheduled to start in 2012 EPU 65 1Q 2015 65 1Q 2016 Design phase in progress (1) Capital investment and MW uprate numbers represent Exelon’s 50% ownership stake in Peach Bottom Station. $’s used in chart are nominal (excludes capitalized interest). Peach Bottom Uprate Projects are underway – 15 additional MWs came online in 2011 and the remaining will come online between 2012 and 2016 2012 Analyst Meeting – Performance that Drives Progress – Low Pressure Turbine Retrofit in progress with installation complete for Unit 3 and completion for Unit 2 planned in 2012 – Replacement of Reactor Recirculation Pump Motor Generator sets with energy efficient Adjustable Speed Drives in 2014 and 2015 – Funding approved for design work – Full project authorization currently in progress |
107 LaSalle Uprate Program • MUR • EPU Unit 1 Unit 2 Uprate Project MW Increase Online Date MW Increase Online Date Status MUR 19 2010 20 2011 Complete EPU 151 3Q 2018 151 3Q 2017 Design phase in progress, Project completion moved from 2015 / 2016 to 2017 / 2018 (1) $’s used in chart are nominal (excludes capitalized interest). LaSalle Uprate Projects are underway – 39 additional MWs came online through 2011 and the remaining will come online between 2017 and 2018 2012 Analyst Meeting – Performance that Drives Progress – Funding approved for design work – Project completion has been moved from 2015/2016 to 2017/2018 – Completed in 2010 and 2011 |
108 Limerick Uprate Program • MW Recovery • MUR • EPU Unit 1 Unit 2 Uprate Project MW Increase Online Date MW Increase Online Date Status MUR 15 2010 15 2011 Complete MW Recovery - Adjustable Speed Drives 3 1Q 2012 3 2Q 2013 Unit 1 complete Unit 2 in progress EPU 153 3Q 2016 153 3Q 2017 Initial studies in progress (1) $’s used in chart are nominal (excludes capitalized interest). Limerick Uprate Projects are underway – 33 additional MWs came online through 2012 and the remaining will come online between 2013 and 2017 – Replacement of Reactor Recirculation Pump Motor Generator sets with energy efficient Adjustable Speed Drives completed for Unit 1 in 2012 and planned for Unit 2 in 2013 – Completed in 2011 – Funding approved for initial studies – Will review in 3Q 2012 before authorizing start of design work 2012 Analyst Meeting – Performance that Drives Progress |
Exelon Nuclear Fleet Overview (including CENG and Salem) Plant Location Type/ Containment Water Body License Extension Status / License Expiration Ownership Spent Fuel Storage/ Date to lose full core discharge capacity (2) Braidwood, IL (Units 1 and 2) PWR Concrete/Steel Lined Kankakee River Expect to file application in 2013 / 2026, 2027 100% Dry Cask Byron, IL (Units 1 and 2) PWR Concrete/Steel Lined Rock River Expect to file application in 2013 / 2024, 2026 100% Dry Cask Clinton, IL (Unit 1) BWR Concrete/Steel Lined / Mark III Clinton Lake 2026 100% 2018 Dresden, IL (Units 2 and 3) BWR Steel Vessel / Mark I Kankakee River Renewed / 2029, 2031 100% Dry Cask LaSalle, IL (Units 1 and 2) BWR Concrete/Steel Lined / Mark II Illinois River 2022, 2023 100% Dry Cask Quad Cities, IL (Units 1 and 2) BWR Steel Vessel / Mark I Mississippi River Renewed / 2032 75% Exelon, 25% Mid- American Holdings Dry Cask Calvert Cliffs, MD (Units 1and 2) PWR Concrete/Steel Lined Chesapeake Bay Renewed / 2034, 2036 100% CENG (4) Dry Cask R.E. Ginna, NY (Unit 1) PWR Concrete/Steel Lined Lake Ontario Renewed / 2029 100% CENG (4) Dry Cask Limerick, PA (Units 1 and 2) BWR Concrete/Steel Lined / Mark II Schuylkill River Filed application in June 2011 (decision expected in 2013) / 2024, 2029 100% Dry Cask Nine Mile Point, NY (Units 1 and 2) BWR Concrete/Steel Vessel / Mark I / Concrete/Steel Vessel/ Mark II Lake Ontario Renewed / 2029, 2046 100% CENG (4) / 82% CENG (4) , 18% Long Island Power Authority Dry Cask (Summer 2012) Oyster Creek, NJ (Unit 1) BWR Steel Vessel / Mark I Barnegat Bay Renewed / 2029 (3) 100% Dry Cask Peach Bottom, PA (Units 2 and 3) BWR Steel Vessel / Mark I Susquehanna River Renewed / 2033, 2034 50% Exelon, 50% PSEG Dry Cask TMI, PA (Unit 1) PWR Concrete/Steel Lined Susquehanna River Renewed / 2034 100% 2023 Salem, NJ (Units 1 and 2) PWR Concrete/Steel Lined Delaware River Renewed / 2036, 2040 42.6% Exelon, 57.4% PSEG Dry Cask (1) Operating license renewal process takes approximately 4-5 years from commencement until completion of NRC review. (2) The date for loss of full core reserve identifies when the on-site storage pool will no longer have sufficient space to receive a full complement of fuel from the reactor core. Dry cask storage will be in operation at those sites prior to losing full core discharge capacity in their on-site storage pools. (3) On December 8, 2010, Exelon announced that it will permanently cease generation operations at Oyster Creek by December 31, 2019. Oyster Creek’s current NRC license expires in 2029. (4) Exelon Generation has a 50.01% ownership interest in CENG (Constellation Energy Nuclear Group, LLC). Electricite de France SA (EDF) has a 49.99% ownership interest in CENG. 109 2012 Analyst Meeting – Performance that Drives Progress (1) |
Effectively Managing Nuclear Fuel Costs (1) Projected Exelon (100%) Uranium Demand Components of Fuel Expense in 2012 2012 – 2015: 100% hedged in volume 2016: ~80% hedged in volume 2017: ~55% hedged in volume 11 10 9 8 7 6 5 4 3 2 1 0 2017E 2016E 2015E 2014E 2013E 2012 Enrichment 31% Tax/Interest 2% Conversion 3% Uranium 36% Nuclear Waste 14% Fabrication 14% 0 20 40 60 80 100 2017E 2016E 2015E 2014E 2013E 2012 Exelon Average Reload Price Projected Market Price (1) All charts exclude Salem and CENG. (2) At ownership, excluding Salem and CENG. Excludes costs reimbursed under the settlement agreement with the DOE. Data assumes LaSalle’s deferral of EPU. 110 0 200 400 600 800 1,000 1,200 1,400 2017E 1,205 2016E 1,174 2015E 1,110 2014E 1,068 2013E 992 2012 927 Nuclear Fuel Capex Nuclear Fuel Expense (Amortization + Spent Fuel) Projected Exelon Average Uranium Cost vs. Market 2012 Analyst Meeting – Performance that Drives Progress Projected Exelon (100%) Uranium Demand Components of Fuel Expense in 2012 Projected Total Nuclear Fuel Spend (2) |
Q&A |
112 Exelon Value Proposition (1) Dividends are subject to declaration by the Exelon board of directors on a quarterly basis. 2012 Analyst Meeting – Performance that Drives Progress • Right strategy, right platform, right set of assets and right leadership team • Merger will be successful • Right time to own Exelon stock given robust dividend yield and unparalleled upside to market recovery • Confident in ability to achieve 2012 earnings in range of $2.55 - $2.85 per share • Commitment to existing dividend (1) rate of $2.10 per share |
113 Exelon Investor Relations Contacts 2012 Analyst Meeting – Performance that Drives Progress Exelon Investor Relations 10 South Dearborn Street Chicago, Illinois 60603 312-394-2345 312-394-4082 (Fax) For copies of other presentations, annual/quarterly reports, or to be added to our email distribution list please contact: Martha Chavez, Executive Admin Coordinator 312-394-4069 Martha.Chavez@ExelonCorp.com Investor Relations Contacts: JaCee Burnes, Vice President 312-394-2948 jacee.burnes@exeloncorp.com Melissa Sherrod, Director 312-394-8351 melissa.sherrod@exeloncorp.com Ishaan Kapoor, Manager 312-394-3657 ishaan.kapoor@exeloncorp.com Sandeep Menon, Principal Analyst 312-394-7279 sandeep.menon@exeloncorp.com 2012 Analyst Meeting – Performance that Drives Progress |