Exhibit 99.2 |
Cautionary Statements Regarding Forward-Looking Information This presentation contains certain forward-looking statements within the meaning of the Private Securities Litigation Reform Act of 1995, that are subject to risks and uncertainties. The factors that could cause actual results to differ materially from the forward-looking statements made by Exelon Corporation, Commonwealth Edison Company, PECO Energy Company, Baltimore Gas and Electric Company and Exelon Generation Company, LLC (Registrants) include those factors discussed herein, as well as the items discussed in (1) Exelon’s 2011 Annual Report on Form 10-K in (a) ITEM 1A. Risk Factors, (b) ITEM 7. Management’s Discussion and Analysis of Financial Condition and Results of Operations and (c) ITEM 8. Financial Statements and Supplementary Data: Note 18; (2) Constellation Energy Group’s 2011 Annual Report on Form 10-K in (a) ITEM 1A. Risk Factors, (b) ITEM 7. Management’s Discussion and Analysis of Financial Condition and Results of Operations and (c) ITEM 8. Financial Statements and Supplementary Data: Note 12; (3) the Registrant’s First Quarter 2012 Quarterly Report on Form 10-Q in (a) Part II, Other Information, ITEM 1A. Risk Factors and (b) Part I, Financial Information, ITEM 1. Financial Statements: Note 15; and (4) other factors discussed in filings with the SEC by the Registrants. Readers are cautioned not to place undue reliance on these forward-looking statements, which apply only as of the date of this presentation. None of the Registrants undertakes any obligation to publicly release any revision to its forward-looking statements to reflect events or circumstances after the date of this presentation. 1 2012 2Q Earnings Release Slides 2012 2Q Earnings Release Slides |
2012 2Q Earnings Release Slides 2 Second Quarter Performance and Full Year Guidance FY 2012 $2.55 - $2.85 (2) $1.75 - $1.95 $0.30 - $0.40 $0.40 - $0.50 $0.05 - $0.15 HoldCo ExGen ComEd PECO BGE 2012 Earnings Guidance • Another quarter of solid financial and operating performance - Operating earnings in 2Q of $0.61/share - Nuclear capacity factor in 2Q of 93.4% - Load serving business on course to meet volume and margin targets • Expect FY 2012 earnings of $2.55 - $2.85/share - On track to achieve $170 million in merger related synergies for 2012 (1) - On track to meet FY 2012 new business gross margin targets for “Power” and “Non Power” categories 2012 synergy estimate is applicable for March 12 - December 31, 2012. 2012 guidance includes Constellation Energy and BGE earnings for March 12 - December 31, 2012. Based on expected 2012 average outstanding shares of 819M. Earnings guidance for OpCos may not add up to consolidated EPS guidance. Maintaining FY 2012 operating earnings within $2.55 - $2.85/share (1) (2) |
2012 2Q Earnings Release Slides 3 Utility Regulatory Update ComEd – ICC Rehearing of 2011 Rate Case ICC decision to rehear key elements of ComEd’s rate case is a step in the right direction ComEd’s positions are solidly supported by existing legislation Expect ICC Order by September 19 , 2012 with hearings on August 3 rd , 2012 Reversal of original ICC decision on the rehearing items could improve ComEd earnings by ~$0.10/share in 2012 BGE – 2012 Rate Case Filing On July 27 , BGE filed an electric and gas rate case Expect order from Maryland PSC by February 2013 with hearings in late 4Q 2012 Reflects a $204M increase in revenue requirements for both electric and gas New rates expected to be in effect in February / March 2013 BGE 2012 Rate Case Request Electric Gas Total Rate Base (reflects 13 month average) $2.7 B $1.0 B $3.7 B Rate of Return (10.5% ROE, 48.4% equity) 8.02% 8.02% 8.02% Revenue Increase $151 M $53 M $204M th th |
2012 2Q Earnings Release Slides 4 Key Financial Messages • Delivered non-GAAP operating earnings in 2Q of $0.61/share in line with internal expectations • Continue to create value via our hedging program with strategic decisions on timing, channels and location of sales • Employing financing strategies to meet funding needs at attractive interest rates • Expect 3Q 2012 operating earnings in the range of $0.65 - $0.75/share FY 2012 $0.61 $0.47 $0.05 $0.10 $0.02 HoldCo ExGen ComEd PECO BGE 2012 2Q Results On track to deliver FY 2012 operating earnings within guidance range owing to excellent operational performance |
2012 2Q Earnings Release Slides 5 ExGen Gross Margin Update June 30, 2012 April 30, 2012 Gross Margin Category ($ MM) (1) 2012 (2) 2013 2014 2012 (2) 2013 2014 Open Gross Margin (2,3) (including South, West, Canada hedged gross margin) $4,450 $5,400 $5,850 $4,300 $5,800 $6,250 Mark-to-Market of Hedges (5) $3,100 $1,650 $600 $3,150 $1,400 $500 Power New Business / To Go $100 $550 $850 $200 $550 $850 Non-Power Margins Executed $250 $100 $100 $200 $100 $50 Non-Power New Business / To Go $150 $500 $500 $200 $500 $550 Total Gross Margin $8,050 $8,200 $7,900 $8,050 $8,350 $8,200 Key Highlights in 2Q 2012 • Continue to ratably hedge entire portfolio, with strategic timing decisions in specific regions: - Midwest and Mid-Atlantic wholesale hedging was pared down in a low price environment given higher level of hedging in previous quarters at more favorable prices - ERCOT wholesale hedges were significantly increased to capture attractive cash and term spark spreads in early 2Q - New England wholesale hedges were increased as spark spreads widened • For 2012, achieved $150 million of our “Power” and “Non-Power” New Business / To-Go, which moved into executed buckets • For 2013 and 2014, we expect the power ‘New Business / To-Go’ margins to start moving into the executed category as we enter a more seasonally active sales cycle in the retail and wholesale business (1) Gross margin rounded to nearest $50M. (2) Stub period calculated by excluding Jan 2012 thru mid-March 2012 for Constellation only. (3) Excludes Maryland assets to be divested. (4) Includes CENG Joint Venture. (5) Mark to Market of Hedges assumes mid-point of hedge percentages. |
2012 Projected Sources and Uses of Cash (1) Exelon beginning cash balance as of 12/31/11. Excludes counterparty collateral activity. (2) Includes $675 million of Constellation net collateral paid to counterparties prior to merger completion. (3) Cash Flow from Operations primarily includes net cash flows provided by operating activities, estimated proceeds from Maryland clean coal fleet divestitures and net cash flows used in investing activities other than capital expenditures. (4) Dividends are subject to declaration by the Board of Directors. (5) Excludes PECO’s $225 million Accounts Receivable (A/R) Agreement with Bank of Tokyo. PECO’s A/R Agreement was extended in accordance with its terms through August 31, 2012. (6) “Other” includes proceeds from options and expected changes in short-term debt. (7) Includes cash flow activity from Holding Company, eliminations, and other corporate entities. Represents Constellation cash flows from merger close through December 31, 2012. 6 ($ in Millions) 2012 2Q Earnings Release Slides (7) ` Beginning Cash Balance (1) $550 Cash acquired from Constellation (2) 150 n/a n/a 1,375 1,650 Cash Flow from Operations (3) 250 975 800 3,450 5,375 CapEx (excluding other items below): (475) (1,200) (350) (1,000) (3,075) Nuclear Fuel n/a n/a n/a (1,175) (1,175) Dividend (4) (1,725) Nuclear Uprates n/a n/a n/a (350) (350) Wind n/a n/a n/a (650) (650) Solar n/a n/a n/a (675) (675) Upstream n/a n/a n/a (75) (75) Utility Smart Grid/Smart Meter (75) (75) (75) n/a (225) Net Financing (excluding Dividend): Planned Debt Issuances (5) 250 375 350 775 1,750 Planned Debt Retirements (175) (450) (375) (75) (1,075) Project Finance/Federal Financing Bank Loan n/a n/a n/a 375 375 Other (6) 25 250 25 (50) 75 Ending Cash Balance (1) $750 |
7 APPENDIX 2012 2Q Earnings Release Slides |
8 ExGen Disclosures June 30, 2012 2012 2Q Earnings Release Slides |
9 Components of Gross Margin Categories Margins move from new business to MtM of hedges over the course of the year as sales are executed Margins move from “Non power new business” to “Non power executed” over the course of the year Gross margin linked to power production and sales Gross margin from other business activities 2012 2Q Earnings Release Slides (1) Hedged gross margins for South, West & Canada region will be included with Open Gross Margin, and no expected generation, hedge %, EREP or reference prices provided for this region. •Generation Gross Margin at current market prices, including capacity & ancillary revenues •Exploration and Production •PPA Costs & Revenues •Provided at a consolidated level for all regions (includes hedged gross margin for South, West & Canada (1) ) •MtM of power, capacity and ancillary hedges, including cross commodity, retail and wholesale load transactions •Provided directly at a consolidated level for five major regions. Provided indirectly for each of the five major regions via EREP, reference price, hedge %, expected generation •Retail, Wholesale planned electric sales •Portfolio Management new business •Mid marketing new business •Retail, Wholesale executed gas sales •Load Response •Energy Efficiency •BGE Home •Distributed Solar •Retail, Wholesale planned gas sales •Load Response •Energy Efficiency •BGE Home •Distributed Solar •Portfolio Management / origination fuels new business •Proprietary trading (3) Open Gross Margin MtM of Hedges (2) “Power” New Business “Non Power” Executed “Non Power” New Business (2) MtM of hedges provided directly for the five larger regions. MtM of hedges is not provided directly at the regional level but can be easily estimated using EREP, reference price and hedged MWh. (3) Proprietary trading gross margins will remain within “Non Power” New Business category and not move to “Non power” executed category. |
10 ExGen Disclosures Gross Margin Category ($ MM) (1) 2012 (2) 2013 2014 Open Gross Margin (including South, West & Canada hedged GM) (3,4) $4,450 $5,400 $5,850 Mark to Market of Hedges (5) $3,100 $1,650 $600 Power New Business / To Go $100 $550 $850 Non-Power Margins Executed $250 $100 $100 Non-Power New Business / To Go $150 $500 $500 Total Gross Margin $8,050 $8,200 $7,900 (1) Gross margin rounded to nearest $50M. (2) Stub period calculated by excluding Jan 2012 thru mid-March 2012 for Constellation only. (3) Excludes Maryland assets to be divested. Reference Prices (6) 2012 2013 2014 Henry Hub Natural Gas ($/MMbtu) $2.72 $3.58 $3.95 Midwest: NiHub ATC prices ($/MWh) $27.17 $28.85 $30.57 Mid-Atlantic: PJM-W ATC prices ($/MWh) $32.35 $36.25 $38.42 ERCOT-N ATC Spark Spread ($/MWh) HSC Gas, 7.2HR, $2.50 VOM $12.19 $7.44 $6.48 New York: NY Zone A ($/MWh) $29.55 $31.45 $32.99 New England: Mass Hub ATC Spark Spread($/MWh) ALQN Gas, 7.5HR, $0.50 VOM $6.17 $4.93 $4.20 (4) Includes CENG Joint Venture. (5) Mark to Market of Hedges assumes mid-point of hedge percentages. (6) Based on June 29, 2012 market conditions. 2012 2Q Earnings Release Slides |
11 ExGen Disclosures Generation and Hedges 2012 (1) 2013 2014 Exp. Gen (GWh) (4) 219,600 216,900 209,200 Midwest 101,000 97,600 97,600 Mid-Atlantic (2,3) 71,900 73,600 71,400 ERCOT 19,900 17,800 15,400 New York (3) 13,400 13,600 10,700 New England 13,400 14,300 14,100 % of Expected Generation Hedged (5) 99-102% 79-82% 46-49% Midwest 98-101% 80-83% 47-50% Mid-Atlantic (2,3) 102-105% 78-81% 49-52% ERCOT 96-99% 70-73% 39-42% New York (3) 101-104% 85-88% 38-41% New England 96-99% 79-82% 41-44% Effective Realized Energy Price ($/MWh) (6) Midwest 40.50 39.00 36.00 Mid-Atlantic (2,3) 53.50 49.00 48.00 ERCOT 7 9.00 7.00 4.00 New York (3) 45.00 37.00 37.50 New England (7) 7.50 7.00 4.00 2012 2Q Earnings Release Slides (1) Stub period calculated by excluding Jan 2012 thru mid-March 2012 for Constellation only. (2) Excludes Maryland assets to be divested (3) Includes CENG Joint Venture. (4) Expected generation represents the amount of energy estimated to be generated or purchased through owned or contracted for capacity. Expected generation is based upon a simulated dispatch model that makes assumptions regarding future market conditions, which are calibrated to market quotes for power, fuel, load following products, and options. Expected generation assumes 10 refueling outages in 2012 and 2013 and 11 refueling outages in 2014 at Exelon-operated nuclear plants and Salem but excludes CENG. Expected generation assumes capacity factors of 93.1%, 93.3% and 93.8% in 2012, 2013 and 2014 at Exelon-operated nuclear plants excluding Salem and CENG. These estimates of expected generation in 2012, 2013 and 2014 do not represent guidance or a forecast of future results as Exelon has not completed its planning or optimization processes for those years. (5) Percent of expected generation hedged is the amount of equivalent sales divided by expected generation. Includes all hedging products, such as wholesale and retail sales of power, options and swaps. Uses expected value on options. (6) Effective realized energy price is representative of an all-in hedged price, on a per MWh basis, at which expected generation has been hedged. It is developed by considering the energy revenues and costs associated with our hedges and by considering the fossil fuel that has been purchased to lock in margin. It excludes uranium costs and RPM capacity revenue, but includes the mark-to-market value of capacity contracted at prices other than RPM clearing prices including our load obligations. It can be compared with the reference prices used to calculate open gross margin in order to determine the mark-to-market value of Exelon Generation's energy hedges. (7) Spark spreads shown for ERCOT and New England. |
12 ExGen Hedged Gross Margin Sensitivities Gross Margin Sensitivities (With Existing Hedges) (1,4) 2012 2013 2014 Henry Hub Natural Gas ($/MMbtu) (2) + $1/Mmbtu $(65) $120 $490 - $1/Mmbtu $75 $(100) $(430) NiHub ATC Energy Price + $5/MWh $5 $85 $280 - $5/MWh $(5) $(85) $(275) PJM-W ATC Energy Price (2) + $5/MWh $(15) $80 $190 - $5/MWh $15 $(80) $(185) NYPP Zone A ATC Energy Price + $5/MWh $5 $10 $45 - $5/MWh $(5) $(10) $(45) Nuclear Capacity Factor (3) +/- 1% +/- $15 +/- $40 +/- $40 2012 2Q Earnings Release Slides (1) Based on June 29, 2012 market conditions and hedged position. Gas price sensitivities are based on an assumed gas-power relationship derived from an internal model that is updated periodically. Power prices sensitivities are derived by adjusting the power price assumption while keeping all other prices inputs constant. Due to correlation of the various assumptions, the hedged gross margin impact calculated by aggregating individual sensitivities may not be equal to the hedged gross margin impact calculated when correlations between the various assumptions are also considered. (2) Excludes Maryland assets to be divested. (3) Includes CENG Joint Venture (4) Sensitivities based on commodity exposure which includes open generation and all committed transactions. |
13 Exelon Generation Hedged Gross Margin Upside/Risk 6,000 6,500 7,000 7,500 8,000 8,500 9,000 9,500 10,000 2014 2013 2012 $8,200 $7,900 $8,700 $7,800 $9,300 $6,900 2012 2Q Earnings Release Slides (1) Represents an approximate range of expected gross margin, taking into account hedges in place, between the 5th and 95th percent confidence levels assuming all unhedged supply is sold into the spot market. Approximate gross margin ranges are based upon an internal simulation model and are subject to change based upon market inputs, future transactions and potential modeling changes. These ranges of approximate gross margin in 2013 and 2014 do not represent earnings guidance or a forecast of future results as Exelon has not completed its planning or optimization processes for those years. The price distributions that generate this range are calibrated to market quotes for power, fuel, load following products, and options as of June 29, 2012 (2) Gross Margin Upside/Risk based on commodity exposure which includes open generation and all committed transactions. (3) Excludes Maryland assets to be divested. |
14 Illustrative Example of Modeling Exelon Generation 2013 Gross Margin Row Item Midwest Mid- Atlantic ERCOT New York New England South, West & Canada (A) Start with fleet-wide open gross margin $5.4 billion (B) Expected Generation (TWh) 97.6 73.6 17.8 13.6 14.3 (C) Hedge % (assuming mid-point of range) 81.5% 79.5% 71.5% 86.5% 80.5% (D=B*C) Hedged Volume (TWh) 79.5 58.5 12.7 11.9 11.7 (E) Effective Realized Energy Price ($/MWh) $39.00 $49.00 $7.00 $37.00 $7.00 (F) Reference Price ($/MWh) $28.85 $36.25 $7.44 $31.45 $4.93 (G=E-F) Difference ($/MWh) $10.15 $12.75 ($0.44) $5.55 $2.07 (H=D*G) $810 million $745 million ($5) million $65 million $25 million (I=A+H) Hedged Gross Margin ($ million) $7,050 million (J) Power New Business / To Go ($ million) $550 million (K) Non-Power Margins Executed ($ million) $100 million (L) Non-Power New Business / To Go ($ million) $500 million (N=I+J+K+L) Total Gross Margin $8,200 million (1) Mark-to-market rounded to the nearest $5 million. 2012 2Q Earnings Release Slides Mark-to-market value of hedges ($ million) (1) |
15 Additional 2012 ExGen Modeling P&L Item 2012 Stub (1) Estimate 2012 Full-Year (2) Estimate O&M (3) $4,000M $4,250M Taxes Other Than Income (TOTI) $300M $300M Depreciation & Amortization (4) $650M $700M Interest Expense $300M $350M 2012 2Q Earnings Release Slides Stub period represents estimates for March 12 – December 31, 2012 and is reflected as part of ExGen’s 2012 earnings guidance Full-year estimates provided for modeling purposes. ExGen O&M does not include CENG O&M of ~$350M in the stub estimate. CENG O&M will be reflected under “Equity earnings of unconsolidated affiliates” in the Income Statement. In addition, we have removed the impact from O&M related to entities consolidated solely as a result of the application of FIN 46R. Our 2012 earnings guidance (prior or current) is not impacted by this change to O&M since the application of FIN 46R does not impact net income. ExGen D&A does not include CENG D&A of ~$100M in the stub estimate. CENG D&A will be reflected under ‘Equity earnings of unconsolidated affiliates” in the Income Statement. (1) (2) (3) (4) |
ComEd Load Trends 4Q12 3Q12 2Q12 1Q12 4Q11 3Q11 2Q11 1Q11 Gross Metro Product Residential Large C&I All Customer Classes 2011 2Q12 2012E (3) Average Customer Growth 0.4% 0.3% 0.3% Average Use-Per-Customer (1.7)% (3.0)% (1.7)% Total Residential (1.3)% (2.7)% (1.4)% Small C&I (0.8)% (1.8)% (0.2)% Large C&I 0.6% 0.4% (0.4)% All Customer Classes (0.5)% (1.3)% (0.6)% Weather-Normalized Electric Load Year-over-Year Key Economic Indicators Weather-Normalized Electric Load (1) Source: U.S. Dept. of Labor (June 2012) and Illinois Department of Security (June 2012) (2) Source: Global Insight (May 2012) (3) Not adjusted for leap year Chicago U.S. Unemployment rate (1) 8.6% 8.2% 2012 annualized growth in gross domestic/metro product (2) 1.7% 2.2% 16 2012 2Q Earnings Release Slides -3% -2% -1% 0% 1% 2% 3% Notes: C&I = Commercial & Industrial. ComEd load activity impacts net income to the extent that it does not result in an ROE outside of the collar, which ensures that the earned ROE is within 0.5% of the allowed ROE. |
17 PECO Load Trends 4Q12 3Q12 2Q12 1Q12 4Q11 3Q11 2Q11 1Q11 Large C&I All Customer Classes Gross Metro Product Residential Note: C&I = Commercial & Industrial 2011 2Q12 2012E (3) Average Customer Growth 0.3% 0.4% 0.5% Average Use-Per-Customer 1.3% (1.0)% (2.1)% Total Residential 1.7% (0.7)% (1.7)% Small C&I (0.7)% (1.9)% (3.2)% Large C&I (3.3)% (4.9)% (1.8)% All Customer Classes (0.9)% (2.7)% (2.0)% Weather-Normalized Electric Load Year-over-Year Key Economic Indicators Weather-Normalized Electric Load (1) Source: U.S. Dept. of Labor (June 2012) - US US Dept of Labor prelim. data (June 2012) - Philadelphia (2) Source: Global Insight (May 2012) (3) Not adjusted for leap year Philadelphia U.S. Unemployment rate (1) 7.8% 8.2% 2012 annualized growth in gross domestic/metro product (2) 1.4% 2.2% 2012 2Q Earnings Release Slides -8% -6% -4% -2% 0% 2% 4% |
Sufficient Liquidity (1) Excludes commitments from Exelon’s Community and Minority Bank Credit Facility. (2) Available Capacity Under Facilities represents the unused commitments under the borrower’s credit agreements net of outstanding letters of credit and facility draws. The amount of commercial paper outstanding does not reduce the available capacity under the credit agreements. (3) Includes Exelon Corporate’s $500M credit facility and legacy Constellation credit facilities assumed as part of the merger, letters of credit and commercial paper outstanding. Exelon will be unwinding the $4B in credit facilities assumed from legacy Constellation over the remainder of the year. (3) ($ in Millions) Available Capacity Under Bank Facilities as of July 27, 2012 Exelon Corp, ExGen, PECO and BGE facilities will be amended and extended to to align maturities of Exelon facilities and secure liquidity and pricing through 2017 18 2012 2Q Earnings Release Slides Aggregate Bank Commitments (1) 600 1,000 600 5,600 10,640 Outstanding Facility Draws -- -- -- -- -- Outstanding Letters of Credit (1) (1) (1) (1,793) (2,317) Available Capacity Under Facilities (2) 599 999 599 3,807 8,323 Outstanding Commercial Paper (35) (256) -- -- (462) Available Capacity Less Outstanding Commercial Paper 564 743 599 3,807 7,861 |
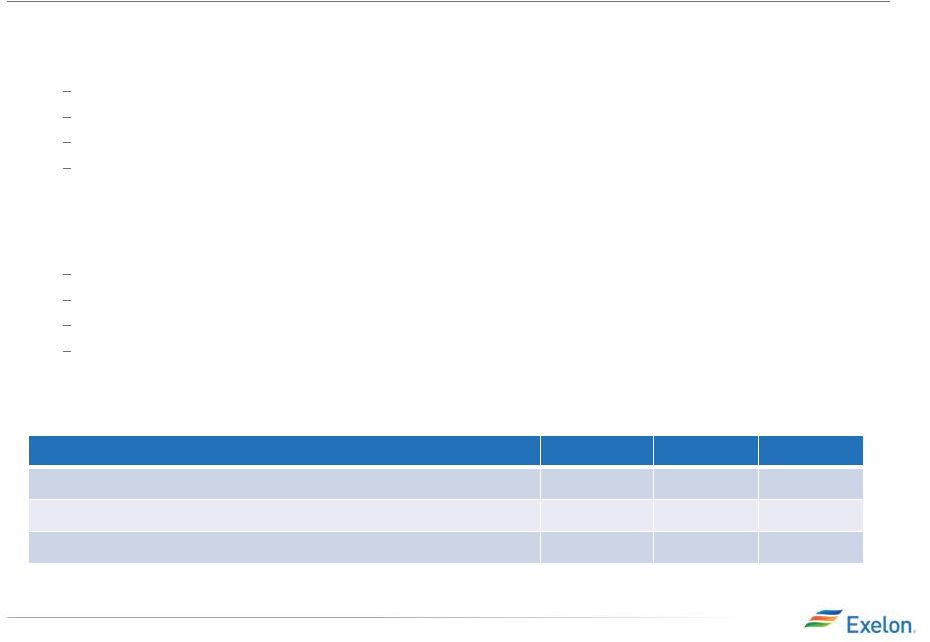
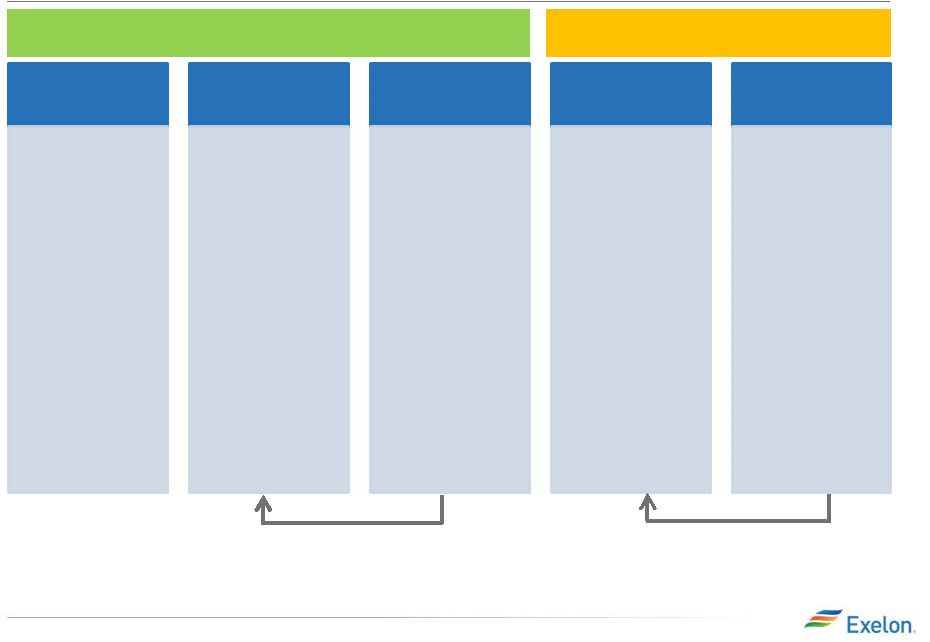
19 ComEd Distribution Rate Case Update 2011 Formula Rate Filing (Docket # 11-0721 filed 11/8/11; rates eff. June 2012): • Based on 2010 calendar year costs and 2011 net plant additions • Supported $59M distribution revenue requirement reduction • 10.05% ROE (2010 Treasury yield of 4.25% + 580 basis point risk premium) ICC Final Order (issued 5/30/12): • $168M revenue requirement reduction; incremental reduction includes: ~$50M related to costs ICC determined should be recovered through alternative rate recovery tariffs or reflected in reconciliation proceeding; primarily delays timing of cash flows ~$35M reflects disallowance of return on pension asset ~$10M reflects incentive compensation related adjustments ~$15M reflects various adjustments for cash working capital, operating reserves and other technical items • ComEd requested and the ICC granted expedited rehearing on the pension, interest rate, and average rate base issues; Commission Final Order expected by Sept. 19. 2012 Formula Rate Filing (Docket # 12-0321 filed 4/30/12, rates eff. Jan 2013) • 2012 plan year based on 2011 actual costs and 2012 net plant additions 9.71% ROE (2011 Treasury yield of 3.91% + 580 basis point risk premium) • Reconciled 2011 revenue requirements in effect to 2011 actual costs incurred 9.81% ROE (3.91% plus 590 basis point risk premium) (1) • Initial filing supported $106M distribution revenue requirement increase relative to Dec. 2012 rates as ComEd initially proposed. When factoring in 5/30/12 order for #11-0721, ComEd proposed a $34M reduction • Received staff and intervener testimony on 7/17/12 – Staff proposes an additional $35M reduction beyond ComEd’s filing • ICC order by year end; rates effective January 2013 Summary of Filings 2010 2011 2012 J F M A M J J A S O N D J F M A M J J A S O N D J F M A M J J A S O N D Costs used for filing Plant additions used for filing Formula rate filing Rates in effect 2011 2012 2013 J F M A M J J A S O N D J F M A M J J A S O N D J F M A J J A S O N D Costs used for filing Plant additions used for filing Formula rate filing Rates in effect (1) 590 basis point premium applies only to 2011 revenue reconciliation. All subsequent revenue reconciliations will assume a 580 basis point premium. 2012 2Q Earnings Release Slides |
20 BGE Rate Case Overview Rate Case Request Electric Gas Docket # 9299 Test Year October 2011 – September 2012 Common Equity Ratio 48.4% Requested Returns ROE: 10.5%; ROR: 8.02% Rate Base $2.7B $1B Revenue Requirement Increase $151M $53M Proposed Distribution Price Increase as % of overall bill 4% 7% 2012 2013 Aug Sep Oct Nov Dec Jan Feb Mar New Rates Effective Final Order Expected Hearings Filed 7/27/12 Timeline 2012 2Q Earnings Release Slides |
21 ComEd Operating EPS Contribution Key Drivers – 2Q12 vs. 2Q11 (1) Impacts of the 2012 distribution formula rate order under the Energy Infrastructure Modernization Act: $(0.07) Share differential: $(0.04) One-time impacts of the 2011 distribution rate case order: $(0.03) Weather: $0.01 2Q12 Actual Actual Normal Heating Degree-Days 823 544 765 Cooling Degree-Days 237 423 218 2Q11 $0.26 $0.15 $0.17 $0.05 YTD 2Q 2012 2011 2012 2Q Earnings Release Slides (1) Refer to the Earnings Release Attachments for additional details and to the Appendix for a reconciliation of adjusted (non-GAAP) operating EPS to GAAP EPS. |
22 PECO Operating EPS Contribution Key Drivers – 2Q12 vs. 2Q11 (1) Share differential: $(0.03) 2Q12 Actual Actual Normal Heating Degree-Days 331 337 463 Cooling Degree-Days 494 430 348 2Q11 $0.32 $0.13 $0.23 $0.10 YTD 2Q 2011 2012 2012 2Q Earnings Release Slides (1) Refer to the Earnings Release Attachments for additional details and to the Appendix for a reconciliation of adjusted (non-GAAP) operating EPS to GAAP EPS. |
23 2Q GAAP EPS Reconciliation Three Months Ended June 30, 2012 ExGen ComEd PECO BGE Other Exelon 2012 Adjusted (non-GAAP) Operating Earnings (Loss) Per Share $0.47 $0.05 $0.10 $0.02 $(0.02) $0.61 Mark-to-market impact of economic hedging activities 0.14 - - - 0.00 0.15 Unrealized losses related to nuclear decommissioning trust funds (0.02) - - - - (0.02) Plant retirements and divestitures 0.00 - - - - 0.00 Constellation merger and integration costs (0.07) - (0.00) (0.00) (0.01) (0.08) Amortization of commodity contract intangibles (0.33) - - - - (0.33) Amortization of the fair value of certain debt 0.00 - - - - 0.00 Reassessment of state deferred income taxes - - - - 0.00 0.00 2Q 2012 GAAP Earnings (Loss) Per Share $0.19 $0.05 $0.09 $0.01 $(0.02) $0.33 NOTE: All amounts shown are per Exelon share and represent contributions to Exelon's EPS. Amounts may not add due to rounding. Three Months Ended June 30, 2011 ExGen ComEd PECO Other Exelon 2011 Adjusted (non-GAAP) Operating Earnings (Loss) Per Share $0.79 $0.15 $0.13 $(0.01) $1.05 Mark-to-market impact of economic hedging activities (0.12) - - - (0.12) Unrealized gains related to nuclear decommissioning trust funds 0.01 - - - 0.01 Plant retirements and divestitures (0.02) - - - (0.02) Recovery of costs pursuant to the 2011 distribution rate case order - 0.03 - - 0.03 Constellation merger and integration costs - - - (0.02) (0.02) 2Q 2011 GAAP Earnings (Loss) Per Share $0.67 $0.17 $0.03 $(0.03) $0.93 2012 2Q Earnings Release Slides |
24 YTD GAAP EPS Reconciliation NOTE: All amounts shown are per Exelon share and represent contributions to Exelon's EPS. Amounts may not add due to rounding. Six Months Ended June 30, 2012 ExGen ComEd PECO BGE Other Exelon 2012 Adjusted (non-GAAP) Operating Earnings (Loss) Per Share $1.03 $0.17 $0.23 $0.04 $(0.03) $1.44 Mark-to-market impact of economic hedging activities 0.20 - - - 0.01 0.21 Unrealized gains related to nuclear decommissioning trust funds 0.02 - - - - 0.02 Plant retirements and divestitures (0.01) - - - - (0.01) Constellation merger and integration costs (0.13) (0.00) (0.01) (0.00) (0.09) (0.23) Maryland commitments (0.03) - - (0.11) (0.16) (0.29) Amortization of commodity contract intangibles (0.46) - - - - (0.46) FERC settlement (0.22) - - - - (0.22) Reassessment of state deferred income taxes 0.02 - - - 0.14 0.16 Amortization of the fair value of certain debt 0.00 - - - - 0.00 Other acquisition costs (0.00) - - - (0.00) YTD 2012 GAAP Earnings (Loss) Per Share $0.43 $0.17 $0.22 $(0.07) $(0.13) $0.62 Six Months Ended June 30, 2011 ExGen ComEd PECO Other Exelon 2011 Adjusted (non-GAAP) Operating Earnings (Loss) Per Share $1.69 $0.26 $0.32 $(0.04) $2.22 Mark-to-market impact of economic hedging activities (0.25) - - - (0.25) Unrealized gains related to nuclear decommissioning trust funds 0.04 - - - 0.04 Plant retirements and divestitures (0.04) - - - (0.04) Non-cash charge resulting from health care legislation (0.03) (0.01) - - (0.04) Recovery of costs pursuant to the 2011 distribution rate case order - 0.03 - - 0.03 Constellation merger and integration costs - - - (0.02) (0.02) YTD 2011 GAAP Earnings (Loss) Per Share $1.41 $0.28 $0.26 $(0.07) $1.94 2012 2Q Earnings Release Slides |
GAAP to Operating Adjustments 25 • Exelon’s 2012 adjusted (non-GAAP) operating earnings outlook excludes the earnings effects of the following: Mark-to-market adjustments from economic hedging activities Unrealized gains and losses from nuclear decommissioning trust fund investments to the extent not offset by contractual accounting as described in the notes to the consolidated financial statements Financial impacts associated with the planned retirement of fossil generating units Certain costs related to the Constellation merger and integration initiatives Costs incurred as part of Maryland commitments in connection with the merger Non-cash amortization of intangible assets, net, related to commodity contracts recorded at fair value at the merger date Costs incurred as part of a March 2012 settlement with the Federal Energy Regulatory Commission (FERC) related to Constellation’s prior period hedging and risk management transactions Revenues and operating expenses related to three generation facilities required to be sold within 180 days of the merger Non-cash benefit associated with a change in state deferred tax rates resulting from a reassessment of anticipated apportionment of Exelon’s deferred taxes as a result of the merger Non-cash amortization of certain debt recorded at fair value at the merger date expected to be retired in 2013 Certain costs incurred associated with other acquisitions Significant impairments of assets, including goodwill Other unusual items Significant changes to GAAP • Operating earnings guidance assumes normal weather for remainder of the year 2012 2Q Earnings Release Slides |