 Barclays CEO Energy-Power Conference Jack Thayer, EVP & Chief Financial Officer September 5, 2012 Exhibit 99.1 |
 Cautionary Statements Regarding Forward-Looking Information This presentation contains certain forward-looking statements within the meaning of the Private Securities Litigation Reform Act of 1995, that are subject to risks and uncertainties. The factors that could cause actual results to differ materially from the forward-looking statements made by Exelon Corporation, Commonwealth Edison Company, PECO Energy Company, Baltimore Gas and Electric Company and Exelon Generation Company, LLC (Registrants) include those factors discussed herein, as well as the items discussed in (1) Exelon’s 2011 Annual Report on Form 10-K in (a) ITEM 1A. Risk Factors, (b) ITEM 7. Management’s Discussion and Analysis of Financial Condition and Results of Operations and (c) ITEM 8. Financial Statements and Supplementary Data: Note 18; (2) Constellation Energy Group’s 2011 Annual Report on Form 10-K in (a) ITEM 1A. Risk Factors, (b) ITEM 7. Management’s Discussion and Analysis of Financial Condition and Results of Operations and (c) ITEM 8. Financial Statements and Supplementary Data: Note 12; (3) the Registrant’s Second Quarter 2012 Quarterly Report on Form 10-Q in (a) Part II, Other Information, ITEM 1A. Risk Factors; (b) Part 1, Financial Information, ITEM 2. Management’s Discussion and Analysis of Financial Condition and Results of Operations and (c) Part I, Financial Information, ITEM 1. Financial Statements: Note 16; and (4) other factors discussed in filings with the SEC by the Registrants. Readers are cautioned not to place undue reliance on these forward-looking statements, which apply only as of the date of this presentation. None of the Registrants undertakes any obligation to publicly release any revision to its forward- looking statements to reflect events or circumstances after the date of this presentation. 1 Barclays CEO Energy-Power Conference |
 Market Fundamentals – Exelon’s Macro View on the Economy 2 GDP growth at 2% or less in 2012 and 2013 Housing starts at ~500 thousand units / year Unemployment expected to stay over 8% Oil prices in the $100/bbl range Load growth is flat GDP growth in excess of 2.5% in 2014 Housing starts exceed 1 million units / year Unemployment moves under 8% Oil prices remain in the $100/bbl range Load growth is positive but at a rate lower than GDP Barclays CEO Energy-Power Conference Current & Near Term 2012 & 2013 Medium to Long Term 2014 & Beyond Slow but positive growth in the near term will give way to higher growth levels in 2014 and beyond. This will result in higher gas and power demand, stabilizing prices in the short term and a positive trajectory going forward. |
 Market Fundamentals – Natural Gas Price Expectations 3 Market Dynamics Steady production Record warm winter in 2012 resulting in excess gas storage, partially offset by hot summer Coal to gas switching reduces supply glut and provides market elasticity Anticipated Price Range $2.00 - $4.00 / mmbtu Limited downside to gas prices from coal to gas switching Market Dynamics Declining production from oil drilling competition Growing industrial demand Increased transportation demand Increased power generation demand Potential for LNG exports Anticipated Price Range $4.00 - $6.00 / mmbtu Limited downside to gas prices from increasing demand and market elasticity Current & Near Term 2012 & 2013 Medium to Long Term 2014 & Beyond Barclays CEO Energy-Power Conference We anticipate 2013 to be a transition year, with demand side pressures from a variety of factors coming into play in 2014 and beyond |
 Market Fundamentals – Expectations for Power Prices in PJM 4 Current & Near Term 2012 & 2013 Medium to Long Term 2014 & Beyond Market Dynamics No major impact on power prices from CSAPR being vacated on power prices ~ 15 GW of retirements expected in latter half of 2012 and 2013 High heat rates in 2012 due to low gas prices and summer heat. Current forwards are fairly valued Exelon Portfolio Impact 4 Fully hedged in 2012, and >80% hedged in 2013 Market Dynamics Low gas prices & MATS rule are major drivers of coal retirements ~40 GW of coal retirements, with almost 70% already announced . Includes ~25 GW of retirements in 2014 and 2015 Internal view of $3-5/MWh upside in power prices not currently reflected in forward prices Exelon Portfolio Impact 4 53% open in 2014, and mostly open beyond 2014 3. Retirement estimate is for the Eastern Interconnect as per Exelon’s internal projections. 4. Portfolio hedge percentages are shown as of 6/30/2012. Barclays CEO Energy-Power Conference 1. Cross State Air Pollution Rule 2. Mercury and Air Toxics Standards 1 2 3 Our baseload and intermediate generation fleet is well positioned and mostly open in 2015 to capture the upside in power prices |
 Market Fundamentals – Expected Upside in Power Prices 5 We believe PJM Power forwards do not fully reflect the upcoming changes in the generation supply stack Supply stack changes driven by the following: ~18 GW of retirements in PJM by 2016 Increased compliance cost that will impact cost of operations for coal units that survive and increase their marginal cost Contango 1 in gas market of ~$0.80 cents from 2013 to 2017 results in a $5/MWh increase in power prices at NIHUB We believe the higher power prices only reflect gas contango and not a restructuring of the generation stack PJM Market View indicates the following: NIHUB has the most upside with ~1 heat rate point increase over current forward market Some upside is already reflected in PJM-WHUB and we anticipate ~1/2 point heat rate increase Significant amount of upside is already reflected in PJM-EHUB due to large number of gas units in that area 1. Contango refers to upward trajectory in forward prices. Data as of 7/30/2012. Barclays CEO Energy-Power Conference Expect power prices to move higher than gas prices resulting in higher heat rates |
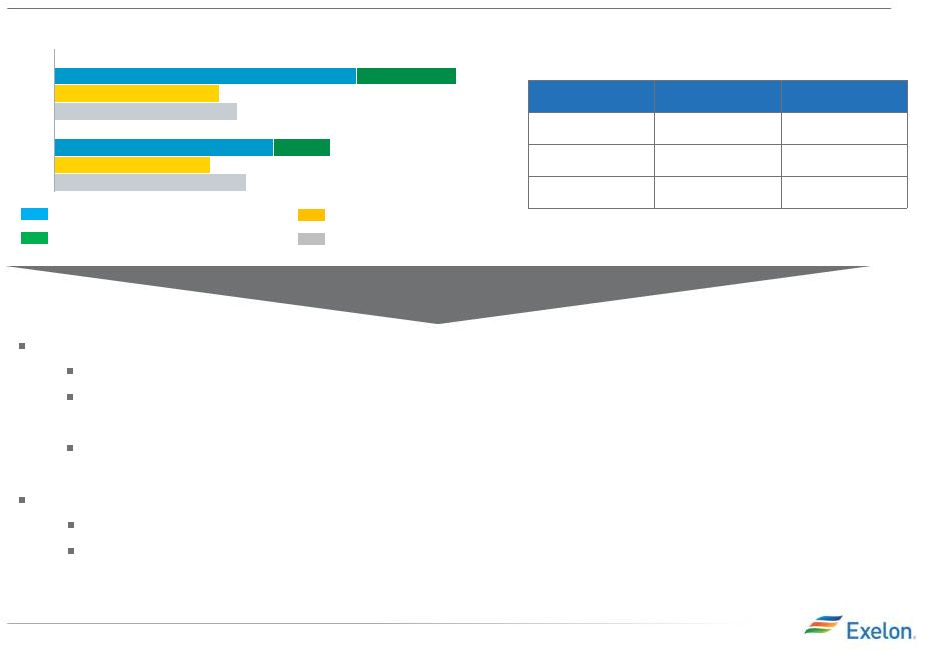 6 Exelon’s Texas and New England Portfolio 21 17 20 18 New England 30 ERCOT 44 ERCOT New England Intermediate 3,750 2,740 Peaking 1,260 710 Total 5,010 3,450 Generation Capacity, Expected Generation & Load (2012 in TWh ) Generation Capacity (MW) 1. Data as of 06/30/2012. Owned and contracted capacity converted from MW to MWh assuming 100% capacity factor for all technology types, except renewables which are shown at estimated capacity factor. 2. Represents installed capacity owned or net contracted as of 6/30/2012. Capacity is rounded to the nearest 10 MW. Well balanced portfolio in Texas and New England Retail provides a lucrative channel to market our generation Intermediate and peaking generation assets are effectively call options at various heat rates that benefit from price volatility Leverage strong asset base and utilize market-based hedging instruments to effectively manage load-following obligations Premium asset location Sizeable generation position in TX close to large load pockets in Dallas and Houston Sizeable generation position in MA close to large load pockets in Boston Generation Capacity - Intermediate Generation Capacity - Peaking Expected Generation Expected Load Barclays CEO Energy-Power Conference 1 2 |
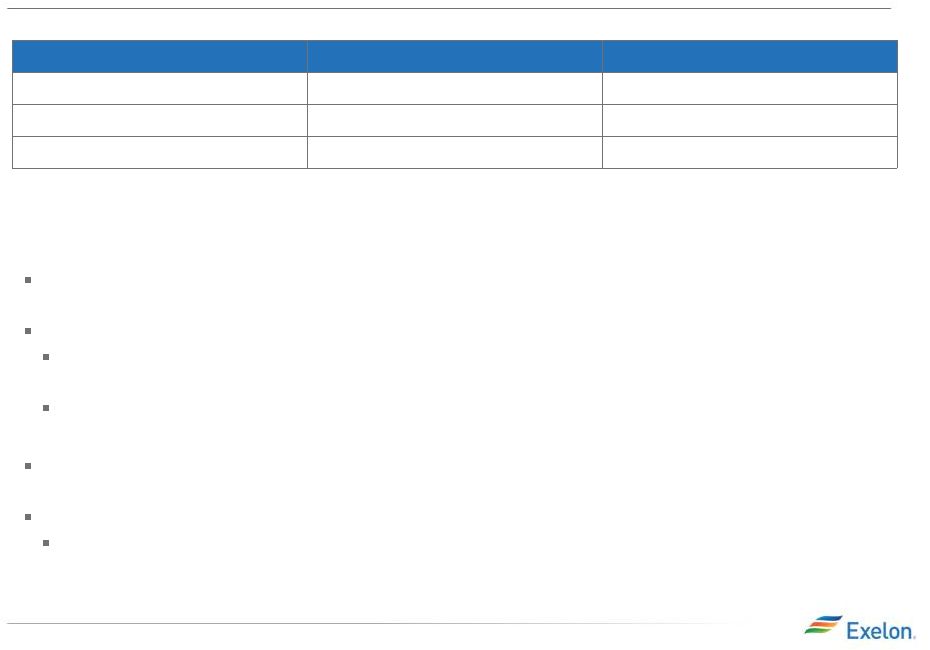 7 Asset Divestiture Update – Maryland Coal Assets Transaction Background and Overview Competitive sales process despite buyer restrictions due to market power considerations Cumulative cash proceeds of ~$605 million ~$400 million sales price represents strong value for the assets in a challenging market environment $205 million tax benefit resulting from differences in sale proceeds versus tax basis Sale requires approval by FERC and DOJ - anticipate closing in the fourth quarter of this year Earnings and ExGen Disclosures No impact on operating earnings or gross margins shown in ExGen disclosures Units Installed Capacity Technology Type Brandon Shores 1, 273 MW 2 coal units C.P. Crane 399 MW 2 coal & 1 oil unit H.A. Wagner 976 MW 2 coal, 2 oil & 1 dual fuel Barclays CEO Energy-Power Conference |