 Bank of America Merrill Lynch 2012 Power and Gas Leaders Conference Bill Von Hoene Senior EVP & Chief Strategy Officer September 19th, 2012 Exhibit 99.1 |
 Cautionary Statements Regarding Forward-Looking Information This presentation contains certain forward-looking statements within the meaning of the Private Securities Litigation Reform Act of 1995, that are subject to risks and uncertainties. The factors that could cause actual results to differ materially from the forward-looking statements made by Exelon Corporation, Commonwealth Edison Company, PECO Energy Company, Baltimore Gas and Electric Company and Exelon Generation Company, LLC (Registrants) include those factors discussed herein, as well as the items discussed in (1) Exelon’s 2011 Annual Report on Form 10-K in (a) ITEM 1A. Risk Factors, (b) ITEM 7. Management’s Discussion and Analysis of Financial Condition and Results of Operations and (c) ITEM 8. Financial Statements and Supplementary Data: Note 18; (2) Constellation Energy Group’s 2011 Annual Report on Form 10-K in (a) ITEM 1A. Risk Factors, (b) ITEM 7. Management’s Discussion and Analysis of Financial Condition and Results of Operations and (c) ITEM 8. Financial Statements and Supplementary Data: Note 12; (3) the Registrant’s Second Quarter 2012 Quarterly Report on Form 10-Q in (a) Part II, Other Information, ITEM 1A. Risk Factors; (b) Part 1, Financial Information, ITEM 2. Management’s Discussion and Analysis of Financial Condition and Results of Operations and (c) Part I, Financial Information, ITEM 1. Financial Statements: Note 16; and (4) other factors discussed in filings with the SEC by the Registrants. Readers are cautioned not to place undue reliance on these forward-looking statements, which apply only as of the date of this presentation. None of the Registrants undertakes any obligation to publicly release any revision to its forward-looking statements to reflect events or circumstances after the date of this presentation. 1 |
 Maintaining Strength Under Current Market Conditions 2 Our business decisions will be reflective of various considerations including current market views, our internal fundamental views and the method to most effectively create and return value to shareholders Current forward power prices do not reflect anticipated recovery • Our internal market analysis forecasts $3/MWh upside at PJW-WHUB and $5/MWh upside at NIHUB • Power markets do not reflect tightening of the supply stack from coal retirements and MATS compliance costs Options are available to manage through the downturn • Currently reviewing plans to identify additional cost savings • Re-evaluating the timing and amount of uprate and renewable spend |
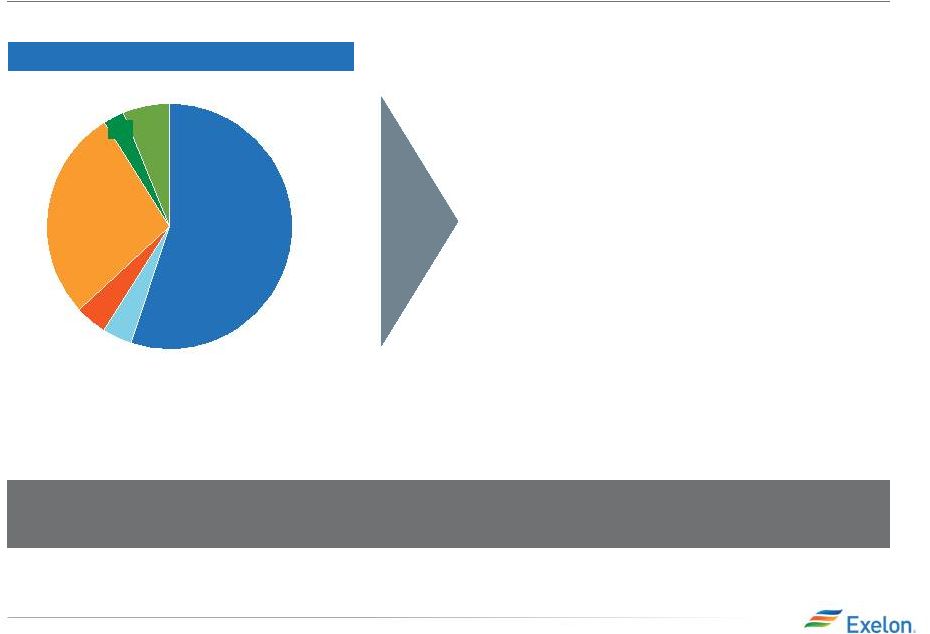
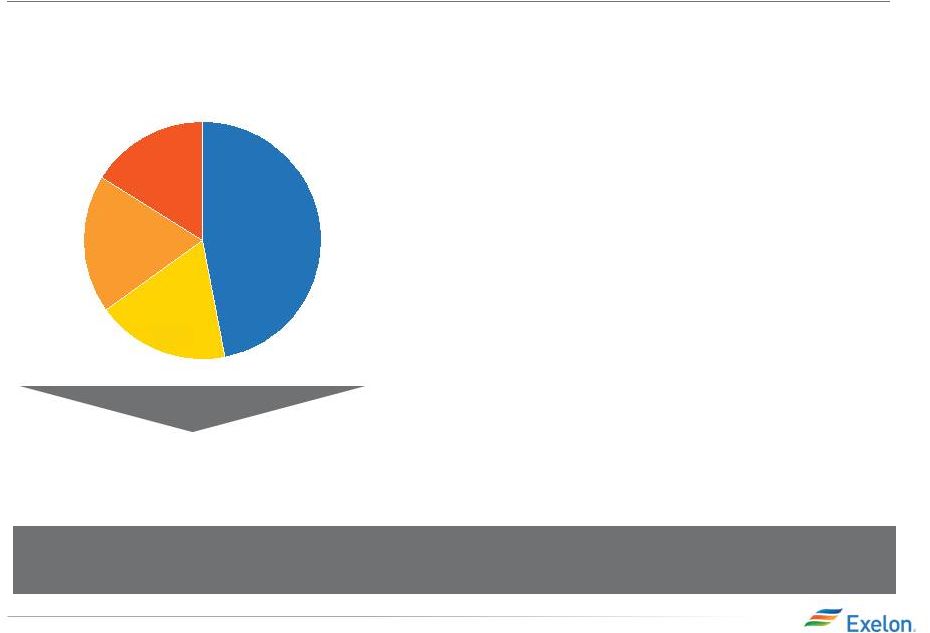 3 Constellation: Electric Retail Business Strategy Constellation is well positioned in a U.S. market where capacity available for competitive supply has room to grow Total U.S. Power Market in 2012 Estimated Load ~ 3,700 TWh (1) (1) Source: EIA, KEMA and internal estimates. Through retail and wholesale channels, Constellation currently serves 170 TWhs, or approximately 5%, of total U.S. power demand Expected Total Competitive Market Growth • Underlying load growth – More than 1% annual load growth across the U.S. • Switched market expected to grow by approximately 11% in C&I from 2011 to 2014 – Existing markets: PA and OH – New markets: MI and AZ • Switched market expected to grow by approximately 15% in residential from 2011 to 2014 Strategy to Grow • As existing markets grow and new markets open, serve new customers • Improve market share in existing markets • Cross sell suite of products to existing customers – Create more value with customers – Utilize data and technology to expand product offerings – Achieve higher renewal rates – Distinguish our brand • Leverage operational efficiency Eligible Non-Switched 16% Eligible Switched 19% Muni/Co-Op Market Other Ineligible 47% 18% |
 4 Exelon Utilities: Rate Case Progress ComEd – ICC Rehearing of 2011 Rate Case • ICC decision to rehear key elements of ComEd’s rate case is a step in the right direction • ComEd’s positions are solidly supported by existing legislation • Expect ICC Order on September 19th, 2012 • Reversal of original ICC decision on the rehearing items could improve ComEd earnings by ~$0.10/share in 2012 BGE – 2012 Rate Case Filing • On July 27th, BGE filed an electric and gas rate case • Expect order from Maryland PSC by February 2013 with hearings in late 4Q 2012 • Reflects a $204M increase in revenue requirements for both electric and gas • New rates expected to be in effect in late February 2013 Exelon Utilities will deliver on operational and financial performance and utilize existing rate making frameworks to earn a fair and reasonable return BGE 2012 Rate Case Request Electric Gas Total Rate Base (reflects 13 month average) $2.7 B $1.0 B $3.7 B Rate of Return (10.5% ROE, 48.4% equity) 8.02% 8.02% 8.02% Revenue Increase $151 M $53 M $204M |
 Modifying the Minimum Offer Price Rules 5 Regulatory advocacy efforts are designed to improve the functioning of competitive markets and protect against attempts to undermine price signals Goal of Advocacy Efforts: • Protect competitive markets against attempts to undermine price signals and ensure uneconomic generation does not distort market • Ensure that generators receiving subsidies bid their appropriate cost into the RPM auction Concerns with Existing MOPR: • MOPR exemption process allows non-competitive supply to escape market power mitigation, and fails to properly consider the value of out-of-market contracts • MOPR does not apply throughout RTO • MOPR floor applies only for one year and is set at 90% of the net cost of new entry Path Forward: • Stakeholders reviewing methods to restructure MOPR • Any MOPR changes intended to be effective by PJM RPM 2016/17 auction |
 ERCOT Market Redesign 6 Exelon is well positioned in ERCOT for any of the new market constructs Option Overview Easy to Implement Risk of Reliability Issues Incentivizes New Build 1 Energy-Only with Market-Based Reserve Margin Market determines reliability levels and investment decisions on energy prices alone (current state) Yes High No 2 Energy-Only with Adders to Support a Target Reserve Margin Potential options include: • increasing the system offer caps • establishing an LMP adder Yes Medium No 3: Energy-Only with Backstop Procurement at Minimum Acceptable Reliability Allows for ERCOT to reactivate mothballed capacity under RMR agreements and procure emergency demand resources at the price cap Yes Low No 4: Mandatory Resource Adequacy Retirement for LSEs LSEs would be required to obtain enough capacity to meet peak load plus reserve margin or face penalty No Low Yes 5 Resource Adequacy Requirement with Centralized Forward Capacity Market • PJM style capacity market • Forward capacity obligations are procured on behalf of load 3-4 years prior to delivery No Low Yes : : : |
 7 APPENDIX |
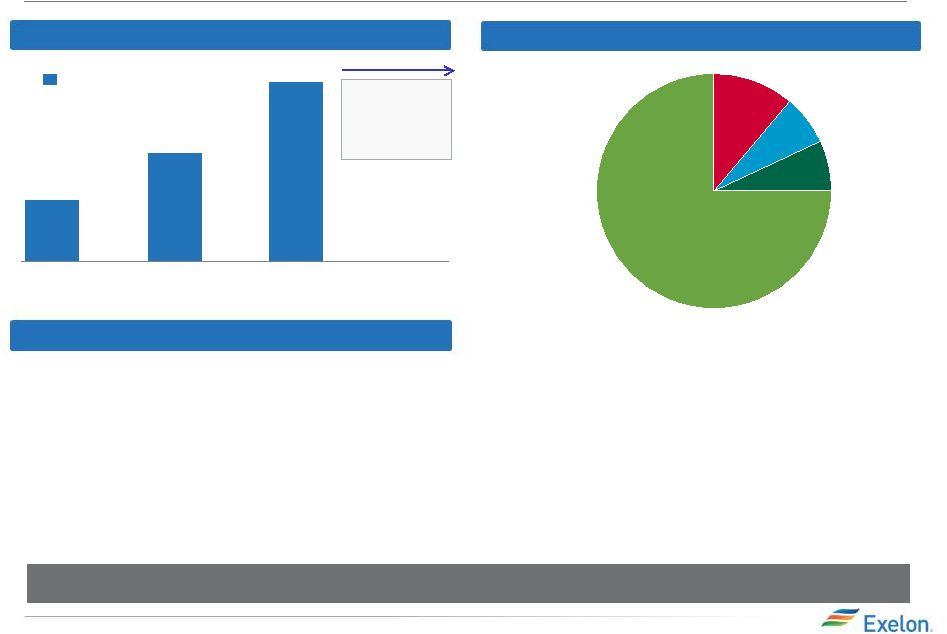 Achievable Merger Synergies • Run rate gross margin opportunities of $100M (2) starting in 2014 – Matching load and generation – Retail growth opportunities – Portfolio optimization $500 $305 $170 2015+ 2014 2013 2012 Merger O&M synergies Higher run rate O&M synergies of ~$500M • Key drivers of run rate O&M synergies include – Labor savings from corporate and commercial consolidations – Reduced collateral requirements – IT systems consolidation – Supply chain savings – Other non-labor corporate synergies Fully committed to achieving merger synergies (1) O&M synergies include cost savings of ~$40M from lower liquidity requirements. (2) Gross margin opportunities included in Total Gross Margin shown on slide 16. Unregulated 75% BGE 7% PECO 7% ComEd 11% 8 Gross Margin Opportunities ($M) O&M Savings ($M) Run Rate O&M Synergies Breakdown (1) |
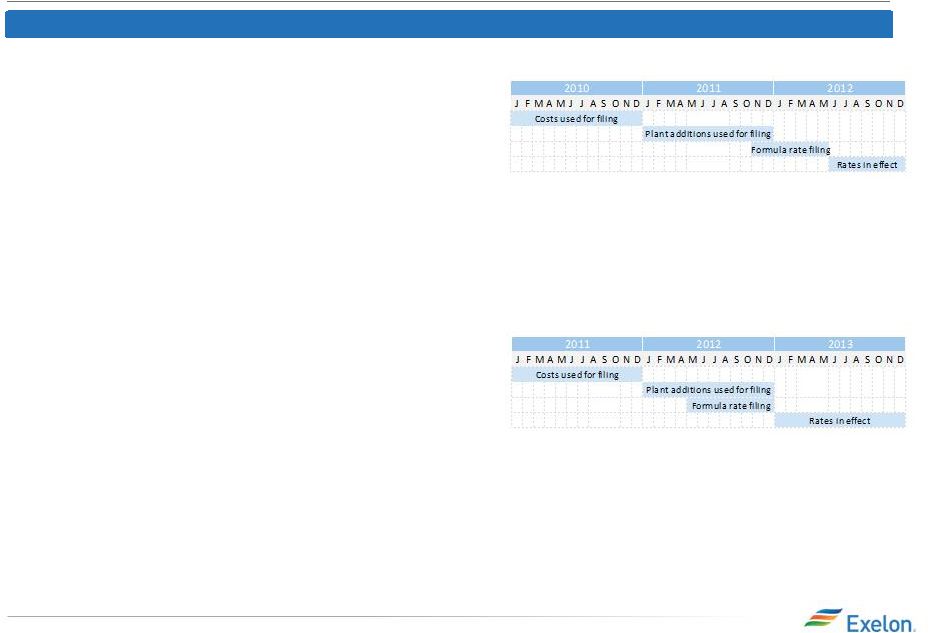 9 ComEd Distribution Rate Case Update 2011 Formula Rate Filing (Docket # 11-0721 filed 11/8/11; rates eff. June 2012) • Based on 2010 calendar year costs and 2011 net plant additions • Supported $59M distribution revenue requirement reduction • 10.05% ROE (2010 Treasury yield of 4.25% + 580 basis point risk premium) ICC Final Order (issued 5/30/12): • $168M revenue requirement reduction; incremental reduction includes: – ~$50M related to costs ICC determined should be recovered through alternative rate recovery tariffs or reflected in reconciliation proceeding; primarily delays timing of cash flows – ~$35M reflects disallowance of return on pension asset – ~$10M reflects incentive compensation related adjustments – ~$15M reflects various adjustments for cash working capital, operating reserves and other technical items • ComEd requested and the ICC granted expedited rehearing on the pension, interest rate and average rate base issues; Commission Final Order expected by Sept. 19 2012 Formula Rate Filing (Docket # 12-0321 filed 4/30/12, rates eff. Jan 2013) • 2012 plan year based on 2011 actual costs and 2012 net plant additions – 9.71% ROE (2011 Treasury yield of 3.91% + 580 basis point risk premium) • Reconciled 2011 revenue requirements in effect to 2011 actual costs incurred – 9.81% ROE (3.91% +590 basis point risk premium) (1) • Initial filing supported $106M distribution revenue requirement increase relative to Dec. 2012 rates as ComEd initially proposed. When factoring in 5/30/12 order for #11-0721, ComEd proposed a $34M reduction • Received staff and intervener testimony on 7/17/12 • ICC order by year end; rates effective January 2013 Summary of Filings (1) 590 basis point premium applies only to 2011 revenue reconciliation. All subsequent revenue reconciliations will assume a 580 basis point premium. Staff proposes an additional $35M reduction beyond ComEd’s filing • |
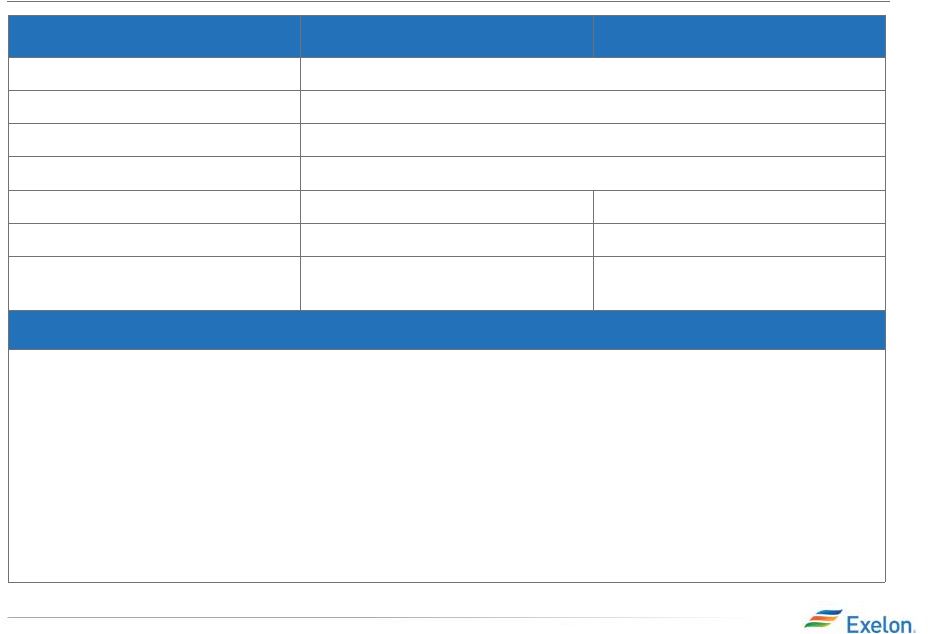 10 BGE Rate Case Overview Rate Case Request Electric Gas Docket # 9299 Test Year October 2011 – September 2012 Common Equity Ratio 48.4% Requested Returns ROE: 10.5%; ROR: 8.02% Rate Base $2.7B $1B Revenue Requirement Increase $151M $53M Proposed Distribution Price Increase as % of overall bill 4% 7% Timeline •10/12/12: Staff/Intervenors file direct testimony •10/22/12: Update 8 months actual/4 month estimated test period data with actuals for last 4 months (June-Sept. 2012) •11/9/12: BGE and staff/intervenors file rebuttal testimony •11/20/12: Staff/Intervenors and BGE file surrebuttal testimony •12/3/12 – 12/18/12: Hearings •1/11/13: Initial Briefs •1/23/13: Reply Briefs •2/23/13: Decision •New rates are in effect shortly after the decision |
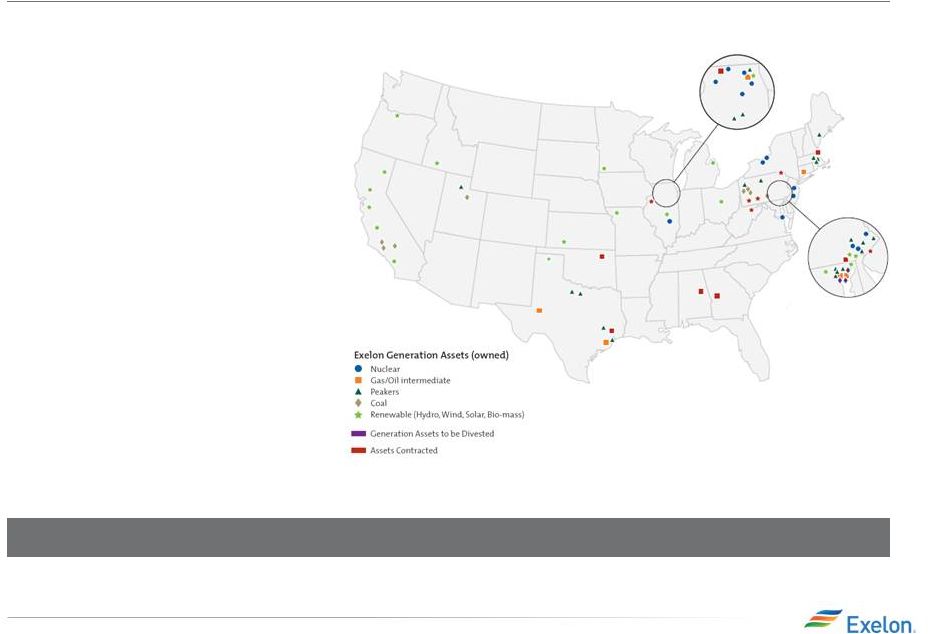 11 Exelon Generation Fleet Generation fleet uniquely diversified across regions and technologies National Scope • Power generation assets in 20 states and Canada Large and Diverse • 35 GW of diverse generation (1) – 19 GW of Nuclear – 10 GW of Gas – 2 GW of Hydro – 2 GW of Oil – 1 GW of Coal – 1 GW of Wind/Solar/Other Clean • One of nation’s cleanest fleets as measured by CO2, SO2 and NOx intensity (1) Total owned generation capacity as of 4/30/2012 for legacy Exelon and legacy Constellation combined, net of physical market mitigation of 2,648 MW. Nuclear capacity reflects EXC ownership of CENG and Salem. Coal capacity shown does not include Eddystone 2 (309 MW) retired on 6/1/2012. |
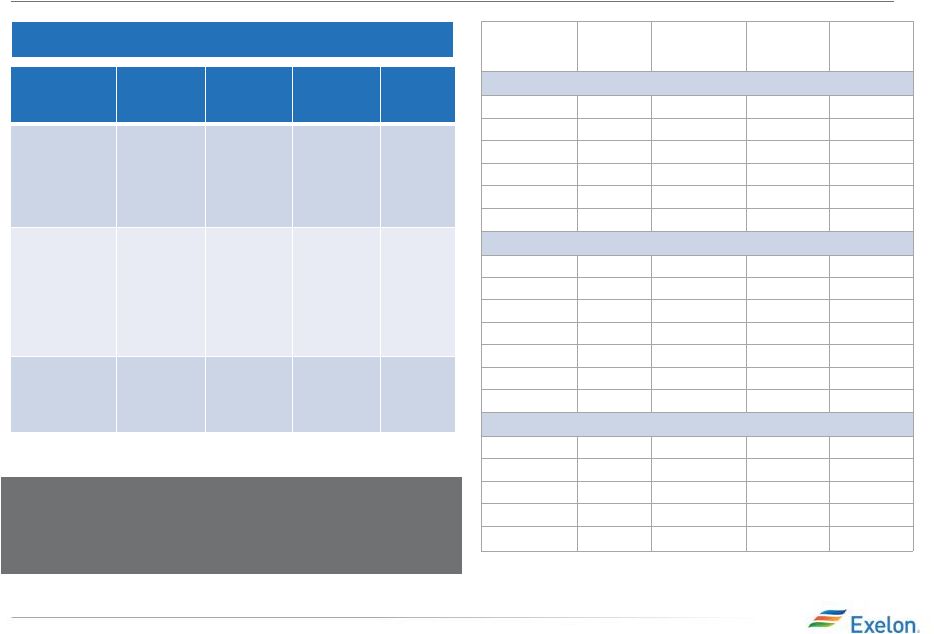 12 Growing Clean Generation with Uprates Station Base Case MW (3) Max Potential MW (3) MW Onlne to Date Year of Full Operation by Unit (1) MW Recovery & Component Upgrades: Quad Cities 99 99 99 2011 / 2010 Dresden 3 3 2013 / 2012 Peach Bottom 29 30 15 2011 / 2012 Dresden 106 110 62 2011 / 2013 Limerick 6 6 3 2012 / 2013 Peach Bottom 2 2 2014 / 2015 MUR: LaSalle 39 39 39 2010 / 2011 Limerick 30 30 30 2011 / 2011 Braidwood 34 42 2012 / 2012 Byron 34 42 2012 / 2012 Quad Cities 21 23 2014 / 2014 Dresden 28 31 2014 / 2015 TMI 12 15 2014 EPU: Clinton 2 2 2 2010 Peach Bottom 130 137 2015 / 2016 LaSalle 303 336 2018 / 2017 Limerick 306 340 2016 / 2017 Total 1,184 250 (1) Includes deferral of LaSalle EPU. (2) In 2012 dollars. Overnight costs do not include financing costs or cost escalation. (3) Adjusted for actual MW’s achieved. Estimated IRR Overnight Cost (2) Approval Process Project Duration Megawatt Recovery & Component Upgrades 11-14% $860 M Not required 3-4 Years MUR (Measurement Uncertainty Recapture) 12-16% $340 M Straight forward approval process 2-3 Years EPU (Extended Power Uprate) 9-13% $2,260 M Straight forward approval process 3-6 Years Executing uprate projects across our geographically diverse nuclear fleet – planned to add 85 MW’s in 2012 Nuclear Uprate Program Summary (1) 1,287 |
 13 Well Positioned for Clean Air Rules A clean and diverse portfolio that is well positioned for environmental upside from EPA regulations (1) Total owned generation capacity as of 4/30/2012 for legacy Exelon and legacy Constellation combined, net of physical market mitigation of 2,648 MW. (2) Nuclear capacity shown above reflects EXC ownership of CENG and Salem. (3) Coal capacity shown above does not include Eddystone 2 (309 MW) retired on 6/1/2012. • Largest clean merchant generation portfolio in the nation • Less than 5% of combined generation capacity will require capital expenditures to comply with Air Toxic rules • Low-cost generation capacity provides unparalleled leverage to rising commodity prices Total Generation Capacity (1) : ~ 34,660 MW 6% Hydro Wind/Solar/Other Gas 28% Oil 4% Coal (3) 4% Nuclear (2) 55% – Approx. $200 million of CapEx, majority of which is at Conemaugh (Exelon ownership share ~31%) 3% Combined Company Portfolio |
 14 ExGen Disclosures June 30, 2012 |
 15 Margins move from new business to MtM of hedges over the course of the year as sales are executed Margins move from “Non power new business” to “Non power executed” over the course of the year Gross margin linked to power production and sales Open Gross Margin MtM of Hedges (2) “Power” New Business “Non Power” Executed “Non Power” New Business •Generation Gross Margin at current market prices, including capacity & ancillary revenues •Exploration and Production •PPA Costs & Revenues •Provided at a consolidated level for all regions (includes hedged gross margin for South, West & Canada (1) ) •MtM of power, capacity and ancillary hedges, including cross commodity, retail and wholesale load transactions •Provided directly at a consolidated level for five major regions. Provided indirectly for each of the five major regions via EREP, reference price, hedge %, expected generation •Retail, Wholesale planned gas sales •Load Response •Energy Efficiency •GE Home •Distributed Solar •Portfolio Management / origination fuels new business •Proprietary trading (3) Gross margin from other business activities •Retail, Wholesale planned electric sales •Portfolio Management new business •Mid marketing new business •Retail, Wholesale executed gas sales •Load Response •Energy Efficiency •BGE Home •Distributed Solar Components of Gross Margin Categories (1) Hedged gross margins for South, West & Canada region will be included with Open Gross Margin, and no expected generation, hedge %, EREP or reference prices provided for this region. (2) MtM of hedges provided directly for the five larger regions. MtM of hedges is not provided directly at the regional level but can be easily estimated using EREP, reference price and hedged MWh. (3) Proprietary trading gross margins will remain within “Non Power” New Business category and not move to “Non Power” Executed category. |
 16 ExGen Disclosures 2012 (2) 2013 2014 Open Gross Margin (including South, West & Canada hedged GM) (3,4) $4,450 $5,400 $5,850 Mark to Market of Hedges (5) $3,100 $1,650 $600 Power New Business / To Go $100 $550 $850 Non-Power Margins Executed $250 $100 $100 Non-Power New Business / To Go $150 $500 $500 Total Gross Margin $8,050 $8,200 $7,900 (1) Gross margin rounded to nearest $50M. (2) Stub period calculated by excluding Jan 2012 thru mid-March 2012 for Constellation only. (3) Excludes Maryland assets divested in 2012. 2012 2013 2014 Henry Hub Natural Gas ($/MMbtu) $2.72 $3.58 $3.95 Midwest: NiHub ATC prices ($/MWh) $27.17 $28.85 $30.57 Mid-Atlantic: PJM-W ATC prices ($/MWh) $32.35 $36.25 $38.42 ERCOT-N ATC Spark Spread ($/MWh) HSC Gas, 7.2HR, $2.50 VOM $12.19 $7.44 $6.48 New York: NY Zone A ($/MWh) $29.55 $31.45 $32.99 New England: Mass Hub ATC Spark Spread($/MWh) ALQN Gas, 7.5HR, $0.50 VOM $6.17 $4.93 $4.20 (4) Includes CENG Joint Venture. (5) Mark to Market of Hedges assumes mid-point of hedge percentages. (6) Based on June 29, 2012 market conditions. Reference Prices (6) Gross Margin Category ($ MM) (1) |
 17 ExGen Disclosures Generation and Hedges 2012 (1) 2013 2014 Exp. Gen (GWh) (4) 219,600 216,900 209,200 Midwest 101,000 97,600 97,600 Mid-Atlantic (2,3) 71,900 73,600 71,400 ERCOT 19,900 17,800 15,400 New York (3) 13,400 13,600 10,700 New England 13,400 14,300 14,100 % of Expected Generation Hedged (5) 99-102% 79-82% 46-49% Midwest 98-101% 80-83% 47-50% Mid-Atlantic (2,3) 102-105% 78-81% 49-52% ERCOT 96-99% 70-73% 39-42% New York (3) 101-104% 85-88% 38-41% New England 96-99% 79-82% 41-44% Effective Realized Energy Price ($/MWh) (6) Midwest 40.50 39.00 36.00 Mid-Atlantic (2,3) 53.50 49.00 48.00 ERCOT 7 9.00 7.00 4.00 New York (3) 45.00 37.00 37.50 New England (7) 7.50 7.00 4.00 (1) Stub period calculated by excluding Jan 2012 thru mid-March 2012 for Constellation only. (2) Excludes Maryland assets divested in 2012. (3) Includes CENG Joint Venture. (4) Expected generation represents the amount of energy estimated to be generated or purchased through owned or contracted for capacity. Expected generation is based upon a simulated dispatch model that makes assumptions regarding future market conditions, which are calibrated to market quotes for power, fuel, load following products and options. Expected generation assume 10 refueling outages in 2012 and 2013 and 11 refueling outages in 2014 at Exelon-operated nuclear plants and Salem but excludes CENG. Expected generation assumes capacity factors of 93.1%, 93.3% and 93.8% in 2012, 2013 and 2014 at Exelon-operated nuclear plants excluding Salem and CENG. These estimates of expected generation in 2012, 2013 and 2014 do not represent guidance or a forecast of future results as Exelon has not completed its planning or optimization processes for those years. (5) Percent of expected generation hedged is the amount of equivalent sales divided by expected generation. Includes all hedging products, such as wholesale and retail sales of power, options and swaps. Uses expected value on options. (6) Effective realized energy price is representative of an all-in hedged price, on a per MWh basis, at which expected generation has been hedged. It is developed by considering the energy revenues and costs associated with our hedges and by considering the fossil fuel that has been purchased to lock in margin. It excludes uranium costs and RPM capacity revenue, but includes the mark-to-market value of capacity contracted at prices other than RPM clearing prices including our load obligations. It can be compared with the reference prices used to calculate open gross margin in order to determine the mark-to-market value of Exelon Generation's energy hedges. (7) Spark spreads shown for ERCOT and New England. |
 18 ExGen Hedged Gross Margin Sensitivities Henry Hub Natural Gas ($/MMbtu) (2) + $1/MMbtu $(65) $120 $490 - $1/MMbtu $75 $(100) $(430) NiHub ATC Energy Price + $5/MWh $5 $85 $280 - $5/MWh $(5) $(85) $(275) PJM-W ATC Energy Price (2) + $5/MWh $(15) $80 $190 - $5/MWh $15 $(80) $(185) NYPP Zone A ATC Energy Price + $5/MWh $5 $10 $45 - $5/MWh $(5) $(10) $(45) Nuclear Capacity Factor (3) +/- 1% +/- $15 +/- $40 +/- $40 Gross Margin Sensitivities (With Existing Hedges) (1,4) 2012 2013 2014 (1) Based on June 29, 2012 market conditions and hedged position. Gas price sensitivities are based on an assumed gas-power relationship derived from an internal model that is updated periodically. Power prices sensitivities are derived by adjusting the power price assumption while keeping all other prices inputs constant. Due to correlation of the various assumptions, the hedged gross margin impact calculated by aggregating individual sensitivities may not be equal to the hedged gross margin impact calculated when correlations between the various assumptions are also considered. (2) Excludes Maryland assets divested in 2012. (3) Includes CENG Joint Venture. (4) Sensitivities based on commodity exposure which includes open generation and all committed transactions. |
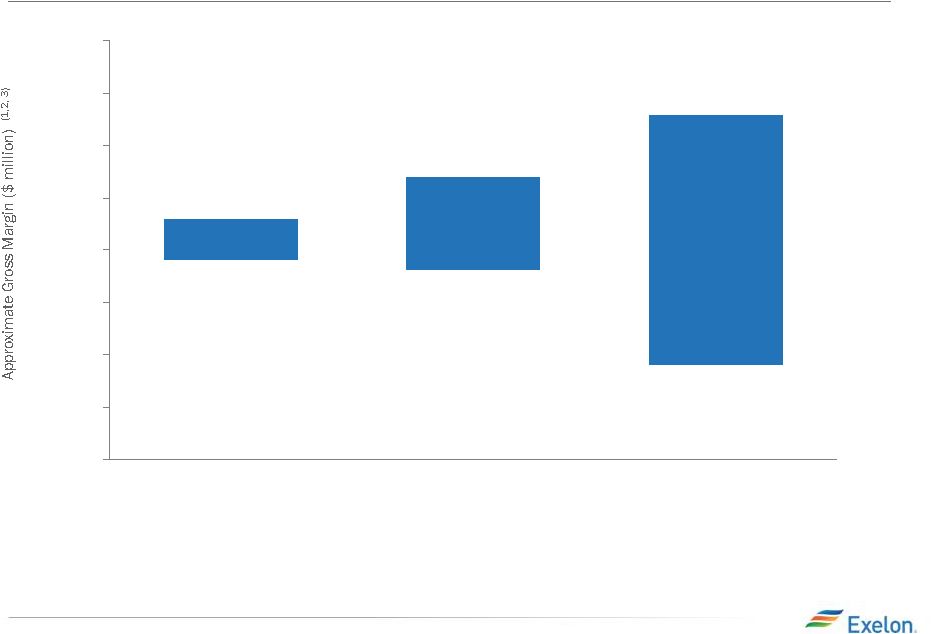 19 Exelon Generation Hedged Gross Margin Upside/Risk 6,000 6,500 7,000 7,500 8,000 8,500 9,000 9,500 10,000 2014 2013 2012 $8,200 $7,900 $8,700 $7,800 $9,300 $6,900 (1) Represents an approximate range of expected gross margin, taking into account hedges in place, between the 5th and 95th percent confidence levels assuming all unhedged supply is sold into the spot market. Approximate gross margin ranges are based upon an internal simulation model and are subject to change based upon market inputs, future transactions and potential modeling changes. These ranges of approximate gross margin in 2013 and 2014 do not represent earnings guidance or a forecast of future results as Exelon has not completed its planning or optimization processes for those years. The price distributions that generate this range are calibrated to market quotes for power, fuel, load following products and options as of June 29, 2012. (2) Gross Margin Upside/Risk based on commodity exposure which includes open generation and all committed transactions. (3) Excludes Maryland assets divested in 2012. |
 20 Illustrative Example of Modeling Exelon Generation 2013 Gross Margin Row Item Midwest Mid- Atlantic ERCOT New York New England South, West & Canada (A) Start with fleet-wide open gross margin $5.4 billion (B) Expected Generation (TWh) 97.6 73.6 17.8 13.6 14.3 (C) Hedge % (assuming mid-point of range) 81.5% 79.5% 71.5% 86.5% 80.5% (D=B*C) Hedged Volume (TWh) 79.5 58.5 12.7 11.9 11.7 (E) Effective Realized Energy Price ($/MWh) $39.00 $49.00 $7.00 $37.00 $7.00 (F) Reference Price ($/MWh) $28.85 $36.25 $7.44 $31.45 $4.93 (G=E-F) Difference ($/MWh) $10.15 $12.75 ($0.44) $5.55 $2.07 (H=D*G) Mark-to-market value of hedges ($ million) (1) $810 million $745 million ($5) million $65 million $25 million (I=A+H) Hedged Gross Margin ($ million) $7,050 million (J) Power New Business / To Go ($ million) $550 million (K) Non-Power Margins Executed ($ million) $100 million (L) Non-Power New Business / To Go ($ million) $500 million (N=I+J+K+L) Total Gross Margin $8,200 million (1) Mark-to-market rounded to the nearest $5 million. |