 Edison Electric Institute Financial Conference November 12 – 13, 2012 Exhibit 99.1 |
 2012 EEI Conference 1 Cautionary Statements Regarding Forward-Looking Information This presentation contains certain forward-looking statements within the meaning of the Private Securities Litigation Reform Act of 1995, that are subject to risks and uncertainties. The factors that could cause actual results to differ materially from the forward-looking statements made by Exelon Corporation, Commonwealth Edison Company, PECO Energy Company, Baltimore Gas and Electric Company and Exelon Generation Company, LLC (Registrants) include those factors discussed herein, as well as the items discussed in (1) Exelon’s 2011 Annual Report on Form 10-K in (a) ITEM 1A. Risk Factors, (b) ITEM 7. Management’s Discussion and Analysis of Financial Condition and Results of Operations and (c) ITEM 8. Financial Statements and Supplementary Data: Note 18; (2) Constellation Energy Group’s 2011 Annual Report on Form 10-K in (a) ITEM 1A. Risk Factors, (b) ITEM 7. Management’s Discussion and Analysis of Financial Condition and Results of Operations and (c) ITEM 8. Financial Statements and Supplementary Data: Note 12; (3) the Registrant’s Third Quarter 2012 Quarterly Report on Form 10-Q in (a) Part II, Other Information, ITEM 1A. Risk Factors; (b) Part 1, Financial Information, ITEM 2. Management’s Discussion and Analysis of Financial Condition and Results of Operations and (c) Part I, Financial Information, ITEM 1. Financial Statements: Note 16; and (4) other factors discussed in filings with the SEC by the Registrants. Readers are cautioned not to place undue reliance on these forward-looking statements, which apply only as of the date of this presentation. None of the Registrants undertakes any obligation to publicly release any revision to its forward- looking statements to reflect events or circumstances after the date of this presentation. |
 2 Financial Discipline & Flexibility Financial Action Summary Operational Efficiencies Cost Management • Identified additional cost savings of $50 million per year beginning in 2014, in addition to $500 million merger run rate synergies (1) Financial Tools Financial Flexibility • Optimized nuclear fuel inventory expenditures for cash savings of $400 million from 2013-2016 (2) (incorporated in 2012 Analyst Day CapEx schedule) • Investments in upstream gas business and utility scale solar will be funded off-credit where possible • Evaluating project financing options for Exelon Wind portfolio Defer Growth Projects • Deferred ~$1.0B of nuclear uprate spend to align with expected market recovery • LaSalle EPU 4-year deferral (additional two years since 2012 Analyst Day announcement) • Limerick EPU 4-year deferral Maintaining investment grade credit rating and dividend are our top priorities (1) Run rate target for O&M synergies from 2014 onwards. 2012 EEI Conference (2) Includes reduction in nuclear fuel capital expenditures related to the 4 year deferral of LaSalle and Limerick EPU projects. Eliminated undesignated renewable spend of ~$1.3 billion in 2013-2015 Note: EPU = Extended Power Uprate. |
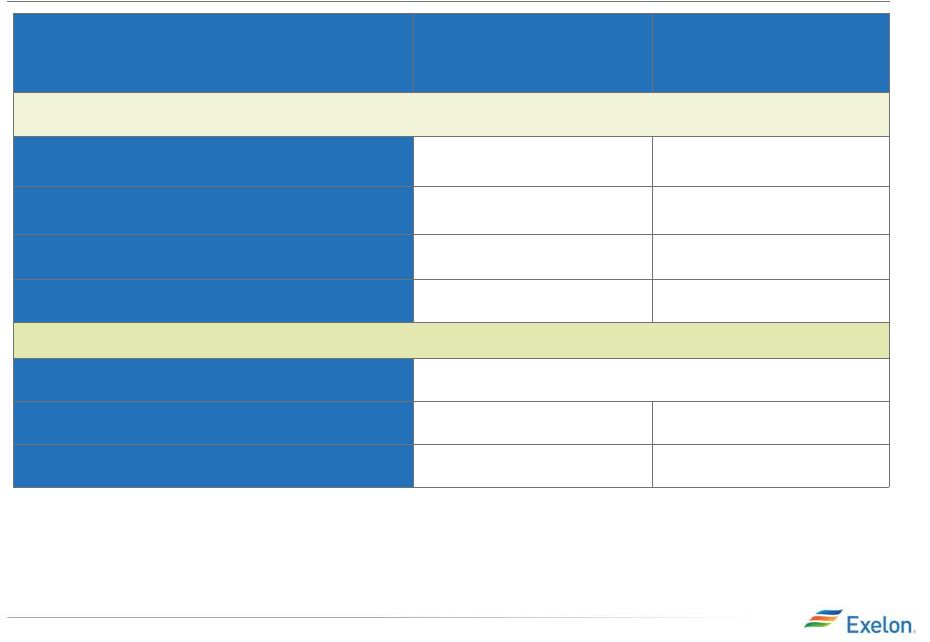
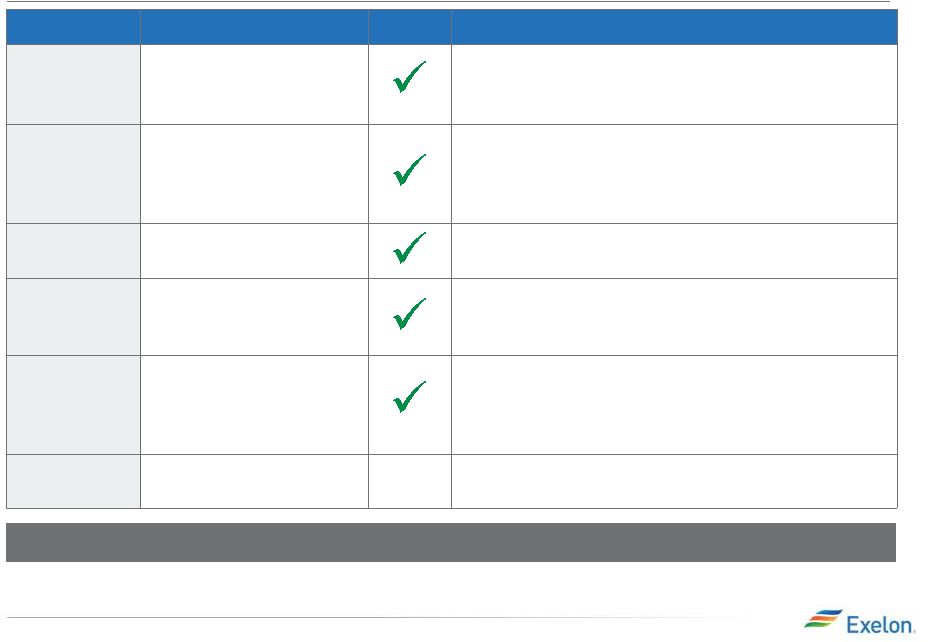 3 Merger Checklist Update Item Target Status Highlights O&M Synergies $500 million run rate beginning in 2014 (1) • On track to meet $170 million 2012 target and $550 (2) million run rate synergy target for 2014 • Unregulated business comprises ~75% of target Liquidity Reduction $4.2 billion year-end 2012 • • Gross Margin Opportunities $100 million run rate (4) • On track to meet $100 million run rate synergies starting in 2014 Asset Sales Process Execute sales agreement by August 2012 • Executed sales agreement on August 9 for ~$400 million, plus tax benefits of $225 million; expect to close transaction in 4Q 2012 BGE File rate case in 2 half of 2012 • Filed rate case on July 27 , 2012 and expect order from MD PSC by February 2013 • Filing reflects a $176M increase in revenue requirements for both electric and gas Commercial Load Growth ~20% growth in volumes from 2011 - 2014 • Lower volume growth as a consequence of significant competition but disciplined pricing (3) As of 9/30/2012. (4) (1) Run rate target for O&M synergies from 2014 onwards. (2) We are successfully executing on the merger 2012 EEI Conference nd Includes additional $50M run rate cost savings disclosed in 3Q12 earnings materials. Gross Margin opportunities on a run rate basis from 2014 onwards from combining the two commercial portfolios. Amended and extended existing $7 billion in credit facilities across all OpCos until 2017 th th On track to eliminate legacy CEG credit facilities of $4.2 billion, with $2.7 billion reduced year to date (3) |
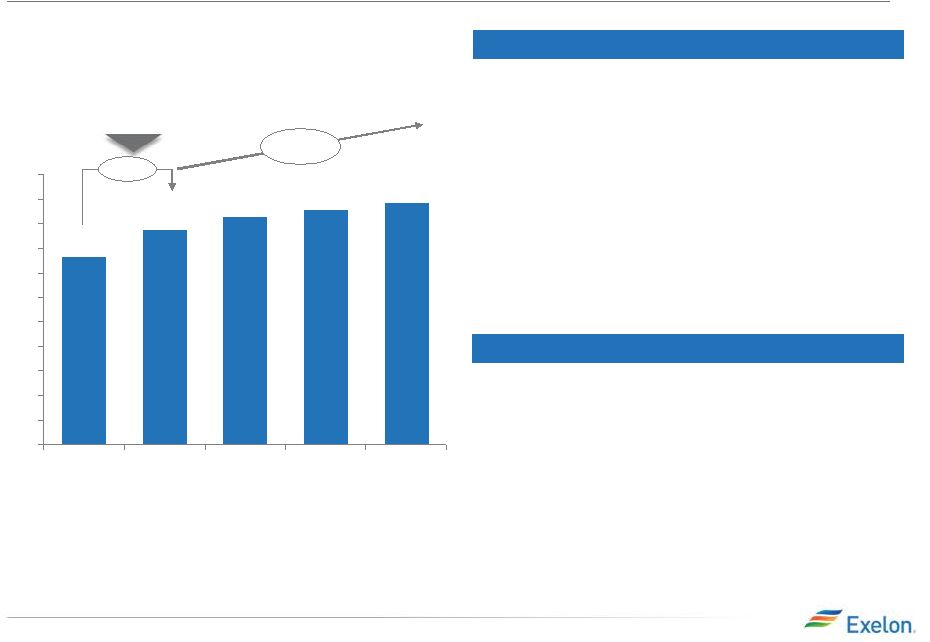
 4 Exelon Generation: Load Serving Update Retail Landscape • Expected load growth of 1% across the U.S. • Switched market expected to grow by approximately 11% in C&I from 2011 to 2015 • Switched market expected to grow by approximately 22% in residential from 2011 to 2015 Strategy • Serve new customers as existing markets grow and new markets open - Retail expected to grow at ~11% CAGR for 2011-2015 - Wholesale expected to remain static starting in 2013 • Improve market share in existing markets • Cross sell suite of products to existing customers to create higher retention • Leverage operational efficiency and national footprint Execution • Recently, the market has been impacted by increased competition and aggressive pricing • Our disciplined approach to pricing has led to a reduction in expected volumes and margins • Various channels to market are available to optimize our generation 2012E 30-40% 60-70% 165 175 2013E 25-35% 185 2015E 2014E 20-30% 170 55-65% 35-45% 2011A 170 90 Wholesale Load Total Contracted Retail Load Retail & Wholesale Load (TWh) (1) 65-75% 70-80% (2) 2012 EEI Conference 0 50 100 150 200 +9% (1) Numbers and percentages are rounded to the nearest 5. (2) Index load expected to be 20% to 30% of total forecasted retail load. 80 |
 Exelon Generation: Regulatory Priorities 5 Exelon is heavily engaged in advocating positions that enhance the integrity of competitive markets and shareholder value 2012 EEI Conference • PJM – Restructured Minimum Offer Price Rules (MOPR) - Proposed modifications will enhance clarity and appropriately apply minimum offer rule to subsidized projects - Modifications positioned to be implemented in advance of May 2013 PJM capacity auction • ERCOT – Market Redesign - Forward capacity market remains a long-term option to assure resource adequacy - In October, the PUCT voted to increase price caps (as an “interim” step) from $4,500/MWh to: • $5,000/MWh (beginning June 1, 2013) • $7,000/MWh (beginning June 1, 2014) • $9,000/MWh (beginning June 1, 2015) |
 2012 EEI Conference 6 Executing Plan for Stronger Future •Strong financial performance in 2012 •Successfully executing on the merger and meeting commitments •Growing utility rate base in a prudent manner •Expecting $3 - $6/MWh upside in forward power prices as a result of plant retirements, higher operating costs for compliance and a disconnect between heat rates and gas prices •Extracting value out of load serving business in a tough, competitive pricing environment •Anticipating positive enhancements in the regulatory arena, particularly with the PJM MOPR •Prioritizing capital allocation in order to maintain investment grade ratings and provide time for a power market recovery to support the dividend |
 Financial Update |
 8 2012 Earnings Guidance 2012 Prior Guidance (prior to 3Q earnings call) $2.55 - $2.85 (1) $1.75 - $1.95 $0.30 - $0.40 $0.40 - $0.50 $0.05 - $0.15 HoldCo ExGen ComEd PECO BGE (1) 2012 Revised Guidance (disclosed at 3Q earnings call) $2.75 - $2.95 (1) $1.85 - $1.95 $0.45 - $0.50 $0.40 - $0.50 $0.05 - $0.10 HoldCo ExGen ComEd PECO BGE 2012 EEI Conference 2012 guidance includes Constellation Energy and BGE earnings for March 12 – December 31, 2012. Based on expected 2012 average outstanding shares of 819M. Earnings guidance for OpCos may not add up to consolidated EPS guidance. Key Drivers of Change in Full-Year Guidance • Impact of ICC Rehearing Order on ComEd’s earnings • Higher than expected RNF at ExGen in 3Q 2012 • Cost impact of Hurricane Sandy |
 Cost Synergies Update O&M Savings ($M) Run Rate O&M Synergies Breakdown Run rate O&M synergies of ~$550M • Key Drivers of run rate O&M synergies include - Labor savings from corporate and commercial consolidations - Reduced collateral requirements - IT systems consolidation - Supply chain savings - Other non-labor corporate synergies On track to achieving merger synergies (1) O&M synergies include cost savings of ~$40M from lower liquidity requirements. Unregulated 77% BGE 7% PECO 7% ComEd 10% 9 2012 EEI Conference $305 $170 2015+ 2014 $550 2013 2012 $50 $500 • On track to meet $170M O&M synergies target for 2012 • Completed activities to enable $275M of the $550M run-rate synergies to date (1) |
 Capital Expenditure Expectations 300 225 100 100 100 50 75 100 2015 2,450 950 975 325 2014 2,475 1,025 1,075 175 2013 2,750 975 925 575 2012 (1) 3,800 975 1,150 625 675 Base Capex Nuclear Fuel MD Commitments Wind Solar Upstream Gas Nuclear Uprates 2015 2,650 1,550 550 225 325 2014 2,525 1,375 550 225 375 2013 2,550 1,350 675 200 325 2012 (1) 2,200 1,400 400 200 200 Electric Distribution Electric Transmission Gas Delivery Smart Grid/Smart Meter (in $M) (in $M) (1) 2012 CapEx includes CEG and BGE from merger close date. 10 2012 EEI Conference Exelon Utilities Exelon Generation |
 2012 Projected Sources and Uses of Cash 11 ($ in Millions) 2012 EEI Conference (1) Exelon beginning cash balance as of 12/31/11. Excludes counterparty collateral activity. (2) Includes $675 million of Constellation net collateral paid to counterparties prior to merger completion. (3) Cash Flow from Operations primarily includes net cash flows provided by operating activities, estimated proceeds from Maryland clean coal fleet divestitures and net cash flows used in investing activities other than capital expenditures. (4) Dividends are subject to declaration by the Board of Directors. (5) Excludes PECO’s $225 million Accounts Receivable (A/R) Agreement with Bank of Tokyo. PECO’s A/R Agreement was extended in accordance with its terms through August 30, 2013. (6) “Other” includes proceeds from options and expected changes in short-term debt. (7) Includes cash flow activity from Holding Company, eliminations, and other corporate entities. Represents Constellation cash flows from merger close through December 31, 2012. Beginning Cash Balance (1) $550 Cash acquired from Constellation (2) 150 n/a n/a 1,375 1,650 Cash Flow from Operations (3) 250 1,175 900 3,475 5,825 CapEx (excluding other items below): (425) (1,225) (350) (975) (3,050) Nuclear Fuel n/a n/a n/a (1,150) (1,150) Dividend (4) (1,725) Nuclear Uprates n/a n/a n/a (300) (300) Wind n/a n/a n/a (625) (625) Solar n/a n/a n/a (675) (675) Upstream n/a n/a n/a (75) (75) Utility Smart Grid/Smart Meter (75) (50) (75) n/a (200) Net Financing (excluding Dividend): Debt Issuances (5) 250 350 350 775 1,725 Debt Retirements (175) (450) (375) (125) (1,125) Project Finance/Federal Financing Bank Loan n/a n/a n/a 375 375 Other (6) -- 25 (25) -- (100) Ending Cash Balance (1) $1,100 (7) |
 Credit Metrics Support Investment-Grade Ratings Moody’s Credit Ratings (1)(2) S&P Credit Ratings (1)(2) Fitch Credit Ratings (1)(2) FFO / Debt Target Range Exelon Corp Baa2 BBB- BBB+ ComEd A3 A- BBB+ 15-18% PECO A1 A- A 15-18% BGE Baa1 BBB+ BBB+ 15-18% Generation Baa1 BBB BBB+ 25-27% (3) (1) Current senior unsecured ratings for Exelon, Exelon Generation and BGE and senior secured ratings for ComEd and PECO as of November 8, 2012. (2) On November 8, 2012 Moody’s affirmed the ratings of Exelon and Generation with a negative outlook, concluding their review for a possible downgrade. ComEd, PECO and BGE ratings have a stable outlook at Moody’s. All ratings at S&P and Fitch have a stable outlook. (3) FFO/Debt Target Range reflects Generation FFO/Debt in addition to the debt obligations of Exelon Corp. Range represents FFO/Debt to maintain current ratings at current business risk. • Committed to maintaining investment-grade ratings • 2012-2015 credit metrics for Exelon Generation/HoldCo at or above target range S&P target of 25-27% for Exelon Generation/HoldCo based on current market conditions 12 2012 EEI Conference Metrics sufficient to maintain investment-grade rating in 5-year financial plan |
 Credit Facility Update •Achieving targeted facility reductions and associated synergies $4.2B reduction in legacy CEG facilities (excluding BGE) on track by 12/31/12 $40M in annual cost savings beginning in 2013 ($35 million in 2012) • Amended and extended existing $7 billion in credit facilities for Exelon Corp, ExGen, PECO and BGE Anticipate ~$20M in savings over life of credit facilities (1) Includes Exelon Generation $5.3B revolver, legacy CEG $2.5B revolver, legacy CEG bilateral agreements of $1.7B, Exelon Corp $0.5B revolver and Exelon Generation $0.3B bilateral agreement $1.5 $6.1 $7.6 12/31/12 Termination of legacy CEG revolver 9/30/12 Liquidity Reduced to Date $2.7 Day 1 Merger Close $10.3 (1) Liquidity sizing supports commercial trading platform and provides ongoing access to substantial liquidity 13 2012 EEI Conference Credit Facility (excluding utilities) |
 Pension and OPEB for Combined Company Plan Design and Funding Strategy: • Plan funding strategies are summarized as follows: For pension, contribute the minimum amounts required under ERISA, including amounts necessary to avoid benefit restrictions and at-risk status as defined by the Pension Protection Act of 2006. For Exelon’s largest pension plan, Exelon expects to contribute the greater of $250M or the minimum amounts required under ERISA beginning annually in 2013. OPEB plans are not subject to regulatory minimum contribution requirements. The contribution strategy for Exelon’s OPEB plans is determined based on benefit claims paid and regulatory implications (amounts deemed prudent to meet regulator expectations and best assure continued recovery), while Constellation’s legacy plans are unfunded. • In July 2012, legislation was passed that provides pension funding relief for certain plans in the near term; the impact of this legislation is included in the forecast and sensitivities. • During the third quarter of 2012, Exelon announced certain plan design changes for its post-retirement benefit plans. The changes are effective beginning in 2014 and their impact has been incorporated in the forecast below. Current Forecast: • The table below provides the combined company’s forecasted 2013 and 2014 pension and OPEB expense and contributions. (1) Pension and OPEB expenses assume an ~ 24% capitalization rate. (2) Contributions shown in the table above are based on the current contribution policy for Exelon and Constellation plans. (3) Expected return on assets for pension is 7.50% (2013) and 7.0% (2014). Expected return on assets for 2013 - 2014 for OPEB is 6.68%. Amounts above assume Exelon achieves its expected return on assets for pension and OPEB in 2012 of 7.50% and 6.68%, respectively. (4) Projected 12/31/12 pension discount rate is 3.87% (Exelon) and 3.67% (Constellation). Projected 12/31/12 OPEB discount rate is 3.96% (Exelon) and 3.69% (Constellation). 14 2013 2014 (in $M) Pre-Tax Expense (1) Contributions (2) Pre-Tax Expense (1) Contributions (2) Pension (3)(4) $430 $265 $455 $280 OPEB (3)(4) $240 $305 $225 $285 Total $670 $570 $680 $565 2012 EEI Conference |
 2013 Pension and OPEB Sensitivities • Tables below provide sensitivities for the combined company’s 2013 pension and OPEB expense and contributions (1) under various discount rate and S&P 500 asset return scenarios 15 2013 Pension Sensitivity (2) (in $M) S&P Returns in Q4 2012 (3) 10% 0% -10% Discount Rate at 12/31/12 Pre-Tax Expense (1) Contributions (2) Pre-Tax Expense (1) Contributions (2) Pre-Tax Expense (1) Contributions (2) Baseline Discount Rate (4) $400 $265 $420 $265 $440 $265 +50 bps $365 $265 $385 $265 $405 $265 - 50bps $445 $265 $465 $265 $485 $265 2013 OPEB Sensitivity (2) (in $M) S&P Returns in Q4 2012 (3) 10% 0% -10% Discount Rate at 12/31/12 Pre-Tax Expense (1) Contributions (2) Pre-Tax Expense (1) Contributions (2) Pre-Tax Expense (1) Contributions (2) Baseline Discount Rate (4) $220 $275 $235 $295 $250 $315 +50 bps $185 $235 $200 $255 $215 $275 - 50bps $255 $320 $270 $340 $285 $360 2012 EEI Conference (1) Contributions shown in the table above are based on the current contribution policy for Exelon and Constellation plans and include the impact of pension funding relief. (2) Pension and OPEB expenses assume an ~ 24% capitalization rate in 2013. (3) Final 2012 asset return for pension and OPEB will depend in part on overall equity market returns for Q4 2012 as proxied by the S&P 500. The amounts above reflect YTD S&P returns through September 30, 2012. (4) The baseline discount rates reflect a projected 12/31/12 pension discount rate of 3.87% and 3.67% for Exelon and Constellation, respectively, and OPEB discount rate of 3.96% and 3.69% for Exelon and Constellation, respectively. |
 2012 EEI Conference 16 Additional 2012 ExGen and CENG Modeling P&L Item 2012 Stub (1) Estimate 2012 Full-Year (2) Estimate ExGen Model Inputs (3) O&M (4) $4,000M $4,250M Taxes Other Than Income (TOTI) $300M $300M Depreciation & Amortization (5) $700M $750M Interest Expense $300M $350M CENG Model Inputs Gross Margin Included in ExGen Disclosures O&M (6) $350M $450M Depreciation & Amortization (7) $100M $100M (1) (2) (3) (4) (5) (6) (7) Stub period represents estimates for March 12 – December 31, 2012 and is reflected as part of ExGen’s 2012 earnings guidance. Full-year estimates provided for modeling purposes. ExGen amounts for O&M, TOTI and Depreciation & Amortization exclude the impacts of CENG. CENG impact is reflected in “Equity earnings of unconsolidated affiliates” in the Income Statement. ExGen O&M excludes decommissioning costs and the impact from O&M related to entities consolidated solely as a result of the application of FIN 46R. ExGen Depreciation & Amortization excludes the impact of decommissioning. CENG O&M includes TOTI of $20M for stub estimate and $25M for full-year estimate. CENG Depreciation & Amortization includes accretion expense. |
 Merger CapEx Synergies & Costs To Achieve $100 2012 $55 2013 $70 $385 Capital O&M $70 $55 $35 2015+ 2014 2013 2012 Run rate CapEx synergies of ~$70M 2012 EEI Conference 17 • On track to achieve CapEx synergies in 2012 and beyond • Run rate CapEx synergies mainly driven by: Information Technology (IT) systems consolidation Supply Chain capital synergies • Costs to achieve excluded from operating earnings • Key areas of costs to achieve: IT systems consolidation Transaction costs (banker, legal costs, etc.) Employee-related costs CapEx Synergies ($M) Costs to Achieve ($M) |
 Debt Maturity Schedule 600 2020 1,600 1,100 500 2019 2018 1,340 500 840 2017 1,166 700 425 41 2016 1,118 75 665 379 2015 1,685 550 260 800 75 2014 1,574 637 250 617 70 2013 1,019 300 252 467 2012 407 375 32 ExGen (2) PECO ComEd Exelon Corp BGE ~64% of 2012 – 2016 debt maturities consist of regulated utility debt (in $M) Debt Maturity Profile (1) (2012-2020) 18 2012 EEI Conference (1) As of 9/30/12 (2) Includes $550M in 2015 and 2020 of inter-company loan agreements between Exelon and Exelon Generation that mirror the terms and amounts of the third party obligations of Exelon. |
 GAAP to Operating Adjustments 19 2012 EEI Conference • Exelon’s 2012 adjusted (non-GAAP) operating earnings outlook excludes the earnings effects of the following: Mark-to-market adjustments from economic hedging activities Unrealized gains and losses from nuclear decommissioning trust fund investments to the extent not offset by contractual accounting as described in the notes to the consolidated financial statements Financial impacts associated with the planned retirement of fossil generating units and the expected sale in the fourth quarter of 2012 of three generating stations as required by the merger Changes in decommissioning obligation estimates Certain costs incurred related to the Constellation merger and integration initiatives Costs incurred as part of Maryland commitments in connection with the merger Non-cash amortization of intangible assets, net, related to commodity contracts recorded at fair value at the merger date Costs incurred as part of a March 2012 settlement with the Federal Energy Regulatory Commission (FERC) related to Constellation’s prior period hedging and risk management transactions Changes in state deferred tax rates resulting from a reassessment of anticipated apportionment of Exelon’s deferred taxes as a result of the merger Non-cash amortization of certain debt recorded at fair value at the merger date expected to be retired in 2013 Certain costs incurred associated with other acquisitions Significant impairments of assets, including goodwill Other unusual items Significant changes to GAAP • Operating earnings guidance assumes normal weather for remainder of the year |
 |
 21 Commercial Business Overview Scale, Scope and Flexibility Across the Energy Value Chain Development and exploration of natural gas and liquids properties 12 assets in seven states ~295 BCFe of proved Reserves (1) Leading merchant power generation portfolio in the U.S. ~35 GW of owned generation capacity (2) Clean portfolio, well positioned for evolving regulatory requirements Industry-leading wholesale and retail sales and marketing platform ~170 TWh of load and ~420 BCF of gas delivered (3) ~ 1 million residential and 100,000 business and public sector customers One of the largest and most experienced Energy Management providers ~1,800 MW of Load Response under contract (4) Over 4,000 energy savings projects implemented across the U.S. Benefiting from scale, scope and flexibility across the value chain (1) Estimated proved reserves as of 12/31/2011. Includes Natural Gas (NG), NG Liquids (NGL) and Oil. NGL and Oil are converted to BCFe at a ratio of 6:1. (2) Total owned generation capacity as of 9/30/2012, net of physical market mitigation (Brandon Shores, C.P. Crane and H.A. Wagner ~2,648 MW). (3) Expected for 2012 as of 9/30/2012. Electric load and gas includes fixed price and indexed products. No stub period adjustment for legacy Constellation contribution. (4) Load Response estimate as of 9/30/2012. 2012 EEI Conference Upstream Exploration & Production Power Generation Electric, Gas Retail & Wholesale Beyond The Meter |
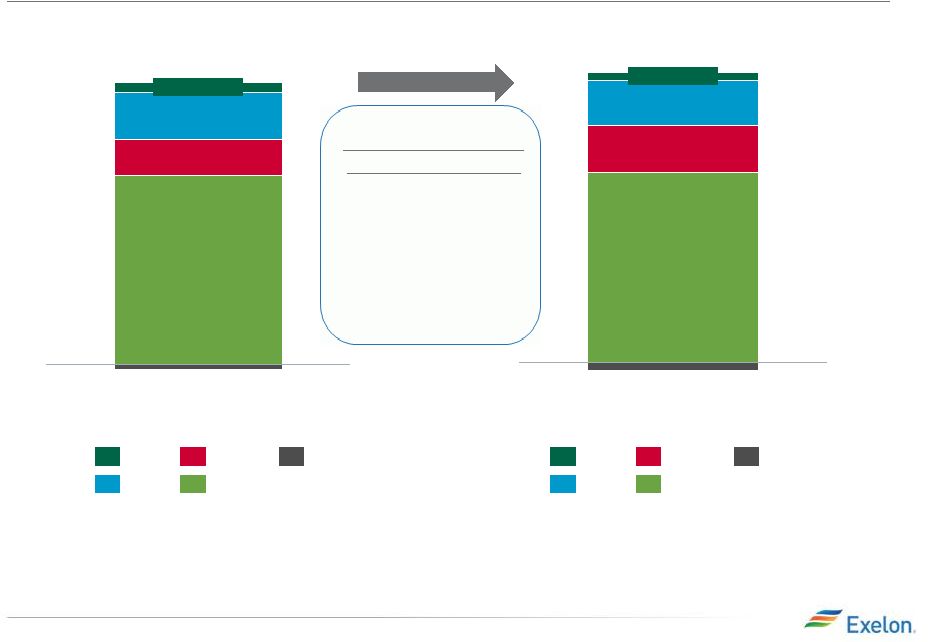
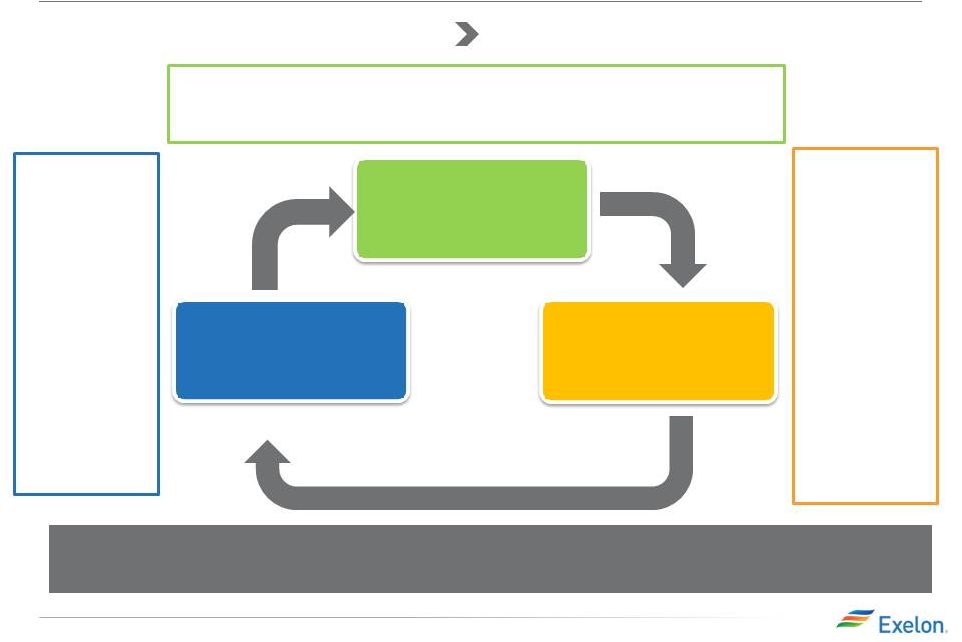 22 Commercial Business Transformation PJM, wholesale marketing focus National, customer-facing business Industry-leading retail platform and portfolio management expertise, combined with one of the lowest cost and best managed generation fleets Expand into new markets Cross sell new products and services Benefit from matching generation and load Capital and collateral efficiency Optimize generation assets/value added forward hedges Leverage relationships with large wholesale customers Monetize risk management expertise ~$8 billion in gross margin per year Low-cost, geographically and technologically diverse generation fleet Unparalleled upside to tightening energy and capacity markets 2012 EEI Conference Leading Merchant Generation Fleet Electric Load Serving Business Portfolio and Risk Management |
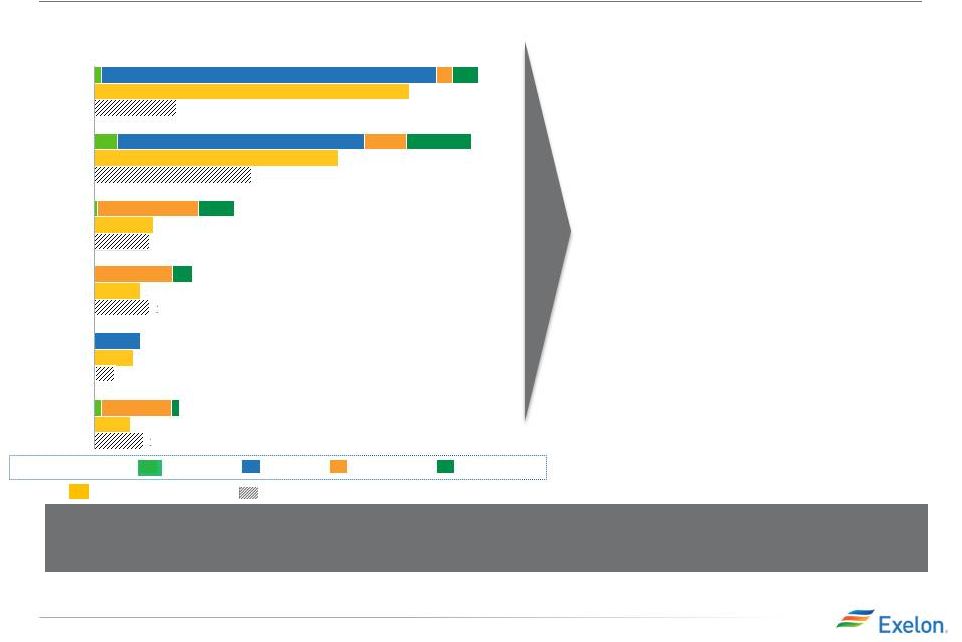 23 Generation and Load Match We have already seen benefits across the portfolio this summer: • Took advantage of large moves in summer heat rates in ERCOT — Sold excess peaking generation at pre- summer higher forward contract prices — Bought back below the cost of our units when actual market heat rates dropped through delivery • Sold load following products against our PJM portfolio through our retail and wholesale load channels 26 ERCOT New England 14 30 New York 43 MidAtlantic 116 MidWest 118 Peaking Intermediate Baseload Renewables The combination establishes an industry-leading platform with regional diversification of the generation fleet and customer-facing load business Generation Capacity, Expected Generation and Expected Load 2013 in TWh (1,2) Expected Load Expected Generation Generation capacity 2012 EEI Conference 15 11 6 12 17 14 17 18 48 75 25 97 South/West/ Canada (1) Owned and contracted generation capacity converted from MW to MWh assuming 100% capacity factor for all technology types, except for renewable capacity which is shown at estimated capacity factor. (2) Expected generation and load shown in the chart above will not tie out with load volume and ExGen disclosures. Load shown above does not include indexed products and generation reflects a net owned and contracted position. Estimates as of 9/30/2012. Generation & Load Match: Competitive Advantage Now able to sell closer to our generation locations reducing risk associated with locational pricing — Generation dispatched due to high summer delivered heat rates and helped serve higher loads from the hot weather — |
 Minimum Offer Price Rules (MOPR) Update 24 PJM is proposing modifications to the MOPR to ensure uneconomic generation does not distort market • Restructured MOPR MOPR to apply to all new gas-fired and IGCC units in PJM, with limited exceptions MOPR exemption to be available only to self-supply entities and competitive market entrants MOPR floor to apply for three years, set at 100% of the net cost of new entry • Implementation/Timing PJM currently reviewing restructured MOPR with all stakeholders PJM expected to file for FERC approval by November 30, 2012 Exelon, other generators, and other stakeholders to support PJM’s filing FERC approval expected in early February, 2013 PJM RPM Auction 2015/16 – May 2012 Stakeholder Discussions - Summer 2012 FERC Filing – November 30, 2012 PJM RPM Auction 2016/17 – Spring 2013 FERC Ruling – February 1, 2013 Note: IGCC = Integrated Gasification Combined Cycle. FERC = Federal Energy Regulatory Commission. RPM= Reliability Pricing Model. 2012 EEI Conference |
 Capacity Markets 25 2011/ 2012 2012/ 2013 2013/ 2014 2014/ 2015 2015/ 2016 PJM (3,8) RTO Capacity 27,400 12,800 11,500 11,500 11,500 Price $110 $16 $28 $126 $136 EMAAC Capacity (4) 9,100 9,100 9,100 9,100 Price $140 $245 $137 $168 MAAC Capacity 2,600 2,700 2,700 2,700 Price $133 $226 $137 $168 SWMAAC Capacity (5) 1,800 1,800 1,800 1,800 Price $133 $226 $137 $168 Average Exelon $110 $78 $142 $132 $153 New England (6) NEMA Capacity 2,100 2,100 2,100 2,100 2,100 Price $104 (7) $85 (7) $85 (7) $107 $114 SEMA Capacity 35 35 35 35 35 Price $104 (7) $85 (7) $85 (7) $95 (7) $104 (7) Rest of Pool Capacity 700 700 700 700 700 Price $104 (7) $85 (7) $85 (7) $95 (7) $104 (7) NYISO (8) Rest of Pool Capacity 1,100 1,100 1,100 1,100 1,100 MISO (9) AMIL Capacity 1,100 1,100 1,100 1,100 1,100 2012 EEI Conference PJM RPM Capacity Revenues $- $200 $400 $600 $800 $1,000 $1,200 $1,400 $- $20 $40 $60 $80 $100 $120 $140 $160 2012 2013 2014 2015 $97 $105 $138 $141 Exelon fleet weighted average price ($/MWd) (2) Revenue ($MM) (1) (1) Revenues reflect capacity cleared in base and incremental auctions and are for calendar years. Revenue rounded to nearest $50M. (2) Weighted average $/MW-Day would apply if all owned generation cleared. (3) Reflects owned and contracted generation Installed Capacity (ICAP) adjusted for mid-year PPA roll offs. (4) ICAP is net of Eddystone 1&2, Cromby 1&2 and Schuykill 1 (total ~ 1,100 MW). (5) ICAP is net of units to be divested (Brandon Shores, Wagner & Crane ~2,648 MW; Constellation offered these units in PY11/12 - PY 15/16 auctions) and Riverside 6 CT (~115MW). (6) Reflects Qualified Summer Capacity including owned and contracted units. (7) Price is pro-rated for auctions that clear at the floor price and there is more capacity procured than suggested by the reliability requirement. (8) Reflects 50.01% ownership in CENG. (9) Does not include wind under PPA. RTO = Regional Transmission Organization, MAAC = Mid-Atlantic Area Council, EMAAC = Eastern Mid-Atlantic Area Council, SWMAAC = South West Mid-Atlantic Area Council, NEMA = North East Massachusetts; SEMA = North East Massachusetts, AMIL = Ameren Illinois. |
 26 Retail and Wholesale Gas Retail Gas (1) (2011 – 2015 Bcf) +18% +14% 480 465 420 Contribution from ONEOK Energy Marketing Company acquisition (1) Estimate as of 9/30/2012. Portfolio Size: • 420 Bcf expected to be served in 2012 • Month by month renewals, with high renewal rates Market Potential: • All states are competitive markets with an estimated total market size of 15,000 Bcf, of which 7,000 Bcf is currently switched Growth Strategy and Objectives: • Looking to grow Northeast gas markets as well as recently acquired ONEOK territories Portfolio Size: • 5 Bcf wholesale storage • 300,000 MMBtu’s per day of term transport • Over 1 Bcf/day of plant supply Growth Strategy and Objectives: • Expand wholesale presence to complement power assets • Increase market knowledge of regional and basis transport information to assist power forecasting 495 2012 EEI Conference 385 0 50 100 150 200 250 300 350 400 450 500 550 2011A 2012E 2013E 2014E 2015E Retail Gas Wholesale Gas |
 27 (1) Oil/NGL conversion to gas is 6:1. (2) Constellation does not operate any of its properties. Note: E&P = Exploration and Production. Upstream E&P Assets Estimated Net Proved Reserves (as of 12/31/11) Average Net Daily Production (Q2 2012) 295 Bcfe 60.3 MMcfe • Our Upstream Gas business achieves strong returns (>12% IRR) • $150m (~50% utilized) Reserve Based Lending (RBL) facility in place — Receives off-balance sheet treatment from S&P • Provides valuable market intelligence in complex natural gas markets Forecasted Production 2012 2013 2014 2015 Net Daily Prod (MMcfe / day) 55 - 70 55 - 70 60 - 75 60 - 75 2012 EEI Conference Mississippi lime (OK) Hunton dewatering (OK) Woodford shale (OK) Eagle Ford shale (TX) Fayetteville shale (AR) Haynesville shale (LA) Floyd shale (AL) Ohio shale (OH) Woodbine shale (TX) Trenton Black River (MI) Current Portfolio Of Investments Investment Thesis |
 28 Exelon Generation Disclosures September 30, 2012 (As disclosed in Third Quarter 2012 Earnings Materials) 2012 EEI Conference |
 29 Portfolio Management Strategy Protect Balance Sheet Ensure Earnings Stability Create Value Exercising Market Views Purely ratable Actual hedge % Market views on timing, product allocation and regional spreads reflected in actual hedge % High End of Profit Low End of Profit % Hedged Open Generation with LT Contracts Portfolio Management & Optimization Portfolio Management Over Time Align Hedging & Financials Establishing Minimum Hedge Targets 2012 EEI Conference Credit Rating Capital & Operating Expenditure Dividend Capital Structure Strategic Policy Alignment •Aligns hedging program with financial policies and financial outlook •Establish minimum hedge targets to meet financial objectives of the company (dividend, investment-grade credit rating) •Hedge enough commodity risk to meet future cash requirements under a stress scenario Three-Year Ratable Hedging •Ensure stability in near-term cash flows and earnings •Disciplined approach to hedging •Tenor aligns with customer preferences and market liquidity •Multiple channels to market that allow us to maximize margins •Large open position in outer years to benefit from price upside Bull / Bear Program •Ability to exercise fundamental market views to create value within the ratable framework •Modified timing of hedges versus purely ratable •Cross-commodity hedging (heat rate positions, options, etc.) •Delivery locations, regional and zonal spread relationships |
 30 Components of Gross Margin Categories Margins move from new business to MtM of hedges over the course of the year as sales are executed Margins move from “Non power new business” to “Non power executed” over the course of the year Gross margin linked to power production and sales Gross margin from other business activities 2012 EEI Conference •Generation Gross Margin at current market prices, including capacity & ancillary revenues, nuclear fuel amortization and fossils fuels expense •Exploration and Production •PPA Costs & Revenues •Provided at a consolidated level for all regions (includes hedged gross margin for South, West & Canada (1) ) •MtM of power, capacity and ancillary hedges, including cross commodity, retail and wholesale load transactions •Provided directly at a consolidated level for five major regions. Provided indirectly for each of the five major regions via EREP, reference price, hedge %, expected generation •Retail, Wholesale planned electric sales •Portfolio Management new business •Mid marketing new business •Retail, Wholesale executed gas sales •Load Response •Energy Efficiency •BGE Home •Distributed Solar •Retail, Wholesale planned gas sales •Load Response •Energy Efficiency •BGE Home •Distributed Solar •Portfolio Management / origination fuels new business •Proprietary trading (3) Open Gross Margin MtM of Hedges (2) “Power” New Business “Non Power” Executed “Non Power” New Business (1) Hedged gross margins for South, West & Canada region will be included with Open Gross Margin, and no expected generation, hedge %, EREP or reference prices provided for this region. (2) MtM of hedges provided directly for the five larger regions. MtM of hedges is not provided directly at the regional level but can be easily estimated using EREP, reference price and hedged MWh. (3) Proprietary trading gross margins will remain within “Non Power” New Business category and not move to “Non power” executed category. |
 31 ExGen Disclosures 2012 EEI Conference Gross Margin Category ($M) (1,2) 2012 (3) 2013 2014 2015 Open Gross Margin (including South, West & Canada hedged GM) (4,5) $4,500 $5,750 $6,050 $6,200 Mark to Market of Hedges (5,6) $3,200 $1,350 $500 $250 Power New Business / To Go $50 $500 $750 $950 Non-Power Margins Executed $300 $150 $100 $50 Non-Power New Business / To Go $100 $450 $500 $550 Total Gross Margin $8,150 $8,200 $7,900 $8,000 Reference Prices (7) 2012 2013 2014 2015 Henry Hub Natural Gas ($/MMbtu) $2.77 $3.84 $4.18 $4.37 Midwest: NiHub ATC prices ($/MWh) $28.95 $30.59 $31.34 $32.32 Mid-Atlantic: PJM-W ATC prices ($/MWh) $33.93 $38.24 $39.44 $40.77 ERCOT-N ATC Spark Spread ($/MWh) HSC Gas, 7.2HR, $2.50 VOM $3.67 $8.37 $8.30 $7.15 New York: NY Zone A ($/MWh) $30.85 $35.19 $35.98 $36.55 New England: Mass Hub ATC Spark Spread($/MWh) ALQN Gas, 7.5HR, $0.50 VOM $6.72 $4.42 $3.79 $4.07 (4) Excludes Maryland assets to be divested. (5) Includes CENG Joint Venture. (6) Mark to Market of Hedges assumes mid-point of hedge percentages. (7) Based on September 30, 2012 market conditions. (1) Gross margin does not include revenue related to decommissioning, Exelon Nuclear Partners and entities consolidated solely as a result of the application of FIN 46R. (2) Gross margin rounded to nearest $50M. (3) Stub period calculated by excluding Jan 2012 through mid-March 2012 for Constellation only. |
 32 ExGen Disclosures Generation and Hedges 2012 (1) 2013 2014 2015 Exp. Gen (GWh) (4) 219,500 218,700 211,400 209,800 Midwest 100,700 97,400 97,500 99,000 Mid-Atlantic (2,3) 71,800 75,000 72,200 71,800 ERCOT 19,900 18,500 16,900 15,800 New York (3) 13,000 13,800 10,900 9,300 New England 14,100 14,000 13,900 13,900 % of Expected Generation Hedged (5) 99-102% 88-91% 56-59% 21-24% Midwest 99-102% 89-92% 56-59% 20-23% Mid-Atlantic (2,3) 99-102% 88-91% 57-60% 24-27% ERCOT 96-99% 78-81% 53-56% 28-31% New York (3) 98-101% 92-95% 61-64% 15-18% New England 97-100% 89-92% 51-54% 11-14% Effective Realized Energy Price ($/MWh) (6) Midwest $42.00 $38.00 $35.00 $34.50 Mid-Atlantic (2,3) $56.00 $48.00 $47.50 $50.50 ERCOT 7 $9.00 $7.50 $5.00 $5.00 New York (3) $44.00 $36.00 $35.00 $52.00 New England (7) $8.00 $7.00 $4.00 $5.00 2012 EEI Conference (1) Stub period calculated by excluding Jan 2012 thru mid-March 2012 for Constellation only. (2) Excludes Maryland assets to be divested (3) Includes CENG Joint Venture. (4) Expected generation represents the amount of energy estimated to be generated or purchased through owned or contracted for capacity. Expected generation is based upon a simulated dispatch model that makes assumptions regarding future market conditions, which are calibrated to market quotes for power, fuel, load following products, and options. Expected generation assumes 10 refueling outages in 2012 and 2013 and 11 refueling outages in 2014 and 2015 at Exelon-operated nuclear plants and Salem but excludes CENG. Expected generation assumes capacity factors of 92.8%, 93.5%, 93.8%, and 93.3% in 2012, 2013, 2014 and 2015 at Exelon-operated nuclear plants excluding Salem and CENG. These estimates of expected generation in 2012, 2013, 2014 and 2015 do not represent guidance or a forecast of future results as Exelon has not completed its planning or optimization processes for those years. (5) Percent of expected generation hedged is the amount of equivalent sales divided by expected generation. Includes all hedging products, such as wholesale and retail sales of power, options and swaps. Uses expected value on options. (6) Effective realized energy price is representative of an all-in hedged price, on a per MWh basis, at which expected generation has been hedged. It is developed by considering the energy revenues and costs associated with our hedges and by considering the fossil fuel that has been purchased to lock in margin. It excludes uranium costs and RPM capacity revenue, but includes the mark-to-market value of capacity contracted at prices other than RPM clearing prices including our load obligations. It can be compared with the reference prices used to calculate open gross margin in order to determine the mark-to-market value of Exelon Generation's energy hedges. (7) Spark spreads shown for ERCOT and New England. |
 33 ExGen Hedged Gross Margin Sensitivities Gross Margin Sensitivities (With Existing Hedges) (1, 4) 2012 2013 2014 2015 Henry Hub Natural Gas ($/MMbtu) (2) $(5) $55 $400 $780 $25 $(15) $(325) $(700) NiHub ATC Energy Price $(5) $40 $230 $390 $5 $(35) $(230) $(385) PJM-W ATC Energy Price (2) $(5) $50 $165 $295 $5 $(40) $(160) $(285) NYPP Zone A ATC Energy Price $5 $15 $35 $45 $(5) $(15) $(35) $(45) Nuclear Capacity Factor (3) +/- 1% +/- $10 +/- $40 +/- $45 +/- $45 2012 EEI Conference (1) Based on September 30, 2012 market conditions and hedged position. Gas price sensitivities are based on an assumed gas-power relationship derived from an internal model that is updated periodically. Power prices sensitivities are derived by adjusting the power price assumption while keeping all other prices inputs constant. Due to correlation of the various assumptions, the hedged gross margin impact calculated by aggregating individual sensitivities may not be equal to the hedged gross margin impact calculated when correlations between the various assumptions are also considered. (2) Excludes Maryland assets to be divested. (3) Includes CENG Joint Venture (4) Sensitivities based on commodity exposure which includes open generation and all committed transactions. + $1/MMbtu - $1/MMbtu + $5/MWh - $5/MWh + $5/MWh - $5/MWh + $5/MWh - $5/MWh |
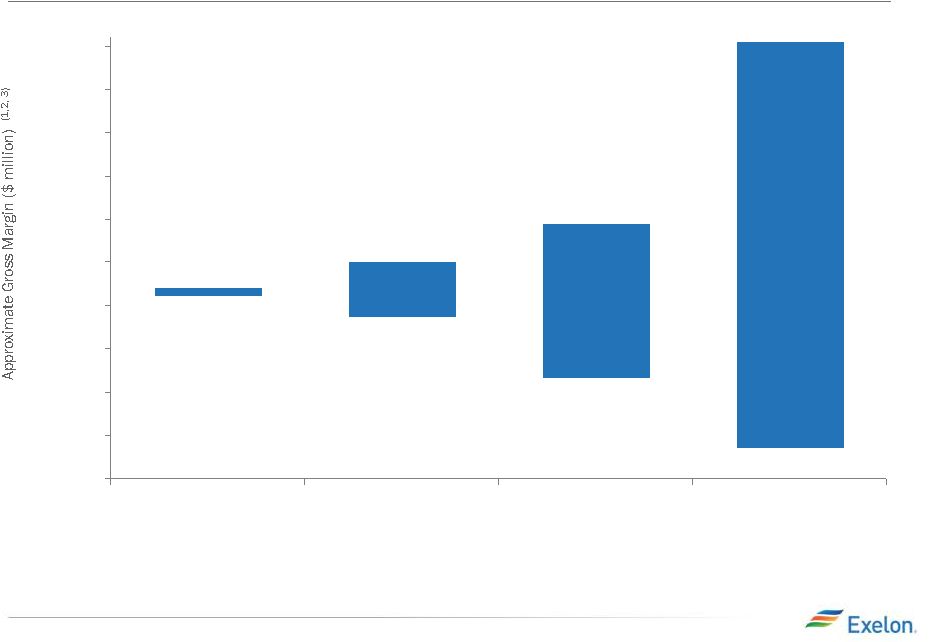 34 Exelon Generation Hedged Gross Margin Upside/Risk $8,200 $8,100 $8,500 $7,850 $8,950 $7,150 2012 EEI Conference 6,000 6,500 7,000 7,500 8,000 8,500 9,000 9,500 10,000 10,500 11,000 2012 2013 2014 2015 $11,050 $6,350 (1) Represents an approximate range of expected gross margin, taking into account hedges in place, between the 5th and 95th percent confidence levels assuming all unhedged supply is sold into the spot market. Approximate gross margin ranges are based upon an internal simulation model and are subject to change based upon market inputs, future transactions and potential modeling changes. These ranges of approximate gross margin in 2013, 2014 and 2015 do not represent earnings guidance or a forecast of future results as Exelon has not completed its planning or optimization processes for those years. The price distributions that generate this range are calibrated to market quotes for power, fuel, load following products, and options as of September 30, 2012 (2) Gross Margin Upside/Risk based on commodity exposure which includes open generation and all committed transactions. (3) Excludes Maryland assets to be divested |
 35 Illustrative Example of Modeling Exelon Generation 2013 Gross Margin Row Item Midwest Mid- Atlantic ERCOT New England New York South, West & Canada (A) Start with fleet-wide open gross margin $5.75 billion (B) Expected Generation (TWh) 97.4 75.0 18.5 14.0 13.8 (C) Hedge % (assuming mid-point of range) 90.5% 89.5% 79.5% 90.5% 93.5% (D=B*C) Hedged Volume (TWh) 88.2 67.1 14.7 12.7 12.9 (E) Effective Realized Energy Price ($/MWh) $38.00 $48.00 $7.50 $7.00 $36.00 (F) Reference Price ($/MWh) $30.59 $38.24 $8.37 $4.42 $35.19 (G=E-F) Difference ($/MWh) $7.41 $9.76 ($0.87) $2.58 $0.81 (H=D*G) Mark-to-market value of hedges ($ million) (1) $655 million $655 million ($15) million $35 million $10 million (I=A+H) Hedged Gross Margin ($ million) $7,100 million (J) Power New Business / To Go ($ million) $500 million (K) Non-Power Margins Executed ($ million) $150 million (L) Non- Power New Business / To Go ($ million) $450 million (N=I+J+K+L) Total Gross Margin $8,200 million (1) Mark-to-market rounded to the nearest $5 million. 2012 EEI Conference |
 36 Constellation Energy Nuclear Group (CENG) Background As a result of Exelon’s equity interest in CENG, CENG gross margins and earnings are reflected in ExGen disclosures and other financial statements. The following is information related to PPA contracts between CENG and 3rd parties and the PPA between CENG and its equity parents. Calvert 1&2 NMP 1 NMP 2 (1) Ginna (2) Ownership Interest Total Plant Capacity 1,705 MW 620 MW 1,138 MW 581 MW Ownership Split 100% CENG 100% CENG 82% CENG / 18% LIPA 100% CENG ExGen Ownership (50.01% of CENG) 852.5 MW 310 MW 466.5 MW 290.5 MW PPA structure (% output) CENG Legacy PPA with Utilities - - See footnote 1 90% < June 2014 0% > June 2014 CENG PPA with Parents 100% 100% 100% 10% < June 2014 100% > June 2014 CENG PPA with Parents 5 year contract extendable at end of each year for additional year - Market based pricing and monthly, rolling 3 year hedge profile (100%, 60%, 30%) 2012 2013 2014 2015 (% of uncommitted output) EDF Trading 15 15 15 N.A. ExGen 85 85 85 N.A. 2012 EEI Conference (1) Nine Mile Point 2 (NMP) has a revenue sharing agreement (via a call option type contract) on 80% of the output. (2) Ginna Legacy PPA at $44/MWh; CENG PPA with parents (ExGen, EDF) at close to market prices and designed to maintain a monthly ratable profile for CENG. |
 37 Constellation Energy Nuclear Group (CENG) Background 2012 EEI Conference ExGen Disclosures Forward Estimates •ExGen forward disclosures reflect the gross position that accrues to ExGen from ownership interest in CENG and PPA with CENG as of a certain date •Open Gross Margin: Reflects proportionate share of CENG revenues and fuel costs, market value of PPA less PPA costs paid by ExGen to CENG •MtM of Hedges: Reflects MtM of any hedges placed by ExGen for managing position arising from ownership interests or PPAs with CENG •Expected Generation: Reflects proportionate ownership in CENG and generation associated with PPA between CENG and ExGen. •Hedge Percentage: Reflects hedges placed by ExGen to hedge exposure arising from CENG position (owned or contracted) •Effective Realized Energy Price: Reflects MtM and hedges from CENG position (owned or contracted) Financial Statements (10-Q, 10-K, Earnings Release tables) Actuals •ExGen actuals reflect equity method accounting treatment for ownership interest in CENG and regular treatment for PPA between ExGen and CENG. •RnF: Includes net PPA gross margin (revenues less costs) between ExGen and CENG. CENG earnings or gross margin are not included, and are instead shown under “CENG equity earnings” on the income statement. •Total Supply: Includes only the generation corresponding to the PPA between ExGen and CENG. •Average Margins ($/MWh): Includes only margins corresponding to PPA between ExGen and CENG as well as any hedges placed by ExGen |
 Exelon Utilities |
 ComEd Distribution Rate Case Overview 2011 Formula Rate Filing (Docket # 11-0721 filed 11/8/11; 2010 test year costs, 2011 plant additions, rates eff. June 2012 – Dec 2012): • Based on 2010 calendar year costs and 2011 net plant additions • Supported $59M distribution revenue requirement reduction • 10.05% ROE (2010 Treasury yield of 4.25% + 580 basis point risk premium) ICC Final Order (issued 5/30/12): • $168M reduction to revenue requirement; incremental reduction includes: ~$50M related to costs ICC determined should be recovered through alternative rate recovery tariffs or reflected in reconciliation proceeding; primarily delays timing of cash flows ~$35M reflects disallowance of return on pension asset ~$10M reflects incentive compensation related adjustments ~$15M reflects various adjustments for cash working capital, operating reserves and other technical items ICC Re-hearing Order (issued 10/3/12) on pension asset, interest rate on reconciliation and average rate base • Granted $35M of prior disallowance related to pension, reflecting an updated total reduction to revenue requirement of $133M Upheld the average rate base decision Order also revised the decision on interest on reconciliation balances, granting a rate equal to the short term debt rate • ComEd filed a notice of appeal with the First Appellate Court on 10/4/12 and a motion to expedite on 10/10/12. The motion to expedite was denied, therefore, initial briefs are due on 12/13/12. 2012 Formula Rate Filing (Docket # 12-0321 filed 4/30/12, 2011 test year costs, 2012 projected plant additions, rates eff. Jan 2013 – December 2013) • 2012 plan year based on 2011 actual costs and 2012 net plant additions 9.71% ROE (2011 Treasury yield of 3.91% + 580 basis point risk premium) • Reconciled 2011 revenue requirements in effect to 2011 actual costs incurred 9.81% ROE (3.91% plus 590 basis point risk premium) (1) • When factoring in 5/30/12 Order and 10/3/12 Re-hearing Order for #11-0721, ComEd proposes a $74M increase to distribution revenue requirement • Received staff and intervener direct testimony on 7/17/12 and rebuttal testimony on 9/11/12 • ICC order by 12/26/12; rates effective January 2013 Summary of Filings (1) 590 basis point premium applies only to 2011 revenue reconciliation. All subsequent revenue reconciliations will assume a 580 basis point premium. 39 2012 EEI Conference |
 40 BGE Rate Case (Updated to reflect 10/22/12 filing) Rate Case Request (1) Electric Gas Docket # 9299 Test Year October 2011 – September 2012 Common Equity Ratio 48.4% Requested Returns ROE: 10.5%; ROR: 7.96% Rate Base $2.7B $1B Revenue Requirement Increase $131M $45M Proposed Distribution Price Increase as % of overall bill 4% 6% Timeline •10/22/12: Update 8 months actual/4 month estimated test period data with actuals for last 4 months (June-Sept. 2012) •11/9/12: BGE and staff/intervenors file rebuttal testimony •11/20/12: Staff/Intervenors and BGE file surrebuttal testimony •12/3/12 – 12/18/12: Hearings •1/11/13: Initial Briefs •1/23/13: Reply Briefs •2/23/13: Decision •New rates are in effect shortly after the decision 2012 EEI Conference Initial filing on 7/27/12 used 8 months of actuals and 4 months of projections for October 2011 – September 2012 time period and requested an ROR of 8.02%, electric revenue increase of $151M and gas revenue increase of $53M. Rate base, equity ratio and ROE have not changed materially since the 7/27/12 filing. (1) |
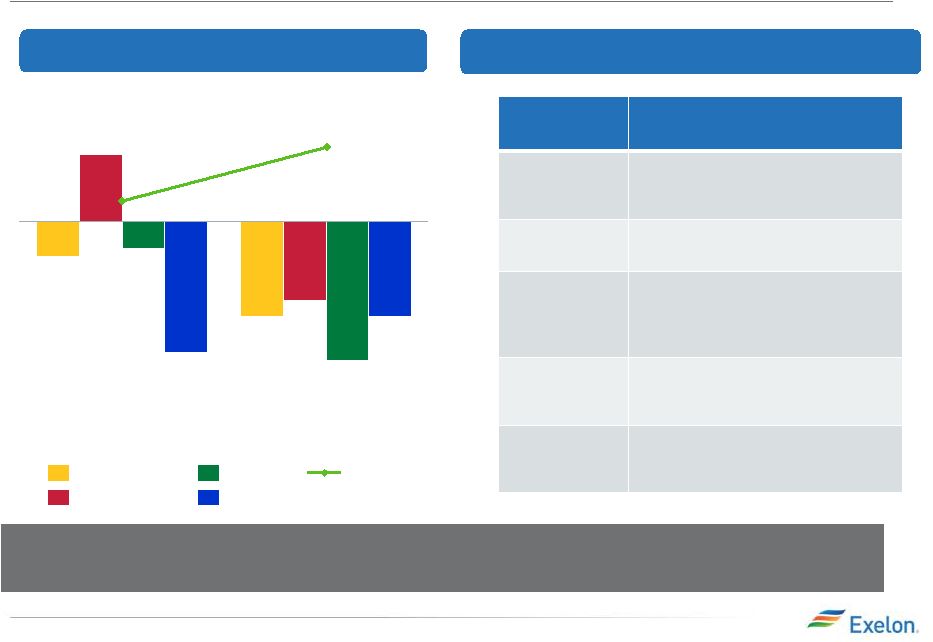
 41 ComEd Load 2012 EEI Conference 2012E -0.3% -0.2% -0.6% -0.3% 1.7% 2011 0.6% -0.8% -1.3% -0.5% 1.4% GMP Large C&I Small C&I Residential All Customers Driver or Indicator 2013 Outlook Gross Metro Product (GMP) 1.5% growth in GMP, which reflects a slow growth economy Employment 1.3% increase in total employment is expected for 2013. Manufacturing Manufacturing employment is expected to grow 2.0% in 2013, which is consistent with the growth in 2011 and 2012. Households Household formations is expected to increase 0.4% in 2013. This is slightly better than the 0.3% growth expected for 2012. Energy Efficiency Continued expansion of EE programs with ~ 1% reduction in usage in 2013. Notes: 2012 data is not adjusted for leap year. Source of 2013 economic outlook data is Global Insight (July 2012). Slow growth economy and energy efficiency initiatives will continue to impact load growth Weather-Normalized Load YoY Growth Economic Forecast of Drivers that Influence Load |
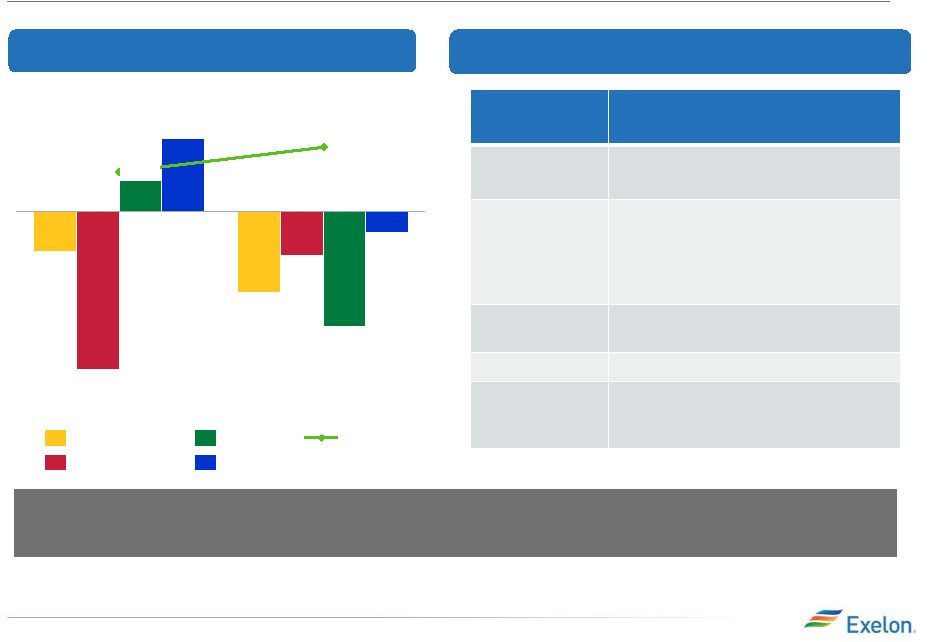
 42 PECO Load 2012E -2.4% -3.5% -2.0% -2.4% 1.9% 2011 -3.3% -0.7% 1.7% -0.9% 0.5% GMP Large C&I Small C&I Residential All Customers Driver or Indicator 2013 Outlook Gross Metro Product (GMP) GMP projected to grow at 1.8% for 2013, vs. pre-recession average of 2.5% Employment Resident Employment outlook is 1.3% in 2013 vs. 1.0% in 2012 Manufacturing Manufacturing employment is expected to grow at 1.0%. Philadelphia has had negative growth from 2000 to 2011. Households Household growth is expected to be 0.3%, the same as the last three years. Energy Efficiency Energy Efficiency impact forecasted to be ~1% reduction in usage in 2013. Improvements at oil refineries will be partially offset by on-going energy efficiency initiatives 2012 EEI Conference Notes: 2012 data is not adjusted for leap year. Source of 2013 economic outlook data is Global Insight (July 2012). Weather-Normalized Load YoY Growth Economic Forecast of Drivers that Influence Load |
 43 BGE Load 2012E -0.6% -3.1% -1.2% -2.2% 1.7% 2011 2.0% 0.8% -4.3% -1.1% 1.0% GMP Large C&I Small C&I Residential All Customers Driver or Indicator 2013 Outlook Gross Metro Product (GMP) GMP is projected to grow at 1.5% for 2013. Employment 1.0% growth projected. BGE’s decoupled non-rate case revenue growth is primarily driven by customer growth. The main driver for customer growth is employment. Manufacturing Manufacturing employment is expected to be fairly flat to 2012 levels in 2013 Personal Income Projected to grow at 1.7% Energy Efficiency Continued expansion of EE programs will offset any growth seen due to improvements in economic conditions. 2013 is expected to be another transition year for the Baltimore economy with continued slow growth projected combined with the shutdown of RG Steel 2012 EEI Conference Notes: 2012 data is not adjusted for leap year. Source of 2013 economic outlook data is Global Insight (July 2012). Weather-Normalized Load YoY Growth Economic Forecast of Drivers that Influence Load |
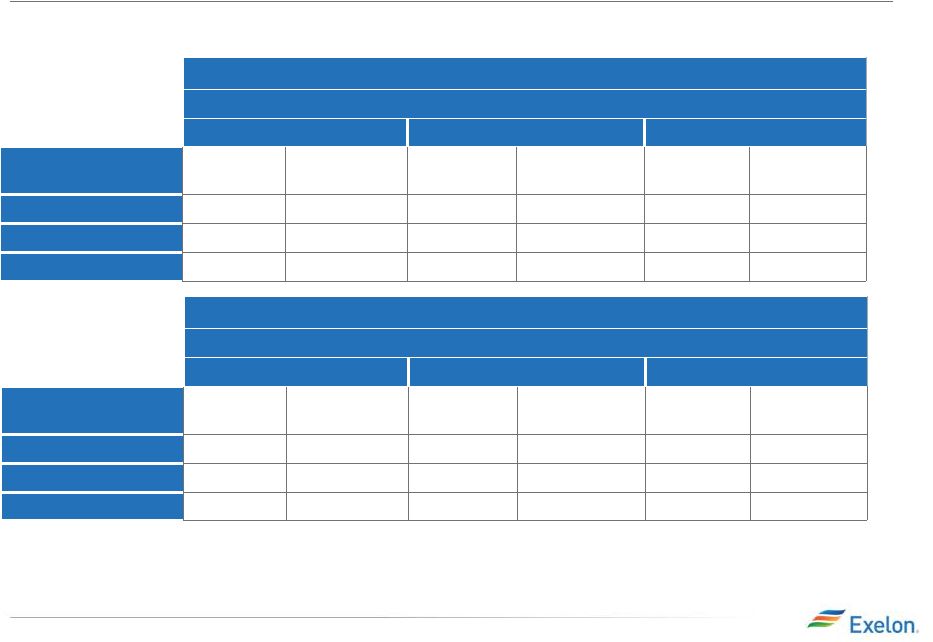
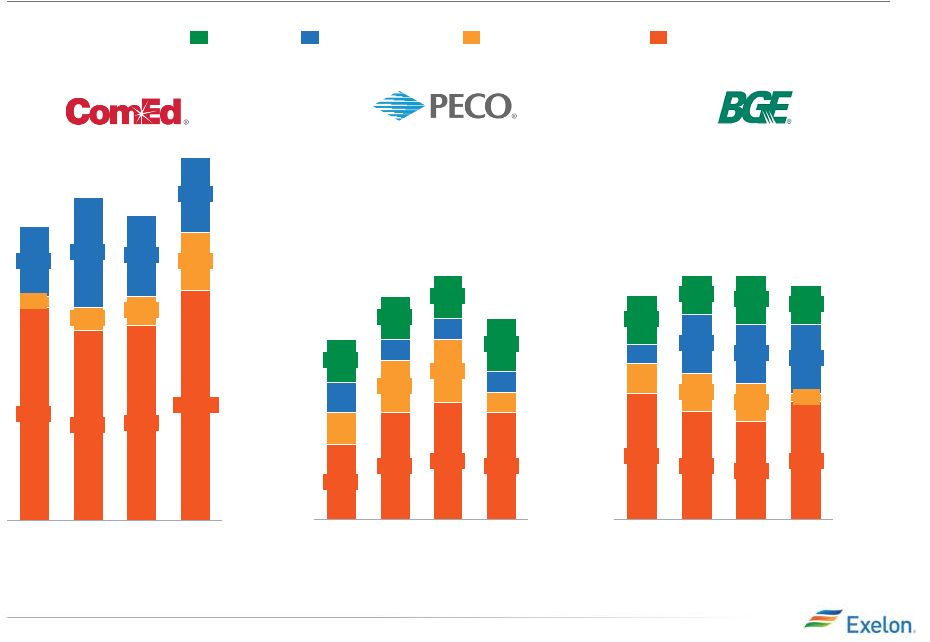
 44 Exelon Utilities: Rate Base and ROE Targets 2012E Long-Term Target Equity Ratio ~49% ~53% (4) Earned ROE 4 - 5% (5) 2012E Long-Term Target Equity Ratio ~45% ~53% (2) Earned ROE 8 -9% Continued investment in Utilities will provide stable earnings growth Based on 30-yr. US Treasury (3) ($ in billions) $1.1 $0.7 $1.1 2012E $5.1 $3.3 $0.7 $5.6 $3.6 2015E $1.2 $0.8 $1.2 2013E $5.2 $3.4 2014E $5.5 $3.6 $0.7 Electric Distribution Electric Transmission Gas Delivery $2.1 $7.2 $2.7 2014E $8.6 $6.7 $2.5 2013E $9.2 $6.4 $9.9 $6.1 2015E $8.2 $2.2 2012E Transmission Distribution $4.6 $2.8 $0.6 $4.1 $0.7 $1.0 $1.0 2013E $2.7 2014E $0.6 $0.9 $2.6 $4.3 2012E $4.8 2015E $1.0 $2.9 $0.8 Electric Distribution Gas Delivery Electric Transmission =10% (1) ComEd distribution rate base represents an average and transmission rate base represents end of year; PECO rate base represents end-of-year; and BGE rate base represents a trailing 13-month average. Numbers may not add due to rounding. (2) Equity component for distribution rates will be the actual capital structure adjusted for goodwill. (3) Earned ROE will reflect the weighted average of 11.5% allowed transmission ROE and distribution ROE resulting from 30-year Treasury plus 580 basis points for each calendar year. 2012 EEI Conference (4) Per MDPSC merger commitment, BGE is precluded from paying dividends through 2014. Per MDPSC orders, BGE cannot pay out a dividend to its parent company if said dividend would cause BGE’s equity ratio to fall below 48%. (5) ROE represents full year of 2012 earnings and therefore includes activity prior to the merger close in March 2012. (1) 2012E Long-Term Target Equity Ratio ~55% ~53% Earned ROE 11.5 – 12.5% =10% |
 45 Capital Expenditures ($ in millions) 2014E $475 2015E $50 $125 $50 $250 $575 $275 $150 2012E $425 $50 $100 2013E $525 $250 $125 $50 $100 $175 $100 $75 $75 Gas Delivery Electric Transmission Electric Distribution Smart Meter/Smart Grid (1) 2015E $1,575 $1,000 $250 $325 2014E $1,325 $850 $125 $350 2013E $1,400 $825 $100 $475 2012E $1,275 $925 $50 $300 2015E $600 $300 $25 $175 $100 2014E $625 $250 $275 $100 2013E $100 $125 $150 $625 $150 $100 2012E (2) $575 $325 $75 $50 $125 (1) Smart Meter/Smart Grid CapEx net of proceeds from U.S. Department of Energy (DOE) grant. For BGE, includes CapEx from Smart Energy Savers program of ~$10M per year. (2) Represents 2012 full year CapEx; estimated 2012 CapEx from merger close date totals $500M. 2012 EEI Conference |
 46 Smart Meter / Smart Grid Update Investments will provide customer operational and reliability benefits (1) The $200M DOE grant was the maximum allowable under the Smart Grid Investment Grant Program. 2012 EEI Conference •Installation of nearly 4M smart electric meters delayed to Q1 2015 pending order on rehearing •Smart Grid program to include distribution automation device installations and substation modernization upgrades •ComEd Innovation Corridor will provide a “Test Bed” for smart grid technologies to be demonstrated within a utility scale environment •Investment recovered through distribution formula rate ComEd will invest ~$1.3B over the next 10 years •Installation of more than 1.8M smart electric meters began Q1 2012 •Plans to file request with PAPUC to accelerate deployment completion by 2014 •Awarded $200M under the DOE program (1) , lowering net cost to customers to ~$450M •Investment recovered through surcharge mechanism with 10% ROE PECO will invest up to $650M through 2014 •Installation of 2M smart electric and gas meters began in April 2012 •A customer web portal and dynamic pricing (Peak Time Rebates) as the default tariff •Awarded $200M under the DOE program (1) , lowering net cost to customers to ~$300M •Cost recovery on project pending until cost-effectiveness showing at the end of deployment BGE will invest up to $500M through 2015 |
 47 PECO – Default Service Plan Filing (DSP II) (1) FR = Full Requirements; (2) FPFR = Fixed-Price Full Requirements Retention as of: October 9, 2012 Proposed Procurement Mix Class DSP I (1/1/11 – 5/31/13) DSP II (6/1/13 – 5/31/15) Large C&I Current load retained: 3% • 100% spot-priced FR (1) products • 2011 opt-in FPFR (2) product • 100% spot-priced FR products Medium Commercial Current load retained: 17% • 85% 1-year FPFR products, 15% spot-priced FR products • 100% 6-month FPFR products Small Commercial Current load retained: 42% • 70% 1-year FPFR products, 20% 2-year FPFR products, 10% spot-priced FR products • 100% 1-year FPFR products Residential Current load retained: 70% • 45% 2-year FPFR products; 30% 1-year FPFR products; targeted 20% block products of 1-yr, 2-yr, 5-yr and seasonal terms; targeted 5% spot market purchases • As block products expire, block and spot is replaced by FPFR products with terms ending 5/31/15 (end of DSP II period) • Remainder of portfolio is a mix of 2-yr and 1-yr FPFR products, with delivery periods overlapping on a semi-annual basis • On 1/13/12, PECO filed a new Default Service Plan with the PAPUC, which outlines how PECO will purchase electricity for customers not purchasing from a competitive generation supplier from 6/1/13 through 5/31/15 • PA PUC entered an Opinion and Order on October 12, 2012 PA PUC order: • Directs PECO to develop a plan by 1/1/14 to allow Customer Assistance Program (CAP) customers to select an Electric Generation Supplier (EGS) • Provides for some changes to PECO’s Retail Market Enhancements (Opt-In and Customer Referral programs) • Directs PECO, EGSs, and interested parties to submit a plan within 60 days to address how participating EGSs will pay for Retail Market Enhancements 2012 EEI Conference |
 48 BGE – Standard Offer Service • BGE provides Standard Offer Service (SOS) as fixed seasonal rates for those electric customers who are not shopping. The costs of providing this service are recovered from customers via an Administrative Charge included in the SOS rate. The Administrative Charge and the Energy & Transmission components of the SOS Rate are subject to periodic true-ups. BGE procures the majority of energy for this product via Full Requirements load auctions as ordered by the MDPSC. See table below: (1) FPFR = Fixed-Price Full Requirements Retention as of: September 30, 2012 Procurement Mix Class 6/1/12 – 5/31/13 6/1/13 – 5/31/14 Large C&I (Hourly) Current load retained: 7% • 100% of supply procured directly from the PJM spot market • 100% of supply procured directly from the PJM spot market Medium Commercial (Type II) Current load retained: 38% • 100% 3-month FPFR (1) products • Auction Apr ’12 for Jun ’12 – Aug ’12 • Auction Jun ’12 for Sep ’12 – Nov ’12 • Auction Oct ’12 for Dec ’12 – Feb ’13 • Auction Jan ’13 for Mar ’13 – May ’13 • 100% 3-month FPFR products • Auction Apr ’13 for Jun ’13 – Aug ’13 • Auction Jun ’13 for Sep ’13 – Nov ’13 • Auction Oct ’13 for Dec ’13 – Feb ’14 • Auction Jan ’14 for Mar ’14 – May ’14 Small Commercial (Type I) Current load retained: 63% • 25% 2-year FPFR products • Auction Apr ’10 for Oct ’10 – Sep ’12 • Auction Oct ’10 for Jun ’11 – May ’13 • Auction Apr ’11 for Oct ’11 – Sep ’13 • Auction Oct ’11 for Jun ’12 – May ’14 • Auction Apr ’12 for Oct ’12 – Sep ’14 • 25% 2-year FPFR products • Auction Apr ’11 for Oct ’11 – Sep ’13 • Auction Oct ’11 for Jun ’12 – May ’14 • Auction Apr ’12 for Oct ’12 – Sep ’14 • Auction Oct ’12 for Jun ’13 – May ’15 • Auction Apr ’13 for Oct ’13 – Sep ’15 Residential Current load retained: 74% • 25% 2-year FPFR products • Auction Apr ’10 for Oct ’10 – Sep ’12 • Auction Oct ’10 for Jun ’11 – May ’13 • Auction Apr ’11 for Oct ’11 – Sep ’13 • Auction Oct ’11 for Jun ’12 – May ’14 • Auction Apr ’12 for Oct ’12 – Sep ’14 • 25% 2-year FPFR products • Auction Apr ’11 for Oct ’11 – Sep ’13 • Auction Oct ’11 for Jun ’12 – May ’14 • Auction Apr ’12 for Oct ’12 – Sep ’14 • Auction Oct ’12 for Jun ’13 – May ’15 • Auction Apr ’13 for Oct ’13 – Sep ’15 2012 EEI Conference |
 49 Regulatory Schedule 4Q12 1Q13 2Q13 3Q13 2013 formula rate case filing (by 5/1/13) ComEd Distribution Formula Rate Illinois Power Agency Procurement ComEd Transmission Rate Update 2013 formula rate case filing (by 5/1); rates effective June 2013 thru May 2014 2013 formula rate case filing final order (by 12/27/13); rates effective 1/2/14 – 1/1/15 4Q13 BGE Distribution Rates PECO Supply Procurement BGE Transmission Rate Update 2013 formula rate case filing (by 5/15/13); rates effective June 2013 thru May 2014 MDPSC Order expected February 23, 2013 DSP II Procurement (December) BGE Supply Procurement Regular procurement event (January) Regular procurement event (April and June) Act 129 Part II Energy Efficiency Plan Filing (11/2012) PECO Distribution Filing 12-0321 final order (by 12/26); rates effective 1/2/13 – 1/1/14 DSP II Procurement (February) DSP II Procurement (October) Regular procurement event (October) Regular procurement event (October) No procurement events scheduled for 2013 2012 EEI Conference |
 Generation |
 Exelon Generation Fleet A clean and diverse portfolio that is well positioned for environmental upside from EPA regulations (1) Total owned generation capacity as of 9/30/2012 for legacy Exelon and legacy Constellation combined, net of physical market mitigation assumed to be 2,648 MW. Nuclear capacity reflects EXC ownership of CENG and Salem. Coal capacity shown does not include Eddystone 2 (309 MW) retired on 6/1/2012. 51 National Scope • Power generation assets in 20 states and Canada • Low-cost generation capacity provides unparalleled leverage to rising commodity prices Large and Diverse • 35 GW of diverse generation (1) – 19 GW of Nuclear – 10 GW of Gas – 2 GW of Hydro – 2 GW of Oil – 1 GW of Coal – 1 GW of Wind/Solar/Other Clean • One of nation’s cleanest fleets as measured by CO2, SO2 and NOx intensity • Less than 5% of combined generation capacity will require capital expenditures to comply with Air Toxic rules 2012 EEI Conference |
 Executing on Renewable Development Projects Existing renewable projects will expand the renewable portfolio by more than 600 MW by 2013 52 • Six projects completed or to be completed by the end of 2012 — Adding 404 MW — Diverse geographic representation: Idaho Kansas Michigan New Mexico Texas • All projects done under long-term PPAs with anticipated payback in approximately 10 years 2012 EEI Conference AVSR 1 Wildcat Wind Wind Solar • Antelope Valley Solar Ranch Project One Large scale solar project that will be 230 MW once fully operational On track to add 80 MW by year-end 2012 150 MW online by Fall 2013 Initial investment fully recovered by 2015 25-year PPA for entire output with Pacific Gas & Electric Cashflow and EPS accretive in 2013 Los Angeles |
 53 Nuclear Uprates (1) Includes deletion of TMI MUR from the uprate program and deferral of Limerick and LaSalle EPU’s. (2) In 2013 dollars. Overnight costs do not include financing costs or cost escalation. (3) Adjusted for actual MW’s achieved. (4) Total project returns Uprate projects enhance Exelon’s geographically diverse nuclear fleet – approximately 18 MW to come on line in 2012 and an additional 230 MW through 2015 Nuclear Uprate Program Summary (1) Estimated IRR (4) Overnight Cost (2) Approval Process Project Duration Megawatt Recovery & Component Upgrades 11 - 13% $890 M Not required 3-4 Years MUR (Measurement Uncertainty Recapture) 12 - 16% $300 M Straight forward approval process 2-3 Years EPU (Extended Power Uprate) 8 - 13% $2,240 M Straight forward approval process 3-6 Years Station Base Case MW (3) Max Potential MW (3) MW Online to Date Year of Full Operation by Unit (1) MW Recovery & Component Upgrades: Quad Cities 99 99 99 2011 / 2010 Dresden 3 3 2013 / 2012 Peach Bottom 29 30 15 2012 / 2011 Dresden 106 110 62 2011 / 2013 Limerick 6 6 3 2012 / 2013 Peach Bottom 2 2 2014 / 2015 MUR: LaSalle 39 39 39 2010 / 2011 Limerick 30 30 30 2011 / 2011 Braidwood 34 42 2013 / 2013 Byron 34 42 2013 / 2013 Quad Cities 20 21 2014 / 2014 Dresden 26 28 2014 / 2015 TMI 0 0 Deleted EPU: Clinton 2 2 2 2010 Peach Bottom 130 137 2015 / 2016 LaSalle 297 313 2020 / 2019 Limerick 270 284 2021 / 2021 Total 1,127 1,188 250 2012 EEI Conference |
 Peach Bottom Uprate Program • MW Recovery – Low Pressure Turbine Retrofit installation complete for both Unit 2 and Unit 3 – Replacement of Reactor Recirculation Pump Motor Generator sets with energy efficient Adjustable Speed Drives in 2014 and 2015 • EPU – Funding approved for installation work 54 Unit 2 Unit 3 Uprate Project MW Increase (1) Online Date MW Increase (1) Online Date Status MW Recovery - Low Pressure Turbine Retrofit 14 4Q 2012 15 4Q 2011 Complete MW Recovery - Adjustable Speed Drives 1 4Q 2014 1 4Q 2015 Initial studies in progress EPU 65 1Q 2015 65 1Q 2016 Installation phase in progress (1) Capital investment and MW uprate numbers represent Exelon’s 50% ownership stake in Peach Bottom Station. $’s used in chart are nominal (excludes capitalized interest). Peach Bottom Uprate Projects are underway – 15 additional MWs came online in 2011 and the remaining will come online between late 2012 and 2016 $0 $50 $100 $150 2009 2010 2011 2012 2013 2014 2015 2016 2017 Capital Investment $M (1) MW Recovery EPU 2012 EEI Conference |
 Exelon Nuclear Fleet Overview (including CENG and Salem) Plant Location Type/ Containment Water Body License Extension Status / License Expiration Ownership Spent Fuel Storage/ Date to lose full core discharge capacity Braidwood, IL (Units 1 and 2) PWR Concrete/Steel Lined Kankakee River Expect to file application in 2013 / 2026, 2027 100% Dry Cask Byron, IL (Units 1 and 2) PWR Concrete/Steel Lined Rock River Expect to file application in 2013 / 2024, 2026 100% Dry Cask Clinton, IL (Unit 1) BWR Concrete/Steel Lined / Mark III Clinton Lake 2026 100% Dry Cask (2017) Dresden, IL (Units 2 and 3) BWR Steel Vessel / Mark I Kankakee River Renewed / 2029, 2031 100% Dry Cask LaSalle, IL (Units 1 and 2) BWR Concrete/Steel Lined / Mark II Illinois River 2022, 2023 100% Dry Cask Quad Cities, IL (Units 1 and 2) BWR Steel Vessel / Mark I Mississippi River Renewed / 2032 75% Exelon, 25% Mid- American Holdings Dry Cask Calvert Cliffs, MD (Units 1and 2) PWR Concrete/Steel Lined Chesapeake Bay Renewed / 2034, 2036 100% CENG Dry Cask R.E. Ginna, NY (Unit 1) PWR Concrete/Steel Lined Lake Ontario Renewed / 2029 100% CENG Dry Cask Limerick, PA (Units 1 and 2) BWR Concrete/Steel Lined / Mark II Schuylkill River Filed application in June 2011 (decision expected in 2015) / 2024, 2029 100% Dry Cask Nine Mile Point, NY (Units 1 and 2) BWR Concrete/Steel Vessel / Mark I / Concrete/Steel Vessel/ Mark II Lake Ontario Renewed / 2029, 2046 100% CENG / 82% CENG , 18% Long Island Power Authority Dry Cask Oyster Creek, NJ (Unit 1) BWR Steel Vessel / Mark I Barnegat Bay Renewed / 2029 100% Dry Cask Peach Bottom, PA (Units 2 and 3) BWR Steel Vessel / Mark I Susquehanna River Renewed / 2033, 2034 50% Exelon, 50% PSEG Dry Cask TMI, PA (Unit 1) PWR Concrete/Steel Lined Susquehanna River Renewed / 2034 100% 2023 Salem, NJ (Units 1 and 2) PWR Concrete/Steel Lined Delaware River Renewed / 2036, 2040 42.6% Exelon, 57.4% PSEG Dry Cask (1) Operating license renewal process takes approximately 4-5 years from commencement until completion of NRC review. (2) The date for loss of full core reserve identifies when the on-site storage pool will no longer have sufficient space to receive a full complement of fuel from the reactor core. Dry cask storage will be in operation at those sites prior to losing full core discharge capacity in their on-site storage pools. (3) On December 8, 2010, Exelon announced that it will permanently cease generation operations at Oyster Creek by December 31, 2019. Oyster Creek’s current NRC license expires in 2029. (4) Exelon Generation has a 50.01% ownership interest in CENG (Constellation Energy Nuclear Group, LLC). Electricite de France SA (EDF) has a 49.99% ownership interest in CENG. 55 2012 EEI Conference (1) (2) (3) (4) (4) (4) (4) |
 Effectively Managing Nuclear Fuel Costs (1) Projected Exelon (100%) Uranium Demand Components of Nuclear Fuel in 2012 2012 – 2015: 100% hedged in volume 2016: ~85% hedged in volume 2017: ~55% hedged in volume 11 10 9 8 7 6 5 4 3 2 1 0 2017E 2016E 2015E 2014E 2013E 2012 Projected Exelon Average Uranium Cost vs. Market 2017E 2016E 2015E 2014E 2013E 2012 Exelon Average Reload Price Projected Market Price (1) All charts exclude Salem and CENG. (2) At ownership, excluding Salem and CENG. Excludes costs reimbursed under the settlement agreement with the DOE. 56 Projected Total Nuclear Fuel Spend (2) 2017E 1,174 2016E 1,152 2015E 1,096 2014E 1,051 2013E 992 2012 926 Nuclear Fuel Capex Nuclear Fuel Expense (Amortization + Spent Fuel) 2012 EEI Conference 14% Fabrication 14% Nuclear Waste 36% Uranium 3% Conversion 2% Tax/Interest 31% Enrichment 0 20 40 60 80 100 0 200 400 600 800 1,000 1,200 1,400 |
 Impact of Refueling Outages Refueling Outage Duration 31% 36% 14% 14% Nuclear Output (1) Note: Net nuclear generation data at ownership excluding Salem and CENG. 57 1,208 1,169 1,104 Nuclear Refueling Cycle • All Exelon owned units on a 24 month cycle except for Braidwood U1/U2, Byron U1/U2 and Salem U1/U2, which are on 18 month cycles • Average Outage Duration (2010-11): ~27 days Note: Exelon data excludes Salem & CENG. Exelon’s 2009 average includes 23 days of TMI outage that extended into 2010 for a steam generator replacement. Actual Target # of Outages 2012 Refueling Outage Impact • 10 planned refueling outages, including 1 at Salem • Exelon completed 4 refueling outages in the Spring with an average duration of 30 days • 5 Exelon planned Fall refueling outages (Byron 1, Peach Bottom 2, Braidwood 2, Oyster Creek, and Dresden 3) • 1 Salem planned Fall refueling outage 2013 Refueling Outage Impact • 10 planned refueling outages, including 1 at Salem • 4 Exelon planned Spring refueling outages and 5 planned Fall refueling outages • 1 Salem planned Spring refueling outage Industry (w/o Exelon) Exelon 2011 2010 2009 2008 2007 2006 2005 2004 2003 2002 2012 EEI Conference 125 126 127 128 129 130 131 132 133 134 135 2004 2005 2006 2007 2008 2009 2010 2011 2012 2013 2014 2015 7 7.5 8 8.5 9 9.5 10 10.5 0 10 20 30 40 50 |