Earnings Conference Call 1 st Quarter 2013 May 1 st , 2013 Exhibit 99.2 |
Cautionary Statements Regarding Forward-Looking Information 1 2013 1Q Earnings Release Slides This presentation contains certain forward-looking statements within the meaning of the Private Securities Litigation Reform Act of 1995, that are subject to risks and uncertainties. The factors that could cause actual results to differ materially from the forward-looking statements made by Exelon Corporation, Commonwealth Edison Company, PECO Energy Company, Baltimore Gas and Electric Company and Exelon Generation Company, LLC (Registrants) include those factors discussed herein, as well as the items discussed in (1) Exelon’s 2012 Annual Report on Form 10-K in (a) ITEM 1A. Risk Factors, (b) ITEM 7. Management’s Discussion and Analysis of Financial Condition and Results of Operations and (c) ITEM 8. Financial Statements and Supplementary Data: Note 19; and (2) other factors discussed in filings with the SEC by the Registrants. Readers are cautioned not to place undue reliance on these forward-looking statements, which apply only as of the date of this presentation. None of the Registrants undertakes any obligation to publicly release any revision to its forward-looking statements to reflect events or circumstances after the date of this presentation. 2013 1Q Earnings Release Slides |
2013 1Q Earnings Release Slides 2 Q1 2013 Executive Summary Expect to deliver on full year financial expectations by focusing on operational excellence and portfolio management • Delivered strong operating and financial results for 1Q 2013 Operating earnings of $0.70 for the first quarter Best ever first quarter generation output; fourth best ever nuclear capacity factor of 96.4%; Fossil availability factor of 98.4%; Renewable energy capture of 94.9% • Forward markets continue to show signs of potential upside • Constructive electric and gas rate case order for BGE • Progress made on ComEd EIMA legislation amendments • Continue execution on the path laid out earlier this year Improve balance sheet strength Focus on operations and efficiency Exploring opportunities for organic and opportunistic growth |
Market Update • Upside in fundamental view starting to materialize in PJM; current view is that there is still $2 - $4/MWh upside in 2015+ based on the market forwards as of March 31, 2013 • Current year gas price increase largely driven by weather; long-term gas price view of $4 - $6/mmbtu 2013 1Q Earnings Release Slides 3 42 40 38 36 34 32 30 4/1/13 3/1/13 2/1/13 1/1/13 NiHub PJM-W 9.6 9.3 7.8 7.5 10.0 9.0 8.0 7.0 6.0 4/1/13 3/1/13 2/1/13 1/1/13 7.5 9.5 8.5 6.5 NiHub PJM-W 2015 ATC Price Change 2015 Heat Rate Change $41.43 $39.17 $33.72 $31.87 |
2013 1Q Earnings Release Slides 4 1Q 2013 Financial Summary • Delivered non-GAAP operating earnings (1) in 1Q of $0.70/share at the upper end of our earnings guidance of $0.60 - $0.70/share 1Q 2013 vs. 1Q 2012 • Lower ExGen pricing • Share differential • Favorable weather • Full quarter of Constellation & BGE in 1Q 2013 1Q 2013 vs. Guidance • Higher nuclear volume • Favorable O&M in 1Q expected to reverse over the rest of 2013 • Favorable tax items • Inability to achieve portfolio management targets $0.39 $0.10 $0.14 $0.09 $0.70 ($0.02) HoldCo ExGen ComEd PECO BGE 2013 1Q Results (1) Refer to the Earnings Release Attachments for additional details and to the Appendix for a reconciliation of adjusted (non-GAAP) operating EPS to GAAP EPS. Expect 2Q 2013 earnings of $0.50 - $0.60/share |
5 Exelon Generation: Gross Margin Update March 31, 2013 December 31, 2012 Gross Margin Category ($M) (1) (2) 2013 2014 2015 2013 2014 2015 Open Gross Margin (3) (including South, West, Canada hedged gross margin) $6,000 $6,350 $6,400 $5,550 $5,900 $6,050 Mark-to-Market of Hedges (3,4) $1,200 $400 $250 $1,650 $650 $300 Power New Business / To Go $350 $600 $800 $400 $650 $850 Non-Power Margins Executed $300 $100 $50 $200 $100 $50 Non-Power New Business / To Go (5) $300 $500 $550 $400 $500 $550 Total Gross Margin $8,150 $7,950 $8,050 $8,200 $7,800 $7,800 • Forward power markets increased during the 1st quarter in nearly all regions The MidWest and Mid-Atlantic saw increases of $2 per MWh or more, driven by expanding heat rates and increasing natural gas prices Continue to optimize our hedging to realize the upside that we believe remains in the market due to liquidity and coal retirements • Power New Business To-Go is lower in 2014 and 2015 as we execute on favorable hedges. Power New Business To-Go in 2013 has been lowered to reflect our portfolio positioning and year-to-date results 2013 1Q Earnings Release Slides 1) Gross margin rounded to nearest $50M. 2) Gross margin does not include revenue related to decommissioning, gross receipts tax, Exelon Nuclear Partners and entities consolidated solely as a result of the application of FIN 46R. 3) Includes CENG Joint Venture. 4) Mark to Market of Hedges assumes mid-point of hedge percentages. 5) Any changes to new business estimates for our non-power business are presented as revenue less costs of sales. 2013 1Q Earnings Release Slides Key Highlights of 1Q 2013 |
BGE 2013 load growth largely driven by the idling of RG Steel and energy efficiency partially offset by improving economic conditions 6 Exelon Utilities Load 2013E 1.0% -0.8% -0.5% -0.1% 2012 -0.3% 0.2% -0.6% -0.1% Large C&I Small C&I Residential All Customers Notes: Data is not adjusted for leap year. Source of 2013 economic outlook data is Global Insight (February 2013). Assumes 2013 GDP of 1.9% and U.S unemployment of 7.6%. ComEd has the ROE collar as part of the distribution formula rate and BGE is decoupled which mitigates the load risk. QTD and YTD actual data can be found in earnings release tables. BGE amounts have been adjusted for unbilled / true-up load from prior quarters. ComEd Moderate economic growth and strong steel /auto sector growth partially offset by energy efficiency yields overall load similar to 2012 2013E 2.0% -2.8% 0.8% 0.5% 2012 -2.7% -2.3% -1.7% -2.2% PECO 2013 growth driven by oil refinery and improved employment outlook partially offset by energy efficiency 2013E -1.7% 1.2% -1.0% -1.1% 2012 -0.2% -2.8% -2.1% -1.5% Chicago GMP 1.3% Chicago Unemployment 9.5% Philadelphia GMP 1.4% Philadelphia Unemployment 8.5% Baltimore GMP 1.6% Baltimore Unemployment 7.1% 2013 1Q Earnings Release Slides 2013 1Q Earnings Release Slides |
7 2013 Cash Flow Summary 2013 1Q Earnings Release Slides • Expect Cash from Operations of ~$5.8B in 2013 • CapEx spend is $150M lower than prior estimates in part due to cancellation of Dresden and Quad Cities MUR projects • Financing plan reflects goal of maintaining a strong balance sheet Financing plan for utilities primarily consists of debt refinancing and redemption of PECO’s $87M preferred stock ExGen financing plan includes retirement of $450M hybrid, DOE loan draws for AVSR1 and project financing for existing wind assets • Projecting to end the year in a strong cash position with $1.35B, the majority of which will be held at ExGen 2013 1Q Earnings Release Slides |
8 2013 Key Events 1Q13 2Q13 3Q13 2013 distribution formula rate case filing (4/29/13) 2013 transmission formula rate case filing (4/29/13); rates effective June 2013 thru May 2014 2013 distribution formula rate case filing final order (by 12/27/13); rates effective 1/2/14 – 1/1/15 4Q13 2013 transmission formula rate case filing (by 5/15/13); rates effective June 2013 thru May 2014 MDPSC Order February 22, 2013 Regular procurement event (January) Regular procurement event (April and June) DSP II Procurement (February) DSP II Procurement (October) Regular procurement event (October) 2016/2017 PJM RPM Auction Results (5/24/13) 2013 1Q Earnings Release Slides Electric & gas distribution rate case filing 2013 1Q Earnings Release Slides |
9 Exelon Generation Disclosures March 31, 2013 2013 1Q Earnings Release Slides 2013 1Q Earnings Release Slides |
10 Portfolio Management Strategy Exercising Market Views Purely ratable Actual hedge % Market views on timing, product allocation and regional spreads reflected in actual hedge % High End of Profit Low End of Profit % Hedged Open Generation with LT Contracts Portfolio Management & Optimization Portfolio Management Over Time Align Hedging & Financials Establishing Minimum Hedge Targets Credit Rating Capital & Operating Expenditure Dividend Capital Structure Protect Balance Sheet Ensure Earnings Stability Create Value Strategic Policy Alignment •Aligns hedging program with financial policies and financial outlook •Establish minimum hedge targets to meet financial objectives of the company (dividend, credit rating) •Hedge enough commodity risk to meet future cash requirements under a stress scenario Three-Year Ratable Hedging Tenor aligns with customer Multiple channels to market that Bull / Bear Program •Ability to exercise fundamental market views to create value within the ratable framework •Modified timing of hedges versus purely ratable •Cross-commodity hedging (heat rate positions, options, etc.) •Delivery locations, regional and zonal spread relationships • Disciplined approach to hedging • preferences and market liquidity • allow us to maximize margins • Large open position in outer years to benefit from price upside •Ensure stability in near - term cash flows and earnings 2013 1Q Earnings Release Slides |
11 Components of Gross Margin Categories Margins move from new business to MtM of hedges over the course of the year as sales are executed Margins move from “Non power new business” to “Non power executed” over the course of the year Gross margin linked to power production and sales Gross margin from other business activities 2013 1Q Earnings Release Slides (1) Hedged gross margins for South, West and Canada region will be included with Open Gross Margin, and no expected generation, hedge %, EREP or reference prices provided for this region. (2) MtM of hedges provided directly for the five larger regions. MtM of hedges is not provided directly at the regional level but can be easily estimated using EREP, reference price and hedged MWh. (3) Proprietary trading gross margins will remain within “Non Power” New Business category and not move to “Non Power” Executed category. 2013 1Q Earnings Release Slides |
12 ExGen Disclosures Gross Margin Category ($M) (1,2) 2013 2014 2015 Open Gross Margin (including South, West & Canada hedged GM) (3) $6,000 $6,350 $6,400 Mark to Market of Hedges (3,4) $1,200 $400 $250 Power New Business / To Go $350 $600 $800 Non-Power Margins Executed $300 $100 $50 Non-Power New Business / To Go (5) $300 $500 $550 Total Gross Margin $8,150 $7,950 $8,050 2013 1Q Earnings Release Slides 2013 1Q Earnings Release Slides (1) Gross margin rounded to nearest $50M. (2) Gross margin does not include revenue related to decommissioning, gross receipts tax, Exelon Nuclear Partners and entities consolidated solely as a result of the application of FIN 46R. (3) Includes CENG Joint Venture. (4) Mark to Market of Hedges assumes mid-point of hedge percentages. (5) Any changes to new business estimates for our non-power business are presented as revenue less costs of sales. (6) Based on March 31, 2013 market conditions. Reference Prices (6) 2013 2014 2015 Henry Hub Natural Gas ($/MMbtu) $3.92 $4.23 $4.30 Midwest: NiHub ATC prices ($/MWh) $32.49 $32.99 $33.72 Mid-Atlantic: PJM-W ATC prices ($/MWh) $39.74 $40.54 $41.43 ERCOT-N ATC Spark Spread ($/MWh) HSC Gas, 7.2HR, $2.50 VOM $7.12 $8.53 $8.48 New York: NY Zone A ($/MWh) $38.16 $37.55 $38.02 New England: Mass Hub ATC Spark Spread($/MWh) ALQN Gas, 7.5HR, $0.50 VOM $2.66 $4.51 $3.73 |
13 ExGen Disclosures Generation and Hedges 2013 2014 2015 Exp. Gen (GWh) (1) 216,900 213,800 208,000 Midwest 97,600 97,100 96,500 Mid-Atlantic (2) 74,700 72,400 70,200 ERCOT 15,600 17,800 18,100 New York (2) 14,100 11,800 9,300 New England 14,900 14,700 13,900 % of Expected Generation Hedged (3) 98-101% 70-73% 33-36% Midwest 98-101% 69-72% 32-35% Mid-Atlantic (2) 99-102% 73-76% 41-44% ERCOT 93-96% 66-69% 24-27% New York (2) 101-104% 74-77% 36-39% New England 98-101% 61-64% 14-17% Effective Realized Energy Price ($/MWh) (4) Midwest $37.50 $35.00 $35.00 Mid-Atlantic (2) $49.00 $46.00 $48.00 ERCOT (5) $9.00 $7.00 $6.00 New York (2) $34.00 $36.00 $45.00 New England (5) $4.50 $4.00 $3.00 (1) Expected generation represents the amount of energy estimated to be generated or purchased through owned or contracted for capacity. Expected generation is based upon a simulated dispatch model that makes assumptions regarding future market conditions, which are calibrated to market quotes for power, fuel, load following products, and options. Expected generation assumes 12 refueling outages in 2013 and 14 refueling outages in 2014 and 2015 at Exelon-operated nuclear plants ,Salem and CENG. Expected generation assumes capacity factors of 93.9%, 93.8%, and 93.3% in 2013, 2014 and 2015 at Exelon-operated nuclear plants excluding Salem and CENG. These estimates of expected generation in 2014 and 2015 do not represent guidance or a forecast of future results as Exelon has not completed its planning or optimization processes for those years. (2) Includes CENG Joint Venture. (3) Percent of expected generation hedged is the amount of equivalent sales divided by expected generation. Includes all hedging products, such as wholesale and retail sales of power, options and swaps. Uses expected value on options. (4) Effective realized energy price is representative of an all-in hedged price, on a per MWh basis, at which expected generation has been hedged. It is developed by considering the energy revenues and costs associated with our hedges and by considering the fossil fuel that has been purchased to lock in margin. It excludes uranium costs and RPM capacity revenue, but includes the mark-to-market value of capacity contracted at prices other than RPM clearing prices including our load obligations. It can be compared with the reference prices used to calculate open gross margin in order to determine the mark-to-market value of Exelon Generation's energy hedges. (5) Spark spreads shown for ERCOT and New England. 2013 1Q Earnings Release Slides |
14 ExGen Hedged Gross Margin Sensitivities Gross Margin Sensitivities (With Existing Hedges) (1, 2) 2013 2014 2015 Henry Hub Natural Gas ($/Mmbtu) + $1/Mmbtu $15 $285 $425 - $1/Mmbtu $(5) $(225) $(370) NiHub ATC Energy Price + $5/MWh $5 $180 $375 - $5/MWh $(5) $(170) $(375) PJM-W ATC Energy Price + $5/MWh $5 $115 $220 - $5/MWh $0 $(115) $(215) NYPP Zone A ATC Energy Price + $5/MWh $0 $20 $30 - $5/MWh $0 $(20) $(30) Nuclear Capacity Factor (3) +/- 1% +/- $35 +/- $45 +/- $50 2013 1Q Earnings Release Slides (1) Based on March 31, 2013 market conditions and hedged position. Gas price sensitivities are based on an assumed gas-power relationship derived from an internal model that is updated periodically. Power prices sensitivities are derived by adjusting the power price assumption while keeping all other prices inputs constant. Due to correlation of the various assumptions, the hedged gross margin impact calculated by aggregating individual sensitivities may not be equal to the hedged gross margin impact calculated when correlations between the various assumptions are also considered. (2) Sensitivities based on commodity exposure which includes open generation and all committed transactions. (3) Includes CENG Joint Venture. 2013 1Q Earnings Release Slides |
15 Exelon Generation Hedged Gross Margin Upside/Risk $6,000 $6,500 $7,000 $7,500 $8,000 $8,500 $9,000 $9,500 $10,000 2015 $9,450 2014 $8,600 2013 $8,350 2013 1Q Earnings Release Slides $7,900 $7,400 $6,850 (1) Represents an approximate range of expected gross margin, taking into account hedges in place, between the 5th and 95th percent confidence levels assuming all unhedged supply is sold into the spot market. Approximate gross margin ranges are based upon an internal simulation model and are subject to change based upon market inputs, future transactions and potential modeling changes. These ranges of approximate gross margin in 2014 and 2015 do not represent earnings guidance or a forecast of future results as Exelon has not completed its planning or optimization processes for those years. The price distributions that generate this range are calibrated to market quotes for power, fuel, load following products, and options as of March 31, 2013 (2) Gross Margin Upside/Risk based on commodity exposure which includes open generation and all committed transactions. 2013 1Q Earnings Release Slides |
16 Illustrative Example of Modeling Exelon Generation 2014 Gross Margin Row Item Midwest Mid- Atlantic ERCOT New York New England South, West & Canada (A) Start with fleet-wide open gross margin $6.35 billion (B) Expected Generation (TWh) 97.1 72.4 17.8 11.8 14.7 (C) Hedge % (assuming mid-point of range) 70.5% 74.5% 67.5% 75.5% 62.5% (D=B*C) Hedged Volume (TWh) 68.5 53.9 12.0 8.9 9.2 (E) Effective Realized Energy Price ($/MWh) $35.00 $46.00 $7.00 $36.00 $4.00 (F) Reference Price ($/MWh) $32.99 $40.54 $8.53 $37.55 $4.51 (G=E-F) Difference ($/MWh) $2.01 $5.46 ($1.53) $(1.55) $0.51 (H=D*G) Mark-to-market value of hedges ($ million) (1) $140 million $300 million ($20) million $(15) million $0 million (I=A+H) Hedged Gross Margin ($ million) $6,750 million (J) Power New Business / To Go ($ million) $600 million (K) Non-Power Margins Executed ($ million) $100 million (L) Non- Power New Business / To Go ($ million) $500 million (N=I+J+K+L) Total Gross Margin $7,950 million (1) Mark-to-market rounded to the nearest $5 million. 2013 1Q Earnings Release Slides 2013 1Q Earnings Release Slides |
17 Additional Disclosures 2013 1Q Earnings Release Slides 2013 1Q Earnings Release Slides |
2013 Projected Sources and Uses of Cash (1) Exelon beginning cash balance as of 1/1/13. Excludes counterparty collateral activity. (2) Cash Flow from Operations primarily includes net cash flows provided by operating activities and net cash flows used in investing activities other than capital expenditures. (3) Dividends are subject to declaration by the Board of Directors. (4) Excludes PECO’s $210 million Accounts Receivable (A/R) Agreement with Bank of Tokyo. PECO’s A/R Agreement was extended in accordance with its terms through August 30, 2013. (5) Excludes BGE’s current portion of its rate stabilization bonds (6) “Other” includes proceeds from options, redemption of PECO preferred stock and expected changes in short-term debt. (7) Includes cash flow activity from Holding Company, eliminations, and other corporate entities. ($ in millions) 18 Beginning Cash Balance (1) 1,575 Cash Flow from Operations (2) 625 1,375 625 3,375 5,825 CapEx (excluding other items below): (550) (1,300) (400) (1,025) (3,300) Nuclear Fuel n/a n/a n/a (1,000) (1,000) Dividend (3) (1,250) Nuclear Uprates n/a n/a n/a (125) (125) Wind n/a n/a n/a -- -- Solar n/a n/a n/a (550) (550) Upstream n/a n/a n/a (25) (25) Utility Smart Grid/Smart Meter (125) (100) (175) n/a (400) Net Financing (excluding Dividend): Debt Issuances (4) 300 250 350 -- 900 Debt Retirements (5) (400) (250) (300) (450) (1,400) Project Finance/Federal Financing Bank Loan n/a n/a n/a 1,025 1,025 Other (6) 50 100 (75) (25) 75 Ending Cash Balance (1) 1,350 (7) 2013 1Q Earnings Release Slides |
Pension/OPEB Update 19 2013 1Q Earnings Release Slides Note: Estimates are based on 12/31/12 with expenses for legacy Exelon plans updated for March 2013 census 2013 2014 (in $M) Pre-Tax Expense (1) Contributions (2) Pre-Tax Expense (1) Contributions (2) Pension $400 $335 $415 $275 OPEB $220 $290 $220 $275 Total $620 $625 $635 $550 (1) Pension and OPEB expenses assume an ~ 24% capitalization rate. (2) Contributions shown in the table above are based on the current contribution policy for Exelon and Constellation plans. Pension includes qualified and non-qualified plans. 2013 1Q Earnings Release Slides |
Sufficient Liquidity (1) Excludes commitments from Exelon’s Community and Minority Bank Credit Facility (2) Available Capacity Under Facilities represents the unused commitments under the borrower’s credit agreements net of outstanding letters of credit and facility draws. The amount of commercial paper outstanding does not reduce the available capacity under the credit agreements. 20 2013 1Q Earnings Release Slides ($ in Millions) Aggregate Bank Commitments (1) 600 1,000 600 5,675 8,375 Outstanding Facility Draws -- -- -- -- -- Outstanding Letters of Credit -- -- (1) (1,475) (1,478) Available Capacity Under Facilities (2) 600 1,000 599 4,200 6,897 Outstanding Commercial Paper -- (281) -- -- (281) Available Capacity Less Outstanding Commercial Paper 600 719 599 4,200 6,616 Available Capacity Under Bank Facilities as of April 25, 2013 |
S&P Credit Metric Ratios 2013 1Q Earnings Release Slides 21 S&P Metrics FFO / Debt Credit Adjustments - Cash From Operations: Source (2012 10K): Methodology: Cash From Operations Stmt. of Cash Flows Start with net cash flows provided by operating activities (+/-) Working Capital Adjustments Stmt. of Cash Flows Includes changes in A/R, Inventories, A/P and other accrued expenses, option premiums, counterparty collateral and income taxes. Impact is opposite of impact to cash flow S&P FFO Adjustments: (+) Operating Lease Depreciation Adjustment FN 19 - Commitments & Contingencies - Minimum Future Lease Payments Reflects operating lease payments – interest on PV of future operating lease payments (using weighted average cost of debt) (+) PPA Depreciation Adjustment FN 19 - Commitments & Contingencies - Net Capacity Purchases Reflects net capacity payments – interest on PV of PPAs (using weighted average cost of debt) (+/-) Normalize Pension/OPEB Contribution FN 14 - Retirement Benefits - Contributions, Service & Int Costs, EROA Reflects employer contributions – (service costs + interest costs + expected return on assets), net of taxes at marginal rate (-) Securitized Debt Principal Paydown FN 11 - Debt and Credit Agreements Reflects payment of principal on securitized debt (+/-) Decommissioning classified as Investing Stmt. of Cash Flows Reclass activity classified as Investing to Cash from Operations (-) Interest Capitalized / AFUDC FN 1 - Accounting Policies - Capitalized Interest and AFUDC Reclass activity classified as Investing to Cash from Operations (+/-) Interest or Dividend on Hybrid Securities FN 11 - Debt and Credit Agreements Remove/add interest expense/dividend payments associated with instruments that qualify as hybrid securites (treated all or partially as debt or equity) (+/-) Other Adjustments N/A One-time or non-standard adjustments at discretion of rating agency = Funds from Operations (FFO) Credit Adjustments - Debt: Source (2012 10K): Methodology: Total Long-term Debt (including current maturities) Balance Sheet Start with long-term debt outstanding (+) Short-term Borrowings Balance Sheet Reflects short-terms borrowings (commerical paper, notes payable etc.) S&P Debt Adjustments: (+) Operating Leases FN 19 - Commitments & Contingencies - Minimum Future Lease Payments Reflects PV of minimum future operating lease payments (using weighted average cost of debt) (+) PPAs / Supply Agreements FN 19 - Commitments & Contingencies - Net Capacity Purchases Reflects PV of net capacity purchases (using weighted average cost of debt) (+) Unfunded Pension FN 14 - Retirement Benefits - Unfunded Status Reflects unfunded status, net of taxes at marginal rate (+) Unfunded OPEB FN 14 - Retirement Benefits - Unfunded Status Reflects unfunded status, net of taxes at marginal rate (-) Securitized Debt FN 11 - Debt and Credit Agreements Reflects securitized debt balance at year-end (+) Accrued Interest Supplemental Balance Sheet Annual accrued interest (+) Asset Retirement Obligation Balance Sheet If net obligation > 0, include net obligation, net of taxes at marginal rate (+/-) Hybrid Securities FN 11 - Debt and Credit Agreements Reclassify instruments that qualify as hybrid securites between debt and equity (treated all or partially as debt or equity) (-) Off-credit Treatment of Debt FN 11 - Debt and Credit Agreements Non-recourse project level debt that qualifies for off-credit treatment under S&P's methodology (+/-) Other Adjustments N/A One-time or non-standard adjustments at discretion of rating agency = Adjusted Debt Funds from Operations / Adjusted Debt Calculation Note: See S&P publications for official guidelines, criteria and methodology Reflects key credit ratio calculations and adjustments per S&P’s guidelines |
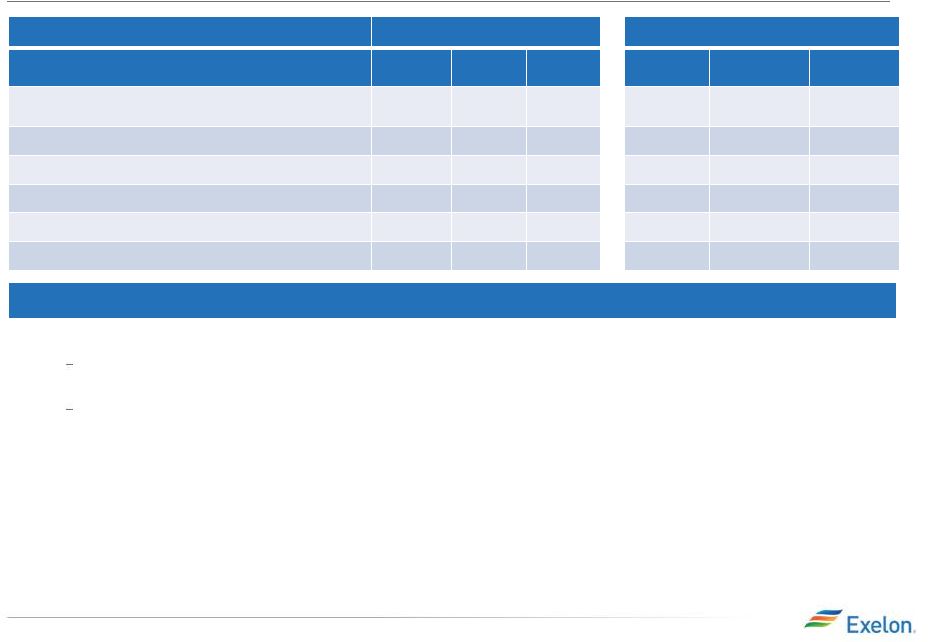
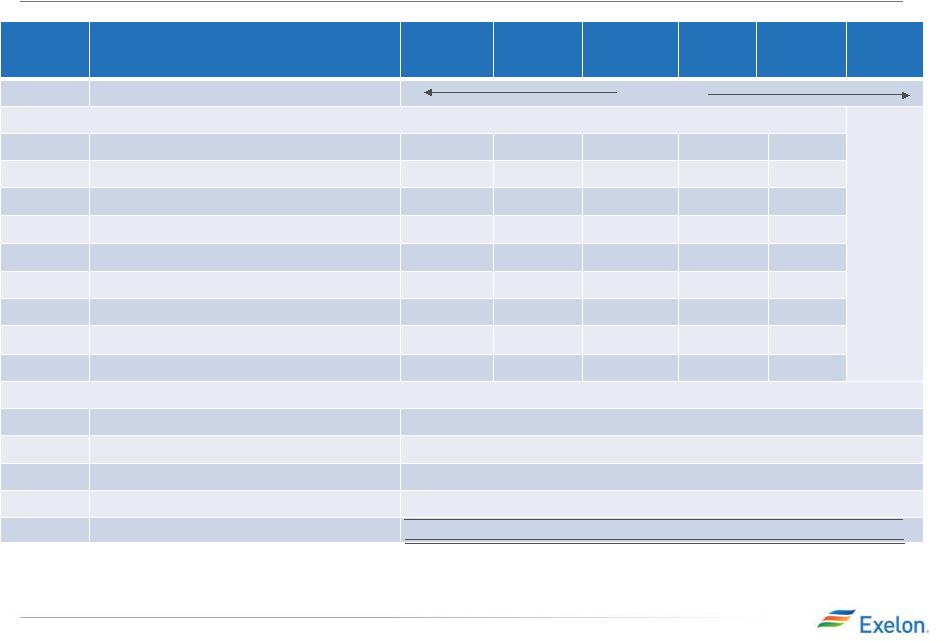
Moody’s Credit Metric Ratios 2013 1Q Earnings Release Slides 22 Note: See Moody’s publications for official guidelines, criteria and methodology Note: Moody’s Approach to Global Standard Adjustments for Non-Financial Corporations allows for Analyst discretion whether to incorporate imputed debt (and other associated adjustments) for PPAs/tolls. Moody’s official methodology for Exelon and subs does not include PPAs/tolls; however they view credit metrics both with and without Reflects key credit ratio calculations and adjustments per Moody’s guidelines Moody's Metrics Cash From Ops (pre w/c) / Debt Cash From Ops (pre w/c) / Adjusted Debt Retained Cash Flow / Debt (Adjusted FFO - Adjusted Dividend) / Adjusted Debt Free Cash Flow Credit Adjustments - Cash from Operations: Source (2012 10K): Methodology: Cash From Operations Stmt. of Cash Flows Start with net cash flows provided by operating activities (+/-) Working Capital Adjustments and changes in short- terms assets and liabilities Stmt. of Cash Flows and Supplemental Cash Flow Information Includes changes in A/R, Inventories, A/P and other accrued expenses, counterparty collateral, income taxes, under/over-recovered energy and transmission costs, other current assets. Impact is opposite of impact to cash flow Moody's Cash From Ops Adjustments: (+) Operating Lease Depreciation Adjustment FN 19 - Commitments & Contingencies - Rental Expense Equals annual rent expense x 2/3 (remaining 1/3 is allocated to interest) (+) Normalize Pension/OPEB Contribution FN 14 - Retirement Benefits - Contributions, Service Costs Reflects employer contributions – service costs, if > $0, otherwise $0 (-) Interest Capitalized / AFUDC FN 1 - Accounting Policies - Capitalized Interest and AFUDC Reclass activity classified as Investing to Cash from Operations (+/-) Interest or Dividend on Hybrid Securities FN 11 - Debt and Credit Agreements Remove/add interest expense/dividend payments associated with instruments that qualify as hybrid securites (treated all or partially as debt or equity) (+/-) Other Adjustments N/A One-time or non-standard adjustments at discretion of rating agency = Cash from Ops (pre w/c) Credit Adjustments - FFO: Source (2012 10K): Methodology: Net Income Stmt. of Cash Flows Start with net income (+/-) Non-cash adjustments to cash flows Stmt. of Cash Flows Includes depreciation and amortization, deferred income taxes, net fair value change in derivatives, net realized/unrealized gains/losses on decom funds, other non-cash operating activities Moody's FFO Adjustments: *** same as Cash from Ops Adjustments listed above *** = Adjusted FFO Credit Adjustments - CapEx: Source (2012 10K): Methodology: Capital Expenditures Stmt. of Cash Flows Start with capital expenditures Moody's CapEx Adjustments: (+) Operating Leases CapEx FN 19 - Commitments & Contingencies - Rental Expense Reclass of operatng spend to capital; equal to operating lease deprecation adjustment (-) Interest Capitalized / AFUDC FN 1 - Accounting Policies - Capitalized Interest and AFUDC Reclass activity classified as Investing to Cash from Operations = Adjusted CapEx Credit Adjustments - Debt: Source (2012 10K): Methodology: Total Long-term Debt (incl. current maturities) Balance Sheet Start with long-term debt outstanding (+) Short-term Borrowings Balance Sheet Reflects short-terms borrowings (commerical paper, notes payable etc.) Moody's Debt Adjustments: (+) Unfunded Pension FN 14 - Retirement Benefits - Unfunded Status Reflects unfunded status (pension only) (+/-) Hybrid Securities FN 11 - Debt and Credit Agreements Reclassify instruments that qualify as hybrid securites between debt and equity (treated all or partially as debt or equity) (+) Operating Leases FN 19 - Commitments & Contingencies - Minimum Future Lease Payments Annual rent expense x multiple between 4 and 10 (currently 8 for ExGen/Corp and 6 for utilities) (+/-) Other Adjustments N/A One-time or non-standard adjustments at discretion of rating agency = Adjusted Debt Credit Adjustments - Dividend: Source (2012 10K): Methodology: Common Dividends Stmt. of Cash Flows Start with common dividends (+) Preferred Dividends Stmt. of Cash Flows Reflects dividends on preferred securities Moody's Dividend Adjustments: (+) Hybrid Securities FN 11 - Debt and Credit Agreements Remove/add dividend payments/interest expense associated with instruments that qualify as hybrid securites (treated all or partially as equity or debt) = Adjusted Dividend Cash From Operations + Moody's Cash From Ops Adjustments - Adjusted Dividend - Adjusted CapEx Calculation |
2013 1Q Earnings Release Slides 23 ComEd April 2013 Distribution Formula Rate Filing Note: Disallowance of any items in the 2013 distribution formula rate filing could impact 2013 earnings in the form of a regulatory asset adjustment. The 2013 distribution formula rate filing establishes the net revenue requirement used to set the rates that will take effect in January 2014 after the ICC’s review. There are two components to the annual distribution formula rate filing: • Filing Year: Based on prior year costs (2012) and current year (2013) projected plant additions. • Annual Reconciliation: For the prior calendar year (2012), this amount reconciles the revenue requirement reflected in rates during the prior year (2012) in effect to the actual costs for that year. The annual reconciliation impacts cash flow in the following year (2014) but the earnings impact has been recorded in the prior year (2012) as a regulatory asset. Given the retroactive ratemaking provision in the EIMA legislation, ComEd net income during the year will be based on actual costs with a regulatory asset/liability recorded to reflect any under/over recovery reflected in rates. Revenue Requirement in rate filings impacts cash flow. |
24 BGE Rate Case Final Order Electric Gas Docket # 9299 Test Year October 2011 – September 2012 BGE Ask Final Order BGE Ask Final Order Common Equity Ratio 48.4% 48.4% 48.4% 48.4% Return on Equity (ROE) 10.5% 9.75% 10.5% 9.6% Rate Base $2.7B $2.6B $1B $1.0B Revenue Requirement Increase $131M $81M $45M $32M 2013 1Q Earnings Release Slides New rates went into effect for service rendered on or after February 23, 2013 |
ComEd Operating EPS Contribution Key Drivers – 1Q13 vs. 1Q12 (1) Share differential: $(0.02) Weather: $0.01 1Q13 Actual Actual Normal Heating Degree-Days 2,384 3,259 3,164 Cooling Degree-Days 39 0 0 1Q12 25 2013 1Q Earnings Release Slides $0.13 $0.10 1Q 2013 2012 (1) Refer to the Earnings Release Attachments for additional details and to the Appendix for a reconciliation of adjusted (non-GAAP) operating EPS to GAAP EPS. |
PECO Operating EPS Contribution Key Drivers – 1Q13 vs. 1Q12 (1) Share differential: $(0.03) Weather: $0.03 1Q13 Actual Actual Normal Heating Degree-Days 1,914 2,440 2,476 Cooling Degree-Days 4 0 0 1Q12 26 2013 1Q Earnings Release Slides $0.14 $0.14 1Q 2013 2012 (1) Refer to the Earnings Release Attachments for additional details and to the Appendix for a reconciliation of adjusted (non-GAAP) operating EPS to GAAP EPS. |
1Q GAAP EPS Reconciliation Three Months Ended March 31, 2013 ExGen ComEd PECO BGE Other Exelon 2013 Adjusted (non-GAAP) Operating Earnings (Loss) Per Share $0.39 $0.10 $0.14 $0.09 $(0.02) $0.70 Mark-to-market impact of economic hedging activities (0.29) - - - 0.01 (0.27) Unrealized gains related to nuclear decommissioning trust funds 0.04 - - - - 0.04 Plant retirements and divestitures 0.02 - - - - 0.02 Constellation merger and integration costs (0.03) - (0.00) 0.00 0.00 (0.03) Amortization of commodity contract intangibles (0.14) - - - - (0.14) Amortization of the fair value of certain debt 0.00 - - - - 0.00 Remeasurement of like-kind exchange tax position - (0.20) - - (0.11) (0.31) Nuclear uprate project cancelation (0.02) - - - - (0.02) 1Q 2013 GAAP Earnings (Loss) Per Share $(0.02) $(0.09) $0.14 $0.09 $(0.12) $(0.01) Three Months Ended March 31, 2012 ExGen ComEd PECO BGE Other Exelon 2012 Adjusted (non-GAAP) Operating Earnings (Loss) Per Share $0.58 $0.13 $0.14 $0.02 $(0.02) $0.85 Mark-to-market impact of economic hedging activities 0.05 - - - 0.01 0.06 Unrealized gains related to nuclear decommissioning trust funds 0.05 - - - - 0.05 Plant retirements and divestitures (0.01) - - - - (0.01) Constellation merger and integration costs (0.06) (0.00) (0.01) (0.00) (0.09) (0.16) Maryland commitments (0.03) - - (0.12) (0.17) (0.32) Amortization of commodity contract intangibles (0.11) - - - - (0.11) FERC settlement (0.25) - - - - (0.25) Non-cash remeasurement of deferred income taxes 0.02 - - - 0.15 0.17 Other acquisition costs (0.00) - - - - (0.00) 1Q 2012 GAAP Earnings (Loss) Per Share $0.24 $0.12 $0.14 $(0.09) $(0.12) $0.28 NOTE: All amounts shown are per Exelon share and represent contributions to Exelon's EPS. Amounts may not add due to rounding. 2013 1Q Earnings Release Slides 27 |
GAAP to Operating Adjustments • Exelon’s 2013 adjusted (non-GAAP) operating earnings excludes the earnings effects of the following: Mark-to-market adjustments from economic hedging activities Unrealized gains from nuclear decommissioning trust fund investments to the extent not offset by contractual accounting as described in the notes to the consolidated financial statements Financial impacts associated with the sale or retirement of generating stations Certain costs incurred related to the Constellation merger and integration initiatives Non-cash amortization of intangible assets, net, related to commodity contracts recorded at fair value at the merger date Non-cash amortization of certain debt recorded at fair value at the merger date expected to be retired in 2013 Non-cash charge to earnings resulting from the remeasurement of Exelon’s like-kind exchange tax position Charge to earnings related to Exelon’s cancelation of previously capitalized nuclear uprate expenditures Significant impairments of assets, including goodwill Significant changes to GAAP Other unusual items 2013 1Q Earnings Release Slides 28 |