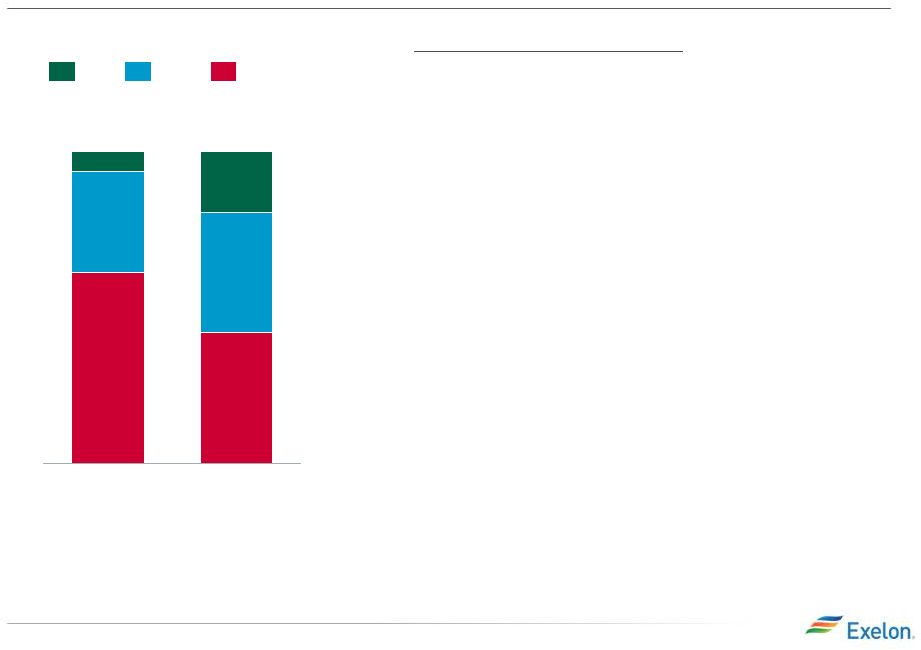
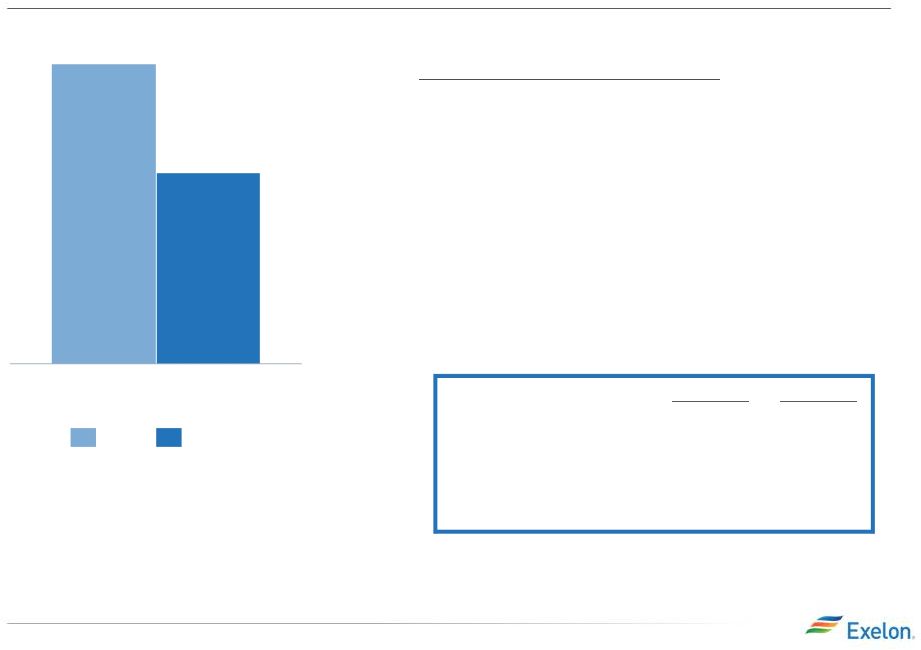
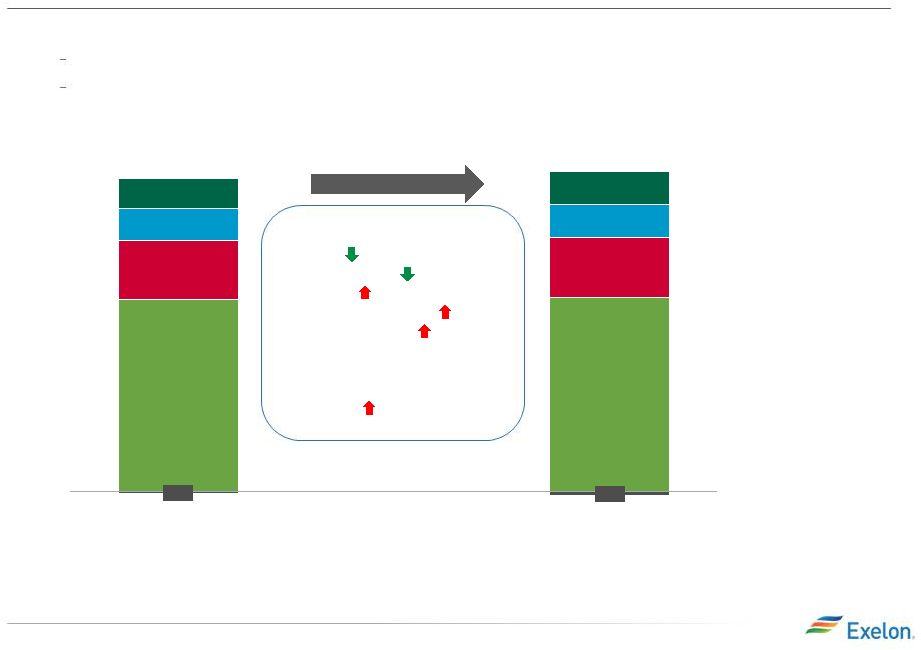
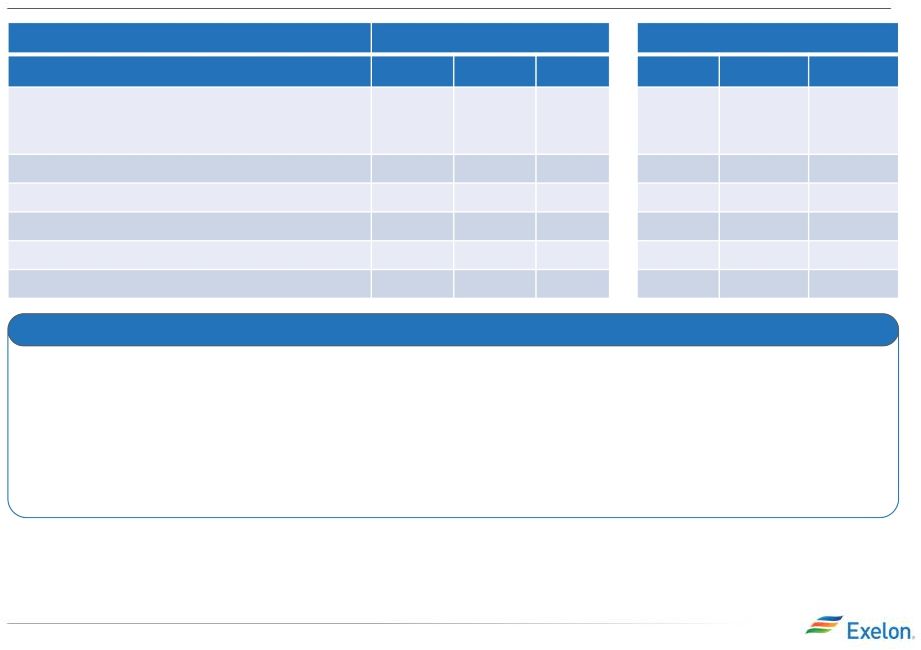
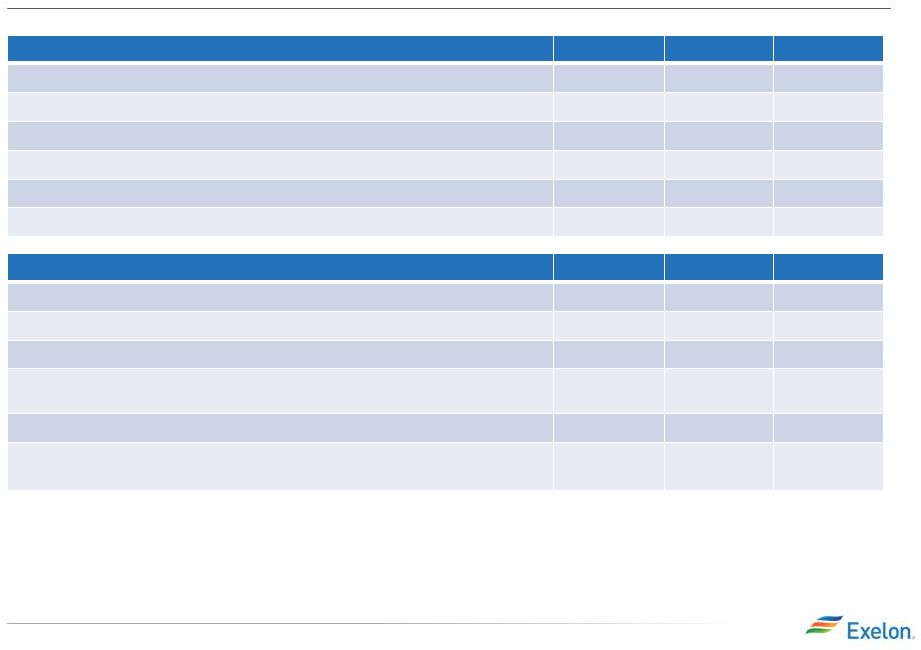
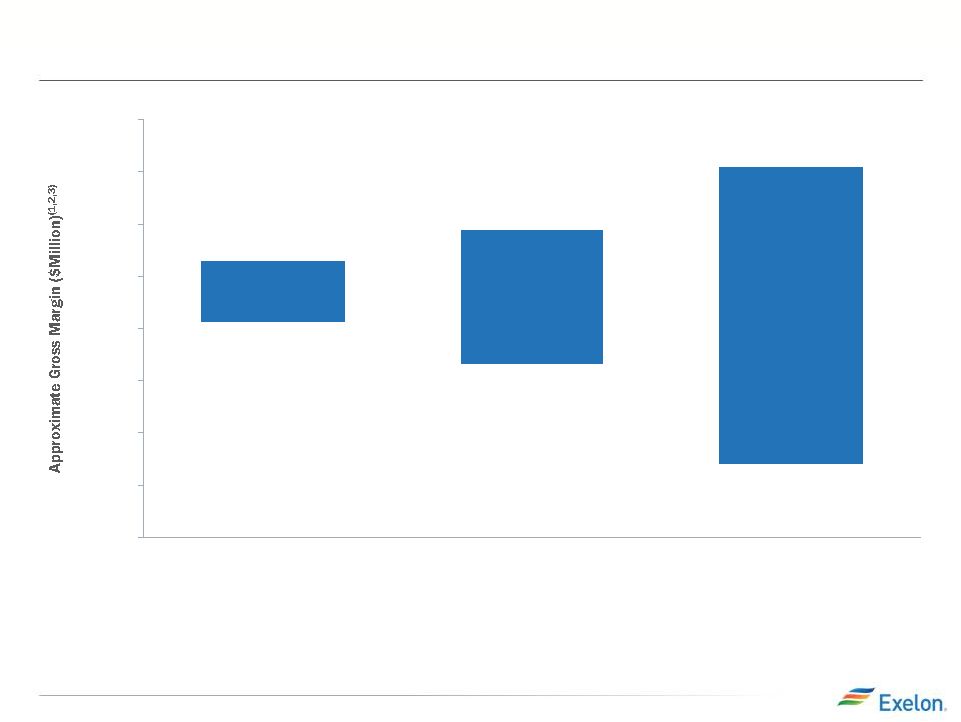
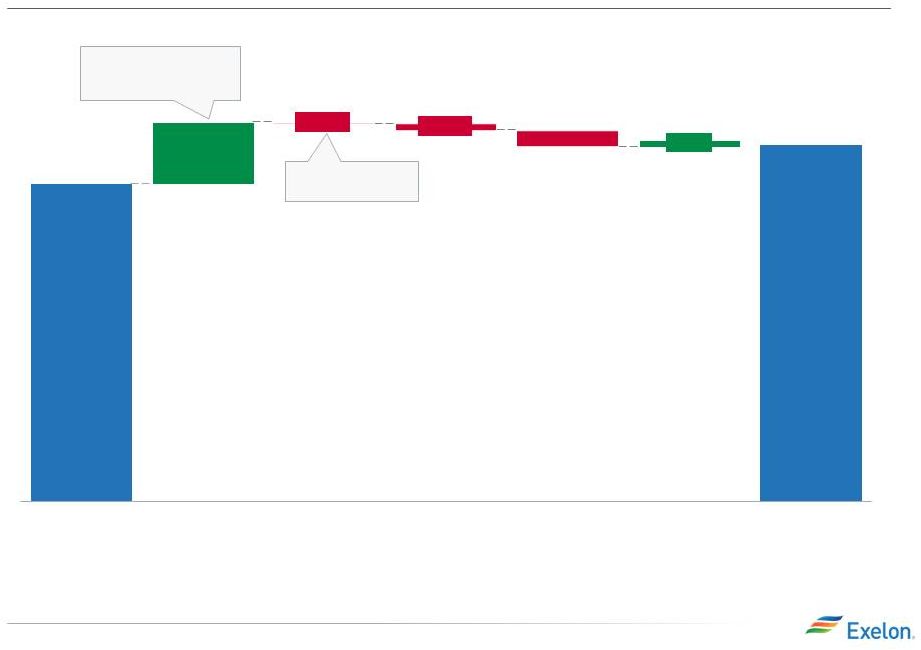
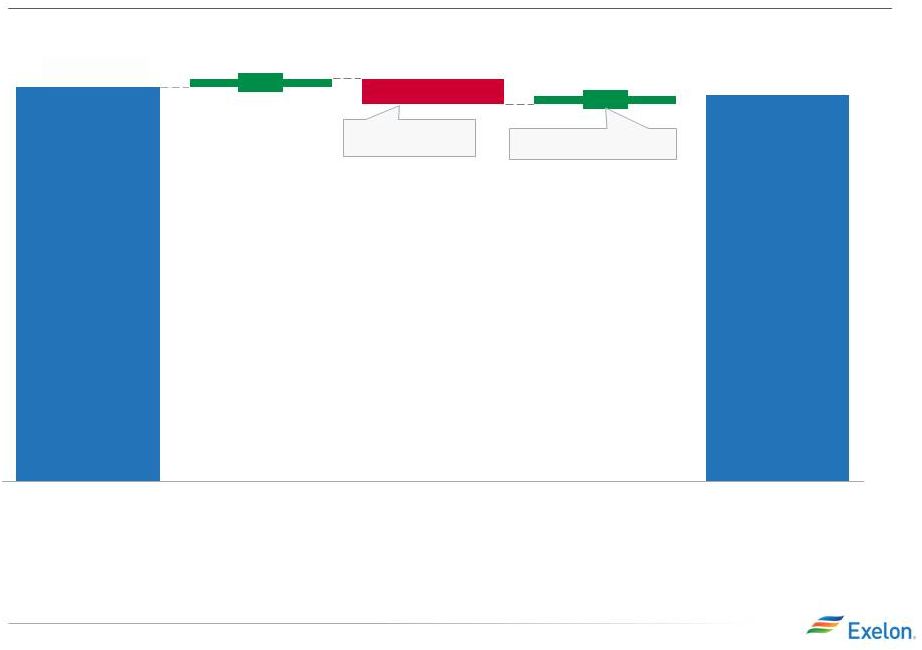
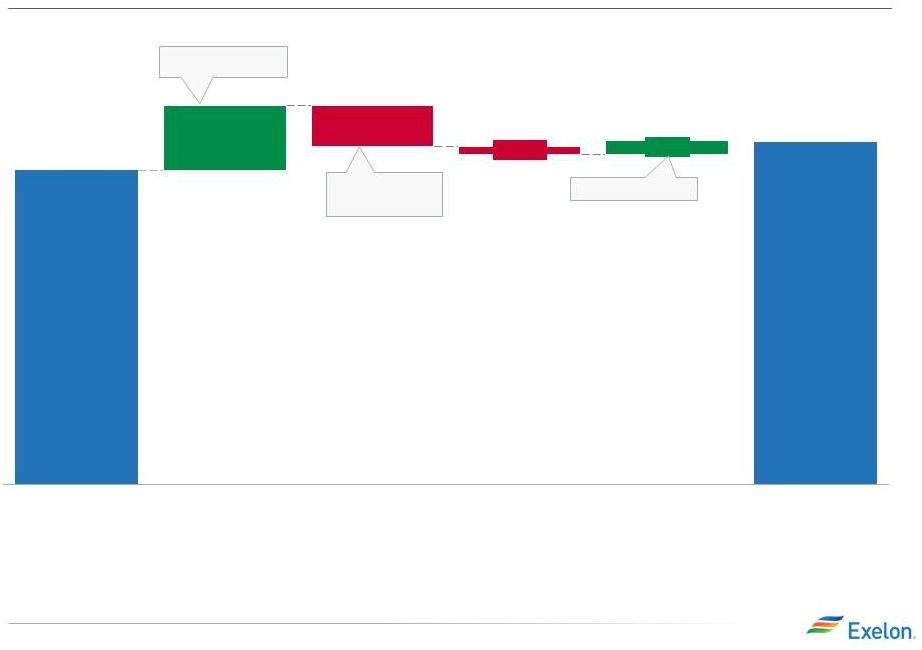
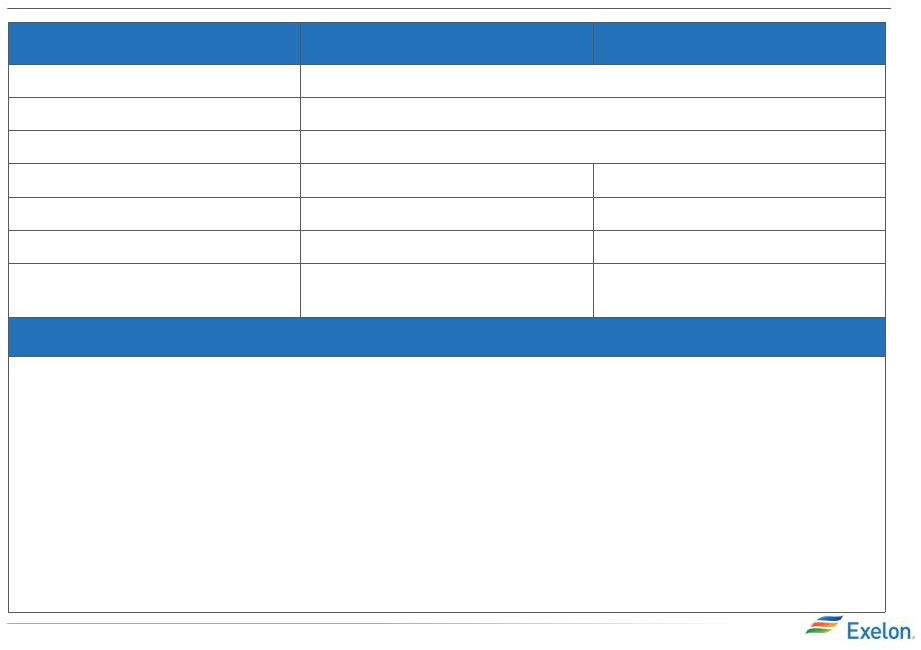
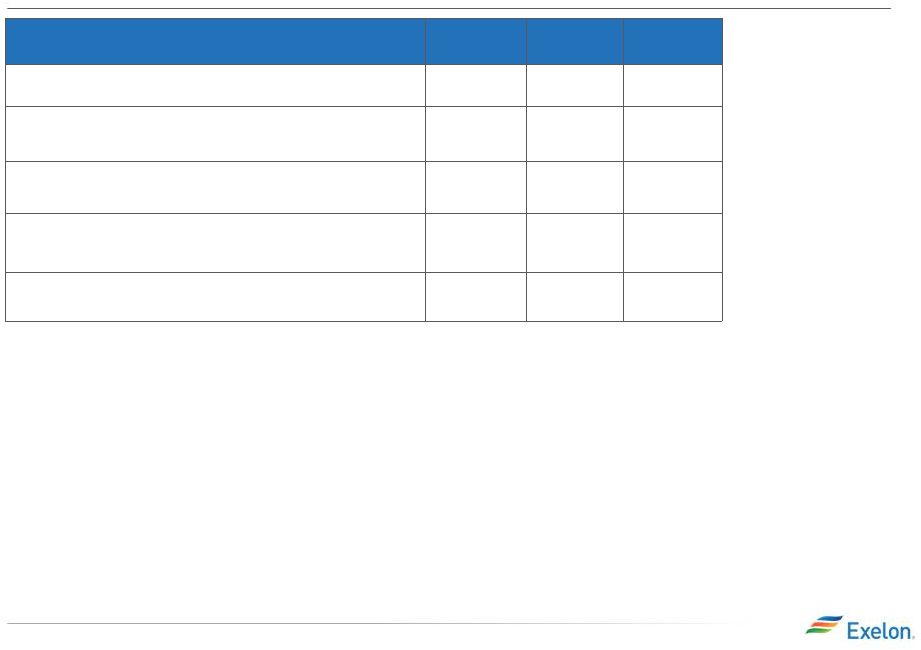
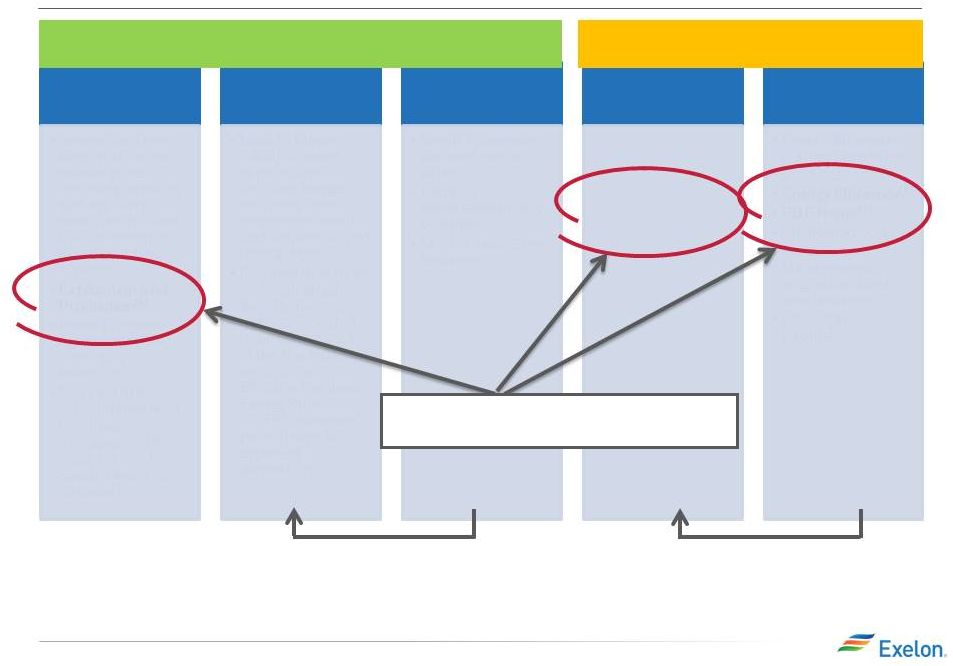
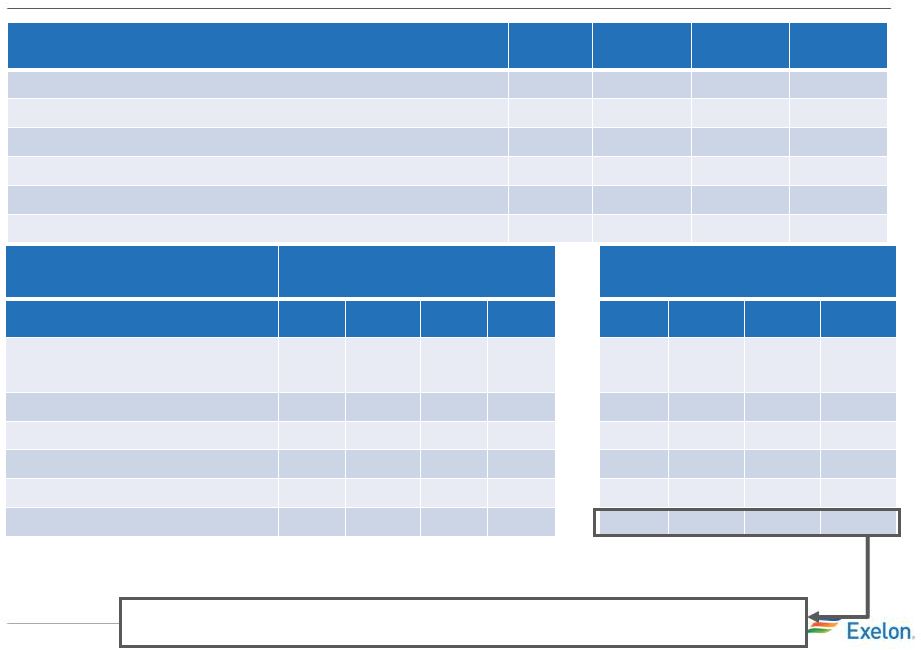
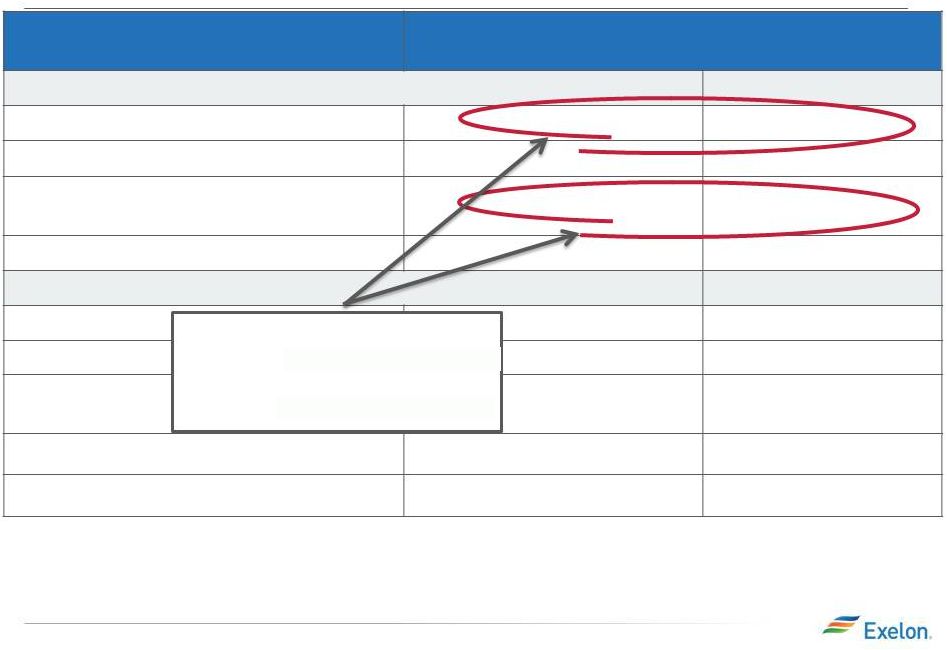
Exelon Consolidated Cash Flow: 2014 Expected vs 2013 Actuals Key Messages (6) • Adjusted Cash from Operations (2) is projected to be $6,100M vs 2013A of $6,025M for a $75M variance. This variance is primarily driven by: • Cash from Financing activities is projected to be ($825M) vs 2013A of ($775M) for a ($50M) variance. This variance is primarily driven by: • CapEx is projected to be $5,475M vs 2013A $5,350M for a ($125M) variance. This variance is primarily driven by: Projected Sources & Uses (6) 6 2013 4Q Earnings Release Slides 2014 Projected Sources and Uses of Cash (7) ($ in millions) BGE ComEd PECO ExGen Exelon 2014E Exelon 2013A Delta Beginning Cash Balance (1) 1,475 1,575 (100) Adjusted Cash Flow from Operations (2) 650 1,525 600 3,175 6,100 6,025 75 CapEx (excluding other items below): (525) (1,575) (450) (1,050) (3,675) (3,250) (425) Nuclear Fuel n/a n/a n/a (900) (900) (1,000) 100 Dividend (3) (1,075) (1,250) 175 Nuclear Uprates n/a n/a n/a (150) (150) (150) -- Wind n/a n/a n/a (75) (75) (25) (50) Solar n/a n/a n/a (200) (200) (450) 250 Upstream n/a n/a n/a (25) (25) (50) 25 Utility Smart Grid/Smart Meter (75) (200) (175) n/a (450) (425) (25) Net Financing (excluding Dividend): Debt Issuances -- 900 300 -- 1,200 1,200 -- Debt Retirements -- (625) (250) (525) (1,375) (1,600) 225 Project Finance/Federal Financing Bank Loan n/a n/a n/a 675 675 725 (50) Other (4) (50) 300 100 (375) (250) 150 1,275 1,475 (200) (3) Dividends are subject to declaration by the Board of Directors. (5) Includes cash flow activity from Holding Company, eliminations, and other corporate entities. (6) All amounts rounded to the nearest $25M. (1) Excludes counterparty collateral of $(28) million and $134 million at 12/31/12 and 12/31/13. In addition, the 12/31/14 ending cash balance does not include collateral. (2) Adjusted Cash Flow from Operations (non-GAAP) primarily includes net cash flows from operating activities and net cash flows from investing activities excluding capital expenditures of $5.5B and $5.4B for 2014 and 2013, respectively. (4) “Other” includes CENG distribution to EDF, proceeds from stock options, redemption of PECO preferred stock and expected changes in short-term debt. (7) Net 2014 sources and uses for each operating company are expected to be $0M, $325M, $125M and $550M for BGE, ComEd, PECO and ExGen, respectively. - $350M Increase in ComEd’s 2014 distribution rates - $125M Income Taxes and Settlements - ($150M) Higher working capital at the utilities - ($225M) Lower ExGen Gross Margin - ($350M) Higher ComEd investment in transmission, distribution and Smart Grid / Smart Meter - $225M AVSR due to majority of work being completed in 2013 - $100M Lower nuclear fuel expenditures - ($75M) Maryland commitments - ($400M) CENG distribution to EDF - $175M Increased ComEd LTD requirements primarily to fund incremental capital investment - $175M Reduced dividend to common shareholders (400) (5) (5) Ending Cash Balance (1) |