 Earnings Conference Call 2 nd Quarter 2014 July 31, 2014 Exhibit 99.2 |
 Cautionary Statements Regarding Forward-Looking Information This presentation contains certain forward-looking statements within the meaning of the Private Securities Litigation Reform Act of 1995, that are subject to risks and uncertainties. The factors that could cause actual results to differ materially from the forward-looking statements made by Exelon Corporation, Commonwealth Edison Company, PECO Energy Company, Baltimore Gas and Electric Company and Exelon Generation Company, LLC (Registrants) include those factors discussed herein, as well as the items discussed in (1) Exelon’s 2013 Annual Report on Form 10-K in (a) ITEM 1A. Risk Factors, (b) ITEM 7. Management’s Discussion and Analysis of Financial Condition and Results of Operations and (c) ITEM 8. Financial Statements and Supplementary Data: Note 22; (2) Exelon’s Second Quarter 2014 Quarterly Report on Form 10-Q (to be filed on July 31, 2014) in (a) Part II, Other Information, ITEM 1A. Risk Factors; (b) Part 1, Financial Information, ITEM 2. Management’s Discussion and Analysis of Financial Condition and Results of Operations and (c) Part I, Financial Information, ITEM 1. Financial Statements: Note 17; and (3) other factors discussed in filings with the SEC by the Registrants. Readers are cautioned not to place undue reliance on these forward-looking statements, which apply only as of the date of this presentation. None of the Registrants undertakes any obligation to publicly release any revision to its forward-looking statements to reflect events or circumstances after the date of this presentation. 1 2014 2Q Earnings Release Slides |
 • Pepco Holdings Acquisition • Successful equity issuance • Regulatory filings: • FERC, New Jersey, District of Columbia, Delaware, Virginia • Partnership with Bloom Energy • AVSR fully operational • Nuclear capacity factor over 91.8% (2) • Power dispatch match over 99.2% and renewables energy capture over 94.7% • EPA Greenhouse Gas Rule – 111(d) • IL House Resolution 1146 on importance of nuclear energy • ComEd and BGE rate cases 2014 2Q Earnings Release Slides 2 • Delivered Q2 adjusted operating earnings of $0.51 per share, exceeding our guidance range (1) Q2 2014 in Review (1) Represents adjusted (non-GAAP) operating EPS. Refer to the Earnings Release Attachments for additional details and to the Appendix for a reconciliation of adjusted (non-GAAP) operating EPS to GAAP EPS (2) Exelon operated plants at ownership including CENG. For comparability, Exelon plants excluding CENG had a 92.5% capacity factor (3) 2014 earnings guidance based on expected average outstanding shares of ~860M 2014 Expectations: Deliver adjusted operating earnings range of $0.60 to $0.70/share for Q3 2014 On-track to achieve full-year operating earnings within guidance range of $2.25-$2.55/share as disclosed on Q4 2013 earnings call (3) Financial Discipline Operational Excellence Regulatory Advocacy Opportunistic Growth • Integrys Energy Services Acquisition |
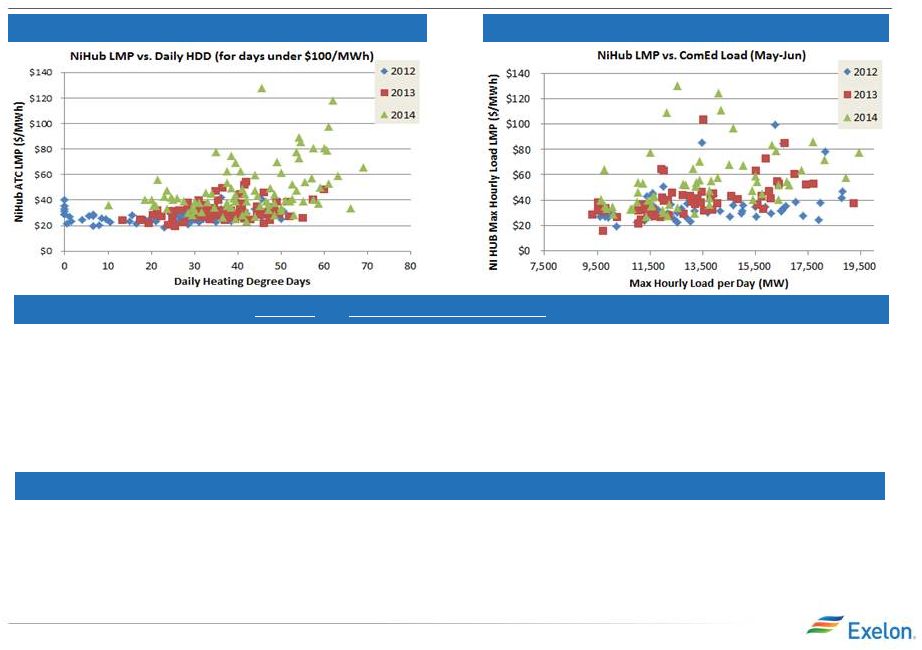 2014 Spot and Forward Market Volatility 3 Significant volatility and higher prices year over year during Q1 and Q2 of 2014 July weakness on the back of an unusually mild summer • Month-to-date CDDs are trending approximately 10% below normal nationally, and 35% in Chicago (NiHub) • July spot prices at PJM W and NiHub have cleared lower compared to the previous two years reflecting the lack of weather-related demand • Forward power and gas prices have also pulled back • During the first quarter, the polar vortex resulted in some extreme conditions and we saw spot prices in PJM reflecting the changing nature of the grid and new reliance on different resources such as NG supply, demand response, and oil peakers • During the second quarter, we saw continued volatility especially in the higher load ranges • Higher peak prices have led to higher average cleared LMP’s compared to the past two years • Continuous strength and liquidity in the spot market carried into the forward power market especially for 2015-2016 Q1 Spot Price Volatility Q2 Spot Price Volatility (1) (1) April data excluded; differences in unit outages during the month of April distort year-over-year comparisons 2014 2Q Earnings Release Slides |
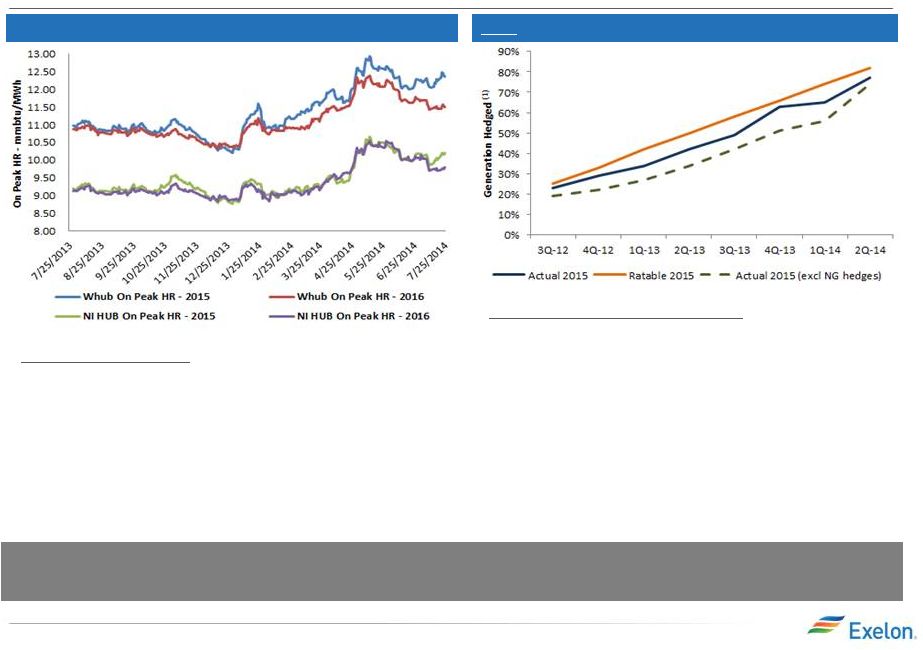 Forward Markets and Hedging Activity 2015: Took profit on our open position as prices moved up (1) Mid-point of disclosed total portfolio hedge % range was used • Over the past several quarters we positioned the portfolio to increase our exposure to power price upside relative to ratable • In response to the power price and heat rate moves during the second quarter, we switched our strategy from behind ratable to closer to ratable and we also reduced our cross-commodity position • When considering our move back to ratable and the reduction in our gas hedges we lowered our total portfolio power exposure by over 15% quarter-over-quarter • Increased market volatility has led to improved margins in the wholesale and retail load business 2014 2Q Earnings Release Slides Forward markets continued their upward trend in Q2 • Forward markets have a tendency to reflect spot market activity • While forward hub natural gas prices stayed relatively flat, power prices continued to trade higher during the second quarter and as a result heat rates expanded further in 2015 and 2016 • Increased volatility led to greater market liquidity • During July we have seen forward markets soften; our fundamental view of power upside remains in certain months/seasons in 2015 Locked in profit during Q2, and reduced power price exposure by over 15% and 10% respectively for 2015 and 2016 Impacts on Forward Markets Impacts of our view on our hedging activity 2014 2Q Earnings Release Slides 4 |
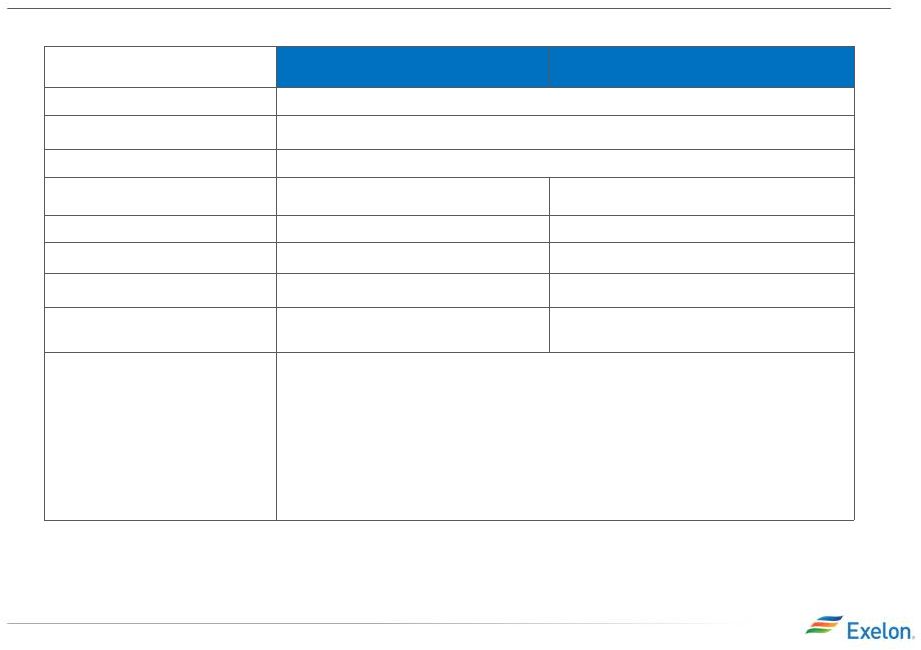
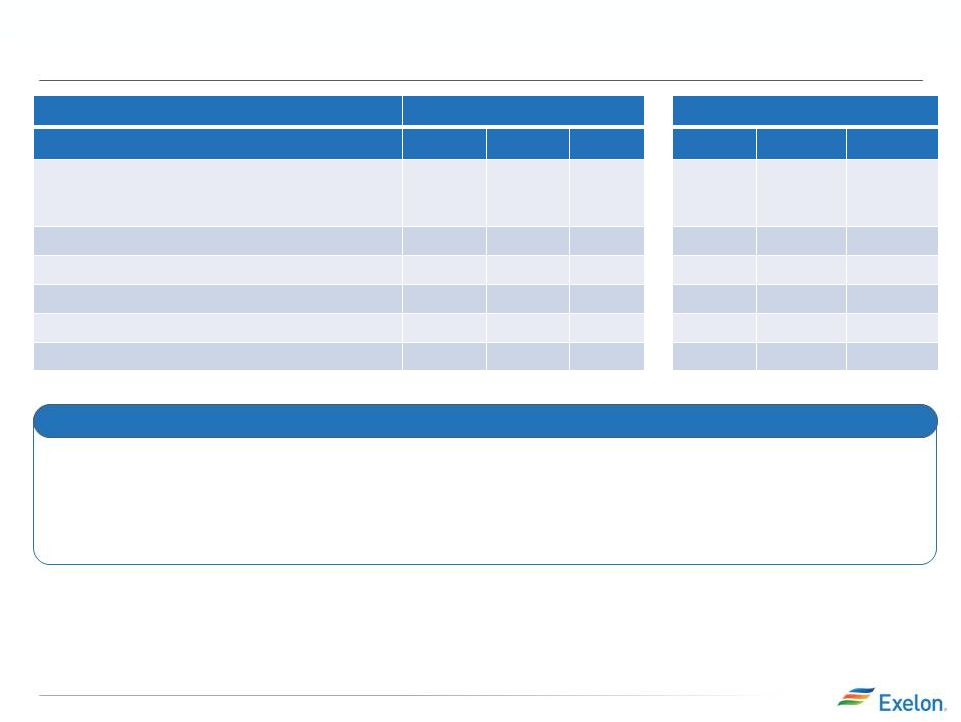 Exelon Generation: Gross Margin Update June 30, 2014 Change from March 31, 2014 Gross Margin Category ($M) (1) 2014 2015 2016 2014 2015 2016 Open Gross Margin (3) (including South, West, Canada hedged gross margin) 7,500 6,800 6,850 150 450 600 Mark-to-Market of Hedges (3,4) (700) 50 50 - (50) (50) Power New Business / To Go 150 500 550 (100) (100) (100) Non-Power Margins Executed 300 100 50 50 - - Non-Power New Business / To Go 100 300 350 (50) - - Total Gross Margin 7,350 7,750 7,850 50 300 450 2014 2Q Earnings Release Slides • Continued market volatility allowed us to execute on a significant piece of our new business targets bringing us closer to our ratable strategy • In Q2 we saw both spot and forward prices trading higher than in previous years • The return of volatility to the markets has led to more appropriate pricing of risk premiums Recent Developments 5 (1) Gross margin categories rounded to nearest $50M (2) Total Gross Margin (Non-GAAP) is defined as operating revenues less purchased power and fuel expense, excluding revenue related to decommissioning, gross receipts tax, Exelon Nuclear Partners and variable interest entities. Total Gross Margin is also net of direct cost of sales for certain Constellation businesses. See Slide 24 for a Non-GAAP to GAAP reconciliation of Total Gross Margin (3) Includes Exelon’s equity ownership share of the CENG Joint Venture (4) Mark to Market of Hedges assumes mid-point of hedge percentages (2) |
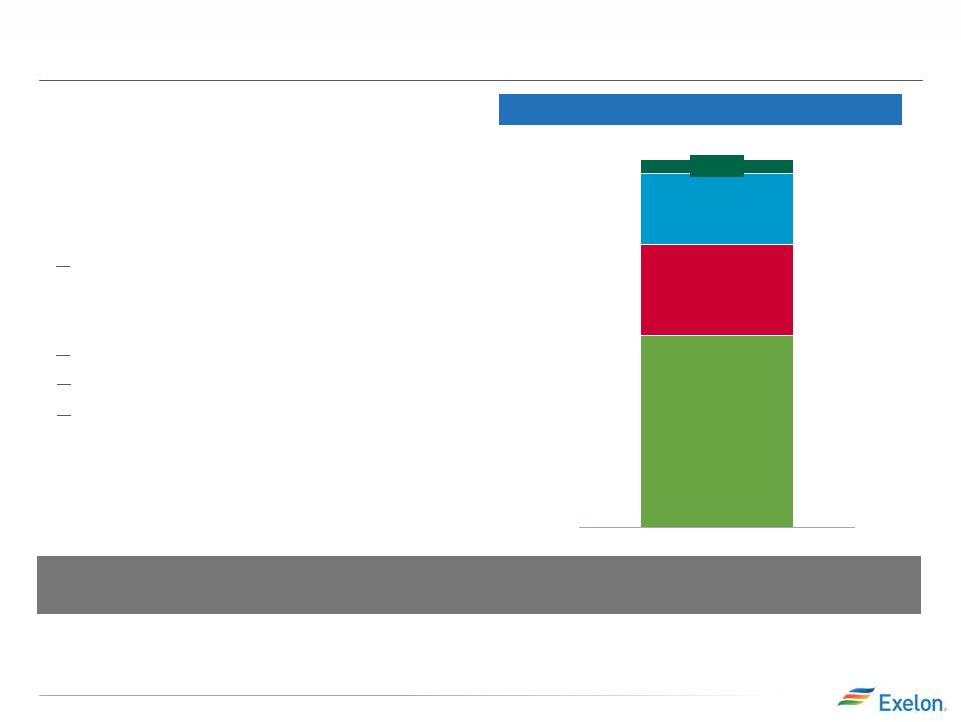 Key Financial Messages • Delivered adjusted (non-GAAP) operating earnings in Q2 of $0.51/share exceeding our guidance range of $0.40-$0.50/share • Utilities: Increased distribution revenue • ExGen Lower realized energy prices Increased capacity pricing Elimination of DOE nuclear waste fee 6 Expect Q3 2014 earnings of $0.60 - $0.70/share and re-affirm full-year guidance range of $2.25 - $2.55/share (2) $0.27 $0.13 $0.10 ExGen ComEd PECO BGE $0.51 $0.02 2Q 2014 Adjusted Operating EPS (1,3) 2014 2Q Earnings Release Slides (1) Refer to the Earnings Release Attachments for additional details and to the Appendix for a reconciliation of adjusted (non-GAAP) operating EPS to GAAP EPS (2) 2014 earnings guidance based on expected average outstanding shares of ~860M (3) Amounts may not add due to rounding |
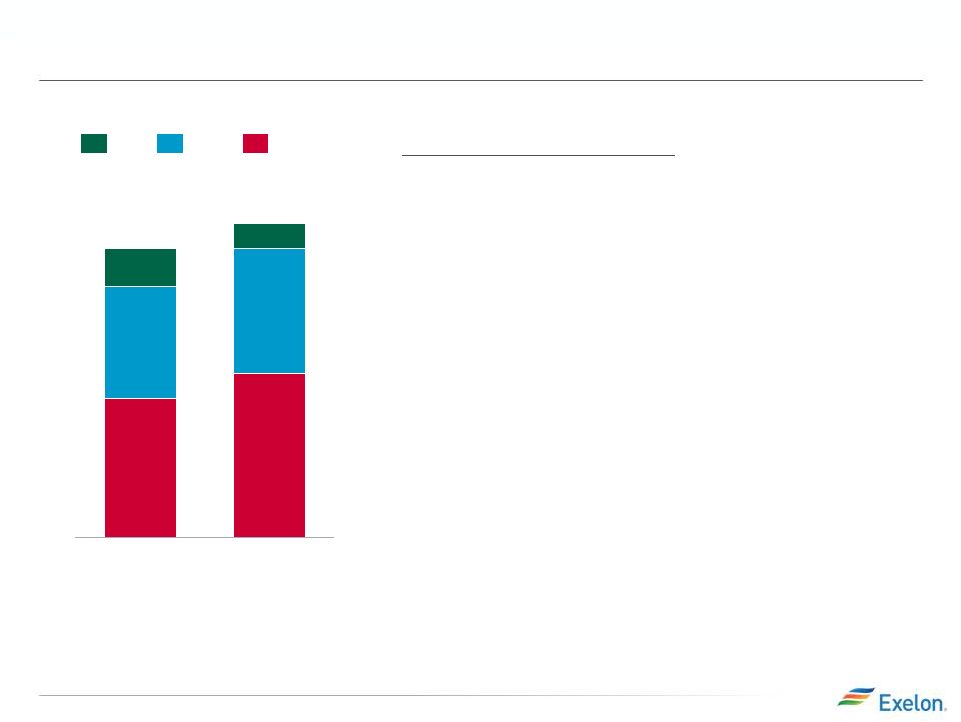 Exelon Utilities Adjusted Operating EPS Contribution (1) BGE (-0.01): • Increased O&M costs, primarily due to bad debt expense and labor, contracting, and materials: $(0.02) • Distribution revenue due to rate cases: $0.01 PECO (+0.01): • Decreased income tax expense due to an increase in electric tax repairs deduction: $0.01 ComEd (+0.02): • Increased distribution earnings due to increased capital investment (2) : $0.01 2014 2Q Earnings Release Slides 2Q 2014 $0.25 $0.13 $0.10 $0.02 2Q 2013 $0.23 $0.11 $0.09 $0.03 ComEd BGE PECO Note: Numbers may not add due to rounding 7 (1) Refer to the Earnings Release Attachments for additional details and to the Appendix for a reconciliation of adjusted (non-GAAP) operating EPS to GAAP EPS (2) Due to the distribution formula rate, changes in ComEd’s earnings are driven primarily by changes in 30-year U.S. Treasury rates (allowed ROE), rate base and capital structure in addition to weather, load and changes in customer mix Key Drivers – 2Q14 vs. 2Q13 : |
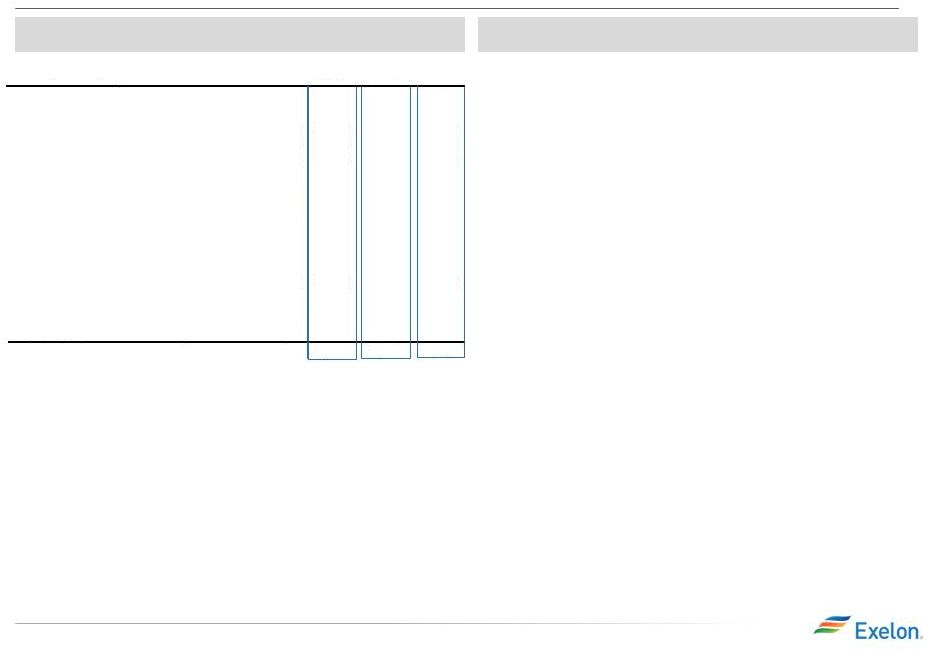 2014 Projected Sources and Uses of Cash Key Messages (1) • Cash from Operations is projected to be $6,975M vs. 1Q14E of $6,200M for a $775M variance. This variance is driven by: • Cash from Financing activities is projected to be $250M vs. 1Q14E of ($825M) for a $1,075M variance. This variance is driven by: • Cash from Investing activities is projected to be ($5,450M) vs. 1Q14E of ($5,375M) for a ($75M) variance. Projected Sources & Uses (1) (1) All amounts rounded to the nearest $25M. (2) Excludes counterparty collateral of $134 million at 12/31/2013. In addition, the 12/31/2014 ending cash balance does not include collateral. (3) Includes cash flow activity from Holding Company, eliminations, and other corporate entities. CapEx for Exelon is shown net of $325M CPS early lease termination fee. (4) Adjusted Cash Flow from Operations (non-GAAP) primarily includes net cash flows from operating activities and net cash flows from investing activities excluding capital expenditures of $5.4B for 2014. (5) Dividends are subject to declaration by the Board of Directors. (6) “Other Financing” primarily includes CENG distribution to EDF, expected changes in short-term debt, and proceeds from issuance of mandatory convertible units. ($ in millions) BGE ComEd PECO ExGen Exelon (3) As of 1Q14 Variance Beginning Cash Balance (2) 1,475 1,475 – Adjusted Cash Flow from Operations (4) 650 1,575 625 4,200 6,975 6,200 775 CapEx (excluding other items below): (525) (1,500) (525) (1,150) (3,450) (3,475) 25 Nuclear Fuel n/a n/a n/a (1,000) (1,000) (975) (25) Dividend (5) (1,075) (1,075) – Nuclear Uprates n/a n/a n/a (150) (150) (150) – Wind n/a n/a n/a (75) (75) (75) – Solar n/a n/a n/a (200) (200) (200) – Upstream n/a n/a n/a (50) (50) (50) – Utility Smart Grid/Smart Meter (75) (275) (150) n/a (525) (450) (75) Net Financing (excluding Dividend): Debt Issuances 950 300 – 1,250 1,250 – Debt Retirements – (625) (250) (525) (1,375) (1,375) – Project Finance/Federal Financing Bank Loan n/a n/a n/a 875 875 675 200 – Other Financing (6) (50) 200 125 (425) 575 (300) 875 Ending Cash Balance (2) 3,250 1,475 1,775 – 2014 2Q Earnings Release Slides 8 - $400M Net proceeds from divestitures - $300M Income taxes and settlements - $150M Decreased OPEB contributions (primarily ComEd and ExGen) - ($125M) Purchase of PHI preferred stock - $75M Working capital and regulatory assets at Utilities - $1,125 Net proceeds from issuance of mandatory convertible units - $200M Incremental project financing at ExGen - ($150M) Decrease in projected commercial paper financing |
 Exelon Generation Disclosures June 30, 2014 2014 2Q Earnings Release Slides 9 |
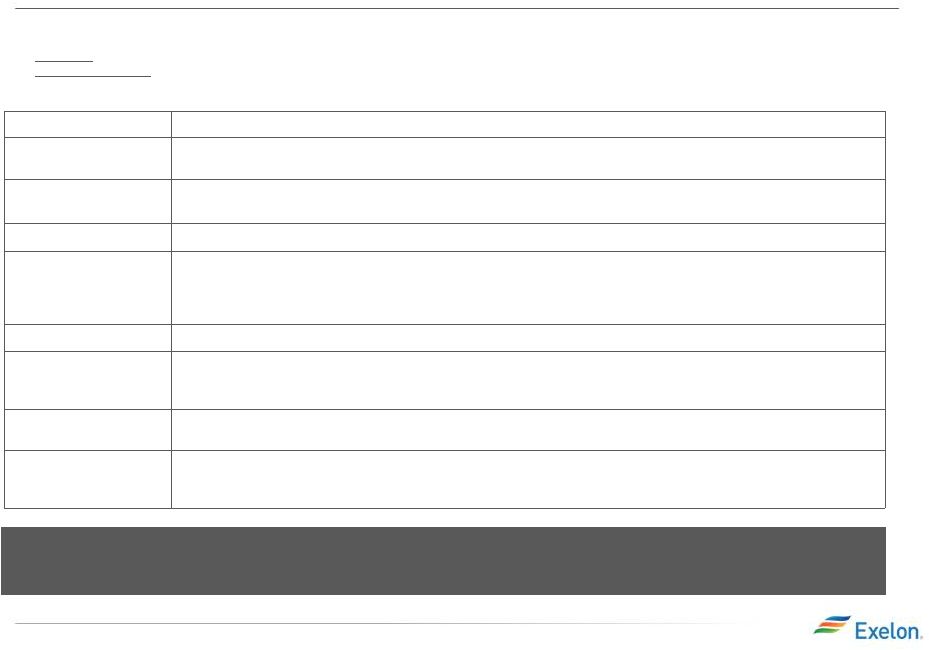
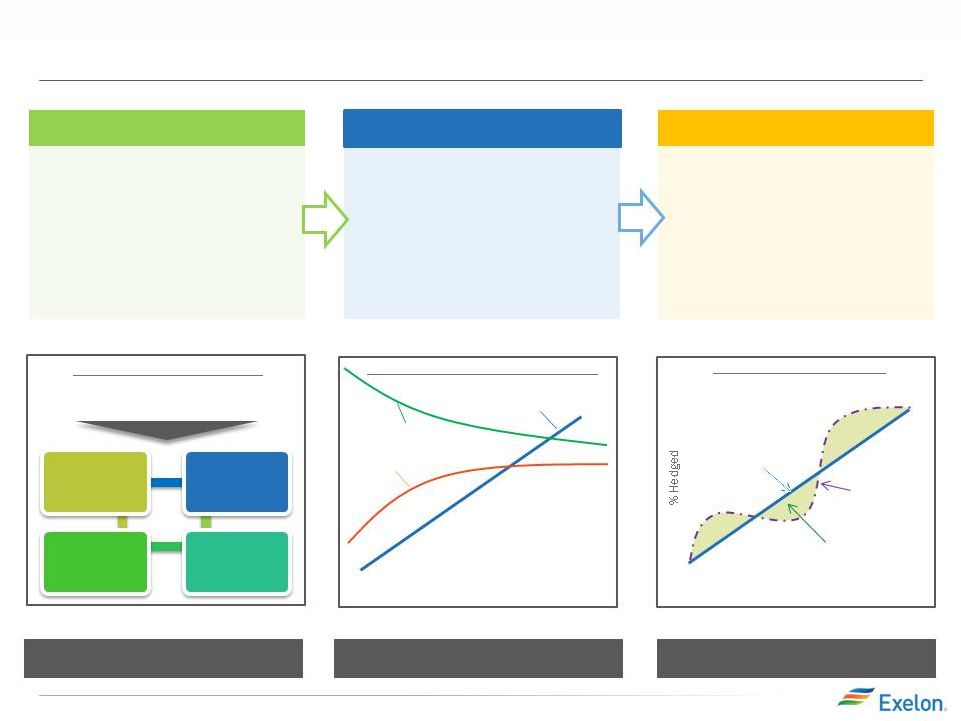 Portfolio Management Strategy Protect Balance Sheet Ensure Earnings Stability Create Value Exercising Market Views Purely ratable Actual hedge % Market views on timing, product allocation and regional spreads reflected in actual hedge % High End of Profit Low End of Profit % Hedged Open Generation with LT Contracts Portfolio Management & Optimization Portfolio Management Over Time Align Hedging & Financials Establishing Minimum Hedge Targets 2014 2Q Earnings Release Slides 10 Strategic Policy Alignment Three-Year Ratable Hedging Bull / Bear Program •Ability to exercise fundamental market views to create value within the ratable framework •Modified timing of hedges versus purely ratable •Cross-commodity hedging (heat rate positions, options, etc.) •Delivery locations, regional and zonal spread relationships Credit Rating Capital Structure Capital & Operating Expenditure Dividend •Aligns hedging program with financial policies and financial outlook •Establish minimum hedge targets to meet financial objectives of the company (dividend, credit rating) •Hedge enough commodity risk to meet future cash requirements under a stress scenario •Ensure stability in near-term cash flows and earnings •Disciplined approach to hedging •Tenor aligns with customer preferences and market liquidity •Multiple channels to market that allow us to maximize margins •Large open position in outer years to benefit from price upside |
 Components of Gross Margin Categories Margins move from new business to MtM of hedges over the course of the year as sales are executed (5) Margins move from “Non power new business” to “Non power executed” over the course of the year Gross margin linked to power production and sales Gross margin from other business activities 2014 2Q Earnings Release Slides 11 (1) Hedged gross margins for South, West and Canada region will be included with Open Gross Margin, and no expected generation, hedge %, EREP or reference prices provided for this region (2) MtM of hedges provided directly for the five larger regions. MtM of hedges is not provided directly at the regional level but can be easily estimated using EREP, reference price and hedged MWh (3) Proprietary trading gross margins will remain within “Non Power” New Business category and not move to “Non Power” Executed category (4) Gross margin for these businesses are net of direct “cost of sales” (5) Margins for South, West & Canada regions and optimization of fuel and PPA activities captured in Open Gross Margin Open Gross Margin •Generation Gross Margin at current market prices, including capacity and ancillary revenues, nuclear fuel amortization and fossils fuels expense •Exploration and Production (4) •Power Purchase Agreement (PPA) Costs and Revenues •Provided at a consolidated level for all regions (includes hedged gross margin for South, West and Canada (1) ) MtM of Hedges (2) •Mark to Market (MtM) of power, capacity and ancillary hedges, including cross commodity, retail and wholesale load transactions •Provided directly at a consolidated level for five major regions. Provided indirectly for each of the five major regions via Effective Realized Energy Price (EREP), reference price, hedge %, expected generation “Power” New Business •Retail, Wholesale planned electric sales •Portfolio Management new business •Mid marketing new business “Non Power” Executed •Retail, Wholesale executed gas sales •Load Response •Energy Efficiency (4) •BGE Home (4) •Distributed Solar “Non Power” New Business •Retail, Wholesale planned gas sales •Load Response •Energy Efficiency (4) •BGE Home (4) •Distributed Solar •Portfolio Management / origination fuels new business •Proprietary trading (3) |
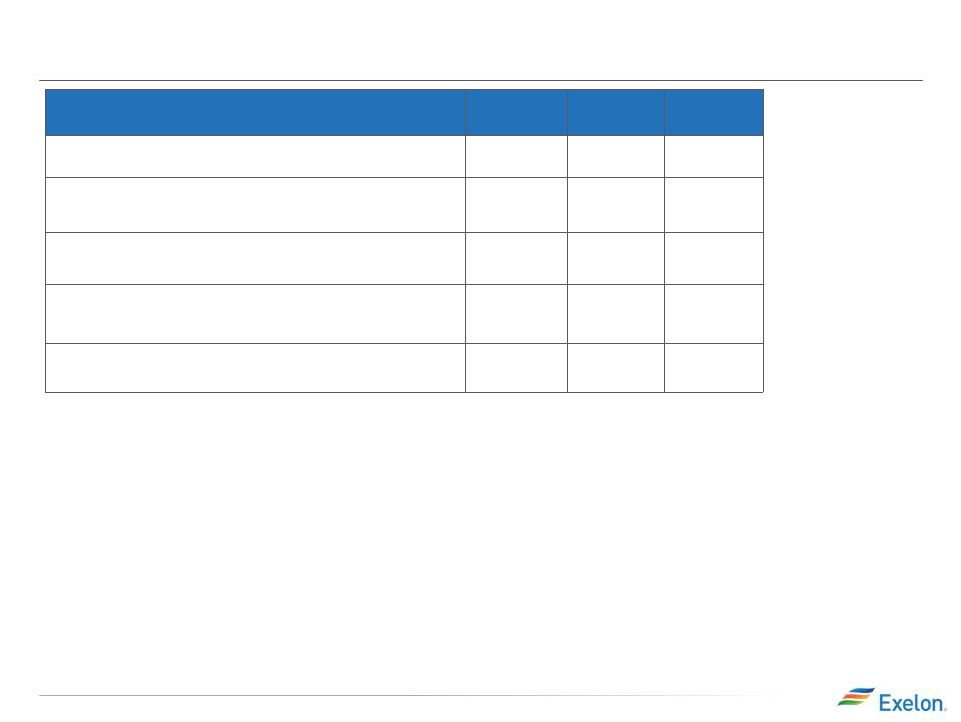
 ExGen Disclosures Gross Margin Category ($M) (1) 2014 2015 2016 Open Gross Margin (including South, West & Canada hedged GM) (3) 7,500 6,800 6,850 Mark to Market of Hedges (3,4) (700) 50 50 Power New Business / To Go 150 500 550 Non-Power Margins Executed 300 100 50 Non-Power New Business / To Go 100 300 350 Total Gross Margin 7,350 7,750 7,850 12 (4) Mark to Market of Hedges assumes mid-point of hedge percentages (5) Based on June 30, 2014 market conditions (1) Gross margin categories rounded to nearest $50M (2) Total Gross Margin (Non-GAAP) is defined as operating revenues less purchased power and fuel expense, excluding revenue related to decommissioning, gross receipts tax, Exelon Nuclear Partners and variable interest entities. Total Gross Margin is also net of direct cost of sales for certain Constellation businesses. See Slide 24 for a Non-GAAP to GAAP reconciliation of Total Gross Margin (3) Includes Exelon’s equity ownership share of the CENG Joint Venture 2014 2Q Earnings Release Slides Reference Prices (5) 2014 2015 2016 Henry Hub Natural Gas ($/MMbtu) $4.63 $4.22 $4.24 Midwest: NiHub ATC prices ($/MWh) $41.12 $33.95 $34.78 Mid-Atlantic: PJM-W ATC prices ($/MWh) $54.47 $42.26 $41.36 ERCOT-N ATC Spark Spread ($/MWh) HSC Gas, 7.2HR, $2.50 VOM $5.02 $6.33 $6.34 New York: NY Zone A ($/MWh) $51.49 $40.99 $39.51 New England: Mass Hub ATC Spark Spread($/MWh) ALQN Gas, 7.5HR, $0.50 VOM $3.68 $5.56 $4.33 (2) |
 ExGen Disclosures Generation and Hedges 2014 2015 2016 Expected Generation (GWh) (1) 208,100 203,700 205,400 Midwest 97,200 96,800 97,900 Mid-Atlantic (2) 74,600 70,600 71,700 ERCOT 14,300 18,100 19,000 New York (2) 12,700 9,400 9,300 New England 9,300 8,800 7,500 % of Expected Generation Hedged (3) 92-95% 75-78% 46-49% Midwest 95-98% 76-79% 45-48% Mid-Atlantic (2) 88-91% 73-76% 45-48% ERCOT 97-100% 79-82% 56-59% New York (2) 97-100% 68-71% 68-71% New England 88-91% 76-79% 29-32% Effective Realized Energy Price ($/MWh) (4) Midwest $37.00 $33.50 $35.00 Mid-Atlantic (2) $48.50 $43.50 $43.50 ERCOT (5) $14.50 $8.00 $5.00 New York (2) $43.50 $43.00 $39.00 New England (5) $8.50 $7.00 $3.00 2014 2Q Earnings Release Slides 13 (1) Expected generation represents the amount of energy estimated to be generated or purchased through owned or contracted for capacity. Expected generation is based upon a simulated dispatch model that makes assumptions regarding future market conditions, which are calibrated to market quotes for power, fuel, load following products, and options. Expected generation assumes 14 refueling outages in 2014 and 2015 and 12 refueling outages in 2016 at Exelon-operated nuclear plants, and Salem. Expected generation assumes capacity factors of 93.5%, 93.5% and 93.7% in 2014, 2015 and 2016 at Exelon-operated nuclear plants, at ownership. These estimates of expected generation in 2015 and 2016 do not represent guidance or a forecast of future results as Exelon has not completed its planning or optimization processes for those years. (2) Includes Exelon’s equity ownership share of CENG Joint Venture. (3) Percent of expected generation hedged is the amount of equivalent sales divided by expected generation. Includes all hedging products, such as wholesale and retail sales of power, options and swaps. Uses expected value on options. (4) Effective realized energy price is representative of an all-in hedged price, on a per MWh basis, at which expected generation has been hedged. It is developed by considering the energy revenues and costs associated with our hedges and by considering the fossil fuel that has been purchased to lock in margin. It excludes uranium costs and RPM capacity revenue, but includes the mark-to-market value of capacity contracted at prices other than RPM clearing prices including our load obligations. It can be compared with the reference prices used to calculate open gross margin in order to determine the mark-to-market value of Exelon Generation's energy hedges. (5) Spark spreads shown for ERCOT and New England. |
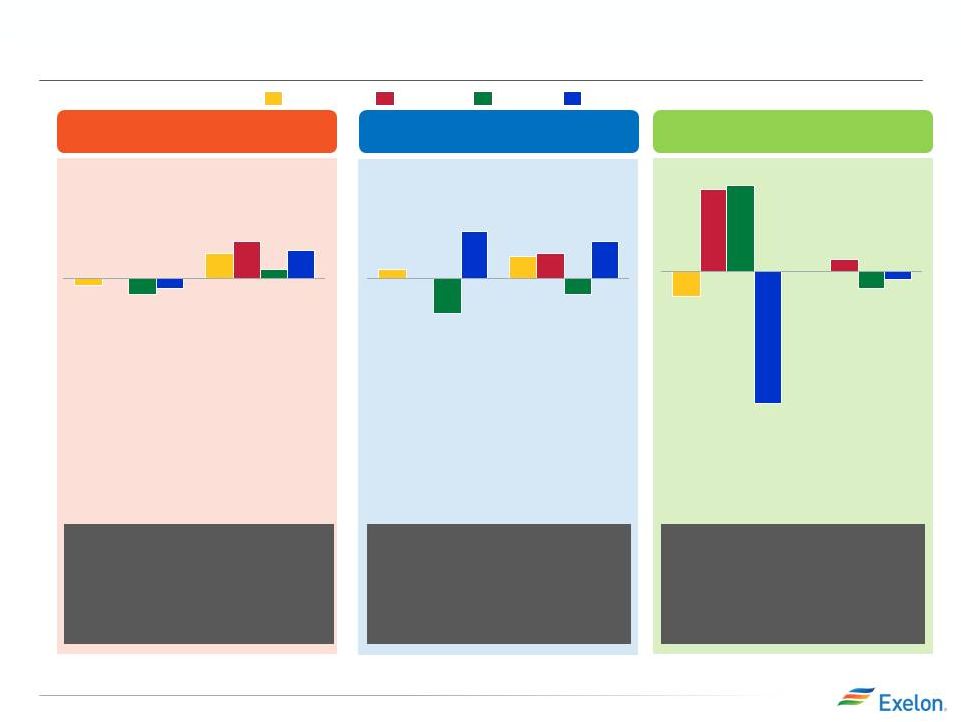
 ExGen Hedged Gross Margin Sensitivities Gross Margin Sensitivities (With Existing Hedges) (1, 2) 2014 2015 2016 Henry Hub Natural Gas ($/Mmbtu) + $1/Mmbtu $10 $190 $415 - $1/Mmbtu $(30) $(125) $(370) NiHub ATC Energy Price + $5/MWh $5 $150 $300 - $5/MWh $(5) $(145) $(300) PJM-W ATC Energy Price + $5/MWh $5 $85 $195 - $5/MWh $- $(75) $(190) NYPP Zone A ATC Energy Price + $5/MWh $5 $15 $15 - $5/MWh $(5) $(15) $(15) Nuclear Capacity Factor (3) +/- 1% +/- $30 +/- $50 +/- $50 2014 2Q Earnings Release Slides 14 (1) Based on June 30, 2014 market conditions and hedged position. Gas price sensitivities are based on an assumed gas-power relationship derived from an internal model that is updated periodically. Power prices sensitivities are derived by adjusting the power price assumption while keeping all other price inputs constant. Due to correlation of the various assumptions, the hedged gross margin impact calculated by aggregating individual sensitivities may not be equal to the hedged gross margin impact calculated when correlations between the various assumptions are also considered. (2) Sensitivities based on commodity exposure which includes open generation and all committed transactions. (3) Includes Exelon’s equity ownership share of the CENG Joint Venture. |
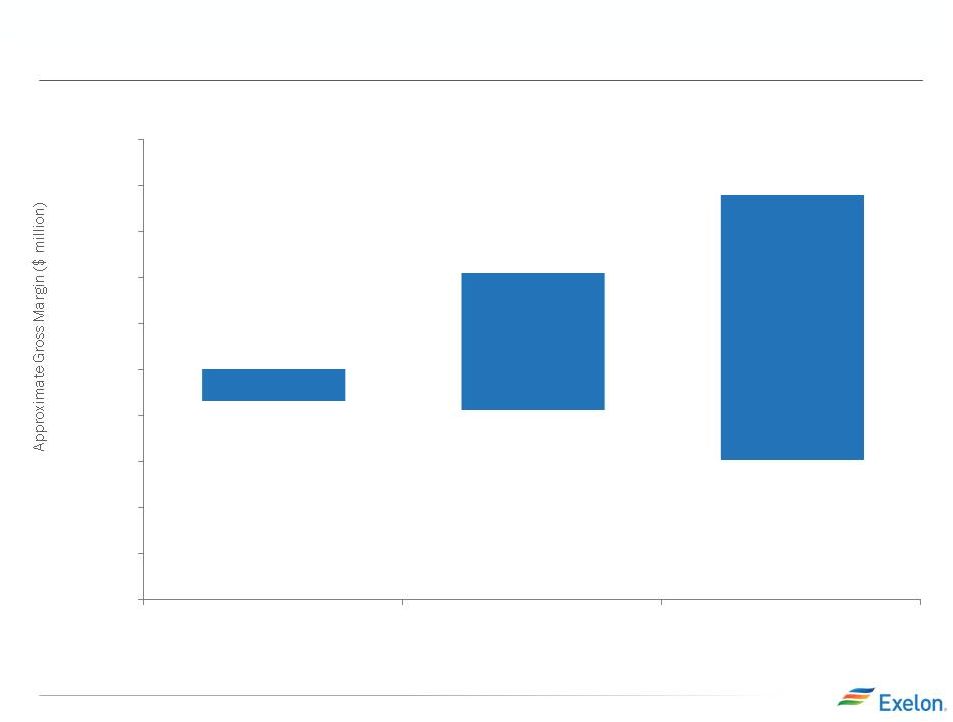 ExGen Hedged Gross Margin Upside/Risk $7,500 $7,150 $8,550 $7,050 2014 2Q Earnings Release Slides 15 5,000 5,500 6,000 6,500 7,000 7,500 8,000 8,500 9,000 9,500 10,000 2014 2015 2016 $9,400 $6,500 |
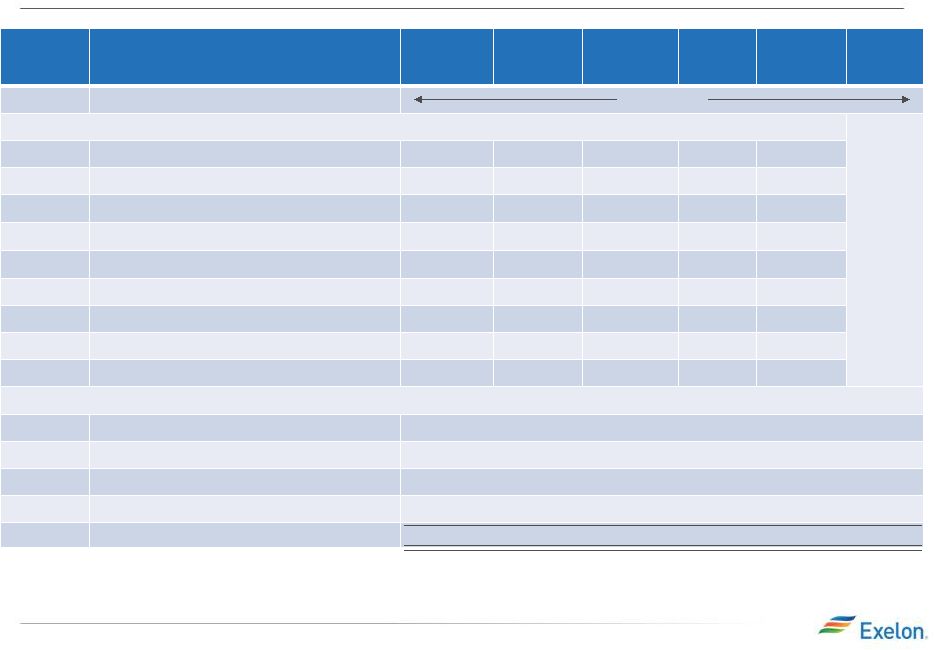 (1) Mark-to-market rounded to the nearest $5 million. (2) Total Gross Margin (Non-GAAP) is defined as operating revenues less purchased power and fuel expense, excluding revenue related to decommissioning, gross receipts tax, Exelon Nuclear Partners and variable interest entities. Total Gross Margin is also net of direct cost of sales for certain Constellation businesses. See Slide 24 for a Non-GAAP to GAAP reconciliation of Total Gross Margin. Illustrative Example of Modeling Exelon Generation 2015 Gross Margin Row Item Midwest Mid- Atlantic ERCOT New York New England South, West & Canada (A) Start with fleet-wide open gross margin $6.80 billion (B) Expected Generation (TWh) 96.8 70.6 18.1 9.4 8.8 (C) Hedge % (assuming mid-point of range) 77.5% 74.5% 80.5% 69.5% 77.5% (D=B*C) Hedged Volume (TWh) 75.0 52.6 14.6 6.5 6.8 (E) Effective Realized Energy Price ($/MWh) $33.50 $43.50 $8.00 $43.00 $7.00 (F) Reference Price ($/MWh) $33.95 $42.26 $6.33 $40.99 $5.56 (G=E-F) Difference ($/MWh) $(0.45) $1.24 $1.67 $2.01 $1.44 (H=D*G) Mark-to-market value of hedges ($ million) (1) $(35) million $65 million $25 million $15 million $10 million (I=A+H) Hedged Gross Margin ($ million) $6,850 million (J) Power New Business / To Go ($ million) $500 million (K) Non-Power Margins Executed ($ million) $100 million (L) Non- Power New Business / To Go ($ million) $300 million (N=I+J+K+L) Total Gross Margin (2) $7,750 million 2014 2Q Earnings Release Slides 16 |
 Additional Disclosures 2014 2Q Earnings Release Slides 17 |
 BGE 2014 load growth is flat to 2013, due to slower economic conditions and continued energy efficiency impacts. Exelon Utilities Weather-Normalized Load 2014E 0.9% 0.3% 1.2% 0.8% 2013 -0.3% -0.5% 0.0% -0.2% Large C&I Small C&I Residential All Customers ComEd 2014 overall load growth is greater than 2013. All three customer classes have positive growth due to slowly improving economic conditions partially mitigated by energy efficiency. 2014E 1.2% -0.5% 0.8% 0.7% 2013 1.5% -1.1% 0.0% 0.3% PECO 2014 load growth is driven primarily by Residential and Large C&I, partially offset by Small C&I. Slowly improving economic conditions & moderate customer growth are partially offset by energy efficiency. -0.4% 0.3% 0.0% 2013 -3.2% 2.1% 2.0% -0.6% 2014E -0.2% Chicago GMP 2.5% Chicago Unemployment 6.9% Philadelphia GMP 1.7% Philadelphia Unemployment 6.4% Baltimore GMP 2.6% Baltimore Unemployment 6.0% 18 2014 2Q Earnings Release Slides Notes: Data is not adjusted for leap year. Source of economic outlook data is Global Insight (April/May 2014). Assumes 2014 GDP of 2.4% and U.S unemployment of 6.1%. ComEd has the ROE collar as part of the distribution formula rate and BGE is decoupled which mitigates the load risk. QTD and YTD actual data can be found in earnings release tables. BGE amounts have been adjusted for true-up load from prior quarters. |
 2014 2Q Earnings Release Slides 19 ComEd April 2014 Distribution Formula Rate Docket # 14-0312 Filing Year 2013 Calendar Year Actual Costs and 2014 Projected Net Plant Additions are used to set the rates for calendar year 2015. Rates currently in effect (docket 13-0318) for calendar year 2014 were based on 2012 actual costs and 2013 projected net plant additions Reconciliation Year Reconciles Revenue Requirement reflected in rates during 2013 to 2013 Actual Costs Incurred. Revenue requirement for 2013 is based on docket 13-0386 filed in June 2013 and reflect the impacts of PA 98-0015 (SB9) Common Equity Ratio ~ 46% for both the filing and reconciliation year ROE 9.25% for the filing year (2013 30-yr Treasury Yield of 3.45% + 580 basis point risk premium) and 9.20% for the reconciliation year (2013 30-yr Treasury Yield of 3.45% + 580 basis point risk premium – 5 basis points performance metrics penalty). For 2014 and 2015, the actual allowed ROE reflected in net income will ultimately be based on the average of the 30-year Treasury Yield during the respective years plus 580 basis point spread, absent any metric penalties Requested Rate of Return ~ 7% for the both the filing and reconciliation Year Rate Base (1) $7,369 million– Filing year (represents projected year-end rate base using 2013 actual plus 2014 projected capital additions). 2014 and 2015 earnings will reflect 2014 and 2015 year-end rate base respectively. $6,596 million - Reconciliation year (represents year-end rate base for 2013) Revenue Requirement Increase (1) $269M ($95M is due to the 2013 reconciliation, $174M relates to the filing year). The 2013 reconciliation impact on net income was recorded in 2013 as a regulatory asset. Timeline (1) Amounts represent ComEd’s position filed in rebuttal testimony on July 23, 2014. Note: Disallowance of any items in the 2014 distribution formula rate filing could impact 2014 earnings in the form of a regulatory asset adjustment. Given the retroactive ratemaking provision in the EIMA legislation, ComEd net income during the year will be based on actual costs with a regulatory asset/liability recorded to reflect any under/over recovery reflected in rates. Revenue Requirement in rate filings impacts cash flow. • 04/16/14 Filing Date • 240 Day Proceeding • ICC order expected by December 12, 2014 The 2014 distribution formula rate filing establishes the net revenue requirement used to set the rates that will take effect in January 2015 after the ICC’s review. There are two components to the annual distribution formula rate filing: • Based on prior year costs (2013) and current year (2014) projected plant additions. • Annual Reconciliation: For the prior calendar year (2013), this amount reconciles the revenue requirement reflected in rates during the prior year (2013) in effect to the actual costs for that year. The annual reconciliation impacts cash flow in the following year (2015) but the earnings impact has been recorded in the prior year (2013) as a regulatory asset. Filing Year: |
 2014 2Q Earnings Release Slides 20 BGE July Rate Case Filing (1) Revenue requirement based on 9 months of actual data, 3 months of forecasted data. Operating results and capital structure will be updated with actual August 31, 2014 data when the results become available. Electric Gas Docket # 9355 Test Year September 2013 - August 2014 Common Equity Ratio (1) 53.3% Requested ROE 10.65% 10.55% Requested Rate of Return 8.07% 8.01% Rate Base (adjusted) $2.9B $1.2B Revenue Requirement Increase (1) $117.6M $67.5M Proposed Distribution Increase as % of overall bill 3% 7% Timeline • 07/02/14 BGE filed application with the MDPSC seeking increases in electric & gas distribution base rates • 210 Day Proceeding • 7/08/14 – Case delegated to the Public Utility Law Judge Division • Delegation of the case to the PULJ Division will add several additional procedural steps before a final order is issued (PULJ proposed order, appeals of PULJ order) which will compress the time frame for everything else • 01/28/2015 - PSC order expected • New rates are in effect shortly after the final order |
 Appendix Reconciliation of Non-GAAP Measures 2014 2Q Earnings Release Slides 21 |
 2Q GAAP EPS Reconciliation Three Months Ended June 30, 2014 ExGen ComEd PECO BGE Other Exelon 2014 Adjusted (non-GAAP) Operating Earnings (Loss) Per Share $0.27 $0.13 $0.10 $0.02 $(0.00) $0.51 Mark-to-market impact of economic hedging activities (0.01) - - - - (0.01) Unrealized gains related to NDT fund investments 0.09 - - - - 0.09 Merger and integration costs (0.02) - - - - (0.02) Amortization of commodity contract intangibles (0.03) - - - - (0.03) Long-Lived Asset Impairment (0.06) - - - (0.02) (0.08) Gain on CENG Integration 0.18 - - - - 0.18 PHI Acquisition Costs - - - - (0.01) (0.01) Non-Controlling Interest (0.03) - - - - (0.03) 2Q 2014 GAAP Earnings (Loss) Per Share $0.39 $0.13 $0.10 $0.02 $(0.03) $0.60 NOTE: All amounts shown are per Exelon share and represent contributions to Exelon's EPS. Amounts may not add due to rounding. 2014 2Q Earnings Release Slides 22 Three Months Ended June 30, 2013 ExGen ComEd PECO BGE Other Exelon 2013 Adjusted (non-GAAP) Operating Earnings Per Share $0.32 $0.11 $0.09 $0.03 $(0.01) $0.53 Mark-to-market impact of economic hedging activities 0.30 - - - (0.01) 0.30 Unrealized losses related to nuclear decommissioning trust funds (0.03) - - - - (0.03) Merger and integration costs (0.01) - (0.00) (0.00) - (0.02) Amortization of commodity contract intangibles (0.13) - - - - (0.13) Amortization of the fair value of certain debt 0.00 - - - - 0.00 Long-Lived Asset Impairment (0.07) - - - (0.01) (0.08) 2Q 2013 GAAP Earnings (Loss) Per Share $0.38 $0.11 $0.08 $0.03 $(0.03) $0.57 |
 GAAP to Operating Adjustments NOTE: All amounts shown are per Exelon share and represent contributions to Exelon's EPS. Amounts may not add due to rounding 2014 2Q Earnings Release Slides 23 • Exelon’s 2014 adjusted (non-GAAP) operating earnings excludes the earnings effects of the following: Mark-to-market adjustments from economic hedging activities Unrealized gains from NDT fund investments to the extent not offset by contractual accounting as described in the notes to the consolidated financial statements Certain costs incurred associated with the Constellation and CENG merger and integration initiatives Non-cash amortization of intangible assets, net, related to commodity contracts recorded at fair value at the Constellation merger date and CENG integration date for 2014 Impairment of certain wind generating assets. Gain recorded upon consolidation of CENG. Costs incurred associated with the Pepco Holdings Inc. acquisition. CENG interest not owned by Generation, where applicable. |
 ExGen Total Gross Margin Reconciliation to GAAP Total Gross Margin Reconciliation (in $M) (5) 2014 2015 2016 Revenue Net of Purchased Power and Fuel Expense (1)(6) $7,750 $8,350 $8,450 Non-cash amortization of intangible assets, net, related to commodity contracts recorded at fair value at the merger date (2) $100 - - Other Revenues (3) $(200) $(250) $(250) Direct cost of sales incurred to generate revenues for certain Constellation businesses (4) $(300) $(350) $(350) Total Gross Margin (Non-GAAP, as shown on slide 14) $7,350 $7,750 $7,850 2014 2Q Earnings Release Slides (1) Revenue net of purchased power and fuel expense (RNF), a non-GAAP measure, is calculated as the GAAP measure of operating revenue less the GAAP measure of purchased power and fuel expense. ExGen does not forecast the GAAP components of RNF separately. RNF also includes the RNF of our equity ownership share of CENG (2) The exclusion from operating earnings for activities related to the merger with Constellation ends after 2014 (3) Reflects revenues from Exelon Nuclear Partners, variable interest entities, funds collected through revenues for decommissioning the former PECO nuclear plants through regulated rates and gross receipts tax revenues (4) Reflects the cost of sales and depreciation expense of certain Constellation businesses of Generation (5) All amounts rounded to the nearest $50M (6) Excludes the impact of the operating exclusion for mark-to-market due to the volatility and unpredictability of the future changes to power prices. Mark-to- market losses were ~$750 million for the six months ended June 30, 2014 2014 2Q Earnings Release Slides 24 |