UNITED STATES
SECURITIES AND EXCHANGE COMMISSION
Washington, DC 20549
FORM N-CSR
CERTIFIED SHAREHOLDER REPORT OF REGISTERED
MANAGEMENT INVESTMENT COMPANIES
Investment Company Act file number 811-09869
Franklin Floating Rate Master Trust
(Exact name of registrant as specified in charter)
One Franklin Parkway, San Mateo, CA 94403-1906
(Address of principal executive offices) (Zip code)
Alison Baur, One Franklin Parkway, San Mateo, CA 94403-1906
(Name and address of agent for service)
Registrant’s telephone number, including area code:
(650)312-2000
Date of fiscal year end: 7/31
Date of reporting period: 7/31/24
Item 1. Reports to Stockholders.
| a.) | The following is a copy of the report transmitted to shareholders pursuant to Rule 30e-1 under the Investment Company Act of 1940, as amended (the “1940 Act”) (17 CFR 270.30e-1). |
| | |
| b.) | Include a copy of each notice transmitted to stockholders in reliance on Rule 30e-3 under the Act (17 CFR 270.30e-3) that contains disclosures specified by paragraph (c)(3) of that rule. |
| | Not Applicable. |
| | |
Franklin Floating Rate Master Series true | |
| Class A |
| Annual Shareholder Report | July 31, 2024 |
|
This annual shareholder report contains important information about Franklin Floating Rate Master Series for the period August 1, 2023, to July 31, 2024.
You can find additional information about the Fund at https://www.franklintempleton.com/regulatory-internalusefunds-documents. You can also request this information by contacting us at (800) DIAL BEN/342-5236.
WHAT WERE THE FUND COSTS FOR THE LAST YEAR? (based on a hypothetical $10,000 investment)
| | |
Class Name | Costs of a $10,000 investment | Costs paid as a percentage of a $10,000 investment* |
| Class A | $56 | 0.53% |
| * | Reflects fee waivers and/or expense reimbursements, without which expenses would have been higher. |
HOW DID THE FUND PERFORM LAST YEAR AND WHAT AFFECTED ITS PERFORMANCE?
For the twelve months ended July 31, 2024, Class A shares of Franklin Floating Rate Master Series returned 10.10%. The Fund compares its performance to the Morningstar LSTA US Leveraged Loan Index, which returned 10.45% for the same period. The Fund previously compared its performance to the Credit Suisse Leveraged Loan Index, which returned 10.42% for the same period. Effective March 1, 2024, the Morningstar LSTA US Leveraged Loan Index replaced the Credit Suisse Leveraged Loan Index as the Fund’s benchmark. The Fund’s investment manager believes the Morningstar LSTA US Leveraged Loan Index is an appropriate benchmark for the Fund.
| |
Top contributors to performance: |
| ↑ | Prior to March 1, 2024, allocation to equity received from prior restructurings; loan selection in leisure, automotive transportation and financial issuers; underweight in upper-tier loans and overweight in middle-tier loans relative to the benchmark |
| ↑ | Post March 1, 2024, underweight in the housing, cable/wireless video and service industries; underweight in lower-tier loans; and loan selection in telecommunications, aerospace and diversified media issuers |
| |
Top detractors from performance: |
| ↓ | Prior to March 1, 2024, underweight to the housing industry; loan selection in service, retail and telecommunications issuers; and underweight in lower-tier loans |
| ↓ | Post March 1, 2024, allocation to equity received from prior restructurings; loan selection in service, health care and manufacturing issuers; overweight to land transportation industry; and underweight to telecommunications and energy relative to the benchmark |
| Franklin Floating Rate Master Series | PAGE 1 | 0924 |
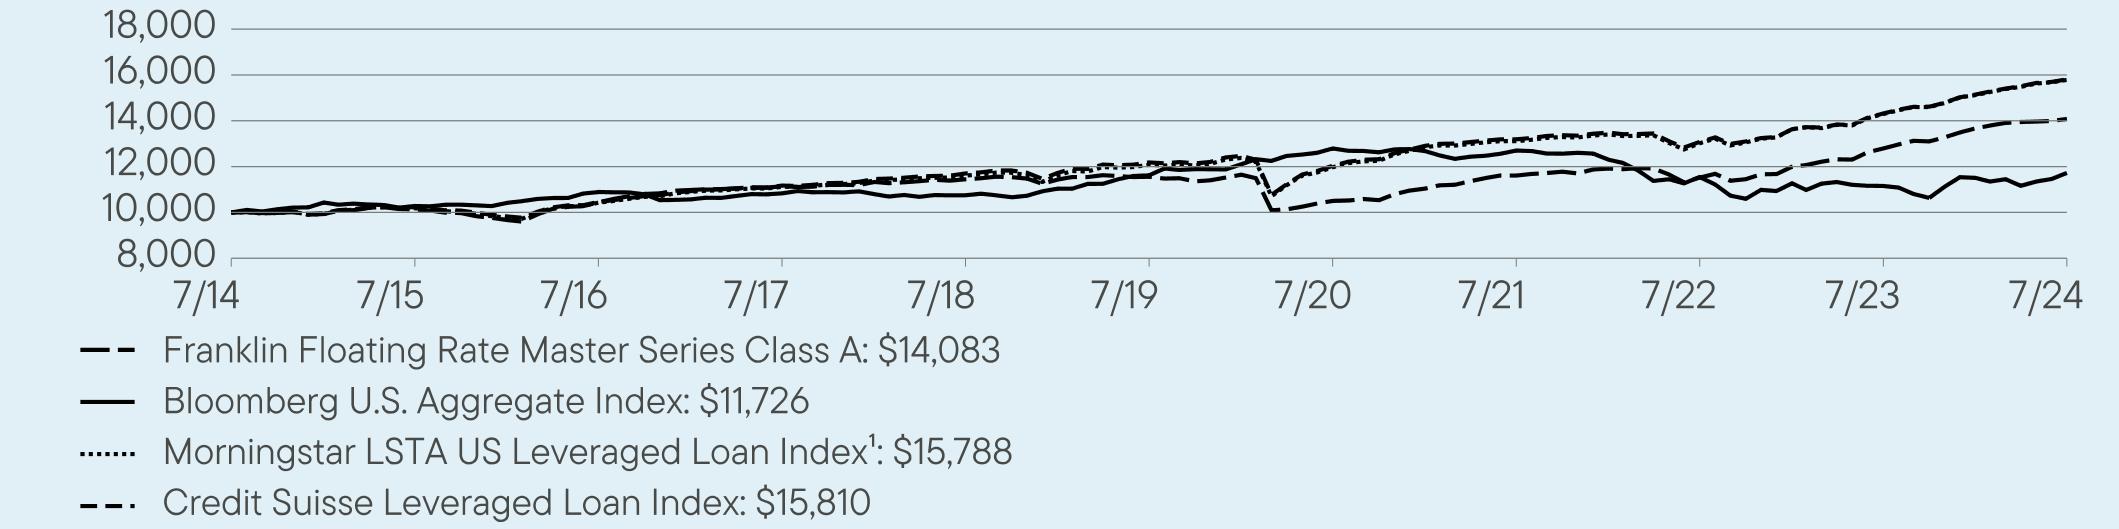
HOW DID THE FUND PERFORM OVER THE LAST 10 YEARS?
The Fund’s past performance is not necessarily an indication of how the Fund will perform in the future. The graph and table do not reflect the deduction of taxes that a shareholder would pay on Fund distributions or redemption of Fund shares.
VALUE OF A $10,000 INVESTMENT – Class A 7/31/2014 — 7/31/2024
AVERAGE ANNUAL TOTAL RETURNS (%) Period Ended July 31, 2024
| | | |
| | 1 Year | 5 Year | 10 Year |
Class A | 10.10 | 4.03 | 3.48 |
Bloomberg U.S. Aggregate Index | 5.10 | 0.19 | 1.60 |
Morningstar LSTA US Leveraged Loan Index1 | 10.45 | 5.50 | 4.67 |
Credit Suisse Leveraged Loan Index | 10.42 | 5.35 | 4.69 |
| 1 | Effective March 1, 2024, the Morningstar LSTA US Leveraged Loan Index replaced the Credit Suisse Leveraged Loan Index as the Fund’s benchmark. The Fund’s investment manager believes the Morningstar LSTA US Leveraged Loan Index is an appropriate benchmark for the Fund. |
Fund performance figures may reflect fee waivers and/or expense reimbursements, without which the performance would have been lower.
For current month-end performance, please call Franklin Templeton at (800) DIAL BEN/342-5236.
Important data provider notices and terms available at www.franklintempletondatasources.com.
KEY FUND STATISTICS (as of July 31, 2024)
| |
Total Net Assets | $514,935,612 |
Total Number of Portfolio Holdings* | 318 |
Total Management Fee Paid | $2,171,569 |
Portfolio Turnover Rate | 49.16% |
| * | Does not include derivatives, except purchased options, if any. |
| Franklin Floating Rate Master Series | PAGE 2 | 0924 |
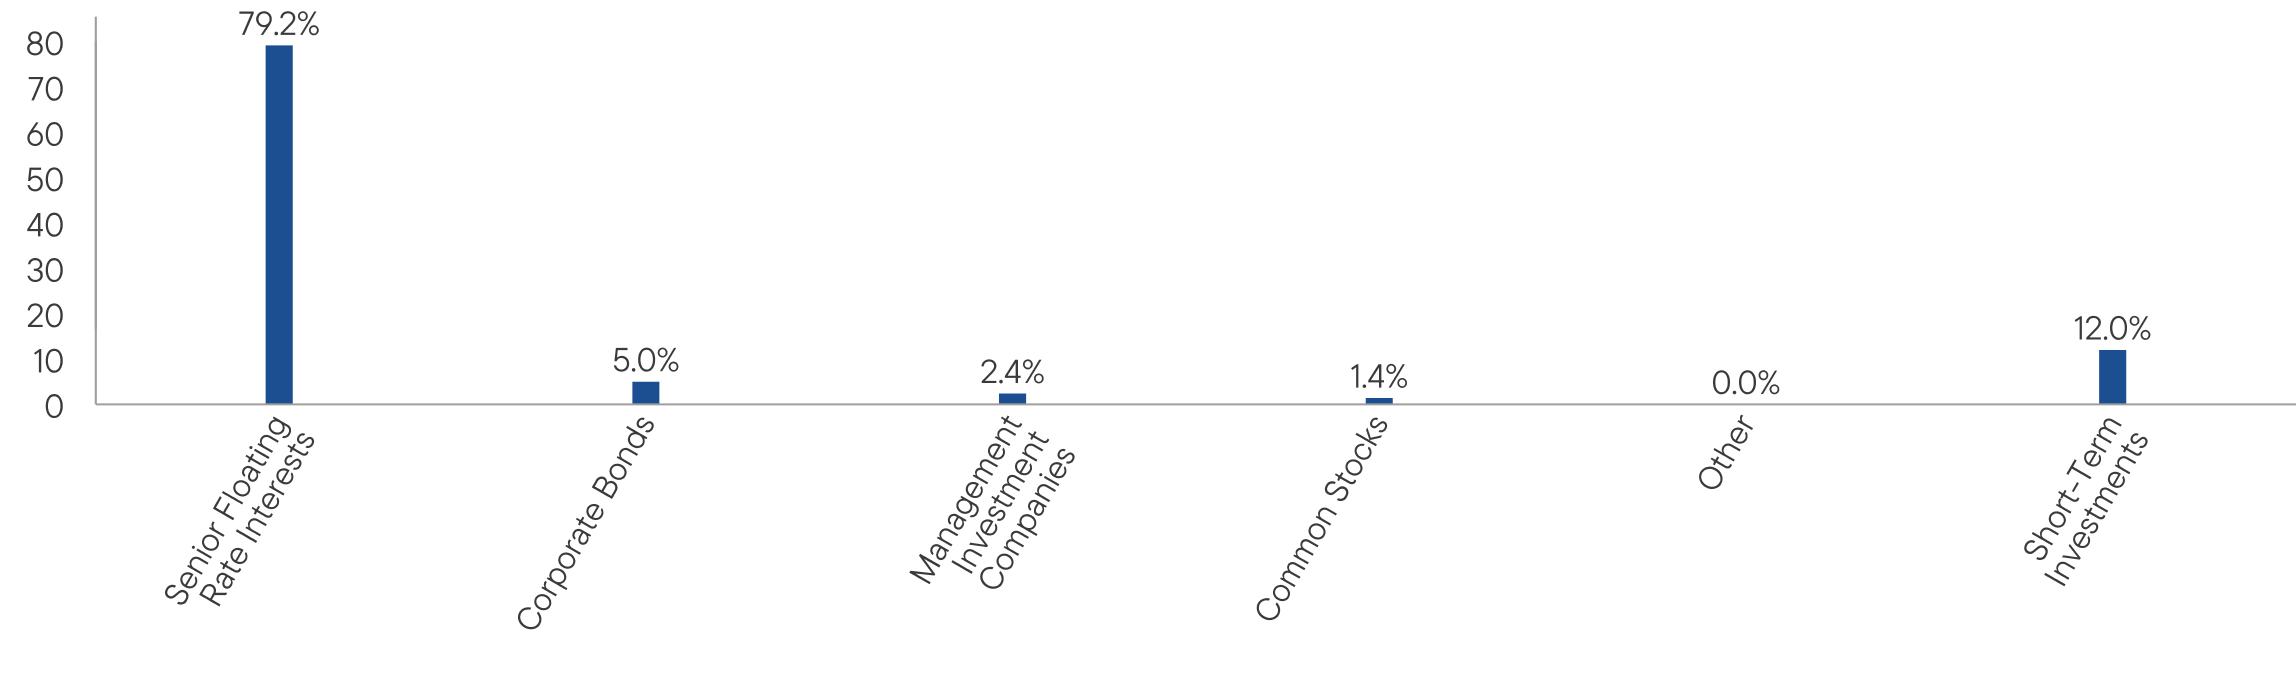
WHAT DID THE FUND INVEST IN? (as of July 31, 2024)
Portfolio Composition*,† (% of Total Investments)
| * | Does not include derivatives, except purchased options, if any. |
| † | Certain categories may represent less than 0.1%. |
| |
| WHERE CAN I FIND ADDITIONAL INFORMATION ABOUT THE FUND? |
Additional information is available on https://www.franklintempleton.com/regulatory-internalusefunds-documents, including its: |
| • proxy voting information • financial information • holdings • tax information |
| Franklin Floating Rate Master Series | PAGE 3 | 0924 |
100001013010441111411144611558105041160811523127911408310000102811089210835107491161712793127031154511156117261000010185104281112011611120791197413111130221429415788100001022910460111741170112181120351319013077143181581079.25.02.41.40.012.0
Item 2. Code of Ethics.
(a) The Registrant has adopted a code of ethics that applies to its principal executive officers and principal financial and accounting officer.
(c) N/A
(d) N/A
(f) Pursuant to Item 19(a)(1), the Registrant is attaching as an exhibit a copy of its code of ethics that applies to its principal executive officers and principal financial and accounting officer.
Item 3. Audit Committee Financial Expert.
(a)(1) The Registrant has an audit committee financial expert serving on its audit committee.
(2) The audit committee financial expert is Mary C. Choksi and she is “independent” as defined under the relevant Securities and Exchange Commission Rules and Releases.
ITEM 4. PRINCIPAL ACCOUNTANT FEES AND SERVICES.
(a) Audit Fees
The aggregate fees paid to the principal accountant for professional services rendered by the principal accountant for the audit of the registrant’s annual financial statements or for services that are normally provided by the principal accountant in connection with statutory and regulatory filings or engagements were $92,894 for the fiscal year ended July 31, 2024, and $90,991 for the fiscal year ended July 31, 2023.
(b) Audit-Related Fees
There were no fees paid to the principal accountant for assurance and related services rendered by the principal accountant to the registrant that are reasonably related to the performance of the audit of the registrant’s financial statements and are not reported under paragraph (a) of Item 4.
There were no fees paid to the principal accountant for assurance and related services rendered by the principal accountant to the registrant’s investment adviser and any entity controlling, controlled by or under common control with the investment adviser that provides ongoing services to the registrant that are reasonably related to the performance of the audit of their financial statements.
(c) Tax Fees
There were no fees paid to the principal accountant for professional services rendered by the principal accountant to the registrant for tax compliance, tax advice and tax planning.
The aggregate fees paid to the principal accountant for professional services rendered by the principal accountant to the registrant’s investment adviser and any entity controlling, controlled by or under common control with the investment adviser that provides ongoing services to the registrant for tax compliance, tax advice and tax planning were $140,000 for the fiscal year ended July 31, 2024, and $70,000 for the fiscal year ended July 31, 2023. The services for which these fees were paid included global access to tax platform International Tax View.
(d) All Other Fees
The aggregate fees paid to the principal accountant for products and services rendered by the principal accountant to the registrant not reported in paragraphs (a)-(c) of Item 4 were $0 for the fiscal year ended July 31, 2024, and $205 for the fiscal year ended July 31, 2023. The services for which these fees were paid included review of materials provided to the fund Board in connection with the investment management contract renewal process.
The aggregate fees paid to the principal accountant for products and services rendered by the principal accountant to the registrant’s investment adviser and any entity controlling, controlled by or under common control with the investment adviser that provides ongoing services to the registrant not reported in paragraphs (a)-(c) of Item 4 were $163,638 for the fiscal year ended July 31, 2024 and $94,715 for the fiscal year ended July 31, 2023. The services for which these fees were paid included professional services relating to the readiness
assessment over Greenhouse Gas Emissions and Energy, fees in connection with license for accounting and business knowledge platform Viewpoint, professional fees relating to security counts and professional fees in connection with SOC 1 Reports.
(e) (1) The registrant’s audit committee is directly responsible for approving the services to be provided by the auditors, including:
| (i) | pre-approval of all audit and audit related services; |
| (ii) | pre-approval of all non-audit related services to be provided to the Fund by the auditors; |
(iii) pre-approval of all non-audit related services to be provided to the registrant by the auditors to the registrant’s investment adviser or to any entity that controls, is controlled by or is under common control with the registrant’s investment adviser and that provides ongoing services to the registrant where the non-audit services relate directly to the operations or financial reporting of the registrant; and
(iv) establishment by the audit committee, if deemed necessary or appropriate, as an alternative to committee pre-approval of services to be provided by the auditors, as required by paragraphs (ii) and (iii) above, of policies and procedures to permit such services to be pre-approved by other means, such as through establishment of guidelines or by action of a designated member or members of the committee; provided the policies and procedures are detailed as to the particular service and the committee is informed of each service and such policies and procedures do not include delegation of audit committee responsibilities, as contemplated under the Securities Exchange Act of 1934, to management; subject, in the case of (ii) through (iv), to any waivers, exceptions or exemptions that may be available under applicable law or rules.
(e) (2) None of the services provided to the registrant described in paragraphs (b)-(d) of Item 4 were approved by the audit committee pursuant to paragraph (c)(7)(i)(C) of Rule 2-01 of regulation S-X.
(f) No disclosures are required by this Item 4(f).
(g) The aggregate non-audit fees paid to the principal accountant for services rendered by the principal accountant to the registrant and the registrant’s investment adviser and any entity controlling, controlled by or under common control with the investment adviser that provides ongoing services to the registrant were $303,638 for the fiscal year ended July 31, 2024, and $164,920 for the fiscal year ended July 31, 2023.
(h) The registrant’s audit committee of the board has considered whether the provision of non-audit services that were rendered to the registrant’s investment adviser (not including any sub-adviser whose role is primarily portfolio management and is subcontracted with or overseen by another investment adviser), and any entity controlling, controlled by, or under common control with the investment adviser that provides ongoing services to the registrant that were not pre-approved pursuant to paragraph (c)(7)(ii) of Rule 2-01 of Regulation S-X is compatible with maintaining the principal accountant’s independence.
(i) N/A
(j) N/A
Item 5. Audit Committee of Listed Registrants. N/A
Item 6. Schedule of Investments.
(a) Please see schedule of investments contained in the Financial Statements and Financial Highlights included under Item 7 of this Form N-CSR.
(b) N/A
Item 7. Financial Statements and Financial Highlights for Open-End Management Investment Companies.
Franklin
Floating
Rate
Master
Series
Financial
Statements
and
Other
Important
Information
Annual
|
July
31,
2024
Financial
Statements
and
Other
Important
Information—Annual
Financial
Highlights
and
Schedule
of
Investments
2
Financial
Statements
21
Notes
to
Financial
Statements
24
Report
of
Independent
Registered
Public
Accounting
Firm
32
Changes
In
and
Disagreements
with
Accountants
33
Results
of
Meeting(s)
of
Shareholders
33
Remuneration
Paid
to
Directors,
Officers
and
Others
33
Board
Approval
of
Management
and
Subadvisory
Agreements
33
Franklin
Floating
Rate
Master
Trust
Financial
Highlights
Franklin
Floating
Rate
Master
Series
Annual
Report
The
accompanying
notes
are
an
integral
part
of
these
financial
statements.
a
Year
Ended
July
31,
2024
2023
2022
2021
2020
Per
share
operating
performance
(for
a
share
outstanding
throughout
the
year)
Net
asset
value,
beginning
of
year
...................
$7.13
$7.00
$7.38
$6.99
$8.18
Income
from
investment
operations
a
:
Net
investment
income
..........................
0.656
b
0.567
b
0.292
b
0.301
b
0.415
Net
realized
and
unrealized
gains
(losses)
...........
0.039
0.165
(0.341)
0.417
(1.141)
Total
from
investment
operations
....................
0.695
0.732
(0.049)
0.718
(0.726)
Less
distributions
from:
Net
investment
income
..........................
(0.695)
(0.602)
(0.331)
(0.328)
(0.464)
Net
asset
value,
end
of
year
.......................
$7.13
$7.13
$7.00
$7.38
$6.99
Total
return
....................................
10.10%
11.00%
(0.73)%
10.51%
(9.13)%
Ratios
to
average
net
assets
Expenses
before
waiver
and
payments
by
affiliates
......
0.57%
0.56%
0.57%
0.61%
0.58%
Expenses
net
of
waiver
and
payments
by
affiliates
.......
0.53%
0.53%
c
0.53%
c
0.53%
c
0.53%
c
Net
investment
income
...........................
9.12%
8.11%
4.01%
4.19%
5.41%
Supplemental
data
Net
assets,
end
of
year
(000’s)
.....................
$514,936
$389,707
$616,607
$430,129
$394,720
Portfolio
turnover
rate
............................
49.16%
11.36%
32.84%
74.82%
16.80%
a
The
amount
shown
for
a
share
outstanding
throughout
the
period
may
not
correlate
with
the
Statement
of
Operations
for
the
period
due
to
the
timing
of
sales
and
repurchas-
es
of
the
Fund’s
shares
in
relation
to
income
earned
and/or
fluctuating
fair
value
of
the
investments
of
the
Fund.
b
Based
on
average
daily
shares
outstanding.
c
Benefit
of
expense
reduction
rounds
to
less
than
0.01%.
Franklin
Floating
Rate
Master
Trust
Schedule
of
Investments,
July
31,
2024
Franklin
Floating
Rate
Master
Series
The
accompanying
notes
are
an
integral
part
of
these
financial
statements.
Annual
Report
a
a
Country
Shares
a
Value
%
of
Net
Assets
a
Common
Stocks
Industrial
Machinery
&
Supplies
&
Components
UTEX
Industries,
Inc.
..........................
United
States
120,386
$
5,136,509
1
.00
Leisure
Facilities
a
24
Hour
Fitness
Worldwide,
Inc.
..................
United
States
104,009
19,346
0.00
†
a
Oil
&
Gas
Exploration
&
Production
a
Talos
Energy,
Inc.
.............................
United
States
213,184
2,524,099
0
.49
a
Total
Common
Stocks
(Cost
$
15,206,568
)
...............................
7,679,954
1
.49
Management
Investment
Companies
Asset
Management
&
Custody
Banks
b
Franklin
Senior
Loan
ETF
.......................
United
States
281,166
6,866,074
1
.33
Invesco
Senior
Loan
ETF
.......................
United
States
289,186
6,072,906
1
.18
12,938,980
2
.51
Total
Management
Investment
Companies
(Cost
$
13,304,935
)
.............
12,938,980
2
.51
Preferred
Stocks
Leisure
Facilities
a
24
Hour
Fitness
Worldwide,
Inc.
..................
United
States
246,320
21,553
0
.01
a
Total
Preferred
Stocks
(Cost
$
332,425
)
..................................
21,553
0
.01
Warrants
a
a
a
a
a
Warrants
Industrial
Machinery
&
Supplies
&
Components
a,c
UTEX
Industries,
Inc.
,
2/20/49
....................
United
States
321
30
0.00
†
Total
Warrants
(Cost
$
–
)
...............................................
30
0.00
†
Principal
Amount
*
a
Corporate
Bonds
Aerospace
&
Defense
d
TransDigm,
Inc.
,
Senior
Secured
Note
,
144A,
6.375
%
,
3/01/29
...................................
United
States
1,500,000
1,529,776
0
.30
Air
Freight
&
Logistics
d
Rand
Parent
LLC
,
Senior
Secured
Note
,
144A,
8.5
%
,
2/15/30
...................................
United
States
1,950,000
1,929,793
0
.37
Automotive
Parts
&
Equipment
d
Tenneco,
Inc.
,
Senior
Secured
Note
,
144A,
8
%
,
11/17/28
United
States
1,500,000
1,362,370
0
.26
Cable
&
Satellite
d
Directv
Financing
LLC
/
Directv
Financing
Co-Obligor,
Inc.
,
Senior
Secured
Note
,
144A,
5.875
%
,
8/15/27
...
United
States
1,100,000
1,060,121
0
.21
Cargo
Ground
Transportation
d
First
Student
Bidco,
Inc.
/
First
Transit
Parent,
Inc.
,
Senior
Secured
Note
,
144A,
4
%
,
7/31/29
...............
United
States
500,000
456,456
0
.09
Casinos
&
Gaming
d
Caesars
Entertainment,
Inc.
,
Senior
Secured
Note
,
144A,
6.5
%
,
2/15/32
..............................
United
States
1,400,000
1,419,350
0
.27
d
International
Game
Technology
plc
,
Senior
Secured
Note
,
144A,
5.25
%
,
1/15/29
.........................
United
States
400,000
392,522
0
.08
1,811,872
0
.35
Franklin
Floating
Rate
Master
Trust
Schedule
of
Investments
Franklin
Floating
Rate
Master
Series
(continued)
Annual
Report
The
accompanying
notes
are
an
integral
part
of
these
financial
statements.
a
a
Country
Principal
Amount
*
a
Value
%
of
Net
Assets
a
a
a
a
a
a
Corporate
Bonds
(continued)
Construction
Materials
d
Cemex
SAB
de
CV
,
Senior
Bond
,
144A,
5.2
%
,
9/17/30
.
Mexico
750,000
$
733,768
0
.14
Diversified
Chemicals
d
SCIH
Salt
Holdings,
Inc.
,
Senior
Secured
Note
,
144A,
4.875
%
,
5/01/28
.............................
United
States
1,100,000
1,026,721
0
.20
Diversified
Support
Services
d
Neptune
Bidco
US,
Inc.
,
Senior
Secured
Note
,
144A,
9.29
%
,
4/15/29
.............................
United
States
900,000
882,192
0
.17
Health
Care
Facilities
d
CHS/Community
Health
Systems,
Inc.
,
Senior
Secured
Note
,
144A,
8
%
,
12/15/27
.....................
United
States
1,500,000
1,502,505
0
.29
Health
Care
Services
d
MPH
Acquisition
Holdings
LLC
,
Senior
Secured
Note
,
144A,
5.5
%
,
9/01/28
.........................
United
States
453,000
354,109
0
.07
d,e
Radiology
Partners,
Inc.
,
Senior
Secured
Note
,
144A,
PIK,
7.775
%
,
1/31/29
.........................
United
States
1,718,476
1,611,794
0
.31
1,965,903
0
.38
Health
Care
Supplies
d
Bausch
+
Lomb
Corp.
,
Senior
Secured
Note
,
144A,
8.375
%
,
10/01/28
............................
United
States
320,000
329,175
0
.06
Independent
Power
Producers
&
Energy
Traders
d
Calpine
Corp.
,
Senior
Secured
Note
,
144A,
4.5
%
,
2/15/28
United
States
1,100,000
1,054,430
0
.21
Integrated
Telecommunication
Services
d
Altice
France
SA
,
Senior
Secured
Note
,
144A,
5.125
%
,
7/15/29
.......
France
800,000
561,880
0
.11
Senior
Secured
Note
,
144A,
5.5
%
,
10/15/29
........
France
1,270,000
894,687
0
.17
1,456,567
0
.28
Investment
Banking
&
Brokerage
d
Jane
Street
Group
/
JSG
Finance,
Inc.
,
Senior
Secured
Note
,
144A,
4.5
%
,
11/15/29
....................
United
States
800,000
757,953
0
.15
IT
Consulting
&
Other
Services
d
Fortress
Intermediate
3,
Inc.
,
Senior
Secured
Note
,
144A,
7.5
%
,
6/01/31
..............................
United
States
600,000
615,954
0
.12
Movies
&
Entertainment
d
Banijay
Entertainment
SAS
,
Senior
Secured
Note
,
144A,
8.125
%
,
5/01/29
.............................
France
600,000
621,797
0
.12
Multi-line
Insurance
d
Acrisure
LLC
/
Acrisure
Finance,
Inc.
,
Senior
Secured
Note
,
144A,
4.25
%
,
2/15/29
....................
United
States
529,400
487,678
0
.09
Oil
&
Gas
Storage
&
Transportation
Cheniere
Energy,
Inc.
,
Senior
Note
,
4.625
%
,
10/15/28
..
United
States
450,000
441,642
0
.09
Passenger
Airlines
d
Allegiant
Travel
Co.
,
Senior
Secured
Note
,
144A,
7.25
%
,
8/15/27
...................................
United
States
1,200,000
1,120,209
0
.22
d
American
Airlines,
Inc.
,
Senior
Secured
Note
,
144A,
8.5
%
,
5/15/29
..............................
United
States
1,300,000
1,339,177
0
.26
d
American
Airlines,
Inc.
/
AAdvantage
Loyalty
IP
Ltd.
,
Senior
Secured
Note
,
144A,
5.5
%
,
4/20/26
.........
United
States
577,091
573,728
0
.11
d
Delta
Air
Lines,
Inc.
/
SkyMiles
IP
Ltd.
,
Senior
Secured
Note
,
144A,
4.5
%
,
10/20/25
....................
United
States
197,760
196,825
0
.04
Franklin
Floating
Rate
Master
Trust
Schedule
of
Investments
Franklin
Floating
Rate
Master
Series
(continued)
The
accompanying
notes
are
an
integral
part
of
these
financial
statements.
Annual
Report
a
a
Country
Principal
Amount
*
a
Value
%
of
Net
Assets
a
a
a
a
a
a
Corporate
Bonds
(continued)
Passenger
Airlines
(continued)
d
United
Airlines,
Inc.
,
Senior
Secured
Note
,
144A,
4.375
%
,
4/15/26
...................................
United
States
1,165,000
$
1,136,687
0
.22
4,366,626
0
.85
Personal
Care
Products
d
Coty,
Inc.
,
Senior
Secured
Note
,
144A,
5
%
,
4/15/26
....
United
States
392,000
388,100
0
.08
Security
&
Alarm
Services
d
Allied
Universal
Holdco
LLC
,
Senior
Secured
Note
,
144A,
7.875
%
,
2/15/31
.............................
United
States
500,000
509,039
0
.10
d
Allied
Universal
Holdco
LLC
/
Allied
Universal
Finance
Corp.
,
Senior
Note
,
144A,
9.75
%
,
7/15/27
.........
United
States
1,600,000
1,599,842
0
.31
2,108,881
0
.41
Wireless
Telecommunication
Services
d
Vmed
O2
UK
Financing
I
plc
,
Senior
Secured
Bond
,
144A,
4.25
%
,
1/31/31
.........................
United
Kingdom
360,000
305,258
0
.06
Total
Corporate
Bonds
(Cost
$
27,690,671
)
...............................
27,195,538
5
.28
f
Senior
Floating
Rate
Interests
Advertising
g
,h
MH
Sub
I
LLC
(Micro
Holding
Corp.)
,
First
Lien,
CME
Term
Loan
,
9.594
%
,
(
1-month
SOFR
+
4.25
%
),
5/03/28
United
States
3,834,510
3,829,890
0
.74
Aerospace
&
Defense
e
Alloy
Finco
Ltd.
,
First
Lien,
Term
Loan,
B
,
PIK,
14
%
,
3/08/28
...................................
United
Kingdom
3,407,100
3,321,923
0
.64
g
,h
Bleriot
US
Bidco,
Inc.
,
First
Lien,
2023
CME
Term
Loan
,
8.585
%
,
(
3-month
SOFR
+
3.25
%
),
10/31/30
.......
United
States
89,061
89,625
0
.02
h
Dynasty
Acquisition
Co.,
Inc.
,
First
Lien,
2024
Specified
Refinancing
CME
Term
Loan,
B1
,
8.844
%
,
(
1-month
SOFR
+
3.5
%
),
8/24/28
......
United
States
416,396
418,826
0
.08
First
Lien,
2024
Specified
Refinancing
CME
Term
Loan,
B2
,
8.844
%
,
(
1-month
SOFR
+
3.5
%
),
8/24/28
......
United
States
160,552
161,488
0
.03
3,991,862
0
.77
a
a
a
a
a
a
h
Air
Freight
&
Logistics
Clue
Opco
LLC
,
First
Lien,
CME
Term
Loan,
B
,
9.752
%
,
(
3-month
SOFR
+
4.5
%
),
12/19/30
...............
United
States
2,972,523
2,743,862
0
.54
Rand
Parent
LLC
,
First
Lien,
CME
Term
Loan,
B
,
9.071
%
,
(
3-month
SOFR
+
3.75
%
),
3/18/30
...............
United
States
3,105,632
3,103,271
0
.60
5,847,133
1
.14
a
a
a
a
a
a
Airport
Services
g
,h
LaserShip,
Inc.
,
First
Lien,
Initial
CME
Term
Loan
,
10.096
%
,
(
3-month
SOFR
+
4.5
%
),
5/08/28
........
United
States
4,337,140
3,399,234
0
.66
Alternative
Carriers
h
Zayo
Group
Holdings,
Inc.
,
First
Lien,
Initial
Dollar
CME
Term
Loan
,
8.458
%
,
(
1-month
SOFR
+
3
%
),
3/09/27
.
United
States
623,553
558,968
0
.11
Aluminum
h
Arsenal
AIC
Parent
LLC
,
First
Lien,
2024
CME
Term
Loan,
B
,
9.094
%
,
(
1-month
SOFR
+
3.75
%
),
8/19/30
.
United
States
584,322
587,390
0
.11
h
Apparel,
Accessories
&
Luxury
Goods
g
ABG
Intermediate
Holdings
2
LLC
,
First
Lien,
2024
Refinancing
CME
Term
Loan
,
8.097
%
,
(
1-month
SOFR
+
2.75
%
),
12/21/28
..........................
United
States
832,727
836,995
0
.16
Franklin
Floating
Rate
Master
Trust
Schedule
of
Investments
Franklin
Floating
Rate
Master
Series
(continued)
Annual
Report
The
accompanying
notes
are
an
integral
part
of
these
financial
statements.
a
a
Country
Principal
Amount
*
a
Value
%
of
Net
Assets
a
a
a
a
a
a
f
Senior
Floating
Rate
Interests
(continued)
h
Apparel,
Accessories
&
Luxury
Goods
(continued)
Champ
Acquisition
Corp.
,
First
Lien,
Initial
CME
Term
Loan
,
11.096
%
,
(
3-month
SOFR
+
5.5
%
),
12/19/25
..
United
States
1,435,014
$
1,442,548
0
.28
Flash
Charm,
Inc.
,
First
Lien,
Term
Loan,
B2
,
8.748
%
,
(
1-month
SOFR
+
3.5
%
),
3/02/28
................
United
States
2,066,738
2,057,727
0
.40
Hanesbrands,
Inc.
,
First
Lien,
Initial
CME
Term
Loan,
B
,
9.094
%
,
(
1-month
SOFR
+
3.75
%
),
3/08/30
........
United
States
1,786,432
1,794,810
0
.35
Tory
Burch
LLC
,
First
Lien,
Initial
CME
Term
Loan,
B
,
8.708
%
,
(
1-month
SOFR
+
3.25
%
),
4/14/28
........
United
States
571,091
572,830
0
.11
6,704,910
1
.30
a
a
a
a
a
a
h
Application
Software
AppLovin
Corp.
,
First
Lien,
Amendment
No.
1
Replacement
CME
Term
Loan,
10-I
,
7.844
%
,
(
1-month
SOFR
+
2.5
%
),
10/25/28
United
States
997,500
1,002,388
0
.20
First
Lien,
Delayed
Draw
CME
Term
Loan,
B
,
7.844
%
,
(
1-month
SOFR
+
2.5
%
),
8/15/30
................
United
States
1,797,462
1,803,780
0
.35
g
Boxer
Parent
Co.,
Inc.
,
First
Lien,
CME
Term
Loan,
B
,
9.005
%
,
(
12-month
SOFR
+
3.75
%
),
7/02/31
.......
United
States
6,000,000
5,980,020
1
.16
g
Central
Parent
LLC
,
First
Lien,
CME
Term
Loan,
B
,
8.585
%
,
(
3-month
SOFR
+
3.25
%
),
7/06/29
........
United
States
4,161,007
4,125,555
0
.80
Cloud
Software
Group,
Inc.
,
First
Lien,
Initial
Dolla
CME
Term
Loan,
B
,
9.335
%
,
(
3-month
SOFR
+
4
%
),
3/30/29
.................
United
States
3,794,128
3,797,145
0
.74
g
First
Lien,
Third
Amendment
CME
Term
Loan
,
9.835
%
,
(
3-month
SOFR
+
4.5
%
),
3/20/31
................
United
States
454,545
456,934
0
.09
Cloudera,
Inc.
,
First
Lien,
Initial
CME
Term
Loan
,
9.194
%
,
(
1-month
SOFR
+
3.75
%
),
10/09/28
..............
United
States
1,693,875
1,649,410
0
.32
ConnectWise
LLC
,
First
Lien,
Initial
CME
Term
Loan
,
9.096
%
,
(
3-month
SOFR
+
3.5
%
),
9/29/28
.........
United
States
791,878
790,492
0
.15
Cornerstone
OnDemand,
Inc.
,
First
Lien,
Initial
CME
Term
Loan
,
9.208
%
,
(
1-month
SOFR
+
3.75
%
),
10/16/28
..
United
States
878,957
826,589
0
.16
ECI
Macola/Max
Holding
LLC
,
First
Lien,
2024
Extending
CME
Term
Loan
,
9.085
%
,
(
3-month
SOFR
+
3.75
%
),
5/31/30
...................................
United
States
1,904,640
1,919,525
0
.37
Epicor
Software
Corp.
,
First
Lien,
Term
Loan,
E
,
8.594
%
,
(
1-month
SOFR
+
3.25
%
),
5/30/31
...............
United
States
3,233,514
3,259,172
0
.63
Flexera
Software
LLC
,
First
Lien,
CME
Term
Loan,
B2
,
8.826
%
,
(
3-month
SOFR
+
3.5
%
),
3/03/28
.........
United
States
328,743
330,449
0
.06
Genesys
Cloud
Services
Holdings
II
LLC
,
First
Lien,
2024
Incremental
Dollar
CME
Term
Loan
,
9.208
%
,
(
1-month
SOFR
+
3.75
%
),
12/01/27
.......
United
States
918,462
925,731
0
.18
First
Lien,
Dollar
CME
Term
Loan,
B4
,
8.844
%
,
(
1-month
SOFR
+
3.5
%
),
12/01/27
...............
United
States
3,260,180
3,282,773
0
.64
IGT
Holding
IV
AB
,
First
Lien,
CME
Term
Loan,
B2
,
4.162
%
,
(
1-day
SOFR
+
3.4
%
),
3/31/28
...........
Sweden
995,174
997,453
0
.19
Mitchell
International,
Inc.
,
First
Lien,
Initial
CME
Term
Loan
,
8.594
%
,
(
1-month
SOFR
+
3.25
%
),
6/17/31
...
United
States
1,800,000
1,783,575
0
.35
Polaris
Newco
LLC
,
First
Lien,
Dollar
CME
Term
Loan
,
9.514
%
,
(
3-month
SOFR
+
4
%
),
6/02/28
..........
United
States
2,853,583
2,860,717
0
.56
Project
Alpha
Intermediate
Holding,
Inc.
,
First
Lien,
2024
Refinancing
CME
Term
Loan
,
9.002
%
,
(
3-month
SOFR
+
3.75
%
),
10/28/30
..........................
United
States
1,897,132
1,907,405
0
.37
g
Project
Boost
Purchaser
LLC
,
First
Lien,
Initial
CME
Term
Loan
,
8.786
%
,
(
3-month
SOFR
+
3.5
%
),
7/16/31
....
United
States
3,089,541
3,099,844
0
.60
Project
Ruby
Ultimate
Parent
Corp.
,
First
Lien,
CME
Term
Loan,
B1
,
8.958
%
,
(
1-month
SOFR
+
3.5
%
),
3/10/28
.
United
States
446,642
448,763
0
.09
Rocket
Software,
Inc.
,
First
Lien,
CME
Term
Loan
,
10.094
%
,
(
1-month
SOFR
+
4.75
%
),
11/28/28
......
United
States
1,364,459
1,371,329
0
.27
Franklin
Floating
Rate
Master
Trust
Schedule
of
Investments
Franklin
Floating
Rate
Master
Series
(continued)
The
accompanying
notes
are
an
integral
part
of
these
financial
statements.
Annual
Report
a
a
Country
Principal
Amount
*
a
Value
%
of
Net
Assets
a
a
a
a
a
a
f
Senior
Floating
Rate
Interests
(continued)
h
Application
Software
(continued)
Severin
Acquisition
LLC
,
First
Lien,
CME
Term
Loan
,
8.252
%
,
(
3-month
SOFR
+
3
%
),
8/01/27
..........
United
States
229,615
$
230,441
0
.05
UKG,
Inc.
,
First
Lien,
Initial
CME
Term
Loan
,
8.555
%
,
(
3-month
SOFR
+
3.25
%
),
2/10/31
...............
United
States
2,688,198
2,699,354
0
.52
VS
Buyer
LLC
,
First
Lien,
2024
Initial
CME
Term
Loan
,
8.579
%
,
(
1-month
SOFR
+
3.25
%
),
4/14/31
........
United
States
456,621
459,048
0
.09
46,007,892
8
.94
a
a
a
a
a
a
h
Asset
Management
&
Custody
Banks
g
Edelman
Financial
Engines
Center
LLC
(The)
,
First
Lien,
2024
Refinancing
CME
Term
Loan
,
8.594
%
,
(
1-month
SOFR
+
3.25
%
),
4/07/28
......................
United
States
2,720,263
2,726,071
0
.53
First
Eagle
Holdings,
Inc.
,
First
Lien,
CME
Term
Loan,
B2
,
8.33
%
,
(
3-month
SOFR
+
3
%
),
2/22/29
...........
United
States
1,795,500
1,783,515
0
.35
g
GTCR
Everest
Borrower
LLC
,
First
Lien,
CME
Term
Loan,
B
,
8.262
%
,
(
12-month
SOFR
+
3.25
%
),
6/03/31
.....
United
States
696,517
691,294
0
.13
Russell
Investments
US
Institutional
Holdco,
Inc.
,
First
Lien,
2027
CME
Term
Loan
,
10.252
%
,
(
3-month
SOFR
+
5
%
),
5/28/27
..............................
United
States
2,535,213
2,257,501
0
.44
7,458,381
1
.45
a
a
a
a
a
a
h
Automobile
Manufacturers
American
Trailer
World
Corp.
,
First
Lien,
CME
Term
Loan,
B
,
9.194
%
,
(
1-month
SOFR
+
3.75
%
),
3/03/28
......
United
States
1,470,567
1,440,487
0
.28
Thor
Industries,
Inc.
,
First
Lien,
USD
CME
Term
Loan,
B3
,
7.594
%
,
(
1-month
SOFR
+
2.25
%
),
11/15/30
....
United
States
266,585
267,584
0
.05
1,708,071
0
.33
a
a
a
a
a
a
h
Automotive
Parts
&
Equipment
Adient
US
LLC
,
First
Lien,
CME
Term
Loan,
B2
,
8.094
%
,
(
1-month
SOFR
+
2.75
%
),
1/31/31
...............
United
States
1,178,140
1,185,827
0
.23
Clarios
Global
LP
,
First
Lien,
CME
Term
Loan,
B
,
8.344
%
,
(
1-month
SOFR
+
3
%
),
5/06/30
.................
United
States
585,616
587,903
0
.11
DexKo
Global,
Inc.
,
First
Lien,
2023
Incremental
CME
Term
Loan
,
9.585
%
,
(
3-month
SOFR
+
4.25
%
),
10/04/28
..............
United
States
392,763
393,009
0
.07
First
Lien,
Closing
Date
Dollar
CME
Term
Loan
,
9.346
%
,
(
3-month
SOFR
+
3.75
%
),
10/04/28
.......
United
States
1,325,866
1,322,743
0
.26
First
Brands
Group
LLC
,
First
Lien,
2021
CME
Term
Loan
,
10.514
%
,
(
3-month
SOFR
+
5
%
),
3/30/27
.........................
United
States
2,760,837
2,747,461
0
.53
First
Lien,
2022-2
Incremental
CME
Term
Loan
,
10.514
%
,
(
3-month
SOFR
+
5
%
),
3/30/27
..........
United
States
2,922,301
2,911,342
0
.57
Second
Lien,
2021
CME
Term
Loan
,
14.014
%
,
(
3-month
SOFR
+
8.5
%
),
3/30/28
................
United
States
1,871,447
1,796,589
0
.35
Highline
Aftermarket
Acquisition
LLC
,
First
Lien,
Initial
CME
Term
Loan
,
9.944
%
,
(
1-month
SOFR
+
4.5
%
),
11/09/27
..................................
United
States
228,103
229,423
0
.05
Tenneco,
Inc.
,
First
Lien,
CME
Term
Loan,
B
,
10.426
%
,
(
3-month
SOFR
+
5
%
),
11/17/28
................
United
States
919,895
878,831
0
.17
TI
Group
Automotive
Systems
LLC
,
First
Lien,
2021
Refinancing
CME
Term
Loan,
B
,
8.708
%
,
(
1-month
SOFR
+
3.25
%
),
12/16/26
.....................
United
States
991,781
995,916
0
.19
13,049,044
2
.53
a
a
a
a
a
a
Franklin
Floating
Rate
Master
Trust
Schedule
of
Investments
Franklin
Floating
Rate
Master
Series
(continued)
Annual
Report
The
accompanying
notes
are
an
integral
part
of
these
financial
statements.
a
a
Country
Principal
Amount
*
a
Value
%
of
Net
Assets
a
a
a
a
a
a
f
Senior
Floating
Rate
Interests
(continued)
Automotive
Retail
h
RealTruck
Group,
Inc.
,
First
Lien,
Initial
CME
Term
Loan
,
8.958
%
,
(
1-month
SOFR
+
3.5
%
),
1/31/28
.........
United
States
2,352,522
$
2,350,075
0
.46
h
Broadcasting
g
Gray
Television,
Inc.
,
First
Lien,
CME
Term
Loan,
D
,
8.457
%
,
(
1-month
SOFR
+
3
%
),
12/01/28
..........
United
States
2,535,756
2,361,233
0
.46
iHeartCommunications,
Inc.
,
g
First
Lien,
CME
Term
Loan
,
8.458
%
,
(
1-month
SOFR
+
3
%
),
5/01/26
...............................
United
States
2,634,564
2,224,323
0
.43
First
Lien,
Second
Amendment
Incremental
CME
Term
Loan
,
8.708
%
,
(
1-month
SOFR
+
3.25
%
),
5/01/26
...
United
States
300,000
250,999
0
.05
Nexstar
Media,
Inc.
,
First
Lien,
CME
Term
Loan,
B4
,
7.958
%
,
(
1-month
SOFR
+
2.5
%
),
9/18/26
.........
United
States
485,655
487,886
0
.10
Univision
Communications,
Inc.
,
First
Lien,
Initial
CME
Term
Loan
,
8.708
%
,
(
1-month
SOFR
+
3.25
%
),
1/31/29
United
States
875,056
853,591
0
.17
6,178,032
1
.21
a
a
a
a
a
a
Broadline
Retail
g
,h
Peer
Holding
III
BV
,
First
Lien,
CME
Term
Loan,
B5
,
8.228
%
,
(
12-month
SOFR
+
3
%
),
6/20/31
..........
Netherlands
1,707,942
1,717,549
0
.33
h
Building
Products
AZZ,
Inc.
,
First
Lien,
Initial
CME
Term
Loan
,
8.594
%
,
(
1-month
SOFR
+
3.25
%
),
5/14/29
...............
United
States
524,825
529,527
0
.10
Cornerstone
Building
Brands,
Inc.
,
First
Lien,
CME
Term
Loan,
C
,
9.829
%
,
(
1-month
SOFR
+
4.5
%
),
5/15/31
............................
United
States
821,918
798,974
0
.16
First
Lien,
New
CME
Term
Loan,
B
,
8.679
%
,
(
1-month
SOFR
+
3.25
%
),
4/12/28
......................
United
States
926,326
880,171
0
.17
EMRLD
Borrower
LP
,
First
Lien,
Initial
CME
Term
Loan,
B
,
7.844
%
,
(
1-month
SOFR
+
2.5
%
),
5/31/30
.......
United
States
328,383
328,918
0
.06
MIWD
Holdco
II
LLC
,
First
Lien,
2024
Incremental
CME
Term
Loan
,
8.844
%
,
(
1-month
SOFR
+
3.5
%
),
3/28/31
United
States
449,102
451,107
0
.09
Quikrete
Holdings,
Inc.
,
First
Lien,
CME
Term
Loan,
B1
,
7.844
%
,
(
1-month
SOFR
+
2.5
%
),
4/14/31
.......................
United
States
884,879
888,702
0
.17
First
Lien,
CME
Term
Loan,
B2
,
7.594
%
,
(
1-month
SOFR
+
2.25
%
),
3/19/29
......................
United
States
554,278
556,420
0
.11
4,433,819
0
.86
a
a
a
a
a
a
h
Cable
&
Satellite
DIRECTV
Financing
LLC
,
First
Lien,
2024
Refinancing
CME
Term
Loan,
B
,
10.708
%
,
(
1-month
SOFR
+
5.25
%
),
8/02/29
.............................
United
States
220,385
220,419
0
.04
Virgin
Media
Bristol
LLC
,
First
Lien,
Advance
CME
Term
Loan,
Q
,
8.693
%
,
(
1-month
SOFR
+
3.25
%
),
1/31/29
.
United
States
1,788,848
1,721,972
0
.33
1,942,391
0
.37
a
a
a
a
a
a
h
Cargo
Ground
Transportation
g
Albion
Financing
3
SARL
,
First
Lien,
2024
Amended
USD
CME
Term
Loan
,
9.826
%
,
(
3-month
SOFR
+
4.25
%
),
8/17/29
...................................
Luxembourg
616,114
621,893
0
.12
First
Student
Bidco,
Inc.
,
First
Lien,
2022
Incremental
CME
Term
Loan,
B
,
8.435
%
,
(
3-month
SOFR
+
3
%
),
7/21/28
..........
United
States
1,108,241
1,112,591
0
.22
First
Lien,
Initial
CME
Term
Loan,
B
,
8.596
%
,
(
3-month
SOFR
+
3
%
),
7/21/28
.........................
United
States
1,756,726
1,763,068
0
.34
Franklin
Floating
Rate
Master
Trust
Schedule
of
Investments
Franklin
Floating
Rate
Master
Series
(continued)
The
accompanying
notes
are
an
integral
part
of
these
financial
statements.
Annual
Report
a
a
Country
Principal
Amount
*
a
Value
%
of
Net
Assets
a
a
a
a
a
a
f
Senior
Floating
Rate
Interests
(continued)
h
Cargo
Ground
Transportation
(continued)
First
Student
Bidco,
Inc.
(continued)
First
Lien,
Initial
CME
Term
Loan,
C
,
8.596
%
,
(
3-month
SOFR
+
3
%
),
7/21/28
.........................
United
States
535,746
$
537,680
0
.10
Kenan
Advantage
Group,
Inc.
(The)
,
First
Lien,
CME
Term
Loan,
B3
,
9.094
%
,
(
1-month
SOFR
+
3.75
%
),
1/25/29
...................................
United
States
2,381,215
2,390,740
0
.47
6,425,972
1
.25
a
a
a
a
a
a
h
Casinos
&
Gaming
g
Bally's
Corp.
,
First
Lien,
CME
Term
Loan,
B
,
8.794
%
,
(
3-month
SOFR
+
3.25
%
),
10/02/28
..............
United
States
4,064,385
3,901,342
0
.76
Caesars
Entertainment,
Inc.
,
First
Lien,
2023
Incremental
CME
Term
Loan,
B
,
8.097
%
,
(
3-month
SOFR
+
2.75
%
),
2/06/30
...................................
United
States
1,417,945
1,425,034
0
.28
Entain
plc
,
First
Lien,
CME
Term
Loan,
B3
,
8.014
%
,
(
6-month
SOFR
+
2.75
%
),
10/31/29
..............
United
Kingdom
1,026,393
1,029,493
0
.20
Fertitta
Entertainment
LLC
,
First
Lien,
Initial
CME
Term
Loan,
B
,
9.079
%
,
(
1-month
SOFR
+
3.75
%
),
1/29/29
.
United
States
2,012,271
2,019,505
0
.39
Flutter
Entertainment
plc
,
First
Lien,
CME
Term
Loan,
B
,
7.585
%
,
(
3-month
SOFR
+
2.25
%
),
11/25/30
.......
Ireland
1,834,287
1,839,258
0
.36
Light
&
Wonder
International,
Inc.
,
First
Lien,
CME
Term
Loan,
B1
,
8.079
%
,
(
1-month
SOFR
+
2.75
%
),
4/16/29
United
States
1,677,169
1,690,796
0
.33
Ontario
Gaming
GTA
LP
,
First
Lien,
CME
Term
Loan,
B
,
9.585
%
,
(
3-month
SOFR
+
4.25
%
),
8/01/30
........
Canada
1,147,455
1,153,824
0
.22
Penn
National
Gaming,
Inc.
,
First
Lien,
CME
Term
Loan,
B
,
8.194
%
,
(
1-month
SOFR
+
2.75
%
),
5/03/29
......
United
States
1,344,075
1,350,977
0
.26
Raptor
Acquisition
Corp.
,
First
Lien,
CME
Term
Loan,
B
,
9.609
%
,
(
3-month
SOFR
+
4
%
),
11/01/26
..........
United
States
1,559,832
1,570,751
0
.30
Scientific
Games
Holdings
LP
,
First
Lien,
2024
Refinancing
Dollar
CME
Term
Loan
,
8.318
%
,
(
3-month
SOFR
+
3
%
),
4/04/29
.........................
United
States
3,615,195
3,613,839
0
.70
19,594,819
3
.80
a
a
a
a
a
a
h
Communications
Equipment
CommScope,
Inc.
,
First
Lien,
Initial
CME
Term
Loan
,
8.708
%
,
(
1-month
SOFR
+
3.25
%
),
4/06/26
........
United
States
1,199,810
1,126,700
0
.22
Delta
Topco,
Inc.
,
First
Lien,
Second
Amendment
CME
Term
Loan
,
8.846
%
,
(
3-month
SOFR
+
3.5
%
),
11/30/29
United
States
2,771,408
2,777,186
0
.54
3,903,886
0
.76
a
a
a
a
a
a
h
Construction
&
Engineering
Artera
Services
LLC
,
First
Lien,
CME
Term
Loan,
C
,
9.835
%
,
(
3-month
SOFR
+
4.5
%
),
2/18/31
.........
United
States
816,136
820,091
0
.16
Brand
Industrial
Services,
Inc.
,
First
Lien,
CME
Term
Loan,
C
,
9.748
%
,
(
3-month
SOFR
+
4.5
%
),
8/01/30
..
United
States
968,447
970,751
0
.19
Chromalloy
Corp.
,
First
Lien,
CME
Term
Loan
,
9.082
%
,
(
3-month
SOFR
+
3.75
%
),
3/27/31
...............
United
States
866,575
854,794
0
.17
Radar
Bidco
SARL
,
First
Lien,
USD
CME
Term
Loan,
B
,
9.568
%
,
(
3-month
SOFR
+
4.25
%
),
3/27/31
........
Luxembourg
487,013
489,755
0
.09
g
USIC
Holdings,
Inc.
,
First
Lien,
CME
Term
Loan
,
9.092
%
,
(
3-month
SOFR
+
3.5
%
),
5/14/28
................
United
States
2,406,942
2,339,548
0
.45
Zekelman
Industries,
Inc.
,
First
Lien,
2024
CME
Term
Loan
,
7.6
%
,
(
1-month
SOFR
+
2.25
%
),
1/24/31
.....
United
States
385,990
387,540
0
.08
5,862,479
1
.14
a
a
a
a
a
a
Franklin
Floating
Rate
Master
Trust
Schedule
of
Investments
Franklin
Floating
Rate
Master
Series
(continued)
Annual
Report
The
accompanying
notes
are
an
integral
part
of
these
financial
statements.
a
a
Country
Principal
Amount
*
a
Value
%
of
Net
Assets
a
a
a
a
a
a
f
Senior
Floating
Rate
Interests
(continued)
Construction
Machinery
&
Heavy
Transportation
Equipment
h
ASP
Blade
Holdings,
Inc.
,
First
Lien,
Initial
CME
Term
Loan
,
9.596
%
,
(
3-month
SOFR
+
4
%
),
10/13/28
.....
United
States
2,506,375
$
1,879,155
0
.36
Consumer
Finance
g
,h
Neon
Maple
US
Debt
Mergersub,
Inc.
,
First
Lien,
CME
Term
Loan
,
8.153
%
,
(
12-month
SOFR
+
3
%
),
7/18/31
United
States
1,684,665
1,681,506
0
.33
Data
Processing
&
Outsourced
Services
h
SS&C
Technologies,
Inc.
,
First
Lien,
CME
Term
Loan,
B8
,
7.344
%
,
(
1-month
SOFR
+
2
%
),
5/09/31
..........
United
States
2,330,982
2,342,252
0
.45
h
Distributors
AIP
RD
Buyer
Corp.
,
First
Lien,
2023
Incremental
CME
Term
Loan
,
9.844
%
,
(
1-month
SOFR
+
4.5
%
),
12/22/28
United
States
315,000
316,706
0
.06
BCPE
Empire
Holdings,
Inc.
,
First
Lien,
Amendment
No.
5
Refinancing
CME
Term
Loan
,
9.344
%
,
(
1-month
SOFR
+
4
%
),
12/11/28
........................
United
States
2,255,885
2,263,510
0
.44
Core
&
Main
LP
,
First
Lien,
Term
Loan,
C
,
7.589
%
,
(
3-month
SOFR
+
2.25
%
),
2/10/31
...............
United
States
523,684
525,975
0
.10
Verde
Purchaser
LLC
,
First
Lien,
Initial
CME
Term
Loan
,
9.835
%
,
(
3-month
SOFR
+
4.5
%
),
11/30/30
........
United
States
1,971,698
1,977,041
0
.39
5,083,232
0
.99
a
a
a
a
a
a
Diversified
Banks
g
,h
Chrysaor
Bidco
SARL
,
First
Lien,
CME
Term
Loan,
B
,
8.737
%
,
(
12-month
SOFR
+
3.5
%
),
5/15/31
........
Luxembourg
475,915
478,594
0
.09
h
Diversified
Chemicals
INEOS
US
Finance
LLC
,
First
Lien,
2030
Dollar
CME
Term
Loan
,
8.597
%
,
(
1-month
SOFR
+
3.25
%
),
2/18/30
Luxembourg
514,800
513,330
0
.10
INEOS
US
Petrochem
LLC
,
First
Lien,
2030
Dollar
CME
Term
Loan,
B
,
9.194
%
,
(
1-month
SOFR
+
3.75
%
),
3/14/30
...............
United
States
538,043
538,267
0
.11
First
Lien,
New
CME
Term
Loan,
B1
,
9.694
%
,
(
1-month
SOFR
+
4.25
%
),
4/02/29
......................
United
States
2,380,295
2,383,270
0
.46
g
LSF11
A5
Holdco
LLC
,
First
Lien,
2024
Refinancing
CME
Term
Loan
,
8.958
%
,
(
1-month
SOFR
+
3.5
%
),
10/16/28
United
States
1,640,948
1,646,076
0
.32
Lummus
Technology
Holdings
V
LLC
,
First
Lien,
2024
CME
Term
Loan,
B
,
8.958
%
,
(
1-month
SOFR
+
3.5
%
),
12/31/29
..................................
United
States
821,033
826,099
0
.16
SCIH
Salt
Holdings,
Inc.
,
First
Lien,
Incremental
CME
Term
Loan,
B1
,
8.755
%
,
(
3-month
SOFR
+
3.5
%
),
3/16/27
...................................
United
States
2,140,174
2,150,030
0
.42
8,057,072
1
.57
a
a
a
a
a
a
Diversified
Financial
Services
h
Mercury
Borrower,
Inc.
,
First
Lien,
Initial
CME
Term
Loan
,
8.958
%
,
(
1-month
SOFR
+
3.5
%
),
8/02/28
.........
United
States
2,527,509
2,536,203
0
.49
h
Diversified
Support
Services
Amentum
Government
Services
Holdings
LLC
,
First
Lien,
CME
Term
Loan,
B3
,
9.35
%
,
(
1-month
SOFR
+
4
%
),
2/15/29
...................................
United
States
1,758,730
1,766,301
0
.34
APi
Group
DE,
Inc.
,
First
Lien,
Repriced
2021
Incremental
CME
Term
Loan
,
7.347
%
,
(
1-month
SOFR
+
2
%
),
1/03/29
...................................
United
States
106,293
106,719
0
.02
CCI
Buyer,
Inc.
,
First
Lien,
Initial
CME
Term
Loan
,
9.335
%
,
(
3-month
SOFR
+
4
%
),
12/17/27
..........
United
States
1,771,616
1,775,124
0
.34
g
Neptune
BidCo
US,
Inc.
,
First
Lien,
Dollar
CME
Term
Loan,
B
,
10.404
%
,
(
3-month
SOFR
+
5
%
),
4/11/29
...
United
States
4,087,640
3,857,710
0
.75
Franklin
Floating
Rate
Master
Trust
Schedule
of
Investments
Franklin
Floating
Rate
Master
Series
(continued)
The
accompanying
notes
are
an
integral
part
of
these
financial
statements.
Annual
Report
a
a
Country
Principal
Amount
*
a
Value
%
of
Net
Assets
a
a
a
a
a
a
f
Senior
Floating
Rate
Interests
(continued)
h
Diversified
Support
Services
(continued)
PG
Investment
Co.
59
SARL
,
First
Lien,
Initial
CME
Term
Loan
,
8.835
%
,
(
3-month
SOFR
+
3.5
%
),
2/24/31
....
Luxembourg
801,796
$
808,311
0
.16
g
Spin
Holdco,
Inc.
,
First
Lien,
Initial
CME
Term
Loan
,
9.6
%
,
(
3-month
SOFR
+
4
%
),
3/06/28
............
United
States
4,663,894
3,857,926
0
.75
12,172,091
2
.36
a
a
a
a
a
a
h
Education
Services
KUEHG
Corp.
,
First
Lien,
CME
Term
Loan,
C
,
9.835
%
,
(
3-month
SOFR
+
4.5
%
),
6/12/30
................
United
States
1,835,862
1,847,336
0
.36
Learning
Care
Group
US
No.
2,
Inc.
,
First
Lien,
CME
Term
Loan,
B
,
9.285
%
,
(
3-month
SOFR
+
4
%
),
8/11/28
United
States
402,945
405,766
0
.08
Spring
Education
Group,
Inc.
,
First
Lien,
CME
Term
Loan
,
9.335
%
,
(
3-month
SOFR
+
4
%
),
9/30/30
..........
United
States
468,211
471,920
0
.09
2,725,022
0
.53
a
a
a
a
a
a
Electric
Utilities
h
Hamilton
Projects
Acquiror
LLC
,
First
Lien,
CME
Term
Loan
,
9.094
%
,
(
1-month
SOFR
+
3.75
%
),
5/30/31
...
United
States
312,012
315,523
0
.06
Electrical
Components
&
Equipment
h
Indicor
LLC
,
First
Lien,
Term
Loan,
C
,
8.585
%
,
(
3-month
SOFR
+
3.25
%
),
11/22/29
.....................
United
States
622,316
624,199
0
.12
Electronic
Components
h
Coherent
Corp.
,
First
Lien,
CME
Term
Loan,
B1
,
7.844
%
,
(
1-month
SOFR
+
2.5
%
),
7/02/29
................
United
States
349,652
351,138
0
.07
h
Environmental
&
Facilities
Services
Covanta
Holding
Corp.
,
First
Lien,
2024
Incremental
CME
Term
Loan,
B
,
8.079
%
,
(
1-month
SOFR
+
2.75
%
),
11/30/28
.......
United
States
1,102,542
1,106,186
0
.22
First
Lien,
CME
Term
Loan,
C
,
8.079
%
,
(
1-month
SOFR
+
2.75
%
),
11/30/28
...........................
United
States
60,248
60,448
0
.01
Madison
IAQ
LLC
,
First
Lien,
Initial
CME
Term
Loan
,
7.889
%
,
(
6-month
SOFR
+
2.75
%
),
6/21/28
........
United
States
2,689,724
2,697,672
0
.52
3,864,306
0
.75
a
a
a
a
a
a
h
Health
Care
Equipment
Medline
Borrower
LP
,
First
Lien,
Dollar
Incremental
CME
Term
Loan
,
7.594
%
,
(
1-month
SOFR
+
2.25
%
),
10/23/28
..............
United
States
341,997
342,691
0
.07
First
Lien,
Initial
CME
Term
Loan
,
7.844
%
,
(
1-month
SOFR
+
2.5
%
),
10/23/28
......................
United
States
1,821,713
1,829,456
0
.35
US
Radiology
Specialists,
Inc.
(US
Outpatient
Imaging
Services,
Inc.)
,
First
Lien,
CME
Term
Loan
,
10.036
%
,
(
3-month
SOFR
+
4.75
%
),
12/15/27
..............
United
States
1,740,870
1,745,988
0
.34
3,918,135
0
.76
a
a
a
a
a
a
h
Health
Care
Facilities
ADMI
Corp.
,
First
Lien,
Amendment
No.
4
Refinancing
CME
Term
Loan
,
8.833
%
,
(
1-month
SOFR
+
3.375
%
),
12/23/27
.
United
States
1,215,301
1,187,167
0
.23
First
Lien,
Amendment
No.
5
CME
Term
Loan
,
9.208
%
,
(
1-month
SOFR
+
3.75
%
),
12/23/27
..............
United
States
1,472,935
1,447,159
0
.28
First
Lien,
CME
Term
Loan,
B5
,
11.094
%
,
(
1-month
SOFR
+
5.75
%
),
12/23/27
.....................
United
States
335,974
338,213
0
.07
Aveanna
Healthcare
LLC
,
First
Lien,
2021
Extended
CME
Term
Loan
,
9.197
%
,
(
3-month
SOFR
+
3.75
%
),
7/17/28
United
States
555,566
533,343
0
.10
Franklin
Floating
Rate
Master
Trust
Schedule
of
Investments
Franklin
Floating
Rate
Master
Series
(continued)
Annual
Report
The
accompanying
notes
are
an
integral
part
of
these
financial
statements.
a
a
Country
Principal
Amount
*
a
Value
%
of
Net
Assets
a
a
a
a
a
a
f
Senior
Floating
Rate
Interests
(continued)
h
Health
Care
Facilities
(continued)
g
Charlotte
Buyer,
Inc.
,
First
Lien,
First
Refinancing
CME
Term
Loan
,
10.076
%
,
(
1-month
SOFR
+
4.75
%
),
2/11/28
...................................
United
States
3,131,835
$
3,151,566
0
.61
g
Concentra
Health
Services,
Inc.
,
First
Lien,
Initial
CME
Term
Loan
,
7.599
%
,
(
1-month
SOFR
+
2.25
%
),
7/28/31
United
States
307,692
308,846
0
.06
Dermatology
Intermediate
Holdings
III,
Inc.
,
First
Lien,
Initial
CME
Term
Loan
,
9.502
%
,
(
3-month
SOFR
+
4.25
%
),
3/26/29
.............................
United
States
1,395,172
1,354,189
0
.26
e
,g
Global
Medical
Response,
Inc.
,
First
Lien,
2024
Extended
CME
Term
Loan
,
PIK,
10.847
%
,
(
3-month
SOFR
+
5.5
%
),
10/31/28
.............................
United
States
1,822,814
1,782,712
0
.35
LifePoint
Health,
Inc.
,
First
Lien,
2024
Incremental
CME
Term
Loan
,
9.329
%
,
(
3-month
SOFR
+
4
%
),
5/19/31
.
United
States
1,107,914
1,112,899
0
.22
Medical
Solutions
Holdings,
Inc.
,
First
Lien,
CME
Term
Loan
,
8.602
%
,
(
3-month
SOFR
+
3.25
%
),
11/01/28
..
United
States
1,450,893
1,162,789
0
.23
Pacific
Dental
Services
LLC
,
First
Lien,
CME
Term
Loan
,
8.585
%
,
(
1-month
SOFR
+
3.25
%
),
3/17/31
........
United
States
944,108
949,248
0
.18
g
PAREXEL
International,
Inc.
,
First
Lien,
Fifth
Amendment
CME
Term
Loan
,
8.344
%
,
(
1-month
SOFR
+
3
%
),
11/15/28
..................................
United
States
1,418,569
1,425,846
0
.28
Pathway
Vet
Alliance
LLC
,
First
Lien,
2021
Replacement
CME
Term
Loan
,
9.208
%
,
(
1-month
SOFR
+
3.75
%
),
3/31/27
...................................
United
States
2,783,262
2,196,078
0
.43
Star
Parent,
Inc.
,
First
Lien,
CME
Term
Loan
,
9.085
%
,
(
3-month
SOFR
+
3.75
%
),
9/27/30
...............
United
States
1,745,625
1,750,583
0
.34
Surgery
Center
Holdings,
Inc.
,
First
Lien,
2024
Refinancing
CME
Term
Loan
,
8.095
%
,
(
1-month
SOFR
+
2.75
%
),
12/19/30
..........................
United
States
284,188
285,319
0
.05
18,985,957
3
.69
a
a
a
a
a
a
h
Health
Care
Services
CNT
Holdings
I
Corp.
,
First
Lien,
Initial
CME
Term
Loan
,
8.752
%
,
(
3-month
SOFR
+
3.5
%
),
11/08/27
........
United
States
1,401,645
1,409,207
0
.27
eResearchTechnology,
Inc.
,
First
Lien,
CME
Term
Loan,
B1
,
9.458
%
,
(
1-month
SOFR
+
4
%
),
2/04/27
.......
United
States
1,054,216
1,061,463
0
.21
MPH
Acquisition
Holdings
LLC
,
First
Lien,
Initial
CME
Term
Loan
,
9.859
%
,
(
3-month
SOFR
+
4.25
%
),
9/01/28
United
States
1,898,325
1,607,321
0
.31
g
National
Mentor
Holdings,
Inc.
,
First
Lien,
Initial
CME
Term
Loan
,
9.192
%
,
(
1-month
SOFR
+
3.75
%
),
3/02/28
......................
United
States
4,323,489
4,084,617
0
.79
First
Lien,
Initial
CME
Term
Loan,
C
,
9.185
%
,
(
3-month
SOFR
+
3.75
%
),
3/02/28
......................
United
States
135,830
128,325
0
.03
Phoenix
Guarantor,
Inc.
,
First
Lien,
CME
Term
Loan,
B4
,
8.594
%
,
(
1-month
SOFR
+
3.25
%
),
2/21/31
........
United
States
2,777,197
2,781,377
0
.54
e
Radiology
Partners,
Inc.
,
First
Lien,
CME
Term
Loan,
B
,
PIK,
10.588
%
,
(
3-month
SOFR
+
5
%
),
1/31/29
......
United
States
2,057,051
1,956,132
0
.38
US
Anesthesia
Partners,
Inc.
,
First
Lien,
Initial
CME
Term
Loan
,
9.707
%
,
(
1-month
SOFR
+
4.25
%
),
10/02/28
..
United
States
2,184,799
2,117,136
0
.41
Waystar
Technologies,
Inc.
,
First
Lien,
Initial
CME
Term
Loan
,
8.094
%
,
(
1-month
SOFR
+
2.75
%
),
10/22/29
..
United
States
1,894,812
1,912,576
0
.37
17,058,154
3
.31
a
a
a
a
a
a
Health
Care
Supplies
h
Bausch
+
Lomb
Corp.
,
First
Lien,
Initial
CME
Term
Loan
,
8.695
%
,
(
1-month
SOFR
+
3.25
%
),
5/10/27
........
United
States
593,939
584,291
0
.11
Franklin
Floating
Rate
Master
Trust
Schedule
of
Investments
Franklin
Floating
Rate
Master
Series
(continued)
The
accompanying
notes
are
an
integral
part
of
these
financial
statements.
Annual
Report
a
a
Country
Principal
Amount
*
a
Value
%
of
Net
Assets
a
a
a
a
a
a
f
Senior
Floating
Rate
Interests
(continued)
h
Health
Care
Technology
athenahealth
Group,
Inc.
,
First
Lien,
Initial
CME
Term
Loan
,
8.594
%
,
(
1-month
SOFR
+
3.25
%
),
2/15/29
...
United
States
5,120,143
$
5,118,556
0
.99
Cotiviti,
Inc.
,
First
Lien,
Initial
Floating
Rate
CME
Term
Loan
,
8.592
%
,
(
1-month
SOFR
+
3.25
%
),
5/01/31
...
United
States
1,870,313
1,879,084
0
.37
6,997,640
1
.36
a
a
a
a
a
a
h
Home
Improvement
Retail
Park
River
Holdings,
Inc.
,
First
Lien,
Initial
CME
Term
Loan
,
8.843
%
,
(
3-month
SOFR
+
3.25
%
),
12/28/27
..
United
States
349,413
333,122
0
.06
White
Cap
Supply
Holdings
LLC
,
First
Lien,
Term
Loan,
C
,
8.594
%
,
(
1-month
SOFR
+
3.25
%
),
10/19/29
.....
United
States
1,582,745
1,575,488
0
.31
1,908,610
0
.37
a
a
a
a
a
a
Homefurnishing
Retail
h
Restoration
Hardware,
Inc.
,
First
Lien,
2022
Incremental
CME
Term
Loan
,
8.694
%
,
(
1-month
SOFR
+
3.25
%
),
10/20/28
..................................
United
States
784,769
754,359
0
.15
Hotels,
Resorts
&
Cruise
Lines
h
Hilton
Grand
Vacations
Borrower
LLC
,
First
Lien,
Initial
CME
Term
Loan
,
7.844
%
,
(
1-month
SOFR
+
2.5
%
),
8/02/28
...................................
United
States
2,561,118
2,567,123
0
.50
Household
Products
h
Energizer
Holdings,
Inc.
,
First
Lien,
2024
Refinancing
CME
Term
Loan
,
7.345
%
,
(
1-month
SOFR
+
2
%
),
12/22/27
..................................
United
States
498,733
500,397
0
.10
Housewares
&
Specialties
h
Hunter
Douglas,
Inc.
,
First
Lien,
CME
Term
Loan,
B1
,
8.836
%
,
(
3-month
SOFR
+
3.5
%
),
2/25/29
.........
Netherlands
1,578,435
1,565,611
0
.30
h
Human
Resource
&
Employment
Services
CHG
Healthcare
Services,
Inc.
,
First
Lien,
2023
Incremental
CME
Term
Loan
,
9.094
%
,
(
1-month
SOFR
+
3.75
%
),
9/30/28
...............
United
States
291,220
291,994
0
.05
g
First
Lien,
CME
Term
Loan
,
8.961
%
,
(
12-month
SOFR
+
3.5
%
),
9/28/28
............................
United
States
500,000
501,330
0
.10
First
Lien,
Initial
CME
Term
Loan
,
8.708
%
,
(
1-month
SOFR
+
3.25
%
),
9/29/28
......................
United
States
816,563
818,645
0
.16
Ingenovis
Health,
Inc.
,
First
Lien,
Initial
CME
Term
Loan
,
9.708
%
,
(
1-month
SOFR
+
4.25
%
),
3/06/28
........
United
States
658,236
586,653
0
.11
TTF
Holdings
LLC
,
First
Lien,
CME
Term
Loan,
B
,
9.237
%
,
(
12-month
SOFR
+
4
%
),
5/28/31
..........
United
States
1,412,180
1,416,600
0
.28
3,615,222
0
.70
a
a
a
a
a
a
h
Independent
Power
Producers
&
Energy
Traders
Calpine
Construction
Finance
Co.
LP
,
First
Lien,
CME
Term
Loan,
B
,
7.344
%
,
(
1-month
SOFR
+
2
%
),
7/31/30
United
States
796,000
796,430
0
.16
Calpine
Corp.
,
First
Lien,
CME
Term
Loan
,
7.344
%
,
(
1-month
SOFR
+
2
%
),
1/31/31
.................
United
States
997,500
998,298
0
.19
Talen
Energy
Supply
LLC
,
First
Lien,
Initial
CME
Term
Loan,
B
,
8.827
%
,
(
3-month
SOFR
+
3.5
%
),
5/17/30
.......................
United
States
733,186
742,692
0
.15
First
Lien,
Initial
CME
Term
Loan,
C
,
8.827
%
,
(
3-month
SOFR
+
3.5
%
),
5/17/30
.......................
United
States
169,101
171,293
0
.03
2,708,713
0
.53
a
a
a
a
a
a
Franklin
Floating
Rate
Master
Trust
Schedule
of
Investments
Franklin
Floating
Rate
Master
Series
(continued)
Annual
Report
The
accompanying
notes
are
an
integral
part
of
these
financial
statements.
a
a
Country
Principal
Amount
*
a
Value
%
of
Net
Assets
a
a
a
a
a
a
f
Senior
Floating
Rate
Interests
(continued)
h
Industrial
Machinery
&
Supplies
&
Components
g
CPM
Holdings,
Inc.
,
First
Lien,
Initial
CME
Term
Loan
,
9.842
%
,
(
1-month
SOFR
+
4.5
%
),
9/28/28
.........
United
States
2,493,734
$
2,459,969
0
.48
Crosby
US
Acquisition
Corp.
,
First
Lien,
Amendment
No.
3
Replacement
CME
Term
Loan
,
9.344
%
,
(
1-month
SOFR
+
4
%
),
8/16/29
.........................
United
States
831,940
837,073
0
.16
Filtration
Group
Corp.
,
First
Lien,
2021
Incremental
CME
Term
Loan
,
3.5
%
,
(
1-month
SOFR
),
10/23/28
.......
United
States
1,000,000
1,006,875
0
.20
Tiger
Acquisition
LLC
,
First
Lien,
Initial
CME
Term
Loan
,
8.694
%
,
(
1-month
SOFR
+
3.25
%
),
6/01/28
........
United
States
2,210,703
2,205,873
0
.43
TK
Elevator
Midco
GmbH
,
First
Lien,
CME
Term
Loan,
C
,
8.588
%
,
(
6-month
SOFR
+
3.5
%
),
4/30/30
.........
Germany
1,932,013
1,944,388
0
.38
8,454,178
1
.65
a
a
a
a
a
a
h
Insurance
Brokers
Alliant
Holdings
Intermediate
LLC
,
First
Lien,
New
CME
Term
Loan,
B6
,
8.845
%
,
(
1-month
SOFR
+
3.5
%
),
11/06/30
..................................
United
States
1,924,197
1,934,539
0
.37
AssuredPartners,
Inc.
,
First
Lien,
2024
CME
Term
Loan
,
8.844
%
,
(
1-month
SOFR
+
3.5
%
),
2/14/31
.........
United
States
1,678,096
1,685,656
0
.33
g
Broadstreet
Partners,
Inc.
,
First
Lien,
CME
Term
Loan,
B4
,
8.494
%
,
(
12-month
SOFR
+
3.25
%
),
5/12/31
....
United
States
905,101
907,826
0
.18
HUB
International
Ltd.
,
First
Lien,
2024
Incremental
CME
Term
Loan
,
8.532
%
,
(
3-month
SOFR
+
3.25
%
),
6/20/30
...............
United
States
2,988,904
2,996,003
0
.58
g
First
Lien,
Term
Loan,
B
,
8.04
%
,
(
12-month
SOFR
+
3
%
),
6/20/30
...............................
United
States
214,876
215,386
0
.04
Truist
Insurance
Holdings
LLC
,
First
Lien,
Initial
CME
Term
Loan
,
8.585
%
,
(
3-month
SOFR
+
3.25
%
),
5/06/31
United
States
1,542,574
1,549,323
0
.30
g
USI,
Inc.
,
First
Lien,
2024
CME
Term
Loan
,
8.085
%
,
(
3-month
SOFR
+
2.75
%
),
9/27/30
...............
United
States
2,493,750
2,500,658
0
.48
11,789,391
2
.28
a
a
a
a
a
a
Integrated
Telecommunication
Services
h
Global
Tel*Link
Corp.
,
First
Lien,
Initial
CME
Term
Loan
,
7.5
%
,
(
1-month
SOFR
),
7/31/29
.............................
United
States
1,620,000
1,555,200
0
.30
Second
Lien,
11/2018
CME
Term
Loan
,
15.444
%
,
(
1-month
SOFR
+
10
%
),
11/30/26
...............
United
States
2,479,737
2,454,940
0
.48
4,010,140
0
.78
a
a
a
a
a
a
Interactive
Home
Entertainment
h
Playtika
Holding
Corp.
,
First
Lien,
CME
Term
Loan,
B1
,
8.208
%
,
(
1-month
SOFR
+
2.75
%
),
3/13/28
........
United
States
1,612,265
1,617,223
0
.32
Internet
Services
&
Infrastructure
h
Barracuda
Networks,
Inc.
,
First
Lien,
Initial
CME
Term
Loan
,
9.814
%
,
(
1-month
SOFR
+
4.5
%
),
8/15/29
....
United
States
1,639,508
1,589,954
0
.31
h
Investment
Banking
&
Brokerage
AI
Aqua
Merger
Sub,
Inc.
,
First
Lien,
2023
Incremental
Delayed
Draw
Term
Loan,
B
,
9.591
%
,
(
1-month
SOFR
+
4.25
%
),
7/31/28
......
United
States
395,833
396,996
0
.08
g
First
Lien,
CME
Term
Loan,
B
,
8.728
%
,
(
12-month
SOFR
+
3.5
%
),
7/31/28
.......................
United
States
1,657,313
1,663,759
0
.32
First
Lien,
Initial
CME
Term
Loan,
B
,
8.843
%
,
(
1-month
SOFR
+
3.5
%
),
7/31/28
.......................
United
States
1,805,923
1,812,948
0
.35
g
Aretec
Group,
Inc.
,
First
Lien,
Term
Loan,
B2
,
9.344
%
,
(
1-month
SOFR
+
4
%
),
8/09/30
.................
United
States
2,777,609
2,736,236
0
.53
Franklin
Floating
Rate
Master
Trust
Schedule
of
Investments
Franklin
Floating
Rate
Master
Series
(continued)
The
accompanying
notes
are
an
integral
part
of
these
financial
statements.
Annual
Report
a
a
Country
Principal
Amount
*
a
Value
%
of
Net
Assets
a
a
a
a
a
a
f
Senior
Floating
Rate
Interests
(continued)
h
Investment
Banking
&
Brokerage
(continued)
Citadel
Securities
LP
,
First
Lien,
CME
Term
Loan
,
7.594
%
,
(
1-month
SOFR
+
2.25
%
),
7/29/30
........
United
States
1,514,652
$
1,521,287
0
.30
Deerfield
Dakota
Holding
LLC
,
First
Lien,
Initial
Dollar
CME
Term
Loan
,
9.085
%
,
(
3-month
SOFR
+
3.75
%
),
4/09/27
...................................
United
States
2,064,384
2,066,840
0
.40
Jane
Street
Group
LLC
,
First
Lien,
2021
CME
Term
Loan
,
7.958
%
,
(
1-month
SOFR
+
2.5
%
),
1/26/28
.........
United
States
1,984,917
1,991,566
0
.39
WEC
US
Holdings
Ltd.
,
First
Lien,
Initial
CME
Term
Loan
,
8.094
%
,
(
1-month
SOFR
+
2.75
%
),
1/27/31
........
United
States
1,514,286
1,519,200
0
.29
13,708,832
2
.66
a
a
a
a
a
a
h
IT
Consulting
&
Other
Services
Amazon
Holdco,
Inc.
,
First
Lien,
CME
Term
Loan,
B
,
7.305
%
,
(
12-month
SOFR
+
2.25
%
),
7/31/31
.......
United
States
972,222
975,868
0
.19
Fortress
Intermediate
3,
Inc.
,
First
Lien,
Initial
CME
Term
Loan
,
9.097
%
,
(
1-month
SOFR
+
3.75
%
),
6/27/31
...
United
States
1,977,218
1,980,925
0
.39
Gainwell
Acquisition
Corp.
,
First
Lien,
CME
Term
Loan,
B
,
9.435
%
,
(
3-month
SOFR
+
4
%
),
10/01/27
..........
United
States
1,929,105
1,721,726
0
.33
Peraton
Corp.
,
First
Lien,
CME
Term
Loan,
B
,
9.194
%
,
(
1-month
SOFR
+
3.75
%
),
2/01/28
...............
United
States
2,162,697
2,166,449
0
.42
Sitel
Worldwide
Corp.
,
First
Lien,
Initial
Dollar
CME
Term
Loan
,
9.208
%
,
(
1-month
SOFR
+
3.75
%
),
8/28/28
...
France
1,678,740
1,179,659
0
.23
8,024,627
1
.56
a
a
a
a
a
a
h
Leisure
Facilities
e
24
Hour
Fitness
Worldwide,
Inc.
,
First
Lien,
Exit
CME
Term
Loan
,
PIK,
10.571
%
,
(
3-month
SOFR
+
5
%
),
12/29/25
..................................
United
States
8,723,545
3,692,982
0
.72
SeaWorld
Parks
&
Entertainment,
Inc.
,
First
Lien,
Term
Loan,
B2
,
7.844
%
,
(
1-month
SOFR
+
2.5
%
),
8/25/28
.
United
States
469,409
470,289
0
.09
4,163,271
0
.81
a
a
a
a
a
a
Leisure
Products
g
,h
Recess
Holdings,
Inc.
,
First
Lien,
Initial
CME
Term
Loan
,
9.752
%
,
(
3-month
SOFR
+
4.5
%
),
2/14/30
.........
United
States
107,527
108,360
0
.02
Metal,
Glass
&
Plastic
Containers
h
Mauser
Packaging
Solutions
Holding
Co.
,
First
Lien,
Initial
CME
Term
Loan
,
8.842
%
,
(
1-month
SOFR
+
3.5
%
),
4/15/27
..............................
United
States
2,721,580
2,733,868
0
.53
Movies
&
Entertainment
h
Banijay
Group
US
Holding,
Inc.
,
First
Lien,
USD
CME
Term
Loan,
B
,
8.587
%
,
(
1-month
SOFR
+
3.25
%
),
3/01/28
...................................
France
684,094
686,981
0
.13
Multi-line
Insurance
h
Acrisure
LLC
,
First
Lien,
Term
Loan,
B6
,
8.594
%
,
(
3-month
SOFR
+
3.25
%
),
11/06/30
..............
United
States
3,497,262
3,498,189
0
.68
Multi-Sector
Holdings
h
Belfor
Holdings,
Inc.
,
First
Lien,
Initial
CME
Term
Loan,
B1
,
9.094
%
,
(
1-month
SOFR
+
3.75
%
),
11/01/30
....
United
States
140,043
140,918
0
.03
Office
Services
&
Supplies
h
Pitney
Bowes,
Inc.
,
First
Lien,
Refinancing
CME
Term
Loan,
B
,
9.458
%
,
(
1-month
SOFR
+
4
%
),
3/17/28
....
United
States
4,461,467
4,470,769
0
.87
Franklin
Floating
Rate
Master
Trust
Schedule
of
Investments
Franklin
Floating
Rate
Master
Series
(continued)
Annual
Report
The
accompanying
notes
are
an
integral
part
of
these
financial
statements.
a
a
Country
Principal
Amount
*
a
Value
%
of
Net
Assets
a
a
a
a
a
a
f
Senior
Floating
Rate
Interests
(continued)
Oil
&
Gas
Storage
&
Transportation
g
,h
UGI
Energy
Services
LLC
,
First
Lien,
Initial
CME
Term
Loan
,
7.844
%
,
(
1-month
SOFR
+
2.5
%
),
2/22/30
....
United
States
1,264,397
$
1,269,378
0
.25
h
Other
Specialty
Retail
Evergreen
Acqco
1
LP
,
First
Lien,
Initial
CME
Term
Loan
,
9.085
%
,
(
3-month
SOFR
+
3.75
%
),
4/26/28
........
United
States
1,287,573
1,296,831
0
.25
GNC
Holdings,
Inc.
,
Second
Lien,
CME
Term
Loan
,
11.444
%
,
(
1-month
SOFR
+
6
%
),
10/07/26
.........
United
States
4,991,642
3,618,940
0
.70
g
Great
Outdoors
Group
LLC
,
First
Lien,
CME
Term
Loan,
B1
,
9.208
%
,
(
1-month
SOFR
+
3.75
%
),
3/06/28
.....
United
States
1,998,246
1,998,246
0
.39
Michaels
Cos.,
Inc.
(The)
,
First
Lien,
CME
Term
Loan,
B
,
9.846
%
,
(
3-month
SOFR
+
4.25
%
),
4/17/28
........
United
States
331,964
272,667
0
.05
Petco
Health
&
Wellness
Co.,
Inc.
,
First
Lien,
Initial
CME
Term
Loan
,
8.846
%
,
(
3-month
SOFR
+
3.25
%
),
3/03/28
United
States
3,710,943
3,438,801
0
.67
Woof
Holdings,
Inc.
,
First
Lien,
Initial
CME
Term
Loan
,
9.346
%
,
(
3-month
SOFR
+
3.75
%
),
12/21/27
.......
United
States
1,548,399
1,190,332
0
.23
11,815,817
2
.29
a
a
a
a
a
a
h
Packaged
Foods
&
Meats
Fiesta
Purchaser,
Inc.
,
First
Lien,
CME
Term
Loan
,
9.344
%
,
(
1-month
SOFR
+
4
%
),
2/12/31
..........
United
States
761,421
767,090
0
.15
Primary
Products
Finance
LLC
,
First
Lien,
CME
Term
Loan,
B
,
8.971
%
,
(
3-month
SOFR
+
3.5
%
),
4/02/29
..
United
States
1,332,700
1,337,344
0
.26
Simply
Good
Foods
USA,
Inc.
,
First
Lien,
Initial
CME
Term
Loan
,
7.944
%
,
(
1-month
SOFR
+
2.5
%
),
3/17/27
United
States
145,773
146,866
0
.03
2,251,300
0
.44
a
a
a
a
a
a
h
Paper
&
Plastic
Packaging
Products
&
Materials
Charter
Next
Generation,
Inc.
,
First
Lien,
CME
Term
Loan,
B
,
8.597
%
,
(
1-month
SOFR
+
3.25
%
),
12/01/27
United
States
1,663,734
1,673,267
0
.33
Klockner
Pentaplast
of
America,
Inc.
,
First
Lien,
USD
CME
Term
Loan,
B
,
10.267
%
,
(
6-month
SOFR
+
4.725
%
),
2/09/26
............................
Luxembourg
3,742,201
3,529,831
0
.69
LC
Ahab
US
Bidco
LLC
,
First
Lien,
Initial
CME
Term
Loan
,
8.844
%
,
(
1-month
SOFR
+
3.5
%
),
5/01/31
....
United
States
328,228
330,141
0
.06
ProAmpac
PG
Borrower
LLC
,
First
Lien,
2024
CME
Term
Loan,
B
,
9.31
%
,
(
3-month
SOFR
+
4
%
),
9/15/28
.....
United
States
1,260,350
1,266,261
0
.25
SupplyOne,
Inc.
,
First
Lien,
CME
Term
Loan,
B
,
9.594
%
,
(
1-month
SOFR
+
4.25
%
),
4/21/31
...............
United
States
1,455,536
1,465,237
0
.28
8,264,737
1
.61
a
a
a
a
a
a
h
Passenger
Airlines
AAdvantage
Loyalty
IP
Ltd.
,
First
Lien,
Initial
CME
Term
Loan
,
10.294
%
,
(
3-month
SOFR
+
4.75
%
),
4/20/28
..
United
States
1,135,336
1,175,992
0
.23
Air
Canada
,
First
Lien,
CME
Term
Loan
,
7.847
%
,
(
3-month
SOFR
+
2.5
%
),
3/21/31
................
Canada
731,764
735,082
0
.14
American
Airlines,
Inc.
,
First
Lien,
Initial
CME
Term
Loan
,
7.775
%
,
(
3-month
SOFR
+
2.5
%
),
6/04/29
.........
United
States
2,200,000
2,192,300
0
.43
United
Airlines,
Inc.
,
First
Lien,
CME
Term
Loan,
B
,
8.033
%
,
(
3-month
SOFR
+
2.75
%
),
2/22/31
........
United
States
997,500
1,002,667
0
.19
WestJet
Loyalty
LP
,
First
Lien,
Initial
CME
Term
Loan
,
9.082
%
,
(
3-month
SOFR
+
3.75
%
),
2/14/31
........
Canada
3,044,066
3,052,072
0
.59
8,158,113
1
.58
a
a
a
a
a
a
h
Passenger
Ground
Transportation
Savage
Enterprises
LLC
,
First
Lien,
Initial
Term
Loan
,
8.329
%
,
(
1-month
SOFR
+
3
%
),
9/15/28
..........
United
States
370,675
372,660
0
.07
Franklin
Floating
Rate
Master
Trust
Schedule
of
Investments
Franklin
Floating
Rate
Master
Series
(continued)
The
accompanying
notes
are
an
integral
part
of
these
financial
statements.
Annual
Report
a
a
Country
Principal
Amount
*
a
Value
%
of
Net
Assets
a
a
a
a
a
a
f
Senior
Floating
Rate
Interests
(continued)
h
Passenger
Ground
Transportation
(continued)
g
Worldwide
Express
LLC
,
First
Lien,
Initial
CME
Term
Loan
,
9.846
%
,
(
3-month
SOFR
+
4.25
%
),
7/26/28
...
United
States
1,496,164
$
1,502,156
0
.29
1,874,816
0
.36
a
a
a
a
a
a
h
Pharmaceuticals
Endo
Finance
Holdings,
Inc.
,
First
Lien,
Initial
CME
Term
Loan
,
9.783
%
,
(
3-month
SOFR
+
4.5
%
),
4/09/31
....
United
States
369,458
370,766
0
.07
Grifols
Worldwide
Operations
Ltd.
,
First
Lien,
CME
Term
Loan,
B
,
7.402
%
,
(
3-month
SOFR
+
2
%
),
11/15/27
...
Spain
448,187
437,173
0
.08
Jazz
Financing
Lux
SARL
,
First
Lien,
Dollar
CME
Term
Loan,
B2
,
2.25
%
,
(
1-month
SOFR
),
5/05/28
........
United
States
2,474,012
2,481,075
0
.48
Organon
&
Co.
,
First
Lien,
Dollar
CME
Term
Loan
,
7.835
%
,
(
1-month
SOFR
+
2.5
%
),
5/19/31
.........
United
States
868,359
873,243
0
.17
Perrigo
Investments
LLC
,
First
Lien,
Initial
CME
Term
Loan,
B
,
7.694
%
,
(
1-month
SOFR
+
2.25
%
),
4/20/29
.
United
States
1,308,092
1,312,997
0
.26
5,475,254
1
.06
a
a
a
a
a
a
h
Property
&
Casualty
Insurance
Asurion
LLC
,
First
Lien,
New
CME
Term
Loan,
B10
,
9.444
%
,
(
1-month
SOFR
+
4
%
),
8/21/28
.................
United
States
886,466
880,234
0
.17
First
Lien,
New
CME
Term
Loan,
B11
,
9.694
%
,
(
1-month
SOFR
+
4.25
%
),
8/21/28
...............
United
States
340,517
339,635
0
.07
First
Lien,
New
CME
Term
Loan,
B8
,
8.708
%
,
(
1-month
SOFR
+
3.25
%
),
12/23/26
.....................
United
States
1,467,937
1,464,583
0
.29
Second
Lien,
New
CME
Term
Loan,
B3
,
10.708
%
,
(
1-month
SOFR
+
5.25
%
),
1/31/28
...............
United
States
2,652,263
2,484,070
0
.48
Second
Lien,
New
CME
Term
Loan,
B4
,
10.708
%
,
(
1-month
SOFR
+
5.25
%
),
1/19/29
...............
United
States
3,248,036
3,008,915
0
.58
g
Sedgwick
Claims
Management
Services,
Inc.
,
First
Lien,
2023
CME
Term
Loan
,
9.094
%
,
(
1-month
SOFR
+
3.75
%
),
2/24/28
.............................
United
States
4,495,882
4,509,303
0
.88
12,686,740
2
.47
a
a
a
a
a
a
h
Publishing
Cengage
Learning,
Inc.
,
First
Lien,
CME
Term
Loan,
B
,
9.538
%
,
(
6-month
SOFR
+
4.25
%
),
3/14/31
........
United
States
3,321,834
3,340,520
0
.65
McGraw-Hill
Education,
Inc.
,
First
Lien,
Initial
CME
Term
Loan
,
10.346
%
,
(
3-month
SOFR
+
4.75
%
),
7/28/28
..
United
States
2,635,367
2,643,787
0
.51
5,984,307
1
.16
a
a
a
a
a
a
Real
Estate
Development
h
Greystar
Real
Estate
Partners
LLC
,
First
Lien,
CME
Term
Loan,
B1
,
8.577
%
,
(
3-month
SOFR
+
3.25
%
),
8/21/30
United
States
400,122
402,123
0
.08
Real
Estate
Services
h
Cushman
&
Wakefield
US
Borrower
LLC
,
First
Lien,
2023
CME
Term
Loan,
B
,
8.344
%
,
(
1-month
SOFR
+
3
%
),
1/31/30
.........................
United
States
1,094,244
1,096,979
0
.21
First
Lien,
CME
Term
Loan
,
9.094
%
,
(
1-month
SOFR
+
3.75
%
),
1/31/30
.............................
United
States
104,214
104,735
0
.02
1,201,714
0
.23
a
a
a
a
a
a
h
Research
&
Consulting
Services
CoreLogic,
Inc.
,
First
Lien,
Initial
CME
Term
Loan
,
8.958
%
,
(
1-month
SOFR
+
3.5
%
),
6/02/28
.........
United
States
2,593,333
2,560,113
0
.50
Dun
&
Bradstreet
Corp.
(The)
,
First
Lien,
CME
Term
Loan,
B
,
8.097
%
,
(
1-month
SOFR
+
2.75
%
),
1/18/29
.
United
States
800,955
803,618
0
.16
Franklin
Floating
Rate
Master
Trust
Schedule
of
Investments
Franklin
Floating
Rate
Master
Series
(continued)
Annual
Report
The
accompanying
notes
are
an
integral
part
of
these
financial
statements.
a
a
Country
Principal
Amount
*
a
Value
%
of
Net
Assets
a
a
a
a
a
a
f
Senior
Floating
Rate
Interests
(continued)
h
Research
&
Consulting
Services
(continued)
Grant
Thornton
LLP
,
First
Lien,
CME
Term
Loan,
B
,
8.597
%
,
(
3-month
SOFR
+
3.25
%
),
6/02/31
........
United
Kingdom
777,778
$
780,698
0
.15
Inizio
Group
Ltd.
,
First
Lien,
Initial
Dollar
CME
Term
Loan
,
9.685
%
,
(
3-month
SOFR
+
4.25
%
),
8/21/28
........
United
Kingdom
872,334
869,063
0
.17
5,013,492
0
.98
a
a
a
a
a
a
h
Restaurants
Dave
&
Buster's,
Inc.
,
First
Lien,
2024
Refinancing
CME
Term
Loan,
B
,
8.625
%
,
(
1-month
SOFR
+
3.25
%
),
6/29/29
...................................
United
States
490,996
493,075
0
.09
Flynn
Restaurant
Group
LP
,
First
Lien,
CME
Term
Loan
,
9.708
%
,
(
1-month
SOFR
+
4.25
%
),
12/01/28
.......
United
States
3,068,382
3,078,738
0
.60
IRB
Holding
Corp.
,
First
Lien,
CME
Term
Loan,
B
,
8.194
%
,
(
1-month
SOFR
+
2.75
%
),
12/15/27
.......
United
States
411,824
412,538
0
.08
g
Whatabrands
LLC
,
First
Lien,
2024
CME
Term
Loan,
B
,
8.094
%
,
(
1-month
SOFR
+
2.75
%
),
8/03/28
........
United
States
2,755,661
2,761,214
0
.54
6,745,565
1
.31
a
a
a
a
a
a
h
Security
&
Alarm
Services
Allied
Universal
Holdco
LLC
,
First
Lien,
Initial
US
Dollar
CME
Term
Loan
,
9.194
%
,
(
1-month
SOFR
+
3.75
%
),
5/12/28
...................................
United
States
3,838,806
3,842,645
0
.75
g
APX
Group,
Inc.
,
First
Lien,
Initial
Term
Loan
,
8.075
%
,
(
PRIME
+
1.75
%
),
7/07/28
.....................
United
States
1,482,527
1,487,041
0
.29
Prime
Security
Services
Borrower
LLC
,
First
Lien,
CME
Term
Loan
,
7.582
%
,
(
1-month
SOFR
+
2.25
%
),
10/11/30
..................................
United
States
1,799,369
1,806,117
0
.35
7,135,803
1
.39
a
a
a
a
a
a
Semiconductor
Materials
&
Equipment
h
MKS
Instruments,
Inc.
,
First
Lien,
2024-1
Dollar
CME
Term
Loan,
B
,
7.597
%
,
(
1-month
SOFR
+
2.25
%
),
8/17/29
...................................
United
States
1,626,568
1,635,213
0
.32
h
Soft
Drinks
&
Non-alcoholic
Beverages
Naked
Juice
LLC
,
First
Lien,
Initial
CME
Term
Loan
,
8.685
%
,
(
1-month
SOFR
+
3.25
%
),
1/24/29
........
United
States
1,607,729
1,436,602
0
.28
Triton
Water
Holdings,
Inc.
,
First
Lien,
2024
Incremental
CME
Term
Loan
,
9.335
%
,
(
3-month
SOFR
+
4
%
),
3/31/28
.................
United
States
165,833
166,932
0
.03
First
Lien,
Initial
CME
Term
Loan
,
8.846
%
,
(
3-month
SOFR
+
3.25
%
),
3/31/28
......................
United
States
1,538,689
1,545,121
0
.30
3,148,655
0
.61
a
a
a
a
a
a
h
Specialized
Consumer
Services
g
Mavis
Tire
Express
Services
Topco
Corp.
,
First
Lien,
2024-2
Incremental
CME
Term
Loan
,
8.847
%
,
(
1-month
SOFR
+
3.5
%
),
5/04/28
.......................
United
States
396,552
397,985
0
.08
Pre-Paid
Legal
Services,
Inc.
,
First
Lien,
Initial
CME
Term
Loan
,
9.208
%
,
(
1-month
SOFR
+
3.75
%
),
12/07/28
..
United
States
562,487
563,345
0
.11
Wand
NewCo
3,
Inc.
,
First
Lien,
Initial
CME
Term
Loan
,
9.097
%
,
(
1-month
SOFR
+
3.75
%
),
1/30/31
......................
United
States
230,769
231,962
0
.05
g
First
Lien,
Term
Loan,
B
,
8.305
%
,
(
12-month
SOFR
+
3.25
%
),
1/02/31
.............................
United
States
431,034
433,263
0
.08
Franklin
Floating
Rate
Master
Trust
Schedule
of
Investments
Franklin
Floating
Rate
Master
Series
(continued)
The
accompanying
notes
are
an
integral
part
of
these
financial
statements.
Annual
Report
a
a
Country
Principal
Amount
*
a
Value
%
of
Net
Assets
a
a
a
a
a
a
f
Senior
Floating
Rate
Interests
(continued)
h
Specialized
Consumer
Services
(continued)
WW
International,
Inc.
,
First
Lien,
Initial
CME
Term
Loan
,
8.958
%
,
(
1-month
SOFR
+
3.5
%
),
4/13/28
.........
United
States
1,260,362
$
481,697
0
.09
2,108,252
0
.41
a
a
a
a
a
a
Specialized
Finance
g
,h
Red
Planet
Borrower
LLC
,
First
Lien,
CME
Term
Loan,
B
,
8.944
%
,
(
1-month
SOFR
+
3.5
%
),
10/02/28
........
United
States
1,986,208
1,906,055
0
.37
h
Specialty
Chemicals
Hexion
Holdings
Corp.
,
First
Lien,
Initial
CME
Term
Loan
,
9.977
%
,
(
3-month
SOFR
+
4.5
%
),
3/15/29
.......................
United
States
3,246,219
3,227,082
0
.62
Second
Lien,
Initial
CME
Term
Loan
,
12.881
%
,
(
1-month
SOFR
+
7.438
%
),
3/15/30
..............
United
States
2,587,209
2,367,297
0
.46
Nouryon
Finance
BV
,
First
Lien,
CME
Term
Loan,
B
,
8.826
%
,
(
3-month
SOFR
+
3.5
%
),
4/03/28
.........
Netherlands
1,210,568
1,219,084
0
.24
PMHC
II,
Inc.
,
First
Lien,
Initial
CME
Term
Loan
,
9.704
%
,
(
3-month
SOFR
+
4.25
%
),
4/23/29
...............
United
States
4,372,182
4,284,148
0
.83
11,097,611
2
.15
a
a
a
a
a
a
h
Systems
Software
McAfee
Corp.
,
First
Lien,
Term
Loan,
B1
,
8.592
%
,
(
1-month
SOFR
+
3.25
%
),
3/01/29
...............
United
States
3,855,053
3,855,342
0
.75
Sovos
Compliance
LLC
,
First
Lien,
Initial
CME
Term
Loan
,
9.958
%
,
(
1-month
SOFR
+
4.5
%
),
8/11/28
....
United
States
2,596,100
2,596,269
0
.50
Surf
Holdings
LLC
,
First
Lien,
Dollar
CME
Term
Loan
,
8.96
%
,
(
1-month
SOFR
+
3.5
%
),
3/05/27
..........
United
States
1,488,379
1,495,092
0
.29
Vision
Solutions,
Inc.
,
First
Lien,
New
CME
Term
Loan,
B
,
9.514
%
,
(
3-month
SOFR
+
4
%
),
4/24/28
..........
United
States
847,118
822,463
0
.16
8,769,166
1
.70
a
a
a
a
a
a
Trading
Companies
&
Distributors
g
,h
Foundation
Building
Materials,
Inc.
,
First
Lien,
2024
Incremental
CME
Term
Loan
,
9.253
%
,
(
1-month
SOFR
+
4
%
),
1/29/31
..............................
United
States
2,932,342
2,911,083
0
.57
Transaction
&
Payment
Processing
Services
h
Boost
Newco
Borrower
LLC
,
g
First
Lien,
CME
Term
Loan
,
7.728
%
,
(
12-month
SOFR
+
2.5
%
),
1/31/31
............................
United
States
571,429
573,528
0
.11
First
Lien,
Initial
USD
CME
Term
Loan
,
8.335
%
,
(
3-month
SOFR
+
3
%
),
1/31/31
.................
United
States
5,119,565
5,138,380
1
.00
5,711,908
1
.11
a
a
a
a
a
a
Wireless
Telecommunication
Services
h
Crown
Subsea
Communications
Holding,
Inc.
,
First
Lien,
CME
Term
Loan,
B
,
10.08
%
,
(
3-month
SOFR
+
4.75
%
),
1/26/31
...................................
United
States
1,129,032
1,138,064
0
.22
Total
Senior
Floating
Rate
Interests
(Cost
$
436,867,456
)
..................
430,528,169
83
.61
Shares/Units
Escrows
and
Litigation
Trusts
a,c
Millennium
Corporate
Claim
Trust,
Escrow
Account
....
United
States
6,589,709
—
0.00
Franklin
Floating
Rate
Master
Trust
Schedule
of
Investments
Franklin
Floating
Rate
Master
Series
(continued)
Annual
Report
The
accompanying
notes
are
an
integral
part
of
these
financial
statements.
a
a
Country
Shares/Units
a
Value
%
of
Net
Assets
a
a
a
a
a
a
Escrows
and
Litigation
Trusts
(continued)
a,c
Millennium
Lender
Claim
Trust,
Escrow
Account
......
United
States
6,589,709
$
—
0.00
Total
Escrows
and
Litigation
Trusts
(Cost
$
–
)
............................
—
0.00
Total
Long
Term
Investments
(Cost
$
493,402,055
)
........................
478,364,224
92
.90
a
Short
Term
Investments
a
a
Principal
Amount
*
a
Value
%
of
Net
Assets
aa
aa
aa
aa
aa
aa
Repurchase
Agreements
i
Joint
Repurchase
Agreement
,
5.292
%
,
8/01/24
(Maturity
Value
$
65,198,521
)
BNP
Paribas
Securities
Corp.
(Maturity
Value
$9,377,504)
Deutsche
Bank
Securities,
Inc.
(Maturity
Value
$25,813,398)
HSBC
Securities
(USA),
Inc.
(Maturity
Value
$30,007,619)
Collateralized
by
U.S.
Government
Agency
Securities,
2%
-
6.5%,
3/20/45
-
7/20/54;
and
U.S.
Treasury
Notes,
2.88%
-
3.75%,
8/15/28
-
12/31/28
(valued
at
$
66,502,103
)
.....................................
65,188,937
65,188,937
12
.66
Total
Repurchase
Agreements
(Cost
$
65,188,937
)
........................
65,188,937
12
.66
a
a
a
Total
Short
Term
Investments
(Cost
$
65,188,937
)
.........................
65,188,937
12
.66
a
Total
Investments
(Cost
$
558,590,992
)
..................................
$543,553,161
105
.56
Other
Assets,
less
Liabilities
...........................................
(28,617,549)
(
5
.56
)
Net
Assets
...........................................................
$514,935,612
100.00
See
Abbreviations
on
page
31
.
*
The
principal
amount
is
stated
in
U.S.
dollars
unless
otherwise
indicated.
†
Rounds
to
less
than
0.01%
of
net
assets.
a
Non-income
producing.
b
See
Note
3(d)
regarding
investments
in
affiliated
management
investment
companies.
c
Fair
valued
using
significant
unobservable
inputs.
See
Note
11
regarding
fair
value
measurements.
d
Security
was
purchased
pursuant
to
Rule
144A
or
Regulation
S
under
the
Securities
Act
of
1933.
144A
securities
may
be
sold
in
transactions
exempt
from
registration
only
to
qualified
institutional
buyers
or
in
a
public
offering
registered
under
the
Securities
Act
of
1933.
Regulation
S
securities
cannot
be
sold
in
the
United
States
without
either
an
effective
registration
statement
filed
pursuant
to
the
Securities
Act
of
1933,
or
pursuant
to
an
exemption
from
registration.
At
July
31,
2024,
the
aggregate
value
of
these
securities
was
$26,753,896,
representing
5.2%
of
net
assets.
e
Income
may
be
received
in
additional
securities
and/or
cash.
f
See
Note
1(e)
regarding
senior
floating
rate
interests.
g
A
portion
or
all
of
the
security
purchased
on
a
delayed
delivery
basis.
See
Note
1(c).
h
The
coupon
rate
shown
represents
the
rate
inclusive
of
any
caps
or
floors,
if
applicable,
in
effect
at
period
end.
i
See
Note
1(b)
regarding
joint
repurchase
agreement.
Franklin
Floating
Rate
Master
Trust
Financial
Statements
Statement
of
Assets
and
Liabilities
July
31,
2024
The
accompanying
notes
are
an
integral
part
of
these
financial
statements.
Annual
Report
Franklin
Floating
Rate
Master
Series
Assets:
Investments
in
securities:
Cost
-
Unaffiliated
issuers
...................................................................
$486,316,048
Cost
-
Non-controlled
affiliates
(Note
3
d
and
8
)
...................................................
7,086,007
Cost
-
Unaffiliated
repurchase
agreements
......................................................
65,188,937
Value
-
Unaffiliated
issuers
..................................................................
$471,498,150
Value
-
Non-controlled
affiliates
(Note
3
d
and
8
)
..................................................
6,866,074
Value
-
Unaffiliated
repurchase
agreements
......................................................
65,188,937
Cash
....................................................................................
2,407,631
Receivables:
Investment
securities
sold
...................................................................
15,417,241
Dividends
and
interest
.....................................................................
4,674,196
Unrealized
appreciation
on
unfunded
loan
commitments
(Note
7
)
.......................................
5,066
Total
assets
..........................................................................
566,057,295
Liabilities:
Payables:
Investment
securities
purchased
..............................................................
46,702,699
Management
fees
.........................................................................
223,229
Trustees'
fees
and
expenses
.................................................................
1
Distributions
to
shareholders
.................................................................
4,059,192
Accrued
expenses
and
other
liabilities
...........................................................
136,562
Total
liabilities
.........................................................................
51,121,683
Net
assets,
at
value
.................................................................
$514,935,612
Net
assets
consist
of:
Paid-in
capital
.............................................................................
$927,343,352
Total
distributable
earnings
(losses)
.............................................................
(412,407,740)
Net
assets,
at
value
.................................................................
$514,935,612
Shares
outstanding
.........................................................................
72,178,849
Net
asset
value
and
maximum
offering
price
per
share
($
514,935,612
÷
72,178,849
shares
outstanding)
a
..........
$7.13
a
Net
asset
value
per
share
may
not
recalculate
due
to
rounding.
Franklin
Floating
Rate
Master
Trust
Financial
Statements
Statement
of
Operations
for
the
year
ended
July
31,
2024
Annual
Report
The
accompanying
notes
are
an
integral
part
of
these
financial
statements.
Franklin
Floating
Rate
Master
Series
Investment
income:
Dividends:
(net
of
foreign
taxes
of
$51,090)
Unaffiliated
issuers
........................................................................
$468,361
Non-controlled
affiliates
(Note
3
d
and
8
)
........................................................
574,690
Interest:
Unaffiliated
issuers
........................................................................
41,878,055
Income
from
securities
loaned:
Unaffiliated
entities
(net
of
fees
and
rebates)
.....................................................
(1,234)
Non-controlled
affiliates
(Not
e
3d)
.............................................................
6,982
Total
investment
income
...................................................................
42,926,854
Expenses:
Management
fees
(Note
3
a
)
...................................................................
2,356,416
Reports
to
shareholders
fees
..................................................................
1,368
Professional
fees
...........................................................................
145,563
Trustees'
fees
and
expenses
..................................................................
4,973
Other
....................................................................................
32,971
Total
expenses
.........................................................................
2,541,291
Expenses
waived/paid
by
affiliates
(Not
e
3d
and
3e)
..............................................
(184,847)
Net
expenses
.........................................................................
2,356,444
Net
investment
income
................................................................
40,570,410
Realized
and
unrealized
gains
(losses):
Net
realized
gain
(loss)
from:
Investments:(net
of
foreign
taxes
of
$1,882,870)
Unaffiliated
issuers
......................................................................
(11,765,672)
Non-controlled
affiliates
(Note
3
d
and
8
)
.......................................................
9,144,177
Foreign
currency
transactions
................................................................
(6,785)
Capital
gain
distributions
from
management
investment
companies:
Non-controlled
affiliates
(Note
3d)
...........................................................
82,329
Net
realized
gain
(loss)
..................................................................
(2,545,951)
Net
change
in
unrealized
appreciation
(depreciation)
on:
Investments:
Unaffiliated
issuers
......................................................................
6,033,244
Non-controlled
affiliates
(Note
3
d
and
8
)
.......................................................
(2,081,029)
Unfunded
loan
commitments
(Not
e
7)
..........................................................
14,033
Net
change
in
unrealized
appreciation
(depreciation)
............................................
3,966,248
Net
realized
and
unrealized
gain
(loss)
............................................................
1,420,297
Net
increase
(decrease)
in
net
assets
resulting
from
operations
..........................................
$41,990,707
Franklin
Floating
Rate
Master
Trust
Financial
Statements
Statements
of
Changes
in
Net
Assets
The
accompanying
notes
are
an
integral
part
of
these
financial
statements.
Annual
Report
Franklin
Floating
Rate
Master
Series
Year
Ended
July
31,
2024
Year
Ended
July
31,
2023
Increase
(decrease)
in
net
assets:
Operations:
Net
investment
income
.................................................
$40,570,410
$39,484,253
Net
realized
gain
(loss)
.................................................
(2,545,951)
(24,595,847)
Net
change
in
unrealized
appreciation
(depreciation)
...........................
3,966,248
32,636,091
Net
increase
(decrease)
in
net
assets
resulting
from
operations
................
41,990,707
47,524,497
Distributions
to
shareholders
..............................................
(42,942,066)
(41,294,993)
Capital
share
transactions
(Note
2
)
..........................................
126,180,240
(233,130,208)
Net
increase
(decrease)
in
net
assets
...................................
125,228,881
(226,900,704)
Net
assets:
Beginning
of
year
.......................................................
389,706,731
616,607,435
End
of
year
...........................................................
$514,935,612
$389,706,731
Franklin
Floating
Rate
Master
Trust
Notes
to
Financial
Statements
Franklin
Floating
Rate
Master
Series
1.
Organization
and
Significant
Accounting
Policies
Franklin
Floating
Rate
Master
Trust
(Trust)
is
registered
under
the
Investment
Company
Act
of
1940
(1940
Act)
as
an
open-end
management
investment
company,
consisting
of
one fund,
Franklin
Floating
Rate
Master
Series (Fund).
The
Fund
follows
the
accounting
and
reporting
guidance
in
Financial
Accounting
Standards
Board
(FASB)
Accounting
Standards
Codification
Topic
946,
Financial
Services
–
Investment
Companies
(ASC
946)
and
applies
the
specialized
accounting
and
reporting
guidance
in
U.S.
Generally
Accepted
Accounting
Principles
(U.S.
GAAP),
including,
but
not
limited
to,
ASC
946. The
Fund's
shares
are
exempt
from
registration
under
the
Securities
Act
of
1933.
The
following
summarizes
the Fund's
significant
accounting
policies.
a.
Financial
Instrument
Valuation
The
Fund's
investments
in
financial
instruments
are
carried
at
fair
value
daily.
Fair
value
is
the
price
that
would
be
received
to
sell
an
asset
or
paid
to
transfer
a
liability
in
an
orderly
transaction
between
market
participants
on
the
measurement
date.
The
Fund
calculates
the
net
asset
value
(NAV)
per
share
each business
day as
of
4
p.m.
Eastern
time
or
the
regularly
scheduled
close
of
the
New
York
Stock
Exchange
(NYSE),
whichever
is
earlier.
Under
compliance
policies
and
procedures
approved
by
the Trust's
Board
of
Trustees
(the
Board),
the
Board
has
designated
the
Fund’s
investment
manager
as
the
valuation
designee
and
has
responsibility
for
oversight
of
valuation.
The
investment
manager
is
assisted
by
the
Fund’s
administrator
in
performing
this
responsibility,
including
leading
the
cross-
functional
Valuation
Committee
(VC).
The
Fund
may
utilize
independent
pricing
services,
quotations
from
securities
and
financial
instrument
dealers,
and
other
market
sources
to
determine
fair
value.
Equity
securities
and
exchange
traded
funds listed
on
an
exchange
or
on
the
NASDAQ
National
Market
System
are
valued
at
the
last
quoted
sale
price
or
the
official
closing
price of
the
day,
respectively.
Foreign
equity
securities
are
valued
as
of
the
close
of
trading
on
the
foreign
stock
exchange
on
which
the
security
is
primarily
traded,
or
as
of
4
p.m.
Eastern
time.
The
value
is
then
converted
into
its
U.S.
dollar
equivalent
at
the
foreign
exchange
rate
in
effect
at
4
p.m.
Eastern
time
on
the
day
that
the
value
of
the
security
is
determined.
Over-the-counter
(OTC)
securities
are
valued
within
the
range
of
the
most
recent
quoted
bid
and
ask
prices.
Securities
that
trade
in
multiple
markets
or
on
multiple
exchanges
are
valued
according
to
the
broadest
and
most
representative
market.
Certain
equity
securities
are
valued
based
upon
fundamental
characteristics
or
relationships
to
similar
securities.
Debt
securities
generally
trade
in
the OTC
market
rather
than
on
a
securities
exchange.
The
Fund's
pricing
services
use
multiple
valuation
techniques
to
determine
fair
value.
In
instances
where
sufficient
market
activity
exists,
the
pricing
services
may
utilize
a
market-based
approach
through
which
quotes
from
market
makers
are
used
to
determine
fair
value.
In
instances
where
sufficient
market
activity
may
not
exist
or
is
limited,
the
pricing
services
also
utilize
proprietary
valuation
models
which
may
consider
market
characteristics
such
as
benchmark
yield
curves,
credit
spreads,
estimated
default
rates,
anticipated
market
interest
rate
volatility,
coupon
rates,
anticipated
timing
of
principal
repayments,
underlying
collateral,
and
other
unique
security
features
in
order
to
estimate
the
relevant
cash
flows,
which
are
then
discounted
to
calculate
the
fair
value.
Investments
in open-end mutual
funds
are
valued
at
the
closing
NAV.
Investments
in
repurchase
agreements
are
valued
at
cost,
which
approximates
fair
value.
The
Fund
has
procedures
to
determine
the
fair
value
of
financial
instruments
for
which
market
prices
are
not
reliable
or
readily
available.
Under
these
procedures,
the Fund
primarily
employs
a
market-based
approach
which
may
use
related
or
comparable
assets
or
liabilities,
recent
transactions,
market
multiples,
and
other
relevant
information
for
the
investment
to
determine
the
fair
value
of
the
investment.
An
income-based
valuation
approach
may
also
be
used
in
which
the
anticipated
future
cash
flows
of
the
investment
are
discounted
to
calculate
fair
value.
Discounts
may
also
be
applied
due
to
the
nature
or
duration
of
any
restrictions
on
the
disposition
of
the
investments.
Due
to
the
inherent
uncertainty
of
valuations
of
such
investments,
the
fair
values
may
differ
significantly
from
the
values
that
would
have
been
used
had
an
active
market
existed.
b.
Joint
Repurchase
Agreement
The
Fund
enters
into
a
joint
repurchase
agreement
whereby
its
uninvested
cash
balance
is
deposited
into
a
joint
cash
account
with
other
funds
managed
by
the
investment
manager
or
an
affiliate
of
the
investment
manager
and
is
used
to
invest
in
one
or
more
repurchase
agreements.
The
value
and
face
amount
of
the
joint
repurchase
agreement
Franklin
Floating
Rate
Master
Trust
Notes
to
Financial
Statements
Franklin
Floating
Rate
Master
Series
(continued)
are
allocated
to
the
funds
based
on
their
pro-rata
interest.
A
repurchase
agreement
is
accounted
for
as
a
loan
by
the
Fund
to
the
seller,
collateralized
by
securities
which
are
delivered
to
the
Fund's
custodian.
The
fair
value,
including
accrued
interest,
of
the
initial
collateralization
is
required
to
be
at
least
102%
of
the
dollar
amount
invested
by
the
funds,
with
the
value
of
the
underlying
securities
marked
to
market
daily
to
maintain
coverage
of
at
least
100%.
Repurchase
agreements
are
subject
to
the
terms
of
Master
Repurchase
Agreements
(MRAs)
with
approved
counterparties
(sellers).
The
MRAs
contain
various
provisions,
including
but
not
limited
to
events
of
default
and
maintenance
of
collateral
for
repurchase
agreements.
In
the
event
of
default
by
either
the
seller
or
the
Fund,
certain
MRAs
may
permit
the
non-
defaulting
party
to
net
and
close-out
all
transactions,
if
any,
traded
under
such
agreements.
The
Fund
may
sell
securities
it
holds
as
collateral
and
apply
the
proceeds
towards
the
repurchase
price
and
any
other
amounts
owed
by
the
seller
to
the
Fund
in
the
event
of
default
by
the
seller.
This
could
involve
costs
or
delays
in
addition
to
a
loss
on
the
securities
if
their
value
falls
below
the
repurchase
price
owed
by
the
seller.
The
joint
repurchase
agreement
held
by
the Fund
at
year
end,
as
indicated
in
the
Schedule
of
Investments,
had
been
entered
into
on July
31,
2024.
c.
Securities
Purchased
on
a
When-Issued,
Forward
Commitment or
Delayed
Delivery
Basis
The
Fund
may
purchase
securities
on
a when-issued,
forward
commitment
or
delayed
delivery basis,
with
payment
and
delivery
scheduled
for
a
future
date.
These
transactions
are
subject
to
market
fluctuations
and
are
subject
to
the
risk
that
the
value
at
delivery
may
be
more
or
less
than
the
trade
date
purchase
price.
Although
the
Fund
will
generally
purchase
these
securities
with
the
intention
of
holding
the
securities, it
may
sell
the
securities
before
the
settlement
date.
d.
Securities
Lending
The
Fund
participates
in
an
agency
based
securities
lending
program
to
earn
additional
income.
The
Fund
receives
collateral
in
the
form
of
cash
and/or
U.S.
Government
and
Agency
securities
against
the
loaned
securities
in
an
amount
equal
to
at
least
102%
of
the
fair
value
of
the
loaned
securities.
Collateral
is
maintained
over
the
life
of
the
loan
in
an
amount
not
less
than
100%
of
the
fair
value
of
loaned
securities,
as
determined
at
the
close
of
Fund
business
each
day;
any
additional
collateral
required
due
to
changes
in
security
values
is
delivered
to
the
Fund
on
the
next
business
day.
Any
cash
collateral
received
is
deposited
into
a
joint
cash
account
with
other
funds
and
is
used
to
invest
in
a
money
market
fund
managed
by
Franklin
Advisers,
Inc.,
an
affiliate
of
the
Fund. The
Fund
may
receive
income
from
the
investment
of
cash
collateral,
in
addition
to
lending
fees paid
by
the
borrower.
Income
from
securities
loaned,
net
of
fees
paid
to
the
securities
lending
agent
and/or
third-party
vendor,
is
reported
separately
in
the Statement of
Operations.
The
Fund
bears
the
market
risk
with
respect
to
any
cash
collateral
investment,
securities
loaned,
and
the
risk
that
the
agent
may
default
on
its
obligations
to
the
Fund.
If
the
borrower
defaults
on
its
obligation
to
return
the
securities
loaned,
the
Fund
has
the
right
to
repurchase
the
securities
in
the
open
market
using
the
collateral
received.
The
securities
lending
agent
has
agreed
to
indemnify
the
Fund
in
the
event
of
default
by
a
third
party
borrower.
At
July
31,
2024,
the
Fund
had
no
securities
on
loan.
e.
Senior
Floating
Rate
Interests
The
Fund
invests
in
senior
secured
corporate
loans
that
pay
interest
at
rates
which
are
periodically
reset
by
reference
to
a
base
lending
rate
plus
a
spread.
These
base
lending
rates
are
generally
the
prime
rate
offered
by
a
designated
U.S.
bank
or
the
Secured
Overnight
Financing
Rate
(SOFR).
Senior
secured
corporate
loans
often
require
prepayment
of
principal
from
excess
cash
flows
or
at
the
discretion
of
the
borrower.
As
a
result,
actual
maturity
may
be
substantially
less
than
the
stated
maturity.
Senior
secured
corporate
loans
in
which
the Fund
invests
are
generally
readily
marketable,
but
may
be
subject
to
certain
restrictions
on
resale.
f.
Income
Taxes
The
Fund
is
a
disregarded
entity
for
U.S.
income
tax
purposes.
As
such,
no
provision
has
been
made
for
income
taxes
because
all
income,
expenses,
gains
and
losses
are
allocated
to
a
non-U.S.
beneficial
owner
for
inclusion
in
its
individual
income
tax
return,
as
applicable.
g.
Security
Transactions,
Investment
Income,
Expenses
and
Distributions
Security
transactions
are
accounted
for
on
trade
date.
Realized
gains
and
losses
on
security
transactions
are
determined
on
a
specific
identification
basis.
Interest
income
1.
Organization
and
Significant
Accounting
Policies
(continued)
b.
Joint
Repurchase
Agreement
(continued)
Franklin
Floating
Rate
Master
Trust
Notes
to
Financial
Statements
Franklin
Floating
Rate
Master
Series
(continued)
(including
interest
income
from
payment-in-kind
securities,
if
any)
and
estimated
expenses
are
accrued
daily.
Amortization
of
premium
and
accretion
of
discount
on
debt
securities
are
included
in
interest
income.
Paydown
gains
and
losses
are
recorded
as
an
adjustment
to
interest
income
in
the
Statement
of
Operations.
The
Fund
may
receive
other
income
from
investments
in
senior
secured
corporate
loans
or
unfunded
commitments,
including
amendment
fees,
consent
fees
or
commitment
fees.
These
fees
are
recorded
as
income
when
received
by
the
Fund.
Facility
fees
are
recognized
as
income
over
the
expected
term
of
the
loan.
Dividend
income
is
recorded
on
the
ex-dividend
date
except
for
certain
dividends
from
securities
where
the
dividend
rate
is
not available.
In
such
cases,
the
dividend
is
recorded
as
soon
as
the
information
is
received
by
the
Fund.
The
Fund's
gross
investment
income
is
distributed
to
the
owner
daily
and
paid
monthly.
Net
capital
gains
(or
losses) realized
by
the
Fund
will
not
be
distributed.
Distributable
earnings
are
determined
according
to
income
tax
regulations
(tax
basis)
and
may
differ
from
earnings
recorded
in
accordance
with
U.S.
GAAP.
These
differences
may
be
permanent
or
temporary.
Permanent
differences
are
reclassified
among
capital
accounts
to
reflect
their
tax
character.
These
reclassifications
have
no
impact
on
net
assets
or
the
results
of
operations.
Temporary
differences
are
not
reclassified,
as
they
may
reverse
in
subsequent
periods.
h.
Accounting
Estimates
The
preparation
of
financial
statements
in
accordance
with
U.S.
GAAP
requires
management
to
make
estimates
and
assumptions
that
affect
the
reported
amounts
of
assets
and
liabilities
at
the
date
of
the
financial
statements
and
the
amounts
of
income
and
expenses
during
the
reporting
period.
Actual
results
could
differ
from
those
estimates.
i.
Guarantees
and
Indemnifications
Under
the Trust's
organizational
documents,
its
officers
and trustees
are
indemnified
by
the Trust against
certain
liabilities
arising
out
of
the
performance
of
their
duties
to
the
Trust.
Additionally,
in
the
normal
course
of
business,
the Trust,
on
behalf
of
the
Fund, enters
into
contracts
with
service
providers
that
contain
general
indemnification
clauses.
The Trust's
maximum
exposure
under
these
arrangements
is
unknown
as
this
would
involve
future
claims
that
may
be
made
against
the Trust
that
have
not
yet
occurred.
Currently,
the Trust
expects
the
risk
of
loss
to
be
remote.
2.
Shares
of
Beneficial
Interest
At
July
31,
2024,
there
were
an
unlimited
number
of
shares
authorized
(without
par
value).
Transactions
in
the
Fund's
shares
were
as
follows:
Year
Ended
July
31,
2024
Year
Ended
July
31,
2023
Shares
Amount
Shares
Amount
Shares
sold
...................................
52,856,297
$380,607,512
4,408,454
$30,884,222
Shares
redeemed
...............................
(35,328,448)
(254,427,272)
(37,870,071)
(264,014,430)
Net
increase
(decrease)
..........................
17,527,849
$126,180,240
(33,461,617)
$(233,130,208)
1.
Organization
and
Significant
Accounting
Policies
(continued)
g.
Security
Transactions,
Investment
Income,
Expenses
and
Distributions
(continued)
Franklin
Floating
Rate
Master
Trust
Notes
to
Financial
Statements
Franklin
Floating
Rate
Master
Series
(continued)
3.
Transactions
with
Affiliates
Franklin
Resources,
Inc.
is
the
holding
company
for
various
subsidiaries
that
together
are
referred
to
as
Franklin
Templeton.
Certain
officers
and
trustees
of
the Trust are
also
officers
and/or
directors
of
the
following
subsidiaries:
a.
Management
Fees
The
Fund
pays
an
investment
management fee,
calculated daily and
paid
monthly,
to
Advisers based
on the
average
daily net
assets
of
the
Fund
as
follows:
For
the
year
ended
July
31,
2024,
the
gross
effective
investment
management
fee
rate
was 0.530%
of
the
Fund’s
average daily
net
assets.
b.
Administrative
Fees
Under
an
agreement
with
Advisers,
FT
Services
provides
administrative
services
to
the
Fund.
The
fee
is
paid
by
Advisers
based
on
the
Fund's
average
daily
net
assets,
and
is
not
an
additional
expense
of
the
Fund.
c.
Transfer
Agent
Fees
Investor
Services,
under
terms
of
an
agreement,
performs
shareholder
servicing
for
the
Fund and
is
not
paid
by
the Fund
for
the
services.
d.
Investments
in
Affiliated
Management
Investment
Companies
The
Fund
invests
in
one
or
more
affiliated
management
investment
companies.
As
defined
in
the
1940
Act,
an
investment
is
deemed
to
be
a
“Controlled
Affiliate”
of
a
fund
when
a
fund
owns,
either
directly
or
indirectly,
25%
or
more
of
the
affiliated
fund’s
outstanding
shares
or
has
the
power
to
exercise
control
over
management
or
policies
of
such
fund.
The
Fund
does
not
invest
for
purposes
of
exercising
a
controlling
influence
over
the
management
or
policies.
Management
fees
paid
by
the
Fund
are
waived
on
assets
invested
in
the
affiliated
management
investment
companies,
as
noted
in
the
Statement
of
Operations,
in
an
amount
not
to
exceed
the
management
and
administrative
fees
paid
directly
or
indirectly
by
each
affiliate.
During
the
year
ended
July
31,
2024,
the
Fund
held
investments
in
affiliated
management
investment
companies
as
follows:
Subsidiary
Affiliation
Franklin
Advisers,
Inc.
(Advisers)
Investment
manager
Franklin
Templeton
Services,
LLC
(FT
Services)
Administrative
manager
Franklin
Templeton
Investor
Services,
LLC
(Investor
Services)
Transfer
agent
Annualized
Fee
Rate
Net
Assets
0.530%
Up
to
and
including
$2.5
billion
0.450%
Over
$2.5
billion,
up
to
and
including
$6.5
billion
0.430%
Over
$6.5
billion,
up
to
and
including
$11.5
billion
0.400%
Over
$11.5
billion,
up
to
and
including
$16.5
billion
0.390%
Over
$16.5
billion,
up
to
and
including
$19
billion
0.380%
Over
$19
billion,
up
to
and
including
$21.5
billion
0.370%
In
excess
of
$21.5
billion
Franklin
Floating
Rate
Master
Trust
Notes
to
Financial
Statements
Franklin
Floating
Rate
Master
Series
(continued)
e.
Waiver
and
Expense
Reimbursements
Advisers
has voluntarily
agreed
in
advance
to
waive
or
limit
its fees
and
to
assume
as
its
own
expense
certain
expenses
otherwise
payable
by
the
Fund
so
that
the expenses
(excluding
interest
expense,
acquired
fund
fees
and
expenses
and
certain
non-routine
expenses
or
costs,
including
those
relating
to
litigation,
indemnification,
reorganizations,
and
liquidations)
of
the
Fund
do
not
exceed 0.53%
based
on
the
average
net
assets
of
the
Fund.
Total
expenses
waived
or
paid
are
not
subject
to
recapture
subsequent
to
the
Fund's
fiscal
year
end.
Advisers
may
discontinue
this
waiver
at
any
time
upon
notice
to
the
Board.
f.
Other
Affiliated
Transactions
At
July
31,
2024, Franklin
Floating
Rate
Fund,
PLC
owned
100%
of
the
Fund's
outstanding
shares.
Investment
activities
of
this
shareholder
could
have
a
material
impact
on
the
Fund.
4.
Income
Taxes
At
July
31,
2024,
the
cost
of
investments
and
net
unrealized
appreciation
(depreciation) for
income
tax
purposes
were
as
follows:
Differences
between
income
and/or
capital
gains
as
determined
on
a
book
basis
and
a
tax
basis
are
primarily
due
to
differing
treatments
of
wash
sales.
aa
Value
at
Beginning
of
Year
Purchases
Sales
Realized
Gain
(Loss)
Net
Change
in
Unrealized
Appreciation
(Depreciation)
Value
at
End
of
Year
Number
of
Shares
Held
at
End
of
Year
Investment
Income
a
a
a
a
a
a
a
a
Franklin
Floating
Rate
Master
Series
Non-Controlled
Affiliates
Dividends
Franklin
Senior
Loan
ETF
....
$6,781,724
$—
$—
$—
$84,350
$6,866,074
281,166
$657,019
a
Non-Controlled
Affiliates
Income
from
securities
loaned
Institutional
Fiduciary
Trust
-
Money
Market
Portfolio,
5.002%
$—
$5,698,000
$(5,698,000)
$—
$—
$—
—
$6,982
Total
Affiliated
Securities
...
$6,781,724
$5,698,000
$(5,698,000)
$—
$84,350
$6,866,074
$664,001
a
Dividend
income
includes
capital
gain
distributions
received,
if
any,
from
underlying
funds,
and
are
presented
in
corresponding
line
item
in
the
Statement
of
Operations.
Cost
of
investments
..........................................................................
$559,309,415
Unrealized
appreciation
........................................................................
$4,076,526
Unrealized
depreciation
........................................................................
(19,832,780)
Net
unrealized
appreciation
(depreciation)
..........................................................
$(15,756,254)
3.
Transactions
with
Affiliates
(continued)
d.
Investments
in
Affiliated
Management
Investment
Companies
(continued)
Franklin
Floating
Rate
Master
Trust
Notes
to
Financial
Statements
Franklin
Floating
Rate
Master
Series
(continued)
5.
Investment
Transactions
Purchases
and
sales
of
investments (excluding
short
term
securities) for
the
year
ended
July
31,
2024,
aggregated
$411,824,096 and
$202,205,982,
respectively.
6.
Credit
Risk
At
July
31,
2024,
the
Fund
had 81.2% of
its
portfolio
invested
in
high
yield
securities,
senior
secured
floating
rate
loans,
or
other
securities
rated
below
investment
grade
and
unrated
securities.
These
securities
may
be
more
sensitive
to
economic
conditions
causing
greater
price
volatility
and
are
potentially
subject
to
a
greater
risk
of
loss
due
to
default
than
higher
rated
securities.
7.
Unfunded
Loan
Commitments
The
Fund
enters
into
certain
credit
agreements,
all
or
a
portion
of
which
may
be
unfunded.
The Fund
is
obligated
to
fund
these
loan
commitments
at
the
borrowers’
discretion.
Unfunded
loan
commitments
and
funded
portions
of
credit
agreements
are
marked
to
market
daily
and
any
unrealized
appreciation
or
depreciation
is
included
in
the
Statement
of
Assets
and
Liabilities
and
the
Statement
of
Operations.
Funded
portions
of
credit
agreements
are
presented
in
the
Schedule
of
Investments.
At
July
31,
2024,
unfunded
commitments
were
as
follows:
8.
Holdings
of
5%
Voting
Securities
of
Portfolio
Companies
The
1940
Act
defines
"affiliated
companies"
to
include
investments
in
portfolio
companies
in
which
a
fund
owns
5%
or
more
of
the
outstanding
voting
securities.
Additionally,
as
defined
in
the
1940
Act,
an
investment
is
deemed
to
be
a
“Controlled
Affiliate”
of
a
fund
when
a
fund
owns,
either
directly
or
indirectly,
25%
or
more
of
the
affiliated
companies’
outstanding
shares
or
has
the
power
to
exercise
control
over
management
or
policies
of
such
company.
During
the
year
ended
July
31,
2024,
investments
in
“affiliated
companies”
were
as
follows:
Borrower
Unfunded
Commitment
Franklin
Floating
Rate
Master
Series
ABG
Intermediate
Holdings
2
LLC
$
375,728
Chrysaor
Bidco
SARL
35,196
Epicor
Software
Corp.
379,384
$
790,308
Value
at
Beginning
of
Year
Purchases
Sales
Realized
Gain
(Loss)
Net
Change
in
Unrealized
Appreciation
(Depreciation)
Value
at
End
of
Year
Number
of
Shares
Held
at
End
of
Year
Investment
Income
Franklin
Floating
Rate
Master
Series
Non-Controlled
Affiliates
Dividends
Onsite
Rental
Group
Operations
Pty.
Ltd.,
Escrow
Account
....
$
597,306
$
—
$
(781,839)
a
$
178,130
$
6,403
$
—
b
—
$
—
Quarternorth
Energy
Holding,
Inc.
......
12,812,668
—
(19,606,933)
a
8,966,047
(2,171,782)
—
b
—
—
Total
Affiliated
Securities
(Value
is
—%
of
Net
Assets)
..........
$13,409,974
$—
$(20,388,772)
$9,144,177
$(2,165,379)
$—
$—
a
May
include
accretion,
amortization,
and/or
other
cost
basis
adjustments.
b
As
of
July
31,
2024,
no
longer
held
by
the
fund.
Franklin
Floating
Rate
Master
Trust
Notes
to
Financial
Statements
Franklin
Floating
Rate
Master
Series
(continued)
9.
Shareholder
Distributions
For
the year
ended
July
31,
2024,
the
Fund
made
the
following
distributions:
10.
Credit
Facility
The
Fund,
together
with
other
U.S.
registered
and
foreign
investment
funds
(collectively,
Borrowers),
managed
by
Franklin
Templeton,
are
borrowers
in
a
joint
syndicated
senior
unsecured
credit
facility
totaling
$2.675
billion
(Global
Credit
Facility)
which
matures
on
January
31,
2025.
This
Global
Credit
Facility
provides
a
source
of
funds
to
the
Borrowers
for
temporary
and
emergency
purposes,
including
the
ability
to
meet
future
unanticipated
or
unusually
large
redemption
requests.
Under
the
terms
of
the
Global
Credit
Facility,
the
Fund
shall,
in
addition
to
interest
charged
on
any
borrowings
made
by
the
Fund
and
other
costs
incurred
by
the
Fund,
pay
its
share
of
fees
and
expenses
incurred
in
connection
with
the
implementation
and
maintenance
of
the
Global
Credit
Facility,
based
upon
its
relative
share
of
the
aggregate
net
assets
of
all
of
the
Borrowers,
including
an
annual
commitment
fee
of
0.15%
based
upon
the
unused
portion
of
the
Global
Credit
Facility.
These
fees
are
reflected
in
other
expenses
in
the
Statement
of
Operations.
During
the
year
ended
July
31,
2024,
the Fund
did
not
use
the
Global
Credit
Facility.
11.
Fair
Value
Measurements
The
Fund
follows
a
fair
value
hierarchy
that
distinguishes
between
market
data
obtained
from
independent
sources
(observable
inputs)
and
the Fund's
own
market
assumptions
(unobservable
inputs).
These
inputs
are
used
in
determining
the
value
of
the
Fund's financial
instruments
and
are
summarized
in
the
following
fair
value
hierarchy:
Level
1
–
quoted
prices
in
active
markets
for
identical
financial
instruments
Level
2
–
other
significant
observable
inputs
(including
quoted
prices
for
similar
financial
instruments,
interest
rates,
prepayment
speed,
credit
risk,
etc.)
Level
3
–
significant
unobservable
inputs
(including
the
Fund's
own
assumptions
in
determining
the
fair
value
of
financial
instruments)
Payment
Date
Amount
Per
Share
8/31/2023
$0.059236
9/29/2023
0.056777
10/31/2023
0.055531
11/30/2023
0.056134
12/29/2023
0.065429
1/31/2024
0.055809
2/29/2024
0.056487
3/28/2024
0.060600
4/30/2024
0.059881
5/31/2024
0.058984
6/28/2024
0.055065
7/31/2024
0.055546
Total
$0.695479
Franklin
Floating
Rate
Master
Trust
Notes
to
Financial
Statements
Franklin
Floating
Rate
Master
Series
(continued)
The
input
levels
are
not
necessarily
an
indication
of
the
risk
or
liquidity
associated
with
financial
instruments
at
that
level.
A
summary
of
inputs
used
as
of
July
31,
2024,
in
valuing
the
Fund's assets carried
at
fair
value,
is
as
follows:
A
reconciliation
in
which
Level
3
inputs
are
used
in
determining
fair
value
is
presented
when
there
are
significant
Level
3
assets
and/or
liabilities
at
the
beginning
and/or
end
of
the year.
12.
Subsequent
Events
The
Fund
has
evaluated
subsequent
events
through
the
issuance
of
the
financial
statements
and
determined
that
no
events
have
occurred
that
require
disclosure.
Abbreviations
Level
1
Level
2
Level
3
Total
Franklin
Floating
Rate
Master
Series
Assets:
Investments
in
Securities:
Common
Stocks
:
Industrial
Machinery
&
Supplies
&
Components
$
—
$
5,136,509
$
—
$
5,136,509
Leisure
Facilities
.......................
—
19,346
—
19,346
Oil
&
Gas
Exploration
&
Production
.........
2,524,099
—
—
2,524,099
Management
Investment
Companies
.........
12,938,980
—
—
12,938,980
Preferred
Stocks
........................
—
21,553
—
21,553
Warrants
..............................
—
—
30
30
Corporate
Bonds
........................
—
27,195,538
—
27,195,538
Senior
Floating
Rate
Interests
...............
—
430,528,169
—
430,528,169
Escrows
and
Litigation
Trusts
...............
—
—
—
a
—
Short
Term
Investments
...................
—
65,188,937
—
65,188,937
Total
Investments
in
Securities
...........
$15,463,079
$528,090,052
$30
$543,553,161
Other
Financial
Instruments:
Unfunded
Loan
Commitments
...............
$
—
$
5,066
$
—
$
5,066
Total
Other
Financial
Instruments
.........
$—
$5,066
$—
$5,066
a
Includes
financial
instruments
determined
to
have
no
value.
Cu
r
rency
USD
United
States
Dollar
Selected
Portfolio
CME
Chicago
Mercantile
Exchange
ETF
Exchange-Traded
Fund
PIK
Payment-In-Kind
SOFR
Secured
Overnight
Financing
Rate
11.
Fair
Value
Measurements
(continued)
Franklin
Floating
Rate
Master
Trust
Report
of
Independent
Registered
Public
Accounting
Firm
To
the
Board
of
Trustees
of
Franklin
Floating
Rate
Master
Trust
and
Shareholders
of
Franklin
Floating
Rate
Master
Series
Opinion
on
the
Financial
Statements
We
have
audited
the
accompanying
statement
of
assets
and
liabilities,
including
the
schedule
of
investments,
of
Franklin
Floating
Rate
Master
Series
(the
“Fund”)
as
of
July
31,
2024,
the
related
statement
of
operations
for
the
year
ended
July
31,
2024,
the
statements
of
changes
in
net
assets
for
each
of
the
two
years
in
the
period
ended
July
31,
2024,
including
the
related
notes,
and
the
financial
highlights
for
each
of
the
five
years
in
the
period
ended
July
31,
2024
(collectively
referred
to
as
the
“financial
statements”).
In
our
opinion,
the
financial
statements
present
fairly,
in
all
material
respects,
the
financial
position
of
the
Fund
as
of
July
31,
2024,
the
results
of
its
operations
for
the
year
then
ended,
the
changes
in
its
net
assets
for
each
of
the
two
years
in
the
period
ended
July
31,
2024
and
the
financial
highlights
for
each
of
the
five
years
in
the
period
ended
July
31,
2024
in
conformity
with
accounting
principles
generally
accepted
in
the
United
States
of
America.
Basis
for
Opinion
These
financial
statements
are
the
responsibility
of
the
Fund’s
management.
Our
responsibility
is
to
express
an
opinion
on
the
Fund’s
financial
statements
based
on
our
audits.
We
are
a
public
accounting
firm
registered
with
the
Public
Company
Accounting
Oversight
Board
(United
States)
(PCAOB)
and
are
required
to
be
independent
with
respect
to
the
Fund
in
accordance
with
the
U.S.
federal
securities
laws
and
the
applicable
rules
and
regulations
of
the
Securities
and
Exchange
Commission
and
the
PCAOB.
We
conducted
our
audits
of
these
financial
statements
in
accordance
with
the
standards
of
the
PCAOB.
Those
standards
require
that
we
plan
and
perform
the
audit
to
obtain
reasonable
assurance
about
whether
the
financial
statements
are
free
of
material
misstatement,
whether
due
to
error
or
fraud.
Our
audits
included
performing
procedures
to
assess
the
risks
of
material
misstatement
of
the
financial
statements,
whether
due
to
error
or
fraud,
and
performing
procedures
that
respond
to
those
risks.
Such
procedures
included
examining,
on
a
test
basis,
evidence
regarding
the
amounts
and
disclosures
in
the
financial
statements.
Our
audits
also
included
evaluating
the
accounting
principles
used
and
significant
estimates
made
by
management,
as
well
as
evaluating
the
overall
presentation
of
the
financial
statements.
Our
procedures
included
confirmation
of
securities
owned
as
of
July
31,
2024
by
correspondence
with
the
custodians,
broker
and
agent
banks;
when
replies
were
not
received
from
agent
banks,
we
performed
other
auditing
procedures.
We
believe
that
our
audits
provide
a
reasonable
basis
for
our
opinion.
/s/PricewaterhouseCoopers
LLP
San
Francisco,
California
September
19,
2024
We
have
served
as
the
auditor
of
one
or
more
investment
companies
in
the
Franklin
Templeton
Group
of
Funds
since
1948.
Franklin
Floating
Rate
Master
Trust
FRANKLIN
FLOATING
RATE
MASTER
TRUST
Franklin
Floating
Rate
Master
Series
(Fund)
At
an
in-person
meeting
held
on
May
22,
2024
(Meeting),
the
Board
of
Trustees
(Board)
of
Franklin
Floating
Rate
Master
Trust
(Trust),
including
a
majority
of
the
trustees
who
are
not
“interested
persons”
as
defined
in
the
Investment
Company
Act
of
1940
(Independent
Trustees),
reviewed
and
approved
the
continuance
of
the
investment
management
agreement
between
Franklin
Advisers,
Inc.
(Manager)
and
the
Trust,
on
behalf
of
the
Fund
(Management
Agreement)
for
an
additional
one-year
period.
The
Independent
Trustees
received
advice
from
and
met
separately
with
Independent
Trustee
counsel
in
considering
whether
to
approve
the
continuation
of
the
Management
Agreement.
In
considering
the
continuation
of
the
Management
Agreement,
the
Board
reviewed
and
considered
information
provided
by
the
Manager
at
the
Meeting
and
throughout
the
year
at
meetings
of
the
Board
and
its
committees.
The
Board
also
reviewed
and
considered
information
provided
in
response
to
a
detailed
set
of
requests
for
information
submitted
to
the
Manager
by
Independent
Trustee
counsel
on
behalf
of
the
Independent
Trustees
in
connection
with
the
annual
contract
renewal
process.
In
addition,
prior
to
the
Meeting,
the
Independent
Trustees
held
a
virtual
contract
renewal
meeting
at
which
the
Independent
Trustees
first
conferred
amongst
themselves
and
Independent
Trustee
counsel
about
contract
renewal
matters,
and
then
met
with
management
to
request
additional
information
that
the
Independent
Trustees
reviewed
and
considered
prior
to
and
at
the
Meeting.
The
Board
reviewed
and
considered
all
of
the
factors
it
deemed
relevant
in
approving
the
continuance
of
the
Management
Agreement,
including,
but
not
limited
to:
(i)
the
nature,
extent
and
quality
of
the
services
provided
by
the
Manager;
(ii)
the
investment
performance
of
the
Fund;
(iii)
the
costs
of
the
services
provided
and
profits
realized
by
the
Manager
and
its
affiliates
from
the
relationship
with
the
Fund;
(iv)
the
extent
to
which
economies
of
scale
are
realized
as
the
Fund
grows;
and
(v)
whether
fee
levels
reflect
these
economies
of
scale
for
the
benefit
of
Fund
investors.
In
approving
the
continuance
of
the
Management
Agreement,
the
Board,
including
a
majority
of
the
Independent
Trustees,
determined,
through
the
exercise
of
its
business
judgment,
that
the
terms
of
the
Management
Agreement
are
fair
and
reasonable
and
that
the
continuance
of
the
Management
Agreement
is
in
the
best
interests
of
the
Fund
and
its
shareholders.
Changes
In
and
Disagreements
with
Accountants
For
the
period
covered
by
this
report
Not
applicable.
Results
of
Meeting(s)
of
Shareholders
For
the
period
covered
by
this
report
Not
applicable.
Remuneration
Paid
to
Directors,
Officers
and
Others
For
the
period
covered
by
this
report
Refer
to
the
financial
statements
included
herein.
Board
Approval
of
Management
and
Subadvisory
Agreements
For
the
period
covered
by
this
report
Franklin
Floating
Rate
Master
Trust
While
attention
was
given
to
all
information
furnished,
the
following
discusses
some
primary
factors
relevant
to
the
Board’s
determination.
Nature,
Extent
and
Quality
of
Services
The
Board
reviewed
and
considered
information
regarding
the
nature,
extent
and
quality
of
investment
management
services
provided
by
the
Manager
and
its
affiliates
to
the
Fund
and
its
shareholders.
This
information
included,
among
other
things,
the
qualifications,
background
and
experience
of
the
senior
management
and
investment
personnel
of
the
Manager,
as
well
as
information
on
succession
planning
where
appropriate;
the
structure
of
investment
personnel
compensation;
oversight
of
third-
party
service
providers;
investment
performance
reports
and
related
financial
information
for
the
Fund;
reports
on
expenses
and
shareholder
services;
legal
and
compliance
matters;
risk
controls;
pricing
and
other
services
provided
by
the
Manager
and
its
affiliates;
and
management
fees
charged
by
the
Manager
and
its
affiliates
to
US
funds
and
other
accounts,
including
management’s
explanation
of
differences
among
accounts
where
relevant.
The
Board
acknowledged
the
ongoing
integration
of
the
Putnam
family
of
funds
into
the
Franklin
Templeton
(FT)
family
of
funds
and
management’s
continued
development
of
strategies
to
address
areas
of
heightened
concern
in
the
mutual
fund
industry,
including
various
regulatory
initiatives
and
continuing
geopolitical
concerns.
The
Board
also
reviewed
and
considered
the
benefits
provided
to
Fund
shareholders
of
investing
in
a
fund
that
is
part
of
the
FT
family
of
funds.
The
Board
noted
the
financial
position
of
Franklin
Resources,
Inc.
(FRI),
the
Manager’s
parent,
and
its
commitment
to
the
mutual
fund
business
as
evidenced
by
its
continued
reassessment
of
the
fund
offerings
in
response
to
FT
acquisitions
and
the
market
environment,
as
well
as
project
initiatives
and
capital
investments
relating
to
the
services
provided
to
the
Fund
by
the
FT
organization.
The
Board
specifically
noted
FT’s
commitment
to
technological
innovation
and
advancement,
including
its
initiative
to
create
a
new
enterprise-wide
artificial
intelligence
platform.
Following
consideration
of
such
information,
the
Board
was
satisfied
with
the
nature,
extent
and
quality
of
services
provided
by
the
Manager
and
its
affiliates
to
the
Fund
and
its
shareholders.
Fund
Performance
The
Board
reviewed
and
considered
the
performance
results
of
the
Fund
over
various
time
periods
ended
December
31,
2023.
The
Board
considered
the
performance
returns
for
the
Fund
in
comparison
to
the
performance
returns
of
mutual
funds
deemed
comparable
to
the
Fund
included
in
a
universe
(Performance
Universe)
selected
by
Broadridge
Financial
Solutions,
Inc.
(Broadridge),
an
independent
provider
of
investment
company
data.
The
Board
received
a
description
of
the
methodology
used
by
Broadridge
to
select
the
mutual
funds
included
in
a
Performance
Universe.
The
Board
also
reviewed
and
considered
Fund
performance
reports
provided
and
discussions
that
occurred
with
portfolio
managers
at
Board
meetings
throughout
the
year.
A
summary
of
the
Fund’s
performance
results
is
below.
The
Performance
Universe
for
the
Fund
included
the
Fund
and
all
retail
and
institutional
loan
participation
funds.
The
Board
noted
that
the
Fund’s
annualized
income
return
for
the
one-,
three-,
five-
and
10-year
periods
was
above
the
median
and
in
the
first
quintile
(best)
of
its
Performance
Universe.
The
Board
also
noted
that
the
Fund’s
annualized
total
return
for
the
one-
and
three-year
periods
was
above
the
median
of
its
Performance
Universe,
but
for
the
five-
and
10-year
periods
was
below
the
median
of
its
Performance
Universe.
The
Board
further
noted
management’s
view
regarding
the
income-related
attributes
of
the
Fund
(e.g.,
a
fund’s
investment
objective)
as
set
forth
in
the
Fund’s
registration
statement
and
that
the
evaluation
of
the
Fund’s
performance
relative
to
its
peers
on
an
income
return
basis
was
appropriate
given
these
attributes.
The
Board
noted
that
the
Fund
does
not
offer
its
shares
to
the
public
and
the
Fund’s
investor
was
exclusively
an
offshore
Irish
feeder
fund.
The
Board
concluded
that
the
Fund’s
performance
was
satisfactory.
Comparative
Fees
and
Expenses
The
Board
reviewed
and
considered
information
regarding
the
Fund’s
actual
total
expense
ratio
and
its
various
components,
including,
as
applicable,
management
fees;
transfer
agent
expenses;
underlying
fund
expenses;
Rule
12b-1
and
non-Rule
12b-1
service
fees;
and
other
non-management
fees.
The
Board
considered
the
actual
total
expense
ratio
and,
separately,
the
contractual
management
fee
rate,
without
the
effect
of
fee
waivers,
if
any
(Management
Rate)
of
the
Fund
in
comparison
Franklin
Floating
Rate
Master
Trust
to
the
median
expense
ratio
and
median
Management
Rate,
respectively,
of
other
mutual
funds
deemed
comparable
to
and
with
a
similar
expense
structure
to
the
Fund
selected
by
Broadridge
(Expense
Group).
Broadridge
fee
and
expense
data
is
based
upon
information
taken
from
each
fund’s
most
recent
annual
or
semi-annual
report,
which
reflects
historical
asset
levels
that
may
be
quite
different
from
those
currently
existing,
particularly
in
a
period
of
market
volatility.
While
recognizing
such
inherent
limitation
and
the
fact
that
expense
ratios
and
Management
Rates
generally
increase
as
assets
decline
and
decrease
as
assets
grow,
the
Board
believed
the
independent
analysis
conducted
by
Broadridge
to
be
an
appropriate
measure
of
comparative
fees
and
expenses.
The
Broadridge
Management
Rate
includes
administrative
charges,
and
the
actual
total
expense
ratio,
for
comparative
consistency,
was
shown
for
Class
A
shares
for
funds
in
the
Expense
Group.
The
Board
received
a
description
of
the
methodology
used
by
Broadridge
to
select
the
mutual
funds
included
in
an
Expense
Group.
The
Expense
Group
for
the
Fund
included
the
Fund
and
13
other
loan
participation
funds.
The
Board
noted
that
the
Management
Rate
and
actual
total
expense
ratio
for
the
Fund
were
below
the
medians
and
in
the
first
quintile
(least
expensive)
of
its
Expense
Group.
After
consideration
of
the
above,
the
Board
concluded
that
the
Management
Rate
charged
to
the
Fund
is
reasonable.
Profitability
The
Board
reviewed
and
considered
information
regarding
the
profits
realized
by
the
Manager
and
its
affiliates
in
connection
with
the
operation
of
the
Fund.
In
this
respect,
the
Board
considered
the
Fund
profitability
analysis
provided
by
the
Manager
that
addresses
the
overall
profitability
of
FT’s
US
fund
business,
as
well
as
its
profits
in
providing
investment
management
and
other
services
to
each
of
the
individual
funds
during
the
12-month
period
ended
September
30,
2023,
being
the
most
recent
fiscal
year-end
for
FRI.
The
Board
noted
that
although
management
continually
makes
refinements
to
its
methodologies
used
in
calculating
profitability
in
response
to
organizational
and
product-related
changes,
the
overall
methodology
has
remained
consistent
with
that
used
in
the
Fund’s
profitability
report
presentations
from
prior
years.
The
Board
also
noted
that
an
independent
registered
public
accounting
firm
has
been
engaged
by
the
Manager
to
periodically
review
and
assess
the
allocation
methodologies
to
be
used
solely
by
the
Fund’s
Board
with
respect
to
the
profitability
analysis.
The
Board
noted
management’s
belief
that
costs
incurred
in
establishing
the
infrastructure
necessary
for
the
type
of
mutual
fund
operations
conducted
by
the
Manager
and
its
affiliates
may
not
be
fully
reflected
in
the
expenses
allocated
to
the
Fund
in
determining
its
profitability,
as
well
as
the
fact
that
the
level
of
profits,
to
a
certain
extent,
reflected
operational
cost
savings
and
efficiencies
initiated
by
management.
As
part
of
this
evaluation,
the
Board
considered
management’s
outsourcing
of
certain
operations,
which
effort
has
required
considerable
up-front
expenditures
by
the
Manager
but,
over
the
long
run
is
expected
to
result
in
greater
efficiencies.
The
Board
also
noted
management’s
expenditures
in
improving
shareholder
services
provided
to
the
Fund,
as
well
as
the
need
to
implement
systems
and
meet
additional
regulatory
and
compliance
requirements
resulting
from
recent
US
Securities
and
Exchange
Commission
and
other
regulatory
requirements.
The
Board
also
considered
the
extent
to
which
the
Manager
and
its
affiliates
might
derive
ancillary
benefits
from
fund
operations,
including
revenues
generated
from
transfer
agent
services,
potential
benefits
resulting
from
personnel
and
systems
enhancements
necessitated
by
fund
growth,
as
well
as
increased
leverage
with
service
providers
and
counterparties.
Based
upon
its
consideration
of
all
these
factors,
the
Board
concluded
that
the
level
of
profits
realized
by
the
Manager
and
its
affiliates
from
providing
services
to
the
Fund
was
not
excessive
in
view
of
the
nature,
extent
and
quality
of
services
provided
to
the
Fund.
Economies
of
Scale
The
Board
reviewed
and
considered
the
extent
to
which
the
Manager
may
realize
economies
of
scale,
if
any,
as
the
Fund
grows
larger
and
whether
the
Fund’s
management
fee
structure
reflects
any
economies
of
scale
for
the
benefit
of
shareholders.
With
respect
to
possible
economies
of
scale,
the
Board
noted
the
existence
of
management
fee
breakpoints,
which
operate
generally
to
share
any
economies
of
scale
with
the
Fund’s
shareholders
by
reducing
the
Fund’s
effective
management
fees
as
the
Fund
grows
in
size.
The
Board
considered
the
Manager’s
view
that
any
analyses
of
potential
Franklin
Floating
Rate
Master
Trust
economies
of
scale
in
managing
a
particular
fund
are
inherently
limited
in
light
of
the
joint
and
common
costs
and
investments
the
Manager
incurs
across
the
FT
family
of
funds
as
a
whole.
The
Board
concluded
that
to
the
extent
economies
of
scale
may
be
realized
by
the
Manager
and
its
affiliates,
the
Fund’s
management
fee
structure
provided
a
sharing
of
benefits
with
the
Fund
and
its
shareholders
as
the
Fund
grows.
Conclusion
Based
on
its
review,
consideration
and
evaluation
of
all
factors
it
believed
relevant,
including
the
above-described
factors
and
conclusions,
the
Board
unanimously
approved
the
continuation
of
the
Management
Agreement
for
an
additional
one-year
period.
©
2024
Franklin
Templeton.
All
rights
reserved.
Item 8. Changes in and Disagreements with Accountants for Open-End Management Investment Companies.
The information is disclosed as part of the Financial Statements included in Item 7 of this Form N-CSR.
Item 9. Proxy Disclosures for Open-End Management Investment Companies.
The information is disclosed as part of the Financial Statements included in Item 7 of this Form N-CSR.
Item 10. Remuneration Paid to Directors, Officers, and Others of Open-End Management Investment Companies.
The information is disclosed as part of the Financial Statements included in Item 7 of this Form N-CSR.
Item 11. Statement Regarding Basis for Approval of Investment Advisory Contract.
The information is disclosed as part of the Financial Statements included in Item 7 of this Form N-CSR.
Item 12. Disclosure of Proxy Voting Policies and Procedures for Closed-End Management Investment Companies. N/A
Item 13. Portfolio Managers of Closed-End Management Investment Companies. N/A
Item 14. Purchases of Equity Securities by Closed-End Management Investment Company and Affiliated Purchasers. N/A
Item 15. Submission of Matters to a Vote of Security Holders.
There have been no changes to the procedures by which shareholders may recommend nominees to the Registrant’s Board of Trustees that would require disclosure herein.
Item 16. Controls and Procedures.
(a) Evaluation of Disclosure Controls and Procedures. The Registrant maintains disclosure controls and procedures that are designed to provide reasonable assurance that information required to be disclosed in the Registrant’s filings under the Securities Exchange Act of 1934, as amended, and the Investment Company Act of 1940 is recorded, processed, summarized and reported within the periods specified in the rules and forms of the Securities and Exchange Commission. Such information is accumulated and communicated to the Registrant’s management, including its principal executive officer and principal financial officer, as appropriate, to allow timely decisions regarding required disclosure. The Registrant’s management, including the principal executive officer and the principal financial officer, recognizes that any set of controls and procedures, no matter how well designed and operated, can provide only reasonable assurance of achieving the desired control objectives.
Within 90 days prior to the filing date of this Shareholder Report on Form N-CSR, the Registrant had carried out an evaluation, under the supervision and with the participation of the Registrant’s management, including the Registrant’s principal executive officer and the Registrant’s principal financial officer, of the effectiveness of the design and operation of the Registrant’s disclosure controls and procedures. Based on such evaluation, the Registrant’s principal executive officer and principal financial officer concluded that the Registrant’s disclosure controls and procedures are effective.
(b) Changes in Internal Controls. There have been no changes in the Registrant’s internal control over financial reporting that occurred during the period covered by this report that has materially affected or is reasonably likely to materially affect the internal control over financial reporting.
Item 17. Disclosure of Securities Lending Activities for Closed-End Management Investment Company. N/A
Item 18. Recovery of Erroneously Awarded Compensation.
(a) N/A
(b) N/A
Item 19. Exhibits.
(a)(1) Code of Ethics
(a)(2) Certifications pursuant to Section 302 of the Sarbanes-Oxley Act of 2002 of Christopher Kings, Chief Executive Officer - Finance and Administration, and Jeffrey White, Chief Financial Officer, Chief Accounting Officer and Treasurer
(b) Certifications pursuant to Section 906 of the Sarbanes-Oxley Act of 2002 of Christopher Kings, Chief Executive Officer - Finance and Administration, and Jeffrey White, Chief Financial Officer, Chief Accounting Officer and Treasurer
SIGNATURES
Pursuant to the requirements of the Securities Exchange Act of 1934 and the Investment Company Act of 1940, the registrant has duly caused this report to be signed on its behalf by the undersigned, thereunto duly authorized.
FRANKLIN FLOATING RATE MASTER TRUST
| By | /s/ CHRISTOPHER KINGS | |
| | Christopher Kings | |
| | Chief Executive Officer - Finance and Administration | |
| | | |
| Date | September 27, 2024 | |
Pursuant to the requirements of the Securities Exchange Act of 1934 and the Investment Company Act of 1940, this report has been signed below by the following persons on behalf of the registrant and in the capacities and on the dates indicated.
| By | /s/ CHRISTOPHER KINGS | |
| | Christopher Kings | |
| | Chief Executive Officer - Finance and Administration | |
| | | |
| Date | September 27, 2024 | |
| By | /s/ JEFFREY WHITE | |
| | Jeffrey White | |
| | Chief Financial Officer, Chief Accounting Officer and Treasurer | |
| | | |
| Date | September 27, 2024 | |