EXHIBIT 99.33
![]()
Alliance Capital
Strength Through Diversification:
Assets Managed, Markets Served
John D. Carifa
President and Chief Operating Officer
November 20, 2002
Introduction
Forward-Looking Statements
Certain statements provided by Alliance Capital Management L.P. (“Alliance Capital”) and Alliance Capital Management Holding L.P. (“Alliance Holding”) in this report are “forward-looking statements” within the meaning of the Private Securities Litigation Reform Act of 1995. Such forward-looking statements are subject to risks, uncertainties and other factors which could cause actual results to differ materially from future results expressed or implied by such forward-looking statements. The most significant of such factors include, but are not limited to, the following: the performance of financial markets, the investment performance of Alliance Capital’s sponsored investment products and separately managed accounts, general economic conditions, future acquisitions, competitive conditions, and government regulations, including changes in tax rates. Alliance Capital and Alliance Holding caution readers to carefully consider such factors. Further, such forward-looking statements speak only as of the date on which such statements are made; Alliance Capital and Alliance Holding undertake no obligation to update any forward-looking statements to reflect events or circumstances after the date of such statements.
2
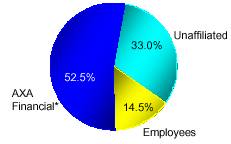
About Alliance Capital – Ownership Structure
Unit Ownership |
| Alliance Capital |
|
|
|
|
|
|
|
| |
| If all unexercised options are included, Alliance employee ownership is 20%. | |
|
|
|
|
| * AXA Financial ownership includes General Partnership interests. Employee ownership percentage includes restricted unit awards. |

3
About Alliance Capital – Investment Considerations
Alliance Capital (The Operating Partnership) |
|
|
|
|
|
• Assets Under Management: |
|
|
| $369 billion |
|
• Value (1): |
|
|
| $7.8 billion |
|
|
|
|
|
|
|
Alliance Holding (The Publicly Traded Partnership) |
|
|
|
|
|
• NYSE |
|
|
| Ticker: AC |
|
• AC: Market Capitalization (public) |
|
|
| $2.3 billion |
|
• Current Price: |
|
|
| $30.70 |
|
• Trailing Twelve Month Yield |
|
|
| 7.5 | % |
• 10 year DPU (2) Growth Rate |
|
|
| 13.9 | % |
• 5 year DPU (2) Growth Rate |
|
|
| 12.3 | % |
(1) Value of operating partnership is based upon price of Alliance Holding units as of 11/8/02 and total outstanding Alliance Capital units as of 9/30/02.
(2) Distributions per Unit.
Current price, value, market capitalization, and yield as of 11/8/02. AUM as of 9/30/02.
4
Strength Through Diversification – Brief History of Alliance Capital
1962 Investment management department of Donaldson, Lufkin & Jenrette (DLJ) is founded to specialize in management of pension fund assets.
1971 DLJ’s investment management department is merged with Moody’s Investors Services investment advisory business to form Alliance Capital Management Corporation.
1985 Alliance Capital and DLJ are acquired by the Equitable Life Assurance Society of the United States.
1988 Alliance Capital “goes public” as a master limited partnership and is listed on the New York Stock Exchange.
1992 Equitable is acquired by AXA and subsequently renamed AXA Financial (1999).*
2000 Alliance Capital acquires Sanford C. Bernstein & Co. Inc., a premier global value franchise. Provides entry into the private client and institutional research business, and scale and product breadth for international expansion.
*Equitable Companies Incorporated, an indirect parent of The Equitable Life Assurance Society of the United States, changed its name to AXA Financial, Inc. in September 1999
5
Strength Through Diversification
• Globally Positioned in Key Markets
• Balanced Product Mix
• Strong Distribution Channels
• Highly Valued Independent Research Organization
• Solid Financial Position
6
Our Mission
To be the premier
global research and investment management organization
through superior performance
across a broad range of investment disciplines
for a diverse group of clients
7
Globally Positioned in Key Markets

| Investment Management |
| Marketing and/or Client/Shareholder Servicing |
| Joint Venture Relationships |
| Private Client |
As of September 30, 2002
8
Resourced to Provide Superior Performance
|
| Equity |
| Fixed |
| Other |
| Total |
|
Buy-Side Analysts |
| 161 |
| 64 |
| – |
| 225 |
|
Sell-Side Analysts |
| 102 |
| – |
| – |
| 102 |
|
Portfolio Managers |
| 141 |
| 65 |
| 1 |
| 207 |
|
Traders |
|
|
|
|
|
|
|
|
|
Buy-Side |
| 28 |
| 8 |
| – |
| 36 |
|
Floor |
| 25 |
| – |
| – |
| 25 |
|
Corporate Finance/Other |
| – |
| – |
| 11 |
| 11 |
|
TOTAL |
| 457 |
| 137 |
| 12 |
| 606 |
|
As of September 30, 2002
Includes investment professionals and analysts from joint venture affiliates and non-key investment locations.
9
Balanced Product Mix – AUM by Investment and Client Orientation
$369 Billion
at Sept. 30, 2002
Investment Orientation* |
| Client Orientation |
|
|
|
|
|
|

| U.S. |
|
| Global & International |
Amounts in $ billions.
Equity includes balanced portfolios AUM.
10
A Strong Global Presence – AUM by Client Location (1)
$369 Billion
at Sept. 30, 2002
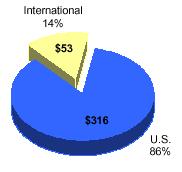
(1) Assets are categorized by country domicile of client accounts.
Amounts in $ billions.
11
Broad Range of Investment Disciplines

12
Diverse Group of Clients
As of September 30, 2002.
13
Continued Challenging Market Environment
In Third Quarter, Growth Begins to Outperform Value
|
| – – – – – Cumulative – – – – – |
| Annualized |
| ||||||||||
|
|
|
|
|
|
|
|
|
|
|
|
|
|
|
|
|
| 3Q02 |
| YTD |
| 1 Yr |
| 3 Yr |
| 5 Yr |
| 3 Yr |
| 5 Yr |
|
S&P 500 |
| -17.3 | % | -28.2 | % | -20.5 | % | -33.9 | % | -7.9 | % | -12.9 | % | -1.6 | % |
Russell 1000 Growth |
| -15.1 | % | -32.7 | % | -22.5 | % | -48.0 | % | -22.1 | % | -19.6 | % | -4.9 | % |
Russell 1000 Value |
| -18.8 | % | -22.7 | % | -17.0 | % | -17.6 | % | 1.3 | % | -6.3 | % | 0.3 | % |
Lehman Aggr Bond |
| 4.6 | % | 8.6 | % | 8.6 | % | 31.2 | % | 45.8 | % | 9.5 | % | 7.8 | % |
Returns through September 30, 2002
14
Market Depreciation Drives AUM Decline
$369 Billion at Sept. 30, 2002 |
| $418 Billion at Sept. 30, 2001 | ||||
|
|
| ||||
Investment Orientation* |
| Investment Orientation* | ||||
|
|
| ||||
|
|
| ||||
|
|
| ||||
Client Orientation |
| Client Orientation | ||||
|
|
| ||||
|
|
| ||||
|
|
| ||||
|
| * |
| U.S. |
| Global & International |
|
|
| ||||
Amounts in $ billions. Equity includes balanced portfolios AUM.
15
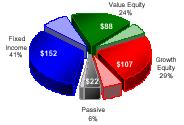
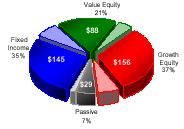
Long-Term Value & Fixed Income Inflows Offset Growth Equity & Cash Mgmt. Outflows
AUM by Investment Orientation: Twelve Months Ended Sept. 30, 2002
|
| Growth |
| Value |
| Fixed |
| Passive |
| Total |
| ||||||
• Sept. 2001 AUM* |
| $ | 156 |
| $ | 88 |
| $ | 145 |
| $ | 29 |
| $ | 418 |
| |
• Net Long-Term Flows |
| (14 | ) | 10 |
| 13 |
| (3 | ) | 6 |
| ||||||
• Cash Management, Net |
| – |
| – |
| (9 | ) | – |
| (9 | ) | ||||||
• Net New Business/(Outflows) |
| (14 | ) | 10 |
| 4 |
| (3 | ) | (3 | ) | ||||||
• Transfers |
| (4 | ) | 4 |
| – |
| – |
| – |
| ||||||
• Apprec/(Deprec) |
| (31 | ) | (14 | ) | 3 |
| (4 | ) | (46 | ) | ||||||
• Sept. 2002 AUM |
| $ | 107 |
| $ | 88 |
| $ | 152 |
| $ | 22 |
| $ | 369 |
| |
• % Change |
| -31.0 | % | -0.3 | % | +4.3 | % | -23.8 | % | -11.8 | % | ||||||
* AUM previously reported as of each date prior to March 31, 2002, have been restated to reflect the reclassification of institutional cash management and sub -advised variable annuity accounts from Institutional Investment Management to Retail and certain Private Client accounts to Retail and Institutional Investment Management. AUM now also excludes assets managed by unconsolidated affiliates.
In $ billions.
16
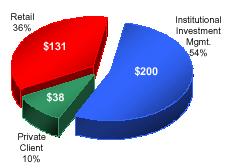
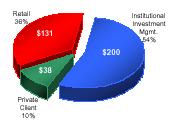
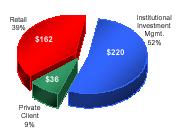
Market Depreciation & Cash Mgmt. Outflows Overwhelm Institutional & Private Client Inflows
AUM by Channel: Twelve Months Ended Sept. 30, 2002
|
| Retail |
| Institutional |
| Private Client |
| Total |
| ||||
• Sept. 2001 AUM* |
| $ | 162 |
| $ | 220 |
| $ | 36 |
| $ | 418 |
|
• Net Long-Term Flows |
| (3 | ) | 5 |
| 4 |
| 6 |
| ||||
• Cash Management, Net |
| (9 | ) | – |
| – |
| (9 | ) | ||||
• Net New Business/(Outflows) |
| (12 | ) | 5 |
| 4 |
| (3 | ) | ||||
• Transfers |
| 1 |
| (1 | ) | – |
| – |
| ||||
• Apprec/(Deprec) |
| (20 | ) | (24 | ) | (2 | ) | (46 | ) | ||||
• Sept. 2002 AUM |
| $ | 131 |
| $ | 200 |
| $ | 38 |
| $ | 369 |
|
• % Change |
| -19.0 | % | -9.0 | % | +3.5 | % | -11.8 | % | ||||
* AUM previously reported as of each date prior to March 31, 2002, have been restated to reflect the reclassification of institutional cash management and sub -advised variable annuity accounts from Institutional Investment Management to Retail and certain Private Client accounts to Retail and Institutional Investment Management. AUM now also excludes assets managed by unconsolidated affiliates.
In $ billions.
17
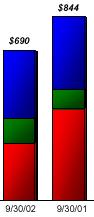
Annualized Fee Base (1)
|
| 9/30/02 vs. 9/30/01 |
| Average Basis Points |
| ||||||||
|
| $1,494 mm |
| $1,685 mm |
|
|
| 9/30/02 |
| 9/30/01 |
| ||
AFB by Channel and |
|
|
|
|
| Retail |
| 52.7 |
| 52.3 |
| ||
Investment Orientation |
|
|
|
|
| Institutional |
| 25.1 |
| 24.8 |
| ||
|
|
|
|
|
| Private Client |
| 80.4 |
| 81.3 |
| ||
|
|
|
|
|
| Total |
| 40.5 |
| 40.3 |
| ||
|
|
|
|
|
|
|
|
|
|
| |||
|
|
|
|
| AUM vs. AFB |
| |||||||
|
|
|
|
|
|
|
|
|
|
| |||
|
|
| Retail |
| -19.0 | % | -18.3 | % | |||||
|
| Institutional |
| -9.0 | % | -7.9 | % | ||||||
|
| Private Client |
| +3.5 | % | +2.4 | % | ||||||
|
|
|
|
|
|
|
| ||||||
|
|
|
|
|
| ||||||||
|
|
|
|
| |||||||||
|
|
|
|
| |||||||||
|
|
|
|
| |||||||||
|
|
|
|
| |||||||||
|
|
|
|
| |||||||||
|
|
|
|
|
|
|
| ||||||
Retail |
| Institutional |
| Private Client |
|
|
| ||||||
|
|
|
|
|
|
|
|
| |||||
|
|
|
|
|
|
|
|
| |||||

(1) Annualized Fee Base is defined as period end AUM times contractual annual fee rates; assumes no change in AUM or fee rates for one year. In $ millions
18
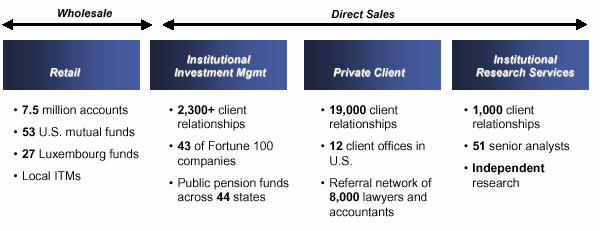
3Q02 Retail Channel Highlights
• Net long-term outflows of $4.4 billion primarily in growth equity funds
• $1.1 billion in outflows attributed to liquidation of EPTA Italy portfolio
• $2.1 billion in cash management net outflows
• Positive net flows in AllianceBernstein and Luxembourg funds
• Equity portfolios performance generally mixed
• 529 CollegeBoundfundSM savings plan remains largest in the country with $2.2 billion in AUM
• Number of accounts increased by 9%; currently over 300,000 accounts
• On November 11, announced distribution agreement with Principal Financial Group to market CollegeBoundfundSM
19
3Q02 AllianceBernstein
Institutional Investment Management Highlights
• Net inflows of $1.0 billion
• 70 new account wins representing $4.8 billion in AUM across a broad range of disciplines
• Seeing benefits of AllianceBernstein combination; year-to-date new accounts balanced among growth, value and fixed income products
• Non-U.S. business strong, particularly in Canada, UK, Japan and Australia
• Relative performance in growth products generally improved while value products remained mixed for the quarter; long-term results remain competitive
20
3Q02 Private Client Overview
Bernstein Investment Research & Management Highlights
• One of the strongest quarters of net new business totaling $1.3 billion; on track for record year
• 600 new client relationships; over 19,000 in total
• Competitive relative performance; clients remain in balanced portfolios, continuing to retain their wealth
21
Private Client Portfolio Performance
• Representative client account allocation:
|
|
|
|
|
|
|
|
|
|
|
|
|
| Equity Allocation with 80/20 | |||||
40% Fixed income |
|
|
| 40 | % | Diversified Muni |
|
|
|
|
|
|
| US Value/US Growth portfolio | |||||
|
|
|
|
|
|
|
|
|
|
|
| 34 | % | Strategic Value | |||||
|
|
|
|
|
|
|
|
|
|
|
|
|
|
|
| 8 | % | Strategic Growth | |
60% equities |
|
|
| 42 | % | U.S. equities |
|
|
|
|
|
|
|
|
| 3 | % | Emerg Mkts Value | |
|
|
| 18 | % | Non-U.S. equities |
|
|
|
|
|
|
|
|
| 15 | % | Intl Value | ||
|
|
|
| 100 | % |
|
|
|
|
|
|
|
|
|
|
|
|
| |
|
|
|
|
|
|
|
|
|
|
|
|
|
| Equity Allocation with 50/50 | |||||
• Representative performance |
|
|
|
|
|
|
|
|
| ||||||||||
|
|
| YTD |
|
|
|
|
|
|
|
|
|
|
| 21 | % | Strategic Value | ||
|
|
| 9/30/02 |
|
|
|
|
|
|
|
|
|
|
| 21 | % | Strategic Growth | ||
80/20* U.S. Equity Allocation |
|
| (12.7 | ) |
|
|
|
|
|
|
|
|
|
| 3 | % | Emerg Mkts Value | ||
|
|
|
|
|
|
|
|
|
|
|
|
|
|
| 15 | % | Intl Value | ||
50/50* U.S. Equity Allocation |
|
| (13.8 | ) |
|
|
|
|
|
|
|
|
|
|
|
|
| ||
|
|
|
|
|
|
|
|
|
|
|
|
|
|
|
|
|
| ||
S&P 500 |
|
| (28.2 | ) |
|
|
|
|
|
|
|
|
|
|
|
|
| ||
|
|
|
|
|
|
|
|
|
|
|
|
|
|
|
|
|
| ||
|
|
|
|
|
|
|
|
|
|
|
|
|
|
|
|
|
| ||
|
|
| YTD |
| 3/1/00- |
|
|
|
|
|
|
|
|
|
|
|
| ||
|
|
| 9/30/02 |
| 9/30/02 |
|
|
|
|
|
|
|
|
|
|
|
| ||
All Balanced Accounts |
|
| (13.1 | ) | 1.1 |
|
|
|
|
|
|
|
|
|
|
|
| ||
|
|
|
|
|
|
|
|
|
|
|
|
|
|
|
|
|
| ||
S&P 500 |
|
| (28.2 | ) | (38.3 | ) |
|
|
|
|
|
|
|
|
|
|
| ||
* Allocation of U.S. equity portion of portfolio. Results are simulated. Performance after fees. See Performance Disclosure.
22
3Q02 Institutional Research Services Highlights
• Revenue growth driven by year-over-year increase in market share and strong European research and trading; continued pricing pressures in the US partially offset by pricing strength in the UK
• Investments made over last few years, combined with industry focus on independent research, increases interest in Bernstein research
• Appointed new Chairman & CEO to lead business unit in continuing expansion of global operations and hired new head of global trading in October
• Became a Nasdaq market maker in July
23
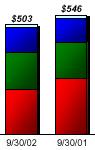
Third Quarter Financial Overview
Alliance Capital |
| 3Q02 vs. 3Q01 |
|
|
|
• Sept. 30, 2002 AUM |
| $369 bn vs. $418 bn, down 11.8% |
|
|
|
|
| S&P 500 down 20.5% |
• Market Environment |
| Russell 1000 Growth down 22.5% |
(12 Months) |
| Russell 1000 Value down 17.0% |
|
| Lehman Aggr. Bond up 8.6% |
|
|
|
• Net Asset Outflows |
| Net outflows in Retail partially offset by positive inflows in Institutional and Private Client |
|
|
|
• Annualized Fee Base |
| $1,494 mm vs. $1,685 mm, down 11.3% |
|
|
|
• Average AUM |
| $391 bn vs. $446 bn, down 12.3% |
|
|
|
• Revenues |
| $650 mm vs. $725 mm, down 10.4% |
|
|
|
• Operating Expenses |
| $506 mm vs. $521 mm, down 2.9% |
|
|
|
• Net Operating Earnings |
| $137 mm vs. $194 mm, down 29.6% |
24
Third Quarter Financial Overview
|
| 3Q02 |
| 3Q01 |
| % chg |
| ||
• Average AUM |
| $ | 391 |
| $ | 446 |
| -12 |
|
• Revenues |
|
|
|
|
|
|
| ||
Base Fee & Other |
| $ | 530 |
| $ | 582 |
| -9 |
|
Performance Fee |
| 11 |
| 9 |
| +27 |
| ||
Distribution |
| 109 |
| 134 |
| -19 |
| ||
|
| 650 |
| 725 |
| -10 |
| ||
• Expenses |
|
|
|
|
|
|
| ||
Compensation |
| 222 |
| 219 |
| +1 |
| ||
Distribution (1) |
| 151 |
| 164 |
| -8 |
| ||
Other (1) |
| 140 |
| 148 |
| -5 |
| ||
|
| 513 |
| 531 |
| -3 |
| ||
• Net Operating Earnings |
| $ | 137 |
| $ | 194 |
| -30 |
|
• Base Fee Earnings |
| $ | 129 |
| $ | 187 |
| -32 |
|
• Performance Fee Earnings |
| 8 |
| 7 |
| +23 |
| ||
• Net Operating Earnings |
| $ | 137 |
| $ | 194 |
| -30 |
|
(1) Distribution includes distribution plan payments and amortization of deferred sales commissions. Distribution and other reflects reclassification of revenue sharing payments of $11 mm in 3Q02 and $14 mm in 3Q01 from distribution plan payments to other promotion and servicing expense.
In $ millions, except AUM in $ billions.
25
Continued Focus on Expense Controls
|
| 3Q02 |
| 3Q01 |
| % chg |
|
| Comments |
| ||
• Employee Comp. & Benefits |
|
|
|
|
|
|
|
|
|
| ||
Base Compensation |
| $ | 75 |
| $ | 80 |
| -6 |
|
| • Headcount down 6% |
|
Incentive Compensation |
|
|
|
|
|
|
|
|
|
| ||
Cash |
| 46 |
| 59 |
| -23 |
|
| • Lower operating earnings |
| ||
Deferred |
| 23 |
| 8 |
| + 198 |
|
| • Second tranche of SCB grant |
| ||
Commissions |
| 60 |
| 51 |
| +16 |
|
| • Private Client & Sell-Side offset by lower retail |
| ||
Other |
| 18 |
| 21 |
| -12 |
|
|
| |||
|
| 222 |
| 219 |
| +1 |
|
|
|
| ||
|
|
|
|
|
|
|
|
|
|
| ||
• Promotion & Servicing |
|
|
|
|
|
|
|
|
|
| ||
Distribution Plan Pmts (1) |
| 95 |
| 107 |
| -11 |
|
|
|
| ||
Amort of Def Sales Comm |
| 56 |
| 57 |
| -2 |
|
| • Continued reductions in controllable expenses |
| ||
T & E |
| 13 |
| 16 |
| -18 |
|
|
| |||
Printing/Mailing |
| 7 |
| 11 |
| -33 |
|
|
| |||
Other (1) |
| 26 |
| 30 |
| -12 |
|
|
| |||
|
| 197 |
| 221 |
| -11 |
|
|
| |||
|
|
|
|
|
|
|
|
|
|
| ||
• General & Admin |
|
|
|
|
|
|
|
|
|
| ||
Office Expense |
| 42 |
| 38 |
| +10 |
|
| • 3Q02 sublease charge |
| ||
Other |
| 42 |
| 38 |
| +9 |
|
|
|
| ||
|
| 84 |
| 76 |
| +10 |
|
|
|
| ||
|
|
|
|
|
|
|
|
|
|
| ||
• Interest and Taxes |
| 10 |
| 15 |
| -31 |
|
| • Lower debt/pre-tax earnings |
| ||
|
|
|
|
|
|
|
|
|
|
| ||
• Total |
| $ | 513 |
| $ | 531 |
| -3 |
|
|
|
|
(1) Reflects reclassification of revenue sharing payments of $11 mm in 3Q02 and $14 mm in 3Q01 from distribution plan payments to other promotion and servicing expense. Amounts in $ millions.
26
Net Distribution Expense
|
| 3Q02 |
| 3Q01 |
| % chg |
| ||
• Distribution Revenues |
| $ | 109 |
| $ | 134 |
| -19 |
|
|
|
|
|
|
|
|
| ||
• Distribution Expenses |
|
|
|
|
|
|
| ||
Distribution Plan Payments (1) |
| 95 |
| 107 |
| -11 |
| ||
Amort. of Deferred Sales Comm. |
| 56 |
| 57 |
| -2 |
| ||
|
| 151 |
| 164 |
| -8 |
| ||
|
|
|
|
|
|
|
| ||
• Net Distribution Expense |
| $ | 42 |
| $ | 30 |
| +40 |
|
• Lower average retail AUM in growth equity and technology products led decline in distribution revenues
(1) Reflects reclassification of revenue sharing payments of $11 mm in 3Q02 and $14 mm in 3Q01 from distribution plan payments to other promotion and servicing expense.
Amounts in $ millions.
27
Alliance Capital Pre-tax Operating Margin
|
| 3Q02 |
| % of |
| 3Q01 |
| % of |
| ||
• Base Fee Earnings, Net |
| $ | 168 |
| 31.0 | % | $ | 221 |
| 37.3 | % |
• Distribution Expense, Net (2) |
| (33 | ) | -6.1 |
| (24 | ) | -4.0 |
| ||
• Performance Fee Earnings, Net |
| 8 |
| 1.6 |
| 7 |
| 1.2 |
| ||
• Pre-tax Operating Earnings |
| $ | 143 |
| 26.5 | % | $ | 204 |
| 34.5 | % |
• Decline in margins due to lower base fees and higher net distribution, principally from declining markets, and higher deferred compensation and a one-time office space charge related to SCB acquisition
(1) Excludes distribution revenues.
(2) Net distribution expense and net performance fee earnings include allocations of incentive compensation.
28
Third Quarter Revenues – by Distribution Channel
|
| 3Q02 |
| 3Q01 |
| % chg |
| Comments | ||
• Retail |
| $ | 318 |
| $ | 390 |
| -19 |
| • Continued unfavorable environment for equities decreases AUM and base fee revenues |
• Institutional Inv. Mgmt |
| 149 |
| 163 |
| -9 |
| • Revenues decline with average AUM | ||
• Private Client |
| 103 |
| 95 |
| +8 |
| • Strong new business flows | ||
• Institutional Research Svcs. |
| 76 |
| 64 |
| +19 |
| • Higher NYSE volume and new business in Europe | ||
• Other |
| 4 |
| 13 |
| -66 |
| • Lower interest rates | ||
• Total |
| $ | 650 |
| $ | 725 |
| -10 |
|
|
Amounts in $ millions.
29
Attractive Yield
LTM Yield1 = 7.9% |
CAGR2 = 12% |
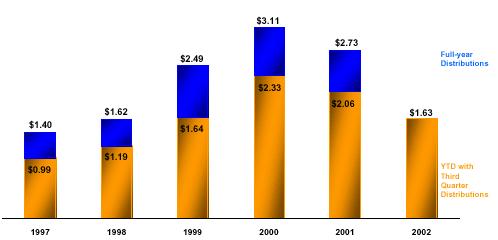
Distributions per Unit are adjusted for two-for-one Unit split in 1998.
1 LTM yield based upon price of Alliance Holding Units as of 10/31/02.
2 Based on last twelve months ended 3Q97 and 3Q02.
30
Delivering Superior Long-Term Investor Returns
Total Annualized Return*
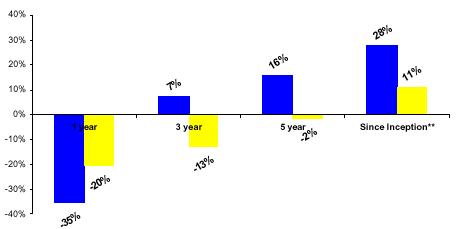
|
| AC |
|
|
| S&P 500 |
*As of 9/30/02. Based on price of Alliance Holding units of $27.73 at 9/30/02. AC and S&P returns include reinvestment of cash distributions and dividends, respectively.
**Since IPO 4/88.
31
2003 Retail Channel Initiatives
Continue to:
• Focus on performance and delivering value to customer
• Emphasize CollegeBoundfundSM for educational savings
• Develop style-balanced and alternative growth products
• Control expenses
32
2003 AllianceBernstein Institutional Investment Mgmt Channel Initiatives
• Continued focus on performance, business development and maintaining high level of client service
• Focus on international markets, especially Japan, UK, Europe and Australia
• Continue to pursue cross-selling opportunities to existing clients
33
2003 Private Client Initiatives
• Capitalize on resource commitments made over last two years
• Increase fee realization through enhanced product profile
• Plan to launch new Global Equity Hedge fund in early 2003 building on success in 2002
34
2003 Institutional Research Services Initiatives
• Continue to capitalize on substantial investments over the last two years
• Complete research coverage launches
• Further broaden trading capabilities
• Capitalize on resource commitments made over last two years
35
Strength Through Diversification
• Globally Positioned in Key Markets
• Balanced Product Mix
• Strong Distribution Channels
• Highly Valued Independent Research Organization
• Solid Financial Position
36

37