EXHIBIT 99.03
Link to searchable text of slide 1
Link to searchable text of slide 2
Link to searchable text of slide 3
Link to searchable text of slide 4
Link to searchable text of slide 5
Link to searchable text of slide 6
Link to searchable text of slide 7
Link to searchable text of slide 8
Link to searchable text of slide 9
Link to searchable text of slide 10
Link to searchable text of slide 11
Link to searchable text of slide 12
Link to searchable text of slide 13
Link to searchable text of slide 14

Link to searchable text of slide 15
Exhibit 99.03
[ALLIANCE CAPITAL LOGO]
Alliance Capital
Strength from Diversification:
Assets Managed, Markets Served
John D. Carifa
President and Chief Operating Officer
Mutual Fund Analyst Meeting
January 16, 2003
Forward-Looking Statements
Certain statements provided by Alliance Capital Management L.P. (“Alliance Capital”) and Alliance Capital Management Holding L.P. (“Alliance Holding”) in this report are “forward-looking statements” within the meaning of the Private Securities Litigation Reform Act of 1995. Such forward-looking statements are subject to risks, uncertainties and other factors which could cause actual results to differ materially from future results expressed or implied by such forward-looking statements. The most significant of such factors include, but are not limited to, the following: the performance of financial markets, the investment performance of Alliance Capital’s sponsored investment products and separately managed accounts, general economic conditions, future acquisitions, competitive conditions, and government regulations, including changes in tax rates. Alliance Capital and Alliance Holding caution readers to carefully consider such factors. Further, such forward-looking statements speak only as of the date on which such statements are made; Alliance Capital and Alliance Holding undertake no obligation to update any forward-looking statements to reflect events or circumstances after the date of such statements.
2
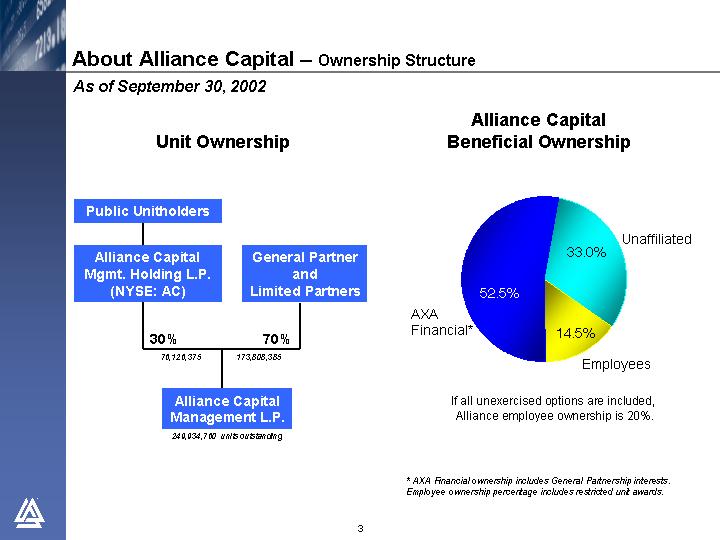
About Alliance Capital — Ownership Structure
As of September 30, 2002
Unit Ownership
[CHART]
Alliance Capital
Beneficial Ownership
[CHART]
If all unexercised options are included,
Alliance employee ownership is 20%.
* AXA Financial ownership includes General Partnership interests.
Employee ownership percentage includes restricted unit awards.
3
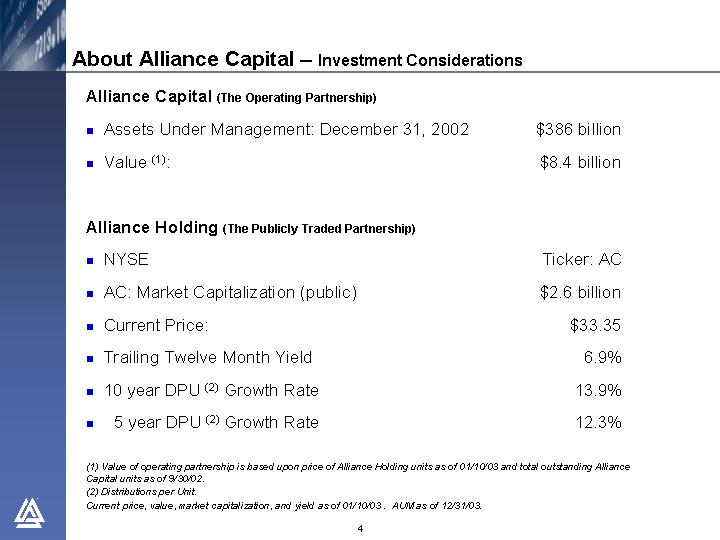
About Alliance Capital — Investment Considerations
Alliance Capital (The Operating Partnership)
• Assets Under Management: December 31, 2002 |
| $ | 386 billion |
|
• Value(1): |
| $ | 8.4 billion |
|
Alliance Holding (The Publicly Traded Partnership)
• NYSE |
| Ticker: AC |
| |
• AC: Market Capitalization (public) |
| $ | 2.6 billion |
|
• Current Price: |
| $ | 33.35 |
|
• Trailing Twelve Month Yield |
| 6.9 | % | |
• 10 year DPU(2) Growth Rate |
| 13.9 | % | |
• 5 year DPU(2) Growth Rate |
| 12.3 | % | |
(1) Value of operating partnership is based upon price of Alliance Holding units as of 01/10/03 and total outstanding Alliance Capital units as of 9/30/02.
(2) Distributions per Unit.
Current price, value, market capitalization, and yield as of 01/10/03 . AUM as of 12/31/03.
4
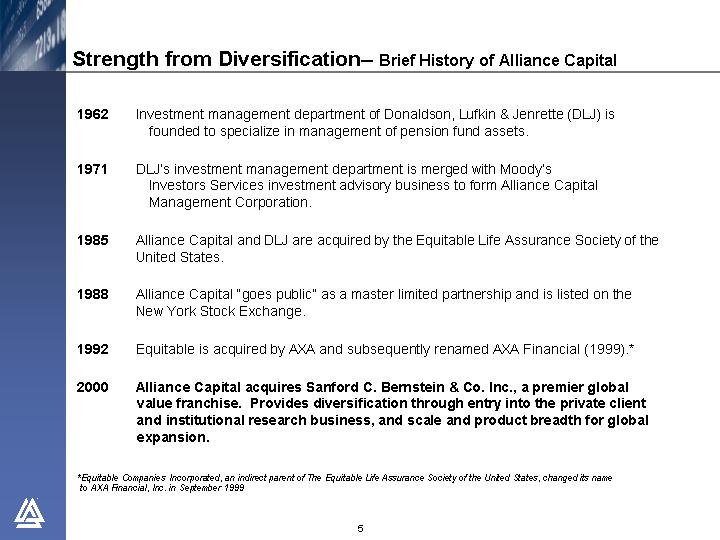
Strength from Diversification — Brief History of Alliance Capital
1962 |
| Investment management department of Donaldson, Lufkin & Jenrette (DLJ) is founded to specialize in management of pension fund assets. |
|
|
|
1971 |
| DLJ’s investment management department is merged with Moody’s Investors Services investment advisory business to form Alliance Capital Management Corporation. |
|
|
|
1985 |
| Alliance Capital and DLJ are acquired by the Equitable Life Assurance Society of the United States. |
|
|
|
1988 |
| Alliance Capital “goes public” as a master limited partnership and is listed on the New York Stock Exchange. |
|
|
|
1992 |
| Equitable is acquired by AXA and subsequently renamed AXA Financial (1999).* |
|
|
|
2000 |
| Alliance Capital acquires Sanford C. Bernstein & Co. Inc., a premier global value franchise. Provides diversification through entry into the private client and institutional research business, and scale and product breadth for global expansion. |
*Equitable Companies Incorporated, an indirect parent of The Equitable Life Assurance Society of the United States, changed its name to AXA Financial, Inc. in September 1999
5
To be the premier
global research and investment management organization
through superior performance
across a broad range of investment disciplines
for a diverse group of clients
6
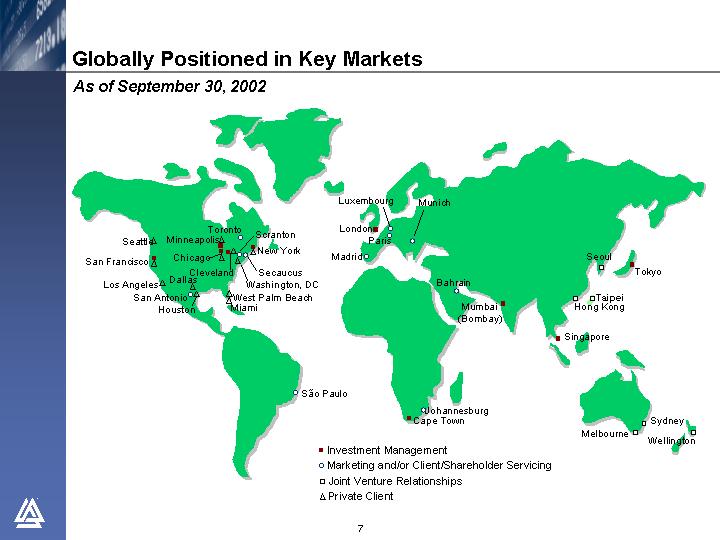
Globally Positioned in Key Markets
As of September 30, 2002
[GRAPHICS]
7
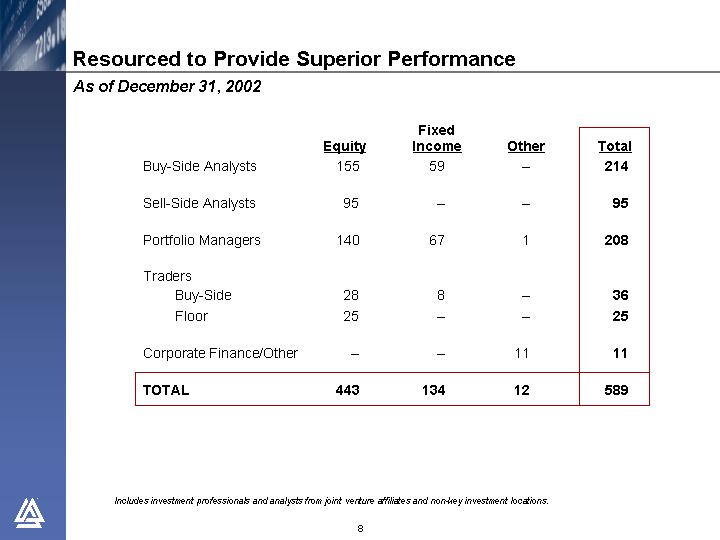
Resourced to Provide Superior Performance
As of December 31, 2002
|
| Equity |
| Fixed |
| Other |
| Total |
|
Buy-Side Analysts |
| 155 |
| 59 |
| — |
| 214 |
|
|
|
|
|
|
|
|
|
|
|
Sell-Side Analysts |
| 95 |
| — |
| — |
| 95 |
|
|
|
|
|
|
|
|
|
|
|
Portfolio Managers |
| 140 |
| 67 |
| 1 |
| 208 |
|
|
|
|
|
|
|
|
|
|
|
Traders |
|
|
|
|
|
|
|
|
|
Buy-Side |
| 28 |
| 8 |
| — |
| 36 |
|
Floor |
| 25 |
| — |
| — |
| 25 |
|
Corporate Finance/Other |
| — |
| — |
| 11 |
| 11 |
|
|
|
|
|
|
|
|
|
|
|
TOTAL |
| 443 |
| 134 |
| 12 |
| 589 |
|
Includes investment professionals and analysts from joint venture affiliates and non-key investment locations.
8
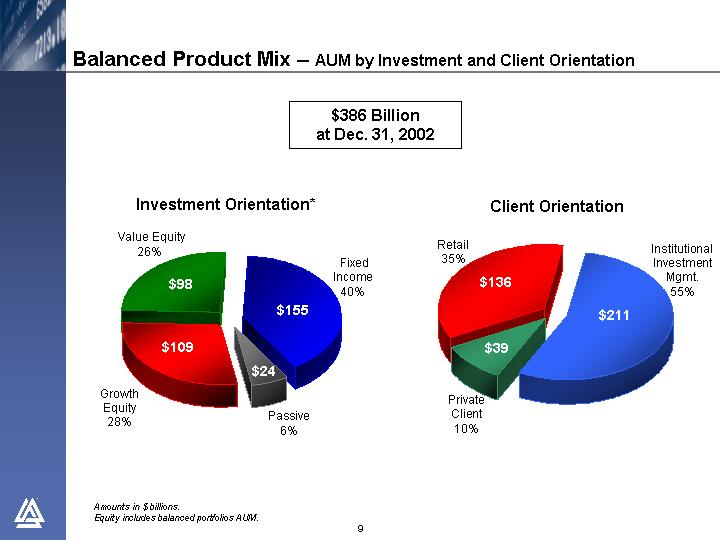
Balanced Product Mix — AUM by Investment and Client Orientation
$386 Billion
at Dec. 31, 2002
Investment Orientation*
[CHART]
Client Orientation
[CHART]
Amounts in $ billions.
Equity includes balanced portfolios AUM.
9
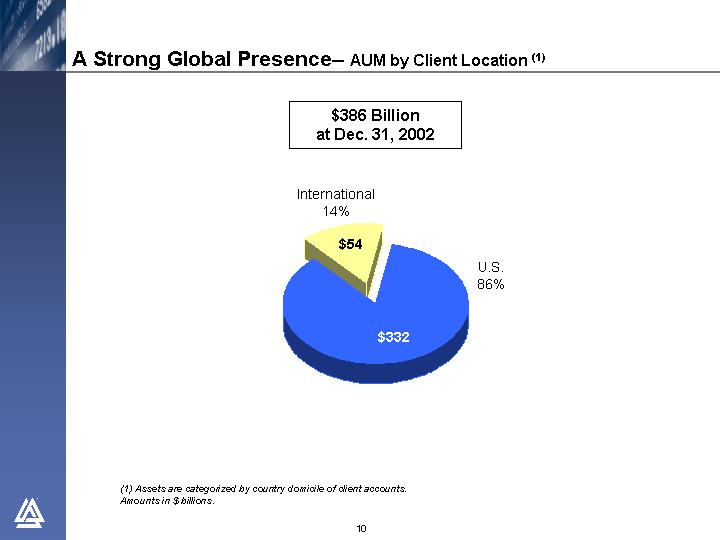
A Strong Global Presence — AUM by Client Location(1)
$386 Billion
at Dec. 31, 2002
[CHART]
(1) Assets are categorized by country domicile of client accounts.
Amounts in $ billions.
10
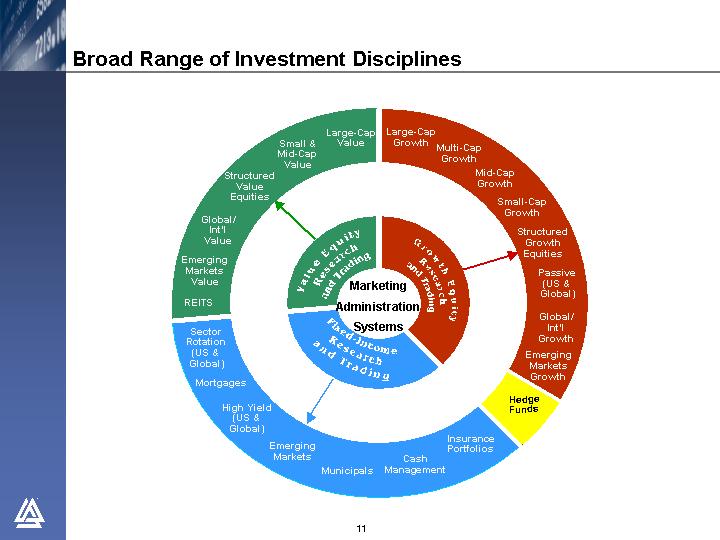
Broad Range of Investment Disciplines
[CHART]
11
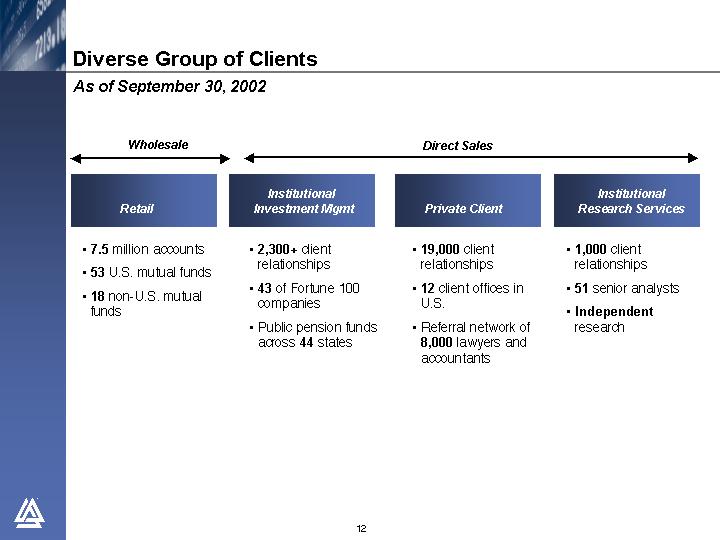
As of September 30, 2002
Wholesale
Retail
• 7.5 million accounts
• 53 U.S. mutual funds
• 18 non-U.S. mutual funds
Direct Sales
Institutional Investment Mgmt
• 2,300+ client relationships
• 43 of Fortune 100 companies
• Public pension funds across 44 states
Private Client
• 19,000 client relationships
• 12 client offices in U.S.
• Referral network of 8,000 lawyers and accountants
Institutional Research Services
• 1,000 client relationships
• 51 senior analysts
• Independent research
12
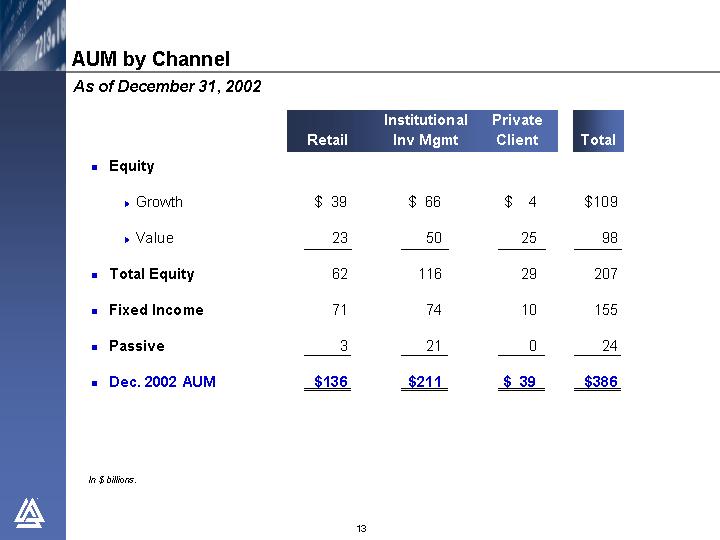
As of December 31, 2002
|
| Retail |
| Institutional |
| Private |
| Total |
| ||||
• Equity |
|
|
|
|
|
|
|
|
| ||||
|
|
|
|
|
|
|
|
|
| ||||
• Growth |
| $ | 39 |
| $ | 66 |
| $ | 4 |
| $ | 109 |
|
|
|
|
|
|
|
|
|
|
| ||||
• Value |
| 23 |
| 50 |
| 25 |
| 98 |
| ||||
|
|
|
|
|
|
|
|
|
| ||||
• Total Equity |
| 62 |
| 116 |
| 29 |
| 207 |
| ||||
|
|
|
|
|
|
|
|
|
| ||||
• Fixed Income |
| 71 |
| 74 |
| 10 |
| 155 |
| ||||
|
|
|
|
|
|
|
|
|
| ||||
• Passive |
| 3 |
| 21 |
| 0 |
| 24 |
| ||||
|
|
|
|
|
|
|
|
|
| ||||
• Dec. 2002 AUM |
| $ | 136 |
| $ | 211 |
| $ | 39 |
| $ | 386 |
|
In $ billions.
13
• Globally Positioned in Key Markets
• Balanced Product Mix
• Strong Distribution Channels
• Highly Valued Independent Research Organization
• Solid Financial Position
14
15