Exhibit 99.09

Link to searchable text of slide shown above
Link to searchable text of slide shown above
Link to searchable text of slide shown above

Link to searchable text of slide shown above
Link to searchable text of slide shown above
Link to searchable text of slide shown above
Link to searchable text of slide shown above
Link to searchable text of slide shown above

Link to searchable text of slide shown above
Link to searchable text of slide shown above
Link to searchable text of slide shown above
Link to searchable text of slide shown above
Link to searchable text of slide shown above
Link to searchable text of slide shown above
Link to searchable text of slide shown above
Link to searchable text of slide shown above
Link to searchable text of slide shown above
Link to searchable text of slide shown above
Link to searchable text of slide shown above
Link to searchable text of slide shown above
Link to searchable text of slide shown above
Link to searchable text of slide shown above
Link to searchable text of slide shown above
Link to searchable text of slide shown above
Link to searchable text of slide shown above
Link to searchable text of slide shown above

Link to searchable text of slide shown above
Link to searchable text of slide shown above

Link to searchable text of slide shown above

Link to searchable text of slide shown above
Link to searchable text of slide shown above
Link to searchable text of slide shown above
Link to searchable text of slide shown above
Link to searchable text of slide shown above
Link to searchable text of slide shown above
Link to searchable text of slide shown above
Link to searchable text of slide shown above
Link to searchable text of slide shown above
Link to searchable text of slide shown above
Link to searchable text of slide shown above
Link to searchable text of slide shown above
Link to searchable text of slide shown above
Link to searchable text of slide shown above
Link to searchable text of slide shown above
Link to searchable text of slide shown above
Link to searchable text of slide shown above
Link to searchable text of slide shown above
Link to searchable text of slide shown above
Link to searchable text of slide shown above
Link to searchable text of slide shown above
Link to searchable text of slide shown above
Link to searchable text of slide shown above
Link to searchable text of slide shown above
Link to searchable text of slide shown above
Link to searchable text of slide shown above

Link to searchable text of slide shown above
Searchable text section of graphics shown above
Exhibit 99.09
Alliance Capital and Alliance Holding
First Quarter 2003 Review
Bruce W. Calvert | | John D. Carifa | | Lewis A. Sanders |
Chairman and CEO | | President and COO | | Vice Chairman and CIO |
April 29, 2003
[LOGO]
Introduction
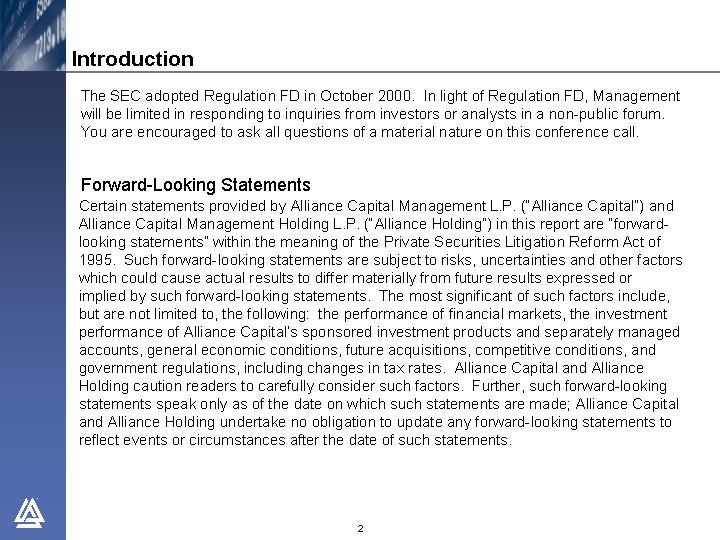
The SEC adopted Regulation FD in October 2000. In light of Regulation FD, Management will be limited in responding to inquiries from investors or analysts in a non-public forum. You are encouraged to ask all questions of a material nature on this conference call.
Forward-Looking Statements
Certain statements provided by Alliance Capital Management L.P. (“Alliance Capital”) and Alliance Capital Management Holding L.P. (“Alliance Holding”) in this report are “forward-looking statements” within the meaning of the Private Securities Litigation Reform Act of 1995. Such forward-looking statements are subject to risks, uncertainties and other factors which could cause actual results to differ materially from future results expressed or implied by such forward-looking statements. The most significant of such factors include, but are not limited to, the following: the performance of financial markets, the investment performance of Alliance Capital’s sponsored investment products and separately managed accounts, general economic conditions, future acquisitions, competitive conditions, and government regulations, including changes in tax rates. Alliance Capital and Alliance Holding caution readers to carefully consider such factors. Further, such forward-looking statements speak only as of the date on which such statements are made; Alliance Capital and Alliance Holding undertake no obligation to update any forward-looking statements to reflect events or circumstances after the date of such statements.
2
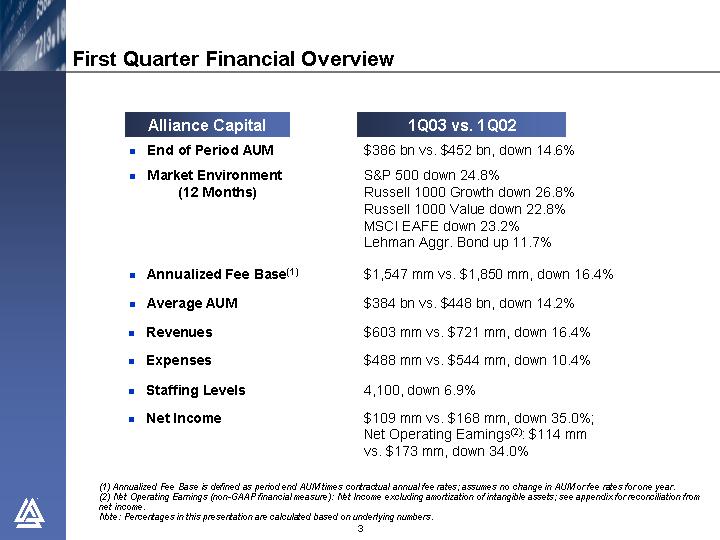
First Quarter Financial Overview
Alliance Capital | | 1Q03 vs. 1Q02 |
• | | End of Period AUM | | $386 bn vs. $452 bn, down 14.6% |
| | | | |
• | | Market Environment
(12 Months) | | S&P 500 down 24.8%
Russell 1000 Growth down 26.8%
Russell 1000 Value down 22.8%
MSCI EAFE down 23.2%
Lehman Aggr. Bond up 11.7% |
| | | | |
• | | Annualized Fee Base(1) | | $1,547 mm vs. $1,850 mm, down 16.4% |
| | | | |
• | | Average AUM | | $384 bn vs. $448 bn, down 14.2% |
| | | | |
• | | Revenues | | $603 mm vs. $721 mm, down 16.4% |
| | | | |
• | | Expenses | | $488 mm vs. $544 mm, down 10.4% |
| | | | |
• | | Staffing Levels | | 4,100, down 6.9% |
| | | | |
• | | Net Income | | $109 mm vs. $168 mm, down 35.0%;
Net Operating Earnings(2): $114 mm
vs. $173 mm, down 34.0% |
(1) Annualized Fee Base is defined as period end AUM times contractual annual fee rates; assumes no change in AUM or fee rates for one year.
(2) Net Operating Earnings (non-GAAP financial measure): Net Income excluding amortization of intangible assets; see appendix for reconciliation from net income.
Note: Percentages in this presentation are calculated based on underlying numbers.
3
Alliance Capital First Quarter Financial Overview
(In $ millions, except AUM in $ billions)
| | | 1Q03 | | 1Q02 | | % chg | |
• | Average AUM ($bn) | | $ | 384 | | $ | 448 | | -14 | |
| | | | | | | | |
• | Revenues | | | | | | | |
| Base Fee & Other | | $ | 441 | | $ | 514 | | -14 | |
| Performance Fee | | 4 | | 6 | | -35 | |
| Distribution | | 100 | | 129 | | -23 | |
| Institutional Research Svcs | | 58 | | 72 | | -19 | |
| | | 603 | | 721 | | -16 | |
• | Expenses | | | | | | | |
| Compensation | | 218 | | 237 | | -8 | |
| Distribution(1) | | 142 | | 162 | | -12 | |
| Other(1) | | 128 | | 145 | | -12 | |
| | | 488 | | 544 | | -10 | |
| | | | | | | | |
• | Taxes | | 6 | | 9 | | -32 | |
• | Net Income | | $ | 109 | | $ | 168 | | -35 | |
| | | | | | | | |
• | Base Fee Earnings | | $ | 106 | | $ | 164 | | -35 | |
• | Performance Fee Earnings | | 3 | | 4 | | -27 | |
• | Net Income | | $ | 109 | | $ | 168 | | -35 | |
(1) Distribution expenses include distribution plan payments and amortization of deferred sales commissions. Revenue sharing payments, previously included in distribution plan payments, are now included in other promotion and servicing expense; 1Q02 amounts have been restated to conform to the 1Q03 presentation. Note: May not add due to rounding
4
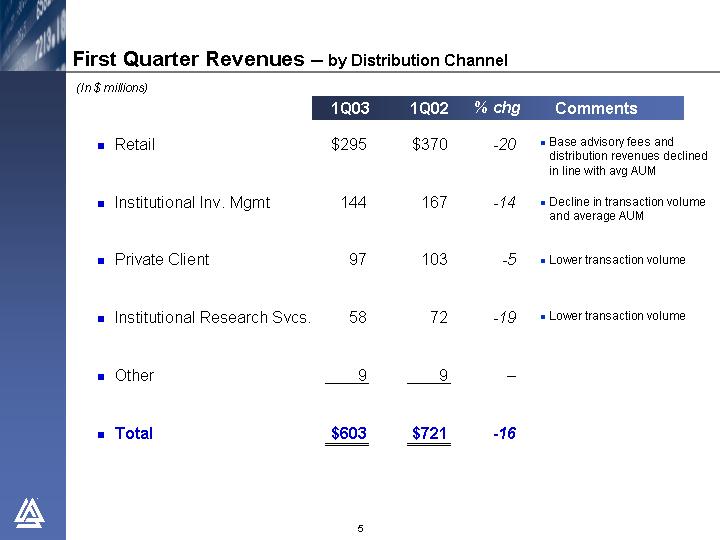
First Quarter Revenues – by Distribution Channel
(In $ millions)
| | | 1Q03 | | 1Q02 | | % chg | | | Comments | |
• | Retail | | $ | 295 | | $ | 370 | | -20 | | • | Base advisory fees and distribution revenues declined in line with avg AUM | |
| | | | | | | | | | | |
• | Institutional Inv. Mgmt | | 144 | | 167 | | -14 | | • | Decline in transaction volume and average AUM | |
| | | | | | | | | | | |
• | Private Client | | 97 | | 103 | | -5 | | • | Lower transaction volume | |
| | | | | | | | | | | |
• | Institutional Research Svcs. | | 58 | | 72 | | -19 | | • | Lower transaction volume | |
| | | | | | | | | | | |
• | Other | | 9 | | 9 | | — | | | | |
| | | | | | | | | | | |
• | Total | | $ | 603 | | $ | 721 | | -16 | | | | |
5
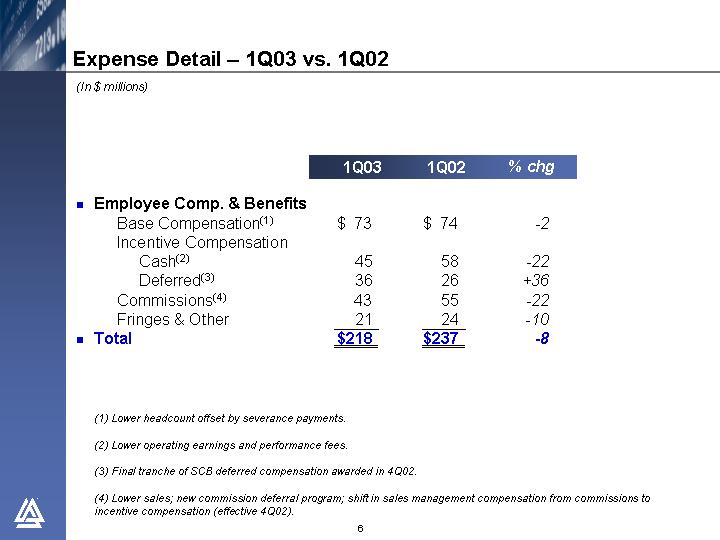
Expense Detail – 1Q03 vs. 1Q02
(In $ millions)
| | | 1Q03 | | 1Q02 | | % chg | |
• | Employee Comp. & Benefits | | | | | | | |
| Base Compensation(1) | | $ | 73 | | $ | 74 | | -2 | |
| Incentive Compensation | | | | | | | |
| Cash(2) | | 45 | | 58 | | -22 | |
| Deferred(3) | | 36 | | 26 | | +36 | |
| Commissions(4) | | 43 | | 55 | | -22 | |
| Fringes & Other | | 21 | | 24 | | -10 | |
• | Total | | $ | 218 | | $ | 237 | | -8 | |
(1) Lower headcount offset by severance payments.
(2) Lower operating earnings and performance fees.
(3) Final tranche of SCB deferred compensation awarded in 4Q02.
(4) Lower sales; new commission deferral program; shift in sales management compensation from commissions to incentive compensation (effective 4Q02).
6
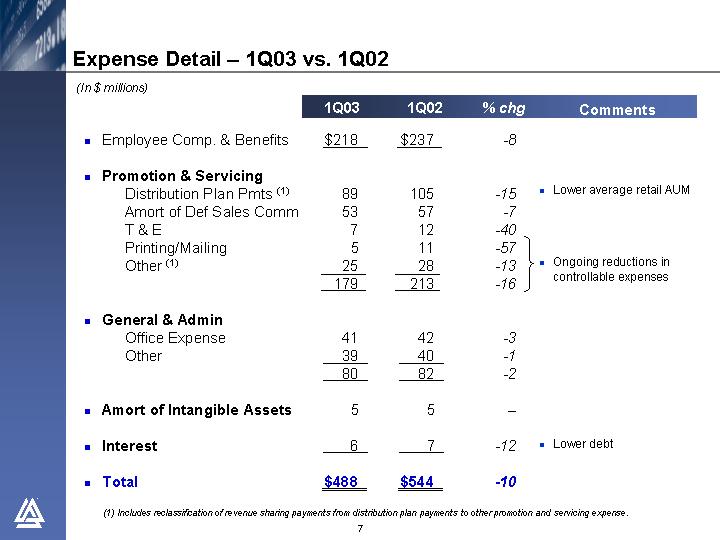
Expense Detail – 1Q03 vs. 1Q02
(In $ millions)
| | | 1Q03 | | 1Q02 | | % chg | | | Comments | |
| | | | | | | | | | | |
• | Employee Comp. & Benefits | | $ | 218 | | $ | 237 | | -8 | | | | |
| | | | | | | | | | | |
• | Promotion & Servicing | | | | | | | | | | |
| Distribution Plan Pmts(1) | | 89 | | 105 | | -15 | | • | Lower average retail AUM | |
| Amort of Def Sales Comm | | 53 | | 57 | | -7 | | | | |
| T & E | | 7 | | 12 | | -40 | 
| • | Ongoing reductions in controllable expenses | |
| Printing/Mailing | | 5 | | 11 | | -57 | |
| Other(1) | | 25 | | 28 | | -13 | | |
| | | 179 | | 213 | | -16 | | | | |
| | | | | | | | | | | |
• | General & Admin | | | | | | | | | | |
| Office Expense | | 41 | | 42 | | -3 | | | | |
| Other | | 39 | | 40 | | -1 | | | | |
| | | 80 | | 82 | | -2 | | | | |
| | | | | | | | | | | |
• | Amort of Intangible Assets | | 5 | | 5 | | — | | | | |
| | | | | | | | | | | |
• | Interest | | 6 | | 7 | | -12 | | • | Lower debt | |
| | | | | | | | | | | |
• | Total | | $ | 488 | | $ | 544 | | -10 | | | | |
(1) Includes reclassification of revenue sharing payments from distribution plan payments to other promotion and servicing expense.
7
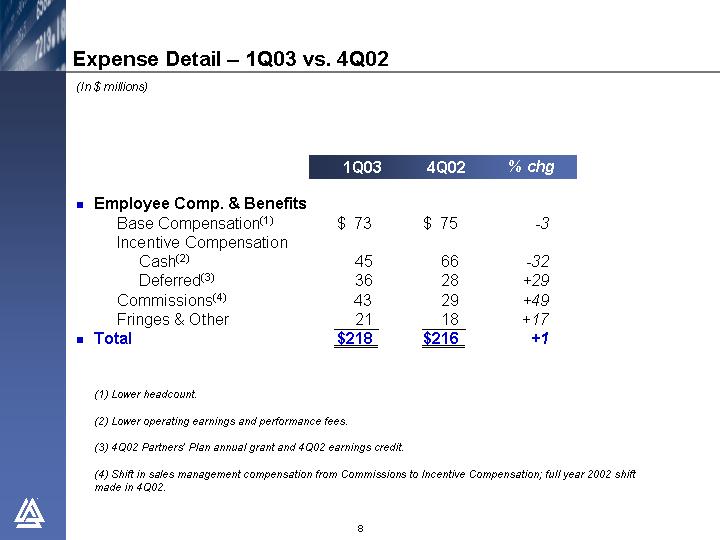
Expense Detail – 1Q03 vs. 4Q02
(In $ millions)
| | | 1Q03 | | 4Q02 | | % chg | |
• | Employee Comp. & Benefits | | | | | | | |
| Base Compensation(1) | | $ | 73 | | $ | 75 | | -3 | |
| Incentive Compensation | | | | | | | |
| Cash(2) | | 45 | | 66 | | -32 | |
| Deferred(3) | | 36 | | 28 | | +29 | |
| Commissions(4) | | 43 | | 29 | | +49 | |
| Fringes & Other | | 21 | | 18 | | +17 | |
• | Total | | $ | 218 | | $ | 216 | | +1 | |
(1) Lower headcount.
(2) Lower operating earnings and performance fees.
(3) 4Q02 Partners’ Plan annual grant and 4Q02 earnings credit.
(4) Shift in sales management compensation from Commissions to Incentive Compensation; full year 2002 shift made in 4Q02.
8
Expense Detail – 1Q03 vs. 4Q02
(In $ millions)
| | | 1Q03 | | 4Q02 | | % chg | | | Comments | |
| | | | | | | | | | | |
• | Employee Comp. & Benefits | | $ | 218 | | $ | 216 | | +1 | | | | |
| | | | | | | | | | | |
• | Promotion & Servicing | | | | | | | | | | |
| Distribution Plan Pmts(1) | | 89 | | 89 | | — | | | | |
| Amort of Def Sales Comm | | 53 | | 55 | | -4 | | | | |
| T & E | | 7 | | 12 | | -41 | 
| • | Ongoing reductions in controllable expenses | |
| Printing/Mailing | | 5 | | 2 | | +98 | |
| Other(1) | | 25 | | 25 | | -2 | | |
| | | 179 | | 183 | | -3 | | | | |
| | | | | | | | | | | |
• | General & Admin | | | | | | | | | | |
| Office Expense | | 41 | | 39 | | +6 | | • | Office consolidation | |
| Other | | 39 | | 45 | | -13 | | | | |
| | | 80 | | 84 | | -4 | | | | |
| | | | | | | | | | | |
• | Amort of Intangible Assets | | 5 | | 5 | | — | | | | |
| | | | | | | | | | | |
• | Interest | | 6 | | 6 | | +1 | | • | Lower debt | |
| | | | | | | | | | | |
• | Total | | $ | 488 | | $ | 494 | | -1 | | | | |
(1) Includes reclassification of revenue sharing payments from distribution plan payments to other promotion and servicing expense.
9
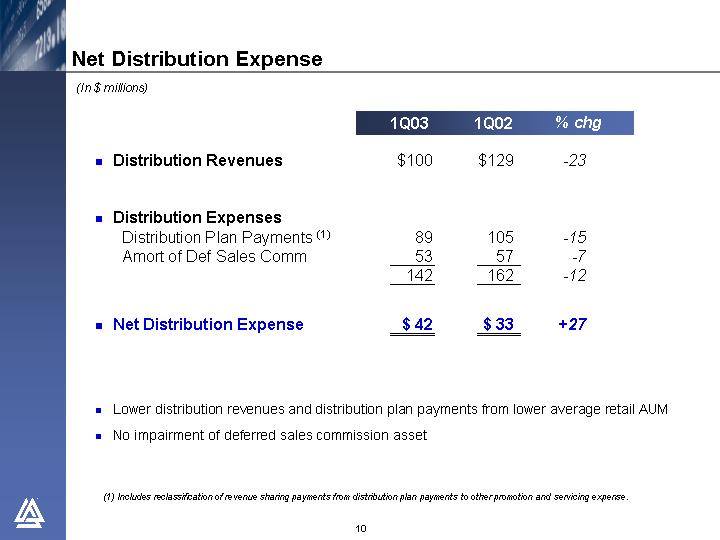
Net Distribution Expense
(In $ millions)
| | | 1Q03 | | 1Q02 | | % chg | |
| | | | | | | | |
• | Distribution Revenues | | $ | 100 | | $ | 129 | | -23 | |
| | | | | | | | |
• | Distribution Expenses | | | | | | | |
| Distribution Plan Payments(1) | | 89 | | 105 | | -15 | |
| Amort of Def Sales Comm | | 53 | | 57 | | -7 | |
| | | 142 | | 162 | | -12 | |
| | | | | | | | |
• | Net Distribution Expense | | $ | 42 | | $ | 33 | | +27 | |
• Lower distribution revenues and distribution plan payments from lower average retail AUM
• No impairment of deferred sales commission asset
(1) Includes reclassification of revenue sharing payments from distribution plan payments to other promotion and servicing expense.
10
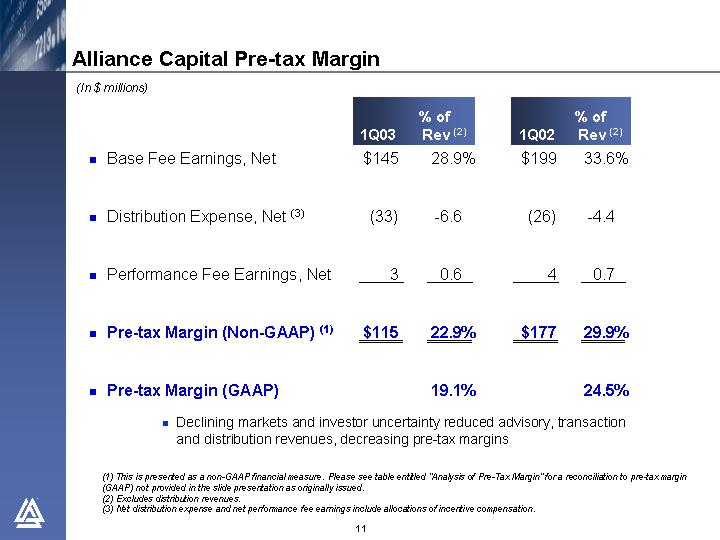
Alliance Capital Pre-tax Margin
(In $ millions)
| | | 1Q03 | | % of
Rev(1) | | 1Q02 | | % of
Rev(1) | |
| | | | | | | | | | |
• | Base Fee Earnings, Net | | $ | 145 | | 28.9 | % | $ | 199 | | 33.6 | % |
| | | | | | | | | | |
• | Distribution Expense, Net(3) | | (33 | ) | -6.6 | | (26 | ) | -4.4 | |
| | | | | | | | | | |
• | Performance Fee Earnings, Net | | 3 | | 0.6 | | 4 | | 0.7 | |
| | | | | | | | | | |
• | Pre-tax Margin (Non-GAAP) (1) | | $ | 115 | | 22.9 | % | $ | 177 | | 29.9 | % |
| | | | | | | | | | | | |
• | Pre-tax Margin (GAAP) | | | | | 19.1 | % | | | | 24.5 | % |
• Declining markets and investor uncertainty reduced advisory, transaction and distribution revenues, decreasing pre-tax margins
(1) This is presented as a non- GAAP financial measure. Please see table entitled “Analysis of Pre-Tax Margin” for a reconciliation to pre- tax margin (GAAP) not provided in the slide presentation as originally issued.
(2) Excludes distribution revenues.
(3) Net distribution expense and net performance fee earnings include allocations of incentive compensation.
11
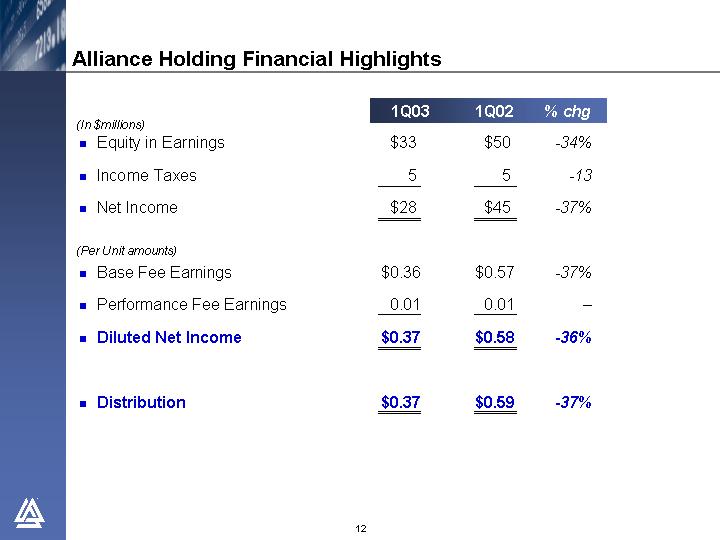
Alliance Holding Financial Highlights
| | | 1Q03 | | 1Q02 | | % chg | |
| | | | | | | | |
(In $ millions) | | | | | | | |
• | Equity in Earnings | | $ | 33 | | $ | 50 | | -34 | % |
| | | | | | | | |
• | Income Taxes | | 5 | | 5 | | -13 | |
| | | | | | | | |
• | Net Income | | $ | 28 | | $ | 45 | | -37 | % |
| | | | | | | | |
(Per Unit amounts) | | | | | | | |
• | Base Fee Earnings | | $ | 0.36 | | $ | 0.57 | | -37 | % |
| | | | | | | | |
• | Performance Fee Earnings | | 0.01 | | 0.01 | | — | |
| | | | | | | | |
• | Diluted Net Income | | $ | 0.37 | | $ | 0.58 | | -36 | % |
| | | | | | | | |
• | Distribution | | $ | 0.37 | | $ | 0.59 | | -37 | % |
12
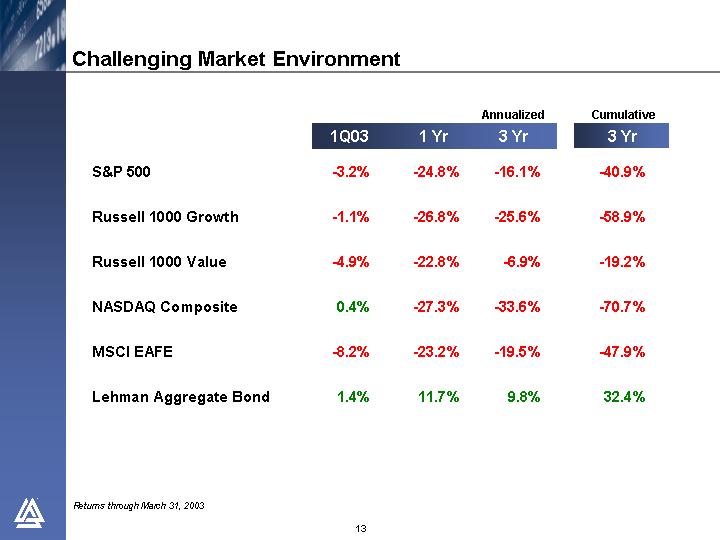
Challenging Market Environment
| | | | | | Annualized | | Cumulative | |
| | 1Q03 | | 1 Yr | | 3 Yr | | 3 Yr | |
| | | | | | | | | |
S&P 500 | | -3.2 | % | -24.8 | % | -16.1 | % | -40.9 | % |
| | | | | | | | | |
Russell 1000 Growth | | -1.1 | % | -26.8 | % | -25.6 | % | -58.9 | % |
| | | | | | | | | |
Russell 1000 Value | | -4.9 | % | -22.8 | % | -6.9 | % | -19.2 | % |
| | | | | | | | | |
NASDAQ Composite | | 0.4 | % | -27.3 | % | -33.6 | % | -70.7 | % |
| | | | | | | | | |
MSCI EAFE | | -8.2 | % | -23.2 | % | -19.5 | % | -47.9 | % |
| | | | | | | | | |
Lehman Aggregate Bond | | 1.4 | % | 11.7 | % | 9.8 | % | 32.4 | % |
Returns through March 31, 2003
13
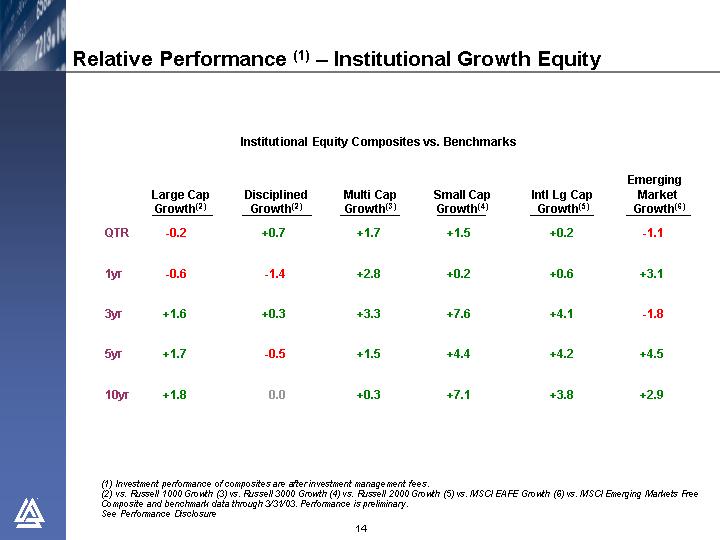
Relative Performance(1) – Institutional Growth Equity
Institutional Equity Composites vs. Benchmarks
| | Large Cap
Growth(2) | | Disciplined
Growth(2) | | Multi Cap
Growth(3) | | Small Cap
Growth(4) | | Intl Lg Cap
Growth(5) | | Emerging
Market
Growth(6) | |
| | | | | | | | | | | | | |
QTR | | -0.2 | | +0.7 | | +1.7 | | +1.5 | | +0.2 | | -1.1 | |
| | | | | | | | | | | | | |
1yr | | -0.6 | | -1.4 | | +2.8 | | +0.2 | | +0.6 | | +3.1 | |
| | | | | | | | | | | | | |
3yr | | +1.6 | | +0.3 | | +3.3 | | +7.6 | | +4.1 | | -1.8 | |
| | | | | | | | | | | | | |
5yr | | +1.7 | | -0.5 | | +1.5 | | +4.4 | | +4.2 | | +4.5 | |
| | | | | | | | | | | | | |
10yr | | +1.8 | | 0.0 | | +0.3 | | +7.1 | | +3.8 | | +2.9 | |
(1) Investment performance of composites are after investment management fees.
(2) vs. Russell 1000 Growth (3) vs. Russell 3000 Growth (4) vs. Russell 2000 Growth (5) vs. MSCI EAFE Growth (6) vs. MSCI Emerging Markets Free
Composite and benchmark data through 3/31/03. Performance is preliminary.
See Performance Disclosure
14
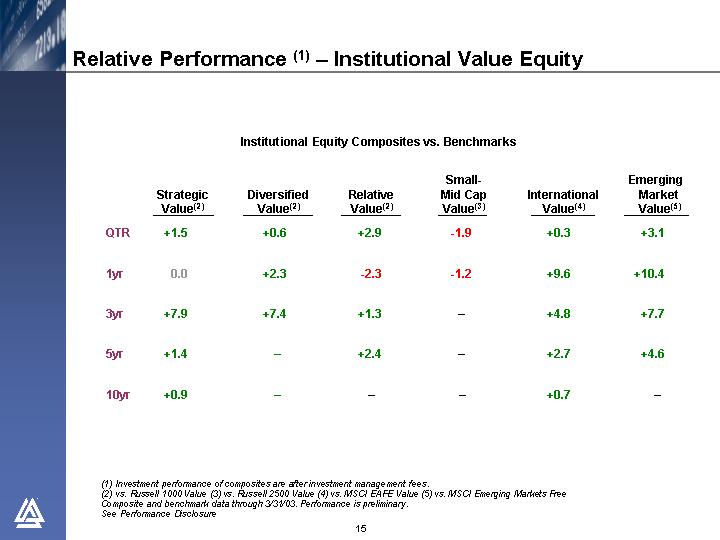
Relative Performance(1)– Institutional Value Equity
Institutional Equity Composites vs. Benchmarks
| | Strategic
Value(2) | | Diversified
Value(2) | | Relative
Value(2) | | Small-
Mid Cap
Value(3) | | International
Value(4) | | Emerging
Market
Value(5) | |
| | | | | | | | | | | | | |
QTR | | +1.5 | | +0.6 | | +2.9 | | -1.9 | | +0.3 | | +3.1 | |
| | | | | | | | | | | | | |
1yr | | 0.0 | | +2.3 | | -2.3 | | -1.2 | | +9.6 | | +10.4 | |
| | | | | | | | | | | | | |
3yr | | +7.9 | | +7.4 | | +1.3 | | — | | +4.8 | | +7.7 | |
| | | | | | | | | | | | | |
5yr | | +1.4 | | — | | +2.4 | | — | | +2.7 | | +4.6 | |
| | | | | | | | | | | | | |
10yr | | +0.9 | | — | | — | | — | | +0.7 | | — | |
(1) Investment performance of composites are after investment management fees.
(2) vs. Russell 1000 Value (3) vs. Russell 2500 Value (4) vs. MSCI EAFE Value (5) vs. MSCI Emerging Markets Free
Composite and benchmark data through 3/31/03. Performance is preliminary.
See Performance Disclosure
15
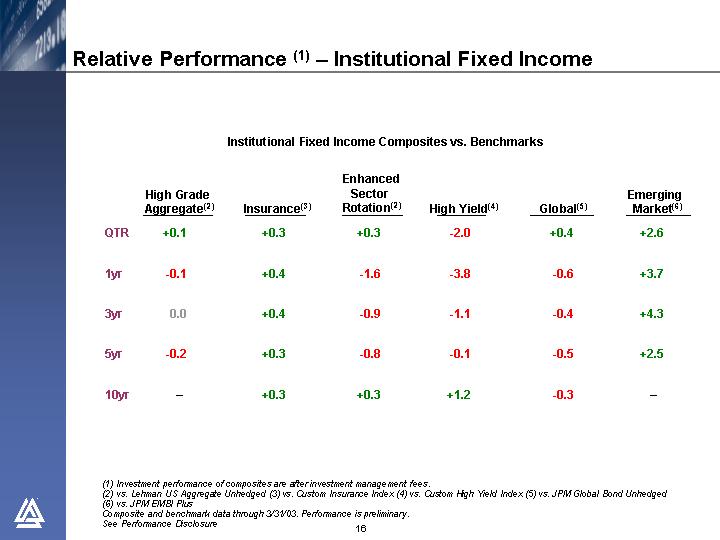
Relative Performance(1) – Institutional Fixed Income
Institutional Fixed Income Composites vs. Benchmarks
| | High Grade
Aggregate(2) | | Insurance(3) | | Enhanced
Sector
Rotation(2) | | High Yield(4) | | Global(5) | | Emerging
Market(6) | |
| | | | | | | | | | | | | |
QTR | | +0.1 | | +0.3 | | +0.3 | | -2.0 | | +0.4 | | +2.6 | |
| | | | | | | | | | | | | |
1yr | | -0.1 | | +0.4 | | -1.6 | | -3.8 | | -0.6 | | +3.7 | |
| | | | | | | | | | | | | |
3yr | | 0.0 | | +0.4 | | -0.9 | | -1.1 | | -0.4 | | +4.3 | |
| | | | | | | | | | | | | |
5yr | | -0.2 | | +0.3 | | -0.8 | | -0.1 | | -0.5 | | +2.5 | |
| | | | | | | | | | | | | |
10yr | | — | | +0.3 | | +0.3 | | +1.2 | | -0.3 | | — | |
(1) Investment performance of composites are after investment management fees.
(2) vs. Lehman US Aggregate Unhedged (3) vs. Custom Insurance Index (4) vs. Custom High Yield Index (5) vs. JPM Global Bond Unhedged (6) vs. JPM EMBI Plus
Composite and benchmark data through 3/31/03. Performance is preliminary.
See Performance Disclosure
16
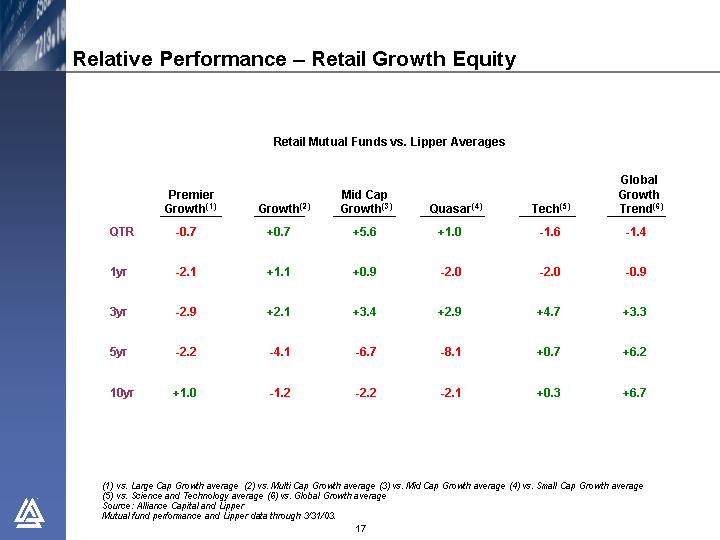
Relative Performance – Retail Growth Equity
Retail Mutual Funds vs. Lipper Averages
| | Premier
Growth(1) | | Growth(2) | | Mid Cap
Growth(3) | | Quasar(4) | | Tech(5) | | Global
Growth
Trend(6) | |
| | | | | | | | | | | | | |
QTR | | -0.7 | | +0.7 | | +5.6 | | +1.0 | | -1.6 | | -1.4 | |
| | | | | | | | | | | | | |
1yr | | -2.1 | | +1.1 | | +0.9 | | -2.0 | | -2.0 | | -0.9 | |
| | | | | | | | | | | | | |
3yr | | -2.9 | | +2.1 | | +3.4 | | +2.9 | | +4.7 | | +3.3 | |
| | | | | | | | | | | | | |
5yr | | -2.2 | | -4.1 | | -6.7 | | -8.1 | | +0.7 | | +6.2 | |
| | | | | | | | | | | | | |
10yr | | +1.0 | | -1.2 | | -2.2 | | -2.1 | | +0.3 | | +6.7 | |
(1) vs. Large Cap Growth average (2) vs. Multi Cap Growth average (3) vs. Mid Cap Growth average (4) vs. Small Cap Growth average (5) vs. Science and Technology average (6) vs. Global Growth average
Source: Alliance Capital and Lipper
Mutual fund performance and Lipper data through 3/31/03.
17
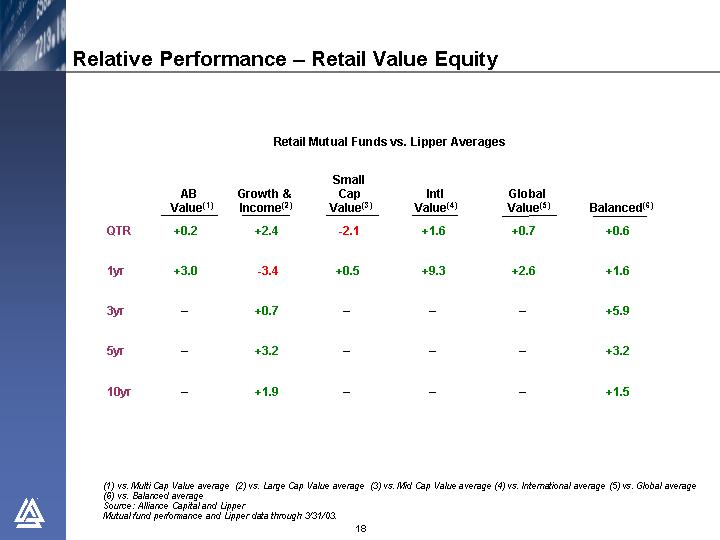
Relative Performance – Retail Value Equity
Retail Mutual Funds vs. Lipper Averages
| | AB
Value(1) | | Growth &
Income(2) | | Small
Cap
Value(3) | | Intl
Value(4) | | Global
Value(5) | | Balanced(6) | |
| | | | | | | | | | | | | |
QTR | | +0.2 | | +2.4 | | -2.1 | | +1.6 | | +0.7 | | +0.6 | |
| | | | | | | | | | | | | |
1yr | | +3.0 | | -3.4 | | +0.5 | | +9.3 | | +2.6 | | +1.6 | |
| | | | | | | | | | | | | |
3yr | | — | | +0.7 | | — | | — | | — | | +5.9 | |
| | | | | | | | | | | | | |
5yr | | — | | +3.2 | | — | | — | | — | | +3.2 | |
| | | | | | | | | | | | | |
10yr | | — | | +1.9 | | — | | — | | — | | +1.5 | |
(1) vs. Multi Cap Value average (2) vs. Large Cap Value average (3) vs. Mid Cap Value average (4) vs. International average (5) vs. Global average (6) vs. Balanced average
Source: Alliance Capital and Lipper
Mutual fund performance and Lipper data through 3/31/03.
18
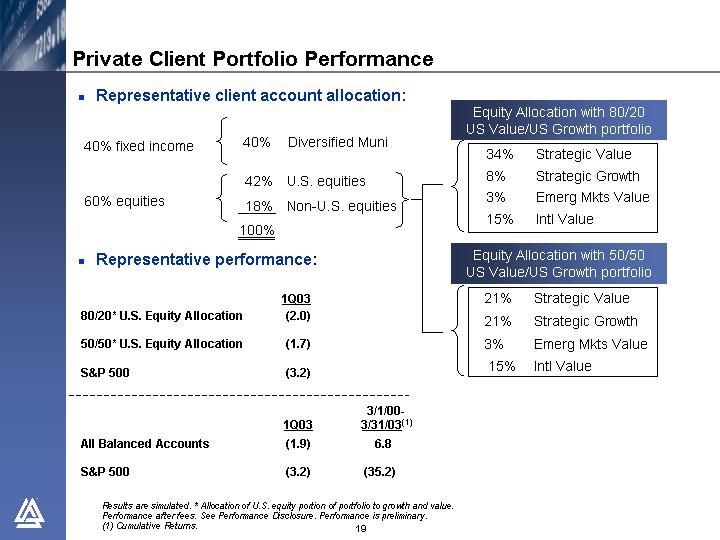
Private Client Portfolio Performance
• Representative client account allocation:
| 
| | | | | | | | | Equity Allocation with 80/20
US Value/US Growth portfolio | |
40% fixed income | | 40 | % | Diversified Muni | | | | | | |
| | | | | | | 
| 34% | Strategic Value | |
| | | | | | | 
| 8% | Strategic Growth | |
| 
| | 42 | % | U.S. equities | 
| 3% | Emerg Mkts Value | |
60% equities | | 18 | % | Non-U.S. equities | 15% | Intl Value | |
| | | 100 | % | | | | | | |
| | | | | | | | | | |
| | | | | | | | | Equity Allocation with 50/50
US Value/US Growth portfolio | |
| | | | | | | 
| 21% | Strategic Value | |
| | | | | | | 21% | Strategic Growth | |
| | | | | | | | 3% | Emerg Mkts Value | |
| | | | | | | | 15% | Intl Value | |
| | | | | | | | | | | | |
• Representative performance:
| | 1Q03 | |
80/20* U.S. Equity Allocation | | (2.0 | ) |
| | | |
50/50* U.S. Equity Allocation | | (1.7 | ) |
| | | |
S&P 500 | | (3.2 | ) |
| | 1Q03 | | 3/1/00-
3/31/03(1) | |
All Balanced Accounts | | (1.9 | ) | 6.8 | |
| | | | | |
S&P 500 | | (3.2 | ) | (35.2 | ) |
Results are simulated. * Allocation of U.S. equity portion of portfolio to growth and value. Performance after fees. See Performance Disclosure. Performance is preliminary.
(1) Cumulative Returns.
19
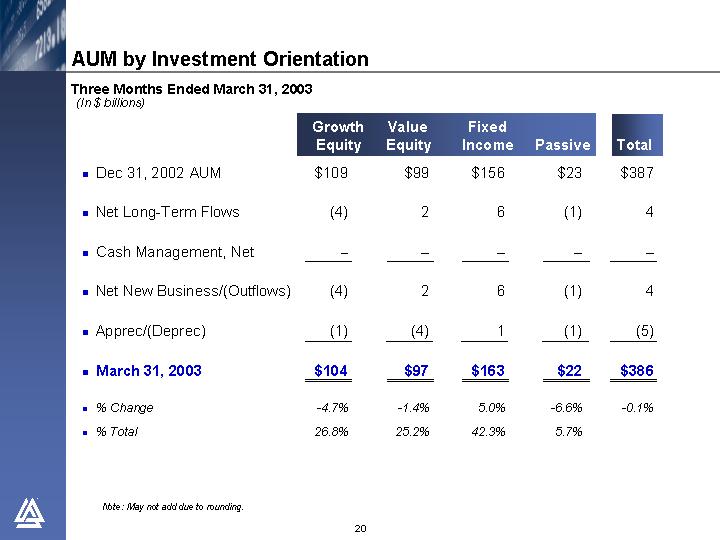
AUM by Investment Orientation
Three Months Ended March 31, 2003
(In $ billions)
| | | Growth
Equity | | Value
Equity | | Fixed
Income | | Passive | | Total | |
• | Dec 31, 2002 AUM | | $ | 109 | | $ | 99 | | $ | 156 | | $ | 23 | | $ | 387 | |
| | | | | | | | | | | | |
• | Net Long-Term Flows | | (4 | ) | 2 | | 6 | | (1 | ) | 4 | |
| | | | | | | | | | | | |
• | Cash Management, Net | | — | | — | | — | | — | | — | |
| | | | | | | | | | | | |
• | Net New Business/(Outflows) | | (4 | ) | 2 | | 6 | | (1 | ) | 4 | |
| | | | | | | | | | | | |
• | Apprec/(Deprec) | | (1 | ) | (4 | ) | 1 | | (1 | ) | (5 | ) |
| | | | | | | | | | | | |
• | March 31, 2003 | | $ | 104 | | $ | 97 | | $ | 163 | | $ | 22 | | $ | 386 | |
| | | | | | | | | | | | |
• | % Change | | -4.7 | % | -1.4 | % | 5.0 | % | -6.6 | % | -0.1 | % |
| | | | | | | | | | | | |
• | % Total | | 26.8 | % | 25.2 | % | 42.3 | % | 5.7 | % | | |
Note: May not add due to rounding.
20
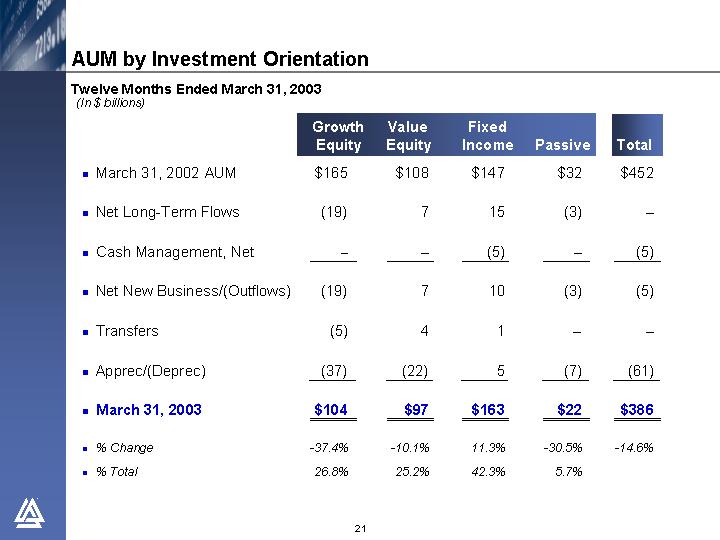
AUM by Investment Orientation
Twelve Months Ended March 31, 2003
(In $ billions)
| | | Growth
Equity | | Value
Equity | | Fixed
Income | | Passive | | Total | |
• | March 31, 2002 AUM | | $ | 165 | | $ | 108 | | $ | 147 | | $ | 32 | | $ | 452 | |
| | | | | | | | | | | | |
• | Net Long-Term Flows | | (19 | ) | 7 | | 15 | | (3 | ) | — | |
| | | | | | | | | | | | |
• | Cash Management, Net | | — | | — | | (5 | ) | — | | (5 | ) |
| | | | | | | | | | | | |
• | Net New Business/(Outflows) | | (19 | ) | 7 | | 10 | | (3 | ) | (5 | ) |
| | | | | | | | | | | | |
• | Transfers | | (5 | ) | 4 | | 1 | | — | | — | |
| | | | | | | | | | | | |
• | Apprec/(Deprec) | | (37 | ) | (22 | ) | 5 | | (7 | ) | (61 | ) |
| | | | | | | | | | | | |
• | March 31, 2003 | | $ | 104 | | $ | 97 | | $ | 163 | | $ | 22 | | $ | 386 | |
| | | | | | | | | | | | |
• | % Change | | -37.4 | % | -10.1 | % | 11.3 | % | -30.5 | % | -14.6 | % |
| | | | | | | | | | | | |
• | % Total | | 26.8 | % | 25.2 | % | 42.3 | % | 5.7 | % | | |
21
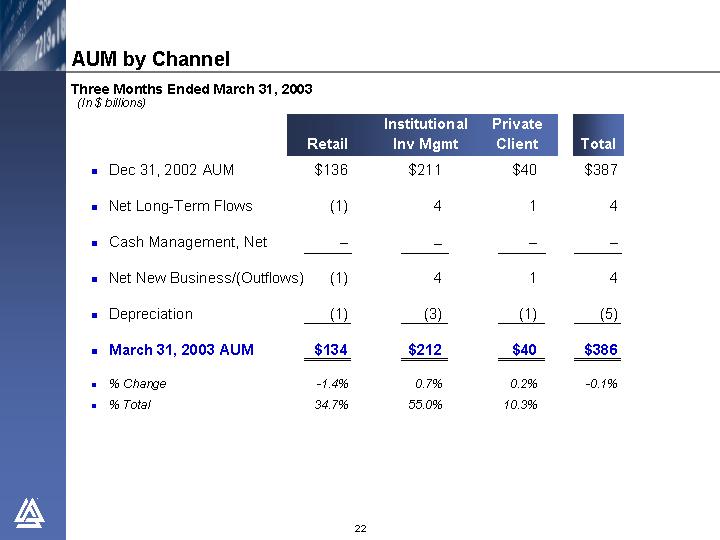
AUM by Channel
Three Months Ended March 31, 2003
(In $ billions)
| | | Retail | | Institutional
Inv Mgmt | | Private
Client | | Total | |
• | Dec 31, 2002 AUM | | $ | 136 | | $ | 211 | | $ | 40 | | $ | 387 | |
| | | | | | | | | | |
• | Net Long-Term Flows | | (1 | ) | 4 | | 1 | | 4 | |
| | | | | | | | | | |
• | Cash Management, Net | | — | | — | | — | | — | |
| | | | | | | | | | |
• | Net New Business/(Outflows) | | (1 | ) | 4 | | 1 | | 4 | |
| | | | | | | | | | |
• | Depreciation | | (1 | ) | (3 | ) | (1 | ) | (5 | ) |
| | | | | | | | | | |
• | March 31, 2003 AUM | | $ | 134 | | $ | 212 | | $ | 40 | | $ | 386 | |
| | | | | | | | | | |
• | % Change | | -1.4 | % | 0.7 | % | 0.2 | % | -0.1 | % |
• | % Total | | 34.7 | % | 55.0 | % | 10.3 | % | | |
22
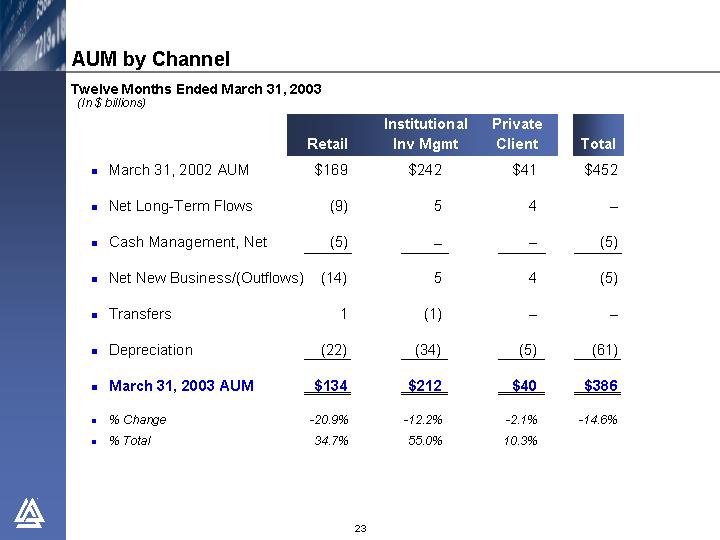
AUM by Channel
Twelve Months Ended March 31, 2003
(In $ billions)
| | | Retail | | Institutional
Inv Mgmt | | Private
Client | | Total | |
• | March 31, 2002 AUM | | $ | 169 | | $ | 242 | | $ | 41 | | $ | 452 | |
| | | | | | | | | | |
• | Net Long-Term Flows | | (9 | ) | 5 | | 4 | | — | |
| | | | | | | | | | |
• | Cash Management, Net | | (5 | ) | — | | — | | (5 | ) |
| | | | | | | | | | |
• | Net New Business/(Outflows) | | (14 | ) | 5 | | 4 | | (5 | ) |
| | | | | | | | | | |
• | Transfers | | 1 | | (1 | ) | — | | — | |
| | | | | | | | | | |
• | Depreciation | | (22 | ) | (34 | ) | (5 | ) | (61 | ) |
| | | | | | | | | | |
• | March 31, 2003 AUM | | $ | 134 | | $ | 212 | | $ | 40 | | $ | 386 | |
| | | | | | | | | | |
• | % Change | | -20.9 | % | -12.2 | % | -2.1 | % | -14.6 | % |
• | % Total | | 34.7 | % | 55.0 | % | 10.3 | % | | |
23
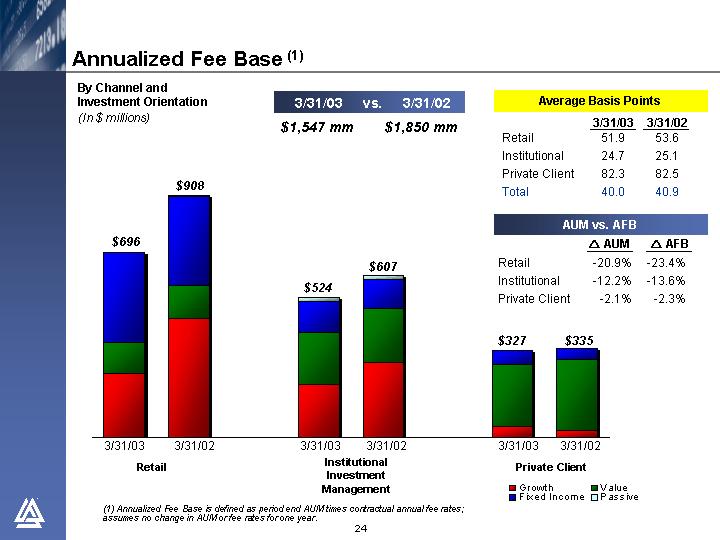
Annualized Fee Base(1)
By Channel and | | 3/31/03 vs. 3/31/02 | | Average Basis Points | |
Investment Orientation | | | | | | | | | |
(In $millions) | | $1,547 mm $1,850 mm | | | | 3/31/03 | | 3/31/02 | |
| | | | Retail | | 51.9 | | 53.6 | |
| | | | Institutional | | 24.7 | | 25.1 | |
| | | | Private Client | | 82.3 | | 82.5 | |
| | | | Total | | 40.0 | | 40.9 | |
| | | | | | | | | |
| | | | AUM vs. AFB | |
| | | | | |
| | | | | | D AUM | | D AFB | |
| | | | Retail | | -20.9 | % | -23.4 | % |
| | | | Institutional | | -12.2 | % | -13.6 | % |
| | | | Private Client | | -2.1 | % | -2.3 | % |
[CHART]
(1) Annualized Fee Base is defined as period end AUM times contractual annual fee rates; assumes no change in AUM or fee rates for one year.
24
1Q03 Business Channel Highlights
Retail
• Rebranded business to AllianceBernstein Investment Research and Management
• Reflects complete product array: growth, value, fixed income and blends
• Signals shift toward consultative selling with focus on client solutions as well as product sales
• Two year anniversary of AllianceBernstein value fund series with over $2 billion in AUM
Institutional Investment Management
• Announced new business of $9.0 billion
• Wins across all major investment services with particular strength in global value and fixed income
• 65% of wins from overseas clients
25
1Q03 Business Channel Highlights
Private Client
• Organic growth consistent at approximately 10%
• Trend to larger account size is intact
• Approximately 50% of wins in $10 million + accounts
• Portfolio exposures to growth and hedge funds continue to build
• Remain focused on productivity
Institutional Research Services
• Weak January and February as addressable market declined
• Adjusted for program trading, market share was relatively stable
• 2003 survey of U.S. institutional analysts and portfolio managers reinforces view that the brand is strong
• #1 in “Overall Research Quality”, #1 in “Product Quality”, and #1 in “Analyst Service Quality”
• Significantly improved sales and service profile
26
Total Return – Alliance Holding Units
Total Annualized Return*
[CHART]
* As of 3/31/03. Alliance Holding and S&P returns include reinvestment of cash distributions and dividends, respectively.
** Since IPO 4/88.
27
Positioned For Growth
• Worldwide research and investment capabilities
• Unique with strengths in both growth and value equity investing
• Broad array of fixed income services
• Generally competitive long-term investment results
• Highly regarded marketing and client service teams
• Well-positioned in retail, institutional and private client channels
• Highly valued independent sell-side research and institutional trading
• Strong financials
• Cogent strategy
28
[LOGO]
29
Reconciliation of Net Operating Earnings from Net Income
(In $ millions, except per unit amounts)
| | 1Q03 | | 1Q02 | |
Alliance Capital | | | | | |
| | | | | |
• Net Income | | $ | 109 | | $ | 168 | |
| | | | | |
• Amortization of Intangible Assets | | 5 | | 5 | |
| | | | | |
• Net Operating Earnings | | $ | 114 | | $ | 173 | |
| | | | | |
Alliance Holding | | | | | |
(per unit amounts) | | | | | |
| | | | | |
• Diluted Net Income | | $ | 0.37 | | $ | 0.58 | |
| | | | | |
• Amortization of Intangible Assets | | 0.02 | | 0.02 | |
| | | | | |
• Net Operating Earnings | | $ | 0.39 | | $ | 0.60 | |
Net Operating Earnings (non-GAAP financial measure): Net Income excluding amortization of intangible assets.
30
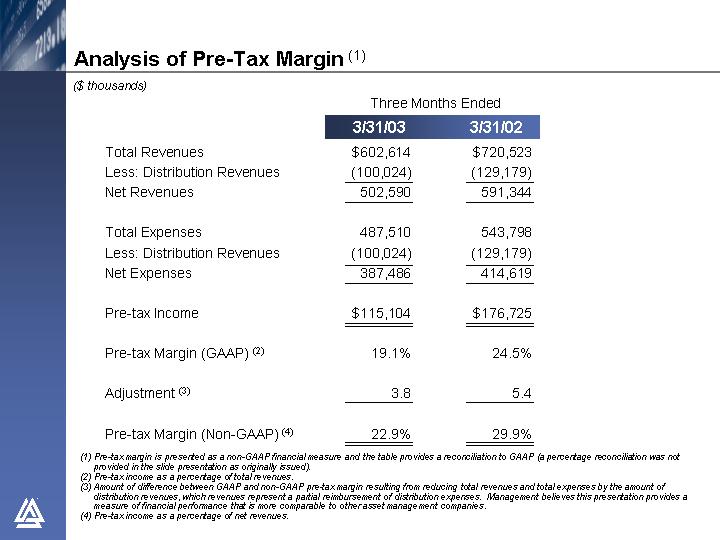
Analysis of Pre-Tax Margin (1)
($ thousands)
| | Three Months Ended | |
| | 3/31/03 | | 3/31/02 | |
Total Revenues | | $ | 602,614 | | $ | 720,523 | |
Less: Distribution Revenues | | (100,024 | ) | (129,179 | ) |
Net Revenues | | 502,590 | | 591,344 | |
| | | | | |
Total Expenses | | 487,510 | | 543,798 | |
Less: Distribution Revenues | | (100,024 | ) | (129,179 | ) |
Net Expenses | | 387,486 | | 414,619 | |
| | | | | |
Pre- tax Income | | $ | 115,104 | | $ | 176,725 | |
| | | | | |
Pre-tax Margin (GAAP) (2) | | 19.1 | % | 24.5 | % |
| | | | | |
Adjustment (3) | | 3.8 | | 5.4 | |
| | | | | |
Pre-tax Margin (Non-GAAP) (4) | | 22.9 | % | 29.9 | % |
(1) Pre-tax margin is presented as a non-GAAP financial measure and the table provides a reconciliation to GAAP (a percentage reconciliation was not provided in the slide presentation as originally issued).
(2) Pre-tax income as a percentage of total revenues.
(3) Amount of difference between GAAP and non-GAAP pre-tax margin resulting from reducing total revenues and total expenses by the amount of distribution revenues, which revenues represent a partial reimbursement of distribution expenses. Management believes this presentation provides a measure of financial performance that is more comparable to other asset management companies.
(4) Pre-tax income as a percentage of net revenues.
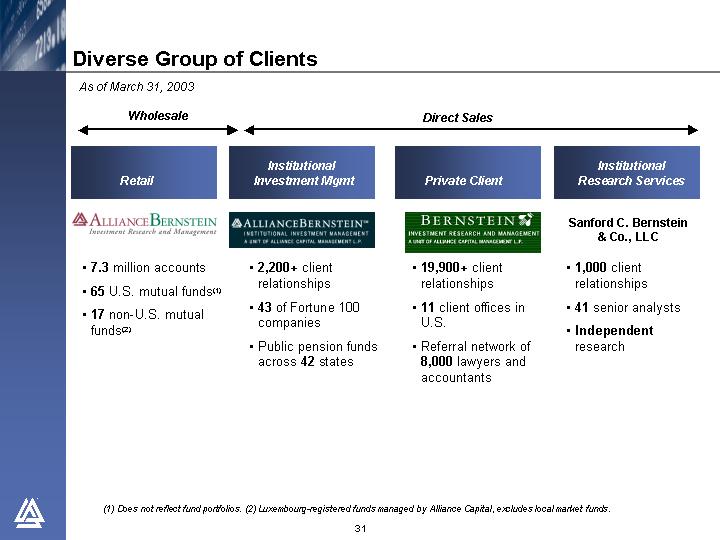
Diverse Group of Clients
As of March 31, 2003
Wholesale | | Direct Sales | |
| | | | | | | |
Retail | | Institutional Investment Mgmt | | Private Client | | Institutional Research Services | |
| | | | | | | |
[LOGO] | | [LOGO] | | [LOGO] | | Sanford C. Bernstein & Co., LLC | |
| | | | | | | |
• 7.3 million accounts | | • 2,200+ client relationships | | • 19,900+ client relationships | | • 1,000 client relationships | |
| | | | | | | |
• 65 U.S. mutual funds(1) | | • 43 of Fortune 100 companies | | • 11 client offices in U.S. | | • 41 senior analysts | |
| | | | | | | |
• 17 non-U.S. mutual funds(2) | | • Public pension funds across 42 states | | • Referral network of 8,000 lawyers and accountants | | • Independent research | |
| | | | | | | | |
(1) Does not reflect fund portfolios. (2) Luxembourg-registered funds managed by Alliance Capital, excludes local market funds.
31
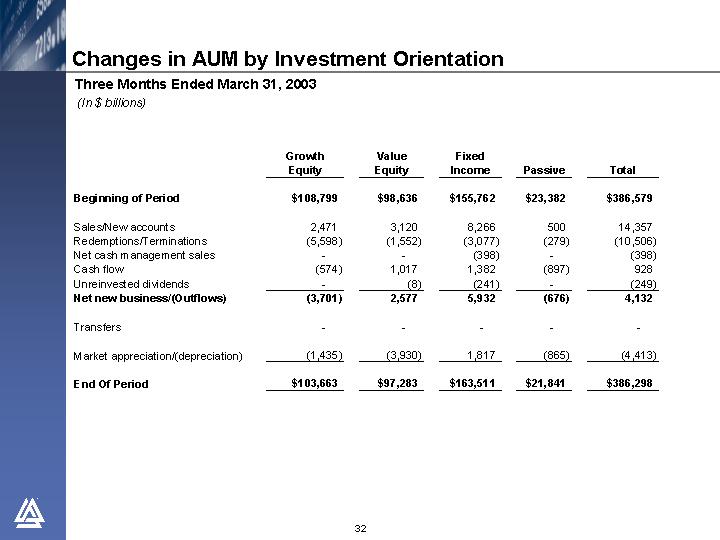
Changes in AUM by Investment Orientation
Three Months Ended March 31, 2003
(In $ billions)
| | Growth Equity | | Value Equity | | Fixed Income | | Passive | | Total | |
| | | | | | | | | | | |
Beginning of Period | | $ | 108,799 | | $ | 98,636 | | $ | 155,762 | | $ | 23,382 | | $ | 386,579 | |
| | | | | | | | | | | |
Sales/New accounts | | 2,471 | | 3,120 | | 8,266 | | 500 | | 14,357 | |
Redemptions/Terminations | | (5,598 | ) | (1,552 | ) | (3,077 | ) | (279 | ) | (10,506 | ) |
Net cash management sales | | — | | — | | (398 | ) | — | | (398 | ) |
Cash flow | | (574 | ) | 1,017 | | 1,382 | | (897 | ) | 928 | |
Unreinvested dividends | | — | | (8 | ) | (241 | ) | — | | (249 | ) |
Net new business/(Outflows) | | (3,701 | ) | 2,577 | | 5,932 | | (676 | ) | 4,132 | |
| | | | | | | | | | | |
Transfers | | — | | — | | — | | — | | — | |
| | | | | | | | | | | |
Market appreciation/(depreciation) | | (1,435 | ) | (3,930 | ) | 1,817 | | (865 | ) | (4,413 | ) |
| | | | | | | | | | | |
End Of Period | | $ | 103,663 | | $ | 97,283 | | $ | 163,511 | | $ | 21,841 | | $ | 386,298 | |
32
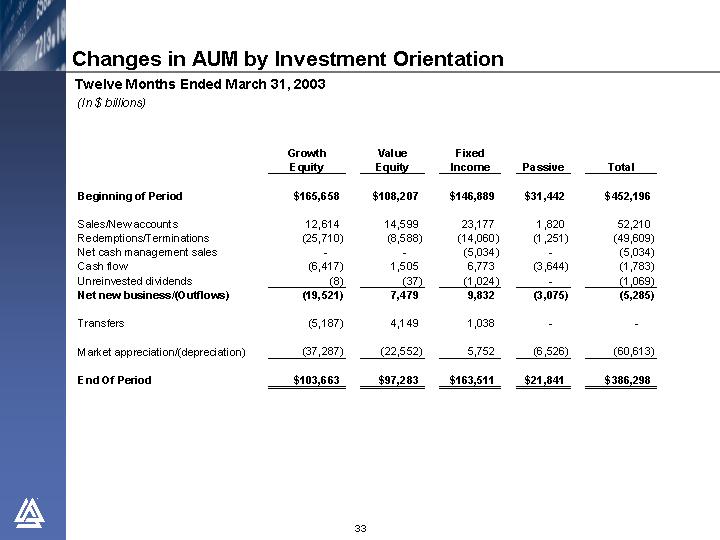
Changes in AUM by Investment Orientation
Twelve Months Ended March 31, 2003
(In $ billions)
| | Growth Equity | | Value Equity | | Fixed Income | | Passive | | Total | |
| | | | | | | | | | | |
Beginning of Period | | $ | 165,658 | | $ | 108,207 | | $ | 146,889 | | $ | 31,442 | | $ | 452,196 | |
| | | | | | | | | | | |
Sales/New accounts | | 12,614 | | 14,599 | | 23,177 | | 1,820 | | 52,210 | |
Redemptions/Terminations | | (25,710 | ) | (8,588 | ) | (14,060 | ) | (1,251 | ) | (49,609 | ) |
Net cash management sales | | — | | — | | (5,034 | ) | — | | (5,034 | ) |
Cash flow | | (6,417 | ) | 1,505 | | 6,773 | | (3,644 | ) | (1,783 | ) |
Unreinvested dividends | | (8 | ) | (37 | ) | (1,024 | ) | — | | (1,069 | ) |
Net new business/(Outflows) | | (19,521 | ) | 7,479 | | 9,832 | | (3,075 | ) | (5,285 | ) |
| | | | | | | | | | | |
Transfers | | (5,187 | ) | 4,149 | | 1,038 | | — | | — | |
| | | | | | | | | | | |
Market appreciation/(depreciation) | | (37,287 | ) | (22,552 | ) | 5,752 | | (6,526 | ) | (60,613 | ) |
| | | | | | | | | | | |
End Of Period | | $ | 103,663 | | $ | 97,283 | | $ | 163,511 | | $ | 21,841 | | $ | 386,298 | |
33
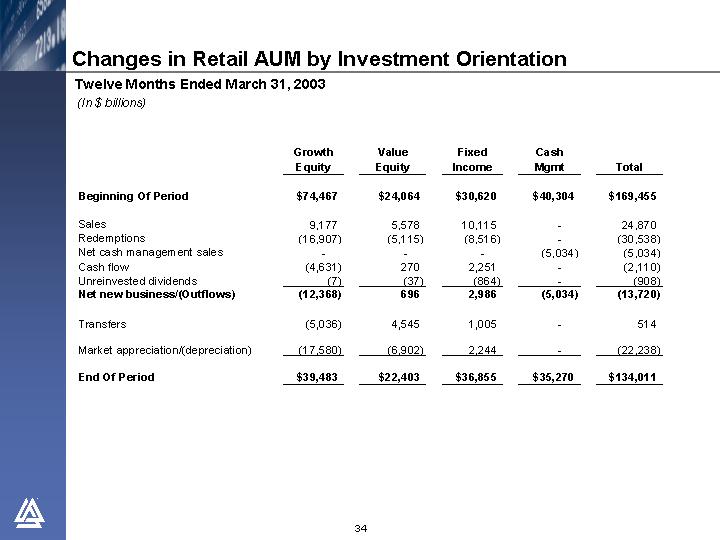
Changes in Retail AUM by Investment Orientation
Twelve Months Ended March 31, 2003
(In $ billions)
| | Growth Equity | | Value Equity | | Fixed Income | | Cash Mgmt | | Total | |
| | | | | | | | | | | |
Beginning Of Period | | $ | 74,467 | | $ | 24,064 | | $ | 30,620 | | $ | 40,304 | | $ | 169,455 | |
| | | | | | | | | | | |
Sales | | 9,177 | | 5,578 | | 10,115 | | — | | 24,870 | |
Redemptions | | (16,907 | ) | (5,115 | ) | (8,516 | ) | — | | (30,538 | ) |
Net cash management sales | | — | | — | | — | | (5,034 | ) | (5,034 | ) |
Cash flow | | (4,631 | ) | 270 | | 2,251 | | — | | (2,110 | ) |
Unreinvested dividends | | (7 | ) | (37 | ) | (864 | ) | — | | (908 | ) |
Net new business/(Outflows) | | (12,368 | ) | 696 | | 2,986 | | (5,034 | ) | (13,720 | ) |
| | | | | | | | | | | |
Transfers | | (5,036 | ) | 4,545 | | 1,005 | | — | | 514 | |
| | | | | | | | | | | |
Market appreciation/(depreciation) | | (17,580 | ) | (6,902 | ) | 2,244 | | — | | (22,238 | ) |
| | | | | | | | | | | |
End Of Period | | $ | 39,483 | | $ | 22,403 | | $ | 36,855 | | $ | 35,270 | | $ | 134,011 | |
34
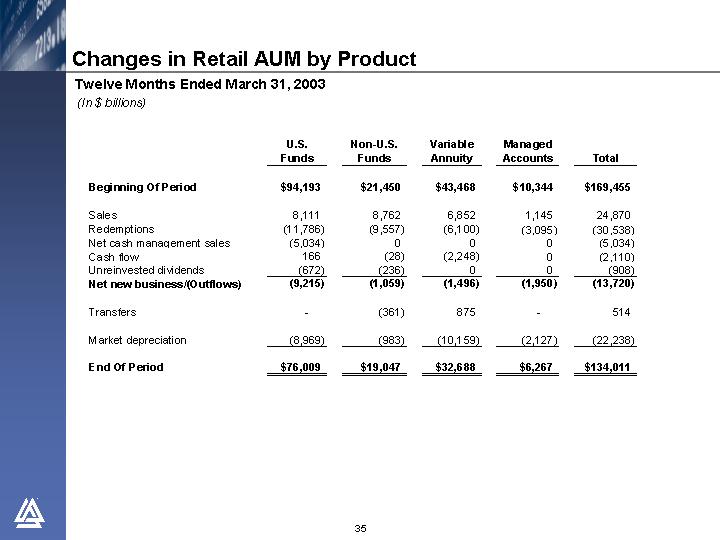
Changes in Retail AUM by Product
Twelve Months Ended March 31, 2003
(In $ billions)
| | U.S. Funds | | Non-U.S. Funds | | Variable Annuity | | Managed Accounts | | Total | |
| | | | | | | | | | | |
Beginning Of Period | | $ | 94,193 | | $ | 21,450 | | $ | 43,468 | | $ | 10,344 | | $ | 169,455 | |
| | | | | | | | | | | |
Sales | | 8,111 | | 8,762 | | 6,852 | | 1,145 | | 24,870 | |
Redemptions | | (11,786 | ) | (9,557 | ) | (6,100 | ) | (3,095 | ) | (30,538 | ) |
Net cash management sales | | (5,034 | ) | 0 | | 0 | | 0 | | (5,034 | ) |
Cash flow | | 166 | | (28 | ) | (2,248 | ) | 0 | | (2,110 | ) |
Unreinvested dividends | | (672 | ) | (236 | ) | 0 | | 0 | | (908 | ) |
Net new business/(Outflows) | | (9,215 | ) | (1,059 | ) | (1,496 | ) | (1,950 | ) | (13,720 | ) |
| | | | | | | | | | | |
Transfers | | — | | (361 | ) | 875 | | — | | 514 | |
| | | | | | | | | | | |
Market depreciation | | (8,969 | ) | (983 | ) | (10,159 | ) | (2,127 | ) | (22,238 | ) |
| | | | | | | | | | | |
End Of Period | | $ | 76,009 | | $ | 19,047 | | $ | 32,688 | | $ | 6,267 | | $ | 134,011 | |
35
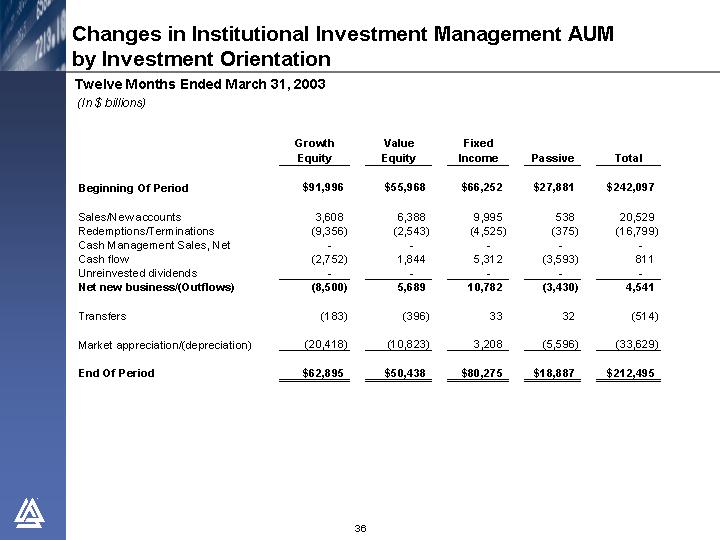
Changes in Institutional Investment Management AUM by Investment Orientation
Twelve Months Ended March 31, 2003
(In $ billions)
| | Growth Equity | | Value Equity | | Fixed Income | | Passive | | Total | |
| | | | | | | | | | | |
Beginning Of Period | | $ | 91,996 | | $ | 55,968 | | $ | 66,252 | | $ | 27,881 | | $ | 242,097 | |
| | | | | | | | | | | |
Sales/New accounts | | 3,608 | | 6,388 | | 9,995 | | 538 | | 20,529 | |
Redemptions/Terminations | | (9,356 | ) | (2,543 | ) | (4,525 | ) | (375 | ) | (16,799 | ) |
Cash Management Sales, Net | | — | | — | | — | | — | | — | |
Cash flow | | (2,752 | ) | 1,844 | | 5,312 | | (3,593 | ) | 811 | |
Unreinvested dividends | | — | | — | | — | | — | | — | |
Net new business/(Outflows) | | (8,500 | ) | 5,689 | | 10,782 | | (3,430 | ) | 4,541 | |
| | | | | | | | | | | |
Transfers | | (183 | ) | (396 | ) | 33 | | 32 | | (514 | ) |
| | | | | | | | | | | |
Market appreciation/(depreciation) | | (20,418 | ) | (10,823 | ) | 3,208 | | (5,596 | ) | (33,629 | ) |
| | | | | | | | | | | |
End Of Period | | $ | 62,895 | | $ | 50,438 | | $ | 80,275 | | $ | 18,887 | | $ | 212,495 | |
36
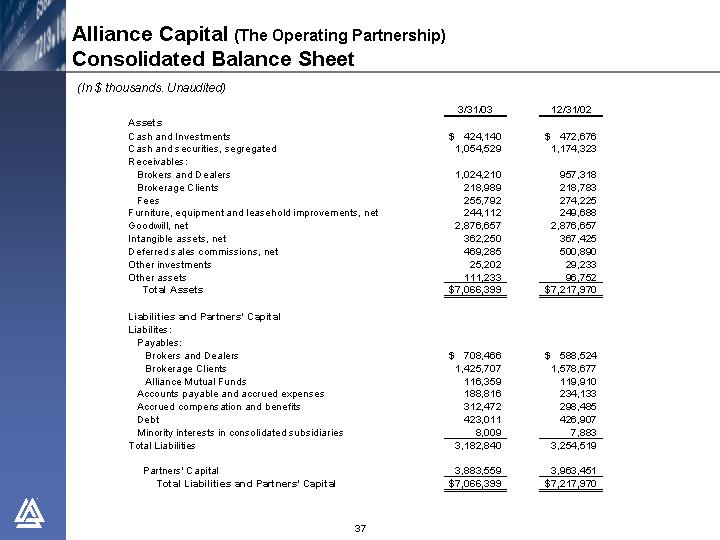
Alliance Capital (The Operating Partnership)
Consolidated Balance Sheet
(In $ thousands. Unaudited)
| | 3/31/03 | | 12/31/02 | |
Assets | | | | | |
Cash and Investments | | $ | 424,140 | | $ | 472,676 | |
Cash and securities, segregated | | 1,054,529 | | 1,174,323 | |
Receivables: | | | | | |
Brokers and Dealers | | 1,024,210 | | 957,318 | |
Brokerage Clients | | 218,989 | | 218,783 | |
Fees | | 255,792 | | 274,225 | |
Furniture, equipment and leasehold improvements, net | | 244,112 | | 249,688 | |
Goodwill, net | | 2,876,657 | | 2,876,657 | |
Intangible assets, net | | 362,250 | | 367,425 | |
Deferred sales commissions, net | | 469,285 | | 500,890 | |
Other investments | | 25,202 | | 29,233 | |
Other assets | | 111,233 | | 96,752 | |
Total Assets | | $ | 7,066,399 | | $ | 7,217,970 | |
| | | | | |
Liabilities and Partners’ Capital | | | | | |
Liabilites: | | | | | |
Payables: | | | | | |
Brokers and Dealers | | $ | 708,466 | | $ | 588,524 | |
Brokerage Clients | | 1,425,707 | | 1,578,677 | |
Alliance Mutual Funds | | 116,359 | | 119,910 | |
Accounts payable and accrued expenses | | 188,816 | | 234,133 | |
Accrued compensation and benefits | | 312,472 | | 298,485 | |
Debt | | 423,011 | | 426,907 | |
Minority interests in consolidated subsidiaries | | 8,009 | | 7,883 | |
Total Liabilities | | 3,182,840 | | 3,254,519 | |
| | | | | |
Partners’ Capital | | 3,883,559 | | 3,963,451 | |
Total Liabilities and Partners’ Capital | | $ | 7,066,399 | | $ | 7,217,970 | |
37
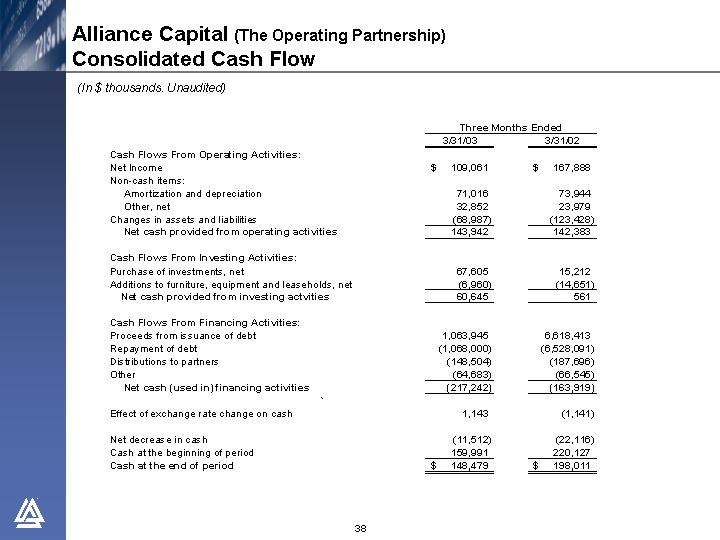
Alliance Capital (The Operating Partnership)
Consolidated Cash Flow
(In $ thousands. Unaudited)
| | Three Months Ended | |
| | 3/31/03 | | 3/31/02 | |
Cash Flows From Operating Activities: | | | | | |
Net Income | | $ | 109,061 | | $ | 167,888 | |
Non-cash items: | | | | | |
Amortization and depreciation | | 71,016 | | 73,944 | |
Other, net | | 32,852 | | 23,979 | |
Changes in assets and liabilities | | (68,987 | ) | (123,428 | ) |
Net cash provided from operating activities | | 143,942 | | 142,383 | |
| | | | | |
Cash Flows From Investing Activities: | | | | | |
Purchase of investments, net | | 67,605 | | 15,212 | |
Additions to furniture, equipment and leaseholds, net | | (6,960 | ) | (14,651 | ) |
Net cash provided from investing actvities | | 60,645 | | 561 | |
| | | | | |
Cash Flows From Financing Activities: | | | | | |
Proceeds from issuance of debt | | 1,063,945 | | 6,618,413 | |
Repayment of debt | | (1,068,000 | ) | (6,528,091 | ) |
Distributions to partners | | (148,504 | ) | (187,696 | ) |
Other | | (64,683 | ) | (66,545 | ) |
Net cash (used in) financing activities | | (217,242 | ) | (163,919 | ) |
| | | | | |
Effect of exchange rate change on cash | | 1,143 | | (1,141 | ) |
| | | | | |
Net decrease in cash | | (11,512 | ) | (22,116 | ) |
Cash at the beginning of period | | 159,991 | | 220,127 | |
Cash at the end of period | | $ | 148,479 | | $ | 198,011 | |
38
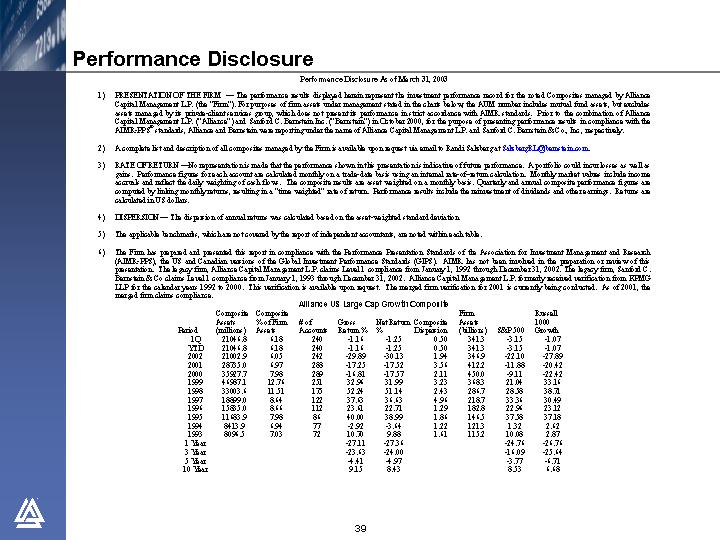
Performance Disclosure
Performance Disclosure As of March 31, 2003
1) PRESENTATION OF THE FIRM – The performance results displayed herein represent the investment performance record for the noted Composites managed by Alliance Capital Management L.P. (the “Firm”). For purposes of firm assets under management stated in the charts below, the AUM number includes mutual fund assets, but excludes assets managed by its private-client services group, which does not present its performance in strict accordance with AIMR standards. Prior to the combination of Alliance Capital Management L.P. (“Alliance”) and Sanford C. Bernstein Inc. (“Bernstein”) in October 2000, for the purpose of presenting performance results in compliance with the AIMR-PPS® standards, Alliance and Bernstein were reporting under the name of Alliance Capital Management L.P. and Sanford C. Bernstein & Co., Inc., respectively.
2) A complete list and description of all composites managed by the Firm is available upon request via email to Randi Salzberg at SalzbergRL@bernstein.com.
3) RATE OF RETURN –No representation is made that the performance shown in this presentation is indicative of future performance. A portfolio could incur losses as well as gains. Performance figures for each account are calculated monthly on a trade-date basis using an internal rate-of-return calculation. Monthly market values include income accruals and reflect the daily weighting of cash flows. The composite results are asset weighted on a monthly basis. Quarterly and annual composite performance figures are computed by linking monthly returns, resulting in a “time weighted” rate of return. Performance results include the reinvestment of dividends and other earnings. Returns are calculated in US dollars.
4) DISPERSION – The dispersion of annual returns was calculated based on the asset-weighted standard deviation.
5) The applicable benchmarks, which are not covered by the report of independent accountants, are noted within each table.
6) The Firm has prepared and presented this report in compliance with the Performance Presentation Standards of the Association for Investment Management and Research (AIMR-PPS), the US and Canadian versions of the Global Investment Performance Standards (GIPS). AIMR has not been involved in the preparation or review of this presentation. The legacy firm, Alliance Capital Management L.P. claims Level 1 compliance from January 1, 1992 through December 31, 2002. The legacy firm, Sanford C. Bernstein & Co claims Level 1 compliance from January 1, 1993 through December 31, 2002. Alliance Capital Management L.P. formerly received verification from KPMG LLP for the calendar years 1992 to 2000. This verification is available upon request. The merged firm verification for 2001 is currently being conducted. As of 2001, the merged firm claims compliance.
Alliance US Large Cap Growth Composite
Period | | Composite Assets (millions) | | Composite % of Firm Assets | | # of Accounts | | Gross Return% | | Net Return % | | Composite Dispersion | | Firm Assets (billions) | | S&P 500 | | Russell 1000 Growth | |
1Q | | 21046.8 | | 6.18 | | 240 | | -1.16 | | -1.25 | | 0.50 | | 341.3 | | -3.15 | | -1.07 | |
YTD | | 21046.8 | | 6.18 | | 240 | | -1.16 | | -1.25 | | 0.50 | | 341.3 | | -3.15 | | -1.07 | |
2002 | | 21002.9 | | 6.05 | | 242 | | -29.89 | | -30.13 | | 1.94 | | 346.9 | | -22.10 | | -27.89 | |
2001 | | 28735.0 | | 6.97 | | 288 | | -17.25 | | -17.52 | | 3.56 | | 412.2 | | -11.88 | | -20.42 | |
2000 | | 35927.7 | | 7.98 | | 289 | | -16.81 | | -17.57 | | 2.11 | | 450.0 | | -9.11 | | -22.42 | |
1999 | | 46987.1 | | 12.76 | | 251 | | 32.96 | | 31.99 | | 3.23 | | 368.3 | | 21.04 | | 33.16 | |
1998 | | 33003.6 | | 11.51 | | 175 | | 52.24 | | 51.14 | | 2.43 | | 286.7 | | 28.58 | | 38.71 | |
1997 | | 18899.0 | | 8.64 | | 122 | | 37.63 | | 36.63 | | 4.96 | | 218.7 | | 33.36 | | 30.49 | |
1996 | | 15835.0 | | 8.66 | | 112 | | 23.61 | | 22.71 | | 1.29 | | 182.8 | | 22.96 | | 23.12 | |
1995 | | 11683.9 | | 7.98 | | 86 | | 40.00 | | 38.99 | | 1.86 | | 146.5 | | 37.58 | | 37.18 | |
1994 | | 8413.9 | | 6.94 | | 77 | | -2.92 | | -3.64 | | 1.22 | | 121.3 | | 1.32 | | 2.62 | |
1993 | | 8096.5 | | 7.03 | | 72 | | 10.70 | | 9.88 | | 1.61 | | 115.2 | | 10.08 | | 2.87 | |
1 Year | | | | | | | | -27.11 | | -27.36 | | | | | | -24.76 | | -26.76 | |
3 Year | | | | | | | | -23.63 | | -24.00 | | | | | | -16.09 | | -25.64 | |
5 Year | | | | | | | | -4.41 | | -4.97 | | | | | | -3.77 | | -6.71 | |
10 Year | | | | | | | | 9.15 | | 8.43 | | | | | | 8.53 | | 6.68 | |
39
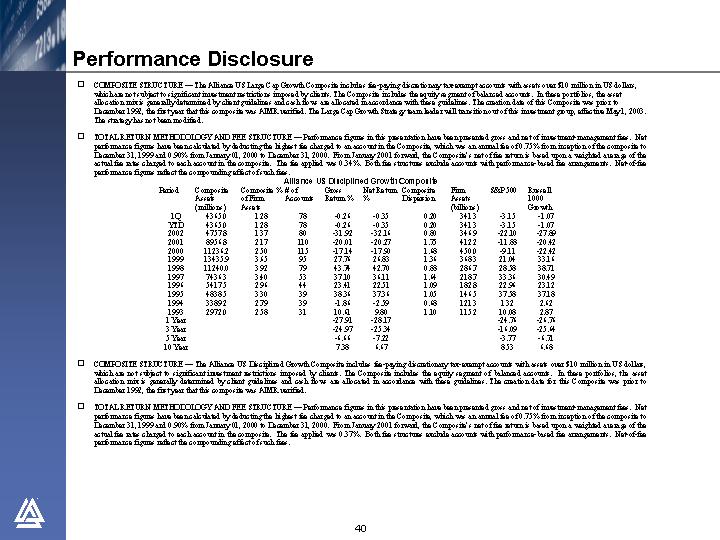
Performance Disclosure
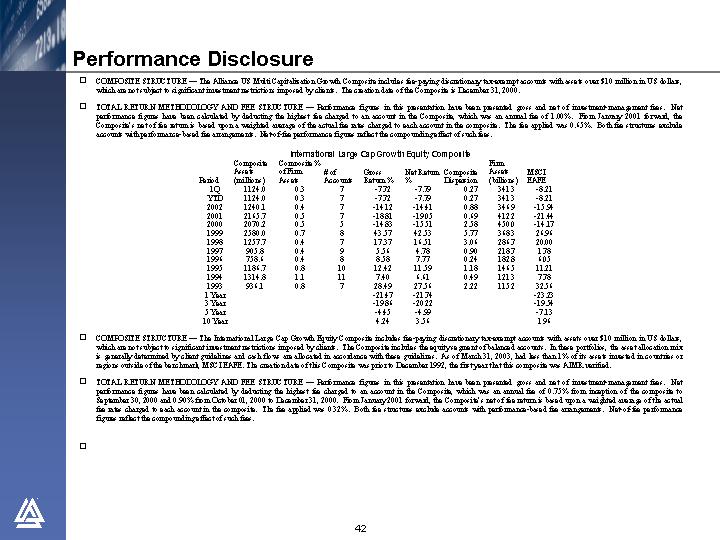
• COMPOSITE STRUCTURE – The Alliance US Large Cap Growth Composite includes fee-paying discretionary tax-exempt accounts with assets over $10 million in US dollars, which are not subject to significant investment restrictions imposed by clients. The Composite includes the equity segment of balanced accounts. In these portfolios, the asset allocation mix is generally determined by client guidelines and cash flows are allocated in accordance with these guidelines. The creation date of this Composite was prior to December 1992, the first year that this composite was AIMR verified. The Large Cap Growth Strategy team leader will transition out of this investment group, effective May 1, 2003. The strategy has not been modified.
• TOTAL RETURN METHODOLOGY AND FEE STRUCTURE – Performance figures in this presentation have been presented gross and net of investment-management fees. Net performance figures have been calculated by deducting the highest fee charged to an account in the Composite, which was an annual fee of 0.75% from inception of the composite to December 31, 1999 and 0.90% from January 01, 2000 to December 31, 2000. From January 2001 forward, the Composite’s net of fee return is based upon a weighted average of the actual fee rates charged to each account in the composite. The fee applied was 0.34%. Both fee structures exclude accounts with performance-based fee arrangements. Net-of-fee performance figures reflect the compounding effect of such fees.
Alliance US Disciplined Growth Composite
Period | | Composite Assets (millions) | | Composite% of Firm Assets | | # of Accounts | | Gross Return% | | Net Return % | | Composite Dispersion | | Firm Assets (billions) | | S&P 500 | | Russell 1000 Growth | |
1Q | | 4365.0 | | 1.28 | | 78 | | -0.26 | | -0.35 | | 0.20 | | 341.3 | | -3.15 | | -1.07 | |
YTD | | 4365.0 | | 1.28 | | 78 | | -0.26 | | -0.35 | | 0.20 | | 341.3 | | -3.15 | | -1.07 | |
2002 | | 4757.8 | | 1.37 | | 80 | | -31.92 | | -32.16 | | 0.80 | | 346.9 | | -22.10 | | -27.89 | |
2001 | | 8956.8 | | 2.17 | | 110 | | -20.01 | | -20.27 | | 1.75 | | 412.2 | | -11.88 | | -20.42 | |
2000 | | 11236.2 | | 2.50 | | 115 | | -17.14 | | -17.90 | | 1.68 | | 450.0 | | -9.11 | | -22.42 | |
1999 | | 13435.9 | | 3.65 | | 95 | | 27.76 | | 26.83 | | 1.36 | | 368.3 | | 21.04 | | 33.16 | |
1998 | | 11240.0 | | 3.92 | | 79 | | 43.74 | | 42.70 | | 0.88 | | 286.7 | | 28.58 | | 38.71 | |
1997 | | 7436.3 | | 3.40 | | 53 | | 37.10 | | 36.11 | | 1.64 | | 218.7 | | 33.36 | | 30.49 | |
1996 | | 5417.5 | | 2.96 | | 44 | | 23.41 | | 22.51 | | 1.09 | | 182.8 | | 22.96 | | 23.12 | |
1995 | | 4838.5 | | 3.30 | | 39 | | 38.36 | | 37.36 | | 1.05 | | 146.5 | | 37.58 | | 37.18 | |
1994 | | 3389.2 | | 2.79 | | 39 | | -1.86 | | -2.59 | | 0.68 | | 121.3 | | 1.32 | | 2.62 | |
1993 | | 2972.0 | | 2.58 | | 31 | | 10.61 | | 9.80 | | 1.10 | | 115.2 | | 10.08 | | 2.87 | |
1 Year | | | | | | | | -27.91 | | -28.17 | | | | | | -24.76 | | -26.76 | |
3 Year | | | | | | | | -24.97 | | -25.34 | | | | | | -16.09 | | -25.64 | |
5 Year | | | | | | | | -6.66 | | -7.22 | | | | | | -3.77 | | -6.71 | |
10 Year | | | | | | | | 7.38 | | 6.67 | | | | | | 8.53 | | 6.68 | |
• COMPOSITE STRUCTURE – The Alliance US Disciplined Growth Composite includes fee-paying discretionary tax-exempt accounts with assets over $10 million in US dollars, which are not subject to significant investment restrictions imposed by clients. The Composite includes the equity segment of balanced accounts. In these portfolios, the asset allocation mix is generally determined by client guidelines and cash flows are allocated in accordance with these guidelines. The creation date for this Composite was prior to December 1992, the first year that this composite was AIMR verified.
• TOTAL RETURN METHODOLOGY AND FEE STRUCTURE – Performance figures in this presentation have been presented gross and net of investment-management fees. Net performance figures have been calculated by deducting the highest fee charged to an account in the Composite, which was an annual fee of 0.75% from inception of the composite to December 31, 1999 and 0.90% from January 01, 2000 to December 31, 2000. From January 2001 forward, the Composite’s net of fee return is based upon a weighted average of the actual fee rates charged to each account in the composite. The fee applied was 0.37%. Both fee structures exclude accounts with performance-based fee arrangements. Net-of-fee performance figures reflect the compounding effect of such fees.
40
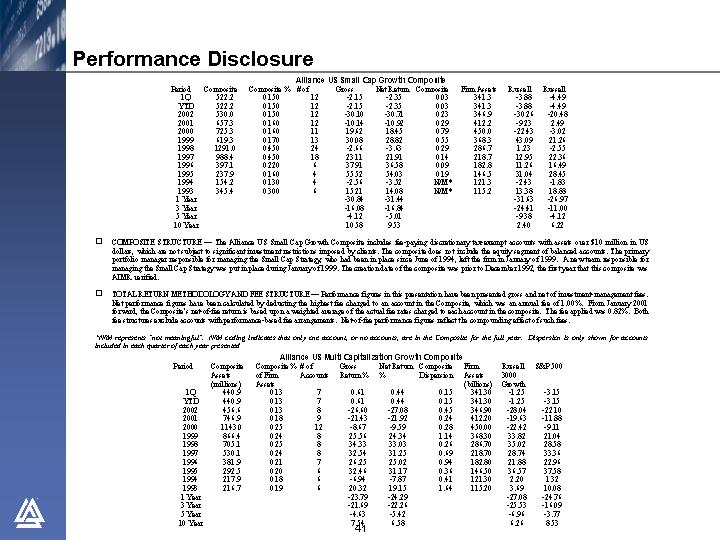
Performance Disclosure
Alliance US Small Cap Growth Composite
Period | | Composite | | Composite % | | # of | | Gross | | Net Return | | Composite | | Firm Assets | | Russell | | Russell | |
1Q | | 522.2 | | 0.150 | | 12 | | -2.15 | | -2.35 | | 0.03 | | 341.3 | | -3.88 | | -4.49 | |
YTD | | 522.2 | | 0.150 | | 12 | | -2.15 | | -2.35 | | 0.03 | | 341.3 | | -3.88 | | -4.49 | |
2002 | | 530.0 | | 0.150 | | 12 | | -30.10 | | -30.71 | | 0.23 | | 346.9 | | -30.26 | | -20.48 | |
2001 | | 657.3 | | 0.160 | | 12 | | -10.14 | | -10.92 | | 0.29 | | 412.2 | | -9.23 | | 2.49 | |
2000 | | 725.3 | | 0.160 | | 11 | | 19.62 | | 18.45 | | 0.79 | | 450.0 | | -22.43 | | -3.02 | |
1999 | | 619.3 | | 0.170 | | 13 | | 30.08 | | 28.82 | | 0.55 | | 368.3 | | 43.09 | | 21.26 | |
1998 | | 1291.0 | | 0.450 | | 24 | | -2.66 | | -3.63 | | 0.29 | | 286.7 | | 1.23 | | -2.55 | |
1997 | | 988.4 | | 0.450 | | 18 | | 23.11 | | 21.91 | | 0.14 | | 218.7 | | 12.95 | | 22.36 | |
1996 | | 397.1 | | 0.220 | | 6 | | 37.91 | | 36.58 | | 0.09 | | 182.8 | | 11.26 | | 16.49 | |
1995 | | 237.9 | | 0.160 | | 4 | | 55.52 | | 54.03 | | 0.19 | | 146.5 | | 31.04 | | 28.45 | |
1994 | | 154.2 | | 0.130 | | 4 | | -2.56 | | -3.52 | | N/M | * | 121.3 | | -2.43 | | -1.83 | |
1993 | | 345.4 | | 0.300 | | 6 | | 15.21 | | 14.08 | | N/M | * | 115.2 | | 13.38 | | 18.88 | |
1 Year | | | | | | | | -30.84 | | -31.44 | | | | | | -31.63 | | -26.97 | |
3 Year | | | | | | | | -16.08 | | -16.84 | | | | | | -24.41 | | -11.00 | |
5 Year | | | | | | | | -4.12 | | -5.01 | | | | | | -9.38 | | -4.12 | |
10 Year | | | | | | | | 10.58 | | 9.53 | | | | | | 2.40 | | 6.22 | |
• COMPOSITE STRUCTURE – The Alliance US Small Cap Growth Composite includes fee-paying discretionary tax-exempt accounts with assets over $10 million in US dollars, which are not subject to significant investment restrictions imposed by clients. The composite does not include the equity segment of balanced accounts. The primary portfolio manager responsible for managing the Small Cap Strategy, who had been in place since June of 1994, left the firm in January of 1999. A new team responsible for managing the Small Cap Strategy was put in place during January of 1999. The creation date of the composite was prior to December 1992, the first year that this composite was AIMR verified.
• TOTAL RETURN METHODOLOGY AND FEE STRUCTURE – Performance figures in this presentation have been presented gross and net of investment-management fees. Net performance figures have been calculated by deducting the highest fee charged to an account in the Composite, which was an annual fee of 1.00%. From January 2001 forward, the Composite’s net-of-fee return is based upon a weighted average of the actual fee rates charged to each account in the composite. The fee applied was 0.82%. Both fee structures exclude accounts with performance-based fee arrangements. Net-of-fee performance figures reflect the compounding effect of such fees.
*N/M represents “not meaningful”. N/M coding indicates that only one account, or no accounts, are in the Composite for the full year. Dispersion is only shown for accounts included in each quarter of each year presented
Alliance US Multi Capitalization Growth Composite
Period | | Composite Assets (millions) | | Composite% of Firm Assets | | # of Accounts | | Gross Return% | | Net Return % | | Composite Dispersion | | Firm Assets (billions) | | Russell 3000 Growth | | S&P 500 | |
1Q | | 440.9 | | 0.13 | | 7 | | 0.61 | | 0.44 | | 0.15 | | 341.30 | | -1.25 | | -3.15 | |
YTD | | 440.9 | | 0.13 | | 7 | | 0.61 | | 0.44 | | 0.15 | | 341.30 | | -1.25 | | -3.15 | |
2002 | | 456.6 | | 0.13 | | 8 | | -26.60 | | -27.08 | | 0.45 | | 346.90 | | -28.04 | | -22.10 | |
2001 | | 746.9 | | 0.18 | | 9 | | -21.43 | | -21.92 | | 0.24 | | 412.20 | | -19.63 | | -11.88 | |
2000 | | 1143.0 | | 0.25 | | 12 | | -8.67 | | -9.59 | | 0.28 | | 450.00 | | -22.42 | | -9.11 | |
1999 | | 866.4 | | 0.24 | | 8 | | 25.56 | | 24.34 | | 1.14 | | 368.30 | | 33.82 | | 21.04 | |
1998 | | 705.1 | | 0.25 | | 8 | | 34.33 | | 33.03 | | 0.26 | | 286.70 | | 35.02 | | 28.58 | |
1997 | | 530.1 | | 0.24 | | 8 | | 32.54 | | 31.25 | | 0.69 | | 218.70 | | 28.74 | | 33.36 | |
1996 | | 381.9 | | 0.21 | | 7 | | 26.25 | | 25.02 | | 0.94 | | 182.80 | | 21.88 | | 22.96 | |
1995 | | 292.5 | | 0.20 | | 6 | | 32.46 | | 31.17 | | 0.36 | | 146.50 | | 36.57 | | 37.58 | |
1994 | | 217.9 | | 0.18 | | 6 | | -6.94 | | -7.87 | | 0.41 | | 121.30 | | 2.20 | | 1.32 | |
1993 | | 216.7 | | 0.19 | | 6 | | 20.32 | | 19.15 | | 1.64 | | 115.20 | | 3.69 | | 10.08 | |
1 Year | | | | | | | | -23.79 | | -24.29 | | | | | | -27.08 | | -24.76 | |
3 Year | | | | | | | | -21.69 | | -22.26 | | | | | | -25.53 | | -16.09 | |
5 Year | | | | | | | | -4.63 | | -5.42 | | | | | | -6.96 | | -3.77 | |
10 Year | | | | | | | | 7.54 | | 6.58 | | | | | | 6.26 | | 8.53 | |
41
Performance Disclosure
• COMPOSITE STRUCTURE – The Alliance US Multi Capitalization Growth Composite includes fee-paying discretionary tax-exempt accounts with assets over $10 million in US dollars, which are not subject to significant investment restrictions imposed by clients. The creation date of the Composite is December 31, 2000.
• TOTAL RETURN METHODOLOGY AND FEE STRUCTURE – Performance figures in this presentation have been presented gross and net of investment-management fees. Net performance figures have been calculated by deducting the highest fee charged to an account in the Composite, which was an annual fee of 1.00%. From January 2001 forward, the Composite’s net of fee return is based upon a weighted average of the actual fee rates charged to each account in the composite. The fee applied was 0.65%. Both fee structures exclude accounts with performance-based fee arrangements. Net-of-fee performance figures reflect the compounding effect of such fees.
International Large Cap Growth Equity Composite
Period | | Composite Assets (millions) | | Composite% of Firm Assets | | # of Accounts | | Gross Return% | | Net Return % | | Composite Dispersion | | Firm Assets (billions) | | MSCI EAFE | |
1Q | | 1124.0 | | 0.3 | | 7 | | -7.72 | | -7.79 | | 0.27 | | 341.3 | | -8.21 | |
YTD | | 1124.0 | | 0.3 | | 7 | | -7.72 | | -7.79 | | 0.27 | | 341.3 | | -8.21 | |
2002 | | 1240.1 | | 0.4 | | 7 | | -14.12 | | -14.41 | | 0.88 | | 346.9 | | -15.94 | |
2001 | | 2165.7 | | 0.5 | | 7 | | -18.81 | | -19.05 | | 0.69 | | 412.2 | | -21.44 | |
2000 | | 2070.2 | | 0.5 | | 5 | | -14.83 | | -15.51 | | 2.58 | | 450.0 | | -14.17 | |
1999 | | 2580.0 | | 0.7 | | 8 | | 43.57 | | 42.53 | | 5.77 | | 368.3 | | 26.96 | |
1998 | | 1257.7 | | 0.4 | | 7 | | 17.37 | | 16.51 | | 3.06 | | 286.7 | | 20.00 | |
1997 | | 905.8 | | 0.4 | | 9 | | 5.56 | | 4.78 | | 0.90 | | 218.7 | | 1.78 | |
1996 | | 758.6 | | 0.4 | | 8 | | 8.58 | | 7.77 | | 0.24 | | 182.8 | | 6.05 | |
1995 | | 1186.7 | | 0.8 | | 10 | | 12.42 | | 11.59 | | 1.18 | | 146.5 | | 11.21 | |
1994 | | 1314.8 | | 1.1 | | 11 | | 7.40 | | 6.61 | | 0.49 | | 121.3 | | 7.78 | |
1993 | | 936.1 | | 0.8 | | 7 | | 28.49 | | 27.56 | | 2.22 | | 115.2 | | 32.56 | |
1 Year | | | | | | | | -21.47 | | -21.74 | | | | | | -23.23 | |
3 Year | | | | | | | | -19.86 | | -20.22 | | | | | | -19.54 | |
5 Year | | | | | | | | -4.45 | | -4.99 | | | | | | -7.13 | |
10 Year | | | | | | | | 4.24 | | 3.56 | | | | | | 1.96 | |
• COMPOSITE STRUCTURE – The International Large Cap Growth Equity Composite includes fee-paying discretionary tax-exempt accounts with assets over $10 million in US dollars, which are not subject to significant investment restrictions imposed by clients. The Composite includes the equity segment of balanced accounts. In these portfolios, the asset allocation mix is generally determined by client guidelines and cash flows are allocated in accordance with these guidelines. As of March 31, 2003, had less than 1% of its assets invested in countries or regions outside of the benchmark, MSCI EAFE. The creation date of this Composite was prior to December 1992, the first year that this composite was AIMR verified.
• TOTAL RETURN METHODOLOGY AND FEE STRUCTURE – Performance figures in this presentation have been presented gross and net of investment-management fees. Net performance figures have been calculated by deducting the highest fee charged to an account in the Composite, which was an annual fee of 0.75% from inception of the composite to September 30, 2000 and 0.90% from October 01, 2000 to December 31, 2000. From January 2001 forward, the Composite’s net of fee return is based upon a weighted average of the actual fee rates charged to each account in the composite. The fee applied was 0.32%. Both fee structures exclude accounts with performance-based fee arrangements. Net-of-fee performance figures reflect the compounding effect of such fees.
42
Performance Disclosure
Alliance Emerging Markets Equity Composite
Period | | Composite Assets (millions) | | Composite% of Firm Assets | | # of Accounts | | Gross Return% | | Net Return % | | Composite Dispersion | | Firm Assets (billions) | | MSCI Emerging Market | |
1Q | | 713.8 | | 0.21 | | 8 | | -6.83 | | -6.93 | | 0.11 | | 341.3 | | -5.87 | |
YTD | | 713.8 | | 0.21 | | 8 | | -6.83 | | -6.93 | | 0.11 | | 341.3 | | -5.87 | |
2002 | | 694.1 | | 0.20 | | 6 | | 0.69 | | 0.21 | | 0.24 | | 346.9 | | -6.00 | |
2001 | | 725.0 | | 0.18 | | 3 | | -7.14 | | -7.56 | | N/M | * | 412.2 | | -2.37 | |
2000 | | 541.3 | | 0.12 | | 1 | | -29.23 | | -29.96 | | N/M | * | 450.0 | | -30.61 | |
1999 | | 456.3 | | 0.12 | | 1 | | 118.32 | | 116.29 | | N/M | * | 368.3 | | 66.41 | |
1998 | | 273.3 | | 0.10 | | 2 | | -28.06 | | -28.80 | | 0.04 | | 286.7 | | -25.34 | |
1997 | | 309.6 | | 0.14 | | 2 | | -8.42 | | -9.33 | | 0.31 | | 218.7 | | -11.58 | |
1996 | | 248.6 | | 0.14 | | 2 | | 22.53 | | 21.34 | | 0.57 | | 182.8 | | 6.03 | |
1995 | | 137.2 | | 0.09 | | 2 | | -3.06 | | -4.03 | | 1.00 | | 146.5 | | -5.21 | |
1994 | | 294.6 | | 0.24 | | 3 | | -12.28 | | -13.16 | | 2.56 | | 121.3 | | -7.32 | |
1993 | | 81.1 | | 0.07 | | 1 | | 64.90 | | 63.33 | | N/M | * | 115.2 | | 74.84 | |
1 Year | | | | | | | | -17.12 | | -17.49 | | | | | | -20.58 | |
3 Year | | | | | | | | -17.66 | | -18.16 | | | | | | -16.35 | |
5 Year | | | | | | | | -1.65 | | -2.39 | | | | | | -6.85 | |
10 Year | | | | | | | | 3.99 | | 3.09 | | | | | | 0.16 | |
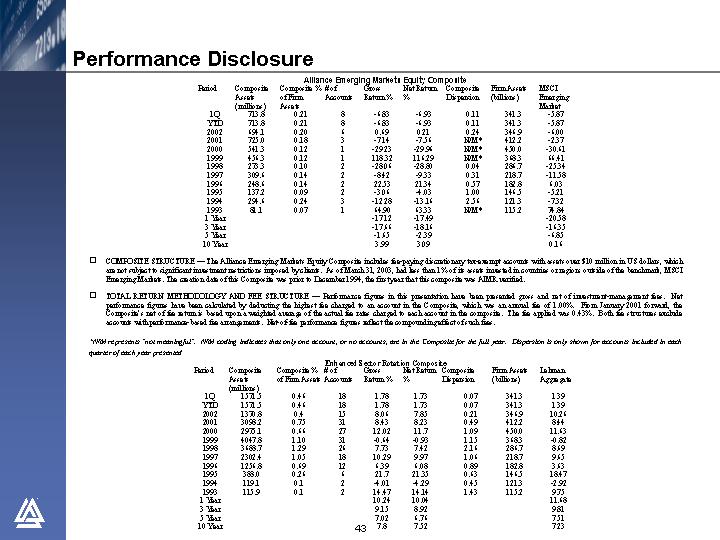
• COMPOSITE STRUCTURE – The Alliance Emerging Markets Equity Composite includes fee-paying discretionary tax-exempt accounts with assets over $10 million in US dollars, which are not subject to significant investment restrictions imposed by clients. As of March 31, 2003, had less than 1% of its assets invested in countries or regions outside of the benchmark, MSCI Emerging Markets. The creation date of this Composite was prior to December 1994, the first year that this composite was AIMR verified.
• TOTAL RETURN METHODOLOGY AND FEE STRUCTURE – Performance figures in this presentation have been presented gross and net of investment-management fees. Net performance figures have been calculated by deducting the highest fee charged to an account in the Composite, which was an annual fee of 1.00%. From January 2001 forward, the Composite’s net of fee return is based upon a weighted average of the actual fee rates charged to each account in the composite. The fee applied was 0.43%. Both fee structures exclude accounts with performance-based fee arrangements. Net-of-fee performance figures reflect the compounding effect of such fees.
*N/M represents “not meaningful”. N/M coding indicates that only one account, or no accounts, are in the Composite for the full year. Dispersion is only shown for accounts included in each quarter of each year presented
Enhanced Sector Rotation Composite
Period | | Composite Assets (millions) | | Composite% of Firm Assets | | # of Accounts | | Gross Return% | | Net Return % | | Composite Dispersion | | Firm Assets (billions) | | Lehman Aggregate | |
1Q | | 1571.5 | | 0.46 | | 18 | | 1.78 | | 1.73 | | 0.07 | | 341.3 | | 1.39 | |
YTD | | 1571.5 | | 0.46 | | 18 | | 1.78 | | 1.73 | | 0.07 | | 341.3 | | 1.39 | |
2002 | | 1370.8 | | 0.4 | | 15 | | 8.06 | | 7.85 | | 0.21 | | 346.9 | | 10.26 | |
2001 | | 3098.2 | | 0.75 | | 31 | | 8.43 | | 8.23 | | 0.49 | | 412.2 | | 8.44 | |
2000 | | 2975.1 | | 0.66 | | 27 | | 12.02 | | 11.7 | | 1.09 | | 450.0 | | 11.63 | |
1999 | | 4047.8 | | 1.10 | | 31 | | -0.64 | | -0.93 | | 1.15 | | 368.3 | | -0.82 | |
1998 | | 3688.7 | | 1.29 | | 26 | | 7.73 | | 7.42 | | 2.16 | | 286.7 | | 8.69 | |
1997 | | 2302.4 | | 1.05 | | 18 | | 10.29 | | 9.97 | | 1.06 | | 218.7 | | 9.65 | |
1996 | | 1256.8 | | 0.69 | | 12 | | 6.39 | | 6.08 | | 0.89 | | 182.8 | | 3.63 | |
1995 | | 388.0 | | 0.26 | | 6 | | 21.7 | | 21.35 | | 0.63 | | 146.5 | | 18.47 | |
1994 | | 119.1 | | 0.1 | | 2 | | -4.01 | | -4.29 | | 0.45 | | 121.3 | | -2.92 | |
1993 | | 115.9 | | 0.1 | | 2 | | 14.47 | | 14.14 | | 1.43 | | 115.2 | | 9.75 | |
1 Year | | | | | | | | 10.24 | | 10.04 | | | | | | 11.68 | |
3 Year | | | | | | | | 9.15 | | 8.92 | | | | | | 9.81 | |
5 Year | | | | | | | | 7.02 | | 6.76 | | | | | | 7.51 | |
10 Year | | | | | | | | 7.8 | | 7.52 | | | | | | 7.23 | |
43
Performance Disclosure
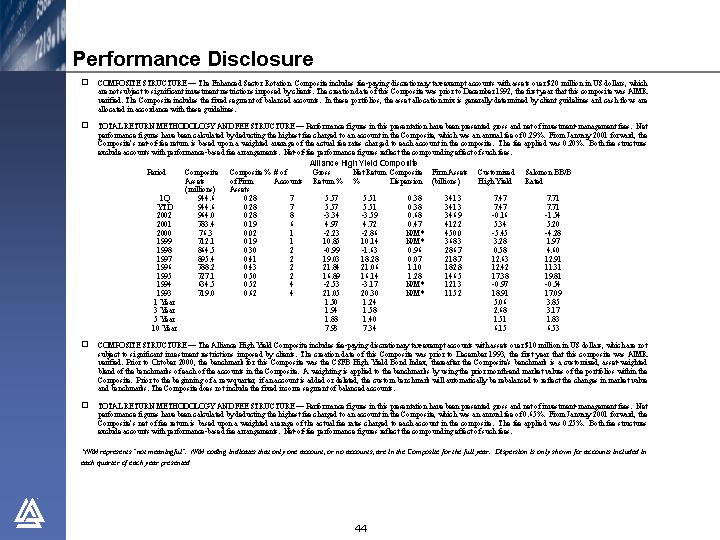
• COMPOSITE STRUCTURE – The Enhanced Sector Rotation Composite includes fee-paying discretionary tax-exempt accounts with assets over $20 million in US dollars, which are not subject to significant investment restrictions imposed by clients. The creation date of this Composite was prior to December 1992, the first year that this composite was AIMR verified. The Composite includes the fixed segment of balanced accounts. In these portfolios, the asset allocation mix is generally determined by client guidelines and cash flows are allocated in accordance with these guidelines.
• TOTAL RETURN METHODOLOGY AND FEE STRUCTURE – Performance figures in this presentation have been presented gross and net of investment-management fees. Net performance figures have been calculated by deducting the highest fee charged to an account in the Composite, which was an annual fee of 0.29%. From January 2001 forward, the Composite’s net-of-fee return is based upon a weighted average of the actual fee rates charged to each account in the composite. The fee applied was 0.20%. Both fee structures exclude accounts with performance-based fee arrangements. Net-of-fee performance figures reflect the compounding effect of such fees.
Alliance High Yield Composite
Period | | Composite Assets (millions) | | Composite% of Firm Assets | | # of Accounts | | Gross Return% | | Net Return % | | Composite Dispersion | | Firm Assets (billions) | | Customized High Yield | | Salomon BB/B Rated | |
1Q | | 944.6 | | 0.28 | | 7 | | 5.57 | | 5.51 | | 0.38 | | 341.3 | | 7.47 | | 7.71 | |
YTD | | 944.6 | | 0.28 | | 7 | | 5.57 | | 5.51 | | 0.38 | | 341.3 | | 7.47 | | 7.71 | |
2002 | | 964.0 | | 0.28 | | 8 | | -3.34 | | -3.59 | | 0.68 | | 346.9 | | -0.16 | | -1.54 | |
2001 | | 783.4 | | 0.19 | | 6 | | 4.97 | | 4.72 | | 0.47 | | 412.2 | | 5.34 | | 5.20 | |
2000 | | 76.3 | | 0.02 | | 1 | | -2.23 | | -2.86 | | N/M* | | 450.0 | | -5.45 | | -4.28 | |
1999 | | 712.1 | | 0.19 | | 1 | | 10.85 | | 10.14 | | N/M* | | 368.3 | | 3.28 | | 1.97 | |
1998 | | 864.5 | | 0.30 | | 2 | | -0.99 | | -1.63 | | 0.96 | | 286.7 | | 0.58 | | 4.60 | |
1997 | | 895.4 | | 0.41 | | 2 | | 19.03 | | 18.28 | | 0.07 | | 218.7 | | 12.63 | | 12.91 | |
1996 | | 788.2 | | 0.43 | | 2 | | 21.84 | | 21.06 | | 1.10 | | 182.8 | | 12.42 | | 11.31 | |
1995 | | 727.1 | | 0.50 | | 2 | | 16.89 | | 16.14 | | 1.28 | | 146.5 | | 17.38 | | 19.81 | |
1994 | | 634.5 | | 0.52 | | 4 | | -2.53 | | -3.17 | | N/M* | | 121.3 | | -0.97 | | -0.54 | |
1993 | | 719.0 | | 0.62 | | 4 | | 21.05 | | 20.30 | | N/M* | | 115.2 | | 18.91 | | 17.09 | |
1 Year | | | | | | | | 1.50 | | 1.24 | | | | | | 5.06 | | 3.85 | |
3 Year | | | | | | | | 1.94 | | 1.58 | | | | | | 2.68 | | 3.17 | |
5 Year | | | | | | | | 1.88 | | 1.40 | | | | | | 1.51 | | 1.83 | |
10 Year | | | | | | | | 7.93 | | 7.34 | | | | | | 6.15 | | 6.53 | |
• COMPOSITE STRUCTURE – The Alliance High Yield Composite includes fee-paying discretionary tax-exempt accounts with assets over $10 million in US dollars, which are not subject to significant investment restrictions imposed by clients. The creation date of this Composite was prior to December 1993, the first year that this composite was AIMR verified. Prior to October 2000, the benchmark for this Composite was the CSFB High Yield Bond Index, thereafter the Composite’s benchmark is a customized, asset-weighted blend of the benchmarks of each of the accounts in the Composite. A weighting is applied to the benchmarks by using the prior month-end market values of the portfolios within the Composite. Prior to the beginning of a new quarter, if an account is added or deleted, the custom benchmark will automatically be rebalanced to reflect the changes in market value and benchmarks. The Composite does not include the fixed income segment of balanced accounts.
• TOTAL RETURN METHODOLOGY AND FEE STRUCTURE – Performance figures in this presentation have been presented gross and net of investment-management fees. Net performance figures have been calculated by deducting the highest fee charged to an account in the Composite, which was an annual fee of 0.65%. From January 2001 forward, the Composite’s net of fee return is based upon a weighted average of the actual fee rates charged to each account in the composite. The fee applied was 0.25%. Both fee structures exclude accounts with performance-based fee arrangements. Net-of-fee performance figures reflect the compounding effect of such fees.
* N/M represents “not meaningful”. N/M coding indicates that only one account, or no accounts, are in the Composite for the full year. Dispersion is only shown for accounts included in each quarter of each year presented
44
Performance Disclosure
Alliance Global Fixed Income Composite
Period | | Composite Assets (millions) | | Composite% of Assets | | # of Accounts | | Gross Return% | | Net Return % | | Composite Dispersion | | Firm Assets (billions) | | JPM Global Govt Bond Index | | Salomon World Govt Bond Index | |
1Q | | 11.2 | | 0 | | 1 | | 3.51 | | 3.38 | | N/M | * | 341.3 | | 3.02 | | 3.10 | |
YTD | | 11.2 | | 0 | | 1 | | 3.51 | | 3.38 | | N/M | * | 341.3 | | 3.02 | | 3.10 | |
2002 | | 13.0 | | 0 | | 1 | | 18.68 | | 18.10 | | N/M | * | 346.9 | | 19.37 | | 19.49 | |
2001 | | 15.9 | | 0 | | 1 | | -0.23 | | -0.73 | | N/M | * | 412.2 | | -0.79 | | -0.99 | |
2000 | | 18.3 | | 0 | | 1 | | 1.60 | | 1.10 | | N/M | * | 450.0 | | 2.34 | | 1.56 | |
1999 | | 16.2 | | 0 | | 2 | | -5.50 | | -5.97 | | N/M | * | 368.3 | | -5.08 | | -4.27 | |
1998 | | 6.6 | | 0 | | 1 | | 16.70 | | 16.13 | | N/M | * | 286.7 | | 15.31 | | 15.30 | |
1997 | | 12.6 | | 0.01 | | 1 | | 1.90 | | 1.40 | | N/M | * | 218.7 | | 1.40 | | 0.23 | |
1996 | | 11.3 | | 0.01 | | 1 | | 5.96 | | 5.44 | | N/M | * | 182.8 | | 4.40 | | 3.62 | |
1995 | | 10.4 | | 0.01 | | 1 | | 19.45 | | 18.86 | | N/M | * | 146.5 | | 19.32 | | 19.04 | |
1994 | | 15.5 | | 0.01 | | 2 | | -0.97 | | -1.46 | | N/M | * | 121.3 | | 1.28 | | 2.35 | |
1993 | | 11.0 | | 0.01 | | 2 | | 16.43 | | 15.86 | | N/M | * | 115.2 | | 12.27 | | 13.27 | |
1 Year | | | | | | | | 24.92 | | 24.31 | | | | | | 24.88 | | 25.22 | |
3 Year | | | | | | | | 7.70 | | 7.17 | | | | | | 7.54 | | 7.34 | |
5 Year | | | | | | | | 6.26 | | 5.73 | | | | | | 6.24 | | 6.29 | |
10 Year | | | | | | | | 6.72 | | 6.20 | | | | | | 6.46 | | 6.41 | |
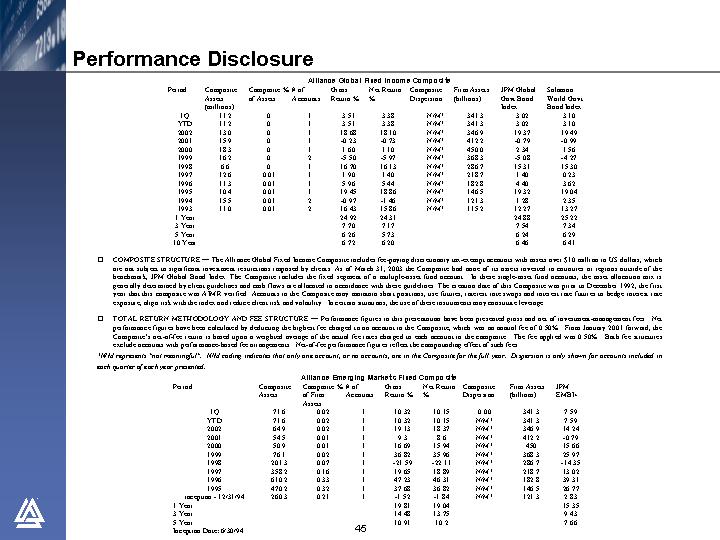
• COMPOSITE STRUCTURE – The Alliance Global Fixed Income Composite includes fee-paying discretionary tax-exempt accounts with assets over $10 million in US dollars, which are not subject to significant investment restrictions imposed by clients. As of March 31, 2003 the Composite had none of its assets invested in countries or regions outside of the benchmark, JPM Global Bond Index. The Composite includes the fixed segment of a multiple-asset fund account. In these single-asset fund accounts, the asset allocation mix is generally determined by client guidelines and cash flows are allocated in accordance with these guidelines. The creation date of this Composite was prior to December 1992, the first year that this composite was AIMR verified. Accounts in the Composite may maintain short positions, use futures, interest rate swaps and interest rate futures to hedge interest rate exposure, align risk with the index and reduce client risk and volatility. In certain situations, the use of these instruments may constitute leverage.
• TOTAL RETURN METHODOLOGY AND FEE STRUCTURE – Performance figures in this presentation have been presented gross and net of investment-management fees. Net performance figures have been calculated by deducting the highest fee charged to an account in the Composite, which was an annual fee of 0.50%. From January 2001 forward, the Composite’s net-of-fee return is based upon a weighted average of the actual fee rates charged to each account in the composite. The fee applied was 0.50%. Both fee structures exclude accounts with performance-based fee arrangements. Net-of-fee performance figures reflect the compounding effect of such fees.
* N/M represents “not meaningful”. N/M coding indicates that only one account, or no accounts, are in the Composite for the full year. Dispersion is only shown for accounts included in each quarter of each year presented.
Alliance Emerging Markets Fixed Composite
Period | | Composite Assets | | Composite% of Firm Assets | | # of Accounts | | Gross Return% | | Net Return % | | Composite Dispersion | | Firm Assets (billions) | | JPM EMBI+ | |
1Q | | 71.6 | | 0.02 | | 1 | | 10.32 | | 10.15 | | 0.00 | | 341.3 | | 7.59 | |
YTD | | 71.6 | | 0.02 | | 1 | | 10.32 | | 10.15 | | N/M | * | 341.3 | | 7.59 | |
2002 | | 64.9 | | 0.02 | | 1 | | 19.13 | | 18.37 | | N/M | * | 346.9 | | 14.24 | |
2001 | | 54.5 | | 0.01 | | 1 | | 9.3 | | 8.6 | | N/M | * | 412.2 | | -0.79 | |
2000 | | 50.9 | | 0.01 | | 1 | | 16.69 | | 15.94 | | N/M | * | 450 | | 15.66 | |
1999 | | 76.1 | | 0.02 | | 1 | | 36.82 | | 35.96 | | N/M | * | 368.3 | | 25.97 | |
1998 | | 201.3 | | 0.07 | | 1 | | -21.59 | | -22.11 | | N/M | * | 286.7 | | -14.35 | |
1997 | | 358.2 | | 0.16 | | 1 | | 19.65 | | 18.89 | | N/M | * | 218.7 | | 13.02 | |
1996 | | 610.2 | | 0.33 | | 1 | | 47.23 | | 46.31 | | N/M | * | 182.8 | | 39.31 | |
1995 | | 470.2 | | 0.32 | | 1 | | 37.68 | | 36.82 | | N/M | * | 146.5 | | 26.77 | |
inception – 12/31/94 | | 260.3 | | 0.21 | | 1 | | -1.52 | | -1.84 | | N/M | * | 121.3 | | 2.83 | |
1 Year | | | | | | | | 19.81 | | 19.04 | | | | | | 15.35 | |
3 Year | | | | | | | | 14.48 | | 13.75 | | | | | | 9.43 | |
5 Year | | | | | | | | 10.91 | | 10.2 | | | | | | 7.66 | |
Inception Date: 6/30/94 | | | | | | | | | | | | | | | | | |
45
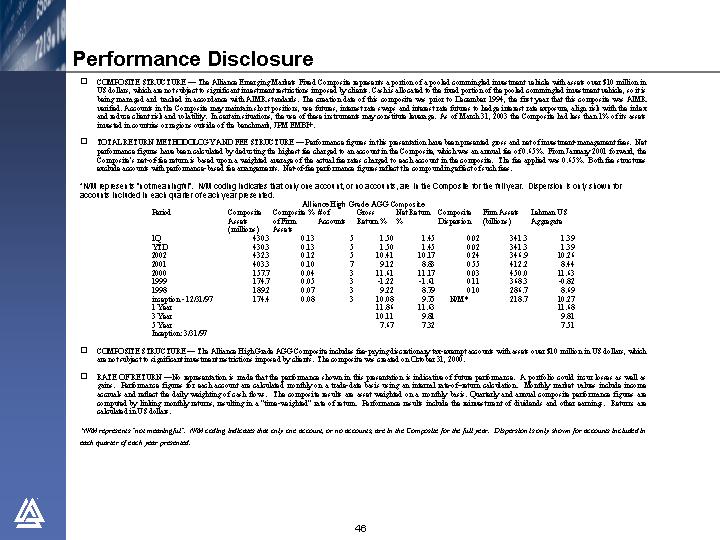
Performance Disclosure
• COMPOSITE STRUCTURE – The Alliance Emerging Markets Fixed Composite represents a portion of a pooled commingled investment vehicle with assets over $10 million in US dollars, which are not subject to significant investment restrictions imposed by clients. Cash is allocated to the fixed portion of the pooled commingled investment vehicle, so it is being managed and tracked in accordance with AIMR standards. The creation date of this composite was prior to December 1994, the first year that this composite was AIMR verified. Accounts in the Composite may maintain short positions, use futures, interest rate swaps and interest rate futures to hedge interest rate exposure, align risk with the index and reduce client risk and volatility. In certain situations, the use of these instruments may constitute leverage. As of March 31, 2003 the Composite had less than 1% of its assets invested in countries or regions outside of the benchmark, JPM EMBI+.
• TOTAL RETURN METHODOLOGY AND FEE STRUCTURE – Performance figures in this presentation have been presented gross and net of investment-management fees. Net performance figures have been calculated by deducting the highest fee charged to an account in the Composite, which was an annual fee of 0.65%. From January 2001 forward, the Composite’s net-of-fee return is based upon a weighted average of the actual fee rates charged to each account in the composite. The fee applied was 0.65%. Both fee structures exclude accounts with performance-based fee arrangements. Net-of-fee performance figures reflect the compounding effect of such fees.
* N/M represents “not meaningful”. N/M coding indicates that only one account, or no accounts, are in the Composite for the full year. Dispersion is only shown for accounts included in each quarter of each year presented.
Alliance High Grade AGG Composite
Period | | Composite Assets (millions) | | Composite% of Firm Assets | | # of Accounts | | Gross Return% | | Net Return % | | Composite Dispersion | | Firm Assets (billions) | | Lehman US Aggregate | |
1Q | | 430.3 | | 0.13 | | 5 | | 1.50 | | 1.45 | | 0.02 | | 341.3 | | 1.39 | |
YTD | | 430.3 | | 0.13 | | 5 | | 1.50 | | 1.45 | | 0.02 | | 341.3 | | 1.39 | |
2002 | | 432.3 | | 0.12 | | 5 | | 10.41 | | 10.17 | | 0.24 | | 346.9 | | 10.26 | |
2001 | | 403.3 | | 0.10 | | 7 | | 9.12 | | 8.83 | | 0.55 | | 412.2 | | 8.44 | |
2000 | | 157.7 | | 0.04 | | 3 | | 11.61 | | 11.17 | | 0.03 | | 450.0 | | 11.63 | |
1999 | | 174.7 | | 0.05 | | 3 | | -1.22 | | -1.61 | | 0.11 | | 368.3 | | -0.82 | |
1998 | | 189.2 | | 0.07 | | 3 | | 9.22 | | 8.79 | | 0.10 | | 286.7 | | 8.69 | |
inception – 12/31/97 | | 174.4 | | 0.08 | | 3 | | 10.08 | | 9.75 | | N/M | * | 218.7 | | 10.27 | |
1 Year | | | | | | | | 11.86 | | 11.63 | | | | | | 11.68 | |
3 Year | | | | | | | | 10.11 | | 9.81 | | | | | | 9.81 | |
5 Year | | | | | | | | 7.67 | | 7.32 | | | | | | 7.51 | |
Inception: 3/31/97 | | | | | | | | | | | | | | | | | |
• COMPOSITE STRUCTURE – The Alliance High Grade AGG Composite includes fee-paying discretionary tax-exempt accounts with assets over $10 million in US dollars, which are not subject to significant investment restrictions imposed by clients. The composite was created on October 31, 2000.
• RATE OF RETURN – No representation is made that the performance shown in this presentation is indicative of future performance. A portfolio could incur losses as well as gains. Performance figures for each account are calculated monthly on a trade-date basis using an internal rate-of-return calculation. Monthly market values include income accruals and reflect the daily weighting of cash flows. The composite results are asset weighted on a monthly basis. Quarterly and annual composite performance figures are computed by linking monthly returns, resulting in a “time-weighted” rate of return. Performance results include the reinvestment of dividends and other earnings. Returns are calculated in US dollars.
* N/M represents “not meaningful”. N/M coding indicates that only one account, or no accounts, are in the Composite for the full year. Dispersion is only shown for accounts included in each quarter of each year presented.
46
Performance Disclosure
Insurance Composite
Period | | Composite Assets (millions) | | Composite% of Firm Assets | | # of Accounts | | Gross Return% | | Net Return % | | Composite Dispersion | | Firm Assets (billions) | | Customized Benchmark | |
2003:1Q | | 2261.4 | | 0.66 | | 8 | | 2.45 | | 2.41 | | 0.40 | | 341.3 | | 2.08 | |
2003:YTD | | 2261.4 | | 0.66 | | 8 | | 2.45 | | 2.41 | | 0.40 | | 341.3 | | 2.08 | |
2002 | | 2415.8 | | 0.70 | | 9 | | 10.79 | | 10.59 | | 1.04 | | 346.9 | | 10.46 | |
2001 | | 2094.5 | | 0.51 | | 9 | | 9.69 | | 9.49 | | 0.81 | | 412.2 | | 9.41 | |
2000 | | 1808.0 | | 0.40 | | 8 | | 10.92 | | 10.73 | | 0.50 | | 450.0 | | 9.77 | |
1999 | | 1811.1 | | 0.49 | | 10 | | 0.40 | | 0.22 | | 1.09 | | 368.3 | | -0.09 | |
1998 | | 1781.2 | | 0.62 | | 10 | | 8.46 | | 8.27 | | 0.50 | | 286.7 | | 8.35 | |
1997 | | 1465.4 | | 0.67 | | 8 | | 9.37 | | 9.17 | | 0.57 | | 218.7 | | 8.89 | |
1996 | | 1356.9 | | 0.74 | | 9 | | 4.02 | | 3.83 | | 0.53 | | 182.8 | | 3.94 | |
1995 | | 760.7 | | 0.52 | | 5 | | 18.91 | | 18.70 | | N/M* | | 146.5 | | 18.62 | |
1994 | | 557.9 | | 0.46 | | 4 | | -1.73 | | -1.91 | | N/M* | | 121.3 | | -2.41 | |
1993 | | 563.8 | | 0.49 | | 4 | | 11.16 | | 10.97 | | N/M* | | 115.2 | | 9.91 | |
1 Year | | | | | | | | 13.66 | | 13.46 | | | | | | 13.01 | |
3 Year | | | | | | | | 10.74 | | 10.54 | | | | | | 10.10 | |
5 Year | | | | | | | | 8.12 | | 7.93 | | | | | | 7.60 | |
10 Year | | | | | | | | 7.84 | | 7.65 | | | | | | 7.31 | |
• COMPOSITE STRUCTURE – The Insurance Composite includes fee-paying discretionary taxable accounts with assets over $40 million in US dollars, which are not subject to significant investment restrictions imposed by clients. The Composite does not include the fixed income segment of balanced accounts. The composite’s benchmark used in the presentation is a customized, asset-weighted blend of the benchmarks of each of the accounts in the Composite(‘custom benchmark’). A weighting is applied to the benchmarks by using the prior month-end market values of the portfolios within the Composite. Prior to the beginning of a new quarter, if an account is added or deleted, the custom benchmark will automatically be rebalanced to include the new account’s market value and benchmark. The terminated account’s market value and benchmark return will be excluded. The creation date of this Composite was prior to December 1993, the first year that this Composite was AIMR verified.
• TOTAL RETURN METHODOLOGY AND FEE STRUCTURE – Performance figures in this presentation have been presented gross and net of investment-management fees. Net performance figures have been calculated by deducting the highest fee charged to an account in the Composite, which was an annual fee of 0.18%. From January 2001 forward, the Composite’s net-of-fee return is based upon a weighted average of the actual fee rates charged to each account in the composite. The fee applied was 0.18%. Both fee structures exclude accounts with performance-based fee arrangements. Net-of-fee performance figures reflect the compounding effect of such fees.
* N/M represents “not meaningful”. N/M coding indicates that only one account, or no accounts, are in the Composite for the full year. Dispersion is only shown for accounts included in each quarter of each year presented.
Alliance US Relative Value Composite
Period | | Composite Assets (millions) | | Composite% of Firm Assets | | # of Accounts | | Gross Return% | | Net Return % | | Composite Dispersion | | Firm Assets (billions) | | S&P 500 | | Russell 1000 Value | |
1Q | | 2098.1 | | 0.62 | | 18 | | -1.92 | | -1.98 | | 0.58 | | 341.3 | | -3.15 | | -4.86 | |
YTD | | 2098.1 | | 0.62 | | 18 | | -1.92 | | -1.98 | | 0.58 | | 341.3 | | -3.15 | | -4.86 | |
2002 | | 2082.7 | | 0.6 | | 18 | | -22.09 | | -22.32 | | 1.24 | | 346.9 | | -22.1 | | -15.52 | |
2001 | | 2099.2 | | 0.51 | | 13 | | -1.73 | | -1.92 | | 0.50 | | 412.2 | | -11.88 | | -5.59 | |
2000 | | 1596.1 | | 0.35 | | 8 | | 15.9 | | 15.04 | | 0.24 | | 450 | | -9.11 | | 7.01 | |
1999 | | 1248.5 | | 0.34 | | 2 | | 10.45 | | 9.63 | | 0.76 | | 368.3 | | 21.04 | | 7.35 | |
1998 | | 1443.5 | | 0.5 | | 10 | | 22.86 | | 21.96 | | 0.54 | | 286.7 | | 28.58 | | 15.63 | |
1997 | | 1493.4 | | 0.68 | | 13 | | 29.77 | | 28.83 | | 0.23 | | 218.7 | | 33.36 | | 35.18 | |
1996 | | 761.3 | | 0.42 | | 3 | | 26.4 | | 25.48 | | 0.39 | | 182.8 | | 22.96 | | 21.64 | |
1995 | | 1024.4 | | 0.7 | | 5 | | 38.17 | | 37.17 | | 2.72 | | 146.5 | | 37.58 | | 38.35 | |
1 Year | | | | | | | | -24.87 | | -25.05 | | | | | | -24.76 | | -22.79 | |
3 Year | | | | | | | | -5.26 | | -5.6 | | | | | | -16.09 | | -6.86 | |
5 Year | | | | | | | | 0.89 | | 0.37 | | | | | | -3.77 | | -2.03 | |
47
Performance Disclosure
• COMPOSITE STRUCTURE – The Alliance US Relative Value Composite includes fee-paying discretionary tax-exempt accounts with assets over $10 million in US dollars, which are not subject to significant investment restrictions imposed by clients. The Composite includes the equity segment of balanced accounts. In these portfolios, the asset allocation mix is generally determined by client guidelines and cash flows are allocated in accordance with these guidelines. The composite has been restated to reflect a material change in the investment process during the fourth quarter of 1994. The nature of the restatement has resulted in a change in the inception of the composite from January 1, 1992 to January 1, 1995. No other changes occurred as a result of this restatement. The creation date of this Composite was prior to December 1992, the first year that this composite was AIMR verified.
• TOTAL RETURN METHODOLOGY AND FEE STRUCTURE — Performance figures in this presentation have been presented gross and net of investment-management fees. Net performance figures have been calculated by deducting the highest fee charged to an account in the Composite, which was an annual fee of 0.75%. From January 2001 forward, the Composite’s net of fee return is based upon a weighted average of the actual fee rates charged to each account in the composite. The fee applied was 0.25%. Both fee structures exclude accounts with performance-based fee arrangements. Net-of-fee performance figures reflect the compounding effect of such fees.
Bernstein US STRATEGIC VALUE Composite
• TOTAL RETURN METHODOLOGY AND FEE STRUCTURE – Performance figures in this report have been presented gross and net of investment-management fees. Prior to 1983, management fees were not charged; instead, the accounts incurred transaction costs. From 1983 through 1992, the composite’s net-of-fee return is the equal-weighted average of the actual after-fee returns of each account in the composite. From 1993 forward, the composite’s net-of-fee return is the asset-weighted average of the actual after-fee returns of each account in the composite. Net-of-fee performance figures reflect the compounding effect of such fees.
• RATE OF RETURN–No representation is made that the performance shown in this presentation is indicative of future performance. A portfolio could incur losses as well as gains. Performance returns for each account are calculated monthly on a trade-date basis using an internal rate-of-return calculation. Performance results are made on a total-return basis, which includes all income from dividends and interest, and realized and unrealized gains or losses. Prior to July 1993, all cash flows were assumed to have occurred on the last day of the month. From July 1993 through 2000, if an account’s net monthly cash flows were equal to or exceeded 10% of its beginning market value, the Modified Dietz Method was used to daily weight the cash flows. When an account’s net monthly cash flows were less than 10% of its beginning market value, the cash flows were assumed to have occurred on the last day of the month. Beginning 2001, all cash flows are daily weighted using the Modified Dietz Method.
Beginning 1993, the composite returns are asset weighted on a monthly basis. Prior to 1993, the composite results are equal weighted on a quarterly basis. These monthly and quarterly performance figures are geometrically linked to calculate cumulative and/or annualized rates of return for various time periods. Returns for the portfolios in the composite are calculated in US dollars.
• COMPOSITE STRUCTURE–Preliminarily, as of March 31, 2003, the US Strategic Value composite (“Composite”) consisted of 208 accounts with a market value of $10,907.00 million in US dollars, which represents 3.14% of the firm’s total assets. Beginning 1993, the Composite includes fee-paying institutional discretionary accounts with assets over $5 million in US dollars which are not subject to significant investment restrictions imposed by clients. From 1983 through 1992, the Composite includes all discretionary accounts with assets over $5 million in US dollars. Prior to 1983, the Composite includes all accounts regardless of size. The Composite was created in March 2002 with an inception date of December 31, 1973.
• DISPERSION–The dispersion of annual returns was calculated based on the equal-weighted standard deviation in 1992 and on the asset-weighted standard deviation from 1993 forward. Dispersion of performance for the Composite is as follows: 1992: 1.42%; 1993: 1.19%; 1994: 0.69%; 1995: 1.24%; 1996: 1.10%; 1997: 1.95%; 1998: 1.74%; 1999: 1.92%; 2000: 2.38%; 2001: 1.51%; 2002: 2.00%.
• ANNUAL RETURNS –Gross: 1992: 26.89%; 1993: 27.30%; 1994: 1.30%; 1995: 38.01%; 1996: 24.71%; 1997: 27.79%; 1998: 10.34%; 1999: 0.25%; 2000: 10.46%; 2001: 10.13%; 2002: (16.97)%; 2003Q1: (3.26)%. Net: 1992: 26.05%; 1993: 26.69%; 1994: 0.81%; 1995: 37.36%; 1996: 24.15%; 1997: 27.25%; 1998: 9.88%; 1999: (0.16)%; 2000: 9.98%; 2001: 9.67%; 2002: (17.36)%; 2003Q1: (3.38)%.
Bernstein US DIVERSIFIED VALUE Composite (optimized to the Russell 1000 Value Index)
1) TOTAL RETURN METHODOLOGY AND FEE STRUCTURE–Performance figures in this report have been presented gross and net of investment-management fees. The composite’s net-of-fee return is the asset-weighted average of the actual after-fee returns of each account in the composite. Net-of-fee performance figures reflect the compounding effect of such fees.
48
Performance Disclosure
2) RATE OF RETURN–No representation is made that the performance shown in this presentation is indicative of future performance. A portfolio could incur losses as well as gains. Performance returns for each account are calculated monthly on a trade-date basis using an internal rate-of-return calculation. Performance results are made on a total-return basis, which includes all income from dividends and interest, and realized and unrealized gains or losses. Prior to 2001, if an account’s net monthly cash flows were equal to or exceeded 10% of its beginning market value, the Modified Dietz Method was used to daily weight the cash flows. When an account’s net monthly cash flows were less than 10% of its beginning market value, the cash flows were assumed to have occurred on the last day of the month. Beginning 2001, all cash flows are daily weighted using the Modified Dietz Method. The composite returns are asset weighted on a monthly basis. These monthly performance figures are geometrically linked to calculate cumulative and/or annualized rates of return for various time periods. Returns for the portfolios in the composite are calculated in US dollars.
3) COMPOSITE STRUCTURE–Preliminarily, as of March 31, 2003, the US Diversified Value composite (opt. R1000V) (“Composite”) consisted of 102 accounts with a market value of $9,605.22 million in US dollars, which represents 2.77% of the firm’s total assets. The Composite commenced on March 31, 1999 and included only 2 private-client, fee-paying, discretionary portfolios in the 2nd quarter of 1999. These portfolios are managed as if they are institutional and remain in the composite until they no longer meet the criteria for inclusion. No other private-client portfolios are included. Beginning June 30, 1999, the composite includes fee-paying institutional discretionary accounts that are not subject to significant investment restrictions imposed by clients. The Composite was created in March 2002 with an inception date of March 31, 1999.
4) DISPERSION–The dispersion of annual returns was calculated based on the asset-weighted standard deviation. Dispersion of performance for the Composite is as follows: 3/31–12/31/99: N/M*; 2000: 1.92%; 2001: 0.80%; 2002: 0.82%.
5) ANNUAL RETURNS–Gross: 3/31-12/31/99: 2.21%; 2000: 13.86%; 2001: 4.20%; 2002: (12.22)%; 2003Q1: (4.17)%. Net: 3/31-12/31/99: 1.94%; 2000: 13.40%; 2001: 3.84%; 2002: (12.54)%; 2003Q1: (4.26)%.
* N/M represents “not meaningful.” N/M coding indicates that 5 or fewer accounts are in the Composite for the full year.
Bernstein US SMALL & MIDCAP VALUE Composite
• TOTAL RETURN METHODOLOGY AND FEE STRUCTURE–Performance figures in this report have been presented gross and net of investment-management fees. The composite’s net-of-fee return is the asset-weighted average of the actual after-fee returns of each account in the composite. Net-of-fee performance figures reflect the compounding effect of such fees.
• RATE OF RETURN–No representation is made that the performance shown in this presentation is indicative of future performance. A portfolio could incur losses as well as gains. Performance figures for each account are calculated monthly on a trade-date basis using an internal rate-of-return calculation. Performance results are made on a total-return basis, which includes all income from dividends and interest, and realized and unrealized gains or losses. All cash flows are daily weighted using the Modified Dietz Method. The composite results are asset weighted on a monthly basis. These monthly performance figures are geometrically linked to calculate cumulative and/or annualized rates of return for various time periods. Returns for the portfolios in the composite are calculated in US dollars.
• Composite Structure–Preliminarily, as of March 31, 2003, the AllianceBernstein Small and MidCap Value composite (“Composite”) consisted of four accounts with a market value of $130.88 million in US dollars, which represents less than 1.0% of the firm’s total assets. The Composite includes fee-paying institutional discretionary accounts which are not subject to significant investment restrictions imposed by clients. The Composite was created in March 2002 with an inception date of December 31, 2000.
• DISPERSION – Dispersion of performance for the Composite is as follows: 2001: N/M*; 2002: N/M*.
• ANNUAL RETURNS–Gross: 2001: 23.40%; 2002: (6.78)%; 2003Q1: (6.54)%. Net: 2001: 22.57%; 2002: (7.40)%; 2003Q1: (6.70)%.
* N/M represents “not meaningful.” N/M coding indicates that 5 or fewer accounts are in the Composite for the full year.
Bernstein EMERGING MARKETS VALUE Composite
1) TOTAL RETURN METHODOLOGY AND FEE STRUCTURE–Performance figures in this report have been presented gross and net of investment-management fees. Net performance figures have been calculated by deducting the highest fee payable by an account of this type; 1.25% annually. Net-of-fee performance figures reflect the compounding effect of such fees.
2) RATE OF RETURN–No representation is made that the performance shown in this presentation is indicative of future performance. A portfolio could incur losses as well as gains. Performance returns for each account are calculated monthly on a trade-date basis using an internal rate-of-return calculation. Performance results are made on a total-return basis, which includes all income from dividends and interest, and realized and unrealized gains or losses. Prior to 2001, if an account’s net monthly cash flows were equal to or exceeded 10% of its
49
Performance Disclosure
beginning market value, the Modified Dietz Method was used to daily weight the cash flows. When an account’s net monthly cash flows were less than 10% of its beginning market value, the cash flows were assumed to have occurred on the last day of the month. Beginning 2001, all cash flows are daily weighted using the Modified Dietz Method. The composite returns are asset weighted on a monthly basis. These monthly performance figures are geometrically linked to calculate cumulative and/or annualized rates of return for various time periods. The composite contains portfolios of clients denominated in foreign currencies. To calculate composite performance, each portfolio’s monthly returns are converted to US dollars using WM Reuters month-end exchange rates.
3) COMPOSITE STRUCTURE–Preliminarily, as of March 31, 2003, the Emerging Markets Value composite (“Composite”) consisted of seven accounts with a market value of $1,414.99 million in US dollars, which represents less than 1.0% of the firm’s total assets. The Composite includes fee-paying institutional and pooled discretionary accounts which are not subject to significant investment restrictions imposed by clients. In 1996, the Composite consisted of a single-pooled discretionary account. The withholding tax basis of the composite is consistent with the benchmark, which is Luxembourg. The Composite was created in March 2002 with an inception date of December 31, 1995. As of March 31, 2003, the Composite had 0.3% of its assets invested in countries or regions outside of the benchmark, the MSCI Emerging Markets Free Index.
4) DISPERSION–The dispersion of annual returns was calculated based on the asset-weighted standard deviation. Dispersion of performance for the Composite is as follows: 1996: N/M*; 1997: N/M*; 1998: N/M*; 1999: N/M*; 2000: N/M*; 2001: N/M*; 2002: N/M*.
5) ANNUAL RETURNS–Gross: 1996: 9.06%; 1997: (21.56)%; 1998: (18.40)%; 1999: 73.28%; 2000: (26.83)%; 2001: (1.12)%; 2002: 6.14%; 2003Q1: (2.52)%. Net: 1996: 7.71%; 1997: (22.54)%; 1998: (19.42)%; 1999: 71.13%; 2000: (27.74)%; 2001: (2.35)%; 2002: 4.82%; 2003Q1: (2.82)%.
* N/M represents “not meaningful.” N/M coding indicates that 5 or fewer accounts are in the Composite for the full year.
Bernstein INTERNATIONAL VALUE Composite (Half Hedged, GDP weighted)
1) TOTAL RETURN METHODOLOGY AND FEE STRUCTURE–Performance figures in this report have been presented gross and net of investment-management fees. The composite’s net-of-fee return is the asset-weighted average of the actual after-fee returns of each account in the composite. Net-of-fee performance figures reflect the compounding effect of such fees.
2) RATE OF RETURN–No representation is made that the performance shown in this presentation is indicative of future performance. A portfolio could incur losses as well as gains. Performance returns for each account are calculated monthly on a trade-date basis using an internal rate-of-return calculation. Performance results are made on a total-return basis, which includes all income from dividends and interest, and realized and unrealized gains or losses. From July 1993 through 2000, if an account’s net monthly cash flows were equal to or exceeded 10% of its beginning market value, the Modified Dietz Method was used to daily weight the cash flows. When an account’s net monthly cash flows were less than 10% of its beginning market value, the cash flows were assumed to have occurred on the last day of the month. Beginning 2001, all cash flows are daily weighted using the Modified Dietz Method. The composite returns are asset weighted on a monthly basis. These monthly performance figures are geometrically linked to calculate cumulative and/or annualized rates of return for various time periods. Returns for the portfolios in the composite are calculated in US dollars.
3) COMPOSITE STRUCTURE–Preliminarily, as of March 31, 2003, the International Value composite (HH, GDP) (“Composite”) consisted of 22 accounts with a market value of $1,335.53 million in US dollars, which represents less than 1.0% of the firm’s total assets. From July 1992 through September 1993, the Composite consisted of a single-pooled discretionary account. Beginning July 1993, the pooled discretionary account is excluded and the Composite includes only fee-paying institutional discretionary accounts, which are not subject to significant investment restrictions imposed by clients. The withholding tax basis of the composite is consistent with the benchmark, which is Luxembourg. The Composite was created in March 2002 with an inception date of June 30, 1992. As of March 31, 2003, the Composite had 5.7% of its assets invested in countries or regions outside of the benchmark, the MSCI EAFE Index (half hedged, GDP weighted).
4) DISPERSION–The dispersion of annual returns was calculated based on the asset-weighted standard deviation. Dispersion of performance for the Composite is as follows: 6/30–12/31/92: N/M*; 1993: N/M*; 1994: 1.00%; 1995: 1.04%; 1996: 0.62%; 1997: 1.26%; 1998: 1.41%; 1999: 1.81%; 2000: 1.18%; 2001: 1.00%; 2002: 0.85%.
5) ANNUAL RETURNS–Gross: 6/30–12/31/92: (4.08)%; 1993: 37.45%; 1994: 5.65%; 1995: 9.48%; 1996: 18.69%; 1997: 10.54%; 1998: 14.49%; 1999: 22.01%; 2000: (1.79)%; 2001: (10.73)%; 2002: (7.61)%; 2003Q1: (5.78)%. Net: 6/30—12/31/92: (4.99)%; 1993: 36.00%; 1994: 5.11%; 1995: 8.84%; 1996: 18.14%; 1997: 9.84%; 1998: 13.81%; 1999: 21.32%; 2000: (2.42)%; 2001: (11.22)%; 2002: (8.19)%; 2003Q1: (5.90)%.
* N/M represents “not meaningful.” N/M coding indicates that 5 or fewer accounts are in the Composite for the full year.
50
Performance Disclosure
Past performance is not indicative of future results. Returns are as of 3/31/03. Because of ongoing market volatility, performance may be subject to substantial fluctuations since that date and may be more or less than that shown. Average annual returns are for Class A shares at NAV. Returns for Class B, Class C and Advisor Class shares will vary due to different expenses associated with these classes.
The Lipper Averages represent the performance of funds that have generally similar investment objectives to the AllianceBernstein funds, although investment policies for the various funds may differ.
Balanced Accounts
Composite Performance Disclosure, Net of Fees
1) Performance Statistics Are Not Financial Statements - There are various methods of compiling or reporting performance statistics. The standards of performance measurement used in compiling these data are in accordance with the methods set forth below. Past performance statistics are not indicative of future results.
2) Total Return - Performance results of accounts and comparisons are made on a total-return basis, which includes all dividends, interest and accrued interest, and realized and unrealized gains or losses. Performance results are after deductions of all transaction charges and fees.
3) Rate of Return - Investment results are computed on a “time-weighted” rate-of-return basis. Assuming dividends and interest are reinvested, the growth in dollars of an investment in a period can be computed using these rates of return. In computing the time-weighted rate of return, if an account’s net monthly cash flow exceeds 10% of its beginning market value, the cash flows are weighted on a daily basis. When an account’s net monthly cash flows are less than 10% of its beginning market value, the cash flows are weighted by the “end-of-the-month” assumption. Beginning 2001, all cash flows are daily weighted using the modified Dietz method.
4) Preparation of Data - Investment results on a quarterly basis for All Balanced Accounts for the entire quarter were added together and the sum divided by the total number of accounts in each quarter to produce a series of average quarterly performance figures. These quarterly performance figures were then linked to produce a continuous-performance index. The continuous-performance index from inception was used to create point-to-point comparisons. Closed accounts are included for each full quarter prior to their closing. All Balanced Accounts include various types of accounts with any combination of equity and fixed income, in any percentage mix.
5) Dispersion - Dispersion, or standard deviation, measures the variability of account returns within a composite. In a normal distribution, approximately two-thirds of the account returns will fall within the range of one standard deviation above and below the equal-weighted mean return. Dispersion of performance for All Balanced Accounts under management were as follows: 1974: 20.4; 1975: 18.3; 1976: 10.7; 1977: 7.4; 1978: 7.7; 1979: 6.9; 1980: 7.2; 1981: 4.9; 1982: 5.8; 1983: 4.6; 1984: 3.1; 1985: 3.5; 1986: 2.6; 1987: 6.3; 1988: 2.4; 1989: 2.5; 1990: 4.4; 1991: 4.1; 1992: 3.5; 1993: 2.3; 1994: 2.1; 1995: 2.9; 1996: 2.1; 1997: 2.8; 1998: 4.1; 1999: 4.6; 2000: 5.7; 2001: 4.3; 2002: 4.9; 2003: N/A.
6) Financial Securities Environment - Various indices are used to indicate the type of investment environment existing during the time periods shown. Year 2002 data are preliminary, pending completion of internal audit.
Strategic Value (All)
Composite Performance Disclosure, Net of Fees
1. General notes:
a. Performance Statistics Are Not Financial Statements - - There are various methods of compiling or reporting performance statistics. The standards of performance measurement used in compiling these data are in accordance with the methods set forth below. Past performance statistics are not indicative of future results. A portfolio could suffer losses as well as gains.
b. Capital Markets Environment - Various indices are used to indicate the type of investment environment existing during the time periods shown.
c. Total Return – Performance figures for each account are calculated monthly using an internal rate-of-return calculation. Performance results of accounts and comparisons are made on a total-return basis, which includes all income from dividends and interest, and realized and unrealized gains or losses. Assuming dividends and interest are reinvested, the growth in dollars of an investment in a period can be computed using these rates of return. Investment results are computed on a “time-weighted” rate-of-return basis. Securities are included in accounts on a trade-date basis. Closed accounts are included for each full quarter prior to their closing. Performance results are after transaction charges, and are after the deduction of all fees as described below.
51
Performance Disclosure
d. Preparation of Data - Investment results for the Strategic Value (All) composite discretionary accounts are added together and the sum divided by the total number of accounts to produce a series of average quarterly performance figures. Strategic Value (All) composite returns include all accounts from 1974-1999 that are not subject to significant investment restrictions imposed by clients. Beginning January 1, 2000, results exclude accounts with a client-directed margin balance of 20% or more of market value at any month end. Prior to 2001, in computing the time-weighted rate of return, if an account’s net monthly cash flow was equal to or exceeded 10% of its beginning market value, the modified Dietz method was used to daily weight the cash flows. When an account’s net monthly cash flows were less than 10% of its beginning market value, the cash flows were assumed to have occurred on the last day of the month. Beginning 2001, all cash flows are daily weighted using the modified Dietz method.
2. Net-of-fee performance figures for the Strategic Value (All) composite have been calculated as follows:
a. Prior to 1983, management fees were not charged; instead, the accounts incurred transaction costs.
b. From 1983 forward, the composite’s net-of-fee return is the equal-weighted average of the actual after-fee returns of Strategic Value accounts in the composite.
3. Dispersion: Dispersion is calculated on the gross-of-fee returns. Dispersion, or standard deviation, measures the variability of account returns within a composite. In a normal distribution, approximately two-thirds of the account returns will fall within the range of one standard deviation above and below the equal-weighted mean return.
Dispersion of returns for Strategic Value (All) is as follows: 1974: 26.0; 1975: 20.3; 1976: 14.3; 1977: 8.3; 1978: 10.9; 1979: 8.5; 1980: 7.8; 1981: 5.5; 1982: 5.6; 1983: 3.7; 1984: 2.8; 1985: 2.4; 1986: 2.1; 1987: 3.3; 1988: 2.1; 1989: 1.7; 1990: 2.1; 1991: 2.4; 1992: 2.1; 1993: 1.6; 1994: 1.4; 1995: 1.6; 1996: 1.4; 1997: 1.9; 1998: 2.9; 1999: 3.1; 2000: 3.0; 2001: 2.2; 2002: 2.7; 2003: N/A.
Year 2002 data are preliminary, pending completion of internal audit.
Strategic Growth
Composite Performance Disclosure, Net of Fees
1. General Notes:
a. Performance Statistics Are Not Financial Statements - - There are various methods of compiling or reporting performance statistics. The standards of performance measurement used in compiling these data are in accordance with the methods set forth below. Past performance statistics are not indicative of future results. A portfolio could suffer losses as well as gains.
b. Capital Markets Environment - Various indices are used to indicate the type of investment environment existing during the time periods shown.
c. Total Return – Performance figures for each account are calculated monthly using an internal rate-of-return calculation. Performance results of accounts and comparisons are made on a total-return basis, which includes all income from dividends and interest, and realized and unrealized gains or losses. Assuming dividends and interest are reinvested, the growth in dollars of an investment in a period can be computed using these rates of return. Investment results are computed on a “time-weighted” rate-of-return basis. Securities are included in accounts on a trade-date basis. Closed accounts are included for each full quarter prior to their closing. Performance results are after transaction charges, and are after the deduction of all fees as described below.
d. Preparation of Data - The performance results of the Strategic Growth composite are calculated by linking the asset-weighted quarterly returns of the Alliance Large Cap Growth composite for the period 1979 through 2000 with those of Strategic Growth thereafter. The quarterly asset-weighted returns are geometrically linked to calculate cumulative and/or annualized rates of return for various periods. Alliance Large Cap Growth differs from Strategic Growth, which is offered exclusively to clients of the Bernstein Investment Research and Management unit of Alliance Capital Management L.P., in that, among other things, Strategic Growth offers tax management and may contain fewer stocks.
2. Alliance Large Cap Growth Composite Methodology (1979-2000) - Monthly market values include income accruals and reflect the daily weighting of cash flows. The Alliance Large Cap Growth composite results are asset-weighted on a monthly basis. The quarterly composite performance figures are computed by linking the monthly returns, resulting in a time-weighted rate of return. The composite includes fee-paying discretionary tax-exempt accounts with assets over $10 million not subject to significant investment restrictions imposed by clients. The composite includes the equity segment of balanced accounts. In these equity portfolios, the asset-allocation mix is generally determined by client guidelines and cash flows are allocated in accordance with these guidelines. Fee structures exclude accounts with performance-based fee arrangements. Net-of-fee performance figures reflect the compounding effect of such fees.
3. Strategic Growth Composite Methodology (2001- present) - The Strategic Growth composite returns are calculated on a quarterly basis with each account’s return weighted by its prior quarter-end market value. All cash flows are daily weighted using the modified Deitz method. Results exclude accounts with a client-directed margin balance of 20% or more of market value at any month end.
4. Net-of-Fee Performance Figures - Net-of-fee performance figures have been calculated as follows:
a. From 1979-1982, 0.75%, the highest annual fee charged to an Alliance Large Cap Growth account for that period (excluding accounts with performance-based fee arrangements) was deducted from the composite’s gross-of-fee returns.
b. From 1983 through 2000, the actual average quarterly fee charged by Bernstein for the Strategic Value (All) service was deducted from the Alliance Large Cap Growth composite gross-of-fee returns.
c. From January 2001 forward, the composite’s net-of-fee return is the asset-weighted average of the actual after-fee returns of Strategic Growth accounts in the composite.
5. Dispersion - Dispersion is calculated on the gross-of-fee returns. Dispersion, or standard deviation, measures the variability of account returns within a composite. In a normal distribution, approximately two-thirds of the account returns will fall within the range of one standard deviation above and below the asset-weighted mean return. Dispersion of returns for accounts within the Alliance Large Cap Growth from 1979-2000 is as follows 1979: 4.7; 1980: 1.4; 1981: 2.4; 1982: 3.1; 1983: 2.4; 1984: 2.1; 1985: 2.6; 1986: 5.3; 1987: 3.9; 1988: 2.9; 1989: 5.4; 1990: 1.5; 1991: 3.3; 1992: 3.1; 1993: 1.6; 1994: 1.2; 1995: 1.9; 1996: 1.3; 1997: 5.0; 1998: 2.4; 1999: 3.2; 2000: 2.1. Dispersion of returns for Strategic Growth is as follows: 2001: 2.2; 2002: 1.4; 2003: N/A.
Year 2002 data are preliminary, pending completion of internal audit.
52
Performance Disclosure
50/50 Simulation - Strategic Value (All) and Strategic Growth
Composite Performance Disclosure, Net of Fees (“50/50 (All)”)
1. General Notes:
a. Performance Statistics Are Not Financial Statements - There are various methods of compiling or reporting performance statistics. The standards of performance measurement used in compiling these data are in accordance with the methods set forth below. Past performance and simulation statistics are not indicative of future results. A portfolio could suffer losses as well as gains.
b. Capital Markets Environment – Various indices are used to indicate the type of investment environment existing during the time periods shown.
c. Total Return – Performance figures for each account are calculated monthly using an internal rate of return calculation. Performance results of accounts and comparisons are made on a total-return basis, which includes all income from dividends and interest, and realized and unrealized gains or losses. Assuming dividends and interest are reinvested, the growth in dollars of an investment in a period can be computed using these rates of return. Investment results are computed on a “time-weighted” rate-of-return basis. Securities are included in accounts on a trade-date basis. Closed accounts are included for each full quarter prior to their closing. Performance results are after transaction charges, other than the transaction charges involved in periodic rebalancing, and are after the deduction of all fees as described below.
2. Preparation of Data:
a. 50/50 (All) Simulation Overview - The 50/50 (All) composite results are calculated on a quarterly basis by summing in a 50/50 percentage ratio (i) the after-fee returns of the Alliance Large Cap Growth composite from 1/1/79 through 12/31/00, and thereafter the actual Strategic Growth composite after-fee returns with (ii) the actual Strategic Value (All) composite after-fee returns. These quarterly performance figures are then geometrically linked to calculate cumulative and/or annualized returns for various time periods.
b. Strategic Value (All) Composite Methodology - Investment results for Strategic Value (All) composite discretionary accounts are added together and the sum divided by the total number of accounts in each quarter to produce a series of average quarterly performance figures. Strategic Value (All) composite returns include all accounts from 1974-1999, which are not subject to significant investment restrictions imposed by clients. Beginning January 1, 2000, results exclude accounts with a client-directed margin balance of 20% or more of market value at any month end. Prior to 2001, in computing the time-weighted rate of return, if an account’s net monthly cash flow was equal to or exceeded 10% of its beginning market value, the modified Dietz method was used to daily weight the cash flows. When an account’s net monthly cash flows were less than 10% of its beginning market value, the cash flows were assumed to have occurred on the last day of the month. Beginning 2001, all cash flows are daily weighted using the modified Dietz method.
c. Strategic Growth Methodology - The performance results of the Strategic Growth composite are calculated by geometrically linking the asset-weighted quarterly returns of the Alliance Large Cap Growth composite for the period 1979 through 2000 with those of Strategic Growth thereafter. Alliance Large Cap Growth differs from Strategic Growth, which is offered exclusively to clients of the Bernstein Investment Research and Management unit of Alliance Capital Management L.P., in that, among other things, Strategic Growth offers tax management and may contain fewer stocks.
(i) Alliance Large Cap Growth Methodology (1979-2000) - Monthly market values include income accruals and reflect the daily weighting of cash flows. The Alliance Large Cap Growth composite results are asset-weighted on a monthly basis. The quarterly composite performance figures are computed by linking the monthly returns, resulting in a time-weighted rate of return. The composite includes fee-paying discretionary tax-exempt accounts with assets over $10 million, which are not subject to significant investment restrictions imposed by clients. The composite includes the equity segment of balanced accounts. In these equity portfolios, the asset allocation mix is generally determined by client guidelines and cash flows are allocated in accordance with these guidelines. Fee structures exclude accounts with performance-based fee arrangements. Net-of-fee performance figures reflect the compounding effect of such fees.
(ii) Strategic Growth Composite Methodology (2001-Present) - The Strategic Growth composite returns are calculated on a quarterly basis with each account’s return weighted by its prior quarter-end market value. All cash flows are daily weighted using the modified Dietz method. Results exclude accounts with a client-directed margin balance of 20% or more of market value at any month end.
3. Net-of-Fee Performance figures - Net-of-fee performance figures for the 50/50 (All) composite have been calculated as follows:
a. Growth:
(i) From 1979-1982, 0.75%, the highest annual fee charged to an Alliance Large Cap Growth account for that period (excluding accounts with performance-based fee arrangements), was deducted from the composite’s gross-of-fee returns.
(ii) From 1983 through 2000, the actual average quarterly fee charged by Bernstein for the Strategic Value (All) service was deducted from the Alliance Large Cap Growth Composite gross-of-fee returns.
(iii) From January 2001 forward, the composite’s net-of-fee return is the asset-weighted average of the actual after-fee returns of Strategic Growth accounts in the composite.
53
Performance Disclosure
b. Value:
(i) Prior to 1983, management fees were not charged; instead, the accounts incurred transaction costs.
(ii) From 1983 forward, the composite’s net-of-fee return is an equal-weighted average of the actual after-fee returns of Strategic Value accounts in the composite.
4. Notes - Simulated portfolio conditions are static; actual balanced portfolios may employ tactical asset allocation and additional rebalancing techniques. Simulated results do not represent actual trading using client assets, even though the underlying portfolio composites do, but:
a. were achieved by means of the retroactive application of a model designed with the benefit of hindsight; and
b. do not reflect the impact that material economic factors may have had on our decision-making.
5. Dispersion - Dispersion is calculated on the gross-of-fee returns. Dispersion, or standard deviation, measures the variability of account returns within a composite. In a normal distribution, approximately two-thirds of the account returns will fall within the range of one standard deviation above and below the equal-weighted mean return for Value and the asset-weighted mean return for Growth.
Dispersion of returns for Alliance Large Cap Growth from 1979-2000 is as follows: 1979: 4.7; 1980: 1.4; 1981: 2.4; 1982: 3.1; 1983: 2.4; 1984: 2.1; 1985: 2.6; 1986: 5.3; 1987: 3.9; 1988: 2.9; 1989: 5.4; 1990: 1.5; 1991: 3.3; 1992: 3.1; 1993: 1.6; 1994: 1.2; 1995: 1.9; 1996: 1.3; 1997: 5.0; 1998: 2.4; 1999: 3.2; 2000: 2.1. Dispersion of returns for Strategic Growth is as follows: 2001: 2.2; 2002: 1.4; 2003: N/A. Dispersion of returns for Strategic Value (All) composite accounts under management from 1974 - 2001 is as follows: 1974: 26.0; 1975: 20.3; 1976: 14.3; 1977: 8.3; 1978: 10.9; 1979: 8.5; 1980: 7.8; 1981: 5.5; 1982: 5.6; 1983: 3.7; 1984: 2.8; 1985: 2.4; 1986: 2.1; 1987: 3.3; 1988: 2.1; 1989: 1.7; 1990: 2.1; 1991: 2.4; 1992: 2.1; 1993: 1.6; 1994: 1.4; 1995: 1.6; 1996: 1.4; 1997: 1.9; 1998: 2.9; 1999: 3.1; 2000: 3.0; 2001: 2.2; 2002: 2.7; 2003: N/A. Year 2002 data are preliminary - pending completion of internal audit.
54
Alliance Capital Investment Management Services
Alliance Capital provides diversified investment management and related services globally to a broad range of clients:
1. Retail Services consists of investment management products and services distributed to individual investors through financial intermediaries, such as brokers and financial planners by means of:
• mutual funds sponsored by Alliance Capital and consolidated joint venture companies,
• cash management products such as money market funds and deposit accounts,
• mutual fund sub-advisory relationships resulting from the efforts of the mutual fund marketing department, and
• managed account products;
2. Institutional Investment Management Services consists of investment management services to unaffiliated parties such as corporate and public employee pension funds, endowment funds, domestic and foreign institutions and governments, and affiliates such as AXA and its insurance company subsidiaries by means of:
• separate accounts,
• mutual fund shares sold exclusively to institutional investors and high net worth individuals,
• sub-advisory relationships resulting from the efforts of the institutional marketing department,
• structured products, and
• group trusts;
3. Private Client Services consists of investment management services provided to high net worth individuals, trusts and estates, charitable foundations, partnerships, private and family corporations and other entities by means of:
• separate accounts,
• hedge funds and
• certain other vehicles; and
4. Institutional Research Services provided to institutional clients by means of:
• in-depth research,
• portfolio strategy,
• trading and
• brokerage-related services.
55