Exhibit 99.14

Link to searchable text of slide shown above
Link to searchable text of slide shown above

Link to searchable text of slide shown above

Link to searchable text of slide shown above

Link to searchable text of slide shown above
Link to searchable text of slide shown above

Link to searchable text of slide shown above

Link to searchable text of slide shown above

Link to searchable text of slide shown above
Link to searchable text of slide shown above
Link to searchable text of slide shown above
Link to searchable text of slide shown above

Link to searchable text of slide shown above

Link to searchable text of slide shown above
Link to searchable text of slide shown above

Link to searchable text of slide shown above

Link to searchable text of slide shown above

Link to searchable text of slide shown above

Link to searchable text of slide shown above

Link to searchable text of slide shown above

Link to searchable text of slide shown above
Link to searchable text of slide shown above
Link to searchable text of slide shown above

Link to searchable text of slide shown above

Link to searchable text of slide shown above
Link to searchable text of slide shown above

Link to searchable text of slide shown above

Link to searchable text of slide shown above
Link to searchable text of slide shown above

Link to searchable text of slide shown above

Link to searchable text of slide shown above

Link to searchable text of slide shown above
Link to searchable text of slide shown above

Link to searchable text of slide shown above
Link to searchable text of slide shown above

Link to searchable text of slide shown above

Link to searchable text of slide shown above
Link to searchable text of slide shown above

Link to searchable text of slide shown above

Link to searchable text of slide shown above

Link to searchable text of slide shown above
Link to searchable text of slide shown above

Link to searchable text of slide shown above
Searchable text section of graphics shown above
[LOGO]
First-Quarter 2006 Review
APRIL 26, 2006
Lewis A. Sanders | | Gerald M. Lieberman |
Chairman & Chief Executive Officer | | President & Chief Operating Officer |
Any forecasts or opinions in this material may not be realized. Information should not be construed as investment advice.
In light of Regulation FD, management will be limited in responding to inquiries from investors or analysts in a non-public forum.
Forward-Looking Statements
Certain statements in this presentation are “forward-looking statements” within the meaning of the Private Securities Litigation Reform Act of 1995. Such forward-looking statements are subject to risks, uncertainties, and other factors that could cause actual results to differ materially from future results expressed or implied by such forward-looking statements. The most significant of these factors include, but are not limited to, the following: the performance of financial markets, the investment performance we achieve for our clients, general economic conditions, future acquisitions, competitive conditions and government regulations, including changes in tax rates. We caution readers to carefully consider such forward-looking statements in light of these factors. Further, such forward-looking statements speak only as of the date on which such statements are made; we have no obligation to update any forward-looking statements to reflect events or circumstances after the date of such statements. For further information regarding these forward-looking statements and the factors that could cause actual results to differ, see “Risk Factors” in Item 1A of Form 10-K for the year ended December 31, 2005. Any or all of the forward-looking statements that we make in Form 10-K, this presentation, or any other public statements we issue may turn out to be wrong. Please remember that factors other than those listed in “Risk Factors” could also adversely affect our business, operating results, or financial condition.
The forward-looking statements we make in this presentation include descriptions of our pipeline of unfunded mandates. These mandates are not legal commitments, and some or all of them may not be funded dueto a client’s subsequent determination to invest in a different manner.
AllianceBernstein – First Quarter Highlights |
• Strong equity capital markets, especially global and international
• Varied investment performance vs. benchmarks
• Organic growth in all channels and actively managed investment services of $12 billion
• Market appreciation of $27 billion
• Institutional Research Services commissions up 26% from strength of research franchise and growing client interest in algorithmic trading services
• Solid financial results
• AllianceBernstein Operating
• Revenues up 20%
• Pre-Tax Margin up 330 basis points
• Net Income up 35%
• AllianceBernstein Holding
• Net Income per Unit up 35% to $0.78
• Distribution of $0.78 per Unit
Market Performance -Non-U.S. |
[CHART]
*12 months ending March 31, 2006.
Source: MSCI (Morgan Stanley Capital International).
[CHART]
*12 months ending March 31, 2006.
Source: Frank Russell Company, Lehman Brothers, and Standard & Poor’s.
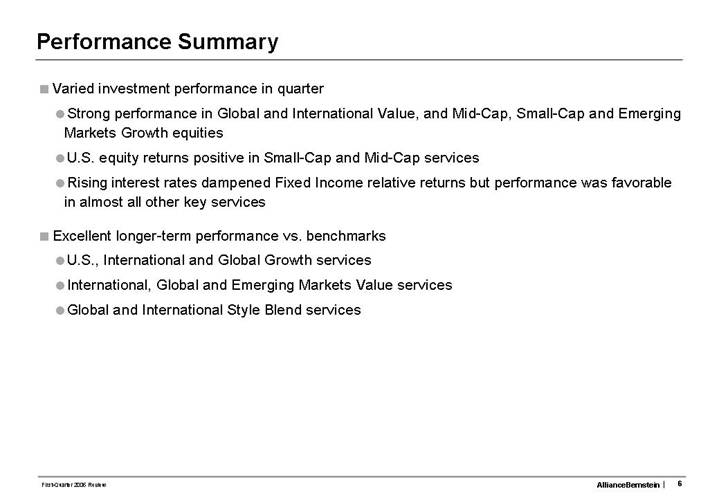
• Varied investment performance in quarter
• Strong performance in Global and International Value, and Mid-Cap, Small-Cap and Emerging Markets Growth equities
• U.S. equity returns positive in Small-Cap and Mid-Cap services
• Rising interest rates dampened Fixed Income relative returns but performance was favorable in almost all other key services
• Excellent longer-term performance vs. benchmarks
• U.S., International and Global Growth services
• International, Global and Emerging Markets Value services
• Global and International Style Blend services
Investment Performance: Delivering Results for Clients |
Net-of-Fee Annualized Performance Premiums
| | Inception | | Inception– | |
| | Date | | Mar 2006 | |
Bernstein Value Equities | | | | | |
[GRAPHIC] | U.S. Strategic Value | | Dec 31, 73 | | +2.6 | % |
[GRAPHIC] | U.S. Diversified Value | | Jun 30, 86 | | +1.1 | |
[GRAPHIC] | Global Value | | Sep 30, 95 | | +3.2 | |
[GRAPHIC] | Emerging Markets Value | | Dec 31, 95 | | +3.8 | |
[GRAPHIC] | European Value | | Jun 30, 97 | | +2.8 | |
[GRAPHIC] | Canadian Value | | Dec 31, 97 | | +5.0 | |
[GRAPHIC] | Global Diversified Value | | Mar 31, 98 | | +2.7 | |
[GRAPHIC] | International Value (EAFE) | | Sep 30, 99 | | +6.2 | |
[GRAPHIC] | U.K. Value | | Jun 30, 00 | | +4.4 | |
[GRAPHIC] | International Diversified Value | | Sep 30, 00 | | +5.8 | |
[GRAPHIC] | U.S. Small/Mid Cap Value | | Dec 31, 00 | | +5.7 | |
[GRAPHIC] | International Strategic Value | | Mar 31, 01 | | +8.8 | |
[GRAPHIC] | Global Strategic Value | | Apr 30, 01 | | +9.2 | |
[GRAPHIC] | Japan Strategic Value | | Mar 31, 02 | | +9.1 | |
[GRAPHIC] | Australian Value | | Jun 30, 03 | | +4.9 | |
| | | | | | |
AllianceBernstein Style Blend | | | | | |
[GRAPHIC] | Emerging Markets Style Blend | | Dec 31, 01 | | +5.6 | % |
[GRAPHIC] | International Style Blend | | Dec 31, 01 | | +2.3 | |
[GRAPHIC] | U.S. Style Blend | | Dec 31, 01 | | +0.8 | |
[GRAPHIC] | Global Style Blend | | Jun 30, 03 | | +3.8 | |
| | Inception | | Inception– | |
| | Date | | Mar 2006 | |
Alliance Growth Equities | | | | | |
[GRAPHIC] | U.S. Growth | | Dec 31, 70 | | +4.2 | % |
[GRAPHIC] | U.S. Small Cap Growth | | Dec 31, 78 | | +3.3 | |
[GRAPHIC] | U.S. Large Cap Growth | | Dec 31, 77 | | +1.8 | |
[GRAPHIC] | U.S. Disciplined Growth | | Dec 31, 87 | | +3.0 | |
[GRAPHIC] | International Large Cap Growth | | Dec 31, 90 | | +8.9 | |
[GRAPHIC] | Emerging Markets Growth | | Sep 30, 91 | | +2.1 | |
[GRAPHIC] | Japan Growth | | Sep 30, 91 | | +3.7 | |
[GRAPHIC] | Global Research Growth | | Dec 31, 91 | | +6.9 | |
[GRAPHIC] | European Concentrated Growth | | Jun 30, 98 | | -2.1 | |
[GRAPHIC] | U.S. Mid Cap Growth | | Mar 31, 99 | | +5.6 | |
[GRAPHIC] | Australian Growth | | Jun 30, 00 | | -1.4 | |
| | | | | | |
AllianceBernstein Fixed Income | | | | | |
[GRAPHIC] | Global Fixed Income | | Jun 30, 86 | | +0.3 | % |
[GRAPHIC] | U.S. High Yield | | Dec 31, 86 | | -0.7 | |
[GRAPHIC] | U.S. Investment-Grade Corporates | | Dec 31, 91 | | +0.4 | |
[GRAPHIC] | U.S. Short Duration | | Mar 31, 92 | | +0.2 | |
[GRAPHIC] | Emerging-Market Debt | | Jun 30, 94 | | +3.1 | |
[GRAPHIC] | U.S. Core Mortgage | | Dec 31, 94 | | +0.1 | |
[GRAPHIC] | U.S. Low Duration | | Dec 31, 95 | | +0.1 | |
[GRAPHIC] | Europe Core Plus | | Mar 31, 99 | | -1.4 | |
[GRAPHIC] | Japan Credit | | Sep 30, 00 | | +0.0 | |
[GRAPHIC] | Global-Plus Fixed Income | | Jun 30, 01 | | +0.5 | |
[GRAPHIC] | U.S. Strategic Core Plus | | Jun 30, 01 | | +0.6 | |
[GRAPHIC] | Canadian Core Plus Advanced | | Sep 30, 02 | | +4.0 | |
The information in this table is provided solely for use in connection with this presentation and is not directed towards existing or potential investment advisory clients of AllianceBernstein. Past performance is no guarantee of future results. The returns presented above are net of fees.
Source: Bloomberg, Citigroup, FTSE, JPMorgan Chase, Lehman Brothers, Merrill Lynch, MSCI, Nomura, Russell Investment Group, Scotia Capital, S&P, TOPIX, and AllianceBernstein.
Changes in Assets Under Management
By Channel |
Three Months Ended March 31, 2006
In $ Millions
| | Institutional | | | | Private | | | |
| | Investments | | Retail | | Client | | Total | |
| | | | | | | | | |
Beginning of Period | | $ | 358,545 | | $ | 145,134 | | $ | 74,873 | | $ | 578,552 | |
| | | | | | | | | |
Sales/New accounts | | 11,172 | | 11,177 | | 3,961 | | 26,310 | |
Redemptions/Terminations | | (2,342 | ) | (7,393 | ) | (721 | ) | (10,456 | ) |
Cash flow | | (3,278 | ) | 203 | | (490 | ) | (3,565 | ) |
Unreinvested dividends | | - | | (217 | ) | (69 | ) | (286 | ) |
Net inflows | | 5,552 | | 3,770 | | 2,681 | | 12,003 | |
| | | | | | | | | |
Transfers (1) | | 7,918 | | (9,155 | ) | 1,237 | | - | |
| | | | | | | | | |
Market appreciation | | 17,902 | | 6,170 | | 2,948 | | 27,020 | |
| | | | | | | | | |
End of Period | | $ | 389,917 | | $ | 145,919 | | $ | 81,739 | | $ | 617,575 | |
| | | | | | | | | |
% Total (end of period) | | 63.2 | % | 23.6 | % | 13.2 | % | 100.0 | % |
| | | | | | | | | |
% Change from beg of period | | 8.7 | % | 0.5 | % | 9.2 | % | 6.7 | % |
| | | | | | | | | |
% Change ex. transfers | | 6.7 | % | 6.9 | % | 6.8 | % | 6.7 | % |
(1) Transfers of certain client accounts were made among distribution channels resulting from changes in how these accounts are serviced by the firm. AUM at March 31, 2006 reflect these transfers.
Changes In Assets Under Management
By Channel |
Twelve Months Ended March 31, 2006
In $ Millions
| | Institutional | | | | Private | | | |
| | Investments | | Retail | | Client | | Total | |
| | | | | | | | | |
Beginning of Period | | $ | 311,310 | | $ | 157,562 | | $ | 65,074 | | $ | 533,946 | |
| | | | | | | | | |
Sales/New accounts | | 41,046 | | 34,816 | | 11,768 | | 87,630 | |
Redemptions/Terminations | | (17,194 | ) | (28,483 | ) | (2,875 | ) | (48,552 | ) |
Cash flow | | (2,370 | ) | (212 | ) | (1,489 | ) | (4,071 | ) |
Unreinvested dividends | | (1 | ) | (924 | ) | (346 | ) | (1,271 | ) |
Net inflows | | 21,481 | | 5,197 | | 7,058 | | 33,736 | |
| | | | | | | | | |
Dispositions (1) | | (1,375 | ) | (26,653 | ) | (370 | ) | (28,398 | ) |
Transfers (2) | | 8,488 | | (9,155 | ) | 667 | | - | |
| | | | | | | | | |
Market appreciation | | 50,013 | | 18,968 | | 9,310 | | 78,291 | |
| | | | | | | | | |
End of Period | | $ | 389,917 | | $ | 145,919 | | $ | 81,739 | | $ | 617,575 | |
| | | | | | | | | |
% Total (end of period) | | 63.2 | % | 23.6 | % | 13.2 | % | 100.0 | % |
| | | | | | | | | |
% Change from beg of period | | 25.3 | % | -7.4 | % | 25.6 | % | 15.7 | % |
| | | | | | | | | |
% Change ex. dispositions & transfers | | 23.0 | % | 18.4 | % | 25.1 | % | 22.1 | % |
(1) Cash Management Services, South African joint venture interest and Indian mutual funds.
(2) Transfers of certain client accounts were made among distribution channels resulting from changes in how these accounts are serviced by the firm. AUM at March 31, 2006 reflect these transfers.
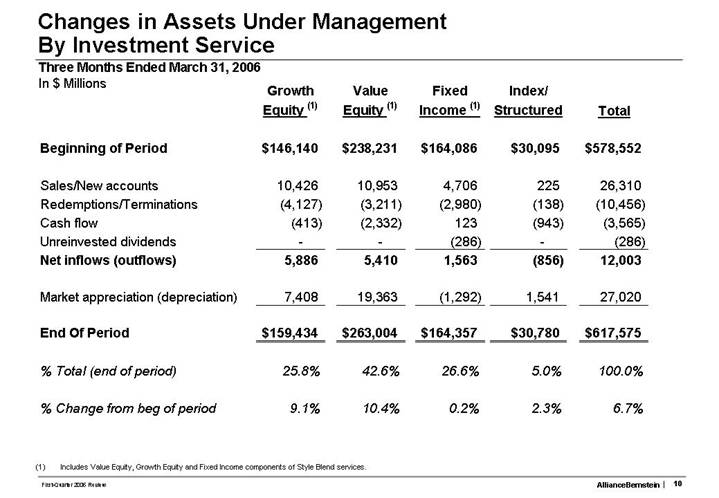
Changes In Assets Under Management
By Investment Service |
Twelve Months Ended March 31, 2006
In $ Millions
| | Growth | | Value | | Fixed | | Index/ | | | |
| | Equity (1) | | Equity (1) | | Income (1) | | Structured | | Total | |
| | | | | | | | | | | |
Beginning of Period | | $ | 146,140 | | $ | 238,231 | | $ | 164,086 | | $ | 30,095 | | $ | 578,552 | |
| | | | | | | | | | | |
Sales/New accounts | | 10,426 | | 10,953 | | 4,706 | | 225 | | 26,310 | |
Redemptions/Terminations | | (4,127 | ) | (3,211 | ) | (2,980 | ) | (138 | ) | (10,456 | ) |
Cash flow | | (413 | ) | (2,332 | ) | 123 | | (943 | ) | (3,565 | ) |
Unreinvested dividends | | - | | - | | (286 | ) | - | | (286 | ) |
Net inflows (outflows) | | 5,886 | | 5,410 | | 1,563 | | (856 | ) | 12,003 | |
| | | | | | | | | | | |
Market appreciation (depreciation) | | 7,408 | | 19,363 | | (1,292 | ) | 1,541 | | 27,020 | |
| | | | | | | | | | | |
End Of Period | | $ | 159,434 | | $ | 263,004 | | $ | 164,357 | | $ | 30,780 | | $ | 617,575 | |
| | | | | | | | | | | |
% Total (end of period) | | 25.8 | % | 42.6 | % | 26.6 | % | 5.0 | % | 100.0 | % |
| | | | | | | | | | | |
% Change from beg of period | | 9.1 | % | 10.4 | % | 0.2 | % | 2.3 | % | 6.7 | % |
(1) Includes Value Equity, Growth Equity and Fixed Income components of Style Blend services.
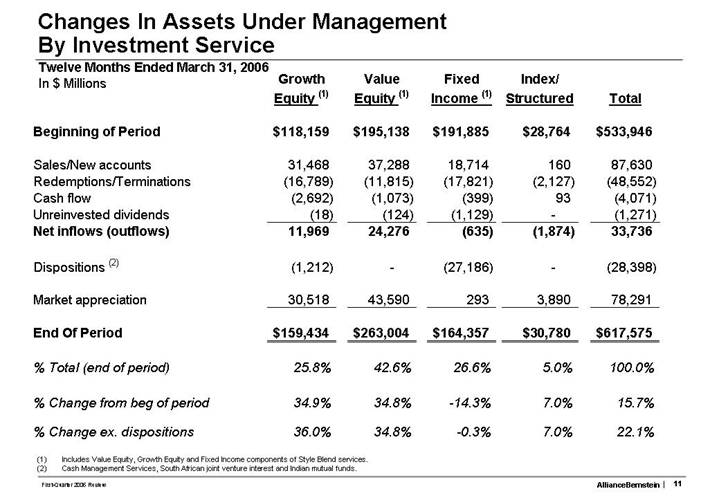
Changes In Assets Under Management
By Investment Service |
Twelve Months Ended March 31, 2006
In $ Millions
| | Growth | | Value | | Fixed | | Index/ | | | |
| | Equity (1) | | Equity (1) | | Income (1) | | Structured | | Total | |
| | | | | | | | | | | |
Beginning of Period | | $ | 118,159 | | $ | 195,138 | | $ | 191,885 | | $ | 28,764 | | $ | 533,946 | |
| | | | | | | | | | | |
Sales/New accounts | | 31,468 | | 37,288 | | 18,714 | | 160 | | 87,630 | |
Redemptions/Terminations | | (16,789 | ) | (11,815 | ) | (17,821 | ) | (2,127 | ) | (48,552 | ) |
Cash flow | | (2,692 | ) | (1,073 | ) | (399 | ) | 93 | | (4,071 | ) |
Unreinvested dividends | | (18 | ) | (124 | ) | (1,129 | ) | - | | (1,271 | ) |
Net inflows (outflows) | | 11,969 | | 24,276 | | (635 | ) | (1,874 | ) | 33,736 | |
| | | | | | | | | | | |
Dispositions (2) | | (1,212 | ) | - | | (27,186 | ) | - | | (28,398 | ) |
| | | | | | | | | | | |
Market appreciation | | 30,518 | | 43,590 | | 293 | | 3,890 | | 78,291 | |
| | | | | | | | | | | |
End Of Period | | $ | 159,434 | | $ | 263,004 | | $ | 164,357 | | $ | 30,780 | | $ | 617,575 | |
| | | | | | | | | | | |
% Total (end of period) | | 25.8 | % | 42.6 | % | 26.6 | % | 5.0 | % | 100.0 | % |
| | | | | | | | | | | |
% Change from beg of period | | 34.9 | % | 34.8 | % | -14.3 | % | 7.0 | % | 15.7 | % |
| | | | | | | | | | | |
% Change ex. dispositions | | 36.0 | % | 34.8 | % | -0.3 | % | 7.0 | % | 22.1 | % |
(1) Includes Value Equity, Growth Equity and Fixed Income components of Style Blend services.
(2) Cash Management Services, South African joint venture interest and Indian mutual funds.
Institutional Investments—
First Quarter Highlights |
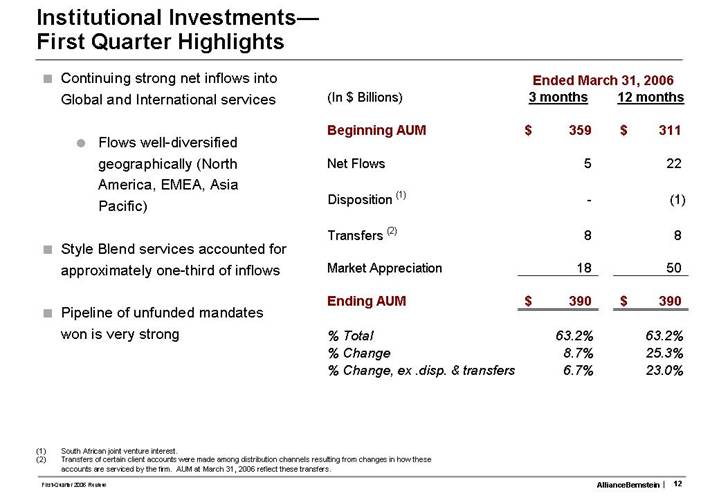
• Continuing strong net inflows into Global and International services
• Flows well-diversified geographically (North America, EMEA, Asia Pacific)
• Style Blend services accounted for approximately one-third of inflows
• Pipeline of unfunded mandates won is very strong
| | Ended March 31, 2006 | |
(In $ Billions) | | 3 months | | 12 months | |
| | | | | |
Beginning AUM | | $ | 359 | | $ | 311 | |
| | | | | |
Net Flows | | 5 | | 22 | |
| | | | | |
Disposition (1) | | - | | (1 | ) |
| | | | | |
Transfers (2) | | 8 | | 8 | |
| | | | | |
Market Appreciation | | 18 | | 50 | |
| | | | | |
Ending AUM | | $ | 390 | | $ | 390 | |
| | | | | |
% Total | | 63.2 | % | 63.2 | % |
% Change | | 8.7 | % | 25.3 | % |
% Change, ex .disp. & transfers | | 6.7 | % | 23.0 | % |
(1) South African joint venture interest.
(2) Transfers of certain client accounts were made among distribution channels resulting from changes in how these accounts are serviced by the firm. AUM at March 31, 2006 reflect these transfers.
Retail—
First Quarter Highlights |
• Positive net flows for third consecutive quarter
• Record Luxembourg fund sales
• Positive net inflows into U.S. funds-first quarter since 1Q 02
• Separately Managed Account business continued to strengthen
• Wealth Strategies services reached nearly $6 billion in assets
• Wealth Strategies - $4 billion
• Global Wealth Strategies - $2 billion
• Value Funds reached their 5-year anniversary in March
| | Ended March 31, 2006 | |
(In $ Billions) | | 3 months | | 12 months | |
| | | | | |
Beginning AUM | | $ | 145 | | $ | 158 | |
| | | | | |
Net Flows | | 4 | | 5 | |
| | | | | |
Dispositions (1) | | - | | (27 | ) |
| | | | | |
Transfers (2) | | (9 | ) | (9 | ) |
| | | | | |
Market Appreciation | | 6 | | 19 | |
| | | | | |
Ending AUM | | $ | 146 | | $ | 146 | |
| | | | | |
% Total | | 23.6 | % | 23.6 | % |
% Change | | 0.5 | % | -7.4 | % |
% Change, ex .disp. & transfers | | 6.9 | % | 18.4 | % |
(1) Cash Management Services and Indian mutual funds.
(2) Transfers of certain client accounts were made among distribution channels resulting from changes in how these accounts are serviced by the firm. AUM at March 31, 2006 reflect these transfers.
Private Client—
First Quarter Highlights |
• Strong net inflows
• Current U.K. expansion plans remain on track for second half of 2006
• Financial Advisors up 23% to 270 from 1Q05
| | Ended March 31, 2006 | |
(In $ Billions) | | 3 months | | 12 months | |
| | | | | |
Beginning AUM | | $ | 75 | | $ | 65 | |
| | | | | |
Net Flows | | 3 | | 7 | |
| | | | | |
Transfers (1) | | 1 | | 1 | |
| | | | | |
Market Appreciation | | 3 | | 9 | |
| | | | | |
Ending AUM | | $ | 82 | | $ | 82 | |
| | | | | |
% Total | | 13.2 | % | 13.2 | % |
% Change | | 9.2 | % | 25.6 | % |
% Change, ex .disp. & transfers | | 6.8 | % | 25.1 | % |
(1) Transfers of certain client accounts were made among distribution channels resulting from changes in how these accounts are serviced by the firm. AUM at March 31, 2006 reflect these transfers.
Institutional Research Services—
First Quarter Highlights |
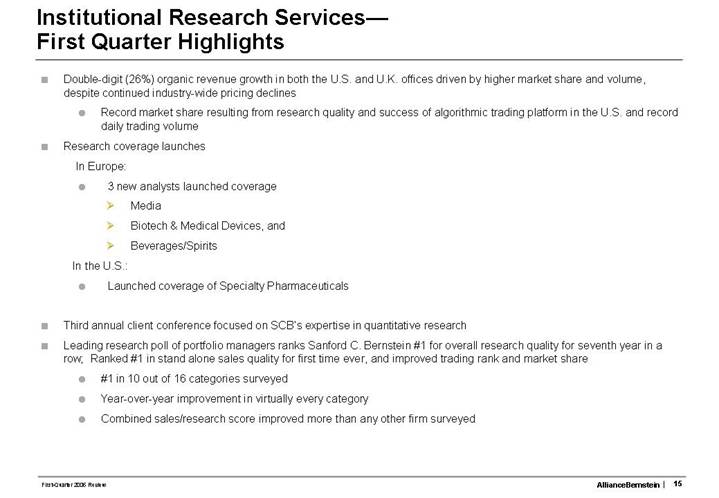
• Double-digit (26%) organic revenue growth in both the U.S. and U.K. offices driven by higher market share and volume, despite continued industry-wide pricing declines
• Record market share resulting from research quality and success of algorithmic trading platform in the U.S. and record daily trading volume
• Research coverage launches
In Europe:
• 3 new analysts launched coverage
• Media
• Biotech & Medical Devices, and
• Beverages/Spirits
In the U.S.:
• Launched coverage of Specialty Pharmaceuticals
• Third annual client conference focused on SCB’s expertise in quantitative research
• Leading research poll of portfolio managers ranks Sanford C. Bernstein #1 for overall research quality for seventh year in a row; Ranked #1 in stand alone sales quality for first time ever, and improved trading rank and market share
• #1 in 10 out of 16 categories surveyed
• Year-over-year improvement in virtually every category
• Combined sales/research score improved more than any other firm surveyed
In $ Billions
By Client Domicile | | $618 Billion
at March 31, 2006 | | By Service |
| | | | |
[CHART] | | [CHART] | | [CHART] |
| Non-U.S.
UP 40% | | Global &
Int’l
UP 38% | |
| | $534 Billion
at March 31, 2005 | | |
| | | | |
[CHART] | | [CHART] | | [CHART] |
Assets categorized by country domicile of client accounts.
A Balanced Mix: |
Style Blend Assets Growing in Importance |
Assets Under Management by
Investment Service
$618 billion | | Style Blend (1)
$100 billion |
| | |
[CHART] | | [CHART] |
As of March 31, 2006
(1) Excludes $4 billion of Blend Fixed Income AUM.
AllianceBernstein First Quarter Revenues |
In $ Millions
| | | | | | Percent | |
| | 1Q 2006 | | 1Q 2005 | | Change | |
Revenues: | | | | | | | |
| | | | | | | |
Advisory Fees | | $ | 626 | | $ | 517 | | 21.1 | % |
| | | | | | | |
Distribution | | 103 | | 108 | | -4.6 | % |
| | | | | | | |
Institutional Research Services | | 96 | | 94 | | 1.9 | % |
| | | | | | | |
Other | | 74 | | 31 | | N/M | |
| | | | | | | |
Total | | $ | 899 | | $ | 750 | | 19.8 | % |
NOTE: Percentages are calculated using revenues and expenses rounded to the nearest thousand.
AllianceBernstein Transaction Fees |
In $ Millions
| | | | | | Percent | |
| | 1Q 2006 | | 1Q 2005 | | Change | |
Advisory Fees | | | | | | | |
| | | | | | | |
Prior period presentation | | $ | 627 | | $ | 536 | | 17.0 | % |
| | | | | | | |
Reclassification to IRS | | (1 | ) | (19 | ) | -96.2 | % |
| | | | | | | |
As reported | | $ | 626 | | $ | 517 | | 21.1 | % |
| | | | | | | |
Institutional Research Services | | | | | | | |
| | | | | | | |
Prior period presentation | | $ | 95 | | $ | 75 | | 26.4 | % |
| | | | | | | |
Reclassification from Advisory Fees | | 1 | | 19 | | -96.2 | % |
| | | | | | | |
As reported | | $ | 96 | | $ | 94 | | 1.9 | % |
NOTE: Percentages are calculated using revenues and expenses rounded to the nearest thousand.
AllianceBernstein First Quarter Advisory Fees |
In $ Millions
| | | | | | Percent | | | | |
| | 1Q 2006 | | 1Q 2005 | | Change | | | | |
By Fee Type: | | | | | | | | | | |
Base Fees | | $ | 614 | | $ | 509 | | 20.5 | | • | Higher AUM | |
| | | | | | | | | | |
Performance Fees | | 12 | | 8 | | 63.1 | % | | | |
| | | | | | | | | | |
Total | | $ | 626 | | $ | 517 | | 21.1 | % | | | |
| | | | | | | | | | |
By Channel: | | | | | | | | | | |
Institutional | | $ | 265 | | $ | 194 | | 37.0 | % | • | Higher average AUM | |
| | | | | | | | | | |
Retail | | 186 | | 182 | | 2.2 | % | • | Higher average AUM offset | |
| | | | | | | | | by sale of CMS assets | |
Private Client | | 175 | | 141 | | 23.9 | % | • | Higher AUM and | |
| | | | | | | | | new fee structure | |
Total | | $ | 626 | | $ | 517 | | 21.1 | % | | | |
| | | | | | | | | | | | | | | | |
NOTE: Percentages are calculated using revenues and expenses rounded to the nearest thousand.
AllianceBernstein First Quarter Revenues |
In $ Millions
| | 1Q 2006 | | 1Q 2005 | | Percent
Change | |
Revenues: | | | | | | | |
| | | | | | | |
Advisory Fees | | $ | 626 | | $ | 517 | | 21.1 | % |
| | | | | | | |
Distribution | | 103 | | 108 | | -4.6 | % |
| | | | | | | |
Institutional Research Services | | 96 | | 94 | | 1.9 | % |
| | | | | | | |
Other | | 74 | | 31 | | N/M | |
| | | | | | | |
Total | | $ | 899 | | $ | 750 | | 19.8 | % |
NOTE: Percentages are calculated using revenues and expenses rounded to the nearest thousand.
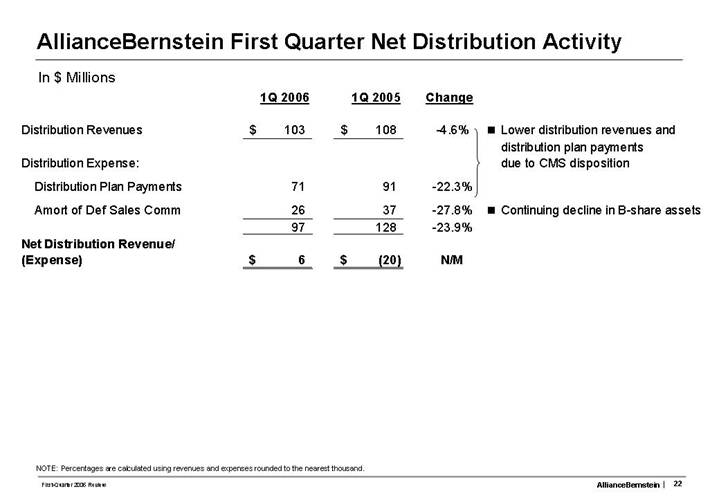
AllianceBernstein First Quarter Net Distribution Activity |
In $ Millions
| | 1Q 2006 | | 1Q 2005 | | Change | | | | |
| | | | | | | | | | |
Distribution Revenues | | $ | 103 | | $ | 108 | | -4.6 | % | 
| • | Lower distribution revenues and | |
| | | | | | | | | distribution plan payments | |
Distribution Expense: | | | | | | | | | due to CMS disposition | |
| | | | | | | | | | |
Distribution Plan Payments | | 71 | | 91 | | -22.3 | % | | | |
| | | | | | | | | | | |
Amort of Def Sales Comm | | 26 | | 37 | | -27.8 | % | | • | Continuing decline in B-share assets | |
| | 97 | | 128 | | -23.9 | % | | | | |
Net Distribution Revenue/ (Expense) | | $ | 6 | | $ | (20 | ) | N/M | | | | | |
NOTE: Percentages are calculated using revenues and expenses rounded to the nearest thousand.
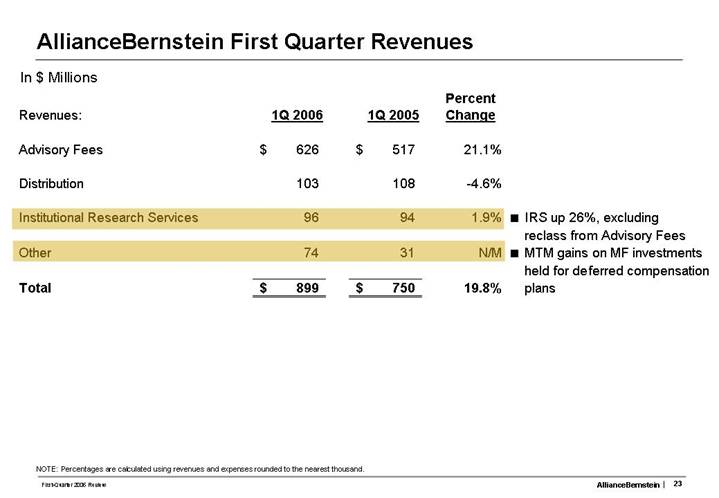
AllianceBernstein First Quarter Revenues |
In $ Millions
| | 1Q 2006 | | 1Q 2005 | | Percent
Change | | | |
Revenues: | | | | | | | | | |
| | | | | | | | | |
Advisory Fees | | $ | 626 | | $ | 517 | | 21.1 | % | | |
| | | | | | | | | |
Distribution | | 103 | | 108 | | -4.6 | % | | |
| | | | | | | | | |
Institutional Research Services | | 96 | | 94 | | 1.9 | % | • | IRS up 26%, excluding | |
| | | | | | | | | reclass from Advisory Fees | |
Other | | 74 | | 31 | | N/M | | • | MTM gains on MF investments | |
| | | | | | | | | held for deferred compensation | |
| | | | | | | | | plans | |
Total | | $ | 899 | | $ | 750 | | 19.8 | % | | |
NOTE: Percentages are calculated using revenues and expenses rounded to the nearest thousand.
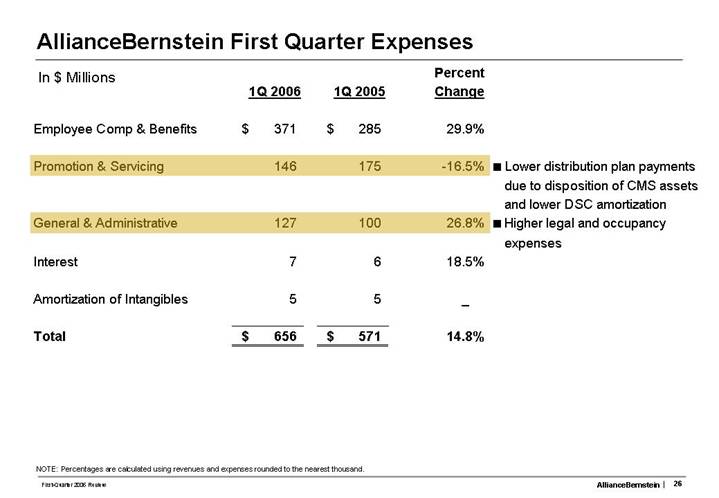
AllianceBernstein First Quarter Expenses |
In $ Millions
| | 1Q 2006 | | 1Q 2005 | | Percent
Change | |
Employee Comp & Benefits | | $ | 371 | | $ | 285 | | 29.9 | % |
| | | | | | | |
Promotion & Servicing | | 146 | | 175 | | -16.5 | % |
| | | | | | | |
General & Administrative | | 127 | | 100 | | 26.8 | % |
| | | | | | | |
Interest | | 7 | | 6 | | 18.5 | % |
| | | | | | | |
Amortization of Intangibles | | 5 | | 5 | | _ | |
| | | | | | | |
Total | | $ | 656 | | $ | 571 | | 14.8 | % |
NOTE: Percentages are calculated using revenues and expenses rounded to the nearest thousand.
AllianceBernstein First Quarter Compensation & Benefits |
In $ Millions
| | 1Q 2006 | | 1Q 2005 | | Percent
Change | | | |
| | | | | | | | | |
Base Compensation | | $ | 90 | | $ | 82 | | 9.7 | % | | |
| | | | | | | | | |
Incentive Compensation | | 157 | | 115 | | 36.8 | % | • | Higher operating earnings | |
| | | | | | | | | | |
Commissions | | 88 | | 62 | | 41.7 | % | • | New business across all channels | |
| | | | | | | | | | |
Fringes & Other | | 36 | | 26 | | 34.8 | % | • | Increased headcount | |
| | | | | | | | | |
Total | | $ | 371 | | $ | 285 | | 29.9 | % | | |
NOTE: Percentages are calculated using revenues and expenses rounded to the nearest thousand.
AllianceBernstein First Quarter Expenses |
In $ Millions
| | 1Q 2006 | | 1Q 2005 | | Percent
Change | | | |
| | | | | | | | | |
Employee Comp & Benefits | | $ | 371 | | $ | 285 | | 29.9 | % | | |
| | | | | | | | | |
Promotion & Servicing | | 146 | | 175 | | -16.5 | % | • | Lower distribution plan payments | |
| | | | | | | | | due to disposition of CMS assets | |
| | | | | | | | | and lower DSC amortization | |
General & Administrative | | 127 | | 100 | | 26.8 | % | • | Higher legal and occupancy | |
| | | | | | | | | expenses | |
Interest | | 7 | | 6 | | 18.5 | % | | |
| | | | | | | | | |
Amortization of Intangibles | | 5 | | 5 | | _ | | | |
| | | | | | | | | |
Total | | $ | 656 | | $ | 571 | | 14.8 | % | | |
| | | | | | | | | | | | | | |
NOTE: Percentages are calculated using revenues and expenses rounded to the nearest thousand.
AllianceBernstein First Quarter Net Income |
In $ Millions
| | 1Q 2006 | | 1Q 2005 | | Percent
Change | | | |
| | | | | | | | | |
Revenues | | $ | 899 | | $ | 750 | | 19.8 | % | | |
| | | | | | | | | |
Expenses | | 656 | | 571 | | 14.8 | % | | |
| | | | | | | | | |
Income before Taxes | | 243 | | 179 | | 36.1 | % | | |
| | | | | | | | | |
Income Taxes | | 15 | | 10 | | 53.1 | % | • | Higher effective tax rate due to increased | |
| | | | | | | | | earnings in non-U.S. subsidiaries | |
| | | | | | | | | | |
Net Income | | $ | 228 | | $ | 169 | | 35.1 | % | | |
| | | | | | | | | |
Pre-Tax Margin * | | 27.1 | % | 23.8 | % | | | | |
*Pre-tax income as a percentage of revenues
NOTE: Percentages are calculated using revenues and expenses rounded to the nearest thousand.
AllianceBernstein Holding Financial Results |
In $ Millions (except per unit amounts)
| | 1Q 2006 | | 1Q 2005 | | Percent
Change | |
AllianceBernstein: | | | | | | | |
| | | | | | | |
Net Income | | $ | 228 | | $ | 169 | | 35.1 | % |
| | | | | | | |
Weighted Average Equity Ownership Interest | | 32.1 | % | 31.5 | % | | |
| | | | | | | |
AllianceBernstein Holding: | | | | | | | |
| | | | | | | |
Equity in Earnings | | $ | 73 | | $ | 53 | | 38.0 | % |
| | | | | | | |
Income Taxes | | 7 | | 6 | | 22.9 | % |
| | | | | | | |
Net Income | | $ | 66 | | $ | 47 | | 40.0 | % |
| | | | | | | |
Diluted Net Income Per Unit | | $ | 0.78 | | $ | 0.58 | | 34.5 | % |
| | | | | | | |
Distributions Per Unit | | $ | 0.78 | | $ | 0.56 | | 39.3 | % |
NOTE: Percentages are calculated using revenues and expenses rounded to the nearest thousand.
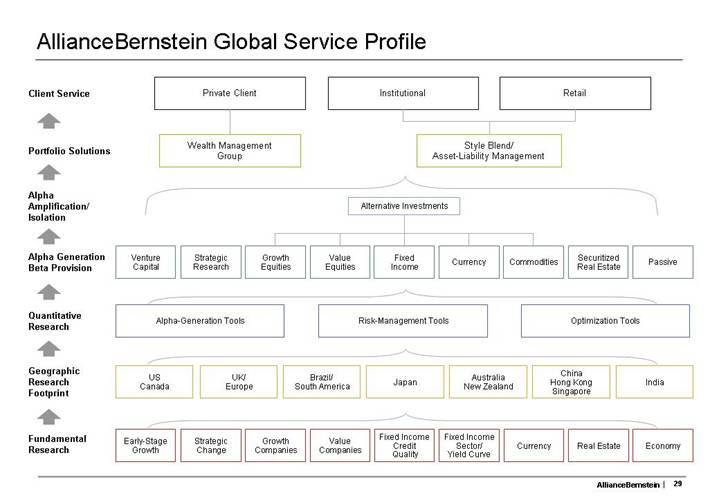
AllianceBernstein Global Service Profile |
[CHART]
[LOGO]
Appendix
| | 1Q 06 | | One Year | | Annualized
Three Years | | Cumulative
Three Years | |
| | | | | | | | | |
MSCI Emerging Markets | | 12.0 | | 47.5 | | 46.2 | | 212.4 | |
| | | | | | | | | |
MSCI EAFE | | 9.4 | | 24.4 | | 31.1 | | 125.5 | |
| | | | | | | | | |
MSCI World | | 6.6 | | 18.0 | | 23.4 | | 87.7 | |
| | | | | | | | | |
Russell 1000 Growth | | 3.1 | | 13.2 | | 14.8 | | 51.3 | |
| | | | | | | | | |
Russell 1000 Value | | 5.9 | | 13.3 | | 21.8 | | 80.6 | |
| | | | | | | | | |
S&P 500 | | 4.2 | | 11.7 | | 17.2 | | 61.1 | |
| | | | | | | | | |
Lehman Aggregate Bond | | (0.6 | ) | 2.3 | | 2.9 | | 9.0 | |
| | | | | | | | | |
Returns in % through March 31, 2006. | | | | | | | | | |
Relative Performance: Institutional Growth Equity (After Fees)(1) |
Institutional Equity Composites vs. Benchmarks
| | Large Cap
Growth (2) | | U.S.
Growth (3) | | Mid Cap
Growth (4) | | Small Cap
Growth (5) | | Intl Lg Cap
Growth (6) | | Global
Research
Growth (7) | | Emerging
Markets
Growth (8) | |
| | | | | | | | | | | | | | | |
1Q 06 | | (1.9 | ) | (3.0 | ) | 5.6 | | 1.5 | | (0.4 | ) | 0.7 | | 1.3 | |
| | | | | | | | | | | | | | | |
One Year | | 12.3 | | 7.4 | | 15.2 | | 4.1 | | 1.6 | | 9.3 | | 0.0 | |
| | | | | | | | | | | | | | | |
Three Years | | 1.9 | | 5.3 | | 6.8 | | 1.2 | | 0.6 | | 2.9 | | 5.3 | |
| | | | | | | | | | | | | | | |
Five Years | | 0.1 | | 3.2 | | 3.5 | | 1.5 | | 2.1 | | 2.4 | | 4.7 | |
| | | | | | | | | | | | | | | |
10 Years | | 2.4 | | 2.6 | | — | | 5.2 | | 3.5 | | 4.1 | | — | |
NOTE: The information in this table is provided solely for use in connection with this presentation, and is not directed toward existing or potential investment advisory clients of AllianceBernstein.
(1) Investment performance of composites is presented after investment management fees.
(2) vs. Russell 1000 Growth
(3) vs. Russell 3000 Growth
(4) vs. Russell Mid Cap Growth
(5) vs. Russell 2000 Growth
(6) vs. MSCI EAFE Growth (net)
(7) vs. MSCI World (net)
(8) vs. MSCI Emerging Markets Growth
Composite and benchmark data through 3/31/06. Performance is preliminary.
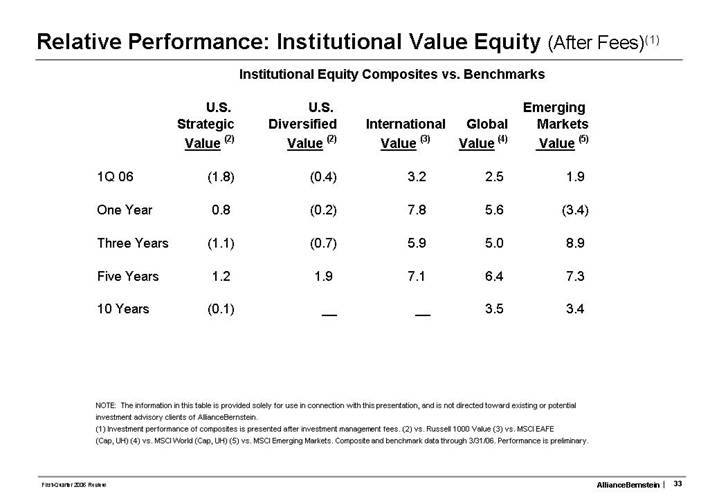
Relative Performance: Institutional Value Equity (After Fees)(1) |
Institutional Equity Composites vs. Benchmarks
| | U.S.
Strategic
Value (2) | | U.S.
Diversified
Value (2) | | International
Value (3) | | Global
Value (4) | | Emerging
Markets
Value (5) | |
| | | | | | | | | | | |
1Q 06 | | (1.8 | ) | (0.4 | ) | 3.2 | | 2.5 | | 1.9 | |
| | | | | | | | | | | |
One Year | | 0.8 | | (0.2 | ) | 7.8 | | 5.6 | | (3.4 | ) |
| | | | | | | | | | | |
Three Years | | (1.1 | ) | (0.7 | ) | 5.9 | | 5.0 | | 8.9 | |
| | | | | | | | | | | |
Five Years | | 1.2 | | 1.9 | | 7.1 | | 6.4 | | 7.3 | |
| | | | | | | | | | | |
10 Years | | (0.1 | ) | — | | — | | 3.5 | | 3.4 | |
NOTE: The information in this table is provided solely for use in connection with this presentation, and is not directed toward existing or potential investment advisory clients of AllianceBernstein.
(1) Investment performance of composites is presented after investment management fees.
(2) vs. Russell 1000 Value
(3) vs. MSCI EAFE (Cap, UH)
(4) vs. MSCI World (Cap, UH)
(5) vs. MSCI Emerging Markets. Composite and benchmark data through 3/31/06. Performance is preliminary.
Relative Performance: Institutional Fixed Income (After Fees)(1) |
Institutional Fixed Income Composites vs. Benchmarks
| | Core
Plus (2) | | Core
Mortgage (3) | | Corp
Bonds (4) | | Global (5) | | Strategic Core
Plus (6) | |
| | | | | | | | | | | |
1Q 06 | | 0.4 | | 0.0 | | 0.1 | | 0.2 | | 0.3 | |
| | | | | | | | | | | |
One Year | | 0.6 | | 0.1 | | 0.1 | | 0.0 | | 0.6 | |
| | | | | | | | | | | |
Three Years | | 0.7 | | 0.3 | | 0.0 | | 0.6 | | 1.1 | |
| | | | | | | | | | | |
Five Years | | 0.0 | | 0.5 | | 0.3 | | 0.2 | | — | |
| | | | | | | | | | | |
10 Years | | 0.1 | | 0.1 | | 0.3 | | 0.1 | | — | |
NOTE: The information in this table is provided solely for use in connection with this presentation, and is not directed toward existing or potential investment advisory clients of AllianceBernstein.
(1) Investment performance of composites is presented after investment management fees.
(2) vs. Lehman U.S. Aggregate Unhedged
(3) vs. Lehman Fixed Rate Mortgage Backed Securities Unhedged
(4) vs. Custom Corporate Index
(5) vs. S&P/Citi World Gov USD unhedged (from 7/1/04 - present)/JPM Global Bond (to 6/30/04)
(6) vs 90% Lehman Universal Index/10% S&P/Citigroup Non-US WGBI (Hedged). Composite and benchmark data through 3/31/06. Performance is preliminary.
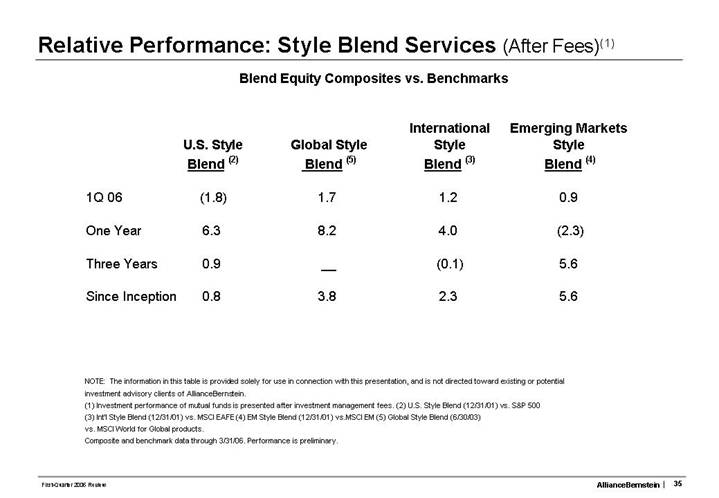
Relative Performance: Style Blend Services (After Fees)(1) |
Blend Equity Composites vs. Benchmarks
| | | | | | International | | Emerging Markets | |
| | U.S. Style | | Global Style | | Style | | Style | |
| | Blend (2) | | Blend (5) | | Blend (3) | | Blend (4) | |
| | | | | | | | | |
1Q 06 | | (1.8 | ) | 1.7 | | 1.2 | | 0.9 | |
| | | | | | | | | |
One Year | | 6.3 | | 8.2 | | 4.0 | | (2.3 | ) |
| | | | | | | | | |
Three Years | | 0.9 | | — | | (0.1 | ) | 5.6 | |
| | | | | | | | | |
Since Inception | | 0.8 | | 3.8 | | 2.3 | | 5.6 | |
NOTE: The information in this table is provided solely for use in connection with this presentation, and is not directed toward existing or potential investment advisory clients of AllianceBernstein.
(1) Investment performance of mutual funds is presented after investment management fees. (2) U.S. Style Blend (12/31/01) vs. S&P 500
(3) Int’l Style Blend (12/31/01) vs. MSCI EAFE (4) EM Style Blend (12/31/01) vs.MSCI EM (5) Global Style Blend (6/30/03)
vs. MSCI World for Global products.
Composite and benchmark data through 3/31/06. Performance is preliminary.
Absolute Performance: Private Client (After Fees)(1) |
| | | | Annualized | |
| | 1Q 06 | | 1 Year | | 3 Year | | 5 Year | |
| | | | | | | | | |
Fully Diversified Simulation (2) | | 4.3 | | 16.4 | | 16.3 | | 8.0 | |
| | | | | | | | | |
S&P 500 | | 4.2 | | 11.7 | | 17.2 | | 4.0 | |
NOTE: The information in this table is provided solely for use in connection with this presentation, and is not directed towards existing or potential investment advisory clients of AllianceBernstein. (1) Investment performance of composites is presented after investment management fees. (2) The Bernstein Fully Divserified Portfolio is a simulation composed of specific proporations of each of the products that follow, which joined the simulation as of the following dates: Strategic Value: 1/1/83; Strategic Growth: 1/1/83 (ACM Large Cap Growth used as a proxy for Strategic Growth through 1/1/01; Strategic Growth used thereafter); Intermediate Municpal Bond Composite: 1/1/83; Bernstein Tax-Managed International Fund: 7/1/92; Emerging Markets Fund: 1/1/96; Alliance/Bernstein Institutional REIT Fund: 7/1/01. It is rebalanced quarterly. Simulated performance results have certain inherent limitations. The results may not reflect the impact that certain material economic and market factors might have had on actual decision making if they were reflective of a managed account. No representation is being made that any account w ill, or is likely to, achieve profits or losses similar to those described herein.
Source: AllianceBernstein and S&P
Mutual fund, Composite and S&P performance through 3/31/06. Performance is preliminary.
Relative Performance: Retail Growth Equity (After Fees)(1) |
Retail Mutual Funds vs. Lipper Averages
| | | | | | | | Global | | | |
| | Large Cap | | | | Mid Cap | | Research | | Regent | |
| | Growth (2) | | Growth (3) | | Growth (4) | | Growth (5) | | Equity (6) | |
1Q 06 | | (2.6 | ) | (4.7 | ) | 3.7 | | 0.2 | | 0.1 | |
| | | | | | | | | | | |
One Year | | 8.3 | | 0.3 | | 13.6 | | 4.9 | | 10.3 | |
| | | | | | | | | | | |
Three Years | | 1.2 | | 0.0 | | 8.6 | | 3.2 | | 6.6 | |
| | | | | | | | | | | |
Five Years | | (1.8 | ) | 0.5 | | 4.4 | | __ | | 3.7 | |
| | | | | | | | | | | |
10 Years | | (0.1 | ) | (1.5 | ) | (0.3 | ) | __ | | 3.7 | |
NOTE: The information in this table is provided solely for use in connection with this presentation, and is not directed toward existing or potential investment advisory clients of AllianceBernstein.
(1) Investment performance of mutual funds is presented after investment management fees
(2) vs. Large Cap Growth average. Formerly named Premier Growth
(3) vs. Multi Cap Growth average
(4) vs. Mid Cap Growth average
(5) vs. Global Large Cap Growth Equity average; formerly named Global Growth Trends
(6) vs. S&P 500; represents Regent separately managed account service. Net performance is inclusive of the investment management fee only; it does not include the total management fee typically associated with a managed account that may range from 2.0 - 3.0% which includes transaction costs, custodial services and investment advisory fees.
Source: AllianceBernstein, Lipper, and S&P
Mutual fund performance and Lipper data through 3/31/06.
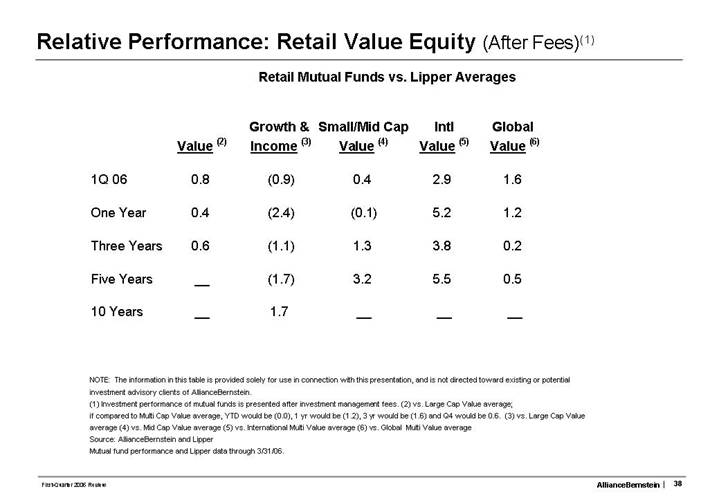
Relative Performance: Retail Value Equity (After Fees)(1) |
Retail Mutual Funds vs. Lipper Averages
| | | | Growth & | | Small/Mid Cap | | Intl | | Global | |
| | Value (2) | | Income (3) | | Value (4) | | Value (5) | | Value (6) | |
| | | | | | | | | | | |
1Q 06 | | 0.8 | | (0.9 | ) | 0.4 | | 2.9 | | 1.6 | |
| | | | | | | | | | | |
One Year | | 0.4 | | (2.4 | ) | (0.1 | ) | 5.2 | | 1.2 | |
| | | | | | | | | | | |
Three Years | | 0.6 | | (1.1 | ) | 1.3 | | 3.8 | | 0.2 | |
| | | | | | | | | | | |
Five Years | | __ | | (1.7 | ) | 3.2 | | 5.5 | | 0.5 | |
| | | | | | | | | | | |
10 Years | | __ | | 1.7 | | __ | | __ | | __ | |
NOTE: The information in this table is provided solely for use in connection with this presentation, and is not directed toward existing or potential investment advisory clients of AllianceBernstein.
(1) Investment performance of mutual funds is presented after investment management fees.
(2) vs. Large Cap Value average; if compared to Multi Cap Value average, YTD would be (0.0), 1 yr would be (1.2), 3 yr would be (1.6) and Q4 would be 0.6.
(3) vs. Large Cap Value average
(4) vs. Mid Cap Value average
(5) vs. International Multi Value average
(6) vs. Global Multi Value average Source: AllianceBernstein and Lipper
Mutual fund performance and Lipper data through 3/31/06.
Relative Performance: Retail Fixed Income (After Fees)(1) |
Retail Fixed Income Funds vs. Peer Group Averages
| | | | | | | | | | | | | | ACMGI- | | | |
| | | | Global | | Emerging | | Global | | American | | Short | | American | | | |
| | Corporate | | Gov’t | | Market | | High | | Income | | Duration | | Income– | | Intermediate | |
| | Bond (2) | | Income (3) | | Debt (4) | | Yield (5) | | Portfolio (8) | | Plus (6) | | Offshore (7) | | Duration (9) | |
| | | | | | | | | | | | | | | | | |
1Q 06 | | (0.3 | ) | (0.4 | ) | (0.6 | ) | 1.2 | | 1.3 | | 0.0 | | 1.1 | | 0.2 | |
| | | | | | | | | | | | | | | | | |
One Year | | (1.2 | ) | 11.5 | | (2.3 | ) | 12.2 | | 5.6 | | (0.2 | ) | 5.9 | | 0.7 | |
| | | | | | | | | | | | | | | | | |
Three Years | | 2.2 | | 3.7 | | 0.3 | | 5.3 | | 5.4 | | 0.0 | | 4.9 | | 0.5 | |
| | | | | | | | | | | | | | | | | |
Five Years | | (0.1 | ) | 1.4 | | 0.8 | | 0.6 | | 3.8 | | 0.3 | | 3.4 | | 0.0 | |
| | | | | | | | | | | | | | | | | |
10 Years | | 0.3 | | 5.4 | | 0.1 | | N/A | | 2.5 | | 0.2 | | 2.5 | | (0.1 | ) |
NOTE: The information in this table is provided solely for use in connection with this presentation, and is not directed toward existing or potential investment advisory clients of AllianceBernstein.
(1) Investment performance of mutual funds is presented after investment management fees.
(2) vs. Corporate Debt Funds BBB-Rated average
(3) vs. Global Income Funds average
(4) vs. Emerging Markets Debt average
(5) vs. Micropal
(6) vs. Short Investment Grade Debt average
(7) vs. Global Bond U.S. Dollar average
(8) vs. Micropal and
(9) vs. Intermediate Investment Grade Average
Source: AllianceBernstein and Lipper
Composite and benchmark data through 3/31/06. Performance is preliminary.
Relative Performance: Wealth Strategies (After Fees)(1) |
Retail Mutual Funds vs. Morningstar Averages
| | Wealth | | Balanced | | Wealth | |
| | Preservation (2) | | Wealth (3) | | Appreciation (4) | |
| | | | | | | |
1Q 06 | | 0.6 | | 1.2 | | 2.6 | |
| | | | | | | |
One Year | | 2.8 | | 5.5 | | 10.0 | |
| | | | | | | |
Since Inception (5) | | 1.4 | | 1.9 | | 4.2 | |
NOTE: The information in this table is provided solely for use in connection with this presentation, and is not directed toward existing or potential investment advisory clients of AllianceBernstein.
(1) Investment performance of mutual funds is presented after investment management fees.
(2) vs. Conservative Allocation average
(3) vs. Moderate Allocation average
(4) vs. Large Blend Average
(5) Inception date: 9/2/03 Source: AllianceBernstein and Morningstar
Mutual fund performance and Morningstar data through 3/31/06.
AllianceBernstein |
Consolidated Balance Sheet |
In $ Thousands, Unaudited
| | 3/31/06 | | 12/31/05 | |
Assets | | | | | |
Cash and investments | | $ | 1,356,613 | | $ | 999,213 | |
Cash and securities, segregated | | 1,629,805 | | 1,720,809 | |
Receivables, net | | 3,212,889 | | 2,936,245 | |
Goodwill, net | | 2,876,657 | | 2,876,657 | |
Intangible assets, net | | 300,150 | | 305,325 | |
Deferred sales commissions, net | | 200,074 | | 196,637 | |
Other (incl. furniture & equipment) | | 451,822 | | 455,594 | |
Total Assets | | $ | 10,028,010 | | $ | 9,490,480 | |
| | | | | |
Liabilities and Partners’ Capital | | | | | |
Liabilites: | | | | | |
Payables | | $ | 4,538,190 | | $ | 4,127,377 | |
Accounts payable and accrued expenses | | 298,605 | | 286,449 | |
Accrued compensation and benefits | | 413,181 | | 357,321 | |
Debt | | 446,288 | | 407,291 | |
Minority Interest | | 11,046 | | 9,368 | |
Total Liabilities | | 5,707,310 | | 5,187,806 | |
| | | | | |
Partners’ Capital | | 4,320,700 | | 4,302,674 | |
Total Liabilities and Partners’ Capital | | $ | 10,028,010 | | $ | 9,490,480 | |
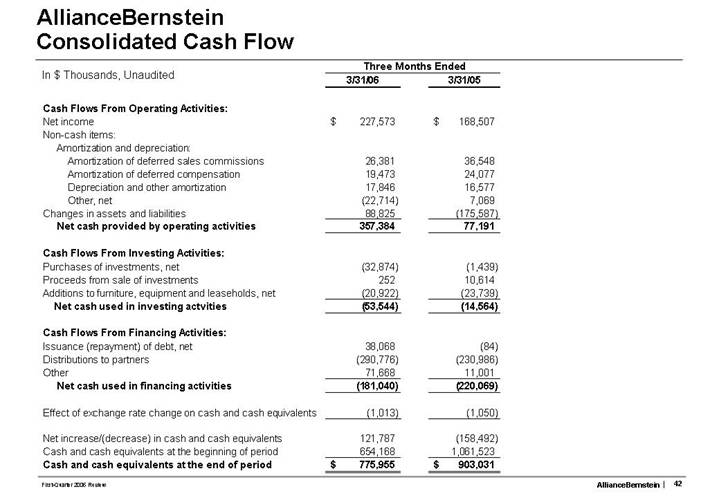
AllianceBernstein |
Consolidated Cash Flow |
In $ Thousands, Unaudited
| | Three Months Ended | |
| | 3/31/06 | | 3/31/05 | |
Cash Flows From Operating Activities: | | | | | |
Net income | | $ | 227,573 | | $ | 168,507 | |
Non-cash items: | | | | | |
Amortization and depreciation: | | | | | |
Amortization of deferred sales commissions | | 26,381 | | 36,548 | |
Amortization of deferred compensation | | 19,473 | | 24,077 | |
Depreciation and other amortization | | 17,846 | | 16,577 | �� |
Other, net | | (22,714 | ) | 7,069 | |
Changes in assets and liabilities | | 88,825 | | (175,587 | ) |
Net cash provided by operating activities | | 357,384 | | 77,191 | |
| | | | | |
Cash Flows From Investing Activities: | | | | | |
Purchases of investments, net | | (32,874 | ) | (1,439 | ) |
Proceeds from sale of investments | | 252 | | 10,614 | |
Additions to furniture, equipment and leaseholds, net | | (20,922 | ) | (23,739 | ) |
Net cash used in investing actvities | | (53,544 | ) | (14,564 | ) |
| | | | | |
Cash Flows From Financing Activities: | | | | | |
Issuance (repayment) of debt, net | | 38,068 | | (84 | ) |
Distributions to partners | | (290,776 | ) | (230,986 | ) |
Other | | 71,668 | | 11,001 | |
Net cash used in financing activities | | (181,040 | ) | (220,069 | ) |
| | | | | |
Effect of exchange rate change on cash and cash equivalents | | (1,013 | ) | (1,050 | ) |
| | | | | |
Net increase/(decrease) in cash and cash equivalents | | 121,787 | | (158,492 | ) |
Cash and cash equivalents at the beginning of period | | 654,168 | | 1,061,523 | |
Cash and cash equivalents at the end of period | | $ | 775,955 | | $ | 903,031 | |
[LOGO]
AllianceBernstein® andthe AB AllianceBernstein Logo are trademarks and service marks owned by AllianceBernstein L.P.