UNITED STATES
SECURITIES AND EXCHANGE COMMISSION
WASHINGTON, D.C. 20549
FORM 10-K
| | | | | |
| ☒ | ANNUAL REPORT PURSUANT TO SECTION 13 OR 15(d) OF THE SECURITIES EXCHANGE ACT OF 1934 |
For the Fiscal Year Ended December 31, 2024
OR
| | | | | |
| ☐ | TRANSITION REPORT PURSUANT TO SECTION 13 OR 15(d) OF THE SECURITIES EXCHANGE ACT OF 1934 |
For the transition period from to
Commission file number 000-29961
ALLIANCEBERNSTEIN L.P.
(Exact name of registrant as specified in its charter)
| | | | | | | | |
| Delaware | | 13-4064930 |
| (State or other jurisdiction of incorporation or organization) | | (I.R.S. Employer Identification No.) |
501 Commerce Street, Nashville, TN 37203
(Address of principal executive offices)
(Zip Code)
Registrant’s telephone number, including area code: (615) 622-0000
Securities registered pursuant to Section 12(b) of the Act: None
Securities registered pursuant to Section 12(g) of the Act:
| | | | | | | | | | | | | | |
| Title of Class | | Trading Symbol | | Name of each exchange on which registered |
| Units of Limited Partnership Interest | | None | | None |
Indicate by check mark if the registrant is a well-known seasoned issuer, as defined in Rule 405 of the Securities Act. Yes ☒ No ☐
Indicate by check mark if the registrant is not required to file reports pursuant to Section 13 or Section 15(d) of the Act. Yes ☐ No ☒
Indicate by check mark whether the registrant (1) has filed all reports required to be filed by Section 13 or 15(d) of the Securities Exchange Act of 1934 during the preceding 12 months (or for such shorter period that the registrant was required to file such reports), and (2) has been subject to such filing requirements for the past 90 days. Yes ☒ No ☐
Indicate by check mark whether the registrant has submitted electronically every Interactive Data File required to be submitted pursuant to Rule 405 of Regulation S-T (§232.405 of this chapter) during the preceding 12 months (or for such shorter period that the registrant was required to submit such files). Yes ☒ No ☐
Indicate by check mark whether the registrant is a large accelerated filer, an accelerated filer, a non-accelerated filer, smaller reporting company, or an emerging growth company. See definitions of “large accelerated filer”, “accelerated filer”, “smaller reporting company”, and “emerging growth company” in Rule 12b-2 of the Exchange Act. (Check one):
| | | | | | | | | | | | | | |
| Large accelerated filer | ☐ | | Accelerated filer | ☐ |
| Non-accelerated filer | ☒ | | Smaller reporting company | ☐ |
| | Emerging growth company | ☐ |
If an emerging growth company, indicate by check mark if the registrant has elected not to use the extended transition period for complying with any new or revised financial accounting standards provided pursuant to Section 13(a) of the Exchange Act. ☐
Indicate by check mark whether the registrant has filed a report on and attestation to its management's assessment of the effectiveness of its internal control over financial reporting under Section 404(b) of the Sarbanes-Oxley Act (15 U.S.C. 7262(b)) by the registered public accounting firm that prepared or issued its audit report. Yes ☒ No ☐
Indicate by check mark whether the registrant is a shell company (as defined in Rule 12b-2 of the Act). Yes ☐ No ☒
If securities are registered pursuant to Section 12 (b) of the Act, indicate by check mark whether the financial statements of the registrant included in the filing reflect the correction of an error to previously issued financial statements. ☐
Indicate by check mark whether any of those error corrections are restatements that required a recovery analysis of incentive-based compensation received by any of the registrant's executive officers during the relevant recovery period pursuant to §240.10D-1(b). ☐
The number of units of limited partnership interest outstanding as of December 31, 2024 was 292,107,907.
DOCUMENTS INCORPORATED BY REFERENCE
This Form 10-K does not incorporate any document by reference.
| | |
| Glossary of Certain Defined Terms |
|
| | | | | |
| AB | AllianceBernstein L.P. (Delaware limited partnership formerly known as Alliance Capital Management L.P., “Alliance Capital”), the operating partnership, and its subsidiaries and, where appropriate, its predecessors, AB Holding and ACMC, Inc. and their respective subsidiaries. |
| |
| AB Holding | AllianceBernstein Holding L.P. (Delaware limited partnership). |
| |
| AB Holding Partnership Agreement | the Amended and Restated Agreement of Limited Partnership of AB Holding, dated as of October 29, 1999 and as amended February 24, 2006. |
| |
| AB Holding Units | units representing assignments of beneficial ownership of limited partnership interest in AB Holding. |
| |
| AB Partnership Agreement | the Amended and Restated Agreement of Limited Partnership of AB, dated as of October 29, 1999 and as amended February 24, 2006. |
| |
| AB Units | units of limited partnership interest in AB. |
| |
| AUM | AB's assets under management. |
| |
| Bernstein Transaction | AB's acquisition of the business and assets of SCB Inc., formerly known as Sanford C. Bernstein Inc., and the related assumption of the liabilities of that business, completed on October 2, 2000. |
| |
| Equitable America | Equitable Financial Insurance Company of America (f/k/a MONY Life Insurance Company of America, an Arizona corporation), a subsidiary of Equitable Holdings. |
| | | | | |
| Equitable Financial | Equitable Financial Life Insurance Company (New York stock life insurance company), a subsidiary of Equitable Holdings. |
| |
| Equitable Holdings or EQH | Equitable Holdings, Inc. (Delaware corporation) and its subsidiaries other than AB and its subsidiaries. |
| |
| Exchange Act | the Securities Exchange Act of 1934, as amended. |
| |
| ERISA | the Employee Retirement Income Security Act of 1974, as amended. |
| |
| GAAP | U.S. Generally Accepted Accounting Principles. |
| |
| General Partner | AllianceBernstein Corporation (Delaware corporation), the general partner of AB and AB Holding and a subsidiary of Equitable Holdings, and, where appropriate, ACMC, LLC, its predecessor. |
| |
| Investment Advisers Act | the Investment Advisers Act of 1940, as amended. |
| |
| Investment Company Act | the Investment Company Act of 1940, as amended. |
| |
| NYSE | the New York Stock Exchange, Inc. |
| |
| Partnerships | AB and AB Holding together. |
| |
| SEC | the United States Securities and Exchange Commission. |
| |
| Securities Act | the Securities Act of 1933, as amended. |
Item 1. Business
The words “we” and “our” in this Form 10-K refer collectively to AB Holding and AB and its subsidiaries, or to their officers and employees. Similarly, the words “company” and “firm” refer to both AB Holding and AB. Where the context requires distinguishing between AB Holding and AB, we identify which company is being discussed. Cross-references are in italics.
We use “global” in this Form 10-K to refer to all nations, including the United States; we use “international” or “non-U.S.” to refer to nations other than the United States.
We use “emerging markets” in this Form 10-K to refer to countries included in the Morgan Stanley Capital International (“MSCI”) emerging markets index, which include, as of December 31, 2024: Brazil, Chile, China, Colombia, Czech Republic, Egypt, Greece, Hungary, India, Indonesia, Korea, Kuwait, Malaysia, Mexico, Peru, Philippines, Poland, Qatar, Saudi Arabia, South Africa, Taiwan, Thailand, Turkey and United Arab Emirates.
Clients
We provide diversified investment management, research and related services globally to a broad range of clients through our three buy-side distribution channels: Institutions, Retail and Private Wealth Management. See “Distribution Channels” in this Item 1 for additional information.
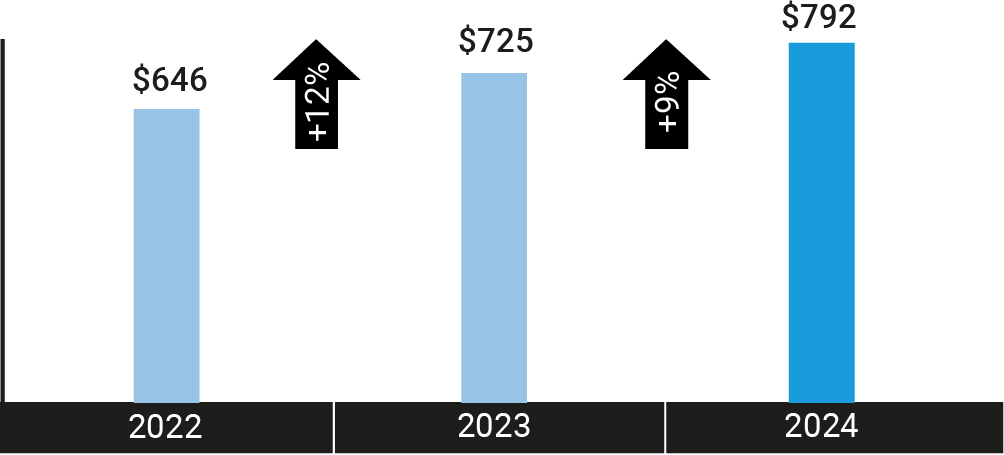
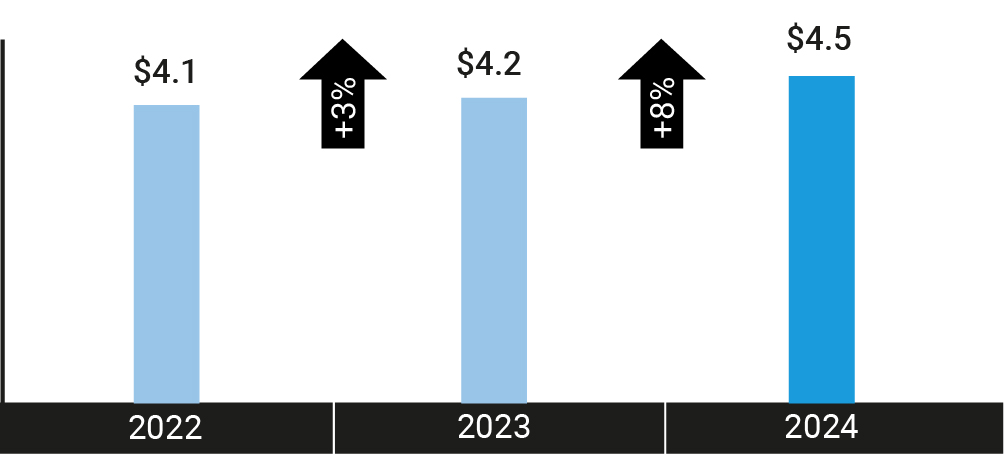
As of December 31, 2024, 2023 and 2022, our AUM were approximately $792 billion, $725 billion and $646 billion, respectively, and our net revenues were approximately $4.5 billion, $4.2 billion and $4.1 billion, respectively. EQH (our parent company) and its subsidiaries, whose AUM consist primarily of fixed income investments, is our largest client. Our EQH affiliates represented approximately 17%, 16% and 16% of our AUM as of December 31, 2024, 2023 and 2022, and we earned approximately 4% of our net revenues from services we provided to them in each of 2024, 2023 and 2022, respectively.
| | | | | |
| |
Assets Under Management (AUM) ($ billions) | Net Revenues ($ billions) |
| |
| |
| |
See “Distribution Channels” below and “Assets Under Management” and “Net Revenues” in Item 7 for additional information regarding our AUM and net revenues.
Generally, we are compensated for our investment services on the basis of investment advisory and services fees calculated as a percentage of AUM. For additional information about our investment advisory and services fees, including performance-based fees, see “Risk Factors” in Item 1A and “Net Revenues – Investment Advisory and Services Fees” in Item 7.
Research
Our high-quality, in-depth research is the foundation of our asset management and private wealth management businesses. We believe that our global team of research professionals, whose disciplines include economic, fundamental equity, fixed income and quantitative research, gives us a competitive advantage in achieving investment success for our clients. We also have experts focused on multi-asset strategies, wealth management, environmental, social and governance (“ESG”), and alternative investments.
Purpose, Values & Corporate Responsibility
Our purpose—to pursue insight that unlocks opportunity—describes the ethos of our firm. Because we are an active investment manager, differentiated insights drive our ability to design innovative investment solutions and help our clients achieve their investment goals.
Our values illustrate the behaviors and actions that create our strong culture and enable us to meet our clients' needs. Each value inspires us to be better:
•We invest in one another, meaning that we have a strong organizational culture in which diversity is celebrated and mentorship is critical to our success.
•We strive for distinctive knowledge, meaning that we collaboratively identify creative solutions to clients' investment challenges through our expertise in a wide range of investment disciplines.
•We speak with courage and conviction, which informs how we engage with our AB colleagues, clients and others.
•We act with integrity — always, which is the bedrock of our relationships and drives us to avoid activities that could create potential conflicts of interest or distract us from our singular focus to provide superior asset management and research to our clients.
Our purpose and values challenge us to be a responsible firm. Our vision for corporate responsibility is: Deliver better outcomes to clients while upholding high ethical standards, building a strong culture, and promoting the future viability of our business.
We work towards these objectives across five pillars.
•Resilient Operations: AB takes precautions to protect our business while adapting to change. This means safeguarding client information and business systems, maintaining strong corporate governance and enhancing our risk management practices.
•Thriving Workforce: Our business thrives when our people thrive. We seek to build diverse teams, create fair outcomes, and develop inclusive behaviors. We also offer opportunities for physical and mental wellness, open pathways for learning and development and recognize success.
•Community & Civic Engagement: Our approach to community engagement is holistic. We connect our resources to our communities’ most pressing needs, and we encourage civic participation. We do this through philanthropy, gift matching, volunteering, board participation and civic engagement.
•Resource Conservation: To us, environmental sustainability is about using resources thoughtfully. Most of our employees are located in green buildings, and we are conscious of our greenhouse gas footprint. We compost and recycle in large offices and we create opportunities for employees to learn about sustainability.
•Responsible Investing: Rigorous responsible investing research, integration, stewardship and solutions can make us better stewards of our clients’ assets. Our responsible investing approach includes evidence-based thought leadership, engagement, integration and solutions that meet clients’ unique responsible investing needs.
We provide additional information in this regard in the AB Responsibility Report, which can be found under “Responsibility - Overview” on www.alliancebernstein.com. And, we have described our firm's governance structure, including our Board and its committees, in Item 10 of this Form 10-K.
Investment Philosophy
We believe that by using differentiated research insights and a disciplined process to build high active share portfolios, we can achieve strong investment results for our clients over time. We are fully invested in delivering better outcomes for our clients. Key to this philosophy is developing and integrating both high quality fundamental and quantitative research, as well as regular company engagement where appropriate. Our global research network, intellectual curiosity and collaborative culture allow us to advance clients' investment objectives, whether our clients are seeking idiosyncratic alpha, total return, downside mitigation, or sustainability and impact-focused outcomes.
Our investment services include expertise in:
•Actively managed equity strategies across global and regional universes, as well as capitalization ranges, concentration ranges and investment strategies, including value, growth and core equities;
•Actively managed traditional and unconstrained fixed income strategies, including taxable and tax-exempt strategies;
•Actively managed alternative investments, including fundamental and systematically-driven hedge funds, fund of hedge funds and direct assets (e.g., direct lending, private credit, real estate debt and private equity);
•Portfolios with Purpose, including Sustainable, Impact and Responsible+ (Climate-Conscious and ESG leaders) equity, fixed income and multi-asset strategies that address our clients' desire to invest their capital with a dedicated ESG focus, while pursuing strong investment returns;
•Multi-asset services and solutions, including dynamic asset allocation, customized target-date funds and target-risk funds; and
•Passively managed equity and fixed income strategies, including index, ESG index and enhanced index strategies.
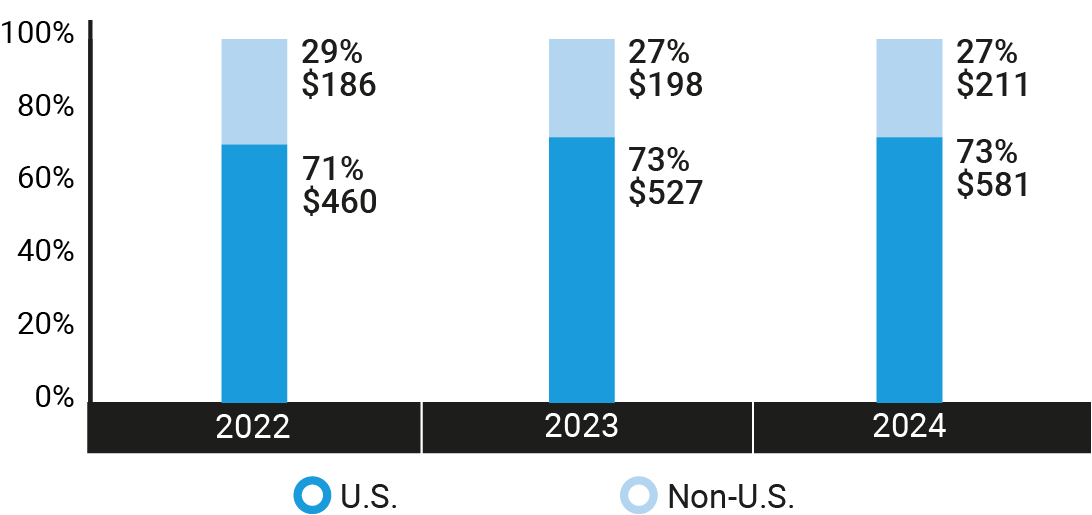
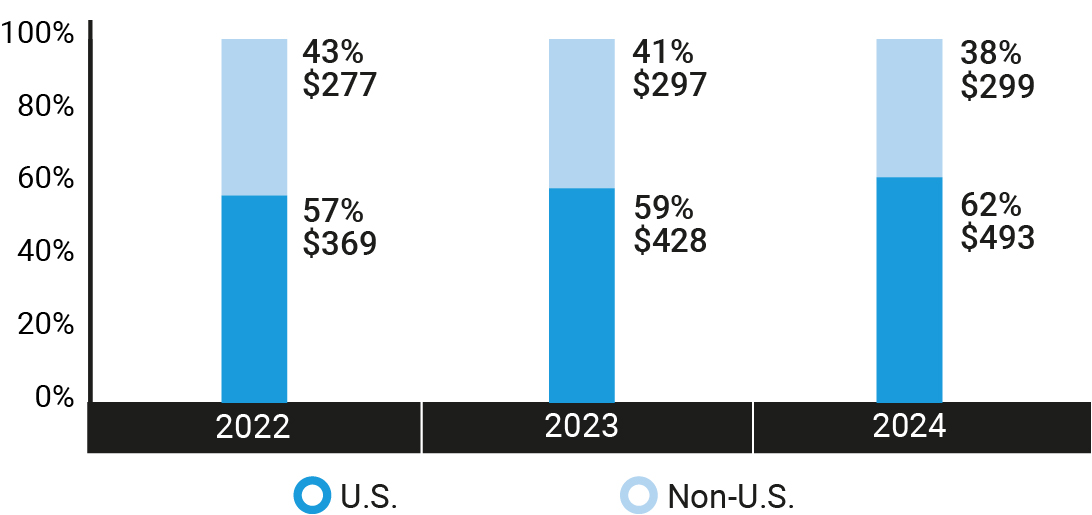
Our AUM by client domicile and investment service as of December 31, 2024, 2023 and 2022 are as follows:
| | | | | |
| |
AUM by Client Domicile ($ in billions) | AUM by Investment Service ($ in billions) |
| |
| |
| |
Distribution Channels
Institutions
We offer to our institutional clients, which include private and public pension plans, foundations and endowments, insurance companies, central banks and governments worldwide, and EQH and its subsidiaries, separately managed accounts, sub-advisory relationships, structured products, collective investment trusts, mutual funds, hedge funds and other investment vehicles (“Institutional Services”).
We manage the assets of our institutional clients pursuant to written investment management agreements or other arrangements, which generally are terminable at any time or upon relatively short notice by either party. In general, our written investment management agreements may not be assigned without the client's consent. For information about our institutional investment advisory and services fees, including performance-based fees, see “Risk Factors” in Item 1A and “Net Revenues – Investment Advisory and Services Fees” in Item 7.
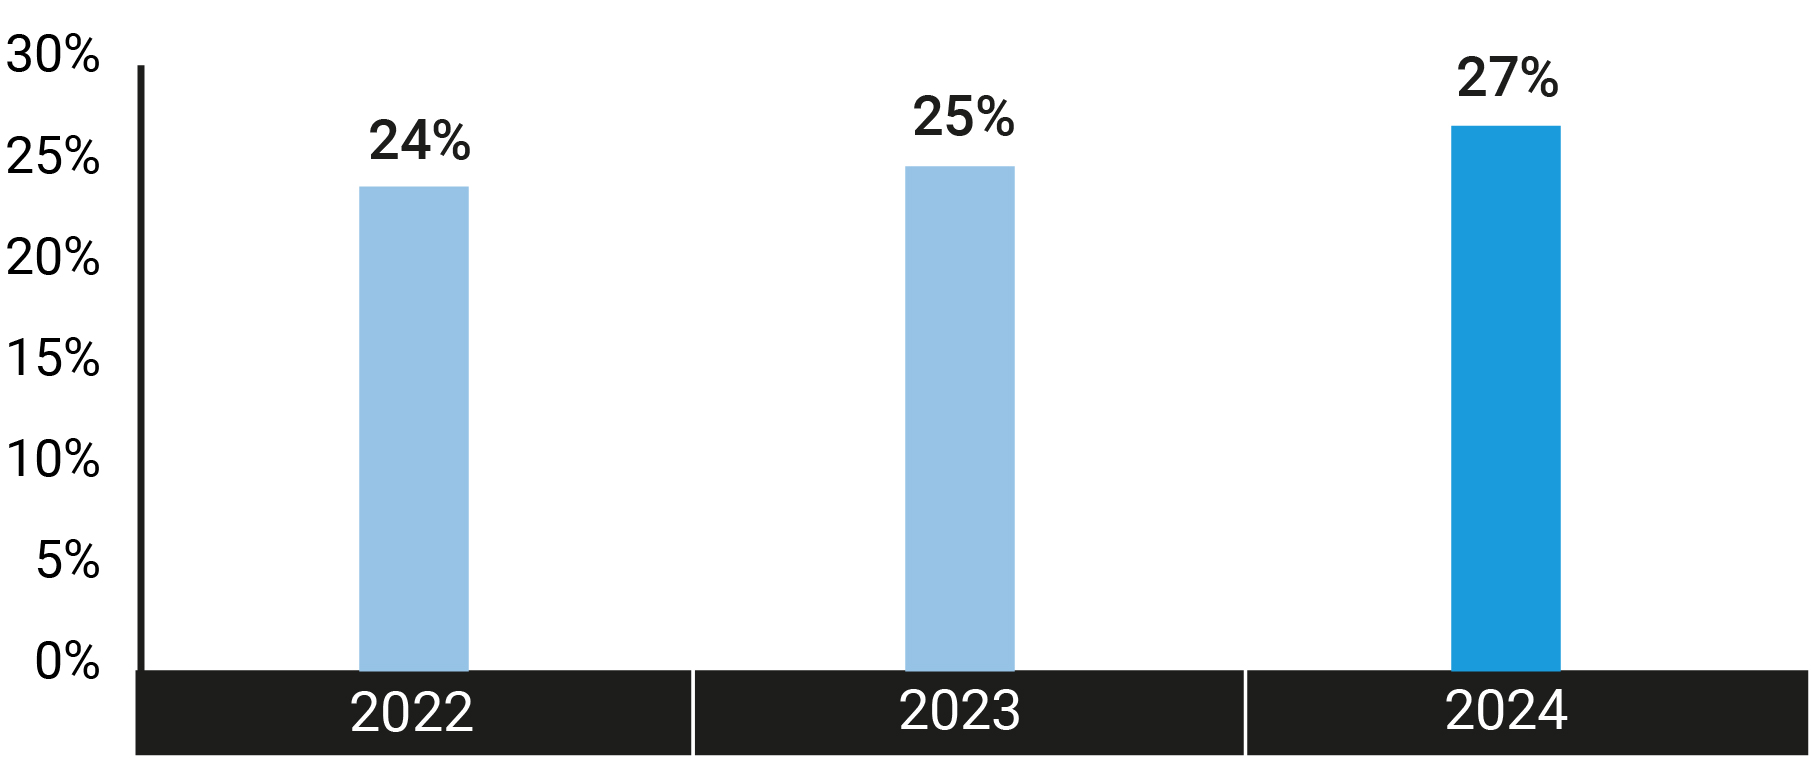
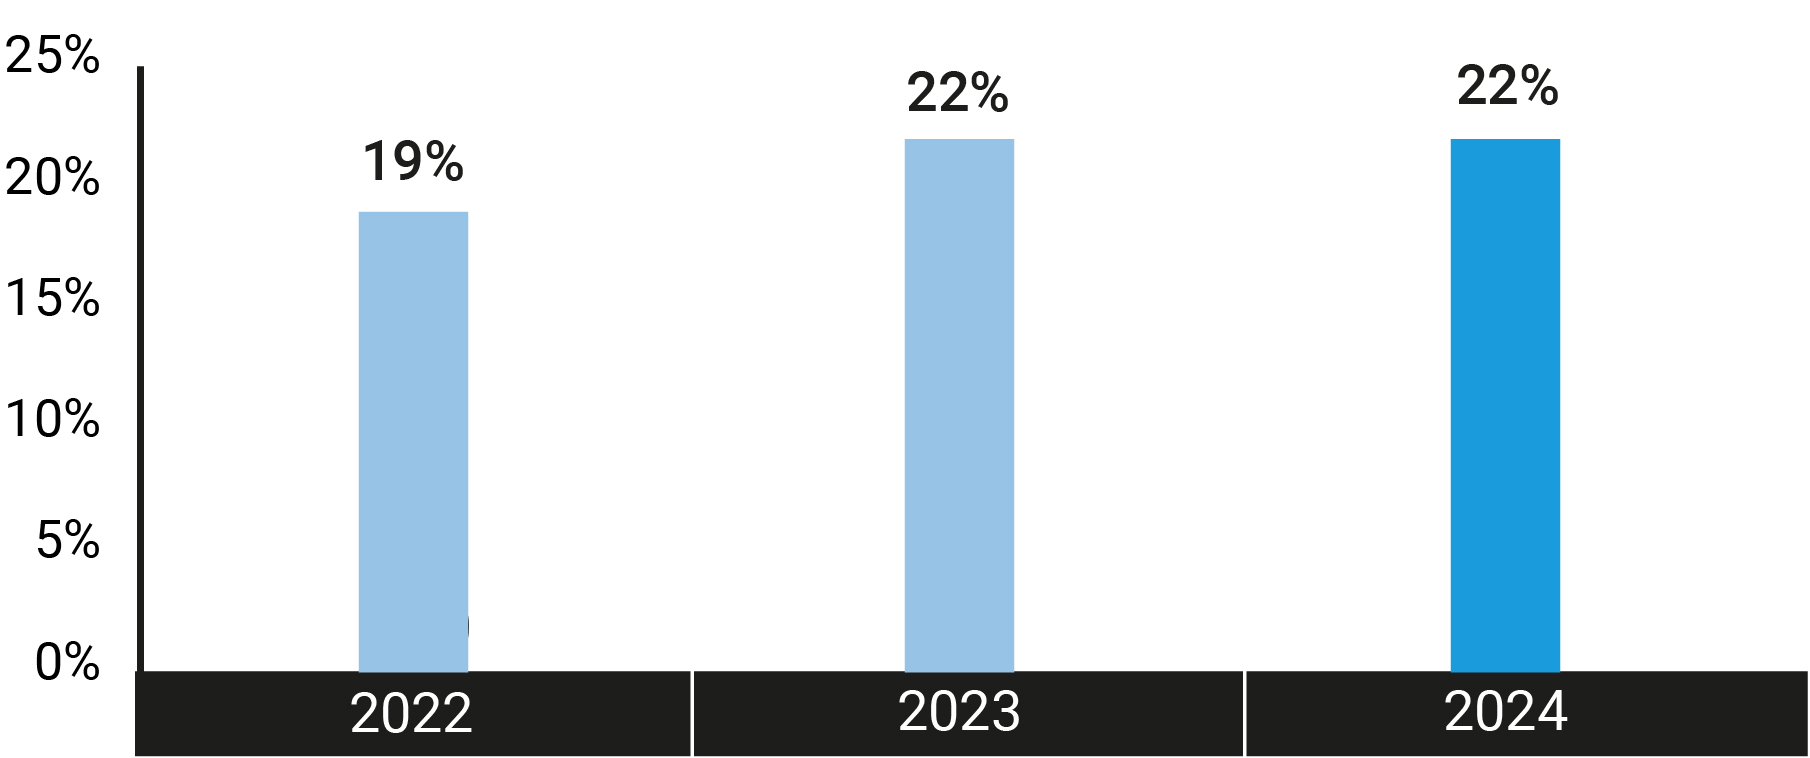
EQH and its subsidiaries constitute our largest institutional client. EQH and its subsidiaries combined AUM accounted for approximately 27%, 25% and 24% of our institutional AUM as of December 31, 2024, 2023 and 2022, respectively, and approximately 22%, 22% and 19% of our institutional revenues for 2024, 2023 and 2022, respectively. No single institutional client other than EQH and its respective subsidiaries accounted for more than approximately 1% of our net revenues for the year ended December 31, 2024.
| | | | | |
|
|
| EQH and Subsidiaries as a % of our Institutional AUM | EQH and Subsidiaries as a % of our Institutional Revenues |
|
|
| |
| |
As of December 31, 2024, 2023 and 2022, Institutional Services represented approximately 41%, 44% and 46%, respectively, of our AUM, and the fees we earned from providing these services represented approximately 16% of our net revenues for each of those years. Our AUM and revenues are as follows:
| | |
|
Institutional Services Assets Under Management (by Investment Service) |
|
| | | | | | | | | | | | | | | | | | | | | | | | | | | | | |
| | Years Ended December 31 | | % Change |
| 2024 | 2023 | 2022 | | 2024-23 | 2023-22 |
| | (in millions) | | | |
| Equity: | | | | | | | | | |
| Equity Actively Managed | | $ | 48,952 | | | $ | 59,423 | | | $ | 55,731 | | | (17.6 | %) | 6.6 | % |
Equity Passively Managed(1) | | 24,614 | | | 23,630 | | | 21,062 | | | 4.2 | | 12.2 | |
| Total Equity | | 73,566 | | | 83,053 | | | 76,793 | | | (11.4) | | 8.2 | |
| U.S. | | 40,799 | | | 40,930 | | | 35,428 | | | (0.3) | | 15.5 | |
| Global & Non-U.S. | | 32,767 | | | 42,123 | | | 41,365 | | | (22.2) | | 1.8 | |
| Total Equity | | 73,566 | | | 83,053 | | | 76,793 | | | (11.4) | | 8.2 | |
| Fixed Income: | | | | | | | | | |
| Fixed Income Taxable | | 116,744 | | | 126,350 | | | 121,871 | | | (7.6) | | 3.7 | |
| Fixed Income Tax-Exempt | | 1,564 | | | 1,317 | | | 849 | | | 18.8 | | 55.1 | |
Fixed Income Passively Managed(1) | | 81 | | | 306 | | | 192 | | | (73.5) | | 59.4 | |
| Total Fixed Income | | 118,389 | | | 127,973 | | | 122,912 | | | (7.5) | | 4.1 | |
| U.S. | | 88,720 | | | 95,808 | | | 88,800 | | | (7.4) | | 7.9 | |
| Global & Non-U.S. | | 29,669 | | | 32,165 | | | 34,112 | | | (7.8) | | (5.7) | |
| Total Fixed Income | | 118,389 | | | 127,973 | | | 122,912 | | | (7.5) | | 4.1 | |
Alternatives/Multi-Asset Solutions(2): | | | | | | | | | |
| U.S. | | 30,942 | | | 13,810 | | | 12,873 | | | 124.1 | | 7.3 | |
| Global & Non-U.S. | | 98,493 | | | 92,288 | | | 84,703 | | | 6.7 | | 9.0 | |
| Total Alternatives/Multi-Asset Solutions | | 129,435 | | | 106,098 | | | 97,576 | | | 22.0 | | 8.7 | |
| Total: | | | | | | | | | |
| U.S. | | 160,461 | | | 150,548 | | | 137,101 | | | 6.6 | | 9.8 | |
| Global & Non-U.S. | | 160,929 | | | 166,576 | | | 160,180 | | | (3.4) | | 4.0 | |
| Total | | $ | 321,390 | | | $ | 317,124 | | | $ | 297,281 | | | 1.3 | % | 6.7 | % |
| Affiliated - EQH | | $ | 87,447 | | | $ | 78,942 | | | $ | 70,924 | | | 10.8 | % | 11.3 | % |
| | | | | | | | | |
| Non-affiliated | | 233,943 | | | 238,182 | | | 226,357 | | | (1.8) | | 5.2 | |
| Total | | $ | 321,390 | | | $ | 317,124 | | | $ | 297,281 | | | 1.3 | % | 6.7 | % |
(1)Includes index and enhanced index services.
(2)Includes certain multi-asset solutions and services not included in equity or fixed income services.
| | |
|
Revenues from Institutional Services (by Investment Service) |
|
| | | | | | | | | | | | | | | | | | | | | | | | | | | | | |
| | Years Ended December 31 | | % Change |
| 2024 | 2023 | 2022 | | 2024-23 | 2023-22 |
| | (in thousands) | | | |
| Equity: | | | | | | | | | |
| Equity Actively Managed | | $ | 183,526 | | | $ | 197,822 | | | $ | 220,917 | | | (7.2 | %) | (10.5 | %) |
Equity Passively Managed(1) | | 4,190 | | | 4,115 | | | 4,910 | | | 1.8 | | (16.2) | |
| Total Equity | | 187,716 | | | 201,937 | | | 225,827 | | | (7.0) | | (10.6) | |
| U.S. | | 79,185 | | | 75,861 | | | 80,908 | | | 4.4 | | (6.2) | |
| Global & Non-U.S. | | 108,531 | | | 126,076 | | | 144,919 | | | (13.9) | | (13.0) | |
| Total Equity | | 187,716 | | | 201,937 | | | 225,827 | | | (7.0) | | (10.6) | |
| Fixed Income: | | | | | | | | | |
| Fixed Income Taxable | | 166,539 | | | 180,625 | | | 189,679 | | | (7.8) | | (4.8) | |
| Fixed Income Tax-Exempt | | 1,955 | | | 1,300 | | | 1,182 | | | 50.4 | | 10.0 | |
Fixed Income Passively Managed(1) | | 934 | | | 580 | | | 425 | | | 61.0 | | 36.5 | |
Fixed Income Servicing(2) | | 22,315 | | | 20,149 | | | 15,991 | | | 10.7 | | 26.0 | |
| Total Fixed Income | | 191,743 | | | 202,654 | | | 207,277 | | | (5.4) | | (2.2) | |
| U.S. | | 127,699 | | | 135,560 | | | 128,392 | | | (5.8) | | 5.6 | |
| Global & Non-U.S. | | 64,044 | | | 67,094 | | | 78,885 | | | (4.5) | | (14.9) | |
| Total Fixed Income | | 191,743 | | | 202,654 | | | 207,277 | | | (5.4) | | (2.2) | |
Alternatives/Multi-Asset Solutions(3): | | | | | | | | | |
| U.S. | | 130,533 | | | 94,488 | | | 114,982 | | | 38.1 | | (17.8) | |
| Global & Non-U.S. | | 190,234 | | | 166,964 | | | 111,202 | | | 13.9 | | 50.1 | |
| Total Alternatives/Multi-Asset Solutions | | 320,767 | | | 261,452 | | | 226,184 | | | 22.7 | | 15.6 | |
| Total Investment Advisory and Services Fees: | | | | | | | | | |
| U.S. | | 337,417 | | | 305,909 | | | 324,282 | | | 10.3 | | (5.7) | |
| Global & Non-U.S. | | 362,809 | | | 360,134 | | | 335,004 | | | 0.7 | | 7.5 | |
| | | | | | | | | |
| Total | | 700,226 | | | 666,043 | | | 659,286 | | | 5.1 | | 1.0 | |
| Distribution Revenues | | 203 | | | 250 | | | 268 | | | (18.8) | | (6.7) | |
| Shareholder Servicing Fees | | 367 | | | 377 | | | 429 | | (2.7) | | (12.1) | |
| Total | | $ | 700,796 | | | $ | 666,670 | | | $ | 659,983 | | | 5.1 | % | 1.0 | % |
| Affiliated - EQH | | $ | 157,017 | | | $ | 144,523 | | | $ | 125,229 | | | 8.6 | % | 15.4 | % |
| | | | | | | | | |
| Non-affiliated | | 543,779 | | | 522,147 | | | 534,754 | | | 4.1 | | (2.4) | |
| Total | | $ | 700,796 | | | $ | 666,670 | | | $ | 659,983 | | | 5.1 | % | 1.0 | % |
(1)Includes index and enhanced index services.
(2)Fixed Income Servicing includes advisory-related services fees that are not based on AUM, including derivative transaction fees, capital purchase program-related advisory services and other fixed income advisory services.
(3)Includes certain multi-asset solutions and services not included in equity or fixed income services.
Retail
We provide investment management and related services to a wide variety of individual retail investors globally through retail mutual funds we sponsor, mutual fund sub-advisory relationships, separately-managed account programs (see below), and other investment vehicles (“Retail Products and Services”).
We distribute our Retail Products and Services through financial intermediaries, including broker-dealers, insurance sales representatives, banks, registered investment advisers and financial planners. These products and services include open-end and closed-end funds that are either (i) registered as investment companies under the Investment Company Act (“U.S. Funds”), or (ii) not registered under the Investment Company Act and generally not offered to U.S. persons (“Non-U.S. Funds” and, collectively with the U.S. Funds, “AB Funds”). They also include separately-managed account programs, which are sponsored by financial intermediaries and generally charge an all-inclusive fee covering investment management, trade execution, asset allocation, and custodial and administrative services. In addition, we provide distribution, shareholder servicing, transfer agency services and administrative services for our Retail Products and Services. See “Net Revenues – Investment Advisory and Services Fees” in Item 7 for information about our retail investment advisory and services fees. See Note 2 to AB’s consolidated financial statements in Item 8 for a discussion of the commissions we pay to financial intermediaries in connection with the sale of open-end AB Funds.
Fees paid by the U.S. Funds are reflected in the applicable investment management agreement, which generally must be approved annually by the board of directors or trustees of those funds, by a majority vote of the independent directors or trustees. Increases in these fees must be approved by fund shareholders; decreases need not be, including any decreases implemented by a fund’s directors or trustees. In general, each investment management agreement with the U.S. Funds provides for termination by either party, at any time, upon 60 days’ notice.
Fees paid by Non-U.S. Funds are reflected in management agreements that continue until they are terminated. Increases in these fees generally must be approved by the relevant regulatory authority, depending on the domicile and structure of the fund, and Non-U.S. Fund shareholders must be given advance notice of any fee increases.
The mutual funds we sub-advise for EQH and its subsidiaries constitute our largest retail client. EQH and its subsidiaries accounted for approximately 13%, 14% and 14% of our retail AUM as of December 31, 2024, 2023 and 2022, respectively, and approximately 1% of our retail net revenues for the years ended December 31, 2024, 2023 and 2022.
Most open-end U.S. Funds have adopted a plan under Rule 12b-1 of the Investment Company Act that allows the fund to pay, out of assets of the fund, distribution and service fees for the distribution and sale of its shares. The open-end U.S. Funds have entered into such agreements with us, and we have entered into selling and distribution agreements pursuant to which we pay sales commissions to the financial intermediaries that distribute our open-end U.S. Funds. These agreements are terminable by either party upon notice (generally 30 days) and do not obligate the financial intermediary to sell any specific amount of fund shares.
As of December 31, 2024, retail U.S. Fund AUM were approximately $74 billion, or 22% of retail AUM, as compared to $66 billion, or 23%, as of December 31, 2023, and $54 billion, or 22%, as of December 31, 2022. Retail non-U.S. Fund AUM, as of December 31, 2024, totaled $127 billion, or 38% of retail AUM, as compared to $107 billion, or 37%, as of December 31, 2023, and $96 billion, or 39%, as of December 31, 2022.
Our Retail Services represented approximately 42%, 39% and 38% of our AUM as of December 31, 2024, 2023 and 2022, respectively, and the fees we earned from providing these services represented approximately 52%, 46% and 49% of our net revenues for the years ended December 31, 2024, 2023 and 2022, respectively. Our AUM and revenues are as follows:
| | |
|
Retail Services Assets Under Management (by Investment Service) |
|
| | | | | | | | | | | | | | | | | | | | | | | | | | | | | |
| | Years Ended December 31 | | % Change |
| 2024 | 2023 | 2022 | | 2024-23 | 2023-22 |
| | (in millions) | | | |
| Equity: | | | | | | | | | |
| Equity Actively Managed | | $ | 160,638 | | | $ | 137,702 | | | $ | 116,235 | | | 16.7 | % | 18.5 | % |
Equity Passively Managed(1) | | 37,608 | | | 34,582 | | | 30,445 | | | 8.8 | | 13.6 | |
| Total Equity | | 198,246 | | | 172,284 | | | 146,680 | | | 15.1 | | 17.5 | |
| U.S. | | 168,086 | | | 141,721 | | | 118,547 | | | 18.6 | | 19.5 | |
| Global & Non-U.S. | | 30,160 | | | 30,563 | | | 28,133 | | | (1.3) | | 8.6 | |
| Total Equity | | 198,246 | | | 172,284 | | | 146,680 | | | 15.1 | | 17.5 | |
| Fixed Income: | | | | | | | | | |
| Fixed Income Taxable | | 73,839 | | | 64,051 | | | 53,995 | | | 15.3 | | 18.6 | |
| Fixed Income Tax-Exempt | | 44,652 | | | 33,014 | | | 26,714 | | | 35.3 | | 23.6 | |
Fixed Income Passively Managed(1) | | 10,212 | | | 11,066 | | | 9,206 | | | (7.7) | | 20.2 | |
| Total Fixed Income | | 128,703 | | | 108,131 | | | 89,915 | | | 19.0 | | 20.3 | |
| U.S. | | 69,525 | | | 52,683 | | | 41,151 | | | 32.0 | | 28.0 | |
| Global & Non-U.S. | | 59,178 | | | 55,448 | | | 48,764 | | | 6.7 | | 13.7 | |
| Total Fixed Income | | 128,703 | | | 108,131 | | | 89,915 | | | 19.0 | | 20.3 | |
Alternatives/Multi-Asset Solutions(2): | | | | | | | | | |
| U.S. | | 2,808 | | | 2,724 | | | 2,697 | | | 3.1 | | 1.0 | |
| Global & Non-U.S. | | 4,498 | | | 3,636 | | | 3,594 | | | 23.7 | | 1.2 | |
| Total Alternatives/Multi-Asset Solutions | | 7,306 | | | 6,360 | | | 6,291 | | | 14.9 | | 1.1 | |
| Total: | | | | | | | | | |
| U.S. | | 240,419 | | | 197,128 | | | 162,395 | | | 22.0 | | 21.4 | |
| Global & Non-U.S. | | 93,836 | | | 89,647 | | | 80,491 | | | 4.7 | | 11.4 | |
| Total | | $ | 334,255 | | | $ | 286,775 | | | $ | 242,886 | | | 16.6 | % | 18.1 | % |
| Affiliated - EQH | | $ | 44,009 | | | $ | 40,516 | | | $ | 34,110 | | | 8.6 | % | 18.8 | % |
| | | | | | | | | |
| Non-affiliated | | 290,246 | | | 246,259 | | | 208,776 | | | 17.9 | | 18.0 | |
| Total | | $ | 334,255 | | | $ | 286,775 | | | $ | 242,886 | | | 16.6 | % | 18.1 | % |
(1)Includes index and enhanced index services.
(2)Includes certain multi-asset solutions and services not included in equity or fixed income services
| | |
|
Revenues from Retail Services (by Investment Service) |
|
| | | | | | | | | | | | | | | | | | | | | | | | | | | | | |
| | Years Ended December 31 | | % Change |
| 2024 | 2023 | 2022 | | 2024-23 | 2023-22 |
| | (in thousands) | | | |
| Equity: | | | | | | | | | |
| Equity Actively Managed | | $ | 869,324 | | | $ | 732,186 | | | $ | 746,889 | | | 18.7 | % | (2.0 | %) |
Equity Passively Managed(1) | | 12,652 | | | 11,283 | | | 12,870 | | | 12.1 | | (12.3) | |
| Total Equity | | 881,976 | | | 743,469 | | | 759,759 | | | 18.6 | | (2.1) | |
| U.S. | | 685,686 | | | 556,751 | | | 558,319 | | | 23.2 | | (0.3) | |
| Global & Non-U.S. | | 196,290 | | | 186,718 | | | 201,440 | | | 5.1 | | (7.3) | |
| Total Equity | | 881,976 | | | 743,469 | | | 759,759 | | | 18.6 | | (2.1) | |
| Fixed Income: | | | | | | | | | |
| Fixed Income Taxable | | 443,908 | | | 373,659 | | | 390,708 | | | 18.8 | | (4.4) | |
| Fixed Income Tax-Exempt | | 105,123 | | | 88,128 | | | 89,450 | | | 19.3 | | (1.5) | |
Fixed Income Passively Managed(1) | | 11,160 | | | 12,247 | | | 13,682 | | | (8.9) | | (10.5) | |
| Total Fixed Income | | 560,191 | | | 474,034 | | | 493,840 | | | 18.2 | | (4.0) | |
| U.S. | | 147,419 | | | 118,288 | | | 119,053 | | | 24.6 | | (0.6) | |
| Global & Non-U.S. | | 412,772 | | | 355,746 | | | 374,787 | | | 16.0 | | (5.1) | |
| Total Fixed Income | | 560,191 | | | 474,034 | | | 493,840 | | | 18.2 | | (4.0) | |
Alternatives/Multi-Asset Solutions(2): | | | | | | | | | |
| U.S. | | 61,732 | | | 44,273 | | | 55,356 | | | 39.4 | | (20.0) | |
| Global & Non-U.S. | | 17,794 | | | 13,499 | | | 13,484 | | | 31.8 | | 0.1 | |
| Total Alternatives/Multi-Asset Solutions | | 79,526 | | | 57,772 | | | 68,840 | | | 37.7 | | (16.1) | |
| Total Investment Advisory and Services Fees: | | | | | | | | | |
| U.S. | | 894,837 | | | 719,312 | | | 732,728 | | | 24.4 | | (1.8) | |
| Global & Non-U.S. | | 626,856 | | | 555,963 | | | 589,711 | | | 12.8 | | (5.7) | |
| Consolidated company-sponsored investment funds | | 486 | | | 836 | | | 770 | | | (41.9) | | 8.6 | |
| Total | | 1,522,179 | | | 1,276,111 | | | 1,323,209 | | | 19.3 | | (3.6) | |
| Distribution Revenues | | 703,174 | | | 569,485 | | | 594,431 | | | 23.5 | | (4.2) | |
| Shareholder Servicing Fees | | 85,964 | | | 80,424 | | | 83,268 | | | 6.9 | | (3.4) | |
| Total | | $ | 2,311,317 | | | $ | 1,926,020 | | | $ | 2,000,908 | | | 20.0 | % | (3.7 | %) |
| Affiliated - EQH | | $ | 24,060 | | | $ | 21,842 | | | $ | 23,836 | | | 10.2 | % | (8.4 | %) |
| | | | | | | | | |
| Non-affiliated | | 2,287,257 | | | 1,904,178 | | | 1,977,072 | | | 20.1 | | (3.7) | |
| Total | | $ | 2,311,317 | | | $ | 1,926,020 | | | $ | 2,000,908 | | | 20.0 | % | (3.7 | %) |
(1)Includes index and enhanced index services.
(2)Includes certain multi-asset solutions and services not included in equity or fixed income services.
Private Wealth Management
We partner with our clients, embracing innovation and research to address increasingly complex challenges. Our clients include high-net-worth individuals and families who have created generational wealth as successful business owners, athletes, entertainers, corporate executives and private practice owners. We also provide investment and wealth advice to foundations and endowments, family offices and other entities. Our flexible and extensive investment platform offers a range of solutions, including separately-managed accounts, hedge funds, mutual funds and other investment vehicles, tailored to meet each distinct client's needs. Our investment platform is complimented with a wealth platform that includes complex tax and estate planning, pre-IPO and pre-transaction planning, multi-generational family engagement, and philanthropic advice in addition to tailored approaches to meeting the unique needs of emerging wealth and multi-cultural demographics ("Private Wealth Services").
We manage accounts pursuant to written investment advisory agreements, which generally are terminable at any time or upon relatively short notice by any authorized party, and may not be assigned without the client's consent. For information about our investment advisory and services fees, including performance-based fees, see “Risk Factors” in Item 1A and “Net Revenues – Investment Advisory and Services Fees” in Item 7.
Our Private Wealth Services represented approximately 17%, 17% and 16% of our AUM as of December 31, 2024, 2023 and 2022, respectively. The fees we earned from providing these services represented approximately 28%, 25% and 25% of our net revenues for 2024, 2023 and 2022. Our AUM and revenues are as follows:
| | |
|
Private Wealth Services Assets Under Management (by Investment Service) |
|
| | | | | | | | | | | | | | | | | | | | | | | | | | | | | | | | |
| | Years Ended December 31 | | % Change | | | |
| 2024 | 2023 | 2022 | | 2024-23 | 2023-22 | | | |
| | (in millions) | | | | | | |
| Equity: | | | | | | | | | | | | |
| Equity Actively Managed | | $ | 53,788 | | | $ | 50,351 | | | $ | 45,977 | | | 6.8 | % | 9.5 | % | | | |
Equity Passively Managed(1) | | 6,102 | | | 3,851 | | | 2,304 | | | 58.5 | | 67.1 | | | | |
| Total Equity | | 59,890 | | | 54,202 | | | 48,281 | | | 10.5 | | 12.3 | | | | |
| U.S. | | 39,056 | | | 33,639 | | | 28,014 | | | 16.1 | | 20.1 | | | | |
| Global & Non-U.S. | | 20,834 | | | 20,563 | | | 20,267 | | | 1.3 | | 1.5 | | | | |
| Total Equity | | 59,890 | | | 54,202 | | | 48,281 | | | 10.5 | | 12.3 | | | | |
| Fixed Income: | | | | | | | | | | | | |
| Fixed Income Taxable | | 18,712 | | | 18,201 | | | 14,391 | | | 2.8 | | 26.5 | | | | |
| Fixed Income Tax-Exempt | | 29,971 | | | 26,760 | | | 24,953 | | | 12.0 | | 7.2 | | | | |
Fixed Income Passively Managed(1) | | — | | | 2 | | | 2 | | | (100.0) | | — | | | | |
| Total Fixed Income | | 48,683 | | | 44,963 | | | 39,346 | | | 8.3 | | 14.3 | | | | |
| U.S. | | 43,969 | | | 40,166 | | | 34,764 | | | 9.5 | | 15.5 | | | | |
| Global & Non-U.S. | | 4,714 | | | 4,797 | | | 4,582 | | | (1.7) | | 4.7 | | | | |
| Total Fixed Income | | 48,683 | | | 44,963 | | | 39,346 | | | 8.3 | | 14.3 | | | | |
Alternatives/Multi-Asset Solutions(2): | | | | | | | | | | | | |
| U.S. | | 9,504 | | | 6,923 | | | 6,607 | | | 37.3 | | 4.8 | | | | |
| Global & Non-U.S. | | 18,462 | | | 15,167 | | | 12,021 | | | 21.7 | | 26.2 | | | | |
| Total Alternatives/Multi-Asset Solutions | | 27,966 | | | 22,090 | | | 18,628 | | | 26.6 | | 18.6 | | | | |
| Total: | | | | | | | | | | | | |
| U.S. | | 92,529 | | | 80,728 | | | 69,385 | | | 14.6 | | 16.3 | | | | |
| Global & Non-U.S. | | 44,010 | | | 40,527 | | | 36,870 | | | 8.6 | | 9.9 | | | | |
| Total | | $ | 136,539 | | | $ | 121,255 | | | $ | 106,255 | | | 12.6 | % | 14.1 | % | | | |
(1)Includes index and enhanced index services.
(2)Includes certain multi-asset solutions and services not included in equity or fixed income services.
| | |
|
Revenues from Private Wealth Services (by Investment Service) |
|
| | | | | | | | | | | | | | | | | | | | | | | | | | | | | |
| | Years Ended December 31 | | % Change |
| 2024 | 2023 | 2022 | | 2024-23 | 2023-22 |
| | (in thousands) | | | |
| Equity: | | | | | | | | | |
| Equity Actively Managed | | $ | 552,321 | | | $ | 502,673 | | | $ | 521,155 | | | 9.9 | % | (3.5 | %) |
Equity Passively Managed(1) | | 24,473 | | | 14,711 | | | 8,700 | | | 66.4 | | 69.1 | |
| Total Equity | | 576,794 | | | 517,384 | | | 529,855 | | | 11.5 | | (2.4) | |
| U.S. | | 359,338 | | | 304,456 | | | 295,235 | | | 18.0 | | 3.1 | |
| Global & Non-U.S. | | 217,456 | | | 212,928 | | | 234,620 | | | 2.1 | | (9.2) | |
| Total Equity | | 576,794 | | | 517,384 | | | 529,855 | | | 11.5 | | (2.4) | |
| Fixed Income: | | | | | | | | | |
| Fixed Income Taxable | | 81,457 | | | 70,887 | | | 66,851 | | | 14.9 | | 6.0 | |
| Fixed Income Tax-Exempt | | 134,814 | | | 124,438 | | | 125,123 | | | 8.3 | | (0.5) | |
Fixed Income Passively Managed(1) | | 8 | | | 13 | | | 1,804 | | | (38.5) | | (99.3) | |
| Total Fixed Income | | 216,279 | | | 195,338 | | | 193,778 | | | 10.7 | | 0.8 | |
| U.S. | | 184,086 | | | 164,601 | | | 159,411 | | | 11.8 | | 3.3 | |
| Global & Non-U.S. | | 32,193 | | | 30,737 | | | 34,367 | | | 4.7 | | (10.6) | |
| Total Fixed Income | | 216,279 | | | 195,338 | | | 193,778 | | | 10.7 | | 0.8 | |
Alternatives/Multi-Asset Solutions(2): | | | | | | | | | |
| U.S. | | 311,875 | | | 223,518 | | | 195,666 | | | 39.5 | | 14.2 | |
| Global & Non-U.S. | | 114,786 | | | 97,074 | | | 69,245 | | | 18.2 | | 40.2 | |
| Total Alternatives/Multi-Asset Solutions | | 426,661 | | | 320,592 | | | 264,911 | | | 33.1 | | 21.0 | |
| Total Investment Advisory and Services Fees: | | | | | | | | | |
| U.S. | | 855,299 | | | 692,575 | | | 650,311 | | | 23.5 | | 6.5 | |
| Global & Non-U.S. | | 364,435 | | | 340,739 | | | 338,232 | | | 7.0 | | 0.7 | |
| | | | | | | | | |
| Total | | 1,219,734 | | | 1,033,314 | | | 988,543 | | | 18.0 | % | 4.5 | % |
| Distribution Revenues | | 23,293 | | | 16,528 | | | 12,496 | | | 40.9 | | 32.3 | |
| Shareholder Servicing Fees | | 2,864 | | | 3,001 | | | 2,964 | | | (4.6) | | 1.2 | |
| Total | | $ | 1,245,891 | | | $ | 1,052,843 | | | $ | 1,004,003 | | | 18.3 | % | 4.9 | % |
(1)Includes index and enhanced index services.
(2)Includes certain multi-asset solutions and services not included in equity or fixed income services.
Bernstein Research Services
Effective April 1, 2024, AB and Societe Generale ("SocGen") completed their previously announced transaction to form a global joint venture with two joint venture holding companies, one outside of North America and one within North America ("NA JV", and together the "JVs"). AB owns a majority interest in the NA JV while SocGen owns a majority interest in the joint venture outside of North America. AB has deconsolidated the Bernstein Research Services business ("Bernstein Research Services" or "BRS") and retained the Bernstein Private Wealth Management business within its existing U.S. broker dealer Sanford C. Bernstein & Co., LLC. For further discussion, see Note 24 Divestitures to AB's consolidated financial statements in Item 8.
Prior to the deconsolidation of the BRS business, we earned revenues for providing investment research to, and executing brokerage transactions for, institutional clients. These clients compensated us principally by directing us to execute brokerage transactions on their behalf, for which we earned commissions, and to a lesser extent, by paying us directly for research through commission sharing agreements or cash payments. Bernstein Research Services accounted for approximately 2%, 9% and 10% of our net revenues for the years ended December 31, 2024, 2023 and 2022, respectively.
For information regarding trends in fee rates charged for brokerage transactions, see “Risk Factors” in Item 1A.
Our Bernstein Research Services revenues are as follows:
| | |
|
| Revenues from Bernstein Research Services |
|
| | | | | | | | | | | | | | | | | | | | | | | | | | | | | |
| | Years Ended December 31 | | % Change |
| 2024 | 2023 | 2022 | | 2024-23 | 2023-22 |
| | (in thousands) | | | |
| Bernstein Research Services | | $ | 96,222 | | | $ | 386,142 | | | $ | 416,273 | | | (75.1 | %) | (7.2 | %) |
Custody
Our U.S. based broker-dealer subsidiary acts as custodian for substantially all of our Private Wealth Management AUM and some of our Institutional AUM. Other custodian arrangements, directed by clients, or where clients authorize or instruct us to appoint a custodian on their behalf, include banks, trust companies, brokerage firms and other financial institutions.
People Management
As a leading global investment management and research firm, we bring together a wide range of insights, expertise, and innovation to advance the interests of our clients around the world. The intellectual capital and distinctive knowledge of our employees are collectively the most important assets of our firm, so the long-term sustainability and success of our firm is heavily dependent on our people. Our People team plays a central role in supporting our employees and advancing their work experience. We are keenly focused on fostering an inclusive culture; encouraging innovation; sourcing, developing, and retaining top performing talent; and consistently aligning employees’ incentives and risk taking with those of the firm.
As a result, we have a robust firm culture that helps us to elevate performance and drive excellence. Further, our firm’s role as a fiduciary is embedded in our culture and our day-to-day practices. As a fiduciary, our firm’s primary objective is to act in our clients' best interests and help them reach their financial goals.
Also, our Board of Directors (the "Board") and committees of the Board, particularly our Compensation and Workplace Practices Committee, provide oversight into various matters affecting our people, including emerging people management risks and strategies to mitigate our exposure to those risks. These collaborative efforts contribute to the overall framework that guides how AB oversees a workforce that supports our values and drives our strategic initiatives.
Talent Acquisition and Development
AB seeks to excel as an organization, in investment performance, client service, and being defined as an employer of choice. Across our global offices, we recruit and hire a workforce with diverse perspectives, backgrounds, and experiences. Our talent acquisition strategy helps us serve both our clients and our workforce, hand in hand, at an optimal level. We engage external organizations, including search firms and partnerships to assist in attracting and recruiting top talent at all levels. We also leverage technology tools to source and evaluate candidates against our needs and we continue to prioritize attracting diverse talent throughout our search activities. Outside of traditional recruiting, we believe investing in emerging talent is key to our future planning. Both our internship and associate programs serve as robust pipelines for future leadership. The talent acquisition process is our firm’s first impression to future employees, and we strive to provide all candidates with a unique and
compelling experience. Enhancing the firm’s recruiting efforts to include talent with a nontraditional path to financial services has been a focus area this year. We recognize that traditional recruitment efforts may not always provide access to the full range of top talent available in the marketplace. Therefore, we remain committed to implementing a recruiting strategy that is broad and includes partnering with community organizations, exploring alternative education and training programs, while more effectively leveraging the networks of our existing top performing talent leading to a valuable expansion of the pool of qualified applicants available to the firm.
We focus heavily on high candidate engagement, an efficient offer process and sound onboarding to support success. Learning and continued development are central to our talent strategy. In addition to an established culture of mentoring, we leverage technology to develop and deploy relevant coursework. Internal mobility is championed throughout the firm and progressing assignments of responsibility offer employees career growth and new opportunities. We remain highly committed to development and believe that top performers expect and deserve this ongoing investment.
Employee Engagement and Fostering an Inclusive Culture
We believe a workforce is most engaged when employees feel connected to our culture. We seek to create a workplace where our people recognize the high importance of the work they do and enjoy the environment where the work gets done. By creating a culture of both high performance and accountability, we see employees thrive and contribute at their highest levels. It is important that our employees are not only connected to our business but also to the communities in which we operate. We offer many opportunities to volunteer, including our firm-wide philanthropic initiative, AB Gives Back. We prioritize the well-being of our staff through our global wellness programming, employee wellness groups, and our hybrid work schedule. Measuring engagement is key to understanding the views and perspectives of the organization. We utilize AB Voice, a periodic engagement survey designed to measure employee sentiment, to identify and address gaps that could impact productivity and retention.
AB is committed to promoting a diverse and inclusive workplace because we believe it has had a positive impact on our people, clients, and communities. In 2024, the workplace continued to undergo changes driven by various factors including rapid technological changes, evolving employee expectations, nuanced global needs and broader societal shifts. We have navigated the current dynamic environment by fostering a culture of continuous learning with a focus on employee engagement, exploring nontraditional recruiting sources, and locally driven inclusion initiatives.
We have prioritized initiatives and events that allow for learning, employee development and healthy discourse to cultivate an environment centered on inclusion. Our Employee Resource Groups hosted over 70 events which aimed to not only foster an inclusive work environment, but also contribute to business opportunities and the professional development of employees worldwide. Additionally, we leverage data from our annual engagement survey to inform our decision-making process and gain a deeper understanding of the ever-changing needs of our diverse workforce across the globe.
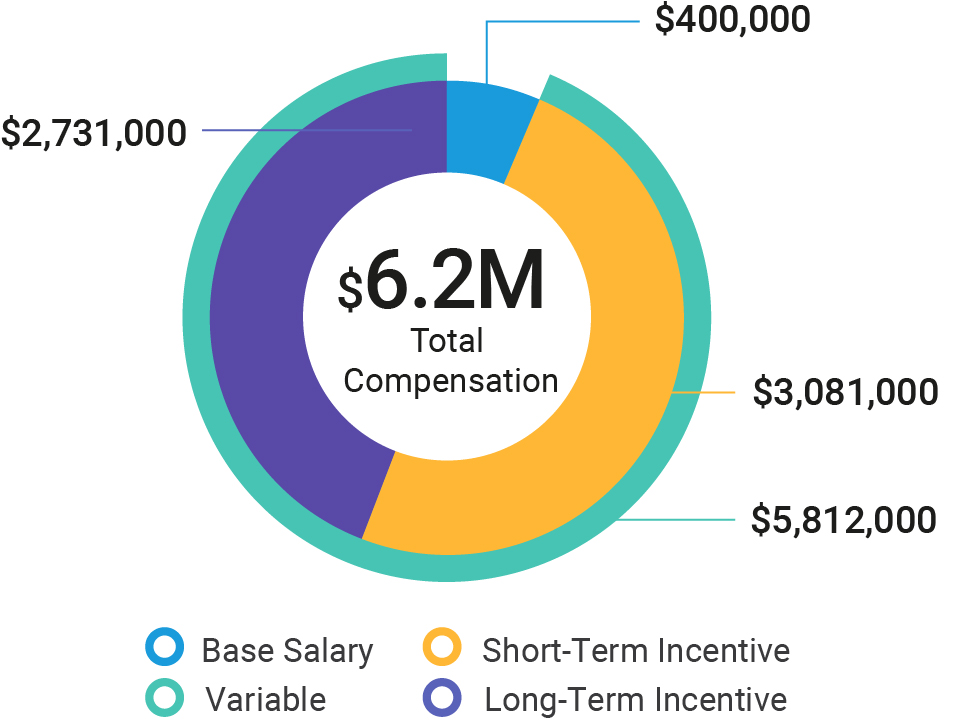
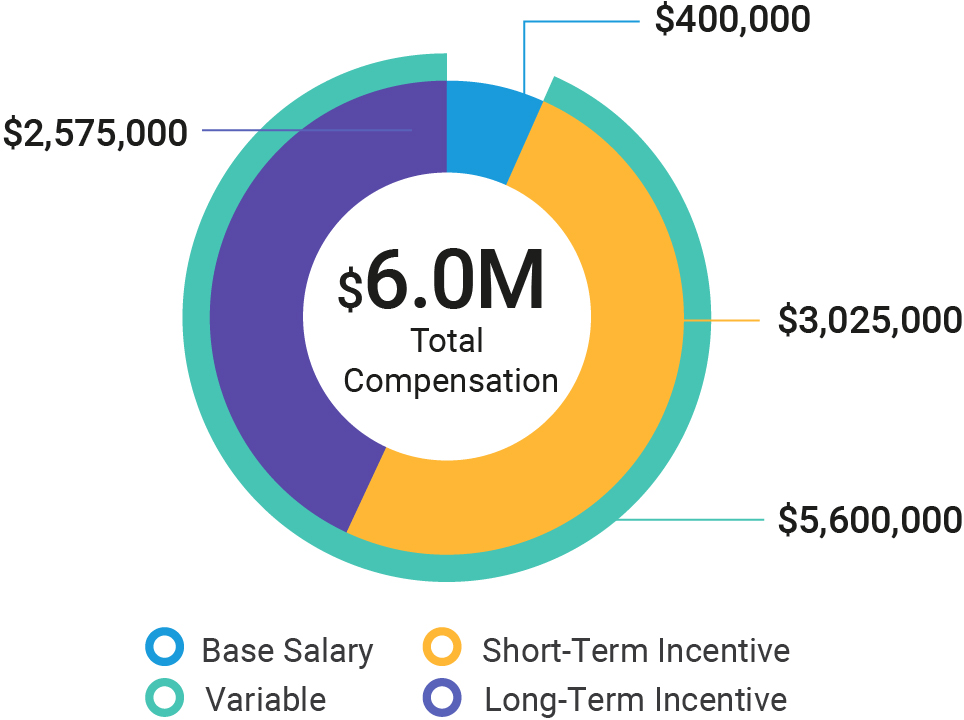
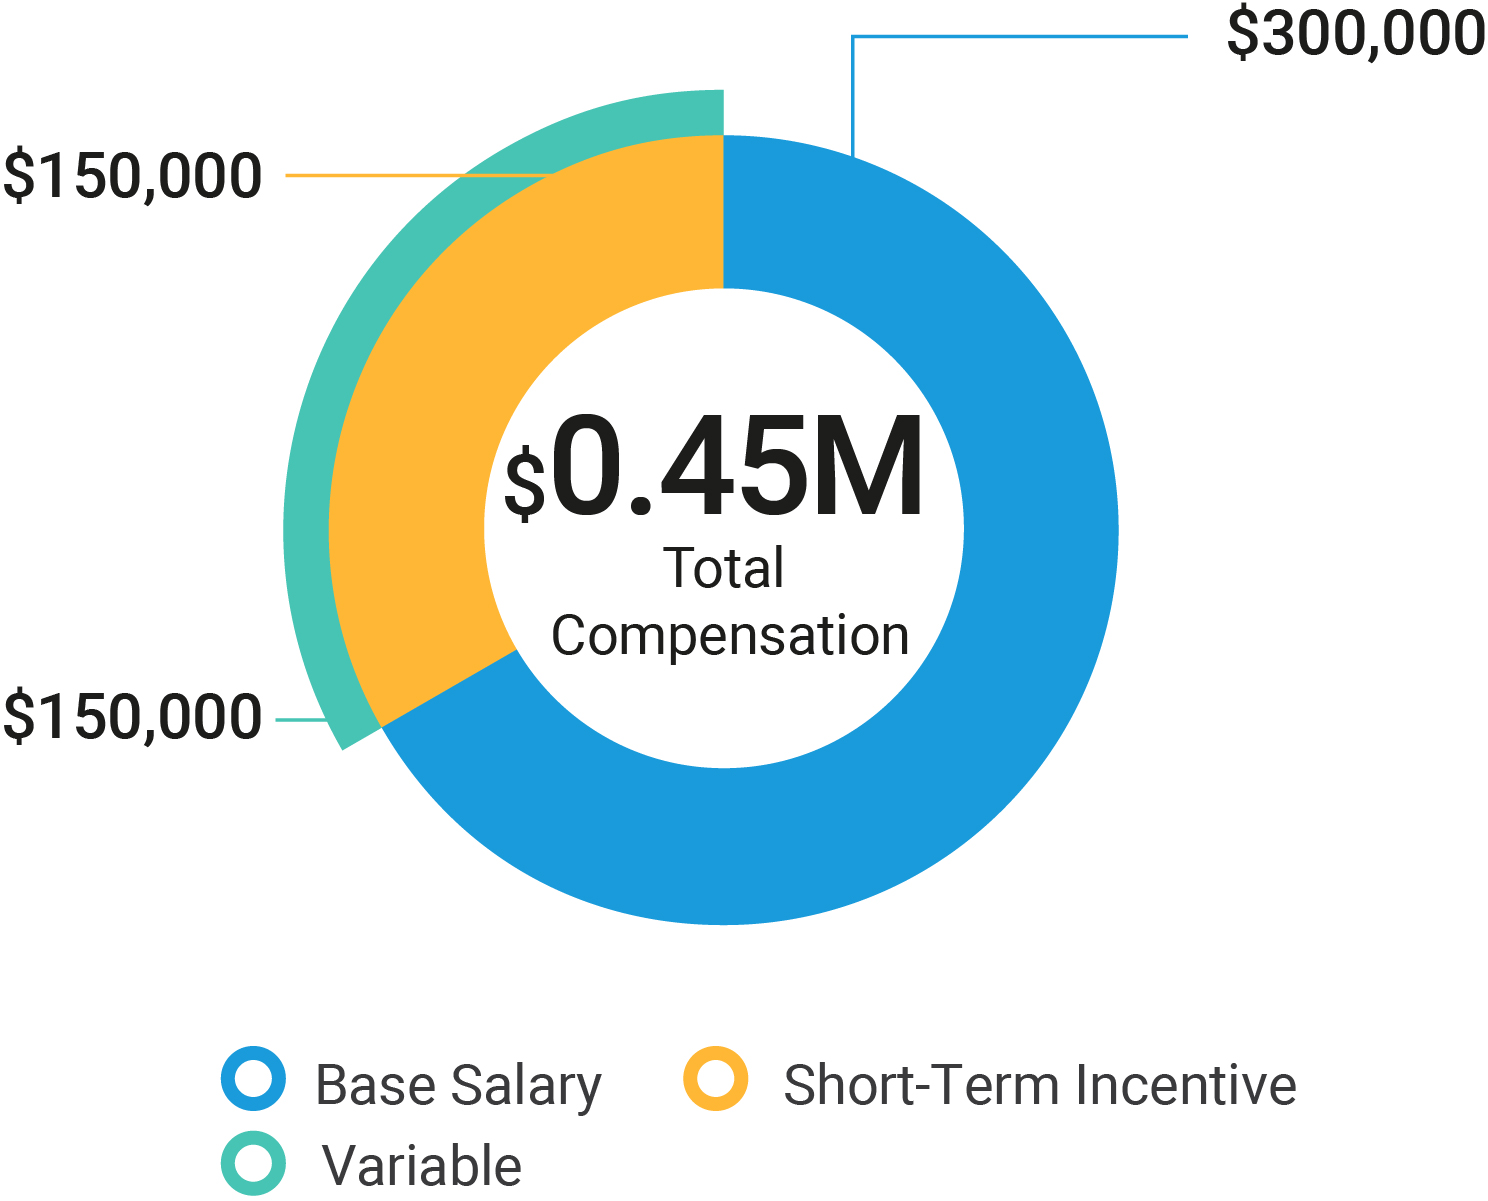
Compensation and Benefits
We recognize the role that a competitive total reward offering plays in attracting and retaining top talent. Our pay practices include base salaries, annual cash bonuses, and, for employees with total compensation over $300,000 annually, a long-term incentive compensation award. These awards are generally denominated in restricted AB Holding Units. We utilize this structure with intentionality to foster a stronger sense of ownership by employees, aligning their interests directly with the interests of our Unitholders and indirectly with the interests of our clients. We are a meritocracy and pay for performance under the auspices of providing compensation that is competitive and consistent with employee positions, skill levels, performance, experience, knowledge, and geographic location. Annually, we engage a compensation consulting firm to independently evaluate the accuracy of our executive compensation and to provide benchmarking against our industry peers. We also use these insights to make pay decisions for the broader organization. Periodically, we engage outside counsel to conduct privileged pay equity reviews. Pay is evaluated on an annual basis, with the firm providing merit-based and cost of living annual base salary increases, as well as incentive compensation. This information is communicated to employees at year-end. On occasion, pay is adjusted off-cycle due to internal transfer and/or promotion. Based on unique geographies, the firm makes benefits available to all eligible employees, including health insurance, paid and unpaid leaves, a self-directed retirement plan, and life and disability/accident coverage. We also offer a variety of voluntary benefits, ranging from adoption and surrogacy assistance to tuition reimbursement, which allows employees to select the offerings that meet their individual needs.
Employees
As of December 31, 2024, our firm had 4,341 full-time employees as compared to 4,707 employees as of December 31, 2023. The decrease was primarily due to the BRS deconsolidation.
As of December 31, 2024, our employees reflected the following characteristics and locations:
| | | | | | | | | | | | | | | | | | | | |
| Region: | Female | % Female | Male | % Male | Grand Total | % of Total |
| Americas | 1,082 | | 26 | % | 1,870 | | 45 | % | 2,952 | 71 | % |
| Asia ex Japan | 319 | | 8 | % | 407 | | 9 | % | 726 | 17 | % |
| EMEA | 181 | | 4 | % | 236 | | 6 | % | 417 | 10 | % |
| Japan | 56 | | 1 | % | 36 | | 1 | % | 92 | 2 | % |
Grand Total(1) | 1,638 | | 39 | % | 2,549 | | 61 | % | 4,187 | 100 | % |
(1)The table above reflects only those employees who have self-reported as male or female and as such does not reconcile to our total of 4,341 full-time employees as of December 31, 2024.
Information about our Executive Officers
Please refer to "Item 10. Directors, Executive Officers and Corporate Governance" below for information relating to our firm's executive officers.
Service Marks
We have registered a number of service marks with the U.S. Patent and Trademark Office and various foreign trademark offices, including the mark “AllianceBernstein.” The logo set forth below is a service mark of AB:
In 2015, we established a new brand identity by prominently incorporating “AB” into our brand architecture, while maintaining the legal names of our corporate entities. With this and other related refinements, our company and each of its subsidiaries, including our Institutional and Retail businesses, are referred to as “AllianceBernstein (AB)” or simply “AB.” Private Wealth Management is referred to as “AB Bernstein.”
Service marks are generally valid and may be renewed indefinitely, as long as they are in use and/or their registrations are properly maintained.
Regulation
Virtually all aspects of our business are subject to various federal and state laws and regulations, rules of various securities regulators and exchanges, and laws in the foreign countries in which our subsidiaries conduct business. These laws and regulations primarily are intended to protect clients and fund shareholders and generally grant supervisory agencies broad administrative powers, including the power to limit or restrict the carrying on of business for failure to comply with such laws and regulations. Possible sanctions that may be imposed on us include the suspension of individual employees, limitations on engaging in business for specific periods, the revocation of the registration as an investment adviser or broker-dealer, censures and fines.
AB, AB Holding, the General Partner and five of our subsidiaries (Sanford C. Bernstein & Co., LLC (“SCB LLC”), AB Broadly Syndicated Loan Manager LLC, AB Custom Alternative Solutions LLC, AB Private Credit Investors LLC, and AB CarVal Investors) are registered with the SEC as investment advisers under the Investment Advisers Act. Additionally, AB Holding is an NYSE-listed company and, accordingly, is subject to applicable regulations promulgated by the NYSE. Also, AB, SCB LLC and AB Custom Alternative Solutions LLC are registered with the Commodity Futures Trading Commission (“CFTC”) as commodity pool operators and commodity trading advisers; SCB LLC also is registered with the CFTC as a commodities introducing broker.
Each U.S. Fund is registered with the SEC under the Investment Company Act and each Non-U.S. Fund is subject to the laws in the jurisdiction in which the fund is registered. For example, our platform of Luxembourg-based funds operates pursuant to Luxembourg laws and regulations, including Undertakings for the Collective Investment in Transferable Securities Directives, and is authorized and supervised by the Commission de Surveillance du Secteur Financier (“CSSF”), the primary regulator in Luxembourg. AllianceBernstein Investor Services, Inc., one of our subsidiaries, is registered with the SEC as a transfer and servicing agent.
SCB LLC and another of our subsidiaries, AllianceBernstein Investments, Inc., are registered with the SEC as broker-dealers, and both are members of the Financial Industry Regulatory Authority.
Many of our subsidiaries are subject to the oversight of regulatory authorities in the jurisdictions outside the United States in which they operate, including the Ontario Securities Commission, the Investment Industry Regulatory Organization of Canada, the European Securities and Markets Authority, the Financial Conduct Authority in the U.K., the CSSF in Luxembourg, the Financial Services Agency in Japan, the Securities & Futures Commission in Hong Kong, the Monetary Authority of Singapore, the Financial Services Commission in South Korea, and the Financial Supervisory Commission in Taiwan. While these regulatory requirements often may be comparable to the requirements of the SEC and other U.S. regulators, they are sometimes more restrictive and may cause us to incur substantial expenditures of time and money related to our compliance efforts. For additional information relating to the regulations that impact our business, please refer to "Risk Factors" in Item 1A.
History and Structure
We have been in the investment research and management business for more than 50 years. Bernstein was founded in 1967. Alliance Capital was founded in 1971 when the investment management department of Donaldson, Lufkin & Jenrette, Inc. (since November 2000, a part of Credit Suisse Group) merged with the investment advisory business of Moody’s Investors Service, Inc.
In April 1988, AB Holding “went public” as a master limited partnership. AB Holding Units, which trade under the ticker symbol “AB,” have been listed on the NYSE since that time.
In October 1999, AB Holding reorganized by transferring its business and assets to AB, a newly-formed operating partnership, in exchange for all of the AB Units (the “Reorganization”). Since the date of the Reorganization, AB has conducted the business formerly conducted by AB Holding and AB Holding’s activities have consisted of owning AB Units and engaging in related activities. Unlike AB Holding Units, AB Units do not trade publicly and are subject to significant restrictions on transfer. The General Partner is the general partner of both AB and AB Holding.
In October 2000, our two legacy firms, Alliance Capital and Bernstein, combined, bringing together Alliance Capital’s expertise in growth equity and corporate fixed income investing and its family of retail mutual funds, with Bernstein’s expertise in value equity investing, tax-exempt fixed income management, and its Private Wealth Management and Bernstein Research Services businesses.
In April 2024, AB and Societe General, a leading European Bank, completed their previously announced transaction to form a jointly owned equity research provider and cash equity trading partner for institutional investors. AB deconsolidated the Bernstein Research Services business and contributed the business to the joint ventures. AB has retained the Bernstein Private Wealth Management business within its existing U.S. broker dealer, Sandford C Bernstein LLC. AB maintains an equity method investment in the joint ventures. For further discussion, see Note 24 Divestitures to AB's consolidated financial statements in Item 8.
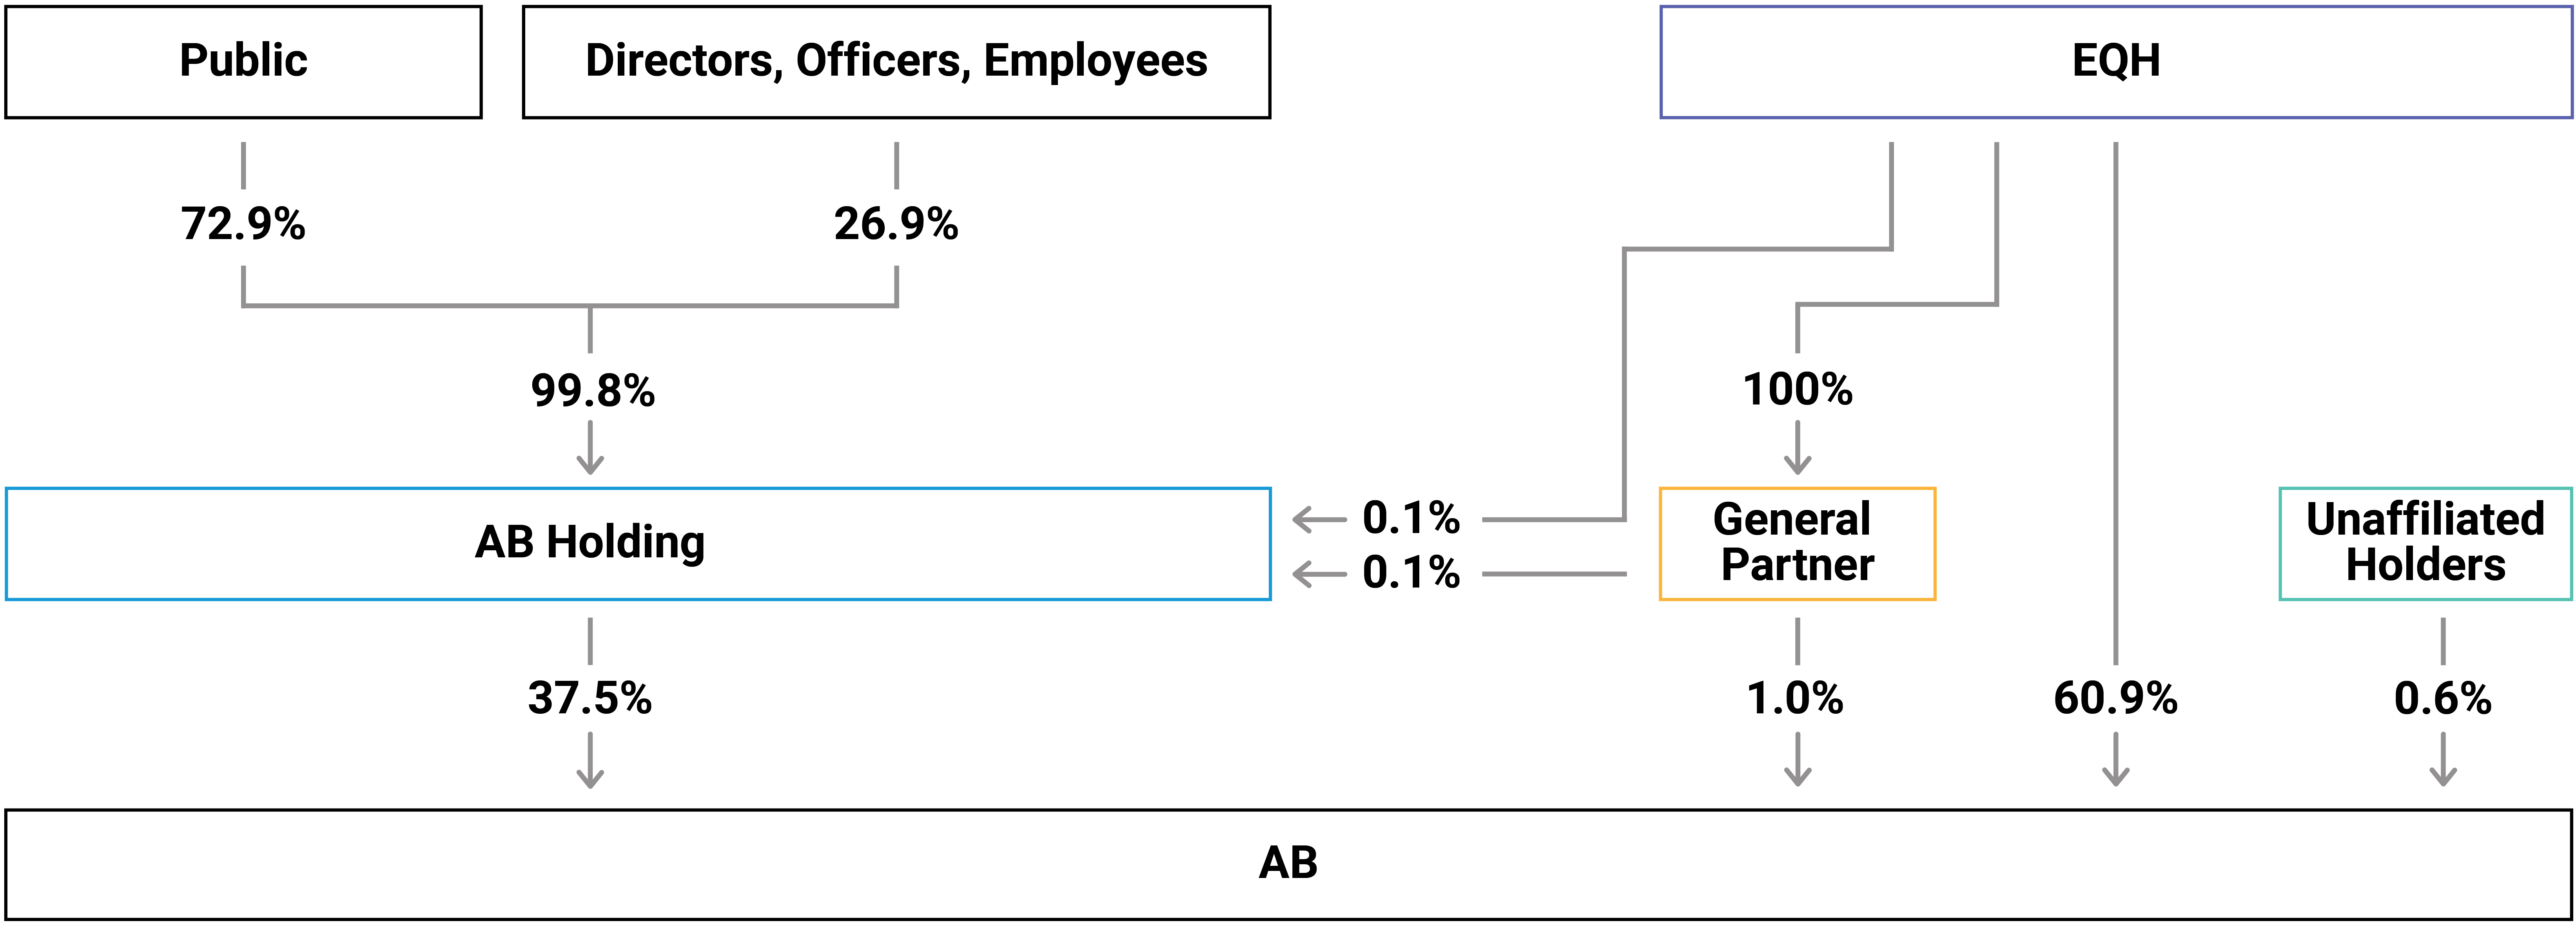
As of December 31, 2024, the condensed ownership structure of AB is as follows (for a more complete description of our ownership structure, see “Principal Security Holders” in Item 12):
The General Partner owns 100,000 general partnership units in AB Holding and a 1.0% general partnership interest in AB. Including these general partnership interests, EQH, directly and through certain of its subsidiaries (see “Principal Security Holders” in Item 12), had an approximate 61.9% interest in AB as of December 31, 2024.
Competition
We compete in all aspects of our business with numerous investment management firms, mutual fund sponsors, brokerage and investment banking firms, insurance companies, banks and other financial institutions that often provide investment products with similar features and objectives as those we offer. Our competitors offer a wide range of financial services to the same customers that we seek to serve. Some of our competitors are larger, have a broader range of product choices and investment capabilities, conduct business in more markets, and have substantially greater resources than we do. These factors may place us at a competitive disadvantage, and we can give no assurance that our strategies and efforts to maintain and enhance our current client relationships, and create new ones, will be successful.
In addition, EQH and its subsidiaries provide financial services, some of which compete with those we offer. The AB Partnership Agreement specifically allows EQH and its subsidiaries (other than the General Partner) to compete with AB and to pursue opportunities that may be available to us. EQH and certain of its subsidiaries have substantially greater financial resources than we do and are not obligated to provide resources to us.
To grow our business, we believe we must be able to compete effectively for AUM. Key competitive factors include:
•our investment performance for clients;
•our commitment to place the interests of our clients first;
•the quality of our research;
•our ability to attract, motivate and retain highly skilled, and often highly specialized, personnel;
•the array of investment products we offer;
•the fees we charge;
•Morningstar/Lipper rankings for the AB Funds;
•our ability to sell our actively-managed investment services despite the fact that many investors favor passive services;
•our operational effectiveness;
•our ability to further develop and market our brand; and
•our global presence.
Competition is an important risk that our business faces and should be considered along with the other factors we discuss in “Risk Factors” in Item 1A.
Available Information
AB and AB Holding file or furnish annual reports on Form 10-K, quarterly reports on Form 10-Q, current reports on Form 8-K, amendments to such reports, and other reports (and amendments thereto) required to comply with federal securities laws, including Section 16 beneficial ownership reports on Forms 3, 4 and 5, registration statements and proxy statements. We maintain an Internet site (http://www.alliancebernstein.com) where the public can view these reports, free of charge, as soon as reasonably practicable after each report is filed with, or furnished to, the Securities and Exchange Commission ("SEC"). In addition, the SEC maintains an Internet site (http://www.sec.gov) that contains reports, proxy and information statements, and other information regarding issuers that file electronically with the SEC.
Item 1A. Risk Factors
Please consider this section along with the description of our business in Item 1, the competition section immediately above and AB’s financial information contained in Items 7 and 8. The majority of the risk factors discussed below directly affect AB. These risk factors also affect AB Holding because AB Holding’s principal source of income and cash flow is attributable to its investment in AB. See also “Cautions Regarding Forward-Looking Statements” in Item 7.
Business-related Risks
Our revenues and results of operations depend on the market value and composition of our AUM, which can fluctuate significantly based on various factors, including many factors outside of our control.
We derive most of our revenues from investment advisory and services fees, typically calculated as a percentage of the value of AUM on a specified date or as an average over a billing period. These fees vary based on the type of service, account size, and total assets managed for a client. Several factors can adversely affect our AUM and composition, including:
•Market Factors: Our AUM remain sensitive to global financial market volatility, such as the inflationary pressures and interest rate increases in 2022 and 2023, followed by interest rate decreases and renewed inflationary concerns in 2024. Continued global economic uncertainty may lead to market volatility, potentially reducing our revenues and net income. Interconnected global economies mean that instability in one region can impact others. Political, social, or economic instability, wars (e.g., Ukraine and the Middle East), terrorism, health crises (e.g., COVID-19), natural disasters, and other unforeseen events can significantly affect financial markets and our AUM, revenues, and net income. Market volatility and reduced margin financing availability can limit liquidity, making it difficult to sell certain securities at their true value. While liquidity was stable in 2024, future deterioration could adversely affect our AUM, revenues, and net income.
•Geographic and Geopolitical Factors: Our clients and our AUM are geographically diverse as approximately 27% of our clients’ domicile is outside the US (primarily Europe, Asia, and the Americas) and approximately 38% of our AUM by Investment Services are non-US. Local or regional events including political, social, or economic instability, wars (e.g., Ukraine and the Middle East), challenges to currently recognized international borders (such as those made by China toward Taiwan), terrorism, health crises (e.g., COVID-19), natural disasters, and other unforeseen events can significantly affect our clients’ demand for our services, local and regional financial markets, and our AUM, revenues, and net income. Specifically, our clients and the investment funds we manage in mainland China, Taiwan, and Hong Kong, as well as any of our investment services with a regional investment focus in this geographic area, may be significantly impacted by a China/Taiwan conflict. The disputed status of Taiwan and the possibility of military conflict with China is a significant geopolitical risk that could materially impact our business in Taiwan.
•Client Preferences: Clients can withdraw their assets at any time with short notice. Shifts in market dynamics and investment trends, such as a move towards less risky investments by defined benefit plan sponsors and a shift to lower-fee passive services, may reduce interest in our investment products. Loss or decrease in AUM reduces our advisory and services fees and revenues.
•Our Investment Performance: Our success in achieving investment returns that match or exceed those of similar asset classes and competing services is crucial for retaining clients and attracting new ones. If our investment performance is poor, either in absolute terms or compared to peers and benchmarks, clients may redeem their assets, and potential clients might choose other investment firms.
•Investing Trends: The fees we charge for our various investment products and services can vary widely. Our overall fee income changes as clients move their assets between accounts or products with different fee structures. For more details on our fee rates, see “Net Revenues” in Item 7).
•Service Changes. We might need to lower our fees, change our fee structures, or adjust the services we offer due to factors like new regulations, advancements in asset management technology (such as algorithmic strategies and new financial technologies), court rulings, and competitive pressures. Lowering our fees would decrease our revenue.
•Interest Rate Changes: Changes in interest rates, especially rapid and significant increases, can negatively impact investor interest in and the value of our fixed income and multi-asset investment portfolios.
A decrease in the value or amount of our AUM, an adverse mix shift in our AUM, or a reduction in our fee levels would negatively impact our investment advisory fees and revenues. Reduced revenues, without a corresponding decrease in expenses, would adversely affect our operating results.
The shift from actively managed investment services to passive services has negatively impacted our investment advisory and services fees, revenues and results of operations, and this trend may continue.
The competitive landscape has become tougher as active managers, who select individual securities, have generally underperformed compared to passive services, which follow market indices. This general underperformance has reduced the flows into actively managed funds, and increased the flows into passive strategies. Achieving organic growth through net inflows remains challenging for active managers like us and requires gaining market share from other active managers.
Our reputation could suffer if we are unable to deliver consistent, competitive investment performance.
Our business relies on the trust and confidence of our clients. Damage to our reputation, such as from poor or inconsistent investment performance, can significantly reduce our AUM and hinder our ability to maintain or grow our business.
EQH and its subsidiaries provide a significant amount of our AUM and fund a significant portion of our new product initiatives, and if our agreements with them terminate or they withdraw capital support it could have a material adverse effect on our business, results of operations and/or financial condition.
EQH, our parent company, and its subsidiaries are our largest client, representing about 17% of our AUM as of December 31, 2024, and contributing approximately 4% of our net revenues. Our investment management agreements with EQH can be terminated at any time or on short notice by either party, and EQH is not obligated to maintain any level of AUM with us. Termination of these agreements by EQH could have a material adverse effect on our business, results of operations, and financial condition.
Our business is dependent on investment advisory agreements with clients, and selling and distribution agreements with various financial intermediaries and consultants, which generally are subject to termination or non-renewal on short notice.
We generate most of our revenue through written investment management agreements with institutional investors, mutual funds, private wealth clients, and selling and distribution agreements with financial intermediaries that distribute AB Funds, including our active ETFs. These agreements, including those with EQH and its subsidiaries, can generally be terminated at any time or with short notice by either party. The investment management agreements for U.S. Funds must be reviewed and approved annually by the Funds’ boards of directors, most of whom are independent. There is no guarantee that these boards will approve the agreements each year or that they won't impose unfavorable terms. Additionally, investors in AB Funds can redeem their investments without notice. Termination or non-renewal of a significant number of these agreements, or a substantial increase in redemption rates, could negatively impact our operations and business prospects.
Similarly, our selling and distribution agreements with securities firms, brokers, banks, and other financial intermediaries can be terminated by either party with notice (usually 30 days) and do not require the intermediaries to sell a specific amount of fund shares. These intermediaries often offer competing investment products. Some institutional investors rely on consultants to choose investment advisers, and our services may not always be recommended by these consultants. This could lead to clients moving their assets to other advisers, resulting in significant net outflows.
Lastly, our Private Wealth Services depend on referrals from financial planners, registered investment advisers, and other professionals. We cannot be certain that we will continue to receive these referrals. Losing access to these referrals could adversely affect our operations and business prospects.
Performance-based fee arrangements with our clients may cause greater fluctuations in our net revenues.
We sometimes charge performance-based fees, which include a base advisory fee plus an additional fee based on investment results, either in absolute terms or relative to a benchmark. Some of these fees have a high-watermark provision, meaning if a client account underperforms, it must recover losses before we can earn future performance-based fees. Failure to meet performance targets means no performance-based fee for that period, and high-watermark provisions can impair future fee earnings.
We earn performance-based fees on 7.4%, 8.0% and 0.3% of the assets we manage for institutional clients, private wealth clients and retail clients, respectively (in total, 4.5% of our AUM). An increase in AUM subject to performance-based fees could lead to greater revenue and earnings volatility. Our performance-based fees were $271.0 million, $144.9 million and $145.2 million in 2024, 2023 and 2022, respectively.
We may be unable to develop new products and services, and the development of new products and services may expose us to reputational harm, additional costs or operational risk.
Our financial performance relies on our ability to quickly adapt to changes in the asset management industry, meet evolving client needs, and develop, market, and manage new investment products and services. Creating new products, including those focused on specific industries, sectors, or criteria like ESG, requires continuous innovation, significant time, resources, and ongoing support.
Introducing new products and services involves substantial risks and uncertainties, such as establishing appropriate operational controls, adapting to shifting client and market preferences, facing competition, and complying with regulatory requirements. We cannot guarantee that we will successfully develop new products and services within the necessary timeframes. Failure to do so, or to manage the associated operational risks effectively, could damage our reputation, increase costs, and negatively impact our AUM, revenues, and operating income.
Fluctuations in the exchange rates between the U.S. dollar and various other currencies can adversely affect our AUM, revenues and results of operations.
Although much of our net revenues, expenses, and AUM are currently denominated in U.S. dollars, we have subsidiaries and clients outside the U.S. with different functional currencies. A weakening of these currencies relative to the U.S. dollar reduces the U.S. dollar value of our revenues and AUM denominated in those currencies. Consequently, fluctuations in U.S. dollar exchange rates impact our AUM, revenues, and reported financial results. Our efforts to hedge against these fluctuations may not be successful, potentially negatively affecting our revenues and financial results.
Our seed capital investments are subject to market risk. While we enter into various futures, forwards, swap and option contracts to economically hedge many of these investments, we also may be exposed to market risk and credit-related losses in the event of non-performance by counterparties to these derivative instruments.
We have a seed investment program to build track records and support marketing for our new products. These investments are subject to market risk. Our risk management team oversees a seed hedging program to minimize this risk, considering practical and cost factors. However, not all seed investments are hedged, exposing us to market risk. Additionally, we may face basis risk, as we cannot always precisely hedge our market exposure, leading to potential relative spreads between market sectors. Consequently, capital market volatility can significantly impact our financial and operating results.
We use various derivative instruments, such as futures, forwards, swaps, and options, in our seed hedging program. While we hedge broad market risks, our hedges are imperfect, leaving some market risk. Furthermore, using derivatives introduces counterparty risk (the risk of credit-related losses if counterparties fail to perform), regulatory risk (e.g., short selling restrictions), and cash/synthetic basis risk (the risk that underlying positions do not move identically to related derivatives).
We may engage in strategic transactions that could pose risks.
As part of our business strategy, we consider strategic transactions (such as our insurance sidecar transaction with Ruby Reinsurance Company), including acquisitions (e.g., CarVal Investors in 2022), dispositions, mergers, consolidations, and joint ventures (e.g., our partnership with SocGen). These transactions may involve significant risks and challenges, including:
•adverse effects on our earnings if acquired intangible assets or goodwill become impaired;
•unknown liabilities or contingencies that arise post-closing;
•exposure to a new regulatory regime;
•potential disputes with counterparties; and
•increased leverage or dilution of existing Unitholders if transactions are funded with AB Units or AB Holding Units.
Acquisitions also pose the risk of losing customers or employees and underperforming relative to expectations. Additionally, losing investment personnel may result in losing expected AUM, adversely affecting our results of operations.
We carry non-controlling interests of joint ventures on our balance sheet that impact our financial performance.
Our business includes non-controlling interests in joint ventures, which pose several risks to our financial condition and results. As a non-controlling partner, we have limited influence over operations and strategic decisions, which may not align with our objectives. Each joint venture's actions could impact its profitability and our share of earnings. Financial difficulties or operational challenges may require us to impair the investment's value in our financial statements. Disputes with partners could lead to costly litigation or dissolution of the joint venture. These factors could reduce our investment returns and negatively impact our financial performance.
We are the guarantor of certain guarantees and credit lines of our consolidated and unconsolidated affiliates, over which we may have limited influence.
As guarantor for certain guarantees and credit lines of our subsidiaries, we face significant financial risks if any subsidiary experiences financial distress or defaults. In such cases, we may need to fulfill these commitments, which could affect our liquidity and financial condition. For unconsolidated affiliates, these risks may be heightened due to lack of control over those entities' operations.
We may not accurately value the securities we hold on behalf of our clients or our company investments.
In accordance with applicable regulatory requirements, contractual obligations or client direction, we have procedures for pricing and valuing securities and other positions in client accounts or company investments. Our Valuation Committee and sub-committees, comprising senior officers and employees, oversee a consistent framework of pricing controls and valuation processes for the firm and its advisory affiliates. If market quotations for a security are unavailable, the Valuation Committee determines its fair value.
Extraordinary market volatility, liquidity constraints, or failure to consider all factors when determining fair value could lead to improper valuation of securities. This could result in inaccurate AUM figures, incorrect net asset values for company-sponsored funds, and inaccurate financial reporting. Although the percentage of our AUM based on limited market observability is not significant, inaccurate valuations can harm clients, create regulatory issues, and damage our reputation.
The quantitative and systematic models we use in certain of our investment services may contain errors, resulting in imprecise risk assessments and unintended output.
We use quantitative and systematic models in many of our investment services, often alongside fundamental research. These models are developed by senior quantitative professionals and implemented by IT professionals. Our Model Risk Oversight Committee, supported by the Model Risk Team, oversees the model governance framework and review activities. However, due to the complexity and data dependency of these models, errors may occur, and our controls might fail to detect them. Undetected errors could lead to client losses and reputational damage.
The financial services industry is intensely competitive.
We compete based on factors such as investment performance, range of services, innovation, reputation, and price. Our global presence means we often face competitors with more experience and established relationships in local markets, potentially hindering our expansion. If we fail to maintain or improve our investment performance, client flows may suffer, making competition more challenging.
Increased competition could reduce the demand for our products and services, adversely affecting on our financial condition, results of operations and business prospects. For more information regarding competitive factors, see “Competition” in Item 1.
People-related Risks
We may be unable to continue to attract, motivate and retain key personnel, and the cost to retain key personnel could put pressure on our adjusted operating margin.
Our business relies on attracting, motivating, and retaining highly skilled technical, investment, managerial, and executive personnel. The market for these professionals is extremely competitive, and their departure could lead to losing client accounts or fewer new business opportunities, adversely affecting our operations and prospects.
A decline in revenues may limit our ability to offer competitive compensation, and maintaining or increasing pay without a revenue increase could negatively impact our operating margin. For additional information regarding our compensation practices, see "Compensation Discussion and Analysis" in Item 11.
Our process of relocating our headquarters may not be executed as we have envisioned.
We have relocated many positions from the New York metropolitan area to our new corporate headquarters in Nashville, Tennessee (see “Relocation Strategy” in Item 7 for more details). While the transition period has been completed, and the associated transition costs and favorable EPU impact have been in line with our estimates, the ongoing long term impact of this move is uncertain and may affect our ability to motivate and retain current employees and hire qualified staff in Nashville.
Employee misconduct, which can be difficult to detect and deter, could harm us by impairing our ability to attract and retain clients and subjecting us to significant regulatory scrutiny, legal liability and reputational harm.
The financial services industry has seen several high-profile cases of employee fraud and misconduct, and we are not immune. Misconduct could involve the improper use or disclosure of confidential information, leading to legal action, regulatory sanctions, and reputational or financial harm. Additionally, fraud, bribery, and other deceptive practices by our employees could result in regulatory scrutiny, legal liability, and reputational damage.
Operational, Technology and Cyber-related Risks
Technology failures and disruptions, including failures to properly safeguard confidential information, can significantly constrain our operations and result in significant time and expense to remediate, which could result in a material adverse effect on our results of operations and business prospects.
We heavily rely on software and related technologies, both proprietary and from third-party vendors, for various business functions such as obtaining securities pricing, processing client transactions, storing data, and providing client reports. Despite our security measures and business continuity plans, we may still face system delays and interruptions due to natural disasters, hardware failures, software defects, power outages, acts of war, cyber attack or third-party failures. These issues could prevent us from performing critical business functions or complying with regulatory requirements, leading to loss of client confidence, reputational damage, disciplinary action, and liability.
Many of our software applications are licensed from third-party vendors who also provide support, upgrades, and maintenance. Suspension or termination of these licenses or services could cause temporary system delays or interruptions. Additionally, rapid technological advancements may allow competitors to implement more advanced platforms, putting us at a competitive disadvantage and negatively impacting our operations and business prospects.
We also risk losses if we fail to protect sensitive and confidential information. We handle and transmit confidential client and employee information and proprietary business data. Despite our protective measures, our systems could be vulnerable to cyber attacks or unauthorized access, including from insiders. Such breaches could expose our proprietary information to competitors, require significant resources to address, harm our reputation, and result in liability under data protection laws, increasing costs or reducing revenues.
Any significant security breach of our information and cyber security infrastructure, as well as our failure to properly escalate and respond to such an incident, may significantly harm our operations and reputation.
Ensuring the continuity and effectiveness of our information and cyber security infrastructure, policies, procedures, and capabilities is crucial to protect our systems and data. Despite our protective measures, including advanced security technology, our systems may still be vulnerable to unauthorized access, supply chain attacks, computer viruses, and other security threats, such as cybercriminal attacks (e.g., phishing and ransomware). These threats could significantly harm our operations, our ability to service our clients and our reputation.
We also take precautions to password-protect and encrypt our laptops and other mobile devices. However, if these devices are stolen, misplaced, or left unattended, they could be hacked or used without authorization, posing a security risk and potentially leading to costly consequences.
Although we have a robust cybersecurity infrastructure and incident preparedness strategy that we test frequently, we may not always respond quickly enough to a cyber incident. Any delay in response could damage our reputation, lead to litigation and regulatory scrutiny, and incur significant remediation costs. For more details see "Cybersecurity" in Item 1C.
Climate change and other unpredictable events, including outbreak of infectious disease, natural disaster, dangerous weather conditions, technology failure, terrorist attack and political unrest, may adversely affect our ability to conduct business.
War, terrorist attacks, political unrest, power failures, climate change, natural disasters, and pandemics (such as COVID-19) could disrupt our operations by:
•decreasing investor confidence and making investment products less attractive;
•causing loss of life;
•triggering technology failures or delays;
•breaching our information and cyber security infrastructure; and
•requiring substantial capital expenditures and operating expenses to remediate damage and restore operations.
Climate change may increase the severity and frequency of disasters, affect our investment portfolio, and influence investor sentiment. It may also lead to regulatory changes impacting the companies in which we invest.
Despite our contingency plans, including system security measures, information backup, and disaster recovery processes, disruptions in infrastructure (electrical, communications, transportation) in key business centers (Nashville, New York City, San Antonio, London, Hong Kong, and India) could adversely affect our operations. If employees cannot access offices or communicate and travel, our business with clients may suffer, and contingency plans may fail.
Unauthorized access, system failures, or data loss could lead to legal proceedings, regulatory penalties, operational disruptions, and reputational damage. Loss of experienced staff or inadequate work facilities could also disrupt operations, affecting our financial condition and business prospects. Our property and business interruption insurance may not cover all potential losses.
Our own operational failures or those of third parties on which we rely, including failures arising out of human error, could disrupt our business, damage our reputation and reduce our revenues.
Weaknesses or failures in our internal processes or systems could disrupt operations, lead to client liability, disciplinary action, or harm our reputation. Our business relies on processing large, complex transactions daily across diverse markets, adhering to client guidelines and regulatory standards.
We must exercise skill, care, and prudence in our services. Despite our highly trained employees, the volume of transactions makes occasional errors likely. If a mistake causes financial harm to a client, we must promptly rectify it. Significant errors can materially affect our reputation, operations, and business prospects.
The individuals and third-party vendors on whom we rely to perform services for us or our clients may be unable or unwilling to honor their contractual obligations to us.
We rely on various counterparties and third-party vendors to enhance our investment, operational, financial, and technological capabilities. However, using third-party vendors does not diminish our responsibility to meet client and regulatory obligations. During market stress, default rates, credit downgrades, and collateral valuation disputes can increase significantly.
Financial market disruptions and economic challenges may cause our counterparties and vendors to face cash flow problems or insolvency, leading to significant costs and impairing our business operations. Weaknesses or failures in a vendor's processes, systems, or business continuity plans can disrupt our operations.
Additionally, vendors may lack the infrastructure to safeguard our confidential data effectively. If we cannot manage the risks associated with third-party relationships, we may face fines, disciplinary action, and reputational damage.
We may not always successfully manage actual and potential conflicts of interest that arise in our business.
We must increasingly manage actual and potential conflicts of interest, including situations where our services to one client may conflict with another's interests. Failure to address these conflicts adequately could harm our reputation, operations, and business prospects. We have procedures and controls to identify and mitigate conflicts, including preventing improper information sharing. However, managing conflicts is complex. If we fail, or appear to fail, in handling conflicts appropriately, our reputation could suffer, and clients may be less willing to engage with us. Additionally, potential or perceived conflicts could lead to litigation or regulatory enforcement actions.
Maintaining adequate liquidity for our general business needs depends on certain factors, including operating cash flows and our access to credit on reasonable terms.
Our financial condition depends on cash flow from operations, which is influenced by capital market performance, our ability to maintain and grow AUM, and other factors beyond our control. Adverse market conditions, profitability, perceived creditworthiness, and changes in government regulations, including tax and interest rates, may limit our ability to issue debt on reasonable terms. Our access to credit also depends on our firm's credit ratings.
In 2024, Moody’s and Standard & Poor's affirmed our long-term and short-term credit ratings with a stable outlook. However, future downgrades could increase borrowing costs and limit capital market access, potentially leading to unanticipated costs or revised strategic plans, adversely affecting our financial condition, operations, and business prospects.
An impairment of goodwill may occur.
Determining goodwill impairment requires significant management judgment. Prolonged depressed securities valuations, deteriorating market conditions, or significant net redemptions can adversely affect our AUM, revenues, profitability, and unit price. Although the AB Holding Unit price is one factor in fair value calculation, significant declines make it harder to conclude that fair value exceeds carrying value.
Economic conditions also impact control premiums, industry earnings multiples, and discount rates, potentially leading to more frequent impairment tests based on negative assumptions and future cash flow projections. This could result in a material charge to our earnings. For more information on our impairment testing, see Item 7.
The insurance that we purchase may not fully cover all potential exposures.
We maintain various types of insurance, including professional liability, errors & omissions, fidelity, cyber, property, casualty, and business interruption. However, this insurance may not cover all business risks and is subject to exclusions, limitations, high deductibles, and maximum limits. Some types of insurance may not always be available on commercially acceptable terms or at all. We cannot guarantee that claims will be covered by our policies, will not exceed our coverage, or that insurers will remain solvent. Future coverage may not be obtainable at current levels, and premiums may increase significantly. Additionally, if our affiliates exclude us from joint insurance arrangements, we may need to secure stand-alone coverage with potentially less favorable terms and higher costs.
Legal and Regulatory-related Risks
Our business is subject to pervasive, complex and continuously evolving global regulation, compliance with which involves substantial expenditures of time and money, and violation of which may result in material adverse consequences.
Our business is subject to federal and state laws, securities regulations, exchange rules, and foreign jurisdiction laws. Violations could result in civil or criminal liability, sanctions, license or registration revocation, fines, or business suspension. Such outcomes could materially affect our financial condition, operations, and business prospects. Even without a finding of wrongdoing, regulatory proceedings could require significant time and money and potentially damage our reputation.
Global regulators have increased oversight of financial services, impacting our business with new and proposed regulations, especially in investment management. Compliance has also become more expensive and time-consuming. For example, regulatory focus on ESG practices remains significant. The SEC continues to scrutinize ESG investment labeling to prevent misleading claims. Privacy regulations such as the General Data Protection Regulation ("GDPR") in Europe have strengthened privacy rules for organizations handling personal data, granting individuals more rights and control over the use of their personal data, and greatly increasing penalties for noncompliance. In many other jurisdictions in which our subsidiaries operate, there is ongoing change to update and strengthen privacy regulations in a manner similar to GDPR, such as the California Consumer Privacy Act and California Privacy Rights Act, and India’s Digital Personal Data Protection Act. The European Commission's (the "EU") action plan and the EU Sustainable Finance Disclosure Regulation also impose increased
restrictions, disclosure obligations, and compliance costs, with potential reputational risks. In Taiwan, the Financial Supervisory Commission implemented limits on local ownership of offshore investment products in 2015. While we have had exemptions, losing them could force local investors to redeem their investments in our funds, significantly reducing our advisory fees and revenues.
Our fund management company (“FMC”) operations in China are subject to a number of regulatory risks, created by an opaque political system evolving regulatory environment and complex data security and data transfer regulations. Foreign governments like China could retaliate against businesses like ours for decisions made by the US government in areas like sanctions and tariffs. China's cybersecurity laws and regulations can be complex and may require companies to store data locally. Restrictions on transfers of certain types of onshore entity business information also may limit our ability to aggregate, report, and monitor such data on our global platform. These factors may increase compliance risk and costs, including the possibility that a breach of local regulation could result in penalties, fines and the revocation of our FMC license.
We are involved in various legal proceedings and regulatory matters and may be involved in such proceedings in the future, any one or combination of which could have a material adverse effect on our reputation, financial condition, results of operations and business prospects.
We are involved in various regulatory inquiries, administrative proceedings, and litigation, some alleging significant damages, with potential for future involvement in additional matters. Litigation carries significant uncertainties, particularly when plaintiffs allege substantial or indeterminate damages, the litigation is in its early stages, or when the litigation is highly complex or broad in scope.
Structure-related Risks
The partnership structure of AB Holding and AB limits Unitholders’ abilities to influence the management and operation of AB’s business and is highly likely to prevent a change in control of AB Holding and AB.
The General Partner has exclusive authority to manage and operate AB Holding and AB, unless otherwise stated in their Amended and Restated Partnership Agreements. AB Holding and AB Unitholders have limited voting rights compared to corporate common stockholders. Unitholders cannot vote for directors of the General Partner and can only vote on certain extraordinary matters, including the removal of the General Partner under specific circumstances. The AB Partnership Agreement also restricts the transfer of AB Units and effectively prevents the removal of the General Partner, making a change in control of AB’s management highly unlikely.
AB Units are illiquid and subject to significant transfer restrictions.
There is no public trading market for AB Units, and we do not expect one to develop. The AB Partnership Agreement restricts participation in a public trading market to avoid classification as a "publicly traded partnership" (“PTP”) under Section 7704 of the Internal Revenue Code (the “Code”), rendering any such transfer void. AB Units also face significant transfer restrictions, requiring written consent from EQH and the General Partner. Transfers that risk AB being treated as a corporation for tax purposes are generally not permitted. EQH and the General Partner have a transfer program that requires sellers to find buyers and imposes annual volume restrictions. You can request a copy of the transfer program from our Corporate Secretary or find it as Exhibit 10.07 in this Form 10-K.
Changes in the treatment of AB Holding and AB as partnerships for tax purposes would have significant tax ramifications.
AB Holding has elected to be taxed as a PTP under Section 7704(g) of the Internal Revenue Code, with a 3.5% federal tax on its gross income from active business. To maintain its PTP status, AB Holding cannot directly or indirectly (through AB) enter into a substantial new line of business. A new line of business is defined as one not closely related to AB’s historical activities, and it becomes substantial if it generates more than 15% of the partnership's gross income or uses more than 15% of its assets (by value).
Additionally, AB Units must not be considered publicly traded to maintain AB’s status as a private partnership for tax purposes. If AB Holding or AB were taxed as a corporation, Unitholders would face double taxation: first at the corporate level, then on dividends received.
Both AB Holding and AB are subject to a 4.0% New York City unincorporated business tax ("UBT"), with AB Holding able to offset UBT credits paid by AB. There are no assurances that AB Holding will remain a PTP or continue to receive the current tax benefits associated with being a PTP.
Changes in tax law governing us or an increase in business activities outside the U.S. could have a material impact on us.
Legislative proposals, if enacted, could materially affect us, but their outcomes are unpredictable. AB management is monitoring potential impacts of new legislation. AB's non-U.S. subsidiaries are subject to local taxes. Increased operations abroad or changes in foreign tax laws or rates could raise AB's effective tax rate.
If any audit by the Internal Revenue Service ("IRS") of our income tax returns for any of our taxable years beginning after December 31, 2017 results in any adjustments, the IRS may collect any resulting taxes, including any applicable penalties and interest, directly from us, in which case our net income and the cash available for quarterly Unitholder distributions may be substantially reduced.
For taxable years beginning after December 31, 2017, a "partnership representative" that we designate (a “Partnership Representative”) has sole authority to act on our behalf in IRS audits and similar state or local audits. Actions taken by the Partnership Representative will be binding on us and our Unitholders.
In an audit of a partnership's taxable years starting after December 31, 2017, the IRS typically adjusts at the partnership level in the year the audit is resolved. We may collect any resulting tax liability (and related interest or penalties) from Unitholders based on their percentage interests, but there is no guarantee we will do so. If we do not collect this tax liability from our Unitholders, our net income and available cash for quarterly distributions could decrease. As a result, current Unitholders may bear some or all of the tax liability, even if they did not own Units during the audited year.
Additionally, we may request adjustments to passive losses from certain audits, which could reduce suspended passive loss carryovers.
We may also make a “push-out” election, which would require our Unitholders to account for audit adjustments on their tax returns. This may require Unitholders to provide certain information to us, including details about beneficial owners. However, we are not required to make this election and may be unable or unwilling to do so. If we do not make the push-out election, we would have to pay any taxes resulting from the adjustments, which would reduce the cash available for distribution to Unitholders.
Non-U.S. unitholders may be subject to withholding tax on the sale of their AB Units or AB Holding Units, as well as on distributions, and we may be liable for any under-withholding.
Gain or loss from the sale or exchange of a partnership unit by a non-U.S. unitholder is treated as effectively connected with a U.S. trade or business and subject to U.S. federal income tax if the non-U.S. unitholder would have had effectively connected gain or loss on a hypothetical sale of the partnership's assets at fair market value. A transferee must withhold 10% of the amount realized on the transfer unless an exception applies.
Distributions by a PTP to a non-U.S. unitholder are also subject to U.S. withholding tax if the PTP has effectively connected gross income, gain, or loss. A transferee is not required to withhold tax if it relies on a certification from the transferor or the partnership that an exception applies. If a transferee fails to withhold when required, AB must withhold on distributions to the transferee to cover the liability.
A broker is not required to withhold on the transfer of a PTP interest or on a PTP distribution if the PTP certifies that the "10% exception" applies. This exception applies if the PTP was not engaged in a U.S. trade or business during a specified period, or if a hypothetical sale of the PTP's assets would result in less than 10% of the total net gain being effectively connected with a U.S. trade or business, or no gain would be effectively connected. To certify this, the PTP must issue a "qualified notice" indicating it qualifies for the exception, which we have done and will continue to do. The notice must state the distribution amounts attributable to each income group specified in the Treasury Regulations, be posted on the PTP's primary public website for 10 years, and be delivered to any registered nominee holder. A broker cannot rely on the certification if it knows it is incorrect or unreliable.
As a PTP, AB Holding may be liable for any under-withholding by a broker relying on a qualified notice if we fail to make a reasonable estimate of the amounts required for the 10% exception.
Item 1B. Unresolved Staff Comments
Neither AB nor AB Holding has unresolved comments from the staff of the SEC to report.
Item 1C. Cybersecurity
Cyber Risk Management and Strategy
Through a combination of security, risk and compliance resources, AB implements information security through a dedicated Information Security Program ("ISP") that is intended to identify, assess and manage material risks from cybersecurity threats and which includes a focus on safeguarding information and assets from cyber threats, engaging in cyber threat monitoring and responding to actual or potential cyber incidents. Our ISP is led by our Chief Information Security Officer ("CISO") who actively partners with our Chief Compliance Officer ("CCO") and Chief Risk Officer "("CRO"). Ultimately, our ISP is part of our full enterprise risk framework, which includes information technology, business continuity and resiliency, in addition to cybersecurity risk. Our ISP is coordinated with our broader risk management team, including our Chief Security Officer. Enterprise risk, including cybersecurity risk, is overseen by the Audit and Risk Committee on behalf of the Board.
Our CISO, with assistance from internal and external resources, is responsible for implementing and providing oversight of our ISP. The ISP employs a defense-in-depth strategy: an information assurance concept in which multiple layers of security controls are distributed throughout an operating environment. The defense-in-depth strategy manages risk with diverse defensive strategies, so that if one layer of defense fails, another layer of defense will attempt to compensate. Our ISP features cybersecurity policies, standards and guidelines, committee governance, training, access controls and data controls. We periodically execute table top exercises as a part of our ISP program.
Our ISP, together with our risk and compliance resources, proactively manage the risk of threat from cybersecurity incidents through (i) implementing protocols to take cybersecurity considerations into account in adopting and onboarding our technology resources, (ii) monitoring IT controls to better ensure compliance with cybersecurity and other related legal and regulatory requirements, (iii) periodically assessing adherence by critical and material third parties we partner with to ensure that the appropriate risk management standards are met, (iv) essential business functions remaining available during a business disruption, and (v) regularly developing and updating response plans to address potential IT or cyber incidents should they occur. We also maintain an operational security function that has a real time response capability that triages potential incidents and triggers, as appropriate, impact mitigation protocols. Additionally, we utilize third parties to conduct periodic cybersecurity assessments to identify, assess, manage, and as appropriate, mitigate and respond to cybersecurity risks, and our internal audit function includes certain cyber risk audits as part of its overall risk audit. Our cybersecurity processes rely predominantly on internal resources, but also include important third party resources for certain matters, including the aforementioned assessments as well as our continuous cybersecurity threat monitoring and initial incident reporting system.
As part of our ISP, we also perform cyber risk assessments on our third party vendors where we deem appropriate based on our risk assessment of such vendors, then periodically thereafter.
As of the date of this report, the Company is not aware of any cybersecurity threats that have materially affected or are reasonably likely to materially affect our business, financial condition or results of operations. However, there can be no assurance that the Company will not be materially affected by such risks. See Item 1A Risk Factors - Operations, Technology and Cyber-Related Risks for a discussion of cybersecurity risks.
Cyber Risk Governance
The Audit and Risk Committee is responsible for assisting the Board with oversight of our enterprise risk framework, including cybersecurity, information security, information technology and business continuity and resiliency. Our CISO and other members of senior management including our General Counsel, CCO and CRO report quarterly to the Audit and Risk Committee at its regular meetings on the status of the Company's cybersecurity risk, risk management policies and risk assessment initiatives. The full Board is updated on an as needed basis. In addition, management updates the Audit and Risk Committee, as appropriate, regarding any material cybersecurity threats or incidents, as well as any incidents with lesser impact potential.
While our Board provides oversight of our cybersecurity risk environment, the ultimate responsibility for our processes for identifying, assessing and managing cybersecurity risks resides with management. Our CISO, with assistance from internal and external resources, is responsible for the implementation and providing oversight to our ISP within the organization and maintaining the appropriate level of expertise to manage and implement cybersecurity policies, programs and strategies. Our CISO has years of applied experience in actively managing cybersecurity and information security programs for large global publicly traded companies with complex and evolving information systems. Management oversight of our ISP is provided by various governance committees including the Operational Risk Oversight Committee, the Information Security Risk Oversight Subcommittee and the Financial Crimes Control Oversight Subcommittee.
Item 2. Properties
Our headquarters is located at 501 Commerce Street, Nashville, Tennessee. We occupy approximately 219,000 square feet of space under a 15-year lease expiring in 2036.
During the second half of 2024, our lease at our other principal location, 1345 Avenue of the Americas, New York, New York expired. At this location, we leased approximately 1,000,000 square feet of space, within which we occupied approximately fifty percent of the space and sublet the other fifty percent. Also, we entered into a 20-year lease agreement in New York, New York, at 66 Hudson Boulevard, for approximately 166,000 square feet that commenced in January 2024 which is now our other principal location in New York.
We also lease approximately 51,000 square feet of space in San Antonio, Texas under a lease expiring in 2029.
Additionally, we lease approximately 100,000 square feet of space in Pune, India. Approximately 48,000 square feet is under a lease expiring in 2032 with the remaining 52,000 square feet under a lease expiring in 2033.
We lease more modest amounts of space in 27 other cities in the United States.
Our subsidiaries lease space in 32 cities outside the United States, the most significant of which is a lease in London, England, expiring in 2031, and in Hong Kong, China, under a lease expiring in 2027. In London we currently lease approximately 68,000 square feet of space of which 28,000 is sublet to our unconsolidated joint venture. In Hong Kong, we currently lease and occupy approximately 36,000 square feet of space.
Item 3. Legal Proceedings
Legal Proceedings
For significant litigation matters, we assess the likelihood of a negative outcome. If a negative outcome is probable and the loss can be reasonably estimated, we record an estimated loss. If a negative outcome is reasonably possible and we can estimate the potential loss or range of loss beyond any amounts already accrued, we disclose this information. However, predicting outcomes or estimating losses is often challenging due to litigation uncertainties, especially in early stages or complex cases. In such instances, we disclose our inability to predict the outcome or estimate losses.
AB may face regulatory inquiries, administrative proceedings, and litigation, some alleging significant damages. While it is possible we could incur losses from these matters, we cannot currently estimate such losses or their range. Management, after consulting with legal counsel, believes that the outcome of any individual or combined matters will not materially affect our operations, financial condition, or liquidity. However, due to inherent uncertainties, future developments could potentially have a material adverse effect on our results, financial condition, or liquidity in future reporting periods.
Item 4. Mine Safety Disclosures
Not applicable.
Item 5. Market for Registrant’s Common Equity, Related Stockholder Matters and Issuer Purchases of Equity Securities
Market for AB Holding Units and AB Units; Cash Distributions
AB Holding Units are listed on the NYSE and trade publicly under the ticker symbol “AB". There is no established public trading market for AB Units, which are subject to significant restrictions on transfer. For information about these transfer restrictions, see “Structure-related Risks” in Item 1A.
AB Holding’s principal source of income and cash flow is attributable to its limited partnership interests in AB.
Each of AB Holding and AB distributes on a quarterly basis all of its Available Cash Flow, as defined in the AB Holding Partnership Agreement and the AB Partnership Agreement, respectively, to its Unitholders and the General Partner. For additional information concerning distribution of Available Cash Flow by AB Holding, see Note 2 to AB Holding’s financial statements in Item 8. For additional information concerning distribution of Available Cash Flow by AB, see Note 2 to AB’s consolidated financial statements in Item 8.
On December 31, 2024 (the last trading day of the year), the closing price of an AB Holding Unit on the NYSE was $37.09 per Unit. On December 31, 2024, there were (i) 822 AB Holding Unitholders of record for approximately 110,000 beneficial owners, and (ii) 362 AB Unitholders of record (we do not believe there are substantial additional beneficial owners).
Recent Sales of Unregistered Securities; Use of Proceeds from Registered Securities
We did not engage in any unregistered sales of our securities during the year ended December 31, 2024, except as previously disclosed in a Current Report on Form 8-K dated December 19, 2024 in connection with the master exchange agreement and purchase agreement entered into with EQH.
We did not engage in any unregistered sales of our equity securities during the year ended December 31, 2023.
We did not engage in any unregistered sales of our securities during the year ended December 31, 2022 except as previously disclosed in a Current Report on Form 8-K dated July 1, 2022 in connection with the acquisition of CarVal Investors L.P.
Purchases of Equity Securities by the Issuer and Affiliated Purchasers
Each quarter, AB considers whether to implement a plan to repurchase AB Holding Units pursuant to Rules 10b5-1 and 10b-18 under the Exchange Act. We did not adopt a plan during the fourth quarter of 2024. AB may adopt additional plans in the future to engage in open-market purchases of AB Holding Units to help fund anticipated obligations under the firm’s incentive compensation award program and for other corporate purposes. For additional information about Rule 10b5-1 plans, see “Units Outstanding” in Item 7.
AB Holding Units bought by us or one of our affiliates during the fourth quarter of 2024 are as follows:
| | |
|
| Issuer Purchases of Equity Securities |
|
| | | | | | | | | | | | | | | | | |
| Period | Total
Number of
AB Holding
Units
Purchased | Average
Price Paid
Per AB
Holding Unit,
net of
Commissions | Total
Number of
AB Holding
Units
Purchased as
Part of
Publicly
Announced
Plans or
Programs | Maximum
Number (or
Approximate
Dollar Value)
of AB
Holding
Units that
May Yet Be
Purchased
Under the
Plans or
Programs |
| 10/1/24-10/31/24 | — | | | $ | — | | — | | — |
| 11/1/24-11/30/24 | — | | | — | | — | | — |
12/1/24-12/31/24(1) | 2,329,963 | | | 36.27 | | — | | — |
| Total | 2,329,963 | | | $ | 36.27 | | — | | — |
(1)During the fourth quarter of 2024, AB retained from employees 2,329,963 AB Holding Units to allow them to fulfill statutory withholding tax requirements at the time of distribution of long-term incentive compensation awards.
AB Units bought by us or one of our affiliates during the fourth quarter of 2024 are as follows:
| | |
|
| Issuer Purchases of Equity Securities |
|
| | | | | | | | | | | | | | | | | |
| Period | Total
Number of
AB
Units
Purchased | Average
Price Paid
Per AB
Unit,
net of
Commissions | Total
Number of
AB Units
Purchased as
Part of
Publicly
Announced
Plans or
Programs | Maximum
Number (or
Approximate
Dollar Value)
of AB
Units that
May Yet Be
Purchased
Under the
Plans or
Programs |
| 10/1/24-10/31/24 | — | | | $ | — | | — | | — |
| 11/1/24-11/30/24 | — | | | — | | — | | — |
12/1/24-12/31/24(1) | 127 | | | 36.03 | | — | | — |
| Total | 127 | | | $ | 36.03 | | — | | — |
(1)During the fourth quarter of 2024, we purchased 127 AB Units in private transactions.
Item 6. [Reserved]
Item 7. Management’s Discussion and Analysis of Financial Condition and Results of Operations
Executive Overview(1)
Our total Assets Under Management ("AUM") as of December 31, 2024 were $792.2 billion, up $67.0 billion, or 9.2%, during 2024. The increase was primarily driven by market appreciation of $68.5 billion, partially offset by net outflows of $2.2 billion (reflecting Institutional net outflows of $16.5 billion, offset by Retail net inflows of $13.4 billion and Private Wealth Management net inflows of $0.9 billion).
Institutional AUM increased $4.3 billion, or 1.3%, to $321.4 billion during 2024, primarily due to market appreciation of $20.7 billion, partially offset by net outflows of $16.5 billion. Gross sales increased $1.2 billion, from $11.8 billion in 2023 to $13.0 billion in 2024. Redemptions and terminations increased $2.3 billion, from $12.6 billion in 2023 to $14.9 billion in 2024.
Retail AUM increased $47.5 billion, or 16.6%, to $334.3 billion during 2024, primarily due to market appreciation of $34.2 billion and net inflows of $13.4 billion. Gross sales increased $28.8 billion, from $71.1 billion in 2023 to $99.9 billion in 2024. Redemptions and terminations increased $13.6 billion, from $58.1 billion in 2023 to $71.7 billion in 2024.
Private Wealth Management AUM increased $15.2 billion, or 12.6%, to $136.5 billion during 2024, primarily due to market appreciation of $13.6 billion and net inflows of $0.9 billion. Gross sales increased $2.2 billion, from $18.6 billion in 2023 to $20.8 billion in 2024. Redemptions and terminations increased $2.4 billion, from $17.5 billion in 2023 to $19.9 billion in 2024.
Bernstein Research Services ("BRS") revenue decreased $289.9 million, or 75.1%, during 2024. The decrease was due to the deconsolidation of the BRS business and contribution of the business to the joint ventures, effective April 1, 2024. For further discussion, see Note 24 Divestitures to our consolidated financial statements in Item 8.
Our 2024 net revenues of $4.5 billion increased $319.8 million, or 7.7%, compared to net revenues of $4.2 billion in the prior year. The increase was primarily due to higher investment advisory base fees of $340.6 million, higher distribution revenues of $140.4 million, higher performance-based fees of $126.1 million and higher other revenues of $41.6 million primarily due certain reimbursements for services provided to the joint ventures, partially offset by lower Bernstein Research Services revenue of $289.9 million due to the deconsolidation of the BRS business, investment losses as compared to gains in the prior year of $27.7 million and lower net dividend and interest income of $11.1 million.
Our operating expenses of $3.4 billion increased $13.4 million, or 0.4%, compared to operating expenses of $3.3 billion in the prior year. The increase was primarily due to higher promotion and servicing expense of $119.7 million, higher employee compensation and benefits expense of $32.6 million and higher general and administrative expenses of $17.6 million, partially offset by higher gain on contingent payment arrangements of $144.7 million and lower interest on borrowings of $10.9 million. The change in contingent payment arrangements was primarily due to the recognition of a gain of $128.5 million related to a fair value remeasurement of the contingent payment liability associated with our acquisition of AB CarVal in 2022.
Our operating income increased $306.4 million, or 37.5%, to $1.1 billion from $817.7 million in 2023 and our operating margin increased to 24.7% in 2024 from 19.1% in 2023.
Market Environment
U.S. Equities
Despite a volatile quarter for U.S. Equities, the S&P 500 ended 2% higher in the fourth quarter of 2024, rounding out a 25% total annual return. Shares were buoyed by expectations that the new federal administration’s policies will lift growth, lower taxes, and ease regulation over the next four years. The Federal Reserve ("Fed") lowered interest rates in both November and December. However, in December the Fed scaled back expectations for rate cuts in 2025, on account of persistent inflation and a robust labor market, triggering a market sell-off particularly in Small Cap (market capitalization between $250 million and $2 billion) with the Russell 2000 giving up earlier gains to end flat in the fourth quarter of 2024. Large Cap growth companies (market capitalization above $10 billion) continued to outperform throughout the quarter and the year. The S&P 500 Growth index returned 36% in 2024 vs. 12% for the S&P 500 Value and 12% for the Russell 2000.
1 Percentage change figures are calculated using assets under management rounded to the nearest million, while financial statement amounts are rounded to the nearest hundred thousand.
Global and Non-U.S. Equities
Eurozone equities declined in the fourth quarter of 2024, with the MSCI European Economic and Monetary Union Index returning negative 1.8% (gross returns, in local-currency terms) amid fears of a recession and political turmoil in France and Germany. The European Central Bank signaled more cuts to come in 2025, as the single currency area wrestles with lackluster growth. The UK MSCI Index was roughly flat in local currency terms and returned negative 7% in USD terms, reflecting rapid GBP depreciation amid a rise in long-term bond yields and growing concerns about the U.K. macro-economic outlook. In Japan, equity markets gained in the fourth quarter with the TOPIX returning 5.4%. The Bank of Japan decided not to raise interest rates at its December policy meeting. MSCI Asia ex-Japan ended negative 7% (USD terms) during the fourth quarter of 2024, reflecting investor concerns around the impact of proposed tariffs, particularly on China. Emerging Markets underperformed Developed Markets in the fourth quarter.
Global Bonds
Fixed income markets experienced considerable volatility in the fourth quarter of 2024, primarily driven by geopolitical tensions, central bank decisions, and fluctuating inflation rates. The Bloomberg Global Aggregate Bond index ended 5.0% lower (USD terms, unhedged) in the fourth quarter of 2024. Major government bonds sold off, driven by persistent inflation, political instability, and budgetary concerns. The 10-year Treasury yield experienced a notable rise, finishing the year at 4.6%, indicating market uncertainty regarding the Fed's future actions amidst rising expectations over potential inflationary policies implemented by the new federal administration. On the credit front, high yield bonds outperformed their investment-grade counterparts during the fourth quarter, driven by expectations of pro-business policies under the new federal administration.
Relationship with EQH and its Subsidiaries
EQH (our parent company) and its subsidiaries are our largest client. EQH is collaborating with AB in order to improve the risk-adjusted yield for the General Accounts of EQH's insurance subsidiaries by investing additional assets at AB, including the utilization of AB's higher-fee, longer-duration alternative offerings. In mid-2021, Equitable Financial Life Insurance Company, a subsidiary of EQH ("Equitable Financial"), agreed to provide an initial $10 billion in permanent capital to build out AB's private illiquid offerings, including private alternatives and private placements. Deployment of the initial $10 billion in permanent capital is now complete. In addition, during the second quarter of 2023, EQH committed to provide an additional $10 billion in permanent capital, deployment of which is approximately 20% complete. We expect this anticipated capital from EQH's insurance subsidiaries will continue to accelerate both organic and inorganic growth in our private alternatives business, allowing us to continue to deliver for our clients, employees, unitholders and other stakeholders. For example, included in the initial $10 billion commitment by EQH is $750 million in capital deployed through AB CarVal.
Permanent capital means investment capital of indefinite duration, for which commitments may be withdrawn under certain conditions. Such conditions primarily include potential regulatory restrictions, lacking sufficient liquidity to fund the capital commitments to AB and AB's inability to identify attractive investment opportunities which align with the investment strategy. Although EQH’s insurance subsidiaries have indicated their intention over time to provide this investment capital to AB, they have no binding commitment to do so. While the withdrawal of their commitment could potentially slow down our introduction of certain products, the impact to our overall operations would not be material.
Joint Venture with Societe Generale
Effective April 1, 2024, AB and Societe Generale ("SocGen") completed their previously announced transaction to form a global joint venture with two joint venture holding companies, one outside of North America and one within North America ("NA JV", and together the "JVs"). AB owns a majority interest in the NA JV while SocGen owns a majority interest in the joint venture outside of North America. AB has deconsolidated the BRS business and retained the Bernstein Private Wealth Management business within its existing U.S. broker dealer Sanford C. Bernstein & Co., LLC. For further discussion, see Note 24 Divestitures to our consolidated financial statements in Item 8.
Relocation Strategy
As previously announced, we have established our corporate headquarters in Nashville, TN, at 501 Commerce Street. Our Nashville headquarters houses Finance, IT, Operations, Legal, Compliance, Internal Audit, Human Capital, and Sales and Marketing and at year-end 2024, we had 1,063 employees in Nashville. We will continue to maintain a principal location in New York City, which houses our Portfolio Management and Trading, and New York-based Private Wealth Management businesses.
We believe relocating our corporate headquarters to Nashville affords us the opportunity to provide an improved quality of life alternative for our employees and enables us to attract and recruit new talented employees to a highly desirable location while improving the long-term cost structure of the firm.
As of December 31, 2024, we have successfully completed the relocation of our corporate headquarters to Nashville, TN.
During the transition period, which began in 2018 and was completed in the fourth quarter of 2024, we incurred $160 million of cumulative transition costs. These costs include employee relocation, severance, recruitment, and overlapping compensation and occupancy costs. Over this same period, we realized total cumulative expense savings of $218 million, resulting in an overall net savings of $58 million for the period.
We incurred $20 million of transition costs for the twelve months ended December 31, 2024, compared to $43 million of expense savings, resulting in an overall net savings of $23 million for the period. In 2024, our net income per unit ("EPU") increased $0.08 as a result of our relocation strategy, which compares to the $0.08 EPU increase that occurred in 2023. We also expect to achieve EPU accretion in each future year. Beginning in 2025, as the transition period has now been completed, we estimate ongoing annual expense savings of approximately $75 million, which will result from a combination of occupancy and compensation-related savings.
During October 2018, we signed a lease, which commenced in the fourth quarter of 2020, relating to 218,976 square feet of space at our new Nashville headquarters. Our estimated total base rent obligation (excluding taxes, operating expenses and utilities) over the 15-year initial lease term is $134 million.
While we have completed the transition period associated with our headquarter relocation to Nashville and our transition costs, expense savings and favorable EPU impact were in line with our estimates, there are several remaining positions to be relocated. We believe that any additional transition costs and expense savings will be immaterial. The actual outcomes may differ due to deviations in one or more of our key assumptions. The remaining transition costs and expense savings, along with their underlying assumptions, are considered Forward-Looking Statements. These statements were subject to various factors discussed in the "Risk Factors" and "Cautions Regarding Forward-Looking Statements" sections of this 2024 10-K.
Assets Under Management
Assets under management by distribution channel are as follows:
| | | | | | | | | | | | | | | | | | | | | | | | | | | | | |
| | As of December 31 | | % Change |
| | 2024 | 2023 | 2022 | | 2024-23 | 2023-22 |
| | (in billions) | | | |
| Institutions | | $ | 321.4 | | | $ | 317.1 | | | $ | 297.3 | | | 1.3 | % | 6.7 | % |
| Retail | | 334.3 | | | 286.8 | | | 242.9 | | | 16.6 | | 18.1 | |
| Private Wealth Management | | 136.5 | | | 121.3 | | | 106.2 | | | 12.6 | | 14.1 | |
| Total | | $ | 792.2 | | | $ | 725.2 | | | $ | 646.4 | | | 9.2 | % | 12.2 | % |
Assets under management by investment service are as follows:
| | | | | | | | | | | | | | | | | | | | | | | | | | | | | |
| | As of December 31 | | % Change |
| | 2024 | 2023 | 2022 | | 2024-23 | 2023-22 |
| | (in billions) | | | |
| Equity | | | | | | | | | |
| Actively Managed | | $ | 263.4 | | | $ | 247.5 | | | $ | 217.9 | | | 6.4 | % | 13.6 | % |
Passively Managed(1) | | 68.3 | | | 62.1 | | | 53.8 | | | 10.1 | | 15.3 | |
| Total Equity | | 331.7 | | | 309.6 | | | 271.7 | | | 7.2 | | 13.9 | |
| Fixed Income | | | | | | | | | |
| Actively Managed | | | | | | | | | |
Taxable(3) | | 209.3 | | | 208.6 | | | 190.3 | | | 0.3 | | 9.6 | |
| Tax–exempt | | 76.2 | | | 61.1 | | | 52.5 | | | 24.7 | | 16.3 | |
| Total | | 285.5 | | | 269.7 | | | 242.8 | | | 5.9 | | 11.1 | |
Passively Managed(1) | | 10.3 | | | 11.4 | | | 9.4 | | | (9.5) | | 21.0 | |
| Total Fixed Income | | 295.8 | | | 281.1 | | | 252.2 | | | 5.2 | | 11.5 | |
Alternatives/Multi-Asset Solutions(2)(3) | | | | | | | | | |
| Actively Managed | | 153.6 | | | 125.9 | | | 115.8 | | | 22.0 | | 8.7 | |
Passively Managed(1) | | 11.1 | | | 8.6 | | | 6.7 | | | 28.0 | | 29.7 | |
| Total Alternatives/Multi-Asset Solutions | | 164.7 | | | 134.5 | | | 122.5 | | | 22.4 | | 9.8 | |
| Total | | $ | 792.2 | | | $ | 725.2 | | | $ | 646.4 | | | 9.2 | % | 12.2 | % |
(1)Includes index and enhanced index services.
(2)Includes certain multi-asset solutions and services not included in equity or fixed income services.
(3)Approximately $12.1 billion of private placements was transferred from Taxable Fixed Income into Alternatives/Multi-Asset during 2024 to better align with standard industry practice for asset class reporting purposes.
Changes in assets under management during 2024 and 2023 are as follows:
| | | | | | | | | | | | | | | | | | | | | | | | | | | |
| | Distribution Channel | |
| | Institutions | Retail | Private
Wealth
Management | Total | |
| | (in billions) | |
| Balance as of December 31, 2023 | | $ | 317.1 | | | $ | 286.8 | | | $ | 121.3 | | | $ | 725.2 | | |
| Long-term flows: | | | | | | | | | |
| Sales/new accounts | | 13.0 | | | 99.9 | | | 20.8 | | | 133.7 | | |
| Redemptions/terminations | | (14.9) | | | (71.7) | | | (19.9) | | | (106.5) | | |
| Cash flow/unreinvested dividends | | (14.6) | | | (14.8) | | | — | | | (29.4) | | |
| Net long-term (outflows) inflows | | (16.5) | | | 13.4 | | | 0.9 | | | (2.2) | | |
Adjustments(1) | | — | | | — | | | 0.7 | | | 0.7 | | |
| | | | | | | | | |
| Transfers | | 0.1 | | | (0.1) | | | — | | | — | | |
| Market appreciation | | 20.7 | | | 34.2 | | | 13.6 | | | 68.5 | | |
| Net change | | 4.3 | | | 47.5 | | | 15.2 | | | 67.0 | | |
| Balance as of December 31, 2024 | | $ | 321.4 | | | $ | 334.3 | | | $ | 136.5 | | | $ | 792.2 | | |
| | | | | | | | | |
| Balance as of December 31, 2022 | | $ | 297.3 | | | $ | 242.9 | | | $ | 106.2 | | | $ | 646.4 | | |
| Long-term flows: | | | | | | | | | |
| Sales/new accounts | | 11.8 | | | 71.1 | | | 18.6 | | | 101.5 | | |
| Redemptions/terminations | | (12.6) | | | (58.1) | | | (17.5) | | | (88.2) | | |
| Cash flow/unreinvested dividends | | (11.0) | | | (9.3) | | | — | | | (20.3) | | |
| Net long-term (outflows) inflows | | (11.8) | | | 3.7 | | | 1.1 | | | (7.0) | | |
| | | | | | | | | |
| | | | | | | | | |
| Transfers | | 0.1 | | | (0.1) | | | — | | | — | | |
| Market appreciation | | 31.5 | | | 40.3 | | | 14.0 | | | 85.8 | | |
| Net change | | 19.8 | | | 43.9 | | | 15.1 | | | 78.8 | | |
| Balance as of December 31, 2023 | | $ | 317.1 | | | $ | 286.8 | | | $ | 121.3 | | | $ | 725.2 | | |
(1)This adjustment is due to a change in fee policy related to certain fixed income assets effective October 1, 2024.
| | | | | | | | | | | | | | | | | | | | | | | | | | | | | | | | | | | | | | | | | | | | |
| | Investment Service |
| | Equity
Actively
Managed | Equity Passively Managed(1) | Fixed
Income
Actively
Managed-
Taxable | Fixed Income
Actively
Managed-Tax-
Exempt | Fixed Income Passively Managed(1) | Alternatives/ Multi-Asset Solutions(2) | Total |
| (in billions) |
| Balance as of December 31, 2023 | | $ | 247.5 | | | $ | 62.1 | | | $ | 208.6 | | | $ | 61.1 | | | $ | 11.4 | | | $ | 134.5 | | | $ | 725.2 | |
| Long-term flows: | | | | | | | | | | | | | | |
| Sales/new accounts | | 49.0 | | | 1.5 | | | 44.4 | | | 24.2 | | | — | | | 14.6 | | | 133.7 | |
| Redemptions/terminations | | (54.3) | | | (0.6) | | | (33.9) | | | (11.1) | | | (0.6) | | | (6.0) | | | (106.5) | |
| Cash flow/unreinvested dividends | | (18.8) | | | (7.5) | | | 0.5 | | | 0.5 | | | (0.4) | | | (3.7) | | | (29.4) | |
| Net long-term (outflows) inflows | | (24.1) | | | (6.6) | | | 11.0 | | | 13.6 | | | (1.0) | | | 4.9 | | | (2.2) | |
Adjustments(3) | | — | | | — | | | 0.2 | | | 0.5 | | | — | | | — | | | 0.7 | |
| | | | | | | | | | | | | | |
Transfers(4) | | — | | | — | | | (12.1) | | | — | | | — | | | 12.1 | | | — | |
| Market appreciation (depreciation) | | 40.0 | | | 12.8 | | | 1.6 | | | 1.0 | | | (0.1) | | | 13.2 | | | 68.5 | |
| Net change | | 15.9 | | | 6.2 | | | 0.7 | | | 15.1 | | | (1.1) | | | 30.2 | | | 67.0 | |
| Balance as of December 31, 2024 | | $ | 263.4 | | | $ | 68.3 | | | $ | 209.3 | | | $ | 76.2 | | | $ | 10.3 | | | $ | 164.7 | | | $ | 792.2 | |
| | | | | | | | | | | | | | |
| Balance as of December 31, 2022 | | $ | 217.9 | | | $ | 53.8 | | | $ | 190.3 | | | $ | 52.5 | | | $ | 9.4 | | | $ | 122.5 | | | $ | 646.4 | |
| Long-term flows: | | | | | | | | | | | | | | |
| Sales/new accounts | | 37.3 | | | 1.3 | | | 36.4 | | | 16.5 | | | 1.7 | | | 8.3 | | | 101.5 | |
| Redemptions/terminations | | (43.8) | | | (0.3) | | | (27.3) | | | (11.1) | | | (0.3) | | | (5.4) | | | (88.2) | |
| Cash flow/unreinvested dividends | | (9.0) | | | (5.0) | | | (2.5) | | | 0.3 | | | 0.1 | | | (4.2) | | | (20.3) | |
| Net long-term (outflows) inflows | | (15.5) | | | (4.0) | | | 6.6 | | | 5.7 | | | 1.5 | | | (1.3) | | | (7.0) | |
| | | | | | | | | | | | | | |
| | | | | | | | | | | | | | |
| Market appreciation | | 45.1 | | | 12.3 | | | 11.7 | | | 2.9 | | | 0.5 | | | 13.3 | | | 85.8 | |
| Net change | | 29.6 | | | 8.3 | | | 18.3 | | | 8.6 | | | 2.0 | | | 12.0 | | | 78.8 | |
| Balance as of December 31, 2023 | | $ | 247.5 | | | $ | 62.1 | | | $ | 208.6 | | | $ | 61.1 | | | $ | 11.4 | | | $ | 134.5 | | | $ | 725.2 | |
(1)Includes index and enhanced index services.
(2)Includes certain multi-asset solutions and services not included in equity or fixed income services.
(3)This adjustment is due to a change in fee policy related to certain fixed income assets effective October 1, 2024.
(4)Approximately $12.1 billion of private placements was transferred from Taxable Fixed Income into Alternatives/Multi-Asset during 2024 to better align with standard industry practice for asset class reporting purposes.
Net long-term (outflows) inflows for actively managed investment services as compared to passively managed investment services during 2024 and 2023 are as follows:
| | | | | | | | | | | | | | |
| Years Ended December 31 |
| 2024 | 2023 |
| (in billions) |
| Actively Managed | | | | |
| Equity | | $ | (24.1) | | | $ | (15.5) | |
| Fixed Income | | 24.6 | | | 12.3 | |
| Alternatives/Multi- Asset Solutions | | 3.8 | | | (2.0) | |
| Total | | 4.3 | | | (5.2) | |
| | | | |
| Passively Managed | | | | |
| Equity | | (6.6) | | | (4.0) | |
| Fixed Income | | (1.0) | | | 1.5 | |
| Alternatives/Multi- Asset Solutions | | 1.1 | | | 0.7 | |
| Total | | (6.5) | | | (1.8) | |
| | | | |
| Total net long-term (outflows) | | $ | (2.2) | | | $ | (7.0) | |
Average assets under management by distribution channel and investment service are as follows:
| | | | | | | | | | | | | | | | | | | | | | | | | | | | | |
| | Years Ended December 31 | | % Change |
| | 2024 | 2023 | 2022 | | 2024-23 | 2023-22 |
| | (in billions) | | | |
| Distribution Channel: | | | | | | | | | |
| Institutions | | $ | 322.9 | | | $ | 304.6 | | | $ | 308.4 | | | 6.0 | % | (1.2 | %) |
| Retail | | 315.3 | | | 262.0 | | | 267.8 | | | 20.4 | | (2.1) | |
| Private Wealth Management | | 130.3 | | | 113.7 | | | 110.3 | | | 14.6 | | 3.0 | |
| Total | | $ | 768.5 | | | $ | 680.3 | | | $ | 686.5 | | | 13.0 | % | (0.9 | %) |
| Investment Service: | | | | | | | | | |
| Equity Actively Managed | | $ | 261.3 | | | $ | 231.5 | | | $ | 239.7 | | | 12.9 | | (3.4) | |
Equity Passively Managed(1) | | 66.0 | | | 57.7 | | | 60.4 | | | 14.3 | | (4.5) | |
| Fixed Income Actively Managed – Taxable | | 211.4 | | | 198.3 | | | 210.0 | | | 6.6 | | (5.6) | |
| Fixed Income Actively Managed – Tax-exempt | | 67.5 | | | 56.0 | | | 54.1 | | | 20.7 | | 3.4 | |
Fixed Income Passively Managed(1) | | 11.0 | | | 9.7 | | | 11.5 | | | 13.4 | | (15.2) | |
Alternatives/Multi-Asset Solutions(2) | | 151.3 | | | 127.1 | | | 110.8 | | | 19.0 | | 14.8 | |
| Total | | $ | 768.5 | | | $ | 680.3 | | | $ | 686.5 | | | 13.0 | % | (0.9 | %) |
(1)Includes index and enhanced index services.
(2)Includes certain multi-asset solutions and services not included in equity or fixed income services.
During 2024, our Institutional channel average AUM of $322.9 billion increased $18.3 billion, or 6.0%, compared to 2023, while ending AUM increased $4.3 billion, or 1.3%, to $321.4 billion from December 31, 2023. The $4.3 billion increase in AUM resulted primarily from market appreciation of $20.7 billion, partially offset by net outflows of $16.5 billion. Market depreciation of $7.6 billion in the fourth quarter of 2024 drove the ending AUM balance down as compared to our average AUM for 2024. During 2023, our Institutional channel average AUM of $304.6 billion decreased $3.8 billion, or 1.2%, compared to 2022, while ending AUM increased $19.8 billion, or 6.7%, to $317.1 billion from December 31, 2022. The $19.8 billion increase in AUM resulted primarily from market appreciation of $31.5 billion (with $22.7 billion of market appreciation occurring in the fourth quarter of 2023), partially offset by net outflows of $11.8 billion.
During 2024, our Retail channel average AUM of $315.3 billion increased $53.3 billion, or 20.4%, compared to 2023, primarily due to this AUM increasing $47.5 billion, or 16.6%, to $334.3 billion from December 31, 2023. The $47.5 billion increase in AUM resulted primarily from market appreciation of $34.2 billion and net inflows of $13.4 billion. During 2023, our Retail channel average AUM of $262.0 billion decreased $5.8 billion, or 2.1%, compared to 2022, while ending AUM increased $43.9 billion, or 18.1%, to $286.8 billion from December 31, 2022. The $43.9 billion increase in AUM resulted primarily from market appreciation of $40.3 billion and net outflows of $3.7 billion.
During 2024, our Private Wealth Management channel average AUM of $130.3 billion increased $16.6 billion, or 14.6%, compared to 2023, primarily due to this AUM increasing $15.2 billion, or 12.6%, to $136.5 billion from December 31, 2023. The $15.2 billion increase in AUM resulted from market appreciation of $13.6 billion, net inflows of $0.9 billion and an adjustment of $0.7 billion. During 2023, our Private Wealth Management channel average AUM of $113.7 billion increased $3.4 billion, or 3.0%, compared to 2022, primarily due to this AUM increasing $15.1 billion, or 14.1%, to $121.3 billion from December 31, 2022. The $15.1 billion increase in AUM resulted from market appreciation of $14.0 billion, and net inflows of $1.1 billion.
Absolute investment composite returns, gross of fees, and relative performance as of December 31, 2024 compared to benchmarks for certain representative Institutional equity and fixed income services are as follows:
| | | | | | | | | | | |
| | 1-Year | 3-Year(1) | 5-Year(1) |
| Income (fixed income) | | | |
| Absolute return | 4.26 | % | 0.22 | % | 1.50 | % |
| Relative return (vs. Bloomberg Barclays U.S. Aggregate Index) | 3.01 | | 2.63 | | 1.83 | |
| High Income (fixed income) | | | |
| Absolute return | 9.27 | | 3.78 | | 3.96 | |
| Relative return (vs. Bloomberg Barclays Global High Yield Index - Hedged) | (1.44) | | (0.05) | | 0.01 | |
| Global Plus - Hedged (fixed income) | | | |
| Absolute return | 2.83 | | (0.71) | | 0.63 | |
| Relative return (vs. Bloomberg Barclays Global Aggregate Index - Hedged) | (0.56) | | (0.16) | | 0.15 | |
| Intermediate Municipal Bonds (fixed income) | | | |
| Absolute return | 2.67 | | 0.92 | | 1.76 | |
| Relative return (vs. Lipper Short/Int. Blended Muni Fund Avg) | 0.49 | | 0.51 | | 0.67 | |
| U.S. Core Plus (fixed income) | | | |
| Absolute return | 2.74 | | (1.84) | | 0.33 | |
| Relative return (vs. Bloomberg Barclays U.S. Aggregate Index) | 1.49 | | 0.57 | | 0.65 | |
| Emerging Market Debt (fixed income) | | | |
| Absolute return | 8.49 | | (0.08) | | 1.12 | |
| Relative return (vs. JPM EMBI Global/JPM EMBI) | 2.76 | | 0.73 | | 0.78 | |
| | | | | | | | | | | |
| | 1-Year | 3-Year(1) | 5-Year(1) |
| Sustainable Global Thematic | | | |
| Absolute return | 7.07 | | (2.70) | | 9.93 | |
| Relative return (vs. MSCI ACWI Index) | (10.42) | | (8.13) | | (0.13) | |
| International Strategic Core Equity | | | |
| Absolute return | 9.82 | | 3.32 | | 5.50 | |
| Relative return (vs. MSCI EAFE Index) | 6.00 | | 1.68 | | 0.78 | |
| U.S. Small & Mid Cap Value | | | |
| Absolute return | 10.81 | | 3.51 | | 9.70 | |
| Relative return (vs. Russell 2500 Value Index) | (0.17) | | (0.30) | | 1.26 | |
| U.S. Large Cap Value | | | |
| Absolute return | 16.41 | | 9.36 | | 11.29 | |
| Relative return (vs. Russell 1000 Value Index) | 2.04 | | 3.73 | | 2.61 | |
| U.S. Small Cap Growth | | | |
| Absolute return | 19.74 | | (4.20) | | 8.62 | |
| Relative return (vs. Russell 2000 Growth Index) | 4.59 | | (4.41) | | 1.76 | |
| U.S. Large Cap Growth | | | |
| Absolute return | 25.90 | | 7.02 | | 16.50 | |
| Relative return (vs. Russell 1000 Growth Index) | (7.46) | | (3.45) | | (2.46) | |
| U.S. Small & Mid Cap Growth | | | |
| Absolute return | 18.39 | | (2.97) | | 9.51 | |
| Relative return (vs. Russell 2500 Growth Index) | 4.49 | | (2.95) | | 1.43 | |
| Concentrated U.S. Growth | | | |
| Absolute return | 11.45 | | 0.69 | | 10.45 | |
| Relative return (vs. S&P 500 Index) | (13.57) | | (8.25) | | (4.07) | |
| Select U.S. Equity | | | |
| Absolute return | 27.05 | | 9.90 | | 15.20 | |
| Relative return (vs. S&P 500 Index) | 2.03 | | 0.96 | | 0.68 | |
| Strategic Equities | | | |
| Absolute return | 23.47 | | 8.06 | | 13.89 | |
| Relative return (vs. Russell 3000 Index) | (0.33) | | 0.05 | | 0.02 | |
| Global Core Equity | | | |
| Absolute return | 11.06 | | 2.63 | | 7.50 | |
| Relative return (vs. MSCI ACWI Index) | (6.43) | | (2.80) | | (2.56) | |
| U.S. Strategic Core Equity | | | |
| Absolute return | 20.84 | | 9.88 | | 12.43 | |
| Relative return (vs. S&P 500 Index) | (4.18) | | 0.94 | | (2.09) | |
| Select U.S. Equity Long/Short | | | |
| Absolute return | 20.30 | | 7.38 | | 10.53 | |
| Relative return (vs. S&P 500 Index) | (4.72) | | (1.56) | | (4.00) | |
| Global Strategic Core Equity | | | |
| Absolute return | 17.69 | | 8.18 | | 10.39 | |
| Relative return (vs. S&P 500 Index) | (0.98) | | 1.84 | | (0.78) | |
(1)Reflects annualized returns.
Consolidated Results of Operations
| | | | | | | | | | | | | | | | | | | | | | | | | | | | | |
| | Years Ended December 31 | | % Change |
| | 2024 | | 2023 | | 2022 | | 2024-23 | 2023-22 |
| | (in thousands, except per unit amounts) | | | |
| Net revenues | | $ | 4,475,139 | | | $ | 4,155,323 | | | $ | 4,054,290 | | | 7.7 | % | 2.5 | % |
| Expenses | | 3,351,066 | | | 3,337,653 | | | 3,239,194 | | | 0.4 | | 3.0 | |
| Operating income | | 1,124,073 | | | 817,670 | | | 815,096 | | | 37.5 | | 0.3 | |
| Non-operating income | | 134,555 | | | — | | | — | | | n/m | n/m |
| Pre-tax income | | 1,258,628 | | | 817,670 | | | 815,096 | | | 53.9 | | 0.3 | |
| Income taxes | | 65,143 | | | 29,051 | | | 39,639 | | | 124.2 | | (26.7) | |
| Net income | | 1,193,485 | | | 788,619 | | | 775,457 | | | 51.3 | | 1.7 | |
| Net income (loss) of consolidated entities attributable to non-controlling interests | | 20,238 | | | 24,009 | | | (56,356) | | | (15.7) | | n/m |
| Net income attributable to AB Unitholders | | $ | 1,173,247 | | | $ | 764,610 | | | $ | 831,813 | | | 53.4 | | (8.1) | |
| Diluted net income per AB Unit | | $ | 4.05 | | | $ | 2.65 | | | $ | 3.01 | | | 52.8 | | (12.0) | |
| Distributions per AB Unit | | $ | 3.60 | | | $ | 3.00 | | | $ | 3.26 | | | 20.0 | | (8.0) | |
Operating margin(1) | | 24.7 | % | | 19.1 | % | | 21.5 | % | | | |
(1)Operating income excluding net income (loss) attributable to non-controlling interests as a percentage of net revenues.
Net income attributable to AB Unitholders for the year ended December 31, 2024 increased $408.6 million from the year ended December 31, 2023. The increase primarily is due to (in millions):
| | | | | |
| Higher base advisory fees | $ | 340.6 | |
| Higher distribution revenues | 140.4 | |
| Higher gain on divestiture | 134.6 | |
Higher gain on contingent payment arrangements (1) | 144.7 | |
| Higher performance-based fees | 126.1 | |
| Higher other revenues | 41.5 | |
| Lower interest expense | 10.9 | |
Lower Bernstein Services Research revenues (2) | (289.9) | |
| Higher promotion and servicing expenses | (119.7) | |
| Higher income tax expense | (36.1) | |
| Higher employee compensation and benefits expense | (32.6) | |
| Higher investment losses | (27.7) | |
| Higher general and administrative expenses | (17.6) | |
| Lower net dividend and interest income | (11.1) | |
| Other | 4.5 | |
| $ | 408.6 | |
(1)During 2024, we recognized a gain of $128.5 million in contingent payment arrangements in the consolidated statements of income related to a fair value remeasurement of the contingent payment liability associated with our acquisition of AB Carval in 2022.
(2)On April 1, 2024, AB and SocGen, a leading European bank, completed their transaction to form a jointly owned equity research provider and cash equity trading partner for institutional investors. AB has deconsolidated the BRS business and contributed the business to the JVs. For further discussion, see Note 24 Divestiture to our consolidated financial statements contained in Item 8.
Net income attributable to AB Unitholders for the year ended December 31, 2023 decreased $67.2 million from the year ended December 31, 2022. The decrease primarily was due to (in millions):
| | | | | |
| Higher employee compensation and benefits | $ | (102.5) | |
| Higher net gains of consolidated entities attributable to non-controlling interest | (80.4) | |
| Higher interest on borrowings | (36.5) | |
| Lower Bernstein Research Services revenue | (30.1) | |
| Lower distribution revenues | (20.9) | |
| Higher amortization of intangible assets | (20.3) | |
| Higher contingent payment arrangements | (16.3) | |
| Higher investment gains | 116.6 | |
| Lower general and administrative expenses | 60.1 | |
| Higher net dividend and interest income | 35.2 | |
| Lower promotion and servicing expenses | 17.1 | |
| Lower income taxes | 10.6 | |
| Other | 0.2 | |
| $ | (67.2) | |
Each quarter, we consider whether to implement a plan to repurchase AB Holding Units pursuant to Rules 10b5-1 and 10b-18 under the Securities Exchange Act of 1934, as amended (“Exchange Act”). A plan of this type allows a company to repurchase its shares at times when it otherwise might be prevented from doing so because of self-imposed trading blackout periods or because it possesses material non-public information. Each broker we select has the authority to repurchase AB Holding Units on our behalf in accordance with the terms and limitations specified in the plan. Repurchases are subject to regulations promulgated by the SEC, as well as certain price, market volume and timing constraints specified in the plan. We did not adopt a plan during the fourth quarter of 2024. We may adopt additional plans in the future to engage in open-market purchases of AB Holding Units to help fund anticipated obligations under our incentive compensation award program and for other corporate purposes.
We are required to distribute all of our Available Cash Flow, as defined in the AB Partnership Agreement, to our Unitholders and the General Partner. Available Cash Flow typically is the adjusted diluted net income per unit for the quarter multiplied by the number of general and limited partnership interests at the end of the quarter. In future periods, management anticipates that Available Cash Flow will continue to be based on adjusted diluted net income per unit, unless management determines, with concurrence of the Board of Directors, that one or more adjustments that are made for adjusted net income should not be made with respect to the Available Cash Flow calculation. See Note 2 to our consolidated financial statements contained in Item 8 for a description of Available Cash Flow.
| | |
|
| Management Operating Metrics |
|
We are providing the non-GAAP measures “adjusted net revenues,” “adjusted operating income” and “adjusted operating margin” because they are additional operating metrics management uses in evaluating and comparing period-to-period operating performance. Management uses these additional metrics in evaluating performance because they present a clearer picture of our operating performance and allow management to see long-term trends without the distortion primarily caused by long-term incentive compensation-related mark-to-market adjustments, acquisition-related expenses, interest expense and other adjustment items. Similarly, we believe that these management operating metrics help investors better understand the underlying trends in our results and, accordingly, provide a valuable perspective for investors.
These non-GAAP measures are provided in addition to, and not as substitutes for, net revenues, operating income and operating margin, and they may not be comparable to non-GAAP measures presented by other companies. Management uses both accounting principles generally accepted in the United States of America ("US GAAP") and non-GAAP measures in evaluating our financial performance. The non-GAAP measures alone may pose limitations because they do not include all of our revenues and expenses.
| | | | | | | | | | | | | | | | | | | | |
| Years Ended December 31 |
| 2024 | 2023 | 2022 |
| (in thousands) |
| Net revenues, US GAAP basis | | $ | 4,475,139 | | | $ | 4,155,323 | | | $ | 4,054,290 | |
| Adjustments: | | | | | | |
| Distribution-related adjustments: | | | | | | |
| Distribution revenues | | (726,670) | | | (586,263) | | | (607,195) | |
| Investment advisory services fees | | (73,737) | | | (60,919) | | | (57,139) | |
| Pass-through adjustments: | | | | | | |
| Investment advisory services fees | | (81,622) | | | (62,538) | | | (65,116) | |
| Other revenues | | (68,939) | | | (34,910) | | | (38,959) | |
| Impact of consolidated company-sponsored funds | | (17,974) | | | (25,123) | | | 57,436 | |
| Incentive compensation-related items | | (14,410) | | | (13,621) | | | (7,083) | |
| | | | | | |
| Equity loss on JV | | 36,611 | | | — | | | — | |
| Adjusted net revenues | | $ | 3,528,398 | | | $ | 3,371,949 | | | $ | 3,336,234 | |
| Operating income, US GAAP basis | | $ | 1,124,073 | | | $ | 817,670 | | | $ | 815,096 | |
| Adjustments: | | | | | | |
| Real estate | | (825) | | | (825) | | | (825) | |
| Incentive compensation-related items | | 2,391 | | | 5,192 | | | 3,461 | |
| Retirement plan settlement loss | | 13,130 | | | — | | | — | |
| EQH award compensation | | 1,088 | | | 727 | | | 606 | |
| | | | | | |
| Acquisition-related expenses | | (59,595) | | | 98,070 | | | 72,503 | |
| | | | | | |
| | | | | | |
| Equity loss on JV | | 36,611 | | | — | | | — | |
| Sub-total of non-GAAP adjustments before interest on borrowings | | (7,200) | | | 103,164 | | | 75,745 | |
| Interest on borrowings | | 43,509 | | | 54,394 | | | 17,906 | |
| Subtotal of non-GAAP adjustments | | 36,309 | | | 157,558 | | | 93,651 | |
| Less: Net income (loss) of consolidated entities attributable to non-controlling interests | | 20,238 | | | 24,009 | | | (56,356) | |
| Adjusted operating income | | $ | 1,140,144 | | | $ | 951,219 | | | $ | 965,103 | |
| Non-operating income, US GAAP basis | | $ | 134,555 | | | $ | — | | | $ | — | |
| Less: Interest on borrowings | | 43,509 | | | 54,394 | | | 17,906 | |
| Less: Gain on divestiture | | 134,555 | | | — | | | — | |
| Adjusted non-operating (expense) | | $ | (43,509) | | | $ | (54,394) | | | $ | (17,906) | |
| Adjusted pre-tax income | | 1,096,635 | | | 896,825 | | | 947,197 | |
| Less: Adjusted income taxes | | 56,806 | | | 31,837 | | | 46,034 | |
| Adjusted net income | | $ | 1,039,829 | | | $ | 864,988 | | | $ | 901,163 | |
| Diluted net income per AB Unit, GAAP basis | | $ | 4.05 | | | $ | 2.65 | | | $ | 3.01 | |
| Impact of non-GAAP adjustments | | (0.46) | | | 0.35 | | | 0.25 | |
| Adjusted diluted net income per AB Unit | | $ | 3.59 | | | $ | 3.00 | | | $ | 3.26 | |
| Operating margin, GAAP basis | | 24.7 | % | | 19.1 | % | | 21.5 | % |
| Impact of non-GAAP adjustments | | 7.6 | | | 9.1 | | | 7.4 | |
| Adjusted operating margin | | 32.3 | % | | 28.2 | % | | 28.9 | % |
Adjusted operating income for the year ended December 31, 2024 increased $188.9 million, or 19.9%, from the year ended December 31, 2023, primarily due to higher investment advisory base fees of $332.6 million, higher performance-based fees of $101.3 million, lower general and administrative expenses of $37.9 million, lower promotion and servicing expenses of $32.5 million, higher investment gains of $10.7 million and higher other revenues of $8.1 million, partially offset by lower Bernstein Research Services revenue of $289.9 million due to the deconsolidation of the BRS business, higher employee compensation and benefits expense of $37.7 million and lower net dividends and interest income of $6.2 million.
Adjusted operating income for the year ended December 31, 2023 decreased $13.9 million, or 1.4%, from the year ended December 31, 2022, primarily due to higher employee compensation and benefits expense of $39.3 million, lower Bernstein Research Services revenue of $30.1 million, lower investment advisory base fees of $25.1 million and higher general and administrative expenses of $6.2 million, partially offset by higher net dividend and interest income of $51.6 million and higher performance-based fees of $35.5 million.
Adjusted Net Revenues
Net Revenue, as adjusted, is reduced to exclude all of the company's distribution revenues, which are recorded as a separate line item on the consolidated statement of income, as well as a portion of investment advisory services fees received that is used to pay distribution and servicing costs. For certain products, based on the distinct arrangements, certain distribution fees are collected by us and passed through to third-party client intermediaries, while for certain other products, we collect investment advisory services fees and a portion is passed through to third-party client intermediaries. In both arrangements, the third-party client intermediary owns the relationship with the client and is responsible for performing services and distributing the product to the client on our behalf. We believe offsetting distribution revenues and certain investment advisory services fees is useful for our investors and other users of our financial statements because such presentation appropriately reflects the nature of these costs as pass-through payments to third parties that perform functions on behalf of our sponsored mutual funds and/or shareholders of these funds. Distribution-related adjustments fluctuate each period based on the type of investment products sold, as well as the average AUM over the period. Also, we adjust distribution revenues for the amortization of deferred sales commissions as these costs, over time, will offset such revenues.
We adjust investment advisory and services fees and other revenues for pass through costs, primarily related to our transfer agent and shareholder servicing fees. Also, we adjust for certain performance-based fees passed through to our investment advisors. These fees do not affect operating income, as such, we exclude these fees from adjusted net revenues. We also adjust for certain pass through costs associated with the transition of services to the JVs entered into with SocGen. These amounts are expensed by us and passed to the JVs for reimbursement. These fees do not affect operating income, as such, we exclude these fees from adjusted net revenues.
We adjust for the revenue impact of consolidating company-sponsored investment funds by eliminating the consolidated company-sponsored investment funds' revenues and including AB's fees from such consolidated company-sponsored investment funds and AB's investment gains and losses on its investments in such consolidated company-sponsored investment funds that were eliminated in consolidation.
We also adjust net revenues to exclude our portion of the equity income or loss associated with our investment in the JVs. Effective April 1, 2024 following the close of the transaction with SocGen, we record all income or loss associated with the JVs as an equity method investment income (loss). As we no longer consider this activity part of our core business operations and our intent is to fully divest from both joint ventures, we consider these amounts temporary, and as such, we exclude these amounts from our adjusted net revenues.
Adjusted net revenues exclude investment gains and losses and dividends and interest on employee long-term incentive compensation-related investments. Also, we adjust for certain acquisition-related pass-through performance-based fees and performance related compensation.
Adjusted Operating Income
Adjusted operating income represents operating income on a US GAAP basis excluding (1) real estate charges (credits), (2) the impact on net revenues and compensation expense of the investment gains and losses (as well as the dividends and interest) associated with employee long-term incentive compensation-related investments, (3) retirement plan settlement loss, (4) the equity compensation paid by EQH to certain AB executives, (5) acquisition-related expenses, (6) equity (income) loss on JVs, (7) interest on borrowings and (8) the impact of consolidated company-sponsored investment funds.
Real estate charges (credits) incurred during the fourth quarter of 2019 through the fourth quarter of 2020, while excluded in the period in which the charges (credits) were recorded, are included ratably over the remaining applicable lease term.
Prior to 2009, a significant portion of employee compensation was in the form of long-term incentive compensation awards that were notionally invested in AB investment services and generally vested over a period of four years. AB economically hedged the exposure to market movements by purchasing and holding these investments on its balance sheet. All such
investments had vested as of year-end 2012 and the investments have been delivered to the participants, except for those investments with respect to which the participant elected a long-term deferral. Fluctuation in the value of these investments, which also impacts compensation expense, is recorded within investment gains and losses on the income statement. Management believes it is useful to reflect the offset achieved from economically hedging the market exposure of these investments in the calculation of adjusted operating income and adjusted operating margin. The non-GAAP measures exclude gains and losses and dividends and interest on employee long-term incentive compensation-related investments included in revenues and compensation expense.
The losses associated with the termination of our defined benefit retirement plan are non-cash, short term in nature and not considered a part of our core operating results when comparing financial results from period to period.
The board of directors of EQH granted to Seth Bernstein, our CEO, equity awards in connection with EQH's IPO. Additionally, equity awards were granted to Mr. Bernstein and other AB executives for their membership on the EQH Management Committee. These individuals may receive additional equity or cash compensation from EQH in the future related to their service on the Management Committee. Any awards granted to these individuals by EQH are recorded as compensation expense in AB’s consolidated statement of income. The compensation expense associated with these awards has been excluded from our non-GAAP measures because they are non-cash and are based upon EQH's, and not AB's, financial performance.
Acquisition-related expenses have been excluded because they are not considered part of our core operating results when comparing financial results from period to period and to industry peers. Acquisition-related expenses include professional fees, the recording of changes in estimates or fair value remeasurements to, and accretion expense related to, our contingent payment arrangements associated with our acquisitions, certain compensation-related expenses and amortization of intangible assets for contracts acquired. During 2024, we recognized a gain of $128.5 million in contingent payment arrangements in the consolidated statement of income related to a fair value remeasurement of the contingent payment liability associated with our acquisition of AB Carval in 2022. The fair value remeasurement was due to updated assumptions of future performance associated with the liability. We also recorded an impairment of $2.5 million of the contingent consideration payable associated with a small acquisition made in 2020 due to the loss of investment management contracts. In addition, we recorded an intangible asset impairment charge of $4.4 million million associated with various historical acquisitions. During 2023, we recorded an expense of $28.4 million due to a change in estimate related to the contingent consideration associated with the acquisition of Autonomous LLC in 2019. The change in estimate was based upon better than expected revenues during the 2023 performance evaluation period. We recorded $14.1 million as contingent payment arrangement expense and $14.3 million as compensation and benefits expense in the consolidated statement of income. The charges to compensation and benefits expense are due to certain service conditions and special awards included in the acquisition agreement. During 2022, acquisition related expenses included an intangible asset impairment charge of $5.6 million related to various historical acquisitions.
We also adjust operating income to exclude our portion of the equity income or loss associated with our investment in the JVs. Effective April 1, 2024 following the close of the transaction with SocGen, we record all income or loss associated with the JVs as an equity method investment (income) loss. As we no longer consider this activity part of our core business operations and our intent is to fully divest from both joint ventures, we consider these amounts temporary, and as such, we exclude these amounts from our adjusted operating income.
We adjust operating income to exclude interest on borrowings in order to align with our industry peer group.
Adjusted Net Income and Adjusted Diluted Net Income per AB Unit
As previously discussed, our quarterly distribution is typically our adjusted diluted net income per unit (which is derived from adjusted net income) for the quarter multiplied by the number of general and limited partnership interests outstanding at the end of the quarter. Adjusted net income is derived from adjusted operating income less interest expense, gain on divestiture and adjusted income taxes. The gain on divestiture is not considered part of our core operating results and, accordingly has been excluded from our adjusted net income. Adjusted income taxes, used in calculating adjusted net income, are calculated using the GAAP effective tax rate adjusted for non-GAAP income tax adjustments.
Adjusted Operating Margin
Adjusted operating margin allows us to monitor our financial performance and efficiency from period to period without the volatility noted above in our discussion of adjusted operating income and to compare our performance to industry peers on a basis that better reflects our performance in our core business. Adjusted operating margin is derived by dividing adjusted operating income by adjusted net revenues.
Net Revenues
The components of net revenues are as follows:
| | | | | | | | | | | | | | | | | | | | | | | | | | | | | |
| | Years Ended December 31 | | % Change |
| | 2024 | 2023 | 2022 | | 2024-23 | 2023-22 |
| | (in thousands) | | | |
| Investment advisory and services fees: | | | | | | | | | |
| Institutions: | | | | | | | | | |
| Base fees | | $ | 619,215 | | | $ | 612,341 | | | $ | 581,987 | | | 1.1 | % | 5.2 | % |
| Performance-based fees | | 81,011 | | | 53,702 | | | 77,299 | | | 50.9 | | (30.5) | |
| | | 700,226 | | | 666,043 | | | 659,286 | | | 5.1 | | 1.0 | |
| Retail: | | | | | | | | | |
| Base fees | | 1,504,354 | | | 1,275,914 | | | 1,321,645 | | | 17.9 | | (3.5) | |
| Performance-based fees | | 17,825 | | | 197 | | | 1,564 | | | n/m | (87.4) | |
| | | 1,522,179 | | | 1,276,111 | | | 1,323,209 | | | 19.3 | | (3.6) | |
| Private Wealth Management: | | | | | | | | | |
| Base fees | | 1,047,606 | | | 942,302 | | | 922,159 | | | 11.2 | | 2.2 | |
| Performance-based fees | | 172,128 | | | 91,012 | | | 66,384 | | | 89.1 | | 37.1 | |
| | | 1,219,734 | | | 1,033,314 | | | 988,543 | | | 18.0 | | 4.5 | |
| Total: | | | | | | | | | |
| Base fees | | 3,171,175 | | | 2,830,557 | | | 2,825,791 | | | 12.0 | | 0.2 | |
| Performance-based fees | | 270,964 | | | 144,911 | | | 145,247 | | | 87.0 | | (0.2) | |
| | | 3,442,139 | | | 2,975,468 | | | 2,971,038 | | | 15.7 | | 0.1 | |
Bernstein Research Services(1) | | 96,222 | | | 386,142 | | | 416,273 | | | (75.1) | | (7.2) | |
| Distribution revenues | | 726,670 | | | 586,263 | | | 607,195 | | | 23.9 | | (3.4) | |
| Dividend and interest income | | 165,313 | | | 199,443 | | | 123,091 | | | (17.1) | | 62.0 | |
| Investment (losses) gains | | (13,486) | | | 14,206 | | | (102,413) | | | n/m | n/m |
| Other revenues | | 142,794 | | | 101,342 | | | 105,544 | | | 40.9 | | (4.0) | |
| Total revenues | | 4,559,652 | | | 4,262,864 | | | 4,120,728 | | | 7.0 | | 3.4 | |
| Less: broker-dealer related interest expense | | 84,513 | | | 107,541 | | | 66,438 | | | (21.4) | | 61.9 | |
| Net revenues | | $ | 4,475,139 | | | $ | 4,155,323 | | | $ | 4,054,290 | | | 7.7 | % | 2.5 | % |
| | | | | | | | | |
| | | | | | | | | |
| | | | | | | | | |
| | | | | | | | | |
| | | | | | | | | |
(1)On April 1, 2024, AB and SocGen, a leading European bank, completed their transaction to form a jointly owned equity research provider and cash equity trading partner for institutional investors. AB has deconsolidated the BRS business and contributed the business to the JVs. For further discussion, see Note 24 Divestiture to our consolidated financial statements contained in Item 8.
Investment Advisory and Services Fees
Investment advisory and services fees are the largest component of our revenues. These fees generally are calculated as a percentage of the value of AUM as of a specified date, or as a percentage of the value of average AUM for the applicable billing period, and vary with the type of investment service, the size of account and the total amount of assets we manage for a particular client. Accordingly, fee income generally increases or decreases as AUM increase or decrease and is affected by market appreciation or depreciation, the addition of new client accounts or client contributions of additional assets to existing accounts, withdrawals of assets from and termination of client accounts, purchases and redemptions of mutual fund shares, shifts of assets between accounts or products with different fee structures, and acquisitions. Our average basis points realized (investment advisory and services fees divided by average AUM) generally approximate 30 to 105 basis points for actively managed equity services, 10 to 65 basis points for actively managed fixed income services and 1 to 50 basis points for passively managed services. Average basis points realized for other services could range from 3 basis points for certain Institutional third party managed services to 190 basis points for certain Private Wealth Management alternative services. These ranges include all-inclusive fee arrangements (covering investment management, trade execution and other services) for our Private Wealth Management clients.
We calculate AUM using established market-based valuation methods and fair valuation (non-observable market) methods. Market-based valuation methods include: last sale/settle prices from an exchange for actively-traded listed equities, options and futures; evaluated bid prices from recognized pricing vendors for fixed income, asset-backed or mortgage-backed issues; mid prices from recognized pricing vendors and brokers for credit default swaps; and quoted bids or spreads from pricing vendors and brokers for other derivative products. Fair valuation methods include: discounted cash flow models or any other methodology that is validated and approved by our Valuation Committee and sub-committee (the "Valuation Committee") (see paragraph immediately below for more information regarding our Valuation Committee). Fair valuation methods are used only where AUM cannot be valued using market-based valuation methods, such as in the case of private equity or illiquid securities.
The Valuation Committee, consists of senior officers and employees, which oversees a consistent framework of pricing and valuation of all investments held in client and AB portfolios. The Valuation Committee has adopted a Statement of Pricing Policies describing principles and policies that apply to pricing and valuing investments held in these portfolios. We also have a Pricing Group, which is overseen by the Valuation Committee and is responsible for managing the pricing process for all investments.
We sometimes charge our clients performance-based fees. In these situations, we charge a base advisory fee and are eligible to earn an additional performance-based fee or incentive allocation that is calculated as either a percentage of absolute investment results or a percentage of investment results in excess of a stated benchmark over a specified period of time. Some performance-based fees include a high-watermark provision, which generally provides that if a client account underperforms relative to its performance target (whether absolute or relative to a specified benchmark), it must gain back such underperformance before we can collect future performance-based fees. Therefore, if we fail to achieve our performance target for a particular period, we will not earn a performance-based fee for that period and, for accounts with a high-watermark provision, our ability to earn future performance-based fees will be impaired. We are eligible to earn performance-based fees on 7.4%, 8.0% and 0.3% of the assets we manage for institutional clients, private wealth clients and retail clients, respectively (in total, 4.5% of our AUM).
Our investment advisory and services fees increased by $466.7 million, or 15.7%, in 2024, due to a $340.6 million, or 12.0%, increase in base fees and a $126.1 million increase in performance-based fees. The increase in base fees is primarily due to a 13.0% increase in average AUM. Our investment advisory and services fees increased by $4.4 million, or 0.1%, in 2023, due to a $4.8 million, or 0.2%, increase in base fees, offset by a $0.3 million decrease in performance-based fees. The increase in base fees was primarily due to slight shift in product mix to alternatives, which generally earn higher fees, partially offset by a 0.9% decrease in average AUM.
Performance-based fees increased $126.1 million, or 87.0%, in 2024, primarily due to higher performance-based fees earned on Financial Services Opportunities fund, Global Opportunistic Credit fund, Global Multi-Strategy fund and US Select Equity Long/Short fund, partially offset by lower performance-based fees earned on International Small Cap fund. Performance-based fees decreased $0.3 million, or 0.2%, in 2023, primarily due to lower performance-based fees earned on U.S. Real Estate fund and Emerging Markets Opportunistic Credit fund, partially offset by higher performance-based fees earned on Private Credit fund, Global Opportunistic Credit fund, Global Multi-Strategy fund and Securitized Assets fund.
Institutional base fees increased $6.9 million, or 1.1%, in 2024, primarily due to a a 6.0% increase in average AUM, partially offset by a lower portfolio fee rate. Retail base fees increased $228.4 million, or 17.9%, in 2024, primarily due to a 20.4% increase in average AUM, partially offset by a lower portfolio fee rate. Private Wealth base fees increased $105.3 million, or 11.2%, in 2024, primarily due to a 14.6% increase in average AUM, partially offset by a lower portfolio fee rate. Institutional base fees increased $30.4 million, or 5.2%, in 2023, primarily due to a higher portfolio fee rate, partially offset by a 1.2% decrease in average AUM. Retail base fees decreased $45.7 million, or 3.5%, in 2023, primarily due to a 2.1% decrease in average AUM. Private Wealth base fees increased $20.1 million, or 2.2%, in 2023, primarily due to a 3.0% increase in average AUM.
Bernstein Research Services
Effective April 1, 2024, AB deconsolidated the BRS business. For further discussion, see Note 24 Divestitures to our consolidated financial statements in Item 8.
Prior to the deconsolidation of the BRS business, we earned revenues for providing investment research to, and executing brokerage transactions for, institutional clients. These clients compensated us principally by directing us to execute brokerage transactions on their behalf, for which we earned commissions, and to a lesser extent, by paying us directly for research through commission sharing agreements or cash payments.
Revenues from Bernstein Research Services decreased $289.9 million, or 75.1%, in 2024. The decrease was driven by the deconsolidation of the BRS business.
Revenues from Bernstein Research Services decreased $30.1 million, or 7.2%, in 2023. The decrease was primarily driven by significantly lower global customer trading activity due to the prevailing macro-economic environment.
Distribution Revenues
Two of our subsidiaries act as distributors and/or placement agents of company-sponsored mutual funds and receive distribution services fees from certain of those funds as full or partial reimbursement of the distribution expenses they incur. Period-over-period fluctuations of distribution revenues typically are in line with fluctuations of the corresponding average AUM of these mutual funds.
Distribution revenues increased $140.4 million, or 23.9%, in 2024, primarily due to a 20.0% increase in the corresponding average AUM of these mutual funds. Distribution revenues decreased $20.9 million, or 3.4%, in 2023, primarily due to a shift in product mix from mutual funds with higher distribution rates to mutual funds with lower distribution rates, as well as a 1.4% decrease in the corresponding average AUM of these mutual funds.
Dividend and Interest Income and Broker-Dealer Related Interest Expense
Dividend and interest income consists primarily of investment income and interest earned on customer margin balances and U.S. Treasury Bills as well as dividend and interest income in our consolidated company-sponsored investment funds. Broker-dealer related interest expense principally reflects interest accrued on cash balances in customers’ brokerage accounts.
Dividend and interest income decreased $34.1 million, or 17.1%, in 2024, primarily due to lower interest earned on U.S. Treasury Bills and customer margin balances. Broker-dealer related interest expense decreased $23.0 million, or 21.4%, in 2024, primarily due to lower interest paid on cash balances in customers' brokerage accounts.
Dividend and interest income increased $76.4 million, or 62.0%, in 2023, primarily due to higher interest earned on customer margin balances and higher interest earned on U.S. Treasury Bills. Broker-dealer related interest expense increased $41.1 million, or 61.9%, in 2023, primarily due to higher interest paid on cash balances in customers' brokerage accounts.
Investment (Losses) Gains
Investment (losses) gains consist primarily of realized and unrealized investment gains or losses on: (i) employee long-term incentive compensation-related investments, (ii) U.S. Treasury Bills, (iii) market-making in exchange-traded options and equities, (iv) seed capital investments, (v) derivatives and (vi) investments in our consolidated company-sponsored investment funds. Investment gains (losses) also include equity in earnings of proprietary investments in limited partnership hedge funds that we sponsor and manage and equity gains (losses) related to our equity investments in JVs.
Investment (losses) gains are as follows:
| | | | | | | | | | | | | | | | | | | | |
| | Years Ended December 31 |
| | 2024 | 2023 | 2022 |
| | (in thousands) |
| Long-term incentive compensation-related investments: | | | | | | |
| Realized gains | | $ | 7,194 | | | $ | 6,573 | | | $ | 1,345 | |
| Unrealized (losses) | | (3,915) | | | (1,707) | | | (10,626) | |
| | | | | | |
| | | | | | |
| | | | | | |
| | | | | | |
| | | | | | |
| | | | | | |
| | | | | | |
| | | | | | |
| | | | | | |
| Investments held by consolidated company-sponsored investment funds: | | | | | | |
| Realized (losses) | | (855) | | | (32,125) | | | (46,293) | |
| Unrealized gains (losses) | | 15,898 | | | 48,350 | | | (73,194) | |
| | | | | | |
| Seed capital investments: | | | | | | |
| Realized gains (losses) | | | | | | |
| Seed capital and other | | 2,322 | | | (34) | | | 17,272 | |
| Derivatives | | (20,542) | | | (7,588) | | | 41,236 | |
| Unrealized gains (losses) | | | | | | |
| Seed capital and other | | 9,668 | | | 10,099 | | | (31,261) | |
| Derivatives | | 12,886 | | | (8,717) | | | (177) | |
| | | | | | |
| Brokerage-related investments: | | | | | | |
| Realized gains (losses) | | 160 | | | (203) | | | (1,384) | |
| Unrealized gains (losses) | | 309 | | | (442) | | | 669 | |
| | | | | | |
| Equity investment in JVs: | | | | | | |
| Equity (loss) | | (36,611) | | | — | | | — | |
| | | $ | (13,486) | | | $ | 14,206 | | | $ | (102,413) | |
Other Revenues
Other revenues consist of fees earned for transfer agency services provided to company-sponsored mutual funds, fees earned for administration and recordkeeping services provided to company-sponsored mutual funds and the General Accounts of EQH and its subsidiaries, and other miscellaneous revenues. Other revenues increased $41.5 million, or 40.9%, in 2024, primarily due to certain reimbursements for services provided to the JVs. Other revenues decreased $4.2 million, or 4.0%, in 2023, primarily due to lower shareholder servicing fees and lower brokerage income, partially offset by higher mutual fund reimbursements.
Expenses
The components of expenses are as follows:
| | | | | | | | | | | | | | | | | | | | | | | | | | | | | |
| | Years Ended December 31 | | % Change |
| | 2024 | 2023 | 2022 | | 2024-23 | 2023-22 |
| | (in thousands) | | | |
| Employee compensation and benefits | | $ | 1,801,767 | | | $ | 1,769,153 | | | $ | 1,666,636 | | | 1.8 | % | 6.2 | % |
| Promotion and servicing: | | | | | | | | | |
| Distribution-related payments | | 742,429 | | | 610,368 | | | 629,572 | | | 21.6 | | (3.1) | |
| Amortization of deferred sales commissions | | 57,983 | | | 36,817 | | | 34,762 | | | 57.5 | | 5.9 | |
| Trade execution, marketing, T&E and other | | 182,146 | | | 215,643 | | | 215,556 | | | (15.5) | | — | |
| | | 982,558 | | | 862,828 | | | 879,890 | | | 13.9 | | (1.9) | |
| General and administrative | | 599,215 | | | 581,571 | | | 641,635 | | | 3.0 | | (9.4) | |
| | | | | | | | | |
| Contingent payment arrangements | | (121,896) | | | 22,853 | | | 6,563 | | | n/m | n/m |
| Interest on borrowings | | 43,509 | | | 54,394 | | | 17,906 | | | (20.0) | | n/m |
| Amortization of intangible assets | | 45,913 | | | 46,854 | | | 26,564 | | | (2.0) | | 76.4 | |
| Total | | $ | 3,351,066 | | | $ | 3,337,653 | | | $ | 3,239,194 | | | 0.4 | % | 3.0 | % |
Employee Compensation and Benefits
Employee compensation and benefits consist of base compensation (including salaries and severance), annual short-term incentive compensation awards (cash bonuses), annual long-term incentive compensation awards, commissions, fringe benefits and other employment costs (including recruitment, training, temporary help and meals).
Compensation expense as a percentage of net revenues was 40.3%, 42.6% and 41.1% for the years ended December 31, 2024, 2023 and 2022, respectively. Compensation expense generally is determined on a discretionary basis and is primarily a function of our firm’s current-year financial performance. The amounts of incentive compensation we award are designed to motivate, reward and retain top talent while aligning our executives' interests with the interests of our Unitholders. Senior management, together with the Compensation and Workplace Practices Committee of the Board of Directors of AllianceBernstein Corporation (“Compensation Committee”), continue to believe that the appropriate metric to consider in determining the amount of incentive compensation is the ratio of adjusted employee compensation and benefits expense to adjusted net revenues. Adjusted net revenues used in the adjusted compensation ratio are the same as the adjusted net revenues presented as a non-GAAP measure (discussed earlier in this Item 7). Adjusted employee compensation and benefits expense is total employee compensation and benefits expense minus other employment costs such as recruitment, training, temporary help and meals (which were 1.0%, 1.1% and 1.1% of adjusted net revenues for 2024, 2023 and 2022, respectively), and excludes the impact of mark-to-market vesting expense, as well as dividends and interest expense, associated with employee long-term incentive compensation-related investments and the amortization expense associated with the awards issued by EQH to some of our firm's executives relating to their roles as members of the EQH Management Committee. Senior management, with the approval of the Compensation Committee, has established as an objective that adjusted employee compensation and benefits expense, excluding the impact of performance-based fees, generally should not exceed 50% of our adjusted net revenues in any year, except in unexpected or unusual circumstances. Our ratios of adjusted compensation expense as a percentage of adjusted net revenues were 47.9%, 49.0% and 48.4%, respectively, for the years ended December 31, 2024, 2023 and 2022.
In 2024, employee compensation and benefits expense increased $32.6 million, or 1.8%, primarily due to higher incentive compensation of $92.9 million and higher commissions of $27.9 million, partially offset by lower base compensation of $87.8 million primarily driven by the Bernstein Research Services deconsolidation. In 2023, employee compensation and benefits expense increased $102.5 million, or 6.2% primarily due to higher base compensation of $72.2 million, higher incentive compensation of $51.7 million and higher fringes of $7.8 million, partially offset by lower commissions of $29.0 million.
Promotion and Servicing
Promotion and servicing expenses include distribution-related payments to financial intermediaries for distribution of AB mutual funds and amortization of deferred sales commissions paid to financial intermediaries for the sale of back-end load shares of AB mutual funds. Also included in this expense category are costs related to trade execution and clearance, travel and entertainment, advertising and promotional materials.
Promotion and servicing expenses increased $119.7 million, or 13.9%, in 2024. The increase was due to higher distribution-related payments of $132.1 million, higher amortization of deferred sales commissions of $21.2 million and higher transfer fees of $11.1 million, partially offset by lower trade execution and clearance expenses of $47.1 million primarily driven by the Bernstein Research Services deconsolidation. Promotion and servicing expenses decreased $17.1 million, or 1.9%, in 2023. The decrease was due to lower distribution-related payments of $19.2 million, lower trade execution and clearance expenses of $9.0 million and lower transfer fees of $3.0 million, offset by higher travel and entertainment expenses of $8.5 million, higher marketing and communication expenses of $3.5 million and higher amortization of deferred sales commissions of $2.1 million.
General and Administrative
General and administrative expenses include portfolio services fees, technology fees, professional fees and office-related expenses (occupancy, communications and similar expenses). General and administrative expenses as a percentage of net revenues were 13.4%, 14.0% and 15.8% for the years ended December 31, 2024, 2023 and 2022, respectively. General and administrative expenses increased $17.6 million, or 3.0%, in 2024. The increase was primarily due to higher office and related expenses of $13.3 million, losses related to the settlement of the retirement plan in 2024 of $13.1 million, higher portfolio services expenses of $7.3 million, higher other state income taxes of $6.3 million and higher charitable contributions of $5.3 million, partially offset by the recognition of a $20.8 million government incentive grant received in connection with our headquarters relocation to Nashville, Tennessee and lower errors of $3.3 million. General and administrative expenses decreased $60.1 million, or 9.4%, in 2023. The decrease was primarily due to lower portfolio services fees of $43.7 million, lower professional fees of $18.0 million, lower valuation adjustments related to the classification of Bernstein Research Services as held for sale of $6.0 million and a favorable foreign exchange translation impact of $5.7 million, partially offset by higher office-related expenses of $7.4 million.
Contingent Payment Arrangements
Contingent payment arrangements reflect changes in estimates of contingent payment liabilities associated with acquisitions in current and previous periods, as well as accretion expense of these liabilities. During 2024, we recognized a gain of $128.5 million in contingent payment arrangements in the consolidated statement of income related to a fair value remeasurement of the contingent payment liability associated with our acquisition of AB CarVal ( the "CarVal Acquisition") in 2022. The fair value remeasurement was due to updated assumptions of future performance associated with the liability. In December 2024, the company agreed to finalize its contingent consideration liability with AB CarVal for a value of $134.0 million. This liability will be paid predominantly in AB Units issued within 10 days of December 31, 2027. Given the liability is no longer contingent, the liability of approximately $118.8 million is now recorded in accounts payable and accrued expenses on the consolidated statements of financial condition. We will accrete the present value of the liability of $118.8 million up to $134.0 million through December 31, 2027 and recognize this expense as general and administrative expenses on the consolidated statements of income on a prospective basis. As of December 31, 2023, the contingent consideration payable associated with the Carval Acquisition was $238.5 million.
During 2023, we recorded a change in estimate related to the contingent consideration liability associated with the acquisition of Autonomous LLC in 2019 of $14.1 million. The change in estimate was based upon better than expected revenues during the 2023 performance evaluation period. There were no changes in our estimates during the year ended December 31, 2022. These expenses resulting from changes to expected payments and the accretion of these obligations to their expected payment amounts are reflected within contingent payment arrangements in our consolidated statements of income.
For the years ended December 31, 2024, 2023 and 2022, we recognized $9.0 million, $8.8 million and $6.6 million, respectively, in accretion expense related to our contingent considerations payable.
Interest on Borrowings
Interest expense decreased $10.9 million in 2024, primarily due to lower weighted average borrowings, partially offset by a slightly higher weighted average interest rate. Average daily borrowings for the EQH facilities and commercial paper were $762.4 million at a weighted average interest rate of 5.3% during 2024 compared to $1.0 billion and 5.1% during 2023.
Interest expense increased $36.5 million in 2023, reflecting higher interest rates on borrowings and higher weighted average borrowings. Average daily borrowings for the EQH facilities and commercial paper were $1.0 billion at a weighted average interest rate of 5.1% during 2023 compared to $845.5 million and 1.7% during 2022.
Amortization of Intangible Assets
Amortization of intangible assets reflects our amortization of costs assigned to acquired investment management contracts with a finite life. These assets are recognized at fair value and generally are amortized on a straight-line basis over their estimated useful life. Amortization of intangible assets decreased by $0.9 million in 2024. During 2024, we wrote off approximately $4.4 million of intangible assets associated with various historical acquisitions.
Amortization of intangible assets increased $20.3 million in 2023. The increase was primarily due to the acquired intangible assets associated with the CarVal acquisition. On July 1, 2022, AB acquired CarVal Investors L.P. ("CarVal"), which resulted in recording of $303.0 million of finite-lived intangible assets primarily relating to investment management contracts and investor relationships with useful lives ranging from 5 to 10 years.
Income Taxes
AB, a private limited partnership, is not subject to federal or state corporate income taxes. However, AB is subject to a 4.0% New York City unincorporated business tax (“UBT”). Our domestic corporate subsidiaries are subject to federal, state and local income taxes, and generally are included in the filing of a consolidated federal income tax return. Separate state and local income tax returns also are filed. Foreign corporate subsidiaries generally are subject to taxes in the jurisdictions where they are located.
Income tax expense increased $36.1 million, or 124.2%, in 2024 compared to 2023. This resulted in a higher effective tax rate in 2024 of 5.2% compared to 3.6% in 2023. Income tax expense decreased $10.6 million, or 26.7%, in 2023 compared to 2022. This resulted in a lower effective tax rate in 2023 of 3.6% compared to 4.9% in 2022.
The respective increase in 2024 and decrease in 2023 were primarily driven by a one time tax benefit of $22.4 million resulting from the release of a valuation allowance on a capital loss tax asset due to a 2023 tax planning action. The fluctuation for both comparative periods presented was primarily driven by this one time tax benefit in 2023.
Net Income (Loss) of Consolidated Entities Attributable to Non-Controlling Interests
Net income (loss) of consolidated entities attributable to non-controlling interests primarily consists of limited partner interests owned by other investors in our consolidated company-sponsored investment funds. In 2024, we had $20.2 million of net income of consolidated entities attributable to non-controlling interests, primarily due to gains on investments held by our consolidated company-sponsored investment funds. In 2023, we had $24.0 million of net income of consolidated entities attributable to non-controlling interests, primarily due to gains on investments held by our consolidated company-sponsored investment funds. In 2022 we had $56.4 million of net loss of consolidated entities attributable to non-controlling interests, primarily due to losses on investments held by our consolidated company-sponsored investment funds.
Capital Resources and Liquidity
Cash flows from operating activities primarily include the receipt of investment advisory and services fees and other revenues offset by the payment of operating expenses incurred in the normal course of business. Our cash flows from operating activities have historically been positive and sufficient to support our operations. We do not anticipate this to change in the foreseeable future. Cash flows from investing activities generally consist of small capital expenditures and, when applicable, divestitures, capital activity related to our equity method investments and business acquisitions. Cash flows from financing activities primarily consist of issuance and repayment of debt and the repurchase of AB Holding units to fund our long-term deferred compensation plans. We are required to distribute all of our Available Cash Flow to our Unitholders and the General Partner.
During 2024, net cash provided by operating activities was $1.4 billion, compared to $0.9 billion during 2023. The change was primarily due to higher earnings of $312.5 million (after non-cash reconciling items), the net activity of our consolidated company-sponsored investment funds of $128.1 million, an increase in accounts payable and accrued expenses of $94.0 million and an increase in broker-dealer related payables (net of receivable and segregated U.S. Treasury Bills activity) of $87.9 million, partially offset by an increase in fees receivable of $140.8 million. During 2023, net cash provided by operating activities was $0.9 billion, compared to $1.1 billion during 2022. The change primarily was due to an increase in fees receivable of $161.1 million, lower earnings of $159.9 million (after non-cash reconciling items), a decrease in broker-dealer related payables (net of receivable and segregated U.S. Treasury Bills activity) of $133.3 million and an increase in deferred sales commissions of $59.8 million, partially offset by net activity of our consolidated company-sponsored investment funds of $166.0 million and an increase in accrued compensation of $127.4 million.
During 2024, net cash used in investing activities was $115.7 million, compared to $33.6 million during 2023. The change was primarily due to higher purchases of furniture, equipment and leasehold improvements of $88.7 million and cash used related to the divestiture of the BRS business of $40.2 million. The cash used in the divestiture included $304.0 million in cash proceeds received from SocGen offset by $338.2 million in cash contributed from the transferring balance sheet and $6.0 million in direct costs to sell. In addition, there was an increase in debt repayment from equity method investments of $86.2 million offset by capital contributions to equity method investments of $39.4 million. During 2023, net cash used in investing activities was $33.6 million, compared to $22.0 million during 2022. The change is due to the acquisition of CarVal, net cash acquired of $40.3 million in 2022, partially offset by lower purchases of furniture, equipment and leasehold improvements of $28.7 million.
During 2024, net cash used in financing activities was $1.6 billion, compared to $1.0 billion during 2023. The change is primarily due to higher repayments of debt of $608.6 million and higher cash distributions to Unitholders of $115.2 million, partially offset by proceeds from the issuance of private units to EQH of $150.0 million. During 2023, net cash used in financing activities was $1.0 billion, compared to $1.1 billion during 2022. The change reflects lower cash distributions to Unitholders of $230.6 million, a decrease in the net purchases of AB Holding Units to fund long-term incentive compensation plans of $66.5 million and the repayment of CarVal debt of $42.7 million, partially offset by higher net purchases of non-controlling interests of consolidated company-sponsored investment funds of $187.1 million and lower net borrowings of debt of $70.7 million.
As of December 31, 2024, AB had $832.0 million of cash and cash equivalents (excluding cash and cash equivalents of consolidated company-sponsored investment funds), all of which is available for liquidity but consist primarily of cash on deposit for our broker-dealers related to various customer clearing activities and cash held by foreign subsidiaries of $460.1 million.
See Note 12 to our consolidated financial statements in Item 8 for disclosures relating to our debt and credit facilities. We use our debt and credit facilities to seed certain new investment products which may expose us to market risk, credit risk and material gains and losses. To reduce our exposure, we enter into various futures, forwards, options and swaps primarily to economically hedge certain of our seed money investments. While in most cases broad market risks are hedged and are effective in reducing our exposure, our hedges are imperfect and we may remain exposed to some market risk and credit-related losses in the event of non-performance by counterparties on these derivative instruments.
Our financial condition and access to public and private debt markets should provide adequate liquidity for our general business needs. Management believes that cash flow from operations and the issuance of debt and AB Units or AB Holding Units will provide us with the resources we need to meet our financial obligations. See “Risk Factors” in Item 1A and “Cautions Regarding Forward-Looking Statements” in this Item 7 for a discussion of credit markets and our ability to renew our credit facilities at expiration.
Off-Balance Sheet Arrangements and Aggregate Contractual Obligations
Guarantees
Under various circumstances, AB guarantees the obligations of its consolidated subsidiaries.
AB maintains a guarantee in connection with an $800 million committed, unsecured senior revolving credit facility (the "Credit Facility"). If SCB LLC is unable to meet its obligations, AB will pay the obligations when due or on demand. SCB LLC currently has three uncommitted lines of credit with three financial institutions. Two of these lines of credit permit us to borrow up to an aggregate of approximately $150.0 million, with AB named as an additional borrower, while the other line has no stated limit. AB has guaranteed the obligations of SCB LLC under these lines of credit. AB maintains guarantees totaling $150.0 million for SCB LLC’s three uncommitted lines of credit.
AB maintains a guarantee with a commercial bank, under which we guarantee the obligations in the ordinary course of business for SCB LLC, one of our U.S. based broker-dealer. In the event this entity is unable to meet its obligations, AB will pay the obligation when due or on demand.
We also have two smaller guarantees with a commercial bank totaling approximately $1.8 million, under which we guarantee certain obligations in the ordinary course of business of one of our foreign subsidiaries.
Effective April 1, 2024 AB and SocGen completed their previously announced transaction to form the JVs. At the time of closing, Bernstein Institutional Services LLC (“BIS”), the U.S. broker-dealer subsidiary of the NA JV, entered into a credit facility agreement with SocGen, as lender, providing for up to $60.0 million of working capital. As a condition of the credit facility and until SocGen’s ownership exceeds 50% of NA JV, AB will provide a limited guarantee under which AB will guarantee up to its percentage ownership, currently 66.7%, of any unpaid obligations of BIS. As of December 31, 2024 there were no unpaid obligations under this facility requiring a guarantee by AB.
In addition, in connection with the close of the transaction, AB will indemnify SG Canada for certain obligations and liabilities in relation to SCB Canada until such time as SocGen exceeds 50% ownership of NA JV (the “Canadian Regulatory Guarantee”). Under the terms of the Canadian Regulatory Guarantee, SG Canada must guarantee the customer liabilities of SCB Canada to the full extent of its regulatory capital which fluctuates based upon business activity. AB has agreed to indemnify SG Canada for 66.7% of any amounts paid by SG Canada under the Canadian Regulatory Guarantee. As of December 31, 2024, there were no unpaid obligations requiring a guarantee by AB.
We have not been required to perform under any of the above agreements and currently have no outstanding liability in connection with these agreements.
Aggregate Contractual Obligations
We have various compensation and benefit obligations, including accrued salaries and fringes, commissions, payroll taxes, incentive payments and deferred compensation arrangements. The majority of our compensation and benefits obligations are paid out in less than one year, while the deferred compensation obligations are payable over various periods, with the majority payable over periods of up to three years. Accrued compensation and benefits as of December 31, 2024 totaled $372.6 million. This amount excludes our accrued pension obligation. Offsetting our accrued compensation obligations are long-term incentive compensation-related investments and money market investments we funded totaling $43.5 million, which are included in our consolidated statement of financial condition. Any amounts reflected on the consolidated statement of financial condition as payables (to broker-dealers, brokerage clients and company-sponsored mutual funds) and accounts payable and accrued expenses are excluded from the aforementioned accrued compensation and benefits obligation amount.
We expect to make contributions to our qualified profit sharing plan of approximately $19.0 million in each of the next four years. Effective May 22, 2024, the Compensation Committee of the AB Board of Directors approved the termination of the retirement plan. Net assets available under the Plan will be distributed to the selected insurer and participants through the first quarter of 2025. We expect to make a contribution of approximately $5.3 million in 2025 to fully fund the retirement plan, purchase the group annuity contract and settle the remaining termination costs associated with the retirement plan.
The 2017 Tax Act (enacted in the U.S. on December 22, 2017) imposed a federal transition tax on mandatory deemed repatriation of certain deferred foreign earnings. Management elected to pay the transition tax in installments over an eight-year period from 2018 to 2025. The federal transition tax obligation as of December 31, 2024 totaled $4.7 million and is recorded to income tax payable on our consolidated statement of financial condition. See Note 21 to our consolidated financial statements in Item 8 for further discussion of our taxes.
During the fourth quarter of 2024, we entered into a non-exclusive partnership with Reinsurance Group of America, Incorporated (“RGA”) under which we committed to invest $100.0 million in a reinsurance sidecar vehicle sponsored by RGA and focused on the U.S. asset-intensive reinsurance market. AB intends to manage private alternative assets for RGA’s general account as part of a separate transaction. As of December 31, 2024, we have funded $0.1 million of this commitment. The remaining commitment of up to $100.0 million can be called upon short notice at any future point.
See Note 13 to our consolidated financial statements in Item 8 for discussion of our leases.
See Note 12 to our consolidated financial statements in Item 8 for a discussion of our debt.
See Note 14 to our consolidated financial statements in Item 8 for a discussion of our commitments and contingencies.
| | |
|
| Critical Accounting Estimates |
|
The preparation of the consolidated financial statements and notes to consolidated financial statements requires management to make estimates and judgments that affect the reported amounts of assets, liabilities, revenues and expenses.
Management believes that the critical accounting policies and estimates discussed below involve significant management judgment due to the sensitivity of the methods and assumptions used.
Goodwill
Our acquisitions are accounted for under the acquisition method of accounting, where the cost of the acquisition is allocated on the basis of the estimated fair value of the assets acquired and the liabilities assumed. The excess of the purchase price over the fair value of identifiable assets acquired, net of liabilities assumed, results in the recognition of goodwill.
As of December 31, 2024, we had goodwill of $3.6 billion on the consolidated statement of financial condition, which included $666.1 million as a result of the CarVal Investors L.P. ("CarVal") acquisition in 2022, $2.6 billion as a result of the Sanford C. Bernstein Inc. (“Bernstein”) acquisition in 2000 and $291.9 million in regard to various smaller acquisitions. As a result of the BRS deconsolidation, approximately $159.8 million of goodwill has been contributed to the JVs.
We have determined that AB has only one reporting segment and reporting unit. We test our goodwill annually, as of September 30, for impairment or if certain events or changes in circumstances occur and trigger an interim impairment test. The carrying value of goodwill is also reviewed if facts and circumstances occur that suggest possible impairment, such as, but not limited to significant transactions including acquisitions or divestitures and significant declines in AUM, revenues, earnings or the price of an AB Holding Unit. Any of these changes in circumstances could suggest the possibility that goodwill is impaired, but none
of these events or circumstances by itself would indicate that it is more likely than not that goodwill is impaired. Instead, they are merely recognized as triggering events for the consideration of impairment and must be viewed in combination with any mitigating or positive factors. A holistic evaluation of all events since the most recent quantitative impairment test must be done to determine whether it is more likely than not that the reporting unit is impaired.
For our annual impairment test, we utilize the market approach where the fair value of the reporting unit is based on its unadjusted market valuation (AB Units outstanding multiplied by AB Holding's Unit price) and earnings multiples. A goodwill impairment would be the amount by which a reporting unit's carrying value exceeds its fair value, not to exceed the carrying amount of goodwill. The goodwill impairment test does not include a determination by management of whether a decline in fair value is temporary and it is important that management's determination of fair value reflect the impact of changing market conditions, including the severity and anticipated duration of any such changes. The price of a publicly traded AB Holding Unit serves as a reasonable starting point for valuing an AB Unit because each represents the same fractional interest in our underlying business. Our market approach analysis also includes comparable industry earnings multiples applied to our earnings forecast and assumes a control premium (when applicable).
Contingent Payment Arrangements
We periodically enter into contingent payment arrangements in connection with our business combinations. In these arrangements, we agree to pay additional consideration to the sellers to the extent that certain performance targets are achieved. We estimate the fair value of these potential future obligations at the time a business combination is consummated and record a liability on a discounted basis on our consolidated statement of financial condition. We then accrete the obligation to its expected payment amount over the measurement period. If our expected payment amount subsequently changes, the obligation is modified in the current period resulting in a gain or loss. Both gains and losses resulting from changes to expected payments and the accretion of these obligations to their expected payment amounts are reflected within contingent payment arrangements in our consolidated statements of income.
For contingent liabilities, we typically use a valuation method that is a form of the income approach, whereby a forecast of future cash flows attributable to the asset are discounted to present value using a risk-adjusted discount rate. We develop a forecast of future cash flows attributable to the performance objectives that are then discounted to present value using a risk-adjusted discount rate. Some of the more significant estimates and assumptions inherent in the income approach include the amount and timing of projected future cash flows, the discount rate selected to measure the risks inherent in the future cash flows.
Investments in Unconsolidated Joint Ventures
Effective April 1, 2024 we deconsolidated our Bernstein Research Services business ("BRS") and contributed the BRS business to two unconsolidated joint ventures (the "JVs"). We recognize our initial investment in our JVs at fair value. The determination of fair values of assets and liabilities of the JVs requires us to make certain estimates, consider assumptions and use valuation techniques when a market value is not readily determinable. The valuation methodology used for our initial investment in the JVs is known as a dividend discount model whereby a forecast of net income attributable to each of the JVs was discounted using an estimated cost of capital to determine the present value of expected future dividends. The joint venture dividend discount model includes significant assumptions such as expected future distributable earnings, discount rate and a long term growth rate. We recorded an initial investment in the JVs at fair value as of April 1, 2024 of $283.9 million. We have recorded our subsequent investment in each of the JVs under the equity method of accounting under ASC 323 Investments – Equity Method and Joint Ventures, as we retained the ability to exercise significant influence over the operating and financial policies of the JVs but did not retain a controlling interest. Our investments in companies over which we have the ability to exercise significant influence are accounted for under the equity method and are recorded at cost plus our share of earnings and losses. As of December 31, 2024 our investment in the JVs was $286.7 million
Our investments in our JVs are reviewed for indicators of impairment when events or circumstances change indicating that a decline in the fair values below the carrying amounts has occurred and such decline is other-than-temporary. An extended series of net operating losses of an investee, inability to operate without significant future capital infusions, or other factors may indicate that a loss in the value of our investment in the unconsolidated JVs may have occurred. If a loss exists, we further review to determine if the loss is other than temporary, in which case we will record an impairment charge in the amount of the excess carrying value over the estimated fair value. As we do not have a controlling financial interest in the JVs, the fair value of the JVs would be determined at the joint venture level using a dividend discount model which is subjective and considers assumptions regarding future performance, as discussed above, that could differ materially from actual results in future periods. As of December 31, 2024 there was no triggering event identified requiring an impairment analysis of our investment in our unconsolidated JVs.
Loss Contingencies
Management continuously reviews with legal counsel the status of regulatory matters and pending or threatened litigation. We evaluate the likelihood that a loss contingency exists and record a loss contingency if it is both probable and reasonably estimable as of the date of the financial statements. See Note 14 to our consolidated financial statements in Item 8.
Accounting Pronouncements
See Note 2 to our consolidated financial statements in Item 8.
Cautions Regarding Forward-Looking Statements
Certain statements provided by management in this report are “forward-looking statements” within the meaning of the Private Securities Litigation Reform Act of 1995. Such forward-looking statements are subject to risks, uncertainties and other factors that could cause actual results to differ materially from future results expressed or implied by such forward-looking statements. The most significant of these factors include, but are not limited to, the following: the performance of financial markets, the investment performance of sponsored investment products and separately managed accounts, general economic conditions, industry trends, future acquisitions, integration of acquired companies, competitive conditions and government regulations, including changes in tax regulations and rates and the manner in which the earnings of publicly-traded partnerships are taxed. We caution readers to carefully consider such factors. Further, these forward-looking statements speak only as of the date on which such statements are made; we undertake no obligation to update any forward-looking statements to reflect events or circumstances after the date of such statements. For further information regarding these forward-looking statements and the factors that could cause actual results to differ, see “Risk Factors” in Item 1A. Any or all of the forward-looking statements that we make in this Form 10-K, other documents we file with or furnish to the SEC, and any other public statements we issue, may turn out to be wrong. It is important to remember that other factors besides those listed in “Risk Factors” and those listed below could also adversely impact our revenues, financial condition, results of operations and business prospects.
The forward-looking statements referred to in the preceding paragraph, most of which directly affect AB but also affect AB Holding because AB Holding’s principal source of income and cash flow is attributable to its investment in AB, include statements regarding:
•Our belief that the cash flow AB Holding realizes from its investment in AB will provide AB Holding with the resources it needs to meet its financial obligations: AB Holding’s cash flow is dependent on the quarterly cash distributions it receives from AB. Accordingly, AB Holding’s ability to meet its financial obligations is dependent on AB’s cash flow from its operations, which is subject to the performance of the capital markets and other factors beyond our control.
•Our financial condition and ability to access the public and private capital markets providing adequate liquidity for our general business needs: Our financial condition is dependent on our cash flow from operations, which is subject to the performance of the capital markets, our ability to maintain and grow client assets under management and other factors beyond our control. Our ability to access public and private capital markets on reasonable terms may be limited by adverse market conditions, our firm’s credit ratings, our profitability and changes in government regulations, including tax rates and interest rates.
•The outcome of litigation: Litigation is inherently unpredictable, and excessive damage awards do occur. Though we have stated that we do not expect any pending legal proceedings to have a material adverse effect on our results of operations, financial condition or liquidity, any settlement or judgment with respect to a legal proceeding could be significant, and could have such an effect.
•The possibility that we will engage in open market purchases of AB Holding Units to help fund anticipated obligations under our incentive compensation award program: The number of AB Holding Units AB may decide to buy in future periods, if any, to help fund incentive compensation awards depends on various factors, some of which are beyond our control, including the fluctuation in the price of an AB Holding Unit (NYSE: AB) and the availability of cash to make these purchases.
•Our determination that adjusted employee compensation expense, excluding the impact of performance-based fees, generally should not exceed 50% of our adjusted net revenues on an annual basis: Aggregate employee compensation reflects employee performance and competitive compensation levels. Fluctuations in our revenues and/or changes in competitive compensation levels could result in adjusted employee compensation expense exceeding 50% of our adjusted net revenues.
Item 7A. Quantitative and Qualitative Disclosures about Market Risk
| | |
|
| Market Risk, Risk Management and Derivative Financial Instruments |
|
Our investments consist of trading and other investments. Trading investments include U.S. Treasury Bills, mutual funds, exchange-traded options and various separately-managed portfolios consisting of equity securities. Trading investments are purchased for short-term investment, principally to fund liabilities related to long-term incentive compensation plans and to seed new investment services. Other investments include alternative investments and hedge funds we sponsor and other investment vehicles.
We enter into various futures, forwards, swaps and options primarily to economically hedge our seed capital investments. We do not hold any derivatives designated in a formal hedge relationship under ASC 815-10, Derivatives and Hedging. See Note 7 Derivative Instruments to our consolidated financial statements in Item 8.
Trading and Non-Trading Market Risk Sensitive Instruments
| | |
|
| Investments with Interest Rate Risk—Fair Value |
|
The table below provides our potential exposure with respect to our fixed income investments, measured in terms of fair value, to an immediate 100 basis point increase in interest rates at all maturities from the levels prevailing as of December 31, 2024 and 2023. Such a fluctuation in interest rates is a hypothetical rate scenario used to calibrate potential risk and does not represent our view of future market movements. While these fair value measurements provide a representation of interest rate sensitivity of our investments in fixed income mutual funds and fixed income hedge funds, they are based on our exposures at a particular point in time and may not be representative of future market results. These exposures will change as a result of ongoing changes in investments in response to our assessment of changing market conditions and available investment opportunities:
| | | | | | | | | | | | | | | | | | | | | | | | | | |
| As of December 31 |
| 2024 | 2023 |
| Fair Value | Effect of
+100
Basis Point
Change | Fair Value | Effect of
+100
Basis Point
Change |
| (in thousands) |
| Fixed Income Investments: | | | | | | | | |
| Securities segregated (U.S. Treasury Bills) | | $ | 499,245 | | | $ | (4,992) | | | $ | 867,679 | | | $ | (8,677) | |
| Trading | | 51,240 | | | (3,033) | | | 70,750 | | | (4,394) | |
| | |
|
| Investments with Equity Price Risk—Fair Value |
|
Our investments also include investments in equity securities, mutual funds and hedge funds. The following table provides our potential exposure with respect to our equity investments, measured in terms of fair value, to an immediate 10% decrease in equity prices from those prevailing as of December 31, 2024 and 2023. A 10% decrease in equity prices is a hypothetical scenario used to calibrate potential risk and does not represent our view of future market movements. While these fair value measurements provide a representation of equity price sensitivity of our investments in equity securities, mutual funds and hedge funds, they are based on our exposures at a particular point in time and may not be representative of future market results. These exposures will change as a result of ongoing portfolio activities in response to our assessment of changing market conditions and available investment opportunities:
| | | | | | | | | | | | | | | | | | | | | | | | | | |
| As of December 31 |
| 2024 | 2023 |
| Fair Value | Effect of -10%
Equity Price
Change | Fair Value | Effect of -10%
Equity Price
Change |
| (in thousands) |
| Equity Investments: | | | | | | | | |
| Trading | | $ | 150,585 | | | $ | (15,058) | | | $ | 117,434 | | | $ | (11,743) | |
| Other investments | | 333,380 | | | (33,338) | | | 55,371 | | | (5,537) | |
Item 8. Financial Statements and Supplementary Data
Report of Independent Registered Public Accounting Firm
To the General Partner and Unitholders of AllianceBernstein L.P.
Opinions on the Financial Statements and Internal Control over Financial Reporting
We have audited the accompanying consolidated statements of financial condition of AllianceBernstein L.P. and its subsidiaries (the "Company") as of December 31, 2024 and 2023, and the related consolidated statements of income, of comprehensive income, of changes in partners' capital and of cash flows for each of the three years in the period ended December 31, 2024, including the related notes and financial statement schedule listed in the index appearing under Item 15 (collectively referred to as the "consolidated financial statements"). We also have audited the Company's internal control over financial reporting as of December 31, 2024, based on criteria established in Internal Control - Integrated Framework (2013) issued by the Committee of Sponsoring Organizations of the Treadway Commission (COSO).
In our opinion, the consolidated financial statements referred to above present fairly, in all material respects, the financial position of the Company as of December 31, 2024 and 2023, and the results of its operations and its cash flows for each of the three years in the period ended December 31, 2024 in conformity with accounting principles generally accepted in the United States of America. Also in our opinion, the Company maintained, in all material respects, effective internal control over financial reporting as of December 31, 2024, based on criteria established in Internal Control - Integrated Framework (2013) issued by the COSO.
Basis for Opinions
The Company's management is responsible for these consolidated financial statements, for maintaining effective internal control over financial reporting, and for its assessment of the effectiveness of internal control over financial reporting, included in Management’s Report on Internal Control Over Financial Reporting appearing under Item 9A. Our responsibility is to express opinions on the Company’s consolidated financial statements and on the Company's internal control over financial reporting based on our audits. We are a public accounting firm registered with the Public Company Accounting Oversight Board (United States) (PCAOB) and are required to be independent with respect to the Company in accordance with the U.S. federal securities laws and the applicable rules and regulations of the Securities and Exchange Commission and the PCAOB.
We conducted our audits in accordance with the standards of the PCAOB. Those standards require that we plan and perform the audits to obtain reasonable assurance about whether the consolidated financial statements are free of material misstatement, whether due to error or fraud, and whether effective internal control over financial reporting was maintained in all material respects.
Our audits of the consolidated financial statements included performing procedures to assess the risks of material misstatement of the consolidated financial statements, whether due to error or fraud, and performing procedures that respond to those risks. Such procedures included examining, on a test basis, evidence regarding the amounts and disclosures in the consolidated financial statements. Our audits also included evaluating the accounting principles used and significant estimates made by management, as well as evaluating the overall presentation of the consolidated financial statements. Our audit of internal control over financial reporting included obtaining an understanding of internal control over financial reporting, assessing the risk that a material weakness exists, and testing and evaluating the design and operating effectiveness of internal control based on the assessed risk. Our audits also included performing such other procedures as we considered necessary in the circumstances. We believe that our audits provide a reasonable basis for our opinions.
Definition and Limitations of Internal Control over Financial Reporting
A company’s internal control over financial reporting is a process designed to provide reasonable assurance regarding the reliability of financial reporting and the preparation of financial statements for external purposes in accordance with generally accepted accounting principles. A company’s internal control over financial reporting includes those policies and procedures that (i) pertain to the maintenance of records that, in reasonable detail, accurately and fairly reflect the transactions and dispositions of the assets of the company; (ii) provide reasonable assurance that transactions are recorded as necessary to permit preparation of financial statements in accordance with generally accepted accounting principles, and that receipts and expenditures of the company are being made only in accordance with authorizations of management and directors of the company; and (iii) provide reasonable assurance regarding prevention or timely detection of unauthorized acquisition, use, or disposition of the company’s assets that could have a material effect on the financial statements.
Because of its inherent limitations, internal control over financial reporting may not prevent or detect misstatements. Also, projections of any evaluation of effectiveness to future periods are subject to the risk that controls may become inadequate because of changes in conditions, or that the degree of compliance with the policies or procedures may deteriorate.
Critical Audit Matters
The critical audit matter communicated below is a matter arising from the current period audit of the consolidated financial statements that was communicated or required to be communicated to the audit committee and that (i) relates to accounts or disclosures that are material to the consolidated financial statements and (ii) involved our especially challenging, subjective, or complex judgments. The communication of critical audit matters does not alter in any way our opinion on the consolidated financial statements, taken as a whole, and we are not, by communicating the critical audit matter below, providing a separate opinion on the critical audit matter or on the accounts or disclosures to which it relates.
Valuation of the Initial Investment in the Unconsolidated JVs
As described in Notes 2 and 24 to the consolidated financial statements, the Company and Societe Generale completed the transaction to form a global joint venture with two joint venture holding companies, one outside of North America and one within North America ("NA JV", and together the "JVs"). The Company maintains an equity method investment in each of the JVs and recorded an initial investment in the JVs at fair value as of April 1, 2024 of $283.9 million. The valuation methodology used for the initial investment in the joint ventures is known as a dividend discount model whereby a forecast of net income attributable to each of the JVs was discounted using an estimated cost of capital to determine the present value of expected future dividends. The joint venture dividend discount model includes significant assumptions such as expected future distributable earnings, discount rate and a long term growth rate.
The principal considerations for our determination that performing procedures relating to the valuation of the initial investment in the unconsolidated JVs is a critical audit matter are (i) the significant judgment by management when developing the fair value estimate of the initial investment in the unconsolidated JVs; (ii) a high degree of auditor judgment, subjectivity, and effort in performing procedures and evaluating management’s significant assumptions related to expected future distributable earnings, discount rate and a long term growth rate; and (iii) the audit effort involved the use of professionals with specialized skill and knowledge.
Addressing the matter involved performing procedures and evaluating audit evidence in connection with forming our overall opinion on the consolidated financial statements. These procedures included testing the effectiveness of controls relating to the dividend discount model, including controls over the valuation of the initial investment in the unconsolidated JVs. These procedures also included, among others (i) reading the joint venture agreement; (ii) testing management’s process for developing the fair value estimate of the initial investment in the unconsolidated JVs; (iii) evaluating the appropriateness of the dividend discount model; (iv) testing the completeness and accuracy of underlying data used in the dividend discount model; and (v) evaluating the reasonableness of the significant assumptions used by management related to expected future distributable earnings, discount rate and a long term growth rate. Evaluating management’s assumptions related to expected future distributable earnings involved considering (i) the historical performance of the contributed businesses; (ii) the consistency with external market and industry data; and (iii) the consistency with evidence obtained in other areas of the audit. Professionals with specialized skill and knowledge were used to assist in the evaluation of the appropriateness of the dividend discount model and the reasonableness of the assumptions related to the discount rate and long term growth rate.
/s/PricewaterhouseCoopers LLP
Nashville, Tennessee
February 14, 2025
We have served as the Company’s auditor since 2006.
| | |
| AllianceBernstein L.P. and Subsidiaries |
|
Consolidated Statements of Financial Condition
| | | | | | | | | | | | | | |
| Years Ended December 31 |
| 2024 | 2023 |
| (in thousands,
except unit amounts) |
| ASSETS | | | | |
| Cash and cash equivalents | | $ | 832,044 | | | $ | 1,000,103 | |
| Cash and securities segregated, at fair value (cost $495,391 and $859,448) | | 500,046 | | | 867,680 | |
| Receivables, net: | | | | |
| Brokers and dealers | | 33,772 | | | 53,144 | |
| Brokerage clients | | 1,432,372 | | | 1,314,656 | |
| AB funds fees | | 467,351 | | | 343,334 | |
| Other fees | | 159,336 | | | 125,500 | |
| Investments: | | | | |
| Joint ventures | | 286,721 | | | — | |
| Other | | 248,483 | | | 243,554 | |
| Assets of consolidated company-sponsored investment funds: | | | | |
| Cash and cash equivalents | | 1,989 | | | 7,739 | |
| Investments | | 140,792 | | | 397,174 | |
| Other assets | | 14,801 | | | 25,299 | |
| Furniture, equipment and leasehold improvements, net | | 248,673 | | | 176,348 | |
| Goodwill | | 3,598,591 | | | 3,598,591 | |
| Intangible assets, net | | 215,054 | | | 264,555 | |
| Deferred sales commissions, net | | 182,707 | | | 87,374 | |
| Right-of-use assets | | 449,877 | | | 323,766 | |
| Assets held for sale | | — | | | 564,776 | |
| Other assets | | 259,318 | | | 216,213 | |
| Total assets | | $ | 9,071,927 | | | $ | 9,609,806 | |
| | | | | | | | | | | | | | |
| Years Ended December 31 |
| 2024 | 2023 |
| (in thousands,
except unit amounts) |
| LIABILITIES, REDEEMABLE NON-CONTROLLING INTEREST AND CAPITAL | | | | |
| Liabilities: | | | | |
| Payables: | | | | |
| Brokers and dealers | | $ | 162,570 | | | $ | 259,175 | |
| | | | |
| Brokerage clients | | 1,933,843 | | | 2,200,835 | |
| AB mutual funds | | 830 | | | 644 | |
| Contingent consideration liability | | 9,385 | | | 252,690 | |
| Accounts payable and accrued expenses | | 426,675 | | | 172,163 | |
| Lease liabilities | | 512,615 | | | 369,017 | |
| Liabilities of consolidated company-sponsored investment funds | | 1,716 | | | 12,537 | |
| Accrued compensation and benefits | | 391,161 | | | 372,305 | |
| | | | |
| Debt | | 710,000 | | | 1,154,316 | |
| Liabilities held for sale | | — | | | 153,342 | |
| Total liabilities | | 4,148,795 | | | 4,947,024 | |
Commitments and contingencies (See Note 14) | | | | |
| Redeemable non-controlling interest of consolidated entities | | 48,489 | | | 209,420 | |
| Capital: | | | | |
| General Partner | | 49,519 | | | 45,388 | |
| Limited partners: 292,107,907 and 286,609,212 units issued and outstanding | | 4,999,616 | | | 4,590,619 | |
| Receivables from affiliates | | (2,893) | | | (4,490) | |
| AB Holding Units held for long-term incentive compensation plans | | (62,366) | | | (76,363) | |
| Accumulated other comprehensive (loss) | | (110,581) | | | (106,364) | |
| Partners’ capital attributable to AB Unitholders | | 4,873,295 | | | 4,448,790 | |
| Non-redeemable non-controlling interests in consolidated entities | | 1,348 | | | 4,572 | |
| Total capital | | 4,874,643 | | | 4,453,362 | |
| Total liabilities, non-controlling interest and capital | | $ | 9,071,927 | | | $ | 9,609,806 | |
See Accompanying Notes to Consolidated Financial Statements.
| | |
| AllianceBernstein L.P. and Subsidiaries |
|
Consolidated Statements of Income
| | | | | | | | | | | | | | | | | | | | |
| Years Ended December 31 |
| 2024 | 2023 | 2022 |
| (in thousands, except per unit amounts) |
| Revenues: | | | | | | |
| Investment advisory and services fees | | $ | 3,442,139 | | | $ | 2,975,468 | | | $ | 2,971,038 | |
| Bernstein research services | | 96,222 | | | 386,142 | | | 416,273 | |
| Distribution revenues | | 726,670 | | | 586,263 | | | 607,195 | |
| Dividend and interest income | | 165,313 | | | 199,443 | | | 123,091 | |
| Investment (losses) gains | | (13,486) | | | 14,206 | | | (102,413) | |
| Other revenues | | 142,794 | | | 101,342 | | | 105,544 | |
| Total revenues | | 4,559,652 | | | 4,262,864 | | | 4,120,728 | |
| Less: Broker-dealer related interest expense | | 84,513 | | | 107,541 | | | 66,438 | |
| Net revenues | | 4,475,139 | | | 4,155,323 | | | 4,054,290 | |
| Expenses: | | | | | | |
| Employee compensation and benefits | | 1,801,767 | | | 1,769,153 | | | 1,666,636 | |
| Promotion and servicing: | | | | | | |
| Distribution-related payments | | 742,429 | | | 610,368 | | | 629,572 | |
| Amortization of deferred sales commissions | | 57,983 | | | 36,817 | | | 34,762 | |
| Trade execution, marketing, T&E and other | | 182,146 | | | 215,643 | | | 215,556 | |
| General and administrative | | 599,215 | | | 581,571 | | | 641,635 | |
| | | | | | |
| | | | | | |
| Contingent payment arrangements | | (121,896) | | | 22,853 | | | 6,563 | |
| Interest on borrowings | | 43,509 | | | 54,394 | | | 17,906 | |
| Amortization of intangible assets | | 45,913 | | | 46,854 | | | 26,564 | |
| Total expenses | | 3,351,066 | | | 3,337,653 | | | 3,239,194 | |
| Operating income | | 1,124,073 | | | 817,670 | | | 815,096 | |
| Gain on divestiture | | 134,555 | | | — | | | — | |
| Non-operating income | | 134,555 | | | — | | | — | |
| Pre-tax Income | | 1,258,628 | | | 817,670 | | | 815,096 | |
| Income tax | | 65,143 | | | 29,051 | | | 39,639 | |
| Net income | | 1,193,485 | | | 788,619 | | | 775,457 | |
| Net income (loss) of consolidated entities attributable to non-controlling interests | | 20,238 | | | 24,009 | | | (56,356) | |
| Net income attributable to AB Unitholders | | $ | 1,173,247 | | | $ | 764,610 | | | $ | 831,813 | |
| Net income per AB Unit: | | | | | | |
| Basic | | $ | 4.05 | | | $ | 2.65 | | | $ | 3.01 | |
| Diluted | | $ | 4.05 | | | $ | 2.65 | | | $ | 3.01 | |
| | | | | | |
| | | | | | |
| | | | | | |
| | | | | | |
| | | | | | |
| | | | | | |
| | | | | | |
| | | | | | |
| | | | | | |
See Accompanying Notes to Consolidated Financial Statements.
| | |
| AllianceBernstein L.P. and Subsidiaries |
|
Consolidated Statements of Comprehensive Income
| | | | | | | | | | | | | | | | | | | | |
| Years Ended December 31 |
| 2024 | 2023 | 2022 |
| (in thousands) |
| Net income | | $ | 1,193,485 | | | $ | 788,619 | | | $ | 775,457 | |
| Other comprehensive income (loss): | | | | | | |
| Foreign currency translation adjustments, before reclassification and tax | | (20,843) | | | 14,262 | | | (47,208) | |
| Less: reclassification adjustment for (losses) included in net income upon liquidation | | (10,197) | | | (389) | | | — | |
| Foreign currency translation adjustments, before tax | | (10,646) | | | 14,651 | | | (47,208) | |
| Income tax benefit (expense) | | 59 | | | (618) | | | 1,215 | |
| Foreign currency translation adjustments, net of tax | | (10,587) | | | 14,033 | | | (45,993) | |
| | | | | | |
| | | | | | |
| | | | | | |
| | | | | | |
| Changes in employee benefit related items: | | | | | | |
| Amortization of prior service cost | | 24 | | | 24 | | | 24 | |
| Recognized actuarial gain | | 1,504 | | | 9,135 | | | 6,922 | |
| Less: reclassification adjustment for (losses) included in net income upon retirement plan liquidation | | (4,931) | | | — | | | — | |
| Changes in employee benefit related items | | 6,459 | | | 9,159 | | | 6,946 | |
| Income tax (expense) | | (89) | | | (79) | | | (95) | |
| Employee benefit related items, net of tax | | 6,370 | | | 9,080 | | | 6,851 | |
| | | | | | |
| Other comprehensive (loss) gain | | (4,217) | | | 23,113 | | | (39,142) | |
| Less: Comprehensive income (loss) in consolidated entities attributable to non-controlling interests | | 20,238 | | | 24,009 | | | (56,356) | |
| Comprehensive income attributable to AB Unitholders | | $ | 1,169,030 | | | $ | 787,723 | | | $ | 792,671 | |
See Accompanying Notes to Consolidated Financial Statements.
| | |
| AllianceBernstein L.P. and Subsidiaries |
|
Consolidated Statements of Changes in Partners’ Capital
| | | | | | | | | | | | | | | | | | | | |
| Years Ended December 31 |
| 2024 | 2023 | 2022 |
| (in thousands) |
| General Partner’s Capital | | | | | | |
| Balance, beginning of year | | $ | 45,388 | | | $ | 45,985 | | | $ | 42,850 | |
| Net income | | 11,732 | | | 7,646 | | | 8,318 | |
| Cash distributions to General Partner | | (9,553) | | | (8,411) | | | (10,715) | |
| Long-term incentive compensation plans activity | | (61) | | | (21) | | | 25 | |
| Issuance (retirement) of AB Units, net | | 513 | | | 189 | | | (385) | |
| Issuance of AB Units for EQH purchase agreement | | 1,500 | | | — | | | — | |
| Issuance of AB Units for CarVal acquisition | | — | | | — | | | 5,892 | |
| | | | | | |
| | | | | | |
| Balance, end of year | | 49,519 | | | 45,388 | | | 45,985 | |
| Limited Partners' Capital | | | | | | |
| Balance, beginning of year | | 4,590,619 | | | 4,648,113 | | | 4,336,211 | |
| Net income | | 1,161,515 | | | 756,964 | | | 823,495 | |
| Cash distributions to Unitholders | | (944,912) | | | (830,860) | | | (1,059,105) | |
| Long-term incentive compensation plans activity | | (6,014) | | | (2,080) | | | 2,521 | |
| Issuance (retirement) of AB Units, net | | 49,908 | | | 18,482 | | | (38,286) | |
| Issuance of AB Units for EQH purchase agreement | | 148,500 | | | — | | | — | |
| Issuance of AB Units for CarVal acquisition | | — | | | — | | | 583,277 | |
| | | | | | |
| | | | | | |
| Balance, end of year | | 4,999,616 | | | 4,590,619 | | | 4,648,113 | |
| Receivables from Affiliates | | | | | | |
| Balance, beginning of year | | (4,490) | | | (4,270) | | | (8,333) | |
| | | | | | |
| | | | | | |
| Long-term incentive compensation awards expense | | 1,088 | | | 727 | | | 607 | |
| Capital contributions from (to) AB Holding | | 509 | | | (947) | | | 3,456 | |
| Balance, end of year | | (2,893) | | | (4,490) | | | (4,270) | |
| AB Holding Units held for Long-term Incentive Compensation Plans | | | | | | |
| Balance, beginning of year | | (76,363) | | | (95,318) | | | (119,470) | |
| Purchases of AB Holding Units to fund long-term compensation plans, net | | (157,038) | | | (144,086) | | | (210,568) | |
| (Issuance) retirement of AB Units, net | | (49,894) | | | (17,562) | | | 40,346 | |
| Long-term incentive compensation awards expense | | 216,133 | | | 179,724 | | | 198,783 | |
| Re-valuation of AB Holding Units held in rabbi trust | | 4,796 | | | 879 | | | (4,240) | |
| Other | | — | | | — | | | (169) | |
| Balance, end of year | | (62,366) | | | (76,363) | | | (95,318) | |
| | | | | | |
| | | | | | |
| | | | | | |
| | | | | | |
| | | | | | |
| | | | | | |
| Accumulated Other Comprehensive (Loss) | | | | | | |
| Balance, beginning of year | | (106,364) | | | (129,477) | | | (90,335) | |
| Foreign currency translation adjustment, net of tax | | (10,587) | | | 14,033 | | | (45,993) | |
| Changes in employee benefit related items, net of tax | | 6,370 | | | 9,080 | | | 6,851 | |
| | | | | | |
| | | | | | |
| Balance, end of year | | (110,581) | | | (106,364) | | | (129,477) | |
| Total Partners' Capital attributable to AB Unitholders | | 4,873,295 | | | 4,448,790 | | | 4,465,033 | |
| Non-redeemable Non-controlling Interests in Consolidated Entities | | | | | | |
| Balance, beginning of year | | 4,572 | | | 12,607 | | | — | |
| CarVal acquisition | | — | | | — | | | 12,607 | |
| Net income | | 3,940 | | | 743 | | | — | |
| | | | | | |
| Distributions to non-controlling interests, net | | (7,164) | | | (8,514) | | | — | |
| Adjustment | | — | | | (264) | | | — | |
| Balance, end of year | | 1,348 | | | 4,572 | | | 12,607 | |
| Total Capital | | $ | 4,874,643 | | | $ | 4,453,362 | | | $ | 4,477,640 | |
See Accompanying Notes to Consolidated Financial Statements.
| | |
| AllianceBernstein L.P. and Subsidiaries |
|
Consolidated Statements of Cash Flows
| | | | | | | | | | | | | | | | | | | | | | |
| Years Ended December 31 | | |
| 2024 | 2023 | 2022 | | |
| (in thousands) | | |
| Cash flows from operating activities: | | | | | | | | |
| Net income | | $ | 1,193,485 | | | $ | 788,619 | | | $ | 775,457 | | | |
| Adjustments to reconcile net income to net cash provided by operating activities: | | | | | | | | |
| Amortization of deferred sales commissions | | 57,983 | | | 36,817 | | | 34,762 | | | |
| Non-cash long-term incentive compensation expense | | 217,220 | | | 180,451 | | | 199,390 | | | |
| Depreciation and other amortization | | 91,126 | | | 92,113 | | | 66,617 | | | |
| Unrealized (gains) losses on investments | | (5,503) | | | (7,810) | | | 40,857 | | | |
| Equity in earnings of equity method investments | | 36,551 | | | — | | | — | | | |
| Unrealized (gains) losses on investments of consolidated company-sponsored investment funds | | (15,898) | | | (48,350) | | | 73,194 | | | |
| | | | | | | | |
| | | | | | | | |
| Non-cash lease expense | | 112,458 | | | 101,761 | | | 99,861 | | | |
| (Gain) on divestiture | | (134,555) | | | — | | | — | | | |
| (Gain) loss on assets held for sale | | — | | | (800) | | | 7,400 | | | |
| Remeasurement of contingent payment arrangements | | (130,901) | | | 14,050 | | | — | | | |
| Retirement plan loss | | 14,309 | | | — | | | — | | | |
| Other, net | | 28,424 | | | (4,641) | | | 14,604 | | | |
| Changes in assets and liabilities: | | | | | | | | |
| | | | | | | | |
| Decrease (increase) in securities, segregated | | 367,634 | | | 654,751 | | | (18,474) | | | |
| (Increase) decrease in receivables | | (199,288) | | | 629,204 | | | 35,410 | | | |
| Decrease (Increase) in investments | | 7,238 | | | (10,656) | | | (10,331) | | | |
| (Increase) in deferred sales commissions | | (153,316) | | | (71,941) | | | (12,113) | | | |
| Decrease (increase) in other assets | | 13,052 | | | (36,263) | | | (5,487) | | | |
| Decrease in investments of consolidated company-sponsored investment funds | | 272,280 | | | 167,712 | | | 23,295 | | | |
| Decrease (Increase) in other assets of consolidated company-sponsored investment funds | | 10,498 | | | 19,125 | | | (13,961) | | | |
| (Decrease) in other liabilities of consolidated company-sponsored investment funds, net | | (10,821) | | | (42,992) | | | (31,471) | | | |
| (Decrease) increase in payables | | (388,594) | | | (1,451,280) | | | 110,112 | | | |
| | | | | | | | |
| Increase (decrease) in accounts payable and accrued expenses | | 86,999 | | | (6,992) | | | (8,424) | | | |
| Increase (decrease) in accrued compensation and benefits | | 26,113 | | | (22,848) | | | (150,285) | | | |
| Cash payments to relieve operating lease liabilities | | (90,190) | | | (107,738) | | | (109,182) | | | |
| Net cash provided by operating activities | | 1,406,304 | | | 872,292 | | | 1,121,231 | | | |
| | | | | | | | |
| Cash flows from investing activities: | | | | | | | | |
| Purchases of furniture, equipment and leasehold improvements | | (122,330) | | | (33,627) | | | (62,308) | | | |
| | | | | | | | |
| Divestiture of business (includes $304.0 million in cash proceeds) | | (40,196) | | | — | | | — | | | |
| Capital contributions to equity method investments | | (39,401) | | | — | | | — | | | |
| Debt repayments from equity method investments | | 86,200 | | | — | | | — | | | |
| | | | | | | | |
| | | | | | | | |
| Acquisition of businesses, net of cash acquired | | — | | | — | | | 40,282 | | | |
| Net cash used in investing activities | | (115,727) | | | (33,627) | | | (22,026) | | | |
| | | | | | | | |
| | | | | | | | |
| Cash flows from financing activities: | | | | | | | | |
| (Repayment) Proceeds from debt, net | | (444,316) | | | 164,316 | | | 235,000 | | | |
| (Decrease) increase in overdrafts payable | | (11) | | | — | | | (25,411) | | | |
| Distributions to General Partner and Unitholders | | (954,464) | | | (839,271) | | | (1,069,820) | | | |
| | | | | | | | |
| (Redemptions) subscriptions of non-controlling interests of consolidated company-sponsored investment funds, net | | (181,169) | | | (183,245) | | | 3,843 | | | |
| Capital contributions (to) from AB Holding | | (770) | | | (2,164) | | | 1,590 | | | |
| | | | | | | | |
| Additional investments by AB Holding with proceeds from exercise of compensatory options to buy AB Holding Units | | — | | | — | | | 178 | | | |
| Purchases of AB Holding Units to fund long-term incentive compensation plan awards, net | | (157,038) | | | (144,086) | | | (210,568) | | | |
| Proceeds from issuance of private units to EQH | | 150,000 | | | — | | | — | | | |
| Payment of acquisition-related debt obligation | | — | | | — | | | (42,661) | | | |
| Other, net | | (9,362) | | | (4,870) | | | (2,131) | | | |
| Net cash used in financing activities | | (1,597,130) | | | (1,009,320) | | | (1,109,980) | | | |
| Effect of exchange rate changes on cash and cash equivalents | | (20,303) | | | 22,527 | | | (56,234) | | | |
| Net (decrease) in cash and cash equivalents | | (326,856) | | | (148,128) | | | (67,009) | | | |
| Cash and cash equivalents as of beginning of the period | | 1,160,889 | | | 1,309,017 | | | 1,376,026 | | | |
| Cash and cash equivalents as of end of the period | | $ | 834,033 | | | $ | 1,160,889 | | | $ | 1,309,017 | | | |
| | | | | | | | |
| Cash paid: | | | | | | | | |
| Interest paid | | $ | 125,839 | | | $ | 155,335 | | | $ | 78,434 | | | |
| Income taxes paid | | 51,799 | | | 57,216 | | | 55,473 | | | |
| | | | | | | | |
| Non-cash investing activities: | | | | | | | | |
| Fair value of assets acquired (excluding cash acquired of zero , zero and $40.8 million, for 2024, 2023 and 2022, respectively) | | $ | — | | | $ | — | | | $ | 1,085,141 | | | |
| Fair value of deferred tax asset recorded | | — | | | — | | | 5,072 | | | |
| Fair value of liabilities assumed | | — | | | — | | | 296,750 | | | |
| Fair value of non-redeemable non-controlling interest recorded | | — | | | — | | | 13,191 | | | |
| Non-cash financing activities: | | | | | | | | |
| Payables recorded under contingent payment arrangements | | $ | — | | | $ | — | | | $ | 231,385 | | | |
| Equity consideration issued in connection with acquisition | | — | | | — | | | 589,169 | | | |
| Retirement of AB Units for EQH Exchange Agreement | | (185,101) | | | — | | | — | | | |
| Issuance of AB Units for EQH Exchange Agreement | | 185,101 | | | — | | | — | | | |
See Accompanying Notes to Consolidated Financial Statements.
| | |
| AllianceBernstein L.P. and Subsidiaries |
|
Notes to Consolidated Financial Statements
The words “we” and “our” refer collectively to AllianceBernstein L.P. and its subsidiaries (“AB”), or to their officers and employees. Similarly, the word “company” refers to AB. Cross-references are in italics.
1. Business Description and Organization1
We provide diversified investment management, research and related services globally to a broad range of clients. Our principal services include:
•Institutional Services—servicing our institutional clients, including private and public pension plans, foundations and endowments, insurance companies, central banks and governments worldwide, and affiliates such as Equitable Holdings, Inc. ("EQH") and its subsidiaries, by means of separately managed accounts, sub-advisory relationships, structured products, collective investment trusts, mutual funds, hedge funds and other investment vehicles.
•Retail Services—servicing our retail clients, primarily by means of retail mutual funds sponsored by AB or an affiliated company, sub-advisory relationships with mutual funds sponsored by third parties, separately managed account programs sponsored by financial intermediaries worldwide and other investment vehicles.
•Private Wealth Management Services—servicing our private clients, including high-net-worth individuals and families, trusts and estates, charitable foundations, partnerships, private and family corporations, and other entities, by means of separately managed accounts, hedge funds, mutual funds and other investment vehicles.
We also provide distribution, shareholder servicing, transfer agency services and administrative services to the mutual funds we sponsor.
Our high-quality, in-depth research is the foundation of our asset management and private wealth management businesses. Our research disciplines include economic, fundamental equity, fixed income and quantitative research. In addition, we have expertise in multi-asset strategies, wealth management, environmental, social and corporate governance ("ESG"), and alternative investments.
We provide a broad range of investment services with expertise in:
•Actively managed equity strategies across global and regional universes, as well as capitalization ranges, concentration ranges and investment strategies, including value, growth and core equities;
•Actively managed traditional and unconstrained fixed income strategies, including taxable and tax-exempt strategies;
•Actively managed alternative investments, including fundamental and systematically-driven hedge funds, fund of hedge funds and direct assets (e.g., direct lending, real estate debt and private equity);
•Portfolios with Purpose, including Sustainable, Impact and Responsible+ (Climate-Conscious and ESG leaders) equity, fixed income and multi-asset strategies that address our clients' desire to invest their capital with a dedicated ESG focus, while pursuing strong investment returns;
•Multi-asset services and solutions, including dynamic asset allocation, customized target-date funds and target-risk funds; and
•Passively managed equity and fixed income strategies, including index, ESG index and enhanced index strategies.
(1)April 1, 2024 AB and Societe Generale, a leading European bank, completed their transaction to form a jointly owned equity research provider and cash equity trading partner for institutional investors. AB has deconsolidated the Bernstein Research Services business and contributed the business to the joint venture. For further discussion, see Note 24 Divestiture.
Organization
AllianceBernstein Corporation (an indirect wholly-owned subsidiary of EQH, “General Partner”) is the general partner of both AllianceBernstein Holding L.P. (“AB Holding”) and AB. AllianceBernstein Corporation owns 100,000 general partnership units in AB Holding and a 1.0% general partnership interest in AB.
As of December 31, 2024, the ownership structure of AB, including limited partnership units outstanding as well as the general partner's 1.0% interest, was as follows:
| | | | | |
| EQH and its subsidiaries | 61.9 | % |
| AB Holding | 37.5 | |
| Unaffiliated holders | 0.6 | |
| 100.0 | % |
2. Summary of Significant Accounting Policies
Basis of Presentation
The consolidated financial statements have been prepared in accordance with accounting principles generally accepted in the United States of America ("US GAAP"). The preparation of the consolidated financial statements requires management to make certain estimates and assumptions that affect the reported amounts of assets and liabilities and disclosure of contingent assets and liabilities at the dates of the consolidated financial statements and the reported amounts of revenues and expenses during the reporting periods. Actual results could differ from those estimates.
Principles of Consolidation
The consolidated financial statements include AB and its majority-owned and/or controlled subsidiaries, and the consolidated entities that are considered to be variable interest entities ("VIEs") and voting interest entities ("VOEs") in which AB has a controlling financial interest. Non-controlling interests on the consolidated statements of financial condition include the portion of consolidated company-sponsored investment funds in which we do not have direct equity ownership. All significant inter-company transactions and balances among the consolidated entities have been eliminated.
Recently Adopted Accounting Pronouncements or Accounting Pronouncements
Not Yet Adopted
Recently Adopted Accounting Pronouncements
In November 2023, Financial Accounting Standards Board (“FASB”) issued ASU 2023-07, Segment Reporting (Topic 280): Improvements to Reportable Segment Disclosures, which required disclosure of incremental segment information on an annual and interim basis. This ASU is effective for fiscal years beginning after December 15, 2023, and interim periods within fiscal years beginning after December 15, 2024, and requires retrospective application to all prior periods presented in the financial statements. We adopted this standard effective for our financial statements issued for fiscal year ended December 31, 2024. The adoption of this standard did not have a material impact on our financial condition or results of operations.
Accounting Pronouncements Not Yet Adopted
In December 2023, the FASB issued ASU 2023-09, Income Taxes (Topic 740): Improvements to Income Tax Disclosures. This amendment is expected to enhance the transparency and decision usefulness of income tax disclosures by requiring public business entities, on an annual basis, to disclose specific categories in the rate reconciliation, additional information for reconciling items that meet a quantitative threshold and certain information about income taxes paid. This revised guidance is effective for financial statements issued for fiscal years beginning after December 15, 2024. The revised guidance will not have a material impact on our financial condition or results of operations.
In November 2024, the FASB issued ASU 2024-03, Income Statement - Reporting Comprehensive Income - Expense Disaggregation Disclosures (Subtopic 220-40): Disaggregation of Income Statement Expenses. This amendment is expected to improve financial reporting by requiring that public business entities disclose additional information about specific expense categories in the notes to financial statements at interim and annual reporting periods. This information is not generally presented in the financial statements today. The amendments in this update do not change or remove current expense disclosure requirements. This ASU is effective for annual reporting periods beginning after December 15, 2026, and interim reporting periods beginning after December 15, 2027. Early adoption is permitted. The amendments in this update should be applied either prospectively to financial statements issued for reporting periods after the effective date of this update or retrospectively to any or all periods presented in the financial statements. We are currently evaluating the impacts of the new standard.
Revenue Recognition
| | |
|
| Investment Advisory and Services Fees |
|
AB provides asset management services by managing customer assets and seeking to deliver investment returns to investors. Each investment management contract between AB and a customer creates a distinct, separately identifiable performance obligation for each day the customer’s assets are managed as the customer can benefit from each day of service. In accordance with ASC 606, a series of distinct goods and services that are substantially the same and have the same pattern of transfer to the customer are treated as a single performance obligation. Accordingly, we have determined that our investment and advisory services are performed over time and entitle us to variable consideration earned based on the value of the investors’ assets under management (“AUM”).
We calculate AUM using established market-based valuation methods and fair valuation (non-observable market) methods. Market-based valuation methods include: last sale/settle prices from an exchange for actively-traded listed equities, options and futures; evaluated bid prices from recognized pricing vendors for fixed income, asset-backed or mortgage-backed issues; mid prices from recognized pricing vendors and brokers for credit default swaps; and quoted bids or spreads from pricing vendors and brokers for other derivative products. Fair valuation methods include: discounted cash flow models or any other methodology that is validated and approved by our Valuation Committee (see paragraph immediately below for additional information about our Valuation Committee). Fair valuation methods are used only where AUM cannot be valued using market-based valuation methods, such as in the case of private equity or illiquid securities.
The Valuation Committee, which consists of senior officers and employees, is responsible for overseeing the pricing and valuation of all investments held in client and AB portfolios. The Valuation Committee has adopted a Statement of Pricing Policies describing principles and policies that apply to pricing and valuing investments held in these portfolios. We also have a Pricing Group, which reports to the Valuation Committee and is responsible for overseeing the pricing process for all investments. We record as revenue investment advisory and services base fees, which we generally calculate as a percentage of AUM. At month-end, all the components of the transaction price (i.e., the base fee calculation) are no longer variable and the value of the consideration is determined. These fees are not subject to claw back and there is minimal probability that a significant reversal of the revenue recorded will occur.
The transaction price for the asset management performance obligation for certain investment advisory contracts, including those associated with hedge funds and other alternative investments, provide for a performance-based fee (including carried interest), in addition to a base advisory fee, which is calculated as either a percentage of absolute investment results or a percentage of investment results in excess of a stated benchmark over a specified period of time. The performance-based fees are forms of variable consideration and are therefore excluded from the transaction price until it becomes probable that there will not be significant reversal of the cumulative revenue recognized. At each reporting date, we evaluate the constraining factors, discussed below, surrounding the variable consideration to determine the extent to which, if any, revenues associated with the performance-based fee can be recognized.
Constraining factors impacting the amount of variable consideration included in the transaction price include: the contractual claw-back provisions to which the variable consideration is subject, the length of time to which the uncertainty of the consideration is subject, the number and range of possible consideration amounts, the probability of significant fluctuations in the AUM market value and the level at which the AUM value exceeds the contractual threshold required to earn such a fee.
| | |
|
| Bernstein Research Services |
|
Bernstein Research Services revenue consists principally of commissions received, and to a lesser but increasing extent, direct payments for trade execution services and equity research services provided to institutional clients. Brokerage commissions for trade execution services and related expenses are recorded on a trade-date basis when the performance obligations are satisfied. Generally, the transaction price is agreed upon at the time of each trade and is based upon the number of shares traded or the value of the consideration traded. The transaction price for research revenues is not fixed and is at the customer's discretion. In many cases there is no contract between AB and the customer for research services, so there is no performance obligation present that requires AB to provide the research or for the customer to compensate AB for the research consumed. The customer has the unilateral right to determine the amount it will pay and whether it will continue to receive research. Research revenues are recognized when the transaction price is quantified, collectability is assured and significant reversal of such revenue is not probable.
Effective April 1, 2024, AB deconsolidated the Bernstein Research Services business ("BRS"). For further discussion, see Note 24 Divestiture to our consolidated financial statements contained in Item 8.
Two of our subsidiaries act as distributors and/or placement agents of company-sponsored mutual funds and receive distribution services fees from certain of those funds as full or partial reimbursement of the distribution expenses they incur. The variable consideration can be determined in different ways, as discussed below, as we satisfy the performance obligation depending on the contractual arrangements with the customer and the specific product sold.
Most open-end U.S. funds have adopted a plan under Rule 12b-1 of the Investment Company Act that allows the fund to pay, out of assets of the fund, distribution and service fees for the distribution and sale of its shares (“12b-1 fees”). The open-end U.S. funds have such agreements with us, and we have selling and distribution agreements pursuant to which we pay sales commissions to the financial intermediaries that distribute our open-end U.S. funds. These agreements are terminable by either party upon notice (generally 30 days) and do not obligate the financial intermediary to sell any specific amount of fund shares.
We record 12b-1 fees monthly based upon a percentage of the net asset value (“NAV”) of the funds. At month-end, the variable consideration of the transaction price is no longer constrained as the NAV can be calculated and the value of consideration is determined. These services are separate and distinct from other asset management services as the customer can benefit from these services independently of other services. We accrue the corresponding 12b-1 fees paid to sub-distributors monthly as the expenses are incurred. We are acting in a principal capacity in these transactions; as such, these revenues and expenses are recorded on a gross basis.
We offer back-end load shares in limited instances and charge the investor a contingent deferred sales charge (“CDSC”) if the investment is redeemed within a certain period. The variable consideration for these contracts is contingent on the timing of the redemption by the investor and the value of the sale proceeds. Due to these constraining factors, we exclude the CDSC fee from the transaction price until the investor redeems the investment. Upon redemption, the cash consideration received for these contractual arrangements are recorded as reductions of unamortized deferred sales commissions.
Our Luxembourg subsidiary, the management company for most of our non-U.S. funds, earns a management fee that is accrued daily and paid monthly, at an annual rate, based on the average daily net assets of the fund. With respect to certain share classes, the management fee may also contain a component that is paid to distributors and other financial intermediaries and service providers to cover shareholder servicing and other administrative expenses (also referred to as an All-in-management-fee). As we have concluded that asset management is distinct from distribution, we allocate a portion of the investment and advisory fee to distribution revenues for the servicing component based on standalone selling prices.
Revenues from contracts with customers include a portion of other revenues, which consists primarily of shareholder servicing fees, as well as mutual fund reimbursements and other brokerage income.
We provide shareholder services, which include transfer agency, administrative and recordkeeping services provided to company-sponsored mutual funds. The consideration for these services is based on a percentage of the NAV of the fund or a fixed fee based on the number of shareholder accounts being serviced. The revenues are recorded at month-end when the constraining factors involved with determining NAV or the number of shareholders’ accounts are resolved.
Dividend and interest income is accrued as earned. Investment gains and losses on the consolidated statements of income include unrealized gains and losses of trading and private equity investments stated at fair value, equity in earnings of our limited partnership hedge fund investments, realized gains and losses on investments sold and equity income (loss) related our equity investment in JVs.
| | |
|
| Contract Assets and Liabilities |
|
We use the practical expedient for contracts that have an original duration of one year or less. Accordingly, we do not consider the time value of money and, instead, accrue the incremental costs of obtaining the contract when incurred. As of December 31, 2024, the balances of contract assets and contract liabilities are not considered material and, accordingly, no further disclosures are necessary.
Consolidation of Company-Sponsored Investment Funds
For legal entities (company-sponsored investment funds) evaluated for consolidation, we first determine whether the fees we receive and the interests we hold qualify as a variable interest in the entity, including an evaluation of fees paid to us as a decision maker or service provider to the entity being evaluated. Fees received by us are not variable interests if (i) the fees are compensation for services provided and are commensurate with the level of effort required to provide those services, (ii) the service arrangement includes only terms, conditions or amounts that are customarily present in arrangements for similar services negotiated at arm’s length, and (iii) our other economic interests in the entity held directly and indirectly through our related parties, as well as economic interests held by related parties under common control, would not absorb more than an insignificant amount of the entity’s losses or receive more than an insignificant amount of the entity’s benefits. For purposes of determining whether AB has an equity interest in an entity, the related parties referred to above are those entities under common control that AB has a direct variable interest in and considered a consolidated entity. Our parent company, EQH, regularly invests in our seed program. In this circumstance, EQH is not considered a related party for our consolidation analysis because AB does not have a direct variable interest in EQH.
For those entities in which we have a variable interest, we perform an analysis to determine whether the entity is a VIE by considering whether the entity’s equity investment at risk is insufficient, whether the investors lack decision making rights proportional to their ownership percentage of the entity, and whether the investors lack the obligation to absorb an entity’s expected losses or the right to receive an entity’s expected income.
A VIE must be consolidated by its primary beneficiary, which generally is defined as the party that has a controlling financial interest in the VIE. We are deemed to have a controlling financial interest in a VIE if we have (i) the power to direct the activities of the VIE that most significantly affect the VIE's economic performance and (ii) the obligation to absorb losses of the VIE or the right to receive income from the VIE that could potentially be significant to the VIE. For purposes of evaluating (ii) above, fees paid to us as a decision maker or service provider are excluded if the amount of fees is commensurate with the level of effort required to be performed and the arrangement includes only customary terms, conditions or amounts present in arrangements for similar services negotiated at arm’s length. The primary beneficiary evaluation generally is performed qualitatively based on all facts and circumstances, as well as quantitatively, as appropriate.
If we have a variable interest in an entity that is determined not to be a VIE, the entity is then evaluated for consolidation under the VOE model. For limited partnerships and similar entities, we are deemed to have a controlling financial interest in a VOE, and would be required to consolidate the entity, if we own a majority of the entity’s kick-out rights through voting limited partnership interests and limited partners do not hold substantive participating rights (or other rights that would indicate that we do not control the entity). For entities other than limited partnerships, we are deemed to have a controlling financial interest in a VOE if we own a majority voting interest in the entity.
The analysis performed regarding the determination of variable interests held, whether entities are VIEs or VOEs, and whether we have a controlling financial interest in such entities, requires the exercise of judgment. The analysis is updated continuously as circumstances change or new entities are formed.
Investments in Unconsolidated Joint Ventures
Effective April 1, 2024, AB and Societe Generale ("SocGen") completed their previously announced transaction to form a global joint venture with two joint venture holding companies, one outside of North America and one within North America ("NA JV", and together the "JVs"). AB owns a majority interest in the NA JV while SocGen owns a majority interest in the joint venture outside of North America.
On April 1, 2024, we deconsolidated our BRS business and contributed the BRS business to the JVs. We recognize our initial investment in our unconsolidated joint ventures at fair value. The determination of fair values of assets and liabilities of the joint ventures requires us to make estimates, consider assumptions and use valuation techniques when a market value is not readily determinable. The valuation methodology used for our initial investment in the joint ventures is known as a dividend discount model whereby a forecast of net income attributable to each of the JVs was discounted using an estimated cost of capital to determine the present value of expected future dividends. The joint venture dividend discount model includes significant assumptions such as expected future distributable earnings, discount rate and a long term growth rate. We recorded an initial investment in the JVs at fair value as of April 1, 2024 of $283.9 million.
We have recorded our subsequent investment in each of the JVs under the equity method of accounting under ASC 323 Investments – Equity Method and Joint Ventures, as we retained the ability to exercise significant influence over the operating and financial policies of the JVs but did not retain a controlling interest. Our investments in companies over which we have the ability to exercise significant influence are accounted for under the equity method and are recorded at cost plus our share of earnings and losses. As of December 31, 2024, we owned 66.7% of the NA JV and 49.0% of the joint venture outside of North America and our combined carrying value in the two investments was 286.7 million.
Our investments in unconsolidated joint ventures are reviewed for indicators of impairment when events or circumstances change indicating that a decline in the fair values below the carrying amounts has occurred and such decline is other-than-temporary. An extended series of net operating losses of an investee, inability to operate without significant future capital infusions, or other factors may indicate that a loss in the value of our investment in the unconsolidated joint venture may have occurred. If a loss exists, we further review to determine if the loss is other than temporary, in which case we will record an impairment charge in the amount of the excess carrying value over the estimated fair value. As we do not have a controlling financial interest in the JVs, the fair value of the JVs would be determined at the joint venture level using a dividend discount model which is subjective and considers assumptions regarding future performance, as discussed above, that could differ materially from actual results in future periods. As of December 31, 2024 there was no triggering event identified requiring an impairment analysis of our investment in our unconsolidated JVs.
Cash and Cash Equivalents
Cash and cash equivalents include cash on hand, demand deposits, money market accounts, overnight commercial paper and highly liquid investments with original maturities of three months or less. Due to the short-term nature of these instruments, the recorded value has been determined to approximate fair value (and considered Level 1 securities in the fair value hierarchy).
Fees Receivable, Net
Fees receivable are shown net of allowances. An allowance for doubtful accounts related to investment advisory and services fees is determined through an analysis of the aging of receivables, assessments of collectability based on historical trends and other qualitative and quantitative factors, including our relationship with the client, the financial health (or ability to pay) of the client, current economic conditions and whether the account is active or closed. The allowance for doubtful accounts is not material to fees receivable.
Brokerage Transactions
Customers’ securities transactions are recorded on a settlement date basis, with related commission income and expenses reported on a trade date basis. Receivables from and payables to clients include amounts due on cash and margin transactions. Securities owned by customers are held as collateral for receivables; such collateral is not reflected in the consolidated financial statements. We have the ability by contract or custom to sell or re-pledge this collateral and have done so at various times. As of December 31, 2024 and 2023, we had zero and $122.4 million of re-pledged securities, respectively. Principal securities transactions and related expenses are recorded on a trade date basis.
Securities borrowed and securities loaned by our broker-dealer subsidiaries are recorded at the amount of cash collateral advanced or received in connection with the transaction and are included in receivables from and payables to brokers and dealers in the consolidated statements of financial condition. Securities borrowed transactions require us to deposit cash collateral with the lender. With respect to securities loaned, we receive cash collateral from the borrower. See Note 8 Offsetting Assets and Liabilities for securities borrowed and loaned amounts recorded in our consolidated statements of financial condition as of December 31, 2024 and 2023. The initial collateral advanced or received approximates or is greater than the fair
value of securities borrowed or loaned. We monitor the fair value of the securities borrowed and loaned on a daily basis and request additional collateral or return excess collateral, as appropriate. As of December 31, 2024 and 2023, there is no allowance provision required for the collateral advanced. Income or expense is recognized over the life of the transaction.
As of December 31, 2024 and 2023, we had $29.1 million and $10.2 million, respectively, of cash on deposit with clearing organization for trade facilitation purposes, which are reported in other assets in our consolidated statements of financial condition. As of December 31, 2024 and 2023, we held no U.S. Treasury bills pledged as collateral. These clearing organizations have the ability by contract or custom to sell or re-pledge the collateral, if any.
Current Expected Credit Losses- Receivables from Brokerage clients
Receivables from clients primarily consists of margin loan balances. The value of the securities owned by clients and held as collateral for these receivables is not reflected in the consolidated financial statements and the collateral was not repledged as of December 31, 2024 and 2023. We consider these financing receivables to be of good credit quality because these receivables are primarily collateralized by the related client investments.
To estimate expected credit losses on margin loans, we applied the collateral maintenance practical expedient by comparing the amortized cost basis of the margin loans with the fair value of the collateral at the reporting date. Margin loans are limited to a percentage of the total value of the securities held in the client's account against those loans. AB requires, in the event of a decline in the market value of the securities in a margin account, the client to deposit additional securities or cash so that, at all times, the value of the securities in the account, at a minimum, cover the loan to the client. As such, AB reasonably expects that the borrower will be able to continually replenish collateral securing the financial asset and does not expect the fair value of collateral to fall below the amortized cost basis of the margin loans and, as a result, we consider the credit risk associated with these receivables to be minimal. In circumstances when a loan becomes undercollateralized and the client fails to deposit additional securities or cash, AB reserves the right to liquidate the account.
Current Expected Credit Losses - Receivables from Revenue Contracts with Customers
The majority of our revenue receivables are from investment advisory and service fees, and distribution revenues, that are typically paid out of the client accounts or third-party products consisting of cash and securities. Due to the size of the fees in relation to the value of the cash and securities in accounts or funds, the account value always exceeds the amortized cost basis of the receivables, resulting in a remote risk of loss. These receivables have a short duration, generally due within 30-90 days and there is minimal historical evidence of non-payment or market declines that would cause the fair value of the underlying securities to decline below the amortized cost of the receivables. AB maintains an allowance for credit losses based upon an estimate of the amount of potential credit losses in existing accounts receivable, as determined from a review of aging schedules, past due balances, historical collection experience and other specific account data. Once determined uncollectible, aged balances are written off as credit loss expense. This determination is based on careful analysis of individual receivables and aging schedules, and generally occurs when the receivable becomes over 360 days past due. Our aged receivables and amounts written off related to credit losses in any year are not material.
Furniture, Equipment and Leasehold Improvements, Net
Furniture, equipment and leasehold improvements are stated at cost, less accumulated depreciation and amortization. Depreciation is recognized on a straight-line basis over the estimated useful lives of eight years for furniture and three to six years for equipment and software. Leasehold improvements are amortized on a straight-line basis over the lesser of their estimated useful lives or the terms of the related leases.
Goodwill
Our acquisitions are accounted for under the acquisition method of accounting under ASC 805 Business Combinations, where the cost of the acquisition is allocated on the basis of the estimated fair value of the assets acquired and the liabilities assumed. The excess of the purchase price over the fair value of identifiable assets acquired, net of liabilities assumed, results in the recognition of goodwill.
As of December 31, 2024, we had goodwill of $3.6 billion on the consolidated statement of financial condition which included $666.1 million as a result of the CarVal L.P. Investors ("CarVal") acquisition in 2022 ("CarVal acquisition"), $2.6 billion as a result of the Sanford C. Bernstein Inc. (“Bernstein”) acquisition in 2000 and $291.9 million in regard to various smaller acquisitions. As a result of the BRS deconsolidation, approximately $159.8 million of goodwill, which was previously reclassified to held for sale assets, has been contributed to the JVs.
Goodwill is tested annually, as of September 30, for impairment utilizing the market approach where the fair value of the reporting unit is based on its unadjusted market valuation (AB Units outstanding multiplied by AB Holding's Unit price) and adjusted market valuations assuming a control premium (when applicable). A goodwill impairment would be the amount by which a reporting unit's carrying value exceeds its fair value, not to exceed the carrying amount of goodwill. The goodwill
impairment test does not include a determination by management of whether a decline in fair value is temporary and it is important that management's determination of fair value reflect the impact of changing market conditions, including the severity and anticipated duration of any such changes.
As a part of our goodwill impairment evaluation, management uses the price of a publicly traded AB Holding Unit as a reasonable starting point for valuing an AB Unit because each represents the same fractional interest in our underlying business. Throughout the year, the carrying value of goodwill is also reviewed for impairment if certain events or changes in circumstances occur and trigger whether an interim impairment test may be required. Such changes in circumstances may include, but are not limited to, significant transactions including acquisitions or divestitures; a sustained decrease in the price of an AB Holding Unit or declines in AB’s market capitalization that would suggest that the fair value of the reporting unit is less than the carrying amount; significant and unanticipated declines in AB’s assets under management or revenues; and/or lower than expected earnings per unit. Any of these changes in circumstances could suggest the possibility that goodwill is impaired, but none of these events or circumstances by itself would indicate that it is more likely than not that goodwill is impaired. Instead, they are merely recognized as triggering events for the consideration of impairment and must be viewed in combination with any mitigating or positive factors. A holistic evaluation of all events since the most recent quantitative impairment test must be done to determine whether it is more likely than not that the reporting unit is impaired. As of September 30, 2024, the impairment test indicated that goodwill was not impaired.
Business Combinations
We account for business combinations using the acquisition method of accounting under ASC 805 Business Combinations, whereby the identifiable assets and liabilities of the acquired business, as well as any non-controlling interest in the acquired business, are recorded at their estimated fair values as of the date that we obtain control of the acquired business. Any purchase consideration in excess of the estimated fair values of the net assets acquired is recorded as goodwill. Acquisition-related expenses are expensed as incurred.
Often, as part of the business combination, intangible assets are recorded based on their estimated fair value at the time of acquisition and primarily relate to acquired investment management contracts. We periodically review indefinite-lived intangible assets for impairment as events or changes in circumstances indicate that the carrying value may not be recoverable. If the carrying value exceeds fair value, we perform additional impairment tests to measure the amount of the impairment loss, if any. During 2024, 2023 and 2022, these expenses included an intangible asset impairment charge of $4.4 million, zero, and $5.6 million , respectively, related to various historical acquisitions.
We periodically enter into contingent payment arrangements in connection with our business combinations. In these arrangements, we agree to pay additional consideration to the sellers to the extent that certain performance targets are achieved. We estimate the fair value of these potential future obligations at the time a business combination is consummated and record a liability on a discounted basis on our consolidated statement of financial condition. We then accrete the obligation to its expected payment amount over the measurement period. If our expected payment amount subsequently changes, the obligation is modified in the current period resulting in a gain or loss. Both gains and losses resulting from changes to expected payments and the accretion of these obligations to their expected payment amounts are reflected within contingent payment arrangements in our consolidated statements of income.
During 2022, we acquired CarVal Investors which included a contingent consideration liability ranging from zero to $650.0 million and is based on CarVal achieving certain performance objectives over a six-year period ending December 31, 2027. During 2024, we remeasured the contingent liability and recorded a gain reflected within contingent payment arrangements in the consolidated statements of income of $128.5 million. The fair value of the contingent consideration was remeasured using forecasted future cash flows using the Real Options valuation methodology. The most significant assumptions used to remeasure the liability were expected revenue growth rates and discount rates. In December 2024, the company agreed to finalize its contingent consideration liability with AB CarVal for a value of $134.0 million. This liability will be paid predominantly in AB Units issued within 10 days of December 31, 2027. Given the liability is no longer contingent, the liability of approximately $118.8 million is now recorded in accounts payable and accrued expenses on the consolidated statements of financial condition. We will accrete the present value of the liability of $118.8 million up to $134.0 million through December 31, 2027 and recognize this expense as general and administrative expenses on the consolidated statements of income on a prospective basis. As of December 31, 2023, the contingent consideration payable associated with the CarVal acquisition was $238.5 million. In addition, during 2024, we recorded an impairment of $2.5 million of the contingent consideration payable associated with a small acquisition made in 2020 due to the loss of investment management contracts.
During 2023, we recorded an expense of $28.4 million due to a change in estimate related to the contingent consideration associated with the acquisition of Autonomous LLC in 2019. The change in estimate was based upon better than expected revenues during the 2023 performance evaluation period. We recorded $14.1 million as contingent payment arrangement expense and $14.3 million as compensation and benefits expense in the consolidated statement of income. The charges to compensation and benefits expense are due to certain service conditions and special awards included in the acquisition agreement. During 2023 and 2022, there were no impairments of contingent consideration payable recorded in the consolidated statements of income.
Several valuation methods may be used to determine the fair value of assets acquired and liabilities assumed. For intangible assets, we typically use a method that is a form of the income approach, whereby a forecast of future cash flows attributable to the asset are discounted to present value using a risk-adjusted discount rate. Similarly for contingent liabilities, we develop a forecast of future cash flows attributable to the performance objectives that are then discounted to present value using a risk-adjusted discount rate. Some of the more significant estimates and assumptions inherent in the income approach include the amount and timing of projected future cash flows and the discount rate selected to measure the risks inherent in the future cash flows.
Intangible Assets, Net
Intangible assets consist primarily of costs assigned to acquired investment management contracts based on their estimated fair value at the time of acquisition, less accumulated amortization. Intangible assets are recognized at fair value and generally are amortized on a straight-line basis over their estimated useful life ranging from 5 to 20 years.
As of December 31, 2024, intangible assets, net of accumulated amortization, of $215.1 million on the consolidated statement of financial condition consists of $199.8 million of finite-lived intangible assets subject to amortization and $15.3 million of indefinite-lived intangible assets not subject to amortization.
As of December 31, 2023, intangible assets, net of accumulated amortization, of $264.6 million on the consolidated statement of financial condition consisted of $249.4 million of finite-lived intangible assets subject to amortization and $15.2 million of indefinite-lived intangible assets not subject to amortization in regard to other acquisitions.
The gross carrying amount of finite-lived intangible assets totaled $320.8 million as of December 31, 2024 and $328.4 million as of December 31, 2023, and accumulated amortization was $121.0 million as of December 31, 2024 and $79.0 million as of December 31, 2023.
Amortization expense was $45.9 million for 2024, $46.9 million for 2023 and $26.6 million for 2022. Estimated future annual amortization expense is approximately $45 million annually in year one and two and $24 million in years three through five.
We review indefinite-lived intangible assets for impairment when events or changes in circumstances indicate that the carrying value may not be recoverable. This test is performed at least annually or as triggering events occur. If the carrying value exceeds fair value, we perform an impairment assessment to measure the amount of the impairment loss, if any. During 2024, we performed an impairment assessment of our intangible assets. The impairment assessment indicated an impairment of intangible assets associated with various smaller historical acquisitions that were other than temporary. Due to the loss of certain investment management contracts, the carrying value of the finite-lived intangible assets exceeded the fair value of the contracts. As such, we recorded an impairment charge of $4.4 million in general and administrative expenses in the consolidated statements of income. The remaining impairment assessments indicated that our intangible assets were not impaired.
During the fourth quarter of 2023, the impairment assessment indicated that our intangible assets were not impaired.
During the fourth quarter of 2022, we recorded an impairment of $5.6 million related to our 2014 acquisition of CPH Capital. Due to the loss of acquired investment management contracts during the year, the carrying value of the finite-lived intangible assets exceeded the fair value of the contract. We determined the fair value of the contract using a discounted cash flow model. The impairment charge was recorded in general and administrative expenses in the consolidated statements of income.
Deferred Sales Commissions, Net
We pay commissions to financial intermediaries in connection with the sale of shares of open-end company-sponsored mutual funds sold without a front-end sales charge (“back-end load shares”). These commissions are capitalized as deferred sales commissions and amortized over periods not exceeding one year for U.S. fund shares and four years for Non-U.S. Fund shares, the periods of time during which deferred sales commissions generally are recovered. We recover these commissions from distribution services fees received from those funds and from CDSC received from shareholders of those funds upon the redemption of their shares. CDSC cash recoveries are recorded as reductions of unamortized deferred sales commissions when received. Since January 31, 2009, our U.S. mutual funds have not offered back-end load shares to new investors.
We periodically review the deferred sales commission asset for impairment as events or changes in circumstances indicate that the carrying value may not be recoverable. If these factors indicate impairment in value, we compare the carrying value to the undiscounted cash flows expected to be generated by the asset over its remaining life. If we determine the deferred sales commission asset is not fully recoverable, the asset will be deemed impaired and a loss will be recorded in the amount by which the recorded amount of the asset exceeds its estimated fair value. There were no impairment charges recorded during 2024 or 2023.
Leases
We determine if an arrangement is a lease at inception. Both operating and finance leases are included in the right-of-use (“ROU”) assets and lease liabilities in our consolidated statement of financial condition.
ROU assets represent our right to use an underlying asset for the lease term and lease liabilities represent our obligation to make lease payments arising from the lease. ROU assets and lease liabilities are recognized at commencement date based on the present value of lease payments over the lease term. We use our consolidated incremental borrowing rate based on the
information available as of the lease commencement date in determining the present value of lease payments. Our lease terms may include options to extend or terminate the lease. These options to extend or terminate are assessed on a lease-by-lease basis, and the ROU assets and lease liabilities are adjusted when it is reasonably certain that an option will be exercised.
When calculating the measurement of ROU assets and lease liabilities, we utilize the fixed payments associated with the lease and do not include other variable contractual obligations, such as operating expenses, real estate taxes, cleaning and utilities. These costs are accounted for as period costs and expensed as incurred.
Additionally, we exclude any intangible assets such as software licensing agreements as stated in ASC 842-10-15-1. These arrangements will continue to follow the guidance of ASC 350, Intangibles - Goodwill and Other.
Loss Contingencies
With respect to all significant litigation matters, we consider the likelihood of a negative outcome. If we determine the likelihood of a negative outcome is probable and the amount of the loss can be reasonably estimated, we record an estimated loss for the expected outcome of the litigation. Any such accruals are adjusted thereafter as appropriate to reflect changed circumstances. When we are able to do so, we also determine estimates of reasonably possible losses or ranges of reasonably possible losses for such matters, whether in excess of any related accrued liability or where there is no accrued liability, and we disclose an estimate of the possible loss or range of losses. However, it is often difficult to predict the outcome or estimate a possible loss or range of loss because litigation is subject to inherent uncertainties, particularly when plaintiffs allege substantial or indeterminate damages. Such is particularly the case when the litigation is in its early stages or when the litigation is highly complex or broad in scope. In these cases, we disclose that we are unable to predict the outcome or estimate a possible loss or range of loss.
Assets and Liabilities Held for Sale
The Company classifies assets and liabilities to be sold (disposal group) as held for sale in the period when all of the applicable criteria are met, including: (i) management commits to a plan to sell, (ii) the disposal group is available to sell in its present condition, (iii) there is an active program to locate a buyer, (iv) the disposal group is being actively marketed at a reasonable price in relation to its fair value, (v) significant changes to the plan to sell are unlikely, and (vi) the sale of the disposal group is generally probable of being completed within one year. Management performs an assessment of held for sale at least quarterly or when events or changes in business circumstances indicate that a change in classification may be necessary. Assets and liabilities held for sale are presented separately within the consolidated statements of financial condition with any adjustments necessary to measure the disposal group at the lower of its carrying value or fair value less costs to sell. Depreciation of property, plant and equipment and amortization of intangible and right-of-use assets are not recorded while these assets are classified as held for sale. For each reporting period the disposal group remains classified as held for sale, the carrying value of the disposal group is adjusted for subsequent changes in fair value less costs to sell. A loss is recognized for any subsequent decrease in fair value less costs to sell, while a gain is recognized in any subsequent period for any subsequent increase in fair value less cost to sell, but not in excess of the cumulative loss previously recognized. If, in any period, the carrying value of the disposal group exceeds the estimated fair value less costs to sell, a loss is recognized on sale rather than an impairment loss.
Effective April 1, 2024, AB and SocGen completed their previously announced transaction to form a global joint venture with two joint venture holding companies. We have deconsolidated our BRS business and contributed the assets and liabilities previously held for sale of the BRS business to the JVs.
Assets and liabilities classified as held for sale as of December 31, 2023 were $564.8 million and $153.3 million, respectively.
Mutual Fund Underwriting Activities
Purchases and sales of shares of company-sponsored mutual funds in connection with the underwriting activities of our subsidiaries, including related commission income, are recorded on the trade date. Receivables from brokers and dealers for sale of shares of company-sponsored mutual funds generally are realized within three business days from the trade date, in conjunction with the settlement of the related payables to company-sponsored mutual funds for share purchases. Distribution plan and other promotion and servicing payments are recognized as expense when incurred.
Long-term Incentive Compensation Plans
We maintain several unfunded, non-qualified long-term incentive compensation plans, under which we grant annual awards to employees, generally in the fourth quarter, and to members of the Board of Directors of the General Partner, who are not employed by our company or by any of our affiliates ("Eligible Directors").
Awards granted in December 2024, 2023 and 2022 allowed employees to allocate their awards between restricted units representing assignments of beneficial ownership of limited partnership interests in AllianceBernstein Holding L.P. (“AB Holding Units”) and deferred cash. Participants (except certain members of senior management) generally could allocate up to 50% of their awards to deferred cash, not to exceed a total of $250,000 per award. Each of our employees based outside
of the United States (other than expatriates), who received an award of $100,000 or less, could have allocated 100% of their award to deferred cash. Starting in December 2024, each of our employees based outside the United States (other than expatriates) generally could allocate up to 50% of their awards to deferred cash, not to exceed a total of $500,000, or 100% of their award to deferred cash for those who received an award of $500,000 or less. The number of AB Holding Units awarded was based on the closing price of an AB Holding Unit as of the eighth business day of December as determined by the Compensation and Workplace Practices Committee (the "Compensation Committee") of the Board of Directors (the "Board"). For awards granted in 2024, 2023 and 2022:
•We engaged in open-market purchases of AB Holding Units or purchase newly issued AB Holding Units from AB Holding that are awarded to participants and keep them in a consolidated rabbi trust.
•Quarterly distributions on vested and unvested AB Holding Units were paid to participants, regardless of whether or not a long-term deferral election had been made.
•Interest on deferred cash was accrued monthly based on our monthly weighted average cost of funds.
We recognize compensation expense related to equity compensation grants in the financial statements using the fair value method. Fair value of restricted AB Holding Unit awards is the closing price of an AB Holding Unit on the grant date; fair value of options is determined using the Black-Scholes option valuation model. Under the fair value method, compensatory expense is measured at the grant date based on the estimated fair value of the award and is recognized over the required service period. For year-end long-term incentive compensation awards, employees who resign or are terminated without cause may retain their awards, provided the employee remains in compliance with certain agreements and covenants set forth in the applicable award agreement, including the imposition of forfeiture as a result of post-employment competition, prohibitions on employee and client solicitation, and a potential claw-back for failing to follow existing risk management policies. Because there is no service requirement, we fully expense these awards on the grant date. Most equity replacement or similar deferred compensation awards included in separate employment agreements or arrangements include a required service period. Regardless of whether the award agreement includes employee service requirements, AB Holding Units are typically delivered to employees ratably over three to four years, unless the employee has made a long-term deferral election.
Grants of restricted AB Holding Units can be awarded to Eligible Directors. Generally, these restricted AB Holding Units vest ratably over three years. These restricted AB Holding Units are not forfeitable (except if the Eligible Director is terminated for “Cause,” as that term is defined in the applicable award agreement). We fully expense these awards on grant date, as there is no service requirement.
We hedge our restricted AB Holding Unit awards either by purchasing AB Holding Units on the open market or purchasing newly-issued AB Holding Units from AB Holding, and then keeping these AB Holding Units in a consolidated rabbi trust until delivering them or retiring them. In accordance with the Amended and Restated Agreement of Limited Partnership of AB (“AB”), when AB purchases newly-issued AB Holding Units from AB Holding, AB Holding is required to use the proceeds it receives from AB to purchase the equivalent number of newly issued AB Units, thus increasing its percentage ownership interest in AB. AB Holding Units held in the consolidated rabbi trust are corporate assets in the name of the trust and are available to the general creditors of AB.
Repurchases of AB Holding Units for the years ended December 31, 2024 and 2023 consisted of the following:
| | | | | | | | | | | | | | |
| Years Ended December 31 |
| 2024 | 2023 |
| (in millions) |
Total amount of AB Holding Units Purchased(1) | | 4.5 | | | 4.7 | |
Total Cash Paid for AB Holding Units Purchased(1) | | $ | 156.2 | | | $ | 144.4 | |
Open Market Purchases of AB Holding Units Purchased(1) | | 1.8 | | | 2.0 | |
Total Cash Paid for Open Market Purchases of AB Holding Units(1) | | $ | 60.1 | | | $ | 62.6 | |
(1)Purchased on a trade date basis. The difference between open-market purchases and units retained reflects the retention of AB Holding Units from employees to fulfill statutory tax withholding requirements at the time of delivery of long-term incentive compensation awards.
Each quarter, we consider whether to implement a plan to repurchase AB Holding Units pursuant to Rules 10b5-1 and 10b-18 under the Securities Exchange Act of 1934, as amended (“Exchange Act”). A plan of this type allows a company to repurchase its shares at times when it otherwise might be prevented from doing so because of self-imposed trading blackout periods or because it possesses material non-public information. Each broker we select has the authority to repurchase AB Holding Units
on our behalf in accordance with the terms and limitations specified in the plan. Repurchases are subject to regulations promulgated by the SEC as well as certain price, market volume and timing constraints specified in the plan. There was no plan adopted during the fourth quarter of 2024. We may adopt additional plans in the future to engage in open-market purchases of AB Holding Units to help fund anticipated obligations under our incentive compensation award program and for other corporate purposes.
During 2024, we granted to employees and Eligible Directors 5.9 million restricted AB Holding Units (including 4.1 million granted in December 2024 under our year-end Incentive Compensation Award Program to employees). During 2023, we granted to employees and Eligible Directors 5.6 million restricted AB Holding Units (including 5.0 million granted in December 2023 under our year-end Incentive Compensation Award Program to employees). We used AB Holding Units repurchased during the periods and newly-issued AB Holding Units to fund these awards.
Foreign Currency Translation and Transactions
Assets and liabilities of foreign subsidiaries are translated from functional currencies into United States dollars (“US$”) at exchange rates in effect at the balance sheet dates, and related revenues and expenses are translated into US$ at average exchange rates in effect during each period. Net foreign currency gains and losses resulting from the translation of assets and liabilities of foreign operations into US$ are reported as a separate component of other comprehensive income in the consolidated statements of comprehensive income. Net foreign currency transaction losses were $3.7 million, $4.5 million and $10.2 million for 2024, 2023 and 2022, respectively, and are reported in general and administrative expenses on the consolidated statements of income.
Cash Distributions
AB is required to distribute all of its Available Cash Flow, as defined in the AB Partnership Agreement, to its Unitholders and to the General Partner. Available Cash Flow can be summarized as the cash flow received by AB from operations minus such amounts as the General Partner determines, in its sole discretion, should be retained by AB for use in its business, or plus such amounts as the General Partner determines, in its sole discretion, should be released from previously retained cash flow.
Typically, Available Cash Flow has been the adjusted diluted net income per unit for the quarter multiplied by the number of general and limited partnership interests at the end of the quarter. In future periods, management anticipates that Available Cash Flow will be based on adjusted diluted net income per unit, unless management determines, with the concurrence of the Board, that one or more adjustments that are made for adjusted net income should not be made with respect to the Available Cash Flow calculation.
On February 6, 2025, the General Partner declared a distribution of $1.15 per AB Unit, representing a distribution of Available Cash Flow for the three months ended December 31, 2024. The General Partner, as a result of its 1.0% general partnership interest, is entitled to receive 1.0% of each distribution. The distribution is payable on March 13, 2025 to holders of record on February 18, 2025.
Total cash distributions per Unit paid to the General Partner and Unitholders during 2024, 2023 and 2022 were $3.30, $2.92 and $3.87, respectively.
Comprehensive Income
We report all changes in comprehensive income in the consolidated statements of comprehensive income. Comprehensive income includes net income, as well as foreign currency translation adjustments, actuarial gains (losses) and prior service cost. Deferred taxes were not recognized on foreign currency translation adjustments for foreign subsidiaries which had earnings that were considered permanently invested outside the United States.
Reclassification
During 2024, amounts previously presented on the consolidated statement of cash flow as "other assets and liabilities of company-sponsored investment funds, net" are now presented as "other assets of company- sponsored investment funds" and "other liabilities of company-sponsored investment funds". Prior period amounts previously presented as such have been reclassified to conform to the current periods presentation.
During 2024, amounts previously presented on the consolidated statement of financial condition as "long-term incentive compensation-related" investments are now presented as "other" investments. Prior period amounts previously presented as such have been reclassified to conform to the current periods presentation.
During 2024, the contingent liability of approximately $118.8 million associated with the CarVal acquisition previously recorded in contingent consideration liability on the consolidated statements of financial condition is now recorded in accounts payable and accrued expenses. Accretion expense associated with the liability will now be recorded as general and administrative expense on the consolidated statements of income on a prospective basis. Prior period amounts have not been recast.
Subsequent Events
We evaluate subsequent events through the date that these financial statements are filed with the SEC and did not identify any subsequent events that would require disclosure in these financial statements.
3. Revenue Recognition
Revenues for the years ended December 31, 2024, 2023 and 2022 consisted of the following:
| | | | | | | | | | | | | | | | | | | | |
| Years Ended December 31 |
| 2024 | 2023 | 2022 |
| (in thousands) |
| Subject to contracts with customers: | | | | | | |
| Investment advisory and services fees | | | | | | |
| Base fees | | $ | 3,171,175 | | | $ | 2,830,557 | | | $ | 2,825,791 | |
| Performance-based fees | | 270,964 | | | 144,911 | | | 145,247 | |
Bernstein research services(1) | | 96,222 | | | 386,142 | | | 416,273 | |
| Distribution revenues | | | | | | |
| All-in-management fees | | 337,999 | | | 284,057 | | | 290,740 | |
| 12b-1 fees | | 67,611 | | | 63,127 | | | 69,041 | |
| Other distribution fees | | 321,060 | | | 239,079 | | | 247,414 | |
| Other revenues | | | | | | |
| Shareholder servicing fees | | 89,195 | | | 83,802 | | | 86,661 | |
JV related revenues (2) | | 37,775 | | | — | | | — | |
| Other | | 14,317 | | | 17,061 | | | 18,120 | |
| | 4,406,318 | | | 4,048,736 | | | 4,099,287 | |
| Not subject to contracts with customers: | | | | | | |
| Dividend and interest income, net of interest expense | | 80,800 | | | 91,902 | | | 56,653 | |
| Investment (losses) gains | | (13,486) | | | 14,206 | | | (102,413) | |
| Other revenues | | 1,507 | | | 479 | | | 763 | |
| | 68,821 | | | 106,587 | | | (44,997) | |
| Total net revenues | | $ | 4,475,139 | | | $ | 4,155,323 | | | $ | 4,054,290 | |
(1)On April 1, 2024 AB and Societe Generale, a leading European bank, completed their transaction to form a jointly owned equity research provider and cash equity trading partner for institutional investors. AB has deconsolidated the Bernstein Research Services business and contributed the business to the joint venture. For further discussion, see Note 24 Divestiture.
(2)We entered into certain transition service level agreements with the JVs in connection with the divestiture of the BRS business. From April 1, 2024 through December 31, 2024 we provided services and recognized revenues of $37.8 million associated with these transition services agreements.
4. Net Income Per Unit
Basic net income per unit is derived by reducing net income for the 1.0% general partnership interest and dividing the remaining 99.0% by the basic weighted average number of limited partnership units outstanding for each year. Diluted net income per unit is derived by reducing net income for the 1.0% general partnership interest and dividing the remaining 99.0% by the total of the diluted weighted average number of limited partnership units outstanding for each year.
| | | | | | | | | | | | | | | | | | | | |
| Years Ended December 31 |
| 2024 | 2023 | 2022 |
| (in thousands, except per unit amounts) |
| Net income attributable to AB Unitholders | | $ | 1,173,247 | | | $ | 764,610 | | | $ | 831,813 | |
| Weighted average units outstanding—basic | | 286,618 | | | 285,125 | | | 273,943 | |
| Dilutive effect of compensatory options to buy AB Holding Units | | — | | | — | | | 1 | |
| Weighted average units outstanding—diluted | | 286,618 | | | 285,125 | | | 273,944 | |
| Basic net income per AB Unit | | $ | 4.05 | | | $ | 2.65 | | | $ | 3.01 | |
| Diluted net income per AB Unit | | $ | 4.05 | | | $ | 2.65 | | | $ | 3.01 | |
There were no anti-dilutive options excluded from diluted net income in 2024, 2023 and 2022.
5. Cash and Securities Segregated Under Federal Regulations and Other Requirements
As of December 31, 2024 and 2023, $0.5 billion and $0.9 billion, respectively, of U.S. Treasury Bills were segregated in a special reserve bank custody account for the exclusive benefit of our brokerage customers under Rule 15c3-3 of the Exchange Act.
6. Investments
Investments consist of:
| | | | | | | | | | | | | | |
| Years Ended December 31 |
| 2024 | 2023 |
| (in thousands) |
| Equity securities: | | | | |
| | | | |
| | | | |
| Long-term incentive compensation-related | | $ | 31,934 | | | $ | 18,882 | |
| Seed capital | | 169,502 | | | 128,771 | |
| Other | | 388 | | | — | |
| | | | |
| Investments in limited partnership hedge funds: | | | | |
| Long-term incentive compensation-related | | 10,831 | | | 21,151 | |
| Seed capital | | 18,397 | | | 57,624 | |
| Investment in joint ventures | | 286,721 | | | — | |
| Time deposits | | 6,100 | | | 6,517 | |
| Other | | 11,331 | | | 10,609 | |
| Total investments | | $ | 535,204 | | | $ | 243,554 | |
Total investments related to long-term incentive compensation obligations of $42.8 million and $40.0 million as of December 31, 2024 and 2023, respectively, consist of company-sponsored mutual funds and hedge funds. For long-term incentive compensation awards granted before 2009, we typically made investments in company-sponsored mutual funds and hedge funds that were notionally elected by plan participants and maintained them (and continue to maintain them) in a consolidated rabbi trust or separate custodial account. The rabbi trust and custodial account enable us to hold such investments separate from our other assets for the purpose of settling our obligations to participants. The investments held in the rabbi trust and custodial account remain available to the general creditors of AB.
The underlying investments of hedge funds in which we invest include long and short positions in equity securities, fixed income securities (including various agency and non-agency asset-based securities), currencies, commodities and derivatives (including various swaps and forward contracts). These investments are valued at quoted market prices or, where quoted market prices are not available, are fair valued based on the pricing policies and procedures of the underlying funds.
We allocate seed capital to our investment teams to help develop new products and services for our clients. A portion of our seed capital trading investments are equity and fixed income products, primarily in the form of separately managed account portfolios, U.S. mutual funds, Luxembourg funds, Japanese investment trust management funds or Delaware business trusts. We also may allocate seed capital to investments in private equity funds. Regarding our seed capital investments, the amounts above reflect those funds in which we are not the primary beneficiary of a VIE or hold a controlling financial interest in a VOE. See Note 15, Consolidated Company-Sponsored Investment Funds, for a description of the seed capital investments that we consolidate. As of December 31, 2024 and 2023, our total seed capital investments were $294.7 million and $394.2 million, respectively. Seed capital investments in unconsolidated company-sponsored investment funds are valued using published net asset values or non-published net asset values if they are not listed on an active exchange but have net asset values that are comparable to funds with published net asset values and have no redemption restrictions.
On April 1, 2024, we deconsolidated our BRS business and contributed the business to the JVs. We record our subsequent investment in the JVs under the equity method of accounting and our investment in joint ventures includes our investments in these JVs (for further discussion, see Note 2 Significant Accounting Policies and Note 24 Divestitures).
The portion of unrealized gains (losses) related to equity securities, as defined by ASC 321-10, held as of December 31, 2024 and 2023 were as follows:
| | | | | | | | | | | | | | |
| Years Ended December 31 |
| 2024 | 2023 |
| (in thousands) |
| Net gains recognized during the period | | $ | 14,622 | | | $ | 14,372 | |
| Less: net gains recognized during the period on equity securities sold during the period | | 8,731 | | | 6,132 | |
| Unrealized gains recognized during the period on equity securities held | | $ | 5,891 | | | $ | 8,240 | |
7. Derivative Instruments
See Note 15 Consolidated Company-Sponsored Investment Funds for disclosure of derivative instruments held by our consolidated company-sponsored investment funds.
We enter into various futures, forwards, options and swaps to economically hedge certain seed capital investments. Also, we have currency forwards that help us to economically hedge certain balance sheet exposures. In addition, our options desk trades long and short exchange-traded equity options. We do not hold any derivatives designated in a formal hedge relationship under ASC 815-10, Derivatives and Hedging.
The notional value, fair value and gains and losses recognized in investment gains (losses) as of December 31, 2024 and 2023 for derivative instruments (excluding derivative instruments relating to our options desk trading activities discussed below) not designated as hedging instruments were as follows:
| | | | | | | | | | | | | | | | | | | | | | | | | | |
| Notional
Value | Derivative
Assets | Derivative
Liabilities | Gains
(Losses) |
| (in thousands) |
| December 31, 2024 | | | | | | | | |
| Exchange-traded futures | | $ | 157,787 | | | $ | 2,835 | | | $ | 33 | | | $ | (2,744) | |
| Currency forwards | | 27,368 | | | 4,881 | | | 4,656 | | | 1,690 | |
| Interest rate swaps | | 17,667 | | | 367 | | | 14 | | | 310 | |
| Credit default swaps | | 199,720 | | | 4,172 | | | 9,099 | | | (2,675) | |
| Total return swaps | | 216,468 | | | 663 | | | 1,087 | | | (3,823) | |
| Option swaps | | 50,459 | | | 8,023 | | | 55 | | | (688) | |
| Total derivatives | | $ | 669,469 | | | $ | 20,941 | | | $ | 14,944 | | | $ | (7,930) | |
| December 31, 2023 | | | | | | | | |
| Exchange-traded futures | | $ | 116,344 | | | $ | 1 | | | $ | 3,511 | | | $ | (2,038) | |
| Currency forwards | | 34,440 | | | 4,951 | | | 5,597 | | | (82) | |
| Interest rate swaps | | 11,345 | | | 294 | | | 349 | | | 110 | |
| Credit default swaps | | 139,607 | | | 9,265 | | | 4,197 | | | (6,850) | |
| Total return swaps | | 95,021 | | | 6 | | | 4,391 | | | (5,443) | |
| Option swaps | | 50,232 | | | 1 | | | 135 | | | (2,107) | |
| Total derivatives | | $ | 446,989 | | | $ | 14,518 | | | $ | 18,180 | | | $ | (16,410) | |
As of December 31, 2024 and 2023, the derivative assets and liabilities are included in both receivables and payables to brokers and dealers on our consolidated statements of financial condition. Gains and losses on derivative instruments are reported in investment gains (losses) on the consolidated statements of income.
We may be exposed to credit-related losses in the event of non-performance by counterparties to derivative financial instruments. We minimize our counterparty exposure through a credit review and approval process. In addition, we have executed various collateral arrangements with counterparties to the over-the-counter derivative transactions that require both pledging and accepting collateral in the form of cash. As of December 31, 2024 and 2023, we held $10.4 million and $5.7 million, respectively, of cash collateral payable to trade counterparties. This obligation to return cash is reported in payables to brokers and dealers in our consolidated statements of financial condition.
Although notional amount is the typical measure of volume in the derivatives market, it is not used as a measure of credit risk. Generally, the current credit exposure of our derivative contracts is limited to the net positive estimated fair value of derivative contracts at the reporting date after taking into consideration the existence of netting agreements and any collateral received. A derivative with positive value (a derivative asset) indicates existence of credit risk because the counterparty would owe us if the contract were closed. Alternatively, a derivative contract with negative value (a derivative liability) indicates we would owe money to the counterparty if the contract were closed. Generally, if there is more than one derivative transaction with a single counterparty, a master netting arrangement exists with respect to derivative transactions with that counterparty to provide for aggregate net settlement.
Our standardized contracts for over-the-counter derivative transactions, known as ISDA master agreements, provide for collateralization. As of December 31, 2024 and 2023, we delivered $5.2 million and $7.8 million, respectively, of cash collateral into brokerage accounts. We report this cash collateral in cash and cash equivalents in our consolidated statements of financial condition.
As a result of the deconsolidation of the BRS business on April 1, 2024, we no longer have long and short exchange-traded equity options. As of December 31, 2023, these equity options were classified as held for sale on our consolidated statement of financial condition. For further discussion, see Note 24 Divestiture.
Prior to the deconsolidation of the BRS business, our options desk provided our clients with equity derivative strategies and execution for exchange-traded options on single stocks, exchange-traded funds and indices. While predominately agency-based, the options desk had the ability to commit capital to facilitate a client's transaction. Our options desk hedged the risk associated with this activity by taking offsetting positions in equities. For the three months ended March 31, 2024 (prior to our deconsolidation of the BRS business on April 1, 2024), we recognized losses of $2.0 million on equity options activity. For the year ended December 31, 2023, we recognized $4.9 million of losses on equity options activity, respectively. These losses are recognized in investment gains (losses) in the consolidated statements of income.
8. Offsetting Assets and Liabilities
See Note 15, Consolidated Company-Sponsored Investment Funds, for disclosure of offsetting assets and liabilities of our consolidated company-sponsored investment funds.
Offsetting of assets as of December 31, 2024 and 2023 was as follows:
| | | | | | | | | | | | | | | | | | | | | | | | | | | | | | | | | | | | | | |
| Gross
Amounts of
Recognized
Assets | Gross
Amounts
Offset in the
Statement
of Financial
Condition | Net
Amounts of
Assets
Presented in
the
Statement of
Financial
Condition | Financial
Instruments Collateral | Cash
Collateral
Received | Net
Amount |
| (in thousands) |
| December 31, 2024 | | | | | | | | | | | | |
| Securities borrowed | | $ | 1,144 | | | $ | — | | | $ | 1,144 | | | $ | (1,044) | | | $ | — | | | $ | 100 | |
| Derivatives | | 20,941 | | | — | | | 20,941 | | | — | | | (10,357) | | | 10,584 | |
| | | | | | | | | | | | |
| December 31, 2023 | | | | | | | | | | | | |
| Securities borrowed | | $ | 23,229 | | | $ | — | | | $ | 23,229 | | | $ | (23,229) | | | $ | — | | | $ | — | |
| Derivatives | | 14,518 | | | — | | | 14,518 | | | — | | | (5,691) | | | 8,827 | |
| | | | | | | | | | | | |
Offsetting of liabilities as of December 31, 2024 and 2023 was as follows:
| | | | | | | | | | | | | | | | | | | | | | | | | | | | | | | | | | | | | | |
| Gross
Amounts of
Recognized
Liabilities | Gross
Amounts
Offset in the
Statement
of
Financial
Condition | Net
Amounts
of Liabilities
Presented in
the
Statement
of Financial
Condition | Financial
Instruments Collateral | Cash
Collateral
Pledged | Net
Amount |
| (in thousands) |
| December 31, 2024 | | | | | | | | | | | | |
| | | | | | | | | | | | |
| Derivatives | | $ | 14,944 | | | $ | — | | | $ | 14,944 | | | $ | — | | | $ | (5,188) | | | $ | 9,756 | |
| | | | | | | | | | | | |
| December 31, 2023 | | | | | | | | | | | | |
| Securities loaned | | $ | 125,101 | | | $ | — | | | $ | 125,101 | | | $ | (122,369) | | | $ | — | | | $ | 2,732 | |
| Derivatives | | 18,180 | | | — | | | 18,180 | | | — | | | (7,795) | | | 10,385 | |
| | | | | | | | | | | | |
Cash collateral, whether pledged or received on derivative instruments, is not considered material and, accordingly, is not disclosed by counterparty.
9. Fair Value
See Note 15, Consolidated Company-Sponsored Investment Funds, for disclosure of fair value of our consolidated company-sponsored investment funds.
Fair value is defined as the price that would be received to sell an asset or paid to transfer a liability (i.e., the “exit price”) in an orderly transaction between market participants at the measurement date. The three broad levels of fair value hierarchy are as follows:
•Level 1—Quoted prices in active markets are available for identical assets or liabilities as of the reported date.
•Level 2—Quoted prices in markets that are not active or other pricing inputs that are either directly or indirectly observable as of the reported date.
•Level 3—Prices or valuation techniques that are both significant to the fair value measurement and unobservable as of the reported date. These financial instruments do not have two-way markets and are measured using management’s best estimate of fair value, where the inputs into the determination of fair value require significant management judgment or estimation.
Assets and Liabilities Measured at Fair Value on a Recurring Basis
Valuation of our financial instruments by pricing observability levels as of December 31, 2024 and 2023 was as follows (in thousands):
| | | | | | | | | | | | | | | | | | | | | | | | | | | | | | | | |
| | Level 1 | Level 2 | Level 3 | NAV Expedient(1) | Total |
| December 31, 2024 | | | | | | | | | | |
| Money markets | | $ | 146,781 | | | $ | — | | | $ | — | | | $ | — | | | $ | 146,781 | |
| Securities segregated (U.S. Treasury Bills) | | — | | | 499,245 | | | — | | | — | | | 499,245 | |
| Derivatives | | 2,835 | | | 18,106 | | | — | | | — | | | 20,941 | |
| | | | | | | | | | |
| | | | | | | | | | |
| Equity securities | | 193,766 | | | 5,921 | | | 121 | | | 2,016 | | | 201,824 | |
| Other Investments | | 8,593 | | | — | | | — | | | — | | | 8,593 | |
| | | | | | | | | | |
| | | | | | | | | | |
| | | | | | | | | | |
| | | | | | | | | | |
| | | | | | | | | | |
| | | | | | | | | | |
| | | | | | | | | | |
| | | | | | | | | | |
| Total assets measured at fair value | | $ | 351,975 | | | $ | 523,272 | | | $ | 121 | | | $ | 2,016 | | | $ | 877,384 | |
| | | | | | | | | | |
| | | | | | | | | | |
| | | | | | | | | | |
| | | | | | | | | | |
| Derivatives | | $ | 33 | | | $ | 14,911 | | | $ | — | | | $ | — | | | $ | 14,944 | |
| Contingent payment arrangements | | — | | | — | | | 9,385 | | | — | | | 9,385 | |
| Total liabilities measured at fair value | | $ | 33 | | | $ | 14,911 | | | $ | 9,385 | | | $ | — | | | $ | 24,329 | |
| | | | | | | | | | |
| December 31, 2023: | | | | | | | | | | |
| Money markets | | $ | 146,906 | | | $ | — | | | $ | — | | | $ | — | | | $ | 146,906 | |
| Securities segregated (U.S. Treasury Bills) | | — | | | 867,679 | | | — | | | — | | | 867,679 | |
| Derivatives | | 1 | | | 14,517 | | | — | | | — | | | 14,518 | |
| | | | | | | | | | |
| | | | | | | | | | |
| Equity securities | | 113,833 | | | 32,104 | | | 118 | | | 1,598 | | | 147,653 | |
| | | | | | | | | | |
| | | | | | | | | | |
| | | | | | | | | | |
| | | | | | | | | | |
| | | | | | | | | | |
| | | | | | | | | | |
| Other investments | | 7,870 | | | — | | | — | | | — | | | 7,870 | |
| | | | | | | | | | |
| Total assets measured at fair value | | $ | 268,610 | | | $ | 914,300 | | | $ | 118 | | | $ | 1,598 | | | $ | 1,184,626 | |
| | | | | | | | | | |
| | | | | | | | | | |
| | | | | | | | | | |
| Derivatives | | $ | 3,511 | | | $ | 14,669 | | | $ | — | | | $ | — | | | $ | 18,180 | |
| Contingent payment arrangements | | — | | | — | | | 252,690 | | | — | | | 252,690 | |
| Total liabilities measured at fair value | | $ | 3,511 | | | $ | 14,669 | | | $ | 252,690 | | | $ | — | | | $ | 270,870 | |
(1)Investments measured at fair value using NAV (or its equivalent) as a practical expedient.
Other investments included in Level 1 of the fair value hierarchy include our investment in a mutual fund measured at fair value.
We provide below a description of the fair value methodologies used for instruments measured at fair value, as well as the general classification of such instruments pursuant to the valuation hierarchy:
•Money markets: We invest excess cash in various money market funds that are valued based on quoted prices in active markets; these are included in Level 1 of the valuation hierarchy.
•Treasury Bills: We hold U.S. Treasury Bills, which are primarily segregated in a special reserve bank custody account as required by Rule 15c3-3 of the Exchange Act. These securities are valued based on quoted yields in secondary markets and are included in Level 2 of the valuation hierarchy.
•Equity securities: Our equity securities consist principally of company-sponsored mutual funds with NAVs and various separately managed portfolios consisting primarily of equity and fixed income mutual funds with quoted prices in active markets, which are included in Level 1 of the valuation hierarchy. In addition, some securities are valued based on observable inputs from recognized pricing vendors, which are included in Level 2 of the valuation hierarchy.
•Derivatives: We hold exchange-traded futures with counterparties that are included in Level 1 of the valuation hierarchy. In addition, we also hold currency forward contracts, interest rate swaps, credit default swaps, option swaps and total return swaps with counterparties that are valued based on observable inputs from recognized pricing vendors, which are included in Level 2 of the valuation hierarchy.
•Contingent payment arrangements: Contingent payment arrangements relate to contingent payment liabilities associated with various acquisitions. At each reporting date, we estimate the fair values of the contingent consideration expected to be paid upon probability-weighted AUM and revenue projections, using unobservable market data inputs, which are included in Level 3 of the valuation hierarchy.
During the years ended December 31, 2024 and 2023, there were no transfers between Level 2 and Level 3 securities.
The change in carrying value associated with Level 3 financial instruments carried at fair value, classified as equity securities, is as follows:
| | | | | | | | | | | | | | |
| December 31 |
| 2024 | 2023 |
| (in thousands) |
| Balance as of beginning of period | | $ | 118 | | | $ | 129 | |
| | | | |
| | | | |
| | | | |
| Unrealized gains (losses), net | | 3 | | | (11) | |
| Balance as of end of period | | $ | 121 | | | $ | 118 | |
Realized and unrealized gains and losses on Level 3 financial instruments are recorded in investment gains and losses in the consolidated statements of income.
Our acquisitions may include contingent consideration arrangements as part of the purchase price. The change in carrying value associated with Level 3 financial instruments carried at fair value, classified as contingent payment arrangements, is as follows:
| | | | | | | | | | | | | | |
| December 31 |
| 2024 | 2023 |
| (in thousands) |
| Balance as of beginning of period | | $ | 252,690 | | | $ | 247,309 | |
| | | | |
| Accretion | | 9,005 | | | 8,803 | |
| Changes in estimates | | (130,901) | | | 14,050 | |
| Payments | | (2,640) | | | (1,291) | |
| Held for sale reclassification | | — | | | (16,181) | |
| Reclassification of AB CarVal contingent liability | | (118,769) | | | — | |
| Balance as of end of period | | $ | 9,385 | | | $ | 252,690 | |
During 2022, we acquired CarVal Investors which included a contingent consideration liability ranging from zero to $650.0 million and is based on CarVal achieving certain performance objectives over a six-year period ending December 31, 2027. The fair value of the contingent liability is remeasured each reporting period. During 2024, we remeasured the contingent liability and recorded a gain reflected within contingent payment arrangements in the consolidated statements of income of $128.5 million. The fair value of the contingent consideration is remeasured using forecasted future cash flows using the Real Options valuation methodology. The most significant assumptions used to remeasure the liability were expected revenue growth rates and discount rates.
In December 2024, the company agreed to finalize its contingent consideration liability with AB CarVal for a value of $134.0 million. This liability will be paid predominantly in AB Units issued within 10 days of December 31, 2027. Given the liability is no longer contingent, the liability of approximately $118.8 million is now recorded in accounts payable and accrued expenses on the consolidated statements of financial condition. We will accrete the present value of the liability of $118.8 million up to $134.0 million through December 31, 2027 and recognize this expense as general and administrative expenses on the consolidated statements of income on a prospective basis. As of December 31, 2023, the contingent consideration payable associated with the CarVal acquisition was $238.5 million.
As of December 31, 2024, the expected revenue growth rates ranged from 2.0% to 29.3%, with a weighted average of 5.5%, calculated using cumulative revenues and range of revenue growth rates. The discount rates range from 1.9% to 10.4%, with a weighted average of 7.3%, calculated using total contingent liabilities and range of discount rates.
As of December 31, 2023, the expected revenue growth rates range from 2.0% to 83.9%, with a weighted average of 10.3%, calculated using cumulative revenues and range of revenue growth rates. The discount rates ranged from 1.9% to 10.4%, with a weighted average of 4.6%, calculated using total contingent liabilities and range of discount rates.
Assets and Liabilities Measured at Fair Value on a Nonrecurring Basis
We did not have any material assets or liabilities that were measured at fair value for impairment on a nonrecurring basis during the years ended December 31, 2024 or 2023.
10. Furniture, Equipment and Leasehold Improvements, Net
Furniture, equipment and leasehold improvements, net consist of:
| | | | | | | | | | | | | | |
| Years Ended December 31 |
| 2024 | 2023 |
| (in thousands) |
Furniture and equipment (1) | | $ | 151,478 | | | $ | 168,415 | |
Leasehold improvements (1) | | 249,422 | | | 326,131 | |
Total (1) | | 400,900 | | | 494,546 | |
Less: Accumulated depreciation and amortization (1) | | (152,227) | | | (318,198) | |
Furniture, equipment and leasehold improvements, net (1) | | $ | 248,673 | | | $ | 176,348 | |
(1)During the fourth quarter of 2024, due to our exit from our previous New York office location, we disposed of approximately $201.8 million in assets with a net book value of $3.1 million.
Depreciation and amortization expense on furniture, equipment and leasehold improvements were $44.9 million, $44.9 million and $39.7 million for the years ended December 31, 2024, 2023 and 2022, respectively.
11. Deferred Sales Commissions, Net
The components of deferred sales commissions, net, for the years ended December 31, 2024 and 2023 were as follows (excluding amounts related to fully amortized deferred sales commissions):
| | | | | | | | | | | | | | |
| Years Ended December 31 |
| 2024 | 2023 |
| (in thousands) |
| Carrying amount of deferred sales commissions | | $ | 303,564 | | | $ | 187,870 | |
| Less: Accumulated amortization | | (74,602) | | | (66,899) | |
| Cumulative CDSC received | | (46,255) | | | (33,597) | |
| Deferred sales commissions, net | | $ | 182,707 | | | $ | 87,374 | |
Amortization expense associated with deferred sales commissions was $58.0 million, $36.8 million and $34.8 million for the years ended December 31, 2024, 2023 and 2022, respectively.
Estimated future amortization expense related to the December 31, 2024 net asset balance, assuming no additional CDSC is received in future periods, is as follows (in thousands):
| | | | | |
| 2025 | $ | 76,415 | |
| 2026 | 68,192 | |
| 2027 | 36,553 | |
| 2028 | 1,547 | |
| |
| |
| Total | $ | 182,707 | |
12. Debt
Credit Facility
AB has an $800.0 million committed, unsecured senior revolving credit facility (the "Credit Facility") with a group of commercial banks and other lenders, which matures on October 13, 2026. The Credit Facility provides for possible increases in the principal amount by up to an aggregate incremental amount of $200.0 million; any such increase is subject to the consent of the affected lenders. The Credit Facility is available for AB and Sanford C. Bernstein & Co., LLC ("SCB LLC") business purposes, including the support of AB’s commercial paper program. Both AB and SCB LLC can draw directly under the Credit Facility and management may draw on the Credit Facility from time to time. AB has agreed to guarantee the obligations of SCB LLC under the Credit Facility.
The Credit Facility contains affirmative, negative and financial covenants, which are customary for facilities of this type, including restrictions on dispositions of assets, restrictions on liens, a minimum interest coverage ratio and a maximum
leverage ratio. As of December 31, 2024, we were in compliance with these covenants. The Credit Facility also includes customary events of default (with customary grace periods, as applicable), including provisions under which, upon the occurrence of an event of default, all outstanding loans may be accelerated and/or lender’s commitments may be terminated. Also, under such provisions, upon the occurrence of certain insolvency- or bankruptcy-related events of default, all amounts payable under the Credit Facility would automatically become immediately due and payable, and the lender’s commitments automatically would terminate.
Amounts under the Credit Facility may be borrowed, repaid and re-borrowed by us from time to time until the maturity of the facility. Voluntary prepayments and commitment reductions requested by us are permitted at any time without a fee (other than customary breakage costs relating to the prepayment of any drawn loans) upon proper notice and subject to a minimum dollar requirement. Borrowings under the Credit Facility bear interest at a rate per annum, which will be, at our option, a rate equal to an applicable margin, which is subject to adjustment based on the credit ratings of AB, plus one of the following indices: a term Secured Overnight Financial Rate; a Prime rate; or the Federal Funds rate.
As of December 31, 2024 and 2023, we had no amounts outstanding under the Credit Facility. During 2024 and 2023, we did not draw upon the Credit Facility.
EQH Facility
AB also has a $900.0 million committed, unsecured senior credit facility (“EQH Facility”) with EQH. The EQH Facility was amended and restated as of August 30, 2024, extending the maturity date to August 31, 2029. There were no other significant changes included in the amendment. The EQH facility is available for AB's general business purposes. Borrowings under the EQH Facility generally bear interest at a rate per annum based on prevailing overnight commercial paper rates.
The EQH Facility contains affirmative, negative and financial covenants which are substantially similar to those in AB’s committed bank facilities. As of December 31, 2024, we were in compliance with these covenants. The EQH Facility also includes customary events of default substantially similar to those in AB’s committed bank facilities, including provisions under which, upon the occurrence of an event of default, all outstanding loans may be accelerated and/or the lender’s commitment may be terminated.
Amounts under the EQH Facility may be borrowed, repaid and re-borrowed by us from time to time until the maturity of the facility. AB or EQH may reduce or terminate the commitment at any time without penalty upon proper notice. EQH also may terminate the facility immediately upon a change of control of our general partner.
As of December 31, 2024 and 2023, AB had $710.0 million and $900.0 million outstanding under the EQH Facility with interest rates of approximately 4.3% and 5.3%, respectively. Average daily borrowings on the EQH Facility during 2024 and 2023 were $494.2 million and $743.1 million, respectively, with weighted average interest rates of approximately 5.2% and 4.9%, respectively.
EQH Uncommitted Facility
In addition to the EQH Facility, AB has a $300.0 million uncommitted, unsecured senior credit facility (“EQH Uncommitted Facility”) with EQH. The EQH Uncommitted Facility was amended and restated as of August 30, 2024, extending the maturity date to August 31, 2029. There were no other significant changes included in the amendment. The EQH Uncommitted facility is available for AB's general business purposes. Borrowings under the EQH Unsecured Facility generally bear interest at a rate per annum based on prevailing overnight commercial paper rates. The EQH Uncommitted Facility contains affirmative, negative and financial covenants which are substantially similar to those in the EQH Facility. As of December 31, 2024, we were in compliance with these covenants. As of December 31, 2024 and 2023, we had no amounts outstanding under the EQH Uncommitted Facility. We did not draw upon the EQH Uncommitted Facility during 2024. Average daily borrowings during 2023 were $3.6 million with a weighted average interest rate of approximately 4.6%.
Commercial Paper
As of December 31, 2024, we had no commercial paper outstanding. As of December 31, 2023, we had $254.3 million of commercial paper outstanding with an interest rate of 5.4%. The commercial paper is short term in nature, and as such, recorded value is estimated to approximate fair value (and considered a Level 2 security in the fair value hierarchy). Average daily borrowings of commercial paper during 2024 and 2023 were $268.2 million and $267.6 million, respectively, with weighted average interest rates of approximately 5.4% and 5.2%, respectively.
SCB Lines of Credit
SCB LLC had five uncommitted lines of credit as of December 31, 2023, two of which matured during the third quarter of 2024. As of December 31, 2024, SCB LLC has three uncommitted lines of credit with three financial institutions. Two of these lines of credit permit us to borrow up to an aggregate of approximately $150.0 million, with AB named as an additional borrower, while the other line has no stated limit. AB has agreed to guarantee the obligations on SCB LLC under these lines of credit. As of December 31, 2024 and 2023, SCB LLC had no outstanding balance on these lines of credit. Average daily borrowings on the lines of credit during 2024 and 2023 were $0.6 million and $1.1 million, respectively, with weighted average interest rates of approximately 8.5% and 7.8%, respectively.
13. Leases
We lease office space, office equipment and technology under various operating and financing leases. Our current leases have initial lease terms of one year to 20 years, some of which include options to extend the leases for up to five years, and some of which include options to terminate the leases within one year.
Leases included in the consolidated statements of financial condition as of December 31, 2024 and 2023 were as follows:
| | | | | | | | | | | | | | | | | |
| Classification | December 31, 2024 | December 31, 2023 |
| (in thousands) |
| Operating Leases | | | | | |
| Operating lease right-of-use assets | Right-of-use assets | | $ | 441,662 | | | $ | 312,588 | |
| Operating lease liabilities | Lease liabilities | | 504,171 | | | 357,623 | |
| Finance Leases | | | | | |
| Property and equipment, gross | Right-of-use assets | | 19,548 | | | 18,975 | |
| Amortization of right-of-use assets | Right-of-use assets | | (11,333) | | | (7,797) | |
| Property and equipment, net | | | 8,215 | | | 11,178 | |
| Finance lease liabilities | Lease liabilities | | 8,444 | | | 11,394 | |
The components of lease expense included in the consolidated statements of income for the years ended December 31, 2024 and 2023 were as follows:
| | | | | | | | | | | | | | | | | | | | | | | | | |
| | | | Years Ended December 31 | | |
| | Classification | | 2024 | 2023 | | |
| | | | (in thousands) | | |
| Operating lease cost | | General and administrative | | | $ | 109,580 | | | $ | 94,784 | | | |
| | | | | | | | | |
| Financing lease cost: | | | | | | | | | |
| Amortization of right-of-use assets | | General and administrative | | | 4,361 | | | 4,779 | | | |
| Interest on lease liabilities | | Interest expense | | | 325 | | | 348 | | | |
| Total finance lease cost | | | | | 4,686 | | | 5,127 | | | |
Variable lease cost (1) | | General and administrative | | | 38,814 | | | 35,525 | | | |
| Sublease income | | General and administrative | | | (33,068) | | | (33,577) | | | |
| Net lease cost | | | | | $ | 120,012 | | | $ | 101,859 | | | |
(1)Variable lease expense includes operating expenses, real estate taxes and employee parking.
The sublease income represents all revenues received from sub-tenants. It is primarily fixed base rental payments combined with variable reimbursements such as operating expenses, real estate taxes and employee parking. The vast majority of sub-tenant income is derived from our New York metro sub-tenant agreements. Sub-tenant income related to base rent is recorded on a straight-line basis.
Maturities of lease liabilities are as follows:
| | | | | | | | | | | | | | | | | | | | |
| Operating Leases | Financing Leases | Total |
| Year ending December 31, | (in thousands) |
| 2025 | | $ | 59,311 | | | $ | 4,341 | | | $ | 63,652 | |
| 2026 | | 61,279 | | | 2,973 | | | 64,252 | |
| 2027 | | 58,405 | | | 1,216 | | | 59,621 | |
| 2028 | | 52,160 | | | 297 | | | 52,457 | |
| 2029 | | 49,235 | | | — | | | 49,235 | |
| Thereafter | | 415,489 | | | — | | | 415,489 | |
| Total lease payments | | 695,879 | | | 8,827 | | | $ | 704,706 | |
| Less interest | | (191,708) | | | (383) | | | |
| Present value of lease liabilities | | $ | 504,171 | | | $ | 8,444 | | | |
We signed a lease that commenced during the first quarter of 2024, relating to approximately 166,000 square feet of space in New York City.
| | | | | |
| Lease term and discount rate: | |
| Weighted average remaining lease term (years): | |
| Operating leases | 13.65 |
| Finance leases | 2.30 |
| Weighted average discount rate: | |
| Operating leases | 4.41 | % |
| Finance leases | 3.61 | % |
Supplemental non-cash activity related to leases are as follows:
| | | | | | | | | | | | | | |
| Years Ended December 31 |
| 2024 | 2023 |
| (in thousands) |
| | | | |
| | | | |
| | | | |
| | | | |
Right-of-use assets obtained in exchange for lease obligations(1): | | | | |
| Operating leases | | $ | 217,318 | | | $ | 32,407 | |
| Finance leases | | 1,097 | | | 4,106 | |
(1)Represents non-cash activity and, accordingly, is not reflected in the consolidated statements of cash flows.
14. Commitments and Contingencies
Leases
As indicated in Note 13 Leases, we lease office space, office equipment and technology under various leasing arrangements. The future minimum payments under non-cancelable leases, sublease commitments and related payments we are obligated to make, net of sublease commitments of third party lessees to make payments to us, as of December 31, 2024, are as follows:
| | | | | | | | | | | | | | | | | | | | |
| Payments | Sublease Receipts | Net Payments |
| (in millions) |
| 2025 | | $ | 67.6 | | | $ | (2.3) | | | $ | 65.3 | |
| 2026 | | 64.8 | | | (2.7) | | | 62.1 | |
| 2027 | | 60.4 | | | (2.7) | | | 57.7 | |
| 2028 | | 52.9 | | | (2.7) | | | 50.2 | |
| 2029 | | 49.8 | | | (2.7) | | | 47.1 | |
| 2030 and thereafter | | 419.5 | | | (4.7) | | | 414.8 | |
| Total future minimum payments | | $ | 715.0 | | | $ | (17.8) | | | $ | 697.2 | |
See Note 13 Leases for material lease commitments.
Legal Proceedings
For significant litigation matters, we assess the likelihood of a negative outcome. If a negative outcome is probable and the loss can be reasonably estimated, we record an estimated loss. If a negative outcome is reasonably possible and we can estimate the potential loss or range of loss, or if a negative outcome is probable and we can estimate the potential loss or range of loss beyond any amounts already accrued, we disclose this information. However, predicting outcomes or estimating losses is often challenging due to litigation uncertainties, especially in early stages or complex cases. In such instances, we disclose our inability to predict the outcome or estimate losses.
AB may face regulatory inquiries, administrative proceedings, and litigation, some alleging significant damages. While it is possible we could incur losses from these matters, we cannot currently estimate such losses or their range. Management, after consulting with legal counsel, believes that the outcome of any individual or combined matters will not materially affect our operations, financial condition, or liquidity. However, due to inherent uncertainties, future developments could potentially have a material adverse effect on our results, financial condition, or liquidity in future reporting periods.
Guarantees
Effective April 1, 2024 AB and SocGen completed their previously announced transaction to form the JVs. At the time of closing, Bernstein Institutional Services LLC (“BIS”), the U.S. broker-dealer subsidiary of the NA JV, entered into a credit facility agreement with SocGen, as lender, providing for up to $60.0 million of working capital. As a condition of the credit facility and until SocGen’s ownership exceeds 50% of NA JV, AB will provide a limited guarantee under which AB will guarantee up to its percentage ownership, currently 66.7%, of any unpaid obligations of BIS. As of December 31, 2024, there were no unpaid obligations under this facility requiring a guarantee by AB.
In addition, in connection with the close of the transaction, AB will indemnify SocGen Canada ("SG Canada") for certain obligations and liabilities in relation to Sanford C. Bernstein Canada ("SCB Canada") until such time as SocGen exceeds 50% ownership of NA JV (the “Canadian Regulatory Guarantee”). Under the terms of the Canadian Regulatory Guarantee, SG Canada must guarantee the customer liabilities of SCB Canada to the full extent of its regulatory capital which fluctuates based upon business activity. AB has agreed to indemnify SG Canada for 66.7% of any amounts paid by SG Canada under the Canadian Regulatory Guarantee. As of December 31, 2024, there were no unpaid obligations requiring a guarantee by AB.
Commitments
During the fourth quarter of 2024, we entered into a non-exclusive partnership with Reinsurance Group of America, Incorporated (“RGA”) under which we committed to invest $100.0 million in a reinsurance sidecar vehicle sponsored by RGA and focused on the U.S. asset-intensive reinsurance market. AB intends to manage private alternative assets for RGA’s general account as part of a separate transaction. As of December 31, 2024, we have funded $0.1 million of this commitment.
15. Consolidated Company-Sponsored Investment Funds
We regularly provide seed capital to new company-sponsored investment funds. As such, we may consolidate or de-consolidate a variety of company-sponsored investment funds each quarter. Due to the similarity of risks related to our involvement with each company-sponsored investment fund, disclosures required under the VIE model are aggregated, such as disclosures regarding the carrying amount and classification of assets.
We are not required to provide financial support to company-sponsored investment funds and only the assets of such funds are available to settle each fund's own liabilities. Our exposure to loss regarding consolidated company-sponsored investment funds is limited to our investment in, and our management fee earned from, such funds. Equity and debt holders of such funds have no recourse to AB’s assets or to the general credit of AB.
The balances of consolidated VIEs and VOEs included in our consolidated statements of financial condition were as follows:
| | | | | | | | | | | | | | | | | | | | | | | | | | | | | | | | | | | | | | | | | | | | | | |
| December 31, 2024 | December 31, 2023 |
| (in thousands) |
| | | | | | VIEs | | VOEs | | Total | | | | | | VIEs | | VOEs | | Total |
| | | | | | | | | | | | | | | | | | | | |
| | | | | | | | | | | | |
| Cash and cash equivalents | | | | | | $ | 1,671 | | | $ | 318 | | | $ | 1,989 | | | | | | | $ | 7,572 | | | $ | 167 | | | $ | 7,739 | |
| Investments | | | | | | 82,027 | | | 58,765 | | | 140,792 | | | | | | | 286,619 | | | 110,555 | | | 397,174 | |
| Other assets | | | | | | 1,317 | | | 13,484 | | | 14,801 | | | | | | | 15,010 | | | 10,289 | | | 25,299 | |
| Total assets | | | | | | $ | 85,015 | | | $ | 72,567 | | | $ | 157,582 | | | | | | | $ | 309,201 | | | $ | 121,011 | | | $ | 430,212 | |
| Liabilities | | | | | | $ | 345 | | | $ | 1,371 | | | $ | 1,716 | | | | | | | $ | 9,699 | | | $ | 2,838 | | | $ | 12,537 | |
| Redeemable non-controlling interest | | | | | | 31,670 | | | 16,819 | | | 48,489 | | | | | | | 202,882 | | | 6,538 | | | 209,420 | |
| Partners' capital attributable to AB Unitholders | | | | | | 53,000 | | | 54,377 | | | 107,377 | | | | | | | 96,620 | | | 111,635 | | | 208,255 | |
| | | | | | | | | | | | | | | | | | | | |
Total liabilities, redeemable non-controlling interest and partners' capital | | | | | | $ | 85,015 | | | $ | 72,567 | | | $ | 157,582 | | | | | | | $ | 309,201 | | | $ | 121,011 | | | $ | 430,212 | |
| | | | | | | | | | | | | | | | | | | | |
During 2024, we deconsolidated nine funds in which we had seed investments totaling approximately $129.0 million as of December 31, 2023 due to no longer having a controlling financial interest.
Changes in the redeemable non-controlling interest balance during the twelve-month period ended December 31, 2024 are as follows (in thousands):
| | | | | |
| Redeemable non-controlling interest as of December 31, 2023 | $ | 209,420 | |
| Deconsolidated funds | (206,806) | |
| Changes in third-party seed investments in consolidated funds | 45,875 | |
| Redeemable non-controlling interest as of December 31, 2024 | $ | 48,489 | |
Fair Value
Cash and cash equivalents include cash on hand, demand deposits, overnight commercial paper and highly liquid investments with original maturities of three months or less. Due to the short-term nature of these instruments, the recorded value has been determined to approximate fair value.
Valuation of consolidated company-sponsored investment funds' financial instruments by pricing observability levels as of December 31, 2024 and 2023 was as follows (in thousands):
| | | | | | | | | | | | | | | | | | | | | | | | | | | | |
| | Level 1 | Level 2 | Level 3 | | | Total |
| December 31, 2024: | | | | | | | | | | |
| Investments - VIEs | | $ | 15,240 | | | $ | 66,787 | | | $ | — | | | | | $ | 82,027 | |
| Investments - VOEs | | 249 | | | 58,516 | | | — | | | | | 58,765 | |
| Derivatives - VIEs | | 48 | | | 53 | | | — | | | | | 101 | |
| Derivatives - VOEs | | — | | | 11,483 | | | — | | | | | 11,483 | |
| Total assets measured at fair value | | $ | 15,537 | | | $ | 136,839 | | | $ | — | | | | | $ | 152,376 | |
| Derivatives - VIEs | | $ | 72 | | | $ | 13 | | | $ | — | | | | | $ | 85 | |
| | | | | | | | | | |
| Total liabilities measured at fair value | | $ | 72 | | | $ | 13 | | | $ | — | | | | | $ | 85 | |
| December 31, 2023: | | | | | | | | | | |
| Investments - VIEs | | $ | 49,455 | | | $ | 237,164 | | | $ | — | | | | | $ | 286,619 | |
| Investments - VOEs | | 9,036 | | | 101,519 | | | — | | | | | 110,555 | |
| Derivatives - VIEs | | 2,139 | | | 2,763 | | | — | | | | | 4,902 | |
| Derivatives - VOEs | | — | | | 8,775 | | | — | | | | | 8,775 | |
| Total assets measured at fair value | | $ | 60,630 | | | $ | 350,221 | | | $ | — | | | | | $ | 410,851 | |
| | | | | | | | | | |
| Derivatives - VIEs | | $ | 944 | | | $ | 1,587 | | | $ | — | | | | | $ | 2,531 | |
| | | | | | | | | | |
| Total liabilities measured at fair value | | $ | 944 | | | $ | 1,587 | | | $ | — | | | | | $ | 2,531 | |
See Note 9 for a description of the fair value methodologies used for instruments measured at fair value, as well as the general classification of such instruments pursuant to the valuation hierarchy.
There were no Level 3 financial instruments carried at fair value within the consolidated company-sponsored investment funds during the years ended December 31, 2024 and 2023.
Derivative Instruments
As of December 31, 2024 and 2023, the VIEs held zero and $2.4 million (net), respectively, of futures, forwards, options and swaps within their portfolios. For the years ended December 31, 2024 and 2023, we recognized zero and $0.1 million of gains, respectively, on these derivatives. These gains and losses are recognized in investment gains (losses) in the consolidated statements of income.
As of December 31, 2024 and 2023, the VIEs held zero and $1.4 million, respectively, of cash collateral payable to trade counterparties. This obligation to return cash is reported in the liabilities of consolidated company-sponsored investment funds in our consolidated statements of financial condition.
As of December 31, 2024 and 2023, the VIEs delivered $0.3 million and $1.4 million, respectively, of cash collateral into brokerage accounts. The VIEs report this cash collateral in the consolidated company-sponsored investment funds cash and cash equivalents in our consolidated statements of financial condition.
As of December 31, 2024 and 2023, the VOEs held $11.5 million and $8.8 million, respectively, of futures, forwards, options and swaps within their portfolios. For the year ended December 31, 2024 and 2023, we recognized zero and $0.1 million of losses, respectively, on these derivatives. These gains and losses are recognized in investment gains (losses) in the consolidated statements of income.
As of December 31, 2024 and 2023, the VOEs held no cash collateral payable to trade counterparties.
As of December 31, 2024 and 2023, the VOEs delivered no cash collateral in brokerage accounts.
Offsetting Assets and Liabilities
Offsetting of derivative assets of consolidated company-sponsored investment funds as of December 31, 2024 and 2023 was as follows:
| | | | | | | | | | | | | | | | | | | | | | | | | | | | | | | | | | | | | | |
| | Gross Amounts
of Recognized
Assets | Gross Amounts
Offset in the
Statement of
Financial
Condition | Net Amounts of
Assets
Presented in the
Statement of
Financial
Condition | Financial
Instruments | Cash Collateral
Received | Net
Amount |
| | (in thousands) |
| December 31, 2024: | | | | | | | | | | | | |
| Derivatives - VIEs | | $ | 101 | | | $ | — | | | $ | 101 | | | $ | — | | | $ | (2) | | | $ | 99 | |
| Derivatives - VOEs | | 11,483 | | | — | | | 11,483 | | | — | | | — | | | 11,483 | |
| December 31, 2023: | | | | | | | | | | | | |
| Derivatives - VIEs | | $ | 4,902 | | | $ | — | | | $ | 4,902 | | | $ | — | | | $ | (1,415) | | | $ | 3,487 | |
| | | | | | | | | | | | |
Offsetting of derivative liabilities of consolidated company-sponsored investment funds as of December 31, 2024 and 2023 was as follows:
| | | | | | | | | | | | | | | | | | | | | | | | | | | | | | | | | | | | | | |
| | Gross
Amounts of
Recognized
Liabilities | Gross Amounts
Offset in the
Statement of
Financial
Condition | Net Amounts
of Liabilities
Presented in the
Statement of
Financial
Condition | Financial
Instruments | Cash Collateral
Pledged | Net
Amount |
| | (in thousands) |
| December 31, 2024: | | | | | | | | | | | | |
| Derivatives - VIEs | | $ | 85 | | | $ | — | | | $ | 85 | | | $ | — | | | $ | (85) | | | $ | — | |
| | | | | | | | | | | | |
| December 31, 2023: | | | | | | | | | | | | |
| Derivatives - VIEs | | $ | 2,531 | | | $ | — | | | $ | 2,531 | | | $ | — | | | $ | (1,408) | | | $ | 1,123 | |
| | | | | | | | | | | | |
Cash collateral, whether pledged or received on derivative instruments, is not considered material and, accordingly, is not disclosed by counterparty.
Non-Consolidated VIEs
As of December 31, 2024, the net assets of company-sponsored investment products that are non-consolidated VIEs are approximately $46.9 billion; our maximum risk of loss is our investment of $17.3 million in these VIEs and our advisory fees receivable from these VIEs are $115.2 million. As of December 31, 2023, the net assets of company-sponsored investment products that were non-consolidated VIEs was approximately $54.6 billion; our maximum risk of loss was our investment of $10.3 million in these VIEs and our advisory fees receivable from these VIEs were $114.5 million.
16. Net Capital
SCB LLC is registered as a broker-dealer under the Exchange Act and is subject to the minimum net capital requirements imposed by the U.S. Securities and Exchange Commission ("SEC"). SCB LLC computes its net capital under the alternative method permitted by the applicable rule, which requires that minimum net capital, as defined, equals the greater of $1.5 million or two percent of aggregate debit items arising from customer transactions, as defined. As of December 31, 2024, SCB LLC had net capital of $190.4 million, which was $161.7 million in excess of the required minimum net capital requirement of $28.7 million. Advances, dividend payments and other equity withdrawals by SCB LLC are restricted by regulations imposed by the SEC, the Financial Industry Regulatory Authority, Inc., and other securities agencies.
AllianceBernstein Investments, Inc. ("ABI"), another one of our subsidiaries and the distributor and/or underwriter for certain company-sponsored mutual funds, is registered as a broker-dealer under the Exchange Act and is subject to the minimum net capital requirements imposed by the SEC. As of December 31, 2024, ABI had net capital of $27.5 million, which was $27.2 million in excess of its required minimum net capital of $0.3 million.
Our U.K.-based broker-dealer and various international subsidiaries which were subject to minimum net capital requirements were contributed to the joint ventures effective April 1, 2024. See Note 24 Divestitures for further discussion.
17. Counterparty Risk
Customer Activities
In the normal course of business, brokerage activities involve the execution, settlement and financing of various customer securities trades, which may expose our broker-dealer operations to off-balance sheet risk by requiring us to purchase or sell securities at prevailing market prices in the event the customer is unable to fulfill its contractual obligations.
Our customer securities activities are transacted on either a cash or margin basis. In margin transactions, we extend credit to the customer, subject to various regulatory and internal margin requirements. These transactions are collateralized by cash or securities in the customer’s account. In connection with these activities, we may execute and clear customer transactions involving the sale of securities not yet purchased. We seek to control the risks associated with margin transactions by requiring customers to maintain collateral in compliance with the aforementioned regulatory and internal guidelines. We monitor required margin levels daily and, pursuant to such guidelines, require customers to deposit additional collateral, or reduce positions, when necessary. A majority of our customer margin accounts are managed on a discretionary basis whereby we maintain control over the investment activity in the accounts. For these discretionary accounts, our margin deficiency exposure is minimized by our maintaining a diversified portfolio of securities in the accounts, our discretionary authority and our U.S.-based broker-dealer's role as custodian.
In accordance with industry practice, we record customer transactions on a settlement date basis. We are exposed to risk of loss on these transactions in the event of the customer’s inability to meet the terms of their contracts, in which case we may have to purchase or sell financial instruments at prevailing market prices. The risks we assume in connection with these transactions are not expected to have a material adverse effect on our financial condition or results of operations.
Other Counterparties
We are engaged in various brokerage, futures, forwards, options and swap activities on behalf of clients, in which counterparties primarily include broker-dealers, banks and other financial institutions. In the event these counterparties do not fulfill their obligations, our clients and we may be exposed to loss. The risk of default depends on the creditworthiness of the counterparty. It is our policy to review, as necessary, each counterparty’s creditworthiness.
In connection with security borrowing and lending arrangements, we enter into collateralized agreements, which may result in potential loss in the event the counterparty to a transaction is unable to fulfill its contractual obligations. Security borrowing arrangements require us to deposit cash collateral with the lender. With respect to security lending arrangements, we receive collateral in the form of cash in amounts generally in excess of the market value of the securities loaned. We attempt to mitigate credit risk associated with these activities by establishing credit limits for each broker and monitoring these limits on a daily basis. Additionally, security borrowing and lending collateral is marked to market on a daily basis, and additional collateral is deposited by or returned to us as necessary.
Through the normal course of business, we may have bank deposits that exceed FDIC insurance limits. A failure of the bank could lead to losses on our deposits. These deposits levels are often temporary, and we attempt to mitigate this risk by using high quality banks that are systemically important.
We enter into various futures, forwards, options and swaps primarily to economically hedge certain of our seed money investments. We may be exposed to credit losses in the event of nonperformance by counterparties to these derivative financial instruments. See Note 7, Derivative Instruments for further discussion.
18. Qualified Employee Benefit Plans
We maintain a qualified profit sharing plan covering U.S. employees and certain foreign employees. Employer contributions are discretionary and generally limited to the maximum amount deductible for federal income tax purposes. Aggregate contributions were $19.7 million, $19.0 million and $17.5 million for 2024, 2023 and 2022, respectively.
We maintain several defined contribution plans for foreign employees working for our subsidiaries in the United Kingdom, Australia, Japan and other locations outside the United States. Employer contributions generally are consistent with regulatory requirements and tax limits. Defined contribution expense for foreign entities was $9.3 million, $11.7 million and $10.2 million in 2024, 2023 and 2022, respectively.
We maintain a qualified, noncontributory, defined benefit retirement plan (the “Retirement Plan”) covering current and former employees who were employed by AB in the United States prior to October 2, 2000. Benefits accrue under the plan based on years of credited service, average final base salary (as defined in the Retirement Plan) and primary Social Security benefits. Service and compensation after December 31, 2008 are not taken into account in determining participants’ retirement benefits.
During 2024, the Compensation Committee of the AB Board of Directors approved the termination of the Retirement Plan, effective May 22, 2024. We began the process of settling benefits with vested participants and all lump sum disbursements elected by plan participants were distributed in December 2024 in the amount of $35.0 million. The remaining retirement plan participants who did not elect a lump sum disbursement elected to roll over their benefit to a group annuity contract from a qualified insurance company to administer all future payments. During the year ended December 31, 2024, we recognized a non-cash settlement charge of approximately $13.1 million related to Retirement Plan losses and the reclassification from accumulated other comprehensive loss to general and administrative expenses in the consolidated statements of income. The company will elect the qualified insurance company to administer all future payments during the first quarter of 2025 at which point, the remaining benefit obligation will be purchased by the insurance carrier and we will fully terminate the plan and recognize a gain or loss on the pension settlement at that time. As of December 31, 2024 the Retirement Plan was underfunded with a benefit obligation of $68.6 million and plan assets of $63.3 million.
Our policy is to satisfy our funding obligation for each year in an amount not less than the minimum required by ERISA and not greater than the maximum amount we can deduct for federal income tax purposes. We did not make a contribution to the Retirement Plan during 2024. The Company expects to make a contribution to the Retirement Plan during the first quarter of 2025 in the amount of $5.3 million to fully fund the Retirement Plan, purchase the group annuity contract and settle the remaining termination costs associated with the Retirement Plan.
The Retirement Plan’s projected benefit obligation, fair value of plan assets and funded status (amounts recognized in the consolidated statements of financial condition) were as follows:
| | | | | | | | | | | | | | |
| Years Ended December 31 |
| 2024 | 2023 |
| (in thousands) |
| Change in projected benefit obligation: | | | | |
| Projected benefit obligation at beginning of year | | $ | 98,426 | | | $ | 100,480 | |
| Interest cost | | 5,025 | | | 5,199 | |
| | | | |
| Plan settlements | | (39,246) | | | — | |
| Actuarial loss (gain) | | 7,655 | | | (984) | |
| Benefits paid | | (3,281) | | | (6,269) | |
| Projected benefit obligation at end of year | | 68,579 | | | 98,426 | |
| Change in plan assets: | | | | |
| Plan assets at fair value at beginning of year | | 101,376 | | | 95,990 | |
| Actual return on plan assets | | 4,476 | | | 11,655 | |
| | | | |
| Plan settlements | | (39,246) | | | — | |
| Benefits paid | | (3,281) | | | (6,269) | |
| Plan assets at fair value at end of year | | 63,325 | | | 101,376 | |
| Funded status | | $ | (5,254) | | | $ | 2,950 | |
Effective December 31, 2015, the Retirement Plan was amended to change the actuarial basis used for converting a life annuity benefit to optional forms of payment and converting benefits payable at age 65 to earlier commencement dates. This prior service cost will be amortized over future years.
The amounts recognized in other comprehensive income for the Retirement Plan for 2024, 2023 and 2022 were as follows:
| | | | | | | | | | | | | | | | | | | | |
| 2024 | 2023 | 2022 |
| (in thousands) |
| Unrecognized net gain from experience different from that assumed and effects of changes and assumptions | | $ | 5,534 | | | $ | 8,815 | | | $ | 6,519 | |
| Prior service cost | | 24 | | | 24 | | | 24 | |
| | 5,558 | | | 8,839 | | | 6,543 | |
| Income tax (expense) | | (20) | | | (9) | | | (33) | |
| Other comprehensive income | | $ | 5,538 | | | $ | 8,830 | | | $ | 6,510 | |
The gain of $5.5 million recognized in 2024 was primarily due to lump sum settlement activity of $13.7 million ($13.1 million of settlement related gains recognized from accumulated other comprehensive income to a realized loss on the consolidated statements of income during the year ended December 31, 2024 and $0.6 million of pension cost amortization) offset by a loss of ($8.2 million). The loss of ($8.2 million) reflects a decrease in the discount rate due to plan termination assumptions using a yield curve rather than ongoing accounting basis assumptions using a bond model increasing the benefit obligation by ($2.2 million), termination pricing increasing the obligation by ($5.7 million) and a loss on plan assets of ($0.6 million), offset by new census data of $0.3 million.
The gain of $8.8 million recognized in 2023 was primarily due to actual earnings exceeding expected earnings on plan assets of ($6.9 million), the recognized actuarial loss of ($0.9 million) changes in the discount rate and lump sum interest rates of ($0.5 million), and changes in the census data ($0.5 million).
The gain of $6.5 million recognized in 2022 was primarily due to changes in the discount rate and lump sum interest rates of ($38.7 million), settlement loss recognized of ($1.7 million) and the recognized actuarial loss of ($1.0 million), offset by actual earnings less than expected earnings on plan assets of ($34.0 million), changes in the census data ($0.5 million) and changes in adjustments for participants who received their pension as a lump sum ($0.4 million).
Foreign retirement plans and an individual's retirement plan maintained by AB are not material to AB's consolidated financial statements. As such, disclosure for these plans is not necessary. The reconciliation of the 2024 amounts recognized in other comprehensive income for the Retirement Plan as compared to the consolidated statement of comprehensive income (the "OCI Statement") is as follows:
| | | | | | | | | | | | | | | | | | | | | | | | | | |
| Retirement
Plan | Retired
Individual Plan | Foreign
Retirement
Plans | OCI
Statement |
| (in thousands) |
| Recognized actuarial gain | | $ | 5,534 | | | $ | 573 | | | $ | 328 | | | $ | 6,435 | |
| Amortization of prior service cost | | 24 | | | — | | | — | | | 24 | |
| Changes in employee benefit related items | | 5,558 | | | 573 | | | 328 | | | 6,459 | |
| Income tax (expense) | | (20) | | | (4) | | | (65) | | | (89) | |
| Employee benefit related items, net of tax | | $ | 5,538 | | | $ | 569 | | | $ | 263 | | | $ | 6,370 | |
The amounts included in accumulated other comprehensive loss for the Retirement Plan as of December 31, 2024 and 2023 were as follows:
| | | | | | | | | | | | | | |
| 2024 | 2023 |
| (in thousands) |
| Unrecognized net loss from experience different from that assumed and effects of changes and assumptions | | $ | (22,899) | | | $ | (28,433) | |
| Prior service cost | | (611) | | | (635) | |
| | (23,510) | | | (29,068) | |
| Income tax benefit | | 147 | | | 168 | |
| Accumulated other comprehensive loss | | $ | (23,363) | | | $ | (28,900) | |
The loss for the Retirement Plan from accumulated other comprehensive loss will be recognized as a realized loss to the consolidated statements of income upon plan settlement in 2025.
The accumulated benefit obligation for the plan was $68.6 million and $98.4 million as of December 31, 2024 and 2023, respectively.
The discount rates used to determine benefit obligations as of December 31, 2024 and 2023 (measurement dates) were 5.15% and 5.40%, respectively. The discount rate to determine the benefit obligation as of December 31, 2024 has been adjusted by the annuity purchase premium to estimate the impending annuity purchase in 2025.
Benefit payments are expected to be paid as follows (in thousands):
Net expense under the Retirement Plan consisted of:
| | | | | | | | | | | | | | | | | | | | |
| Years Ended December 31 |
| 2024 | 2023 | 2022 |
| (in thousands) |
| Interest cost on projected benefit obligations | | $ | 5,025 | | | $ | 5,199 | | | $ | 3,958 | |
| Expected return on plan assets | | (5,056) | | | (4,776) | | | (6,591) | |
| Amortization of prior service cost | | 24 | | | 24 | | | 24 | |
| Settlement loss recognized | | 13,104 | | | — | | | 1,678 | |
| Recognized actuarial loss | | 666 | | | 952 | | | 1,042 | |
| Net pension expense | | $ | 13,763 | | | $ | 1,399 | | | $ | 111 | |
Actuarial computations used to determine net periodic costs were made utilizing the following weighted-average assumptions:
| | | | | | | | | | | |
| Years Ended December 31 |
| 2024 | 2023 | 2022 |
| Discount rate on benefit obligations | 5.40 | % | 5.50 | % | 2.90 | % |
| Expected long-term rate of return on plan assets | 5.25 | % | 5.25 | % | 5.25 | % |
In developing the expected long-term rate of return on plan assets of 5.25%, management considered the historical returns and future expectations for returns for each asset category, as well as the target asset allocation of the portfolio. The expected long-term rate of return on assets is based on weighted average expected returns for each asset class.
As of December 31, 2024, the mortality projection assumption used the generational MP-2021 improvement scale, which is consistent with the improvement scale used in 2023 and 2022. The base mortality assumption used is the Society of Actuaries PRI-2012 base mortality table for private sector plans, with a white-collar adjustment, using the contingent annuitant table for beneficiaries of deceased participants.
For fiscal year-end 2024, we reflected the most recently published Internal Revenue Service table for lump sums paid in 2024.
The Retirement Plan’s asset allocation percentages consisted of:
| | | | | | | | |
| Years Ended December 31 |
| 2024 | 2023 |
| Equity | — | % | 28 | % |
| Debt securities | 88 | | 62 | |
| Other | 12 | | 10 | |
| Total | 100 | % | 100 | % |
The Investment Committee oversees investments for the benefit of the Retirement Plan. The objective of the investment program is to closely match the potential plan termination liability and to minimize funded status volatility, thereby promoting the ongoing ability of the Retirement Plan to meet future liabilities and obligations, while minimizing the need for additional contributions and managing the Retirement Plan’s funded status appropriately. The asset allocation was updated to 100% liability hedging investments (cash and cash equivalents) in light of the pending Retirement Plan termination.
See Note 9, Fair Value for a description of how we measure the fair value of our plan assets.
The valuation of our Retirement Plan assets by pricing observability levels as of December 31, 2024 and 2023 was as follows (in thousands):
| | | | | | | | | | | | | | | | | | | | | | | | | | |
| Level 1 | Level 2 | Level 3 | Total |
| December 31, 2024 | | | | | | | | |
| Cash | | $ | 5,618 | | | $ | — | | | $ | — | | | $ | 5,618 | |
| | | | | | | | |
| | | | | | | | |
| Fixed income securities | | — | | | 55,839 | | | — | | | 55,839 | |
| | | | | | | | |
| | | | | | | | |
| | | | | | | | |
| Investments measured at net assets value | | — | | | — | | | — | | | 1,868 | |
| Investments at fair value | | $ | 5,618 | | | $ | 55,839 | | | $ | — | | | $ | 63,325 | |
| | | | | | | | |
| | | | | | | | |
| | | | | | | | |
| | | | | | | | | | | | | | | | | | | | | | | | | | |
| Level 1 | Level 2 | Level 3 | Total |
| December 31, 2023 | | | | | | | | |
| Cash | | $ | 944 | | | $ | — | | | $ | — | | | $ | 944 | |
| U.S. Treasury Strips | | — | | | 15,764 | | | — | | | 15,764 | |
| Fixed income mutual funds | | 2,271 | | | — | | | — | | | 2,271 | |
| Fixed income securities | | — | | | 46,443 | | | — | | | 46,443 | |
| Equity mutual funds | | 9,821 | | | — | | | — | | | 9,821 | |
| Equity securities | | 10,231 | | | — | | | — | | | 10,231 | |
| Total assets in the fair value hierarchy | | 23,267 | | | 62,207 | | | — | | | 85,474 | |
| Investments measured at net assets value | | — | | | — | | | — | | | 15,902 | |
| Investments at fair value | | $ | 23,267 | | | $ | 62,207 | | | $ | — | | | $ | 101,376 | |
During 2024 the Retirement Plan's investments include the following:
•fixed income securities primarily invested in bonds and included as a level 2 security;
During 2023 the Retirement Plan's investments include the following:
•one multi asset fund in 2023, in which the fund pursued an aggressive investment strategy involving a variety of asset classes. This fund seeks inflation protection from investments around the globe, both in developed and emerging market countries;
•six equity mutual funds in 2023, which focus on both U.S.-based and non-U.S.-based equity securities of various capitalization sizes ranging from small to large capitalization and diversified portfolios within those capitalization ranges;
•one asset allocation mutual which was liquidated in 2023;
•one separately managed account in 2023, managed against the Bloomberg Long U.S. Corporate index. This portfolio invests in U.S. dollar denominated investment grade fixed income securities with at least 10 years to maturity;
•investments measured at net asset value, including one hedge fund in 2023. The hedge fund seeks to provide attractive risk-adjusted returns over full market cycles with less volatility than that of broad equity markets by allocating all or substantially all of their assets among portfolio managers through portfolio funds that employ a broad range of investment strategies.
19. Long-term Incentive Compensation Plans
We maintain an unfunded, non-qualified incentive compensation program known as the AllianceBernstein Incentive Compensation Award Program (the “Incentive Compensation Program”), under which annual awards may be granted to eligible employees. See Note 2 "Summary of Significant Accounting Policies – Long-Term Incentive Compensation Plans" for a discussion of the award provisions.
Under the Incentive Compensation Program, we made awards in 2024, 2023 and 2022 aggregating $184.3 million, $170.2 million and $164.3 million, respectively. The amounts charged to employee compensation and benefits expense for the years ended December 31, 2024, 2023 and 2022 were $208.0 million, $183.0 million and $160.1 million, respectively.
Effective as of September 30, 2017, we established the AB 2017 Long Term Incentive Plan (“2017 Plan”), which was adopted at a special meeting of AB Holding Unitholders held on September 29, 2017. The following forms of awards may be granted to employees and Eligible Directors (directors who satisfy applicable independence standards) under the 2017 Plan: (i) restricted AB Holding Units or phantom restricted AB Holding Units (a “phantom” award is a contractual right to receive AB Holding Units at a later date or upon a specified event); (ii) options to buy AB Holding Units; and (iii) other AB Holding Unit-based awards (including, without limitation, AB Holding Unit appreciation rights and performance awards). The purpose of the 2017 Plan is to promote the interest of AB by: (i) attracting and retaining talented officers, employees and directors, (ii) motivating such officers, employees and directors by means of performance-related incentives to achieve longer-range business and
operational goals, (iii) enabling such officers, employees and directors to participate in the long-term growth and financial success of AB, and (iv) aligning the interests of such officers, employees and directors with those of AB Holding Unitholders. The 2017 Plan will expire on September 30, 2027, and no awards under the 2017 Plan will be made after that date. Under the 2017 Plan, the aggregate number of AB Holding Units with respect to which awards may be granted is 60 million, including no more than 30 million newly-issued AB Holding Units.
As of December 31, 2024, 35,854,070 AB Holding Units, net of withholding tax requirements, were subject to other AB Holding Unit awards made under the 2017 Plan or the AllianceBernstein 2010 Long Term Incentive Plan, as amended, an equity compensation plan with similar terms that was canceled on September 30, 2017. AB Holding Unit-based awards in respect of 24,145,930 AB Holding Units were available for grant under the 2017 Plan as of December 31, 2024.
As of December 31, 2023, 32,738,157 AB Holding Units, net of withholding tax requirements, were subject to other AB Holding Unit awards made under the 2017 Plan or the AllianceBernstein 2010 Long Term Incentive Plan, as amended, an equity compensation plan with similar terms that was canceled on September 30, 2017. AB Holding Unit-based awards in respect of 27,261,843 AB Holding Units were available for grant under the 2017 Plan as of December 31, 2023.
Clawbacks
The award agreement contained in the Incentive Compensation Program permits AB to clawback the unvested portion of an award if the recipient fails to adhere to our risk management policies. Further, pursuant to Rule 10D-1 of the Securities Exchange Act of 1934 (the "Rule") and Section 303A.14 of the NYSE Listed Company Manual, the Board of Directors (the "Board") has adopted a Compensation Recovery Policy (the "Policy") effective November 15, 2023. Pursuant to the Policy, the Company will promptly recover erroneously awarded incentive-based compensation (as defined by section 10D(b)(1) to include any compensation that is granted, earned or vested wholly or in part upon attainment of a financial reporting measure) from any current or former Executive Officer of the Company as defined by Rule 10D-1 of the Exchange Act as required under the Exchange Act and the NYSE Listed Company Manual. The company does not currently award incentive-based compensation as defined by the Rule. We have filed the Policy as Exhibit 97.01 to this Form 10-K.
The portion of incentive-based compensation received from EQH specific to Seth Bernstein, our Chief Executive Officer, and Onur Erzan, our Head of Global Client Group and Private Wealth, is covered under the Compensation Recovery Policy adopted by our parent EQH and will be applicable to any current or previous incentive-based compensation received directly from our parent company by Mr. Bernstein and Mr. Erzan.
Restricted AB Holding Unit Awards
In 2024, 2023 and 2022, the Board granted restricted AB Holding Unit awards to Eligible Directors. These AB Holding Units give the Eligible Directors, in most instances, all the rights of other AB Holding Unitholders, subject to such restrictions on transfer as the Board may impose.
We award restricted AB Holding Units to Eligible Directors that vest ratably over three years. We fully expensed these awards on each grant date, as there is no service requirement. Grant details related to these awards is as follows:
| | | | | | | | | | | | | | | | | | | | |
| 2024 | 2023 | 2022 |
| Restricted Units Awarded | | 29,952 | | | 30,102 | | | 30,870 | |
| Weighted Average Grant Date Fair Value | | $ | 34.06 | | | $ | 33.89 | | | $ | 38.55 | |
| Compensation Expense (in millions) | | $ | 1.0 | | | $ | 1.0 | | | $ | 1.2 | |
Under the Incentive Compensation Program, we awarded 4.7 million restricted AB Holding Units in 2024 (which included 4.4 million restricted AB Holding Units in December for the 2024 year-end awards as well as 0.3 million additional restricted AB Holding Units granted earlier during the year relating to the 2023 year-end awards), with grant date fair values per restricted AB Holding Unit ranging between $30.56 to $36.19.
We awarded 5.2 million restricted AB Holding Units in 2023 (which included 5.0 million restricted AB Holding Units in December for the 2023 year-end awards as well as 0.2 million additional restricted AB Holding Units granted earlier during the year relating to the 2022 year-end awards), with grant date fair values per restricted AB Holding Unit ranging between $30.56 to $38.84.
We awarded 4.2 million restricted AB Holding Units in 2022 (which included 3.8 million restricted AB Holding Units in December for the 2022 year-end awards as well as 0.4 million additional restricted AB Holding Units granted earlier during the year related to the 2021 year-end awards), with grant date fair values per restricted AB Holding Unit ranging between $38.84 to $50.94.
Restricted AB Holding Units awarded under the Incentive Compensation Program generally vest in 33.3% increments on December 1st of each of the three years immediately following the year in which the award is granted.
We also award restricted AB Holding Units in connection with certain employment and separation agreements, as well as relocation-related performance awards, with vesting schedules generally ranging between two and ten years. Grant details related to these awards is as follows:
| | | | | | | | | | | | | | | | | | | | |
| 2024 | 2023 | 2022 |
| (in millions excluding share prices) |
| Restricted Units Awarded | | 1.2 | | | 0.5 | | | 0.5 | |
| Grant Date Fair Value Range | $28.46 - $37.26 | $27.86 - $38.58 | $34.86 - $49.90 |
| Compensation Expense | | $ | 17.6 | | | $ | 30.1 | | | $ | 35.0 | |
The fair value of the restricted AB Holding Units is amortized over the requisite service period as compensation expense. Changes in unvested restricted AB Holding Units during 2024 are as follows:
| | | | | | | | | | | |
| AB Holding
Units | Weighted Average
Grant Date Fair
Value per AB Holding
Unit |
| Unvested as of December 31, 2023 | 13,447,555 | | | $ | 35.02 | |
| Granted | 5,922,324 | | | 35.29 | |
| Vested | (6,740,540) | | | 36.26 | |
| Forfeited | (210,088) | | | 35.15 | |
| Unvested as of December 31, 2024 | 12,419,251 | | | $ | 34.47 | |
The total grant date fair value of restricted AB Holding Units that vested was $244.4 million, $235.8 million and $246.2 million during 2024, 2023 and 2022, respectively. As of December 31, 2024, the 12,419,251 unvested restricted AB Holding Units consist of 9,189,286 restricted AB Holding Units that do not have a service requirement and have been fully expensed on the grant date and 3,229,965 restricted AB Holding Units that have a service requirement and will be expensed over the required service period. As of December 31, 2024, there was $93.5 million of compensation expense related to unvested restricted AB Holding Unit awards granted and not yet recognized in the consolidated statement of income. We expect to recognize the expense over a weighted average period of 5.39 years.
20. Units Outstanding
Changes in AB Units outstanding for the years ended December 31, 2024 and 2023 were as follows:
| | | | | | | | |
| 2024 | 2023 |
| Outstanding as of January 1, | 286,609,212 | | 285,979,913 | |
| | |
Units issued (1) | 12,627,827 | | 3,283,594 | |
Units retired(2) (3) | (7,129,132) | | (2,654,295) | |
| Outstanding as of December 31, | 292,107,907 | | 286,609,212 | |
On December 19, 2024, the company entered into a master exchange agreement with EQH providing for the issuance by AB of up to 10,000,000 units representing assignments of beneficial ownership of limited partnership interests in AB (“AB Units”) to EQH in exchange for an equal number of AB Holding Units owned by EQH, with such exchanges to occur over the next two years. Each AB Holding Unit exchanged will be retired following the exchange. On December 19, 2024, EQH and AB exchanged 5,211,194 AB Units for AB Holding Units and the AB Holding Units were retired. See Exhibit 10.32 to this Form 10-K for further details.
In addition to the master exchange agreement, on December 19, 2024, AB entered into a purchase agreement providing for, and consummated, the sale by AB of 4,215,140 AB Units to EQH.
(1)Includes 4,215,140 and 5,211,194 Units issued in connection with a separate purchase and master exchange agreement entered into with EQH on December 19, 2024, respectively. See Exhibit 10.32 and 10.33 to this Form 10-K.
(2)Includes 5,211,194 Units retired in connection with a master exchange agreement entered into with EQH on December 19, 2024. See Exhibit 10.32 to this Form 10-K.
(3)During 2024 and 2023, we purchased 21,877 and 5,695 AB Units, respectively, in private transactions and retired them.
21. Income Taxes
AB, a private limited partnership, is not subject to federal or state corporate income taxes. However, AB is subject to a 4.0% New York City unincorporated business tax (“UBT”). Our domestic corporate subsidiaries are subject to federal, state and local income taxes, and generally are included in the filing of a consolidated federal income tax return. Separate state and local income tax returns also are filed. Foreign corporate subsidiaries generally are subject to taxes in the jurisdictions where they are located.
In order to preserve AB’s status as a private partnership for federal income tax purposes, AB Units must not be considered publicly traded. The AB Partnership Agreement provides that all transfers of AB Units must be approved by EQH and the General Partner; EQH and the General Partner approve only those transfers permitted pursuant to one or more of the safe harbors contained in the relevant Treasury regulations. If AB Units were considered readily tradable, AB’s net income would be subject to federal and state corporate income tax, significantly reducing its quarterly distribution to AB Holding. Furthermore, should AB enter into a substantial new line of business, AB Holding, by virtue of its ownership of AB, would lose its status as a publicly traded partnership and would become subject to corporate income tax, which would reduce materially AB Holding’s net income and its quarterly distributions to AB Holding Unitholders.
Earnings before income taxes and income tax expense consist of:
| | | | | | | | | | | | | | | | | | | | |
| Years Ended December 31 |
| 2024 | 2023 | 2022 |
| (in thousands) |
| Earnings before income taxes: | | | | | | |
| United States | | $ | 1,075,305 | | | $ | 714,732 | | | $ | 689,278 | |
| Foreign | | 183,323 | | | 102,938 | | | 125,818 | |
| Total | | $ | 1,258,628 | | | $ | 817,670 | | | $ | 815,096 | |
| Income tax expense: | | | | | | |
| Partnership UBT | | $ | 12,458 | | | $ | 7,838 | | | $ | 5,996 | |
| Corporate subsidiaries: | | | | | | |
| Federal | | 899 | | | 2,855 | | | 1,457 | |
| State and local | | 1,345 | | | 914 | | | 931 | |
| Foreign | | 51,764 | | | 35,906 | | | 34,327 | |
| Current tax expense | | 66,466 | | | 47,513 | | | 42,711 | |
| Deferred tax | | (1,323) | | | (18,462) | | | (3,072) | |
| Income tax expense | | $ | 65,143 | | | $ | 29,051 | | | $ | 39,639 | |
The principal reasons for the difference between the effective tax rates and the UBT statutory tax rate of 4.0% are as follows:
| | | | | | | | | | | | | | | | | | | | | | | | | | | | | | | | | | | | | | |
| Years Ended December 31 |
| 2024 | 2023 | 2022 |
| (in thousands) |
| UBT statutory rate | | $ | 50,345 | | | 4.0 | % | | $ | 32,707 | | | 4.0 | % | | $ | 32,604 | | | 4.0 | % |
| Corporate subsidiaries' federal, state, and local | | 2,236 | | | 0.2 | | | 4,538 | | | 0.6 | | | 1,460 | | | 0.2 | |
| Foreign subsidiaries taxed at different rates | | 42,384 | | | 3.4 | | | 36,788 | | | 4.5 | | | 32,664 | | | 4.0 | |
| FIN 48 reserve (release) | | — | | | — | | | (2,838) | | | (0.3) | | | — | | | — | |
| UBT business allocation percentage rate change | | (634) | | | (0.1) | | | (1,049) | | | (0.1) | | | (98) | | | — | |
| Deferred tax and payable write-offs | | 911 | | | 0.1 | | | 1,750 | | | 0.2 | | | 1,089 | | | 0.1 | |
| Foreign outside basis difference | | 126 | | | — | | | 3,414 | | | 0.4 | | | (1,535) | | | (0.2) | |
| Valuation allowance reserve (release) | | (16) | | | — | | | (22,447) | | | (2.7) | | | — | | | — | |
| Effect of ASC 740 adjustments, miscellaneous taxes, and other | | 3,474 | | | 0.3 | | | 3,553 | | | 0.4 | | | 5,366 | | | 0.7 | |
| Tax Credits | | (29) | | | — | | | (1,604) | | | (0.2) | | | (5,275) | | | (0.6) | |
| Income not taxable resulting from use of UBT business apportionment factors and effect of compensation charge | | (33,654) | | | (2.7) | | | (25,761) | | | (3.2) | | | (26,636) | | | (3.3) | |
| Income tax expense and effective tax rate | | $ | 65,143 | | | 5.2 | % | | $ | 29,051 | | | 3.6 | % | | $ | 39,639 | | | 4.9 | % |
We recognize the effects of a tax position in the financial statements only if, as of the reporting date, it is “more likely than not” to be sustained based on its technical merits and its applicability to the facts and circumstances of the tax position. In making this assessment, we assume that the taxing authority will examine the tax position and have full knowledge of all relevant information.
A reconciliation of the beginning and ending amount of unrecognized tax benefits is as follows:
| | | | | | | | | | | | | | | | | | | | |
| Years Ended December 31 |
| 2024 | 2023 | 2022 |
| (in thousands) |
| Balance as of beginning of period | | $ | — | | | $ | 2,838 | | | $ | 2,838 | |
| Additions for prior year tax positions | | — | | | — | | | — | |
| Reductions for prior year tax positions | | — | | | — | | | — | |
| Additions for current year tax positions | | — | | | — | | | — | |
| Reductions for current year tax positions | | — | | | — | | | — | |
| Reductions related to closed years/settlements with tax authorities | | — | | | (2,838) | | | — | |
| Balance as of end of period | | $ | — | | | $ | — | | | $ | 2,838 | |
The amount of unrecognized tax benefits as of December 31, 2024, 2023, and 2022, when recognized, is recorded as a reduction to income tax expense and reduces the company’s effective tax rate.
Interest and penalties, if any, relating to tax positions are recorded in income tax expense on the consolidated statements of income. As of December 31, 2024, 2023, and 2022, there is no accrued interest or penalties recorded on the consolidated statements of financial condition.
Generally, the company is no longer subject to U.S. federal, state or local income tax examinations by tax authorities for any year prior to 2020, except as set forth below.
During the third quarter of 2023, the City of New York notified us of an examination of AB's UBT returns for the years 2020 through 2021. The examination is ongoing and no provision with respect to this examination has been recorded.
Currently, there are no income tax examinations at our significant non-U.S. subsidiaries. Years that remain open and may be subject to examination vary under local law and range from one to seven years.
Deferred income taxes reflect the net tax effect of temporary differences between the carrying amounts of assets and liabilities for financial reporting purposes and the amounts used for income tax purposes. The tax effect of significant items comprising the net deferred tax asset (liability) is as follows:
| | | | | | | | | | | | | | |
| Years Ended December 31 |
| 2024 | 2023 |
| (in thousands) |
| Deferred tax asset: | | | | |
| Differences between book and tax basis: | | | | |
| Benefits from net operating loss carryforwards | | $ | 14,242 | | | $ | 11,360 | |
| Long-term incentive compensation plans | | 11,295 | | | 12,519 | |
| Investment basis differences | | 12,977 | | | 11,890 | |
| Depreciation and amortization | | 3,647 | | | 3,706 | |
| Lease liability | | 5,940 | | | 4,324 | |
| Investment in foreign subsidiaries | | — | | | 33,427 | |
| Capital loss carryforward | | 34,069 | | | — | |
| Tax credits carryforward | | 5,300 | | | 5,710 | |
| Other, primarily accrued expenses deductible when paid | | 9,181 | | | 8,988 | |
| | 96,651 | | | 91,924 | |
| Less: valuation allowance | | (25,996) | | | (28,579) | |
| Deferred tax asset | | 70,655 | | | 63,345 | |
| Deferred tax liability: | | | | |
| Differences between book and tax basis: | | | | |
| Intangible assets | | 12,254 | | | 11,454 | |
| Investment in foreign subsidiaries | | 5,697 | | | — | |
| Right-of-use asset | | 5,168 | | | 3,730 | |
| Other | | 2,485 | | | 3,020 | |
| Deferred tax liability | | 25,604 | | | 18,204 | |
| Net deferred tax asset | | $ | 45,051 | | | $ | 45,141 | |
Valuation allowances of $26.0 million and $28.6 million were established as of December 31, 2024 and 2023, respectively, primarily due to significant negative evidence that capital losses generated in the sale of foreign subsidiaries will not be utilized, given the nature of income expected to be incurred by the applicable subsidiaries. As a result of the deconsolidation of BRS and contribution to the JVs in 2024, capital loss carry forwards of $140.2 million were generated from the contribution of foreign entities into the JV’s and was reflected in the prior year as an investment in subsidiaries deferred tax asset. The capital loss carryforward has a five year expiration period. We had net operating loss carryforwards at December 31, 2024 and 2023 of approximately $56.7 million and $44.0 million, respectively, in certain foreign locations with a five year expiration period.
The deferred tax asset is included in other assets in our consolidated statement of financial condition. Management believes there will be sufficient future taxable income to realize the tax benefits related to the remaining net deferred tax assets recognized that are not subject to valuation allowances.
The company provides income taxes on the unremitted earnings of non-U.S. corporate subsidiaries except to the extent that such earnings are indefinitely reinvested outside the United States. As of December 31, 2024, $29.6 million of undistributed earnings of non-U.S. corporate subsidiaries were indefinitely invested outside the U.S. At existing applicable income tax rates, additional taxes of approximately $6.1 million would need to be paid if such earnings are remitted.
22. Business Segment Information
Management has assessed the requirements of ASC 280, Segment Reporting, and determined that, because we utilize a consolidated approach to assess performance and allocate resources, we have only one operating segment. We provide diversified investment management, research and related services globally to a broad range of clients through our three distribution channels: Institutions, Retail and Private Wealth Management.
The Chief Operating Decision Maker ("CODM") is the Chief Executive Officer of AB. The CODM evaluates the reported measure of segment profit or loss in assessing segment performance and deciding how to allocate resources. Significant segment expenses are part of the CODM review and are critically important to understand the level of profitability and overall performance of the company. This assessment will determine the way in which the CODM allocates resources to our respective business operations.
Measurement of Segment Profit or Loss and How the CODM Uses the Reported Measure
The CODM regularly receives financial information and management reports that are prepared on a consolidated basis. When assessing profitability, allocating resources and evaluating the underlying performance of our business, the CODM uses consolidated net income as reported on the consolidated statements of income. In applying the requirements under ASC 280, the company has identified significant segment expenses and other segment items related to our one operating segment. The significant expenses considered by the CODM in evaluating the performance of our business are consistent with the financial information included on the company's consolidated statements of income. The measurement of assets as evaluated by the CODM is reported as "Total assets" on the consolidated statements of financial condition. As an additional measure of segment profit or loss, the CODM considers certain adjustments to consolidated net income. While management uses these additional adjusted metrics in assessing and allocating resources to the business, management recognizes that US GAAP principles are the basis of our performance. The accounting policies of our one operating segment are described in Note 2 "Significant Accounting Policies".
Enterprise-wide disclosures as of and for the years ended December 31, 2024, 2023 and 2022 were as follows:
Services
Net revenues derived from our investment management, research and related services were as follows:
| | | | | | | | | | | | | | | | | | | | |
| Years Ended December 31 |
| 2024 | 2023 | 2022 |
| (in thousands) |
Institutions(1) | | $ | 700,796 | | | $ | 666,670 | | | $ | 659,983 | |
Retail(1) | | 2,311,317 | | | 1,926,020 | | | 2,000,908 | |
Private Wealth Management(1) | | 1,245,891 | | | 1,052,843 | | | 1,004,003 | |
Bernstein Research Services (2) | | 96,222 | | | 386,142 | | | 416,273 | |
| | | | | | |
| | | | | | |
| Other | | 205,426 | | | 231,189 | | | 39,561 | |
| Total revenues | | 4,559,652 | | | 4,262,864 | | | 4,120,728 | |
| Less: Broker-dealer related Interest expense | | 84,513 | | | 107,541 | | | 66,438 | |
| Net revenues | | $ | 4,475,139 | | | $ | 4,155,323 | | | $ | 4,054,290 | |
(1)Institutions, Retail and Private Wealth management revenues by channel include investment advisory base fees, performance-based fees, distribution revenues and shareholder servicing fees by channel.
(2)On April 1, 2024 AB and Societe Generale, a leading European bank, completed their transaction to form a jointly owned equity research provider and cash equity trading partner for institutional investors. AB has deconsolidated the Bernstein Research Services business and contributed the business to the joint ventures. For further discussion, see Note 24 Divestiture.
Our AllianceBernstein U.S. Growth Stock, an open-end fund incorporated in Japan, generated approximately 13%, 11%, and 11% of our investment advisory and service fees and 10%, 8%, and 8% of our net revenues during 2024, 2023 and 2022, respectively.
Geographic Information
Net revenues and long-lived assets, related to our U.S. and international operations, as of and for the years ended December 31, were as follows:
| | | | | | | | | | | | | | | | | | | | |
| 2024 | 2023 | 2022 |
| (in thousands) |
Net revenues1: | | | | | | |
| United States | | $ | 2,641,634 | | | $ | 2,527,498 | | | $ | 2,381,958 | |
| International: | | | | | | |
| Luxembourg | | 1,046,793 | | | 886,256 | | | 933,642 | |
| Japan | | 487,409 | | | 375,222 | | | 382,457 | |
| Other International | | 299,303 | | | 366,347 | | | 356,233 | |
| Total International | | 1,833,505 | | | 1,627,825 | | | 1,672,332 | |
| Total | | $ | 4,475,139 | | | $ | 4,155,323 | | | $ | 4,054,290 | |
| Long-lived assets: | | | | | | |
| United States | | $ | 4,187,885 | | | $ | 4,073,198 | | | |
| International | | 57,140 | | | 53,670 | | | |
| | | | | | |
| | | | | | |
| | | | | | |
| Total | | $ | 4,245,025 | | | $ | 4,126,868 | | | |
(1)Locations comprising greater than 10% of total net revenues are disclosed separately in the current period. Prior periods have been recast to agree to current periods presentation.
Major Customers
No single customer or individual client accounted for more than 10% of our total revenues for the years ended December 31, 2024, 2023 and 2022.
23. Related Party Transactions
Mutual Funds
We provide investment management, distribution, shareholder, administrative and brokerage services to individual investors by means of retail mutual funds sponsored by our company and our subsidiaries. We provide substantially all of these services under contracts that specify the services to be provided and the fees to be charged. The contracts are subject to annual review and approval by each mutual fund’s board of directors or trustees and, in certain circumstances, by the mutual fund’s shareholders.
Revenues for services provided or related to the mutual funds are as follows:
| | | | | | | | | | | | | | | | | | | | |
| Years Ended December 31 |
| 2024 | 2023 | 2022 |
| (in thousands) |
| Investment advisory and services fees | | $ | 1,597,253 | | | $ | 1,377,916 | | | $ | 1,452,885 | |
| Distribution revenues | | 711,156 | | | 575,647 | | | 590,580 | |
| Shareholder servicing fees | | 80,947 | | | 76,440 | | | 79,167 | |
| Other revenues | | 7,400 | | | 9,398 | | | 8,366 | |
| | $ | 2,396,756 | | | $ | 2,039,401 | | | $ | 2,130,998 | |
EQH and its Subsidiaries
We provide investment management and certain administration services to EQH and its subsidiaries. In addition, EQH and its subsidiaries distribute company-sponsored mutual funds, for which they receive commissions and distribution payments. Also, we are covered by various insurance policies maintained by EQH and we pay fees for technology and other services provided by EQH and its subsidiaries. Additionally, see Note 12 Debt, for disclosures related to our credit facility with EQH.
Aggregate amounts included in the consolidated financial statements for transactions with EQH and its subsidiaries, as of and for the years ended December 31, are as follows:
| | | | | | | | | | | | | | | | | | | | |
| Years Ended December 31 |
| 2024 | 2023 | 2022 |
| (in thousands) |
| Revenues: | | | | | | |
| Investment advisory and services fees | | $ | 180,511 | | | $ | 165,748 | | | $ | 148,377 | |
| Other revenues | | 566 | | | 617 | | | 688 | |
| | $ | 181,077 | | | $ | 166,365 | | | $ | 149,065 | |
| Expenses: | | | | | | |
| Commissions and distribution payments to financial intermediaries | | $ | 3,645 | | | $ | 3,492 | | | $ | 3,897 | |
| General and administrative | | 2,362 | | | 2,909 | | | 2,882 | |
| EQH Facility Interest | | 25,976 | | | 37,304 | | | 11,372 | |
| Other | | 3,469 | | | 2,949 | | | 2,697 | |
| | $ | 35,452 | | | $ | 46,654 | | | $ | 20,848 | |
| Statement of Financial Condition: | | | | | | |
| Institutional investment advisory and services fees receivable | | $ | 35,515 | | | $ | 9,055 | | | |
| Prepaid expenses | | 543 | | | 709 | | | |
| Other due (to) from EQH and its subsidiaries | | (2,800) | | | 4,719 | | | |
| EQH Facility | | (710,000) | | | (900,000) | | | |
| | $ | (676,742) | | | $ | (885,517) | | | |
Other Related Parties
The consolidated statements of financial condition include a net receivable from AB Holding as a result of cash transactions for fees and expense reimbursements. The net receivable balance included in the consolidated statements of financial condition as of December 31, 2024 and 2023 was $8.2 million and $8.7 million, respectively.
24. Divestitures
Divestitures
On November 22, 2022, AB and SocGen, a leading European bank, announced plans to form a joint venture combining their respective cash equities and research businesses (the “Initial Plan”). In the Initial Plan, AB would own a 49% interest in the global joint venture and SocGen would own a 51% interest, with an option to reach 100% ownership after five years.
During the fourth quarter of 2023, AB and SocGen negotiated a revised plan (the "Revised Plan") to form a global joint venture with two joint venture holding companies, one outside of North America and one within North America ("NA JV", and together the "JVs"). Effective April 1, 2024, AB and SocGen completed their previously announced transaction in accordance with the Revised Plan. AB owns a 66.7% majority interest in the NA JV while SocGen owns a 51% majority interest in the joint venture outside of North America. While AB currently owns a majority of the NA JV, the structure of the Board of Directors of the NA JV, which includes two independent directors, in addition to four directors from AB and three directors from SocGen, precludes AB’s control of the Board thereby permitting deconsolidation of the BRS business. Going forward, AB will maintain an equity method investment in each of the JVs and report on the performance of the two JV holding companies on a combined basis.
As a result of the greater value of the business AB contributed to the JVs, SocGen paid AB $304.0 million in cash to equalize the value of the contributions by AB and SocGen to the JVs. The cash payment of $304.0 million included $102.6 million of prepaid consideration for an option, exercisable by AB during the next five years, that would result in SocGen having a 51% ownership of the NA JV (the "AB option") and bringing the transaction ownership terms back in line with the Initial Plan. AB's option may only be exercised upon receipt of appropriate regulatory approvals. The $304.0 million cash payment was used to pay down debt under AB’s existing credit facilities.
Under the terms of the transaction and assuming AB exercises its option as noted above, SocGen would increase its ownership to a majority interest of the NA JV, without further consideration payable. AB has an additional option to sell its ownership interests in the JVs to SocGen after five years, at the fair market value of AB’s interests in the JVs, subject to regulatory approval. The ultimate objective of SocGen and AB is for SocGen to eventually own 100% of the JVs after five years.
AB has deconsolidated the BRS business and retained the Bernstein Private Wealth Management business within its existing U.S. broker dealer, SCB LLC. AB’s Private Wealth Management business continues to operate through SCB LLC and SCB LLC continues to serve as custodian for substantially all Private Wealth assets under management. AB continues to serve as investment adviser to these Private Wealth clients. Further, we entered into certain transition service level agreements with the JVs in connection with the divestiture of the BRS business. From April 1, 2024 through December 31, 2024 we provided services and recognized revenues of $37.8 million associated with these transition services agreements.
The net carrying amount of the BRS business assets and liabilities included in the sale was $312.1 million and consisted of the following:
| | | | | | | | |
| April 1, 2024 |
| | (in thousands) |
| Cash and cash equivalents | | $ | 338,226 | |
| Receivables, net: | | |
| Brokers and dealers | | 31,427 | |
| Brokerage clients | | 2,817 | |
| Other fees | | 14,719 | |
| Investments | | 9,555 | |
| Furniture and equipment, net | | 5,472 | |
| Other assets | | 44,751 | |
| Right-of-use assets | | 4,422 | |
| Intangible assets | | 3,850 | |
| Goodwill | | 159,826 | |
| | |
| Total assets sold | | $ | 615,065 | |
| Payables: | | |
| Brokers and dealers | | $ | 15,271 | |
| Brokerage clients | | 14,110 | |
| AP and Accrued Expenses | | 134,979 | |
| Other liabilities | | 10,370 | |
| Accrued compensation and benefits | | 42,069 | |
| Debt | | 86,200 | |
| Total liabilities sold | | $ | 302,999 | |
As a result of the sale, we recognized a pre-tax gain of $134.6 million during the second quarter of 2024, calculated as follows:
| | | | | | | | |
| April 1, 2024 |
| (in thousands) |
| Cash proceeds | | $ | 303,980 | |
| Fair value of equity interest in the JVs | | 283,871 | |
| Net carrying amount of assets and liabilities divested | | (312,066) | |
| Consideration for future put option to be exercised by AB | | (102,550) | |
| Cumulative translation losses | | (10,197) | |
| Reorganization costs | | (28,483) | |
| | |
| | |
| | |
| | |
| | |
| | |
| Pre-tax gain on divestiture | | $ | 134,555 | |
We deconsolidated approximately $312.1 million of net assets and liabilities of the BRS business and contributed those assets and liabilities to the JVs. We recorded an initial investment in the JVs, at fair value of $283.9 million. The fair value of the equity method investments was determined using a dividend discount model whereby a forecast of net income attributable to each of the JVs is discounted using an estimated cost of capital to determine the present value of expected future dividends.
In addition, we recorded a liability in accounts payable and accrued expenses on the consolidated statement of financial condition of approximately $102.6 million, based on the negotiated terms of the Revised Plan, related to the AB option. Upon receipt of appropriate regulatory approvals, AB intends to exercise the AB option and will recognize a gain or loss at that time, dependent upon the fair market value of the additional equity interest that would result in SocGen having 51% ownership interest in NA JV. For discussion on our accounting policy related to investments in unconsolidated joint ventures, see Note 2 Significant Accounting Policies.
The net cash contributed at transaction close from the divestiture of the BRS business as presented under Cash Flows from Investing Activities represents the cash portion of the sale consideration, which was determined as the fair value of the sale consideration, adjusted by the cash transferred to the joint ventures and direct costs to sell. The following table summarizes the different components of the initial business divestiture presented under cash flows from investing activities:
| | | | | | | | |
| December 31, 2024 |
| (in thousands) |
| Cash proceeds from buyer | | $ | 303,980 | |
| Initial cash contributed to joint ventures from transferring balance sheet | | (338,226) | |
| Direct costs to sell | | (5,950) | |
| Cash outflow from divestiture | | $ | (40,196) | |
Included in the initial cash contribution to the joint ventures is approximately $69.1 million of prefunded cash received from SocGen in advance of closing due to certain banking holidays in the U.S. and internationally. The $69.1 million was included in held for sale cash as of March 31, 2024 with an offsetting liability recorded in accounts payable and accrued expenses in held for sale liabilities on the consolidated statement of financial condition. At transaction close, AB contributed this cash to the joint ventures on behalf of SocGen.
As of December 31, 2023 the assets and liabilities of AB's research services business (“the disposal group”) were classified as held for sale on the consolidated statement of financial condition and recorded at fair value, less cost to sell. As a result of classifying these assets as held for sale, we recognized a cumulative non-cash valuation adjustment of $6.6 million as of December 31, 2023, respectively, to recognize the net carrying value at lower of cost or fair value, less estimated costs to sell.
| | | | | | | | | | |
| Year Ended December 31 | | |
| 2023 | | |
| (in thousands) | | |
| Cash and cash equivalents | | $ | 153,047 | | | |
| Receivables, net: | | | | |
| Brokers and dealers | | 32,669 | | | |
| Brokerage clients | | 74,351 | | | |
| Other fees | | 15,326 | | | |
| Investments | | 17,029 | | | |
| Furniture and equipment, net | | 5,807 | | | |
| Other assets | | 104,228 | | | |
| Right-of-use assets | | 5,032 | | | |
| Intangible assets | | 4,061 | | | |
| Goodwill | | 159,826 | | | |
| Valuation adjustment (allowance) on disposal group | | (6,600) | | | |
| Total assets held for sale | | $ | 564,776 | | | |
| Payables: | | | | |
| Brokers and dealers | | $ | 39,359 | | | |
| Brokerage clients | | 16,885 | | | |
| Other liabilities | | 67,938 | | | |
| Accrued compensation and benefits | | 29,160 | | | |
| Total liabilities held for sale | | $ | 153,342 | | | |
As of December 31, 2023, cash and cash equivalents classified as held for sale included in the consolidated statement of cash flows was $153.0 million.
We have determined that the exit from the sell-side research business did not represent a strategic shift that has had, or is likely to have a major effect on our consolidated results of operations. Accordingly, we did not classify the disposal group as discontinued operations. The results of operations of the disposal group up to the respective date of sale were included in our consolidated results of operations for all periods presented. The lower of amortized cost or fair value adjustment upon transferring these assets to held for sale was not material.
Item 9. Changes in and Disagreements with Accountants on Accounting and Financial Disclosure
We did not have any changes in or disagreements with accountants in respect of accounting or financial disclosure.
Item 9A. Controls and Procedures
Disclosure Controls and Procedures
Each of AB Holding and AB maintains a system of disclosure controls and procedures that is designed to ensure that information required to be disclosed in our reports under the Exchange Act is (i) recorded, processed, summarized and reported in a timely manner, and (ii) accumulated and communicated to management, including the Chief Executive Officer (“CEO”) and the Chief Financial Officer (“CFO”), to permit timely decisions regarding our disclosure.
As of the end of the period covered by this report, management carried out an evaluation, under the supervision and with the participation of the CEO and the CFO, of the effectiveness of the design and operation of disclosure controls and procedures. Based on this evaluation, the CEO and the CFO concluded that the disclosure controls and procedures are effective.
Management’s Report on Internal Control Over Financial Reporting
Management acknowledges its responsibility for establishing and maintaining adequate internal control over financial reporting for each of AB Holding and AB.
Internal control over financial reporting is a process designed by, or under the supervision of, a company’s CEO and CFO, to provide reasonable assurance regarding the reliability of financial reporting and the preparation of financial statements for external purposes in accordance with accounting principles generally accepted in the United States of America (“US GAAP”) and includes those policies and procedures that:
•Pertain to the maintenance of records that, in reasonable detail, accurately and fairly reflect the transactions and dispositions of the assets of the company;
•Provide reasonable assurance that transactions are recorded as necessary to permit preparation of financial statements in accordance with US GAAP and receipts and expenditures of the company are being made only in accordance with authorizations of management and directors of the company; and
•Provide reasonable assurance regarding prevention or timely detection of unauthorized acquisition, use or disposition of the company’s assets that could have a material effect on the financial statements.
All internal control systems, no matter how well designed, have inherent limitations. Therefore, even those internal control systems determined to be effective can provide only reasonable assurance with respect to the reliability of financial statement preparation and presentation. Because of these inherent limitations, internal control over financial reporting may not prevent or detect misstatements. Projections of any evaluation of effectiveness of internal control to future periods are subject to the risk that controls may become inadequate because of changes in conditions, or that the degree of compliance with the policies or procedures may deteriorate.
Management assessed the effectiveness of AB Holding’s and AB’s internal control over financial reporting as of December 31, 2024. In making its assessment, management used the criteria set forth by the Committee of Sponsoring Organizations of the Treadway Commission in Internal Control-Integrated Framework (2013) (the “COSO criteria”).
Based on its assessment, management concluded that, as of December 31, 2024, each of AB Holding and AB maintained effective internal control over financial reporting based on the COSO criteria.
PricewaterhouseCoopers LLP (PCAOB ID No. 238), the independent registered public accounting firm that audited the 2024 financial statements included in this Form 10-K, has issued an attestation report on the effectiveness of each of AB Holding’s and AB’s internal control over financial reporting as of December 31, 2024. The reports pertaining to AB Holding and AB each can be found in Item 8 of this Form 10-K.
Changes in Internal Control Over Financial Reporting
No changes in our internal control over financial reporting occurred during the fourth quarter of 2024 that materially affected, or are reasonably likely to materially affect, our internal control over financial reporting.
Item 9B. Other Information
We reported all information required to be disclosed on Form 8-K during the fourth quarter of 2024.
Pursuant to Item 408(a) of Regulation S-K, there were no directors or officers that had adopted or terminated a 10b5-1 plan or other trading arrangement during the fourth quarter of 2024.
Item 9C. Disclosure Regarding Foreign Jurisdictions that Prevent Inspections
Not applicable.
Item 10. Directors, Executive Officers and Corporate Governance
We use “Internet Site” in Items 10 and 11 to refer to our company’s public website, www.alliancebernstein.com.
To contact our company’s Corporate Secretary, you may send an email to corporate_secretary@alliancebernstein.com or write to Corporate Secretary, AllianceBernstein L.P., 501 Commerce Street, Nashville, Tennessee 37203.
General Partner
The Partnerships’ activities are managed and controlled by the General Partner. The Board of the General Partner acts as the Board of each of the Partnerships. Neither AB Unitholders nor AB Holding Unitholders have rights to manage or control the Partnerships or to elect directors of the General Partner. The General Partner is a wholly owned subsidiary of EQH.
The General Partner does not receive any compensation from the Partnerships for services rendered to them as their general partner. The General Partner holds a 1% general partnership interest in AB and 100,000 units of general partnership interest in AB Holding. Each general partnership unit in AB Holding is entitled to receive distributions equal to those received by each AB Holding Unit. Similarly, the 1% general partnership interest in AB is entitled to receive distributions equal to those received by each AB Unit.
The General Partner is entitled to reimbursement by AB for any expenses it incurs in carrying out its activities as general partner of the Partnerships, including compensation paid by the General Partner to its directors and officers (to the extent such persons are not compensated directly by AB).
Board of Directors
Our Board consists of 10 directors, including six independent directors (including our Chair of the Board), our President and CEO, and three senior executives of EQH. While we do not have a formal, written diversity policy in place, we believe that an effective board consists of a diverse group of individuals who collectively possess a variety of complementary skills, personal experiences and perspectives and who will work together to provide a board with the needed leadership and experience to successfully guide our company. As set forth in its charter, the Corporate Governance Committee of the Board (the “Governance Committee”) assists the Board in identifying and evaluating such candidates, determining Board composition, developing and monitoring a process to assess Board effectiveness, developing and implementing corporate governance guidelines, and reviewing programs relating to matters of corporate responsibility.
As we indicate below, our directors have a combined wealth of leadership experience derived from extensive service leading large, complex organizations in their roles as either senior executives or board members, as well as in government and academia. Each of our directors has the integrity, business judgment, collegiality and commitment that are among the essential characteristics for a member of our Board. Collectively, they have substantive knowledge and skills applicable to our business, including expertise in areas such as asset management; regulation; public accounting and financial reporting; finance; risk management; business development; operations; information technology and security; strategic planning; management development, succession planning and compensation; corporate governance; public policy; and international matters.
| | | | | | | | | | | | | | | | | | | | | | | |
| | | | | | | |
| Executive
Committee | | Audit and Risk
Committee | | Corporate Governance
Committee | | Compensation and
Workplace Practices
Committee |
| | | | | | | |
| Joan Lamm-Tennant | | | | | | | |
| Seth Bernstein | M | | | | M | | |
| Jeffrey Hurd | | | | | | | |
| Daniel Kaye | | | | | | | M |
| Nick Lane | | | | | | | |
| Das Narayandas | | | | | | | |
| Mark Pearson | M | | | | M | | M |
| | | | | | | |
| Charles Stonehill | | | | | | | |
| Todd Walthall | | | M | | M | | |
| Bruce Holley | | | M | | | | |
| | | | | | | | | | | | | | |
| Female | Male | Non-Binary | Did Not Disclose Gender |
| Gender Diversity | | | | |
| Directors | 1 | 9 | — | | — | |
| Racial/Ethnic/Nationality/Other Forms of Diversity | | | | |
| African American/Black | — | | 2 | — | | — | |
| Alaskan Native/Native American | — | | — | | — | | — | |
| Asian/South Asian | — | | 1 | — | | — | |
| Hispanic/Latinx | — | | — | | — | | — | |
| Native Hawaiian/Pacific Islander | — | | — | | — | | — | |
| White/Caucasian | 1 | 6 | — | | — | |
| LGBTQ+ | — | | 1 | — | | — | |
| Directors Born Outside of the US | — | | 3 | — | | — | |
| Did Not Disclose Demographics | — | | — | | — | | — | |
| | | | | | | | | | | | | | | | | | | | |
| | | | | | |
| | | | | | |
Joan Lamm-Tennant Chair of the Board, Equitable Holdings Committees: Executive (Chair) Age: 72 Director Since: 2021 | | Seth Bernstein President and Chief Executive Officer, AllianceBernstein Committees: Executive Governance Age: 63 Director Since: 2017 | | Bruce Holley Director, Managing Director of Alvarez & Marsal's Financial Services Committees: Audit Age: 62 Director Since: 2024 | | Jeffrey Hurd Chief Operating Officer, Equitable Holdings Committees: None Age: 58 Director Since: 2019 |
| | | | | | |
| | | | | | |
| | | | | | |
Daniel Kaye Director, CME Group (NASDAQ: CME), and Equitable Holdings Committees: Compensation Age: 70 Director Since: 2017 | | Nick Lane President, Equitable Financial Life Insurance Company Committees: None Age: 51 Director Since: 2019 | | Das Narayandas Edsel Bryant Ford Professor of Business Administration, Harvard Business School Committees: Governance (Chair) Age: 64 Director Since: 2017 | | Mark Pearson President and Chief Executive Officer, Equitable Holdings Committees: Executive Governance Compensation Age: 66 Director Since: 2011 |
| | | | | | |
| | | | | | |
| | | | | | |
Charles Stonehill Founding Partner, Green & Blue Advisors; Director, Equitable Holdings Committees: Audit (Chair) Compensation (Chair) Age: 66 Director Since: 2019 | | Todd Walthall Chief Growth Officer, Optum Health, UnitedHealth Group Committees: Audit Governance Age: 54 Director Since: 2021 | | | | |
As of February 14, 2025, our directors are as follows:
| | | | | | | | | | | | | | |
| | | | |
| | | Background •Ms. Lamm-Tennant was appointed Chair of AB in October 2021. •She has served as Chair of the Board of EQH, Equitable Financial and Equitable America since October 2021, after having joined these boards in January 2020. •Ms. Lamm-Tennant founded Blue Marble Microinsurance and served as its CEO from 2015 to 2020. •She currently is executive advisor of Brewer Lane Ventures, having joined in 2021; she serves on the boards of Ambac Financial Group and Element Fleet Financial Corp; and she joined the board of Africa Specialty Risk in April 2023. •Previously, Ms. Lamm-Tennant was Adjunct Professor, International Business at The Wharton School of the University of Pennsylvania from 2005 to 2016. Prior to or concurrently with her service at The Wharton School, Ms. Lamm-Tennant held various senior positions in the insurance industry, including with Marsh & McLennan Companies, Guy Carpenter and General Reinsurance Corporation. Director Qualifications Ms. Lamm-Tennant brings to the Board significant industry and academic experience, having held global business leadership roles and developed a distinguished career as a professor of finance and economics. | |
| | | |
| Joan Lamm-Tennant Committees: Executive (Chair) Age: 72 Director Since: 2021 | | |
| | | | |
| | | | | | | | | | | | | | |
| | | | |
| | | Background •Mr. Bernstein was appointed President and Chief Executive Officer in April 2017 and began serving in this role on May 1, 2017. •He has served as Senior Executive Vice President and Head of Investment Management and Research of EQH since April 2018 and is a member of the Management Committee of EQH. •Previously, Mr. Bernstein had a distinguished 32-year career at JPMorgan Chase, most recently as Managing Director and Global Head of Managed Solutions and Strategy at J.P. Morgan Asset Management. In this role, Mr. Bernstein was responsible for the management of all discretionary assets within the Private Banking client segment. •Among other roles, he served as Managing Director and Global Head of Fixed Income and Currency for 10 years, concluding in 2012. •Mr. Bernstein held the position of Chief Financial Officer at JPMorgan Chase’s Investment Management and Private Banking division. •Mr. Bernstein is Vice-Chair of Haverford College’s Board of Managers and Clerk of the Board’s Investment Committee (Pennsylvania), a Board of Trustees member of the Brookings Institution, a Governor of the Investment Company Institute (Washington, D.C.), a trustee of Cheekwood Estate and Gardens (Nashville), and a member of the Council on Foreign Relations (New York). Director Qualifications Mr. Bernstein brings to the Board the diverse financial services experience he developed through his extensive service at JPMorgan Chase and more recent career at AB. | |
| | | |
| Seth Bernstein Committees: Executive, Governance Age: 63 Director Since: 2017 | | |
| | | | |
| | | | | | | | | | | | | | |
| | | | |
| | | Background •Mr. Holley was appointed a director of AB in 2024. •He is a Managing Director of Alvarez & Marsal's Financial Services Industry Practice. •Prior to joining Alvarez & Marsal, he was a Senior Managing Director at Accenture. •Mr. Holley spent 25 years at the Boston Consulting Group as a Senior Partner and Managing Director, where he helped launch their Global Wealth and Asset Management practice. •He received his bachelor's degree in biochemistry and an MBA from Harvard University. •Mr. Holley has served as a Director of the New York Community non-profit since 2023. Director Qualifications Mr. Holley brings to the Board his extensive experience in financial services, specifically Global Wealth and Asset Management, as a Managing Director at Alvarez & Marsal and the Boston Consulting Group. | |
| | | |
| Bruce Holley Committees: Audit Age: 62 Director Since: 2024 | | |
| | | | |
| | | | | | | | | | | | | | |
| | | | |
| | | Background •Mr. Hurd was appointed a director of AB in April 2019. •He has served as Chief Operating Officer of EQH, and as a member of the EQH Management Committee, since 2018. •In this role, Mr. Hurd has strategic oversight for EQH’s Human Resources, Information Technology, Insurance Operations and Communications departments. •He also is responsible for other key functional areas, including procurement and corporate real estate. •Mr. Hurd also has served as Chief Operating Officer of Equitable Financial since 2018. •Prior to joining Equitable, Mr. Hurd served as Executive Vice President and Chief Operating Officer at American International Group, Inc. (“AIG”), where he amassed deep financial services industry experience during his 20-year tenure. While at AIG, Mr. Hurd served as Chief Human Resources Officer, Chief Administrative Officer, Deputy General Counsel and Head of Asset Management Restructuring. •Mr. Hurd joined the board of the Thurgood Marshall College Fund in May 2023. Director Qualifications Mr. Hurd brings to the Board his extensive experience in financial services and strategic insights as a senior executive at EQH and, formerly, at AIG. | |
| | | |
| Jeffrey Hurd Committees: None Age: 58 Director Since: 2019 | | |
| | | | |
| | | | | | | | | | | | | | |
| | | | |
| | | Background •Mr. Kaye was appointed a director of AB in April 2017. •He has been a director of EQH since May 2018 and a director of Equitable Financial and Equitable America since September 2015. •Also, since May 2019, Mr. Kaye has been a director of CME Group, Inc. (NASDAQ: CME), where he serves as Chair of the Audit Committee and serves on the Executive and Risk Committees. •From January 2013 to May 2014, Mr. Kaye served as interim Chief Financial Officer and Treasurer of HealthEast Care System. He held this post after retiring in 2012 from his career at Ernst & Young LLP (“E&Y”). •He served for 35 years at E&Y, including 25 years as an audit partner. •During his tenure at E&Y, Mr. Kaye served as the New England Area Managing Partner and the Midwest Area Managing Partner of Assurance. •Mr. Kaye is a Certified Public Accountant and a National Association of Corporate Directors Board Leadership Fellow. Director Qualifications Mr. Kaye brings to the Board the extensive financial and regulatory expertise he developed through his career at E&Y and his directorships at CME, EQH and certain of EQH’s subsidiaries. | |
| | | |
| Daniel Kaye Committees: Compensation Age: 70 Director Since: 2017 | | |
| | | | |
| | | | | | | | | | | | | | |
| | | | |
| | | Background •Mr. Lane was appointed a director of AB in April 2019. •He has served as Head of Retirement, Wealth Management & Protection Solutions of EQH, and as a member of the EQH Management Committee, since May 2018. •Also, since February 2019, Mr. Lane has served as President of Equitable Financial, leading that company’s Retirement, Wealth Management & Protection Solutions businesses and also leading its Marketing and Digital functions. •Mr. Lane held various leadership roles with AXA and Equitable Financial since joining Equitable Financial (then a subsidiary of AXA) in 2005 as Senior Vice President of the Strategic Initiatives Group. •He has served as President and CEO of AXA Japan, Senior Executive Director at Equitable Financial with responsibilities across commercial divisions, and Head of AXA Global Strategy overseeing AXA’s five-year strategic plan across 60 countries. •Prior to joining Equitable Financial, Mr. Lane was a consultant for McKinsey & Company and a Captain in the United States Marine Corps. •Mr. Lane joined the board of the American Counsel of Life Insurers ("ACLI") in September 2023. Director Qualifications Mr. Lane brings to the Board the outstanding experience and leadership qualities he has developed in various senior roles at AXA S.A., EQH and various subsidiaries, and as an officer in the United States Marine Corps. | |
| | | |
| Nick Lane Committees: None Age: 51 Director Since: 2019 | | |
| | | | |
| | | | | | | | | | | | | | |
| | | | |
| | | Background •Mr. Narayandas was appointed a director of AB in November 2017. •He is the Edsel Bryant Ford Professor of Business Administration at Harvard Business School (“HBS”), where he has been a faculty member since 1994. •Mr. Narayandas also currently serves as the Senior Associate Dean and Chairman of Harvard Business School Publishing, and as the Senior Associate Dean of HBS External Relations. •He previously served as the senior associate dean of HBS Executive Education, and as chair of the HBS Executive Education Advanced Management Program and the Program for Leadership Development, as well as course head of the required first-year marketing course in the MBA program. •Mr. Narayandas has received the award for teaching excellence from the graduating HBS MBA class on several occasions. Other awards he has received include the Robert F. Greenhill Award for Outstanding Service to the HBS Community, the Charles M. Williams Award for Excellence in Teaching and the Apgar Award for Innovation in Teaching. •Mr. Narayandas has served as a member of the Board of Neurolens, a specialty eyewear company, since January 2021. He also has served as a member of the Harvard University Press since June, 2023. •His scholarship has focused on market-facing issues in traditional business-to-business marketing and professional service firms, including client management strategies, delivering service excellence, product-line management and channel design. Director Qualifications Mr. Narayandas brings to the Board his wealth of experience at the highest level of academia in the U.S. | |
| | | |
| Das Narayandas Committees: Governance (Chair) Age: 64 Director Since: 2017 | | |
| | | | |
| | | | | | | | | | | | | | |
| | | | |
| | | Background •Mr. Pearson was appointed a director of AB in February 2011. •He has served as President and Chief Executive Officer of EQH since May 2018. •Mr. Pearson also serves as a member of EQH’s Management Committee. •Additionally, Mr. Pearson serves as CEO of Equitable Financial and Equitable America, and he has been a director of both companies since 2011. •Mr. Pearson joined AXA S.A. in 1995 when it acquired National Mutual Funds Management Limited (presently AXA Asia Pacific Holdings Limited) and was appointed Regional Chief Executive of AXA Asia Life in 2001. •From 2008 to 2011, Mr. Pearson was President and Chief Executive Officer of AXA Japan Holding Co., Ltd. (“AXA Japan”). •Prior to joining AXA S.A., Mr. Pearson spent approximately 20 years in the insurance sector, holding several senior management positions at Hill Samuel, Schroders, National Mutual Holdings and Friends Provident. •Mr. Pearson is a Fellow of the Chartered Public Association of Certified Public Accountants. Director Qualifications Mr. Pearson brings to the Board the diverse financial services experience he has developed through his service as an executive, including as Chief Executive Officer, with EQH, AXA Japan and other affiliates of AXA S.A. | |
| | | |
| Mark Pearson Committees: Executive, Governance, Compensation Age: 66 Director Since: 2011 | | |
| | | | |
| | | | | | | | | | | | | | |
| | | | |
| | | Background •Mr. Stonehill was appointed a director of AB in April 2019. •He has been a director and member of various board committees at EQH and Equitable America since March 2019, and at Equitable Financial since November 2017. •Mr. Stonehill has served as a member of the supervisory board of Deutsche Boerse AG, a capital market infrastructure provider, since 2019. He has served as a Governor of the Harrow School (UK) since 2011, a Director of Strangeworks, Inc. since 2023, and a Board member of Koenigsegg since 2024. •In addition, Mr. Stonehill is the Founding Partner of Green & Blue Advisors LLC, having started this advisory firm that provides financial advice to clean-tech and other environmentally-minded companies in 2011. •He formerly was a director of Play Magnus AS, a chess app company, from 2016 to 2021, and non-executive vice chairman of Julius Baer Group Ltd., a global private banking company based in Switzerland, from 2009 to 2021. •Mr. Stonehill has over 30 years' experience in energy markets, investment banking and capital markets, including leadership positions at Lazard Freres & Co. LLC, Credit Suisse and Morgan Stanley & Co. •He also served as Chief Financial Officer at Better Place Inc., an electric vehicle start-up, from 2009 to 2011, where he oversaw global financial strategy and capital raising. Director Qualifications Mr. Stonehill brings to the Board his extensive expertise and distinguished track record in the financial services industry and over 30 years' experience in energy markets, investment banking and capital markets. | |
| | | |
| Charles Stonehill Committees: Audit (Chair), Compensation (Chair) Age: 66 Director Since: 2019 | | |
| | | | |
| | | | | | | | | | | | | | |
| | | | |
| | | Background •Mr. Walthall was appointed a director of AB in September 2021. •He is a senior executive with UnitedHealth Group, an American multinational managed healthcare and insurance company, currently serving as Chief Growth Officer at Optum Health; formerly as Chief Executive for Optum Insight (Payer Market), UnitedHealth Group. •Previously, he served as Executive Vice President and Chief Operating Officer at Blue Shield of California. •He served in senior roles at American Express and USAA. Mr. Walthall held numerous senior roles with USAA Insurance and Bank, having contributed to the development of the industry's first mobile check-deposit service. •Mr. Walthall serves on the Board of Trustees of Positive Coaching Alliance. Director Qualifications Mr. Walthall brings extensive experience in healthcare and financial services through numerous senior executive and global leadership roles throughout his career. | |
| | | |
| Todd Walthall Committees: Audit, Governance Age: 54 Director Since: 2021 | | |
| | | | |
Executive Officers (other than Mr. Bernstein)
Jackie Marks, CFO
Ms. Marks, age 47, was named Chief Financial Officer in March 2024. As CFO, she is responsible for leading firm wide strategy, financial operations and discipline. Prior to AB, Marks served as CFO of Conde Nast, a global media company with more than one billion consumers in 32 markets, where she was responsible for Finance, Legal, Corporate Strategy & Development, Procurement, Global Events & Workplace Services, and Real Estate. Before joining Conde Nast in early 2021, Marks served as CFO at Mercer and prior to that was the CFO of Enterprise Technology & Operations at Thomson Reuters. She also served in a variety of financial leadership roles throughout her 15-year tenure there based in New York, London and Zurich, including CFO of Thomson Reuters News & Editorial. Marks spent her early career in private equity and at Siemens.
Karl Sprules, COO
Mr. Sprules, age 51, was appointed Chief Operating Officer in June 2023, formerly Head of Global Technology & Operations since 2019. In his role as COO, Mr. Sprules oversee's the firm's Global Technology and Operations, Real Estate, Legal & Compliance, Diversity, Equity & Inclusion and Corporate Citizenship, Audit and Risk. He joined AB's technology department in 1998 as a senior systems engineer in the firm's London office. From 2012 to 2020, Mr. Sprules served as AB's chief technology officer, and since 2018 he has led the relocation of AB's Technology & Operations department to the firm's new Nashville headquarters. In 2012, Mr. Sprules became head of Infrastructure Services for Equities, managing investment operations, operational risk and technology teams. From 2005 to 2012, Mr. Sprules led technology for AB's Private Wealth, Institutional and Client groups. Before joining AB, Mr. Sprules held research analyst positions in cellular and defense product development.
Onur Erzan, Head of Global Client Group and Private Wealth
Mr. Erzan, age 49, joined our firm in 2021 as Head of Global Client Group and was named Head of Private Wealth in July 2022. In this role, he oversees AB's entire private wealth management business and third-party institutional and retail franchise, where he is responsible for all client services, sales and marketing, as well as product strategy, management and development worldwide. Prior to joining AB, Mr. Erzan spent over 19 years with McKinsey, most recently as a senior partner and co-leader of its Wealth & Asset Management practice. In addition, Mr. Erzan co-led McKinsey's Banking & Securities Solutions (a portfolio of data, analytics and digital assets and capabilities) globally. He has been active in nonprofit organizations for the last several years and has served on the boards of Graham Windham and Turkish Philanthropy Funds.
Mark Manley, General Counsel and Corporate Secretary
Mr. Manley, age 62, joined the firm in 1984 and currently serves as Senior Vice President, General Counsel and Corporate Secretary. He served as Deputy General Counsel from June 2004 to December 2021 and served as the firm’s Global Head of Compliance from 1988 until November 2023. He chairs AB’s Code of Ethics Oversight Committee and is a member of AB’s Internal Compliance Controls Committee and nearly all of the firm’s senior operating, risk and compliance committees.
Chris Hogbin, Global Head of Investments
Mr. Hogbin, age 51, was appointed Global Head of Investments in January 2024. In this broad leadership role, he oversees all the firm’s investment activities with responsibility for driving investment success across asset classes, fostering collaboration and sharing best practices across investment teams, as well as leveraging a common infrastructure and evaluating opportunities to invest in capabilities that deliver better outcomes for clients. Mr. Hogbin joined AB’s institutional research business in 2005 as a senior analyst covering the European food retail sector, was named to Institutional Investor’s All-Europe Research Team and was ranked as the #1 analyst in his sector. He became European director of research for the Sell Side in 2012 and was given additional responsibility for Asian research in 2016. In 2018, he was appointed COO of Equities for AB. In 2019, Mr. Hogbin was promoted to co-head of Equities, becoming head of Equities in 2020. Prior to joining the firm, he worked as a strategy consultant for the Boston Consulting Group. He is chair of the Caius Foundation and is involved in several nonprofit organizations.
Cathy Spencer, Chief People Officer
Ms. Spencer, age 58, is the Chief People Officer for AB, and leads the teams responsible for advancing the employee experience for all of AB's people. Ms. Spencer’s responsibilities include oversight of the following functions, including benefits, compensation, employee relations, culture, learning and engagement, talent acquisition and management, and onsite excellence. Ms. Spencer’s responsibilities extend throughout the firm's global footprint, serving more than 4,000 staff members. Since 2018 she has overseen the transition of US staff to the firm's new Nashville headquarters as well as the recruiting and onboarding of local hires. Ms. Spencer joined AB in 1997 and has held a variety of roles, from overseeing talent and organizational development to managing employee relations, both globally. She was promoted to senior vice president in 2008, when she assumed the role of Head of Human Resources, a position she held for 10 years.
Changes in Directors and Executive Officers
The following changes in our directors and executive officers occurred since we filed our Form 10-K for the year ended December 31, 2023:
Directors
•Bruce Holley was appointed to the Board and the Audit and Risk Committee on May 15, 2024.
Executive Officers
•Ms. Marks was appointed as CFO effective March 1, 2024.
•Mr. Siemers transitioned from Interim CFO to Senior Advisor to AB effective February 29, 2024.
Board Meetings
In 2024, the Board held regular meetings in February, May, September and November.
The Board has established a calendar consisting of four regular meetings, which typically are held in February, May, September and November. In addition, the Board holds special meetings or takes action by unanimous written consent as circumstances warrant. The Board has standing Executive, Audit and Risk, Compensation and Workplace Practices, and Governance Committees, each of which is described in further detail below. Each member of the Board attended 75% or more of the aggregate of all Board and committee meetings that he or she was entitled to attend in 2024.
Committees of the Board
| | | | | | | | | | | |
| | | |
| | Responsibilities: •Exercises all of the powers and authority of the Board (with limited exceptions) when the Board is not in session, or when it is impractical to assemble the full Board. •Typically, determines quarterly unitholder distributions, as applicable. | |
| | |
| Executive Committee Committee Members: Joan Lamm-Tennant (Chair) Seth Bernstein Mark Pearson Meetings in 2024: 5 | |
| | | |
| | | | | | | | | | | |
| | | |
| | Responsibilities: •Assist the Board in its oversight of: •the integrity of the financial statements of the Partnerships; •the effectiveness of the Partnerships' internal control over financial reporting and the Partnerships' risk management framework and risk mitigation processes; •the Partnerships’ status and system of compliance with legal and regulatory requirements and business conduct; •the independent registered public accounting firm’s qualification and independence; and •the performance of the Partnerships’ internal audit function. •Oversee the appointment, retention, compensation, evaluation and termination of the Partnerships’ independent registered public accounting firm. •Oversee management’s development of a comprehensive set of metrics for evaluating the firm’s ESG objectives and monitor management’s progress in pursing those objectives. •Encourages continuous improvement of, and fosters adherence to, the Partnerships’ policies, procedures and practices at all levels. •Provides an open avenue of communication among the independent registered public accounting firm, senior management, the Internal Audit Department, the Global Head of Compliance, the Chief Risk Officer and the Board. | |
| | |
| Audit and Risk Committee Committee Members: Charles Stonehill (Chair)
Todd Walthall Bruce Holley Meetings in 2024: 8 | |
| | | |
| | | | | | | | | | | |
| | | |
| | Responsibilities: •Assists the Board and the sole stockholder of the General Partner in: •identifying and evaluating qualified individuals to become Board members; and •determining the composition of the Board and its committees. •Assists the Board in: •developing and monitoring a process to assess Board effectiveness; •developing and implementing our Corporate Governance Guidelines; and •reviewing our policies and programs that relate to matters of corporate responsibility of the General Partner and the Partnerships. | |
| | |
| Governance Committee Committee Members: Das Narayandas (Chair) Seth Bernstein Mark Pearson Todd Walthall Meetings in 2024: 1 | |
| | | |
| | | | | | | | | | | |
| | | |
| | For a discussion of the Compensation Committee's responsibilities, please see “Compensation Discussion and Analysis - Compensation Committee; Process for Determining Executive Compensation” in Item 11. | |
| | |
| Compensation and Workplace Practices Committee Committee Members: Charles Stonehill (Chair) Daniel Kaye Mark Pearson Meetings in 2024: 5 | |
| | | |
The functions of each of the Board committees discussed above are more fully described in each committee’s charter. The charters are available in the "Responsibility - Corporate Governance" section of our Internet Site.
Independence of Certain Directors
In February 2024, the Governance Committee, after reviewing materials prepared by management, recommended that the Board determine that each of Ms. Lamm-Tennant and Messrs. Kaye, Narayandas, Stonehill, and Walthall is independent. The Board determined, at its February 2024 regular meeting, that each of these directors is independent (each an "Independent Director") within the meaning of the relevant rules. In May 2024, the Governance Committee, after reviewing materials prepared by management, none of which included an identification of any transactions, relationships or arrangements not disclosed pursuant to Item 404(a), recommended by unanimous written consent that the Board determine that Mr. Holley is independent, and the Board so determined at its May 2024 regular meeting.
Audit Committee Financial Experts; Financial Literacy
Audit Committee Financial Expertise
In February 2024, the Governance Committee, after reviewing materials prepared by management, recommended that the Board determine that each of Ms. Lamm-Tennant and Messrs. Kaye and Stonehill is an “audit committee financial expert” within the meaning of Item 407(d) of Regulation S-K. The Board so determined at its regular meeting held in February 2024.
Financial Literacy
In February 2024, the Governance Committee, after reviewing materials prepared by management, recommended that the Board determine that each of Ms. Lamm-Tennant and Messrs. Kaye, Narayandas, Stonehill, and Walthall is financially literate and possesses accounting or related financial management expertise, as contemplated by Section 303A.07(a) of the NYSE Listed Company Manual ("Financially Literate"). The Board so determined at its regular meeting held in February 2024. In May 2024, the Governance Committee, after reviewing materials prepared by management, recommended that the Board determine that Mr. Holley is Financially Literate, and the Board so determined at its May 2024 regular meeting.
Board Leadership Structure and Role in Risk Oversight
Leadership
The Board, together with the Governance Committee, is responsible for reviewing the Board’s leadership structure. In determining the appropriate individuals to serve as our Chair and our CEO, the Board and the Governance Committee consider, among other things, the composition of the Board, our company’s strong corporate governance practices, and the challenges and opportunities specific to AB.
Contacting our Board
Interested parties wishing to communicate directly with our Chair or the other members of our Board may send an e-mail, with “confidential” in the subject line, to our Corporate Secretary or address mail to Ms. Lamm-Tennant in care of our Corporate Secretary. Our Corporate Secretary will promptly forward such e-mail or mail to Ms. Lamm-Tennant. We have posted this information in the “Responsibility - Corporate Governance” section of our Internet Site.
Risk Oversight
| | | | | | | | |
| Board of Directors | |
| |
| | |
| The Board, together with the Audit Committee, has oversight for our company’s risk management framework, which includes investment risk, credit and counterparty risk, and operational risk (includes legal/regulatory risk, cyber security risk and climate risk), and is responsible for helping to ensure that these risks are managed in a sound manner. |
| | |
| | | | | | | | |
| q | |
| Audit Committee | |
| |
| | |
| The Board has delegated to the Audit Committee, which consists entirely of independent directors, the responsibility to consider our company’s policies and practices with respect to investment, credit and counterparty, and operational risk assessment and risk management, including discussing with management the major financial, operational and reputational risk exposures and the steps taken to monitor and control such exposures. |
| | |
| | | | | | | | | | | | | | | | | | | | |
| | | | | p | |
| Risk Management Team | | | | Chief Risk Officer | |
| | | | |
| | | | | | |
| Members of the company's risk management team (including our Chief Security Officer), who are responsible for identifying, managing and controlling the array of risks inherent in our company’s business and operations, make quarterly reports to the Audit Committee, which address investment, credit and counterparty, and operational risk identification, assessment and monitoring. | u | The Chief Risk Officer makes quarterly presentations to the Audit Committee and has reporting lines to the CEO and the Audit Committee. |
| | | | | | |
The Board has determined that its leadership and risk oversight are appropriate for our company. Mr. Bernstein’s in-depth knowledge of financial services and extensive executive experience in the investment management industry make him well-suited to serve as our President and CEO, while Ms. Lamm-Tennant’s in-depth industry and academic experience are invaluable at enhancing the overall functioning of the Board. The Board believes that the combination of a separate Chair and CEO, the Audit Committee, a specialized risk management team and significant involvement from our largest Unitholder (EQH) provide the appropriate leadership to help ensure effective risk oversight.
Code of Ethics and Related Policies
Our directors, officers and employees are subject to our Code of Business Conduct and Ethics (the "Code of Ethics"). The Code of Ethics is intended to comply with Section 303A.10 of the NYSE Listed Company Manual, Rule 204A-1 under the Investment Advisers Act and Rule 17j-1 under the Investment Company Act, as well as with recommendations issued by the Investment Company Institute regarding, among other things, practices and standards with respect to securities transactions of investment professionals. The Code of Ethics establishes certain guiding principles for all of our employees, including sensitivity to our fiduciary obligations and ensuring that we meet those obligations.
In addition, the Code of Ethics, together with our firm's insider trading policy, restricts employees from trading when in possession of material non-public information of any kind, which can include the existence of a significant cybersecurity incident at our firm. Our Code of Ethics may be found in the “Responsibility - Corporate Governance” section of our Internet Site. Our insider trading policy, which is applicable to purchases and sales of AB Holding units by our directors, officers and employees, is included as Exhibit 19 to this Form 10-K. We believe that our insider trading policy has been reasonably designed to promote compliance with insider trading laws, rules and regulations and any applicable NYSE standards. Prior to initiating a buy-back plan on behalf of AB Holding, whether pursuant to Rule 10b5-1(c) or otherwise, our Corporate Treasurer, in consultation with our CFO, determines the timing of such buy-back plan. Plans of this type are only implemented during window periods and prior to implementation, the Treasurer will confirm with legal counsel that we are clear to implement the plan as there is no material non-public information that would cause us to delay the implementation.
We do not have polices or procedures relating to the timing of awards of options in relation to the disclosure of material non-public information because we do not issues options.
We have adopted a Code of Ethics for the CEO and Senior Financial Officers, which is intended to comply with Section 406 of the Sarbanes-Oxley Act of 2002 (the “Item 406 Code”). The Item 406 Code may be found in the “Responsibility - Corporate Governance” section of our Internet Site. We intend to satisfy the disclosure requirements under Item 5.05 of Form 8-K regarding certain amendments to, or waivers from, provisions of the Item 406 Code that apply to the CEO, the CFO and the Chief Accounting Officer by posting such information on our Internet Site. To date, there have been no such amendments or waivers.
NYSE Governance Matters
Section 303A.00 of the NYSE Listed Company Manual exempts limited partnerships from compliance with the following sections of the Manual, some of which we comply with voluntarily: Section 303A.01 (board must have a majority of independent directors), 303A.04 (corporate governance committee must have only independent directors as its members and must have a charter that addresses, among other things, the committee’s purpose and responsibilities), and 303A.05 (compensation committee must have only independent directors as its members and must have a charter that addresses, among other things, the committee’s purpose and responsibilities).
AB Holding is a limited partnership (as is AB). In addition, because the General Partner is a wholly owned subsidiary of EQH, and the General Partner controls AB Holding (and AB), we believe we also would qualify for the “controlled company” exemption. However, we comply voluntarily with the charter requirements set forth in Sections 303A.04 and 303A.05.
Our Corporate Governance Guidelines (the “Guidelines”) promote the effective functioning of the Board and its committees, promote the interests of the Partnerships’ respective Unitholders (with appropriate regard to the Board’s duties to the sole stockholder of the General Partner), and set forth a common set of expectations as to how the Board, its various committees, individual directors and management should perform their functions. The Guidelines may be found in the “Responsibility - Corporate Governance” section of our Internet Site.
The Governance Committee is responsible for considering any request for a waiver under the Code of Ethics, the Item 406 Code and the EQH Policy Statement on Ethics from any director or executive officer of the General Partner. No such waiver has been granted to date and, if a waiver is granted in the future, such waiver would be described in the “Responsibility - Corporate Governance” section of our Internet Site.
We include in the “Responsibility - Corporate Governance,” section of our Internet site an e-mail address for any interested party, including Unitholders, to communicate with the Board. Our Corporate Secretary reviews e-mails sent to that address and has some discretion in determining how or whether to respond, and in determining to whom such e-mails should be forwarded. In our experience, substantially all of the e-mails received are ordinary client requests for administrative assistance that are best addressed by management, or solicitations of various kinds.
Certifications by our CEO and CFO pursuant to Section 302 of the Sarbanes-Oxley Act of 2002 have been furnished as exhibits to this Form 10-K.
AB Holding Unitholders and AB Unitholders may request a copy of any committee charter, the Guidelines, the Code of Ethics, and the Item 406 Code by contacting our Corporate Secretary. The charters and memberships of the Executive, Audit, Governance and Compensation Committees may be found in the “Responsibility - Corporate Governance” section of our Internet Site.
Fiduciary Culture
We maintain a robust fiduciary culture and, as a fiduciary, we place the interests of our clients first and foremost. We are committed to the fair and equitable treatment of all our clients, and to compliance with all applicable rules and regulations and internal policies to which our business is subject. We pursue these goals through education of our employees to promote awareness of our fiduciary obligations, incentives that align employees’ interests with those of our clients, and a range of measures, including active monitoring, to ensure regulatory compliance. Our compliance framework includes:
•the Code of Ethics Oversight Committee (the “Ethics Committee”) and the Internal Compliance Controls Committee (the “Compliance Committee”), each of which consists of executive and other senior officers of the firm;
•an ombudsman office, where employees and others can voice concerns on a confidential basis;
•firm-wide compliance and ethics training programs; and
•a Conflicts Officer and a Conflicts Committee, which help to identify and mitigate conflicts of interest.
The Ethics Committee oversees all matters relating to issues arising under our Code of Ethics and meets on a quarterly basis and at such other times as circumstances warrant. The Ethics Committee and its subcommittee, the Personal Trading Subcommittee, have oversight of personal trading by our employees.
The Compliance Committee reviews compliance issues throughout our firm, endeavors to develop solutions to those issues as they may arise from time to time and oversees implementation of those solutions. The Compliance Committee meets on a quarterly basis and at such other times as circumstances warrant.
Item 11. Executive Compensation
Compensation Discussion and Analysis (“CD&A”)
In this CD&A, we provide an overview and analysis of our executive compensation philosophy, address the principal elements used to compensate our executive officers and explain how our executive compensation program aligns with AB’s strategic objectives. Additionally, we discuss 2024 incentive compensation recommendations and decisions made by our Compensation Committee for our named executive officers (“NEOs”). This CD&A should be read together with the compensation tables that follow this section. Our NEOs for 2024(1) are:
| | | | | | | | |
| | |
| | |
Seth Bernstein President and Chief Executive Officer (“CEO“) | Jackie Marks Chief Financial Officer (“CFO“) | Onur Erzan Head of Global Client Group and Private Wealth |
| | |
| | |
Chris Hogbin Global Head of Investments | Karl Sprules Chief Operating Officer ("COO") | |
(1)Bill Siemers resigned from his position as Interim Chief Financial Officer on February 29, 2024, at which point he transitioned into the role of a Senior Advisor to AB. We have included information concerning Mr. Siemers in this CD&A and the compensatory tables that follow in accordance with applicable SEC rules and regulations.
Compensation Philosophy and Goals
Our employees are collectively the most important asset of our firm. We invest in our people – we hire highly talented individuals, develop them, recognize them for giving their best thinking to the firm and our clients, and reward them to motivate and retain them while aligning their interests with the interests of our Unitholders and clients.
Furthermore, our compensation practices are structured to help the firm realize its long-term growth strategy to Deliver, Diversify and Expand, Responsibly, with Equitable (the “Growth Strategy”), which includes firm-wide initiatives to:
•Deliver superior investment solutions to our clients;
•Develop high-quality differentiated services; and
•Maintain strong incremental margins.
We also are focused on ensuring that our compensation practices are competitive with industry peers and within the geographies that we operate and provide sufficient opportunities for wealth creation for all our top performing senior staff, including our NEOs, which we believe will enable us to meet the following key compensation goals:
•motivate and retain highly qualified executive talent;
•reward current-year performance;
•incentivize future contribution;
•recognize distinct outstanding individual performance that foster our firm’s primary objective of helping our clients reach their financial goals; and
•align our executives’ long-term interests with those of our Unitholders and clients.
Deliver Superior Investment Solutions to our Clients:
Investment Performance
The firm’s investment teams remain focused on consistently delivering differentiated return streams to our clients. We believe that, over time, the ability to produce idiosyncratic returns that cannot be easily replicated will be central to sustaining our competitive advantage. In 2024, our fixed income performance declined, primarily due to long-term interest rates moving upwards, weighing on our longer duration exposure. 57% of fixed income assets were outperforming for the one-year period ended December 31, 2024, 61% outperforming over the three-year period and 57% outperforming for the five-year period. In Equities, our performance improved over the one-year and the five-year periods, but it remained relatively challenged due to both stock selection and highly concentrated benchmark returns led by a narrow set of growth-oriented stocks. Approximately 45% of equity assets were in outperforming services for the one-year period, 35% for the three-year period and 65% for the five-year period ended December 31, 2024. (This performance data reflects the percentage of active fixed income and equity assets in Institutional Services that outperformed their respective benchmarks, gross of fees, and of active fixed income and equity assets in Retail advisor and I share class funds ranked in the top half of their Morningstar category; if no advisor class exists, we used A share class. Performance for private client services included as available.)
Net Flows
Scaling our proven investment services remains a key focus of our firm. In 2024, we grew our actively managed platform organically, registering $4.3 billion annual net inflows across our active strategies. Additionally, we grew organically in two of our three distribution channels, retail and private wealth, while institutions saw net outflows.
By asset class, our active fixed income platform, consisting of our taxable and tax-exempt strategies, grew organically at a 9% annual rate. Active alternative/multi-asset strategies also grew organically at a 3% annual rate. Partially offsetting the above-mentioned trends, our actively managed equity strategies posted an attrition rate of nearly 10%, with outflows primarily concentrated within institutions. Across our passively managed platform, we registered $6.5 billion outflows. AB’s net firm-wide outflows totaled $2.2 billion in 2024, improving versus $7.0 billion net firm-wide outflows in 2023.
By channel, retail gross sales rose to $99.9 billion in 2024, up from $71.1 billion in 2023. The retail redemption rate also rose to 30% from 28% in 2023, and full-year inflows were $13.4 billion, driven by strong demand for our taxable and tax-exempt fixed income. Within our institutional channel, 2024 gross sales of $13.0 billion increased from the prior-year’s $11.8 billion. Net outflows of $16.5 billion were primarily concentrated within active equities. Our institutional pipeline was at $10.7 billion AUM at year-end 2024 versus $12.0 billion at year-end 2023. In private wealth, gross sales of $20.8 billion increased from the prior-year’s $18.6 billion, with the channel generating $0.9 billion net inflows, and remaining positive for four consecutive years.
Our Compensation Practices are Structured to Help the Firm Realize its Growth Strategy
| | | | | | | | | | | | | | |
| | | | Deliver superior investment solutions to clients |
| Develop, commercialize and scale our suite of services Expanding our Coverage We launched our first perpetual, retail-oriented alternative offering with CarVal, the AB CarVal Credit Opportunities Interval Fund, in addition to 5 new active ETFs, bringing the total to 17 active ETFs with $5.5 billion AUM. Diversifying our Platform We launched an insurance vertical and continued to grow our private markets capabilities, in partnership with Equitable, reaching $70 billion in AUM. Enhancing our Margins We delivered on transformative initiatives such as our Bernstein Research Joint Venture and the relocation of our New York City office, which contributed to our 410 bps margin expansion in 2024. Growing Organically Our actively managed assets grew organically in 2024, registering $4.3 billion in net active annual inflows, led by $24.6 billion in active fixed income inflows, across taxable and tax-exempt. | | |
| | | Fixed Income and Equity Performance |
| | | Maintain strong incremental margins(1) |
| | | AB Adjusted Operating Margin |
| | | |
| | | Total Unitholder Return (2020 - 2024; assumes dividend reinvestment) |
| | |
| | |
| | | |
| | | |
| | | |
Overview
| | | | | | | | | | | |
| Record Retail Sales | Active Fixed Income | Organic Growth | Beneficial Pipeline Mix |
| AB’s retail channel tops record 2021 sales | Record annual active fixed income inflows | Two of three channels grew organically in 2024 | Alternatives represented over |
| $99.9B | $24.6B | 5% & 1% | 88% |
| in gross sales in 2024, in-line with our record 2021 sales | net inflows in taxable and tax-exempt | Retail & Private Wealth grew organically 5% & 1% in 2024 | of institutional pipeline fee base at year-end |
(1)We provide additional information regarding our adjusted operating margin in MD&A above in Item 7.
Overview of 2024 Incentive Compensation Program
When reflecting on 2024 performance and pay, each of our NEOs received a portion of his year-end incentive compensation in the form of an annual cash bonus and a portion in the form of long-term incentive compensation awards. The split between annual cash bonus and long-term incentive compensation varied depending on the NEO's total compensation, with lower-paid executives receiving a greater percentage of their incentive compensation as cash bonuses than more highly-paid executives. (For additional information about these compensatory elements, see “Compensation Elements for NEOs” below.)
In 2024, we utilized performance scorecards for senior leaders of the firm, including our NEOs. These scorecards require our senior leaders to develop and maintain a broad leadership mindset with priorities, such as accelerating strategic initiatives and our firm's alternatives platform, that are aligned with firm-wide goals of creating long-term value for all of our stakeholders. The scorecard for each NEO reflected our Growth Strategy and included actual results relative to target metrics across the following measures:
•Financial performance, including peer results, adjusted operating margin, adjusted net revenue growth and operating efficiency targets (see our discussion of “Management Operating Metrics” in Item 7 for a reconciliation between our results pursuant to U.S. GAAP and our adjusted results);
•Investment performance, by delivering competitive returns across services and time periods;
•Strategic, aligned with our strategy of delivering core investment solutions, while developing high-quality differentiated services, in faster-growing geographies, responsibly, in partnership with Equitable;
•Organizational, including organizational effectiveness and efficiency, leadership impact, succession planning, developing talent, innovating and automating, and real estate utilization; and
•Cultural, including purpose, employee engagement, diversity, retention and safety.
The scorecards support management and the Compensation Committee in assessing each executive's performance relative to business, operational and cultural goals established at the beginning of the year and reviewed in the context of the current-year financial performance of the firm. The amount of incentive compensation paid to our NEOs continues to be determined on a discretionary basis by the Compensation Committee. (For additional information, please see "Compensation Committee; Process for Determining Executive Compensation" below in this CD&A.)
Mr. Bernstein, with the Compensation Committee, continue to believe that the appropriate metric to consider in determining the amount of incentive compensation paid to all employees, including our NEOs, in respect of 2024 performance is the ratio of adjusted employee compensation and benefits expense to adjusted net revenues, which terms are described immediately below:
•Adjusted employee compensation and benefits expense is our total employee compensation and benefits expense minus other employment costs such as recruitment, training, temporary help and meals, and excludes the impact of mark-to-market vesting expense, as well as dividends and interest expense, associated with employee long-term incentive compensation-related investments. Also, we adjust for certain performance-based fees passed through to our investment professionals.
•Adjusted net revenues (see our discussion of “Management Operating Metrics” in Item 7 for a reconciliation between our results pursuant to U.S. GAAP and our adjusted results) exclude investment gains and losses and dividends and interest on employee long-term incentive compensation-related investments. In addition, adjusted net revenues offset distribution-related payments to third parties as well as amortization of deferred sales commissions against distribution revenues. We also exclude additional pass-through expenses we incur (primarily through our transfer agent) that are reimbursed and recorded as fees in revenues. Additionally, we adjust for the revenue impact of consolidating company-sponsored investment funds by eliminating the consolidated company-sponsored investment funds’ revenues and including AB’s fees from such funds, and AB’s investment gains and losses on its investment in such funds, that were eliminated in consolidation. We also adjust for certain acquisition-related pass-through performance-based fees and certain other performance-based fees passed through to our investment professionals.
In addition, Mr. Bernstein, along with the Compensation Committee, continue to believe that the firm’s adjusted employee compensation and benefits expense, excluding the impact of performance-based fees, generally should not exceed 50.0% of our adjusted net revenues annually, except in unexpected or unusual circumstances. As the table below indicates, in 2024, adjusted employee compensation and benefits expense amounted to approximately 47.9% of our adjusted net revenues (in thousands):
| | | | | |
| Net Revenues | $ | 4,475,139 | |
Adjustments (see above) | (946,741) | |
| Adjusted Net Revenues | $ | 3,528,398 | |
| Employee Compensation & Benefits Expense | 1,801,767 | |
Adjustments (see above) | (110,729) | |
| Adjusted Employee Compensation & Benefits Expense | $ | 1,691,038 | |
| Adjusted Compensation Ratio | 47.9 | % |
Our 2024 adjusted compensation ratio of approximately 47.9% reflects a balancing of the need to keep compensation levels competitive with industry peers in order to attract, motivate and retain highly-qualified talent with the need to maintain strong operating leverage in our business. The Compensation Committee works with management to help ensure both needs are sufficiently addressed.
We have described below each NEO’s individual achievements in 2024 given each officer’s role, the contents of their respective performance scorecards and the firm's business and operational goals:
| | | | | | | | | | | |
| | | |
| Seth Bernstein President and Chief Executive Officer Summary of Achievements: As President and CEO, Mr. Bernstein achieved organic growth in two of three distribution channels. Under Mr. Bernstein’s leadership, revenues increased, and operating margin expanded from 28% to 32%. Mr. Bernstein executed on multiple strategic initiatives, including the close of Bernstein Research Services joint ventures with Societe Generale, the continued strengthening of flows into retail products like Exchange Traded Funds (ETFs) and Separately Managed Accounts (SMAs), the creation of an insurance vertical, the launch of AB’s first onshore fund in China, the expansion of operations in India, and the development of AB’s private alternative platform. Mr. Bernstein enhanced the AB executive leadership team with the appointment of Chris Hogbin as Global Head of Investments and Jackie Marks as Chief Financial Officer, while fostering the development of managers, and cultivating a strong firm culture. | Individual Achievements Financial and Investment Performance •Maintained flows in a difficult fundraising environment; two of the firm’s three distribution channels grew organically year-over-year. •2024 adjusted EPU of $3.25 increased 21% versus 2023 and adjusted operating margin increased 410 bps to 32.3%. •Despite challenging markets, maintained strong performance in Fixed Income, outperforming applicable peers or benchmarks, while our equities franchise underperformed due to both stock selection as well as strong benchmark returns narrowly led by a small number of mega-cap technology stocks (both measured by the percentage of assets outperforming). Strategic •Closed the Bernstein Research Services joint ventures with Societe Generale and enhanced the longer-term financial flexibility for AB to invest in core businesses of investment and wealth management. •Capitalized on strategic investments and deepened market share for key products. Oversaw the growth of the ETF and SMA platforms; the ETF business expanded to 17 funds and over $5B in AUM, while SMAs generated $6B in net flows. Gained share and built track record in Europe via newly acquired Global & European Growth Equities Team which has reached over $713M in AUM. •Created an insurance vertical to capitalize on momentum and grow AB’s brand in the insurance space. Hired Geoff Cornell as AB’s first Chief Investment Officer of Insurance. Oversaw the $100M commitment to Reinsurance Group of America’s (RGA) sidecar, Ruby Re, gaining access to investment management agreements with RGA for $1B of private market AUM. •After receiving Fund Management Company license in December of 2023, launched AB’s first onshore fund in China. Appointed Dengpan Luo as Chief Executive Officer and laid plans to hire a Chief Investment Officer of FMC to drive growth and flows in 2025. •Committed to the growth of the Private Alternatives platform. Raised over $8B in gross sales and made progress in retail distribution through the launch of the Credit Opportunities Fund and AB Lend. Navigated AB CarVal business through challenging markets and the finalization of the contingent earnout. Laid groundwork for further integration of AB CarVal and broader private alternatives platform. Organizational •Led a successful transition of New York midtown office to state-of-the-art building in Hudson Yards. •Bolstered the strength of the executive leadership team through the appointment of Chris Hogbin as Global Head of Investments and onboarding of Jackie Marks as Chief Financial Officer. •Invested in Pune office, expanded headcount to include over 500 roles across corporate, client group, and investment functions. Established local leadership and cultivated a strong culture with high engagement. •Navigated ESG headwinds and advanced firmwide sustainability goals. Strengthened controls and oversight to minimize risk and advanced corporate sustainability. Culture •Improved firmwide voluntary attrition and retention among our top performers. •Maintained strong engagement metrics in AB’s employee survey. Invested in competence initiatives to boost strength of AB managers. | |
| | |
| 2024 Compensation | |
| | |
| | |
| | | |
| | | | | | | | | | | |
| | | |
| Jackie Marks Chief Financial Officer effective March 1, 2024* Summary of Achievements: As Chief Financial Officer (CFO), Ms. Marks oversaw the delivery of complete, accurate and timely financial results both internally and externally (in Forms 10-K and 10-Q and Earnings Releases) and ensured continuity and continuous improvement of a strong Finance function. Ms. Marks oversaw the prioritization of the firm’s strategic initiatives and Corporate Development activities. | Individual Achievements Financial •Oversaw the achievement of improved margin growth from 28.2% to 32.3%. •Delivered on a short-term cost reduction plan to fund in-year strategic initiatives as well as co-led firm-wide efforts to develop a proactive approach to managing costs and creating capacity to improve economic margin and invest in the business. •Improved AB’s financial processes through enhanced budgeting; bringing improved financial discipline allowing for clear prioritization of spend and investment across the firm. Strategic •Formulated a Strategy and Corporate Development function to enable the acceleration of strategic initiatives. Proactively managed the assignment of investments in strategic initiatives. •Provided financial leadership to support the completion of the joint ventures between AB and Societe Generale. •Supported the $100M commitment to Reinsurance Group of America’s (RGA) sidecar, Ruby Re, to gain access to certain investment management agreements with RGA for $1B of private market AUM. •Maintained a strong relationship with Equitable, successfully partnering on the financial impacts of our strategic initiatives and investments. •Led the finance effort related to the finalization of the AB CarVal contingent earnout. Organizational •Strengthened the Finance function with several leadership hires and expanded roles for high potential talent. •Enhanced financial rigor around decision-making through additional management analytics providing greater actionable analysis. •Continued automation of processes within the Finance function, supporting innovation and allowing additional capacity for business partnering. •Began the roll out of a best-in-class ERP system estimated to be complete in 2025. Culture •Maintained strong Finance employee engagement, retention, in-office collaboration and diversity within our workforce. •Successfully completed a listening tour of Finance employees after joining the firm, enhanced collaboration within Finance with regular Town Halls and cross team events. •Introduced development opportunities to Finance employees through Power Hours: learning sessions to allow teams to improve knowledge of other business areas. | |
| | |
| 2024 Compensation | |
| | |
| | |
| | | |
* Jackie Marks joined AB on January 8, 2024, as a Senior Advisor and was appointed to the role of Chief Financial Officer as of March 1, 2024. Bill Siemers served as Interim Chief Financial Officer from January 1, 2024, to February 29, 2024.
| | | | | | | | | | | |
| | | |
| Onur Erzan Global Head of Client Group and Head of Private Wealth Summary of Achievements: As Global Head of Client Group (CG) and Head of Private Wealth (PW), Mr. Erzan delivered strong results across both groups. Mr. Erzan created an insurance vertical and appointed AB’s first Chief Investment Officer of Insurance. Mr. Erzan co-led efforts to launch AB’s first onshore fund in China, and drove progress across other strategic initiatives, including surpassing $5B in ETF assets under management, fostering sales growth in retail channel, and establishing new leadership, talent review, and process enhancement efforts in institutional business. Additionally, Mr. Erzan oversaw the expansion of global family, family office, and ultra-high net worth teams within AB’s Private Wealth Management division. | Individual Achievements Financial •Achieved solid results in CG with 2024 gross sales of $113B, including $100B retail and $13B institutional. US Retail, a key strategic growth area, grew sales by 26% year-over-year and achieved a sixth straight year of organic growth. •Realized positive PW net flows (+$862M), with 0.7% annualized net organic growth, the fourth straight year of organic growth. Grew advisor productivity by 10% and made progress towards advisor growth goals. Saw 3-year client retention above 95%. Strategic •Expanded ETF platform, adding five funds in 2024 for a total suite of 17 funds; surpassed $5B in total AUM across multiple client channels. ETF platform launched in September 2022 with two funds. •Co-led launch of first onshore fund in China after obtaining regulatory license for AB’s fund management company (FMC) in 2023. Implemented leadership changes at FMC to improve performance and build distribution relationships. Oversaw growth in sales in Asia Pacific region by 80% year-over-year. •Created an insurance vertical and appointed Geoff Cornell as AB’s first Chief Investment Officer of Insurance. Reorganized insurance investment, operations, marketing, and sales teams into the newly formed vertical. Led the $100M commitment to Reinsurance Group of America’s (RGA) sidecar, Ruby Re, to gain access to certain investment management agreements with RGA for $1B of private market AUM. In defined contribution, fostered capabilities with forums and consultant education roadshow. •Oversaw generation of $7B in gross alternatives sales for retail and institutional clients, and $1B for private wealth clients. •Revised organizational structure to enhance strategic planning across channels; launched new strategies including Credit Opportunities Fund and AB Lend. •Made progress toward Private Wealth advisor growth goals and client segmentation strategy. Increased total advisor by 5 to a total of 246 in 2024. Demonstrated success in key wealth client segments with UHNW Client Growth +~23%, outpacing the ~12% AUM growth for PWM overall. •Launched client experience program and a corresponding culture campaign, initiated pilots for various projects, and established an organizational structure for rolling out enhanced client experience. Organizational •Executed onboarding of several senior leadership roles within the CG globally across sales, business development, and product strategy. •Centered organizational structure to focus on new business growth within targeted client segments. (UHNW, Global Families, Family Offices, Women and Diverse Markets). Culture •Continued to foster a positive, results-driven culture of continuous learning and development across CG and PW. Supported a smooth transition to AB’s new office at the Spiral. Ensured collaboration across both organizations including cross-department partnerships in business management and marketing. •Prioritized a customer-centric approach across the organization via segmented client playbooks and client engagement surveys. | |
| | |
| 2024 Compensation | |
| | |
| | |
| | | |
| | | | | | | | | | | |
| | | |
| Chris Hogbin Global Head of Investments Summary of Achievements: As Global Head of Investments, Mr. Hogbin oversaw solid investment performance across AB’s investment platform and delivered organic growth across our actively managed services. He has engendered high levels of engagement amongst our investment professionals and driven a greater level of cohesiveness and collaboration among our investors. Mr. Hogbin has found opportunities to develop, deploy, and retain talent across the investment organization, to better leverage a common infrastructure, and has evaluated opportunities to invest in capabilities that deliver better outcomes for clients. | Individual Achievements Financial and Investment Performance •Despite challenging markets, maintained strong performance in Fixed Income, outperforming applicable peers or benchmarks, while our equities franchise underperformed due to both stock selection as well as strong benchmark returns narrowly led by a small number of mega-cap technology stocks (both measured by the percentage of assets outperforming). •Worked to address areas of underperformance and developed plans to deliver improved investment performance. •Delivered organic growth across AB’s actively managed services. Strategic •Onboarded and started commercialization of new Global & European Growth Equities team launching two Lux vehicles and raising $713M AUM in first year. •Supported commercialization of innovative fixed income services, with significant organic growth in Muni SMA and new institutional clients in systematic Fixed Income services. •Directed rebuild of AB’s multi-manager long short equities service, Arya. •Oversaw continued build out of active ETF business, bringing total to 17 funds and surpassing $5B AUM. •Successfully launched first product in China FMC, and developed plan for future product launches. Organizational •Introduced new management structure with a single Chief Operating Officer and Chief Administrative Officer across the investment teams, to drive more consistency and a greater focus on strategic planning, organizational effectiveness and operational excellence. •Introduced a variety of talent processes to better attract, develop and retain the best and most innovative investment talent. •Reorganized AB’s responsibility team and improved alignment with investment teams by implementing industry focused organization. •Made progress on researching and evaluating options to evolve AB’s investment infrastructure. Culture •Engendered high levels of engagement amongst investment professionals through various activities and initiatives geared toward employees developing an overall investments mindset. •Supported a smooth transition to Hudson Yards office, with the investment teams seated in close proximity to each other, fostering greater connectedness and interaction. •Oversaw numerous working groups and various other forums for investors across asset classes to come together to discuss investment topics, processes, industry trends and to raise ideas for creating greater cohesion amongst our investors. | |
| | |
| 2024 Compensation | |
| | |
| | |
| | | |
| | | | | | | | | | | |
| | | |
| Karl Sprules Chief Operating Officer (COO) Summary of Achievements: As COO, Mr. Sprules successfully completed the relocation of AB’s New York Midtown office to Hudson Yards, marking a significant advancement in AB’s real estate strategy. Mr. Sprules co-led cost savings efforts across the firm, spearheaded efforts to achieve 90% in-office compliance and drove the expansion of AB’s footprint in India, China, and Ireland. | Individual Achievements Financial •Drove cost discipline efforts across corporate functions, resulting in reduced Global Technology and Operations costs, lower Legal and Compliance expenditures, and savings from the early termination of AB’s New York Midtown real estate lease. •Co-led firm-wide efforts to develop a continuous and proactive approach to managing costs and creating capacity to improve economic margin and invest in the business. Identified and kicked off a multi-year scoping and planning process across a number of initiatives focused on enhancing financial rigor, location strategy, talent development, business and system improvement, and artificial intelligence. Strategic •Established a new entity in Dublin, Ireland and obtained necessary regulatory approval allowing AB to provide portfolio management services in all offices across the European Union, enabling us to support the growth of AB's newly acquired Global & European Growth equities business. •Supported the completion of AB’s joint ventures with Societe Generale of Bernstein Research and oversaw a significant transfer of technology and operations functions; continues to play an active role in the executive oversight of the joint ventures. •Ensured operational readiness for the launch and post-launch of AB’s first equity fund in China, championed the establishment of the local business, and actively advised on organizational and leadership changes. Organizational •Led AB’s location strategy, consolidating the firm’s real estate footprint, including moving nearly 800 New York employees to Hudson Yards while decommissioning nearly 1 million square feet of real estate. •Expanded AB India functions across all major units of the firm, adding an additional 137 roles in 2024, managed staff attrition lower than market rates, and obtained regulatory approval to perform investment advisory activities allowing us to support future growth. •Established the Chief Artificial Intelligence Officer role to drive the strategic use of AI to enhance efficiency, improve decision-making, and transform operational and business processes across the firm. Culture •Led the change management of AB’s relocation to Hudson Yards by regularly collaborating with leadership and establishing a committee to maintain engagement and seamless integration into the new space. •Drove the firm to 90% in-office compliance and partnered to create simplified and accessible reporting for managers to enhance workplace collaboration. •Organized various employee gatherings, including the firm’s first all-employee events in New York and Nashville, to foster staff unity and engagement across business units. | |
| | |
| 2024 Compensation | |
| | |
| | |
| | | |
| | | | | | | | | | | |
| | | |
| Bill Siemers Interim Chief Financial Officer effective May 31, 2023 through February 29, 2024 Summary of Achievements: As Interim Chief Financial Officer, Mr. Siemers oversaw the delivery of complete, accurate and timely financial results both internally and externally (in Forms 10-K and 10-Q and Earnings Releases), supported the transition to a new CFO, and ensured continuity and continuous improvement of a strong Finance function. Mr. Siemers held the role of Controller and Chief Accounting Officer through August 20, 2023. | Individual Achievements Financial •Contributed to cost reduction and containment initiatives in a restricted revenue growth environment. Strategic •Supported the contribution of our cash equities and research business into a planned joint venture between AB and Societe Generale. Organizational •Led the Finance function and executed all CFO responsibilities for approximately nine months. •Supported the integration plans and processes of financial functions relating to the 2022 CarVal acquisition. •Supported the successful recruitment process to identify and hire a new CFO as well as facilitated transition and onboarding. Culture •Maintained strong Finance employee engagement, retention and in-office collaboration and grew diversity within our workforce. | |
| | |
| 2024 Compensation | |
| | |
| | |
| | | |
The compensation of each of these NEOs reflected the Compensation Committee’s judgment (and Mr. Bernstein’s judgment, with respect to each executive other than himself) in assessing the importance of the executive's achievements in the context of our firm’s adjusted financial results and progress in advancing our Growth Strategy.
Compensation Committee; Process for Determining Executive Compensation
The Compensation Committee consists of Mr. Stonehill (Chair), Mr. Kaye and Mr. Pearson. The Compensation Committee held five regular meetings in 2024.
As discussed in “NYSE Governance Matters” in Item 10, AB Holding, as a limited partnership, is exempt from NYSE rules that require public companies to have a compensation committee consisting solely of independent directors. EQH owns, directly and through various subsidiaries, an approximate 61.9% interest in AB (as of December 31, 2024), and compensation expense is a significant component of our financial results. For these reasons, Mr. Pearson, director and President and CEO of EQH, is a member of the Compensation Committee, and any action taken by the Compensation Committee requires his affirmative vote or consent. Given this structure, the Compensation Committee has established a sub-committee consisting entirely of non-management directors (i.e., Mr. Stonehill and Mr. Kaye). This “Section 16 Sub-Committee” approves awards of restricted AB Holding Units to NEOs to ensure we can utilize the short-swing trading exemption set forth in Section 16b-3 under the Exchange Act. Under this exemption, equity grants to our firm's executive officers are exempt from short-swing trading rules if each such grant is approved by the full Board or a committee of the Board consisting entirely of “non-employee” directors (generally, directors who are not officers of the company or an affiliate).
The Compensation Committee has general oversight of compensation and compensation-related matters, including:
•determining cash bonuses;
•determining contributions and awards under incentive plans or other compensation arrangements (whether qualified or non-qualified) for employees of AB and its subsidiaries, and amending or terminating such plans or arrangements or any welfare benefit plan or arrangement or making recommendations to the Board with respect to adopting any new incentive compensation plan, including equity-based plans;
•reviewing and approving the compensation of our CEO, evaluating his performance, and determining and approving his compensation level based on this evaluation; and
•reviewing and discussing the CD&A and recommending to the Board its inclusion in each of AB’s and AB Holding’s Form 10-K and, and when applicable, proxy statements.
The Compensation Committee has developed a comprehensive process for:
•reviewing our executive compensation program to ensure it is aligned with our firm’s philosophy and strategic objectives;
•evaluating performance by our NEOs against goals and objectives established in each executive's performance scorecard at the beginning of the year; and
•setting compensation for the NEOs and other senior executives.
The Compensation Committee’s year-end process generally focuses on the cash bonuses and long-term incentive compensation awards granted to NEOs and other senior executives. Mr. Bernstein, working with the other senior executives, provides recommendations for individual executive awards to the Compensation Committee for its consideration. As part of this process, and as we discuss more fully below in "Compensation Consultant; Benchmarking Data," the Chief People Officer provides the Compensation Committee with competitive market data from one or more compensation consultants.
Management periodically reviews, with the Compensation Committee, the firm’s expected adjusted financial and operating results, the firm’s actual adjusted financial and operating results and management’s year-end compensation expectations, as they evolve throughout the year. Management accomplished these reviews during regular meetings of the Compensation Committee held in February, May, September, October and November 2024. The Compensation Committee approved the firm's final year-end compensation recommendations during its regular meeting held in November 2024.
Additional information regarding the Compensation Committee’s functions can be found in the Committee's charter, which is available online in the “Responsibility - Corporate Governance” section of our Internet Site.
Compensation Consultant; Benchmarking Data
In 2024, we retained McLagan Partners (“McLagan”) as an independent consultant to provide competitive market data and trend forecasting for our NEOs and other senior executives, for which we paid McLagan $50,000 (the "2024 Benchmarking Data"). McLagan has an extensive database on compensation for most asset management companies, including private companies for which information is not otherwise available.
The 2024 Benchmarking Data summarized 2023 compensation levels and 2024 salaries, which helps form a reasonable estimation of compensation levels in the industry for executive positions like those held by our NEOs at selected asset management companies comparable to ours in terms of size and business mix (the “Comparable Companies”) and, in so doing, assists in determining the appropriate level of compensation for our NEOs.
The Comparable Companies, which management selected with input from McLagan, included:
| | | | | | | | |
| | |
| Barings | Columbia Threadneedle | Franklin Templeton Investments |
| Goldman Sachs Asset Management | Invesco | Janus Henderson Investors |
| Loomis, Sayles & Company | MFS Investment Management | Morgan Stanley Investment Management |
| Neuberger Berman Group | Nuveen Investments | Pacific Investment Management |
| Prudential Global Investment Mgmt. | Schroder Investment Management | T. Rowe Price |
| | |
The 2024 Benchmarking Data indicated that, as a group, our NEOs fall within market range. Please note that we excluded Mr. Siemers from this analysis as he resigned from his position as Interim Chief Financial Officer on February 29, 2024, at which point he transitioned into the role of a Senior Advisor to AB.
The Compensation Committee considered this information in concluding that the compensation levels paid in 2024 to our NEOs were appropriate and reasonable.
Compensation Elements for NEOs
We utilize a variety of compensation elements to achieve the goals described above, consisting of base salary, annual short-term incentive compensation awards (cash bonuses), a long-term incentive compensation award program, a defined contribution plan, a defined benefit plan and certain other benefits, each of which we discuss below:
Base Salaries
Base salaries comprise a relatively small portion of our NEOs’ total compensation. We consider individual experience, responsibilities and tenure with the firm when determining the narrow range of base salaries paid to our NEOs (please refer to “Overview of Mr. Bernstein's Employment Agreement” below for information relating to Mr. Bernstein’s base salary and other compensation elements).
Annual Short-Term Incentive Compensation Awards (Cash Bonuses)
We provide our NEOs with annual short-term incentive compensation awards in the form of cash bonuses.
We believe that annual cash bonuses, which generally reflect individual performance and the firm’s current year adjusted financial performance, provide a short-term retention mechanism for our NEOs because such bonuses typically are paid in December.
Annual cash bonuses for the 2024 performance for each NEO were determined in November 2024 and paid in December 2024. These bonuses, and the 2024 long-term incentive compensation awards described immediately below, were based on management’s evaluation, subject to the Compensation Committee’s review and approval, of each NEO’s performance during the year, the firm's progress in advancing its Growth Strategy during the year, the performance of the NEO’s business unit or function compared to business and operational goals established in each NEO's performance scorecard at the beginning of the year, and the firm’s current-year adjusted financial performance.
In 2024, Mr. Bernstein received a cash bonus of $5,425,000 in accordance with the terms of the employment agreement into which he entered with the General Partner, AB and AB Holding as of May 1, 2017 (the “CEO Employment Agreement”) and after review of Mr. Bernstein's performance during 2024 by the Compensation Committee. Please refer to “Overview of Mr. Bernstein's Employment Agreement” below for additional information relating to Mr. Bernstein’s cash bonus and other compensation elements.
Long-Term Incentive Compensation Awards
Long-term incentive compensation awards generally are denominated in restricted AB Holding Units. We utilize this structure to align our NEOs’ long-term interests directly with the interests of our Unitholders and indirectly with the interests of our clients, as strong performance for our clients generally contributes directly to increases in AUM and improved financial performance for the firm.
We believe that annual long-term incentive compensation awards provide a long-term retention mechanism for our NEOs because such awards generally vest ratably over three years. We also believe that certain long term incentive compensation awards can be used for recruitment or retention purposes when it includes a required service period. In January 2025, Mr. Erzan received a long term incentive award of $5,000,016 which cliff vests December 2028 subject to Mr. Erzan's continued service.
For 2024 performance, awards were granted in December 2024 to each of Mr. Bernstein, Ms. Marks. Messrs. Erzan, Hogbin and Sprules pursuant to the AB 2024 Incentive Compensation Award Program (the "ICAP"), an unfunded, non-qualified incentive compensation plan, and the AB 2017 Long Term Incentive Plan, our equity compensation plan (the “2017 Plan”).
Prior to the date on which an award vests, the AB Holding Units underlying an award are restricted and are not permitted to be transferred. Upon vesting, the AB Holding Units underlying an award generally are delivered, unless the award recipient has, in advance, voluntarily elected to defer receipt to future periods or the award is structured with a delayed delivery date. Quarterly cash distributions on vested and unvested restricted AB Holding Units are delivered to award recipients when cash distributions are paid generally to Unitholders.
An award recipient who resigns or is terminated without cause prior to the vesting date is eligible to continue to vest in his or her long-term incentive compensation award subject to compliance with the restrictive covenants set forth in the applicable award agreement, including restrictions on competition, and restrictions on employee and client solicitation. Additionally, the award agreement provides for continued vesting in the event of an award recipient's retirement, subject to applicable restrictive covenants. To be eligible for retirement, an award recipient must provide notice of retirement, enter into a retirement agreement and satisfy a "Rule of 70," whereby the sum of the recipient's age and full years of service must equal at least 70.
Clawbacks
The award agreement contained in the AB Incentive Compensation Award Program ("ICAP") permits AB to claw-back the unvested portion of an award if the recipient fails to adhere to our risk management policies. As such, for accounting purposes, there is no employee service requirement and awards are fully expensed when granted. As used in this Item 11, “vest” refers to the time at which the awards are no longer subject to forfeiture for breach of these restrictions or risk management policies, which we discuss further below in “Consideration of Risk Matters in Determining Compensation.”
Further, pursuant to Rule 10D-1 of the Exchange Act and Section 303A.14 of the NYSE Listed Company Manual, the Board has adopted a Compensation Recovery Policy (the "Policy") effective November 15, 2023. Pursuant to the Policy, the Company will promptly recover erroneously awarded incentive-based compensation (as defined by section 10D(b)(1) to include any compensation that is granted, earned or vested wholly or in part upon attainment of a financial reporting measure) from any current or former Executive Officer of the Company as defined by Rule 10D-1 of the Exchange Act as required under the Exchange Act and the NYSE Listed Company Manual. The company does not currently award incentive-based compensation as defined by the Act. We have filed the Policy as Exhibit 97.01 to this Form 10-K.
The portion of incentive-based compensation received from EQH specific to Mr. Bernstein and Mr. Erzan is covered under the Compensation Recovery Policy adopted by our parent EQH and will be applicable to any current or previous incentive-based compensation received directly from our parent company by Mr. Bernstein and Mr. Erzan. See "Summary Compensation Table" EQH for stock awards received by Mr. Bernstein and Mr. Erzan for which the EQH Compensation Recovery Policy is applicable.
Former Interim CFO Resignation
As announced in a Form 8-K filed on January 8, 2024, Mr. Siemers resigned from his position as Interim Chief Financial Officer on February 29, 2024, a position he held since June 2023. Upon resignation, he transitioned into the role of a Senior Advisor to AB. His responsibilities as Interim CFO were promptly transferred to Jackie Marks on March 1, 2024 as the current CFO on an ongoing basis.
Defined Contribution Plan
U.S. employees of AB, including each of our NEOs, are eligible to participate in the Profit Sharing Plan for Employees of AB (as amended and restated as of January 1, 2015, and as further amended as of January 1, 2017, as of April 1, 2018, and as of June 28, 2022, the “AB Profit Sharing Plan”), a tax-qualified defined contribution retirement plan. The Compensation Committee determines the amount of company contributions (both the level of annual matching by the firm of an employee’s pre-tax salary deferral contributions and the annual company profit sharing contribution, if any).
With respect to 2024, the Compensation Committee determined in November 2024 that employee deferral contributions would be matched on a dollar-for-dollar basis up to 5% of eligible compensation and that there would be no profit sharing contribution paid by AB.
Defined Benefit Plan
The retirement plan (the "Retirement Plan") is a qualified, noncontributory, defined benefit retirement plan covering current and former employees who were employed in the United States prior to October 2, 2000. Each participant’s benefits are determined under a formula which takes into account years of credited service through December 31, 2008, the participant’s average compensation over prescribed periods and Social Security covered compensation. The maximum annual benefit payable under the Retirement Plan may not exceed the lesser of $100,000 or 100% of a participant’s average aggregate compensation for the three consecutive years in which he or she received the highest aggregate compensation from us or such lower limit as may be imposed by the Internal Revenue Code of 1986, as amended (the "Code") on certain participants by reason of their coverage under another qualified retirement plan we maintain. For additional information regarding interest rates and actuarial assumptions, see Note 18 to AB's consolidated financial statements in Item 8.
During 2024, the Compensation Committee of the AB Board of Directors approved the termination of the Retirement Plan, effective May 22, 2024. We began the process of settling benefits with vested participants and all lump sum disbursements elected by plan participants were distributed in December 2024. The remaining retirement plan participants who did not elect a lump sum disbursement elected to roll over their benefit to a group annuity contract from a qualified insurance company to administer all future payments. The company will elect the qualified insurance company to administer all future payments during the first quarter of 2025 at which point, the remaining benefit obligation will be purchased by the insurance carrier and we will fully terminate the plan. As of December 31, 2024 the Retirement Plan was underfunded with a benefit obligation of $68.6 million and plan assets of $63.3 million.
Our policy is to satisfy our funding obligation for each year in an amount not less than the minimum required by ERISA and not greater than the maximum amount we can deduct for federal income tax purposes. We did not make a contribution to the Retirement Plan during 2024. The Company expects to make a contribution to the Retirement Plan during the first quarter of 2025 in the amount of $5.3 million to fully fund the Retirement Plan, purchase the group annuity contract and settle the remaining termination costs associated with the Retirement Plan.
Other Benefits
Change in Control Plan
In December 2020, the Compensation Committee approved the AllianceBernstein Change in Control Plan for Executive Officers (the "CIC Plan"). The purpose of the CIC Plan is to provide certain benefits for each individual designated by our CEO as an executive officer (an "Executive Officer") in the event of a change in control ("CIC") of AB. The CIC Plan contains a change in control provision substantially similar to the change in control provision included in Mr. Bernstein's employment agreement (as described below in "Overview of Mr. Bernstein's Employment Agreement"). The provisions under the CIC Plan also are described in a compensatory table below entitled, “Potential Payments upon Termination or Change in Control.”
The CIC Plan provides that, in the event of a CIC, unless prior to the CIC, any unvested restricted unit awards (including ICAP awards) then held by an Executive Officer are honored or assumed, or new rights are substituted therefore, so that the Executive Officer's rights and entitlements after the CIC are substantially equivalent to or better than the Executives Officer's rights and entitlements under the award, each award will, prior to the CIC, immediately and fully vest and no longer be subject to forfeiture.
In addition, (i) if the Executive Officer's employment is terminated by AB, other than for cause, (ii) the Executive Officer resigns with good reason (as defined in the CIC Plan), or (iii) the Executive Officer dies or becomes disabled, within 12 months following a CIC, the Executive Officer will be entitled to receive the sum of (a) the Executives Officer's annual base salary at the time of his or her termination, and (b) the Executive Officer's most recent annual cash incentive compensation award, multiplied by two.
The CIC Plan defines CIC to include any transaction as a result of which EQH ceases to control AB, or a successor entity that conducts the business of AB. However, there would not be a CIC unless, as a result of the transaction, an entity other than EQH controls AB (or a successor to its business).
Life Insurance
Our firm pays the premiums associated with life insurance policies purchased on behalf of our NEOs.
Consideration of Risk Matters in Determining Compensation
In 2024, we considered whether our compensation practices for employees, including our NEOs, encourage unnecessary or excessive risk-taking and whether any risks arising from our compensation practices are reasonably likely to have a material adverse effect on our firm. For the reasons set forth below, we have determined that our current compensation practices do not create risks that are reasonably likely to have a material adverse effect on our firm.
As described above in “Long-Term Incentive Compensation Awards,” long-term incentive compensation awards generally are denominated in AB Holding Units that are not distributed until subsequent years, so the ultimate value that the employee derives from the award depends on the long-term performance of the firm. Denominating the award in restricted AB Holding Units and deferring their delivery is intended to sensitize employees to risk outcomes and discourage them from taking excessive risks, whether relating to investments, operations, regulatory compliance and/or cyber security, that could lead to a decrease in the value of the AB Holding Units and/or an adverse effect on the firm's long-term prospects. Furthermore, and as noted above in “Long-Term Incentive Compensation Awards,” generally all outstanding long-term incentive compensation awards include a provision permitting us to “claw-back” the unvested portion of an employee’s long-term incentive compensation award if the Compensation Committee determines that (i) the employee failed to adhere to existing risk management policies and (ii) as a result of the employee’s failure, there has been or reasonably could be expected to be a material adverse impact on our firm or the employee’s business unit.
Overview of Mr. Bernstein's Employment Agreement
Employment Agreement Overview
Mr. Bernstein began his role as President and CEO on May 1, 2017, with an initial term ending on May 1, 2020, automatically extending each year thereafter unless the CEO Employment Agreement is terminated in accordance with its terms (the “Employment Term”). The terms were approved by the Board considering various factors including compensation of Mr. Bernstein’s predecessor, the 2016 compensation and 2017 expected compensation of AB’s other executive officers and Mr. Bernstein’s compensation at his former employer. Amendments in December 2018 and 2019 included aligning equity awards with AB's practices, increasing severance payments, redefining change in control, and narrowing the definition of good reason.
Compensation Elements
Base Salary
Mr. Bernstein’s annual base salary under the CEO Employment Agreement has been, and continues to be, $500,000. This amount is consistent with our firm’s policy to keep base salaries of executives and other highly-compensated employees low in relation to total compensation. Any future increase to Mr. Bernstein's base salary is entirely at the discretion of the Compensation Committee.
Cash Bonus
Mr. Bernstein is entitled to a target cash bonus of $3,000,000 annually, subject to review. For 2024, he received a $5,425,000 bonus based on performance evaluations. See description of the performance metrics and individual achievement for Mr. Bernstein above.
Restricted AB Holding Units
Starting in 2018, Mr. Bernstein is eligible for annual equity awards with a grant date fair value of $3,500,000, subject to review and increase by the Compensation Committee, in its sole discretion, in accordance with AB’s compensation practices and policies generally applicable to the firm’s executive officers as in effect from time to time. During November 2024, the Compensation Committee approved an equity award to Mr. Bernstein with a grant date fair value equal to $5,075,000, subject to the same terms as other executive officers, which terms and conditions are described above in "Compensation Elements for NEOs - Long-Term Incentive Compensation Awards."
Perquisites and Benefits
Mr. Bernstein is eligible for all executive benefit plans and, for his safety and accessibility, is provided with a company car and driver for business and personal use and cybersecurity protection services contracted through a third party.
Severance and Change in Control Benefits
If Mr. Bernstein is terminated without cause, or because of his death or disability, or resigns for good reason, and he signs and does not revoke a waiver and release of claims, he will receive the following severance benefits:
•A cash payment based on a multiple of his base salary and bonus opportunity (1x for resignation for good reason, 1.5x for termination without cause or because of death or disability).
•A pro rata bonus based on actual performance for the fiscal year in which the termination occurs.
•COBRA coverage costs and following the COBRA coverage period, access to AB’s medical plans at his (or his spouse’s) sole expense.
If terminated within 12 months following a change in control (as defined in the amended CEO Employment Agreement), he will receive the same severance benefits as described above, except that his cash payment will be equal to 2x the sum of his base salary and bonus opportunity. In the event any payments made to Mr. Bernstein upon a change in control of AB constitute “golden parachute payments” within the meaning of Section 280G of the Internal Revenue Code and would be subject to an excise tax imposed by Section 4999 of the Internal Revenue Code, such payments will be reduced to the maximum amount that does not result in the imposition of such excise tax, but only if such reduction results in Mr. Bernstein receiving a higher net-after tax amount than he would receive absent such reduction.
For additional information on severance and change in control benefits for Mr. Bernstein as of December 31, 2024, see Potential Payments Upon Termination or Change in Control below.
Mr. Bernstein is subject to confidentiality, non-competition during employment and six months after, and non-solicitation of customers and employees for 12 months post-termination.
Mr. Bernstein negotiated the severance and change-in-control provisions described immediately above to have the security and flexibility to focus on the business and preserve the value of his long-term incentive compensation. The Board and EQH determined that these provisions were reasonable and appropriate because they were necessary to recruit and retain Mr. Bernstein and provided Mr. Bernstein with effective incentives for future performance, aligning his interests with those of AB’s Unitholders and clients, and providing effective incentives for future performance.
Compensation awarded by EQH to Mr. Bernstein and Mr. Erzan
In February 2024, EQH granted to Mr. Bernstein, in connection with his membership on and service to the EQH Management Committee:
•a restricted stock unit award (for EQH common stock) with a grant date fair value of $400,006; and
•a total shareholder return ("TSR") performance share award (for EQH common stock) with a grant date fair value of $300,019, which can be earned subject to EQH’s total shareholder return relative to its peer group.
•a EPS performance share award (for EQH common stock) with a grant date fair value of $300,021, which can be earned subject to EQH's average of annual performance against Non-GAAP Common Operating EPS targets assigned each year.
Additionally, in February 2024, EQH granted to Mr. Erzan, in connection with their membership on and service to the EQH Management Committee:
•a restricted stock unit award (for EQH common stock) with a grant date fair value of $40,007; and
•a TSR performance share award (for EQH common stock) with a grant date fair value of $30,013, which can be earned subject to EQH’s total shareholder return relative to its peer group.
•a EPS performance share award (for EQH common stock) with a grant date fair value of $30,006, which can be earned subject to EQH's average of annual performance against Non-GAAP Common Operating EPS targets assigned each year.
Assumptions made in determining the EQH restricted stock unit and performance share figures discussed above are described in footnotes to the compensatory tables below entitled "Summary Compensation Table for 2024" and "Grants of Plan-Based Awards in 2024."
Mr. Bernstein and Mr. Erzan may receive additional equity or cash compensation from EQH in the future related to their continued membership on and service to the EQH Management Committee.
CEO Pay Ratio
In 2024, the compensation of Mr. Bernstein, our President and CEO, was approximately 82 times the median pay of our employees, resulting in a 82:1 CEO Pay Ratio.
We identified our median employee by examining 2024 total compensation for all individuals, excluding Mr. Bernstein, who were employed by our firm as of December 31, 2024, the last day of our payroll year. We included all of our employees in this process, whether employed on a full-time or part-time basis. We did not make any assumptions or estimates with respect to total compensation, but we did adjust compensation paid to our non-U.S. employees during our 2024 fiscal year based on the average daily exchange rates for the three-month period ending September 30, 2024 (data compiled in fourth quarter) between the local currencies in which such employees are paid and U.S. dollars. We define “total compensation” as the aggregate of base salary (plus overtime, as applicable), commissions (as applicable), cash bonus and the grant date fair value of long-term incentive compensation awards.
After identifying the median employee based on total compensation, we calculated total compensation in 2024 for such employee using the same methodology we use for our NEOs as set forth below in the "Summary Compensation Table for 2024."
As illustrated in the table below, our 2024 CEO Pay Ratio is 82:1:
| | | | | | | | |
| Seth Bernstein | Median Employee |
| Base salary ($) | 500,000 | | 127,000 | |
| Cash bonus ($) | 5,425,000 | | 14,000 | |
Stock awards ($)(1) | 6,075,046 | | — | |
All other compensation ($)(2) | 127,148 | | 6,779 | |
| Total ($) | 12,127,194 | | 147,779 | |
| 2024 CEO Pay Ratio | 82:1 | |
(1)Includes (i) an award granted by AB of restricted AB Holding Units with a grant date fair value of $5,075,000 and (ii) awards granted by EQH with an aggregate grant date fair value of $1,000,046, as more fully described above in “Compensation awarded by EQH to Mr. Bernstein and Mr. Erzan” For additional information, please refer to the compensatory tables below in this Item 11.
(2)For a description of Mr. Bernstein’s other compensation, please refer to the "Summary Compensation Table for 2024 below." The median employee's other compensation consists of a $6,345 contribution match under the AB Profit Sharing Plan, a $360 mobile phone stipend which is paid to employees generally as well, and a employer-paid group term life insurance premium of $74 .
Other Compensation-Related Matters
AB and AB Holding are, respectively, private and public limited partnerships. They are subject to taxes other than federal and state corporate income tax (see “Structure-related Risks” in Item 1A and Note 21 to AB’s consolidated financial statements in Item 8). Accordingly, Section 162(m) of the Code, which limits tax deductions relating to executive compensation otherwise available to an entity taxed as a corporation, is not applicable to either AB or AB Holding for 2024.
Compensation Committee Interlocks and Insider Participation
Mr. Pearson is a director and the President and CEO of EQH, the parent company of the General Partner.
No executive officer of AB serves as (i) a member of a compensation committee or (ii) a director of another entity, an executive officer of which serves as a member of AB’s Compensation Committee.
Compensation Committee Report
The members of the Compensation Committee reviewed and discussed with management the Compensation Discussion and Analysis set forth above and, based on such review and discussion, recommended to the Board its inclusion in this Form 10-K.
| | | | | |
| Charles Stonehill (Chair) | Daniel Kaye |
| Mark Pearson | |
| | |
| Summary Compensation Table for 2024 |
|
Total compensation of our NEOs for 2024, 2023 and 2022, as applicable, is as follows:
| | | | | | | | | | | | | | | | | | | | | | | | | | |
| Name and Principal Position | Year | Salary
($) | Bonus
($) | Stock Awards(1)(2) ($) | Option
Awards
($) | Pension
($) | All Other
Compensation
($) | Total
($) |
Seth Bernstein(3)(4) President and CEO | 2024 | 500,000 | | 5,425,000 | | 6,075,046 | | — | | — | | 127,148 | | 12,127,194 | |
| 2023 | 500,000 | | 4,515,000 | | 4,995,054 | | — | | — | | 114,201 | | 10,124,255 | |
| 2022 | 500,000 | | 4,925,000 | | 5,575,062 | | — | | — | | 277,777 | | 11,277,839 | |
Jackie Marks CFO | 2024 | 383,077 | | 1,428,825 | | 971,175 | | — | | — | | 582 | | 2,783,659 | |
Onur Erzan(5) Head of Global Client Group and Private Wealth | 2024 | 400,000 | | 3,080,851 | | 2,730,877 | | — | | — | | 19,302 | | 6,231,030 | |
| 2023 | 400,000 | | 2,905,851 | | 2,555,887 | | — | | — | | 17,544 | | 5,879,282 | |
| 2022 | 400,000 | | 1,955,851 | | 1,605,886 | | — | | — | | 11,017 | | 3,972,754 | |
Chris Hogbin(6) Global Head of Investments | 2024 | 400,000 | | 3,025,000 | | 2,575,000 | | — | | — | | 19,694 | | 6,019,694 | |
Karl Sprules COO | 2024 | 400,000 | | 2,225,000 | | 1,775,000 | | — | | 123,932 | | 59,109 | | 4,583,041 | |
| 2023 | 400,000 | | 2,025,000 | | 1,575,000 | | — | | 3,018 | | 32,294 | | 4,035,312 | |
| 2022 | 400,000 | | 1,555,000 | | 1,105,000 | | — | | 122,835 | | 17,860 | | 3,200,695 | |
Bill Siemers (7) Former Interim CFO | 2024 | 300,000 | | 150,000 | | — | | — | | — | | 17,340 | | 467,340 | |
| 2023 | 300,000 | | 645,000 | | 255,000 | | — | | — | | 17,340 | | 1,217,340 | |
| 2022 | 300,000 | | 525,000 | | 1,175,034 | | — | | — | | 17,340 | | 2,017,374 | |
(1)The figures in the “Stock Awards” column provide the aggregate grant date fair value of the awards calculated in accordance with FASB ASC Topic 718. For the assumptions made in determining the AB Holding Unit award values, see Note 19 to AB’s consolidated financial statements in Item 8. Assumptions made in determining the EQH restricted stock unit, TSR performance share, and EPS performance share figures in the "Stock Awards" column are set forth in the EQH 2024 Long-Term Incentive Compensation Program and described in a footnote to the "Grants of Plan-Based Awards in 2024" table below.
(2)See “Grants of Plan-Based Awards in 2024” below.
(3)See "Overview of Mr. Bernstein's Employment Agreement" and "Compensation Awarded by EQH to Mr. Bernstein and Mr. Erzan" above in CD&A for a description of Mr. Bernstein's compensatory elements. Please be advised that Mr. Bernstein's compensation also is disclosed by EQH.
(4)The "Stock Awards" column for 2024 includes the grant date fair value of the restricted stock award (grant date fair value of $400,006), the TSR performance share award (grant date fair value of $300,019), and the EPS performance share award (grant date fair value of $300,021) Mr. Bernstein received from EQH in February 2024. For 2023, this column includes the grant date fair value of the restricted stock unit award (grant date fair value of $332,029) and the TSR performance share award (grant date fair value of $498,025) Mr. Bernstein received from EQH in February 2023. For 2022, this column includes the grant date fair value of the restricted stock unit award (grant date fair value of $400,033) and the TSR performance share award (grant date fair value of $600,029) Mr. Bernstein received from EQH in February 2022.
(5)The "Stock Awards" column for 2024 includes the grant date fair value of the restricted stock unit award (grant date fair value of $40,007), the TSR performance share award (grant date fair value of $30,013), and EPS performance share award (grant date fair value of $30,006) Mr. Erzan received from EQH in February 2024. For 2023, this column includes the grant date fair value of the restricted stock unit award (grant date fair value of $40,024) and the TSR performance share award (grant date fair value of $60,012) Mr. Erzan received from EQH in February 2023. For 2022, this column includes the grant date fair value of the restricted stock unit award (grant date fair value of $40,021) and the TSR performance share award (grant date fair value of $60,014) received from EQH in February 2022.
(6)We have not provided 2023 and 2022 compensation for Mr. Hogbin as he was not deemed to be a NEO in those years.
(7)Mr. Siemers resigned from his position as Interim CFO on February 29, 2024, at which point he transitioned into the role of a Senior Advisor to AB. The "Bonus" column for 2024 includes a stub bonus in recognition of the duties performed through February 2024 as Interim CFO.
The “All Other Compensation” column includes the aggregate incremental cost to our company of certain other expenses and perquisites. For 2024, this column includes the following:
| | | | | | | | | | | | | | | | | | | | |
| Name | Personal
Use of Car
and Driver
($) | Contributions
to Profit
Sharing Plan
($) | Life
Insurance
Premiums
($) | Other(2) ($) | |
| Seth Bernstein | 104,787 | | (1) | 17,250 | | 3,564 | | 1,547 | | |
| Jackie Marks | — | | | — | | 582 | | — | | |
| Onur Erzan | — | | | 17,250 | | 630 | | 1,422 | | |
| Chris Hogbin | — | | | 17,250 | | 966 | | 1,478 | | |
| Karl Sprules | — | | | 17,250 | | 4,002 | | 37,857 | | |
| Bill Siemers | — | | | 15,000 | | 1,980 | | 360 | | |
(1)Mr. Bernstein is entitled to the use of a dedicated car and driver pursuant to his employment agreement for security and business purposes. The amount reflects Mr. Bernstein's personal use for commuting and other non-business use. Car and driver services were contracted through a third party. The cost of providing a car is determined annually and includes, as applicable, the cost of the driver, annual car lease, insurance cost and various miscellaneous expenses such as fuel and car maintenance.
(2)These amounts represent (i) mobile phone stipends paid to Messrs. Bernstein, Erzan, Hogbin, and Siemers which are paid to employees generally as well; (ii) a stipend paid to Mr. Sprules to help cover a portion of the housing cost in New York while traveling for business; and (iii) partial year cybersecurity protection services contracted through a third party for Messrs. Bernstein, Erzan, Hogbin, and Sprules to help mitigate against cyber, privacy, identity theft and reputational threats, which are available to executive officers, directors, and employees whose role includes representing AB publicly or processing significant financial transactions.
Grants of Plan-Based Awards in 2024
Grants of awards under the 2017 Plan, our equity compensation plan, during 2024 made to our NEOs are as follows (we also discuss awards issued by EQH to Mr. Bernstein and Mr. Erzan below):
| | | | | | | | | | | | | | | | | | | | |
| Grant Date | Estimated Future Payouts Under Equity Incentive Plan Awards(3) | All Other
Stock Awards:
Number of Shares
of Stock
or Units
(#) | Grant Date Fair Value of Stock Awards(1) ($) |
| Name | Threshold
(#) | Target
(#) | Maximum
(#) |
Seth Bernstein(2)(3) | 12/11/2024 | | | | 140,232 | | 5,075,000 | |
| 2/14/2024 | | | | 11,838 | | 400,006 | |
| 2/14/2024 | 1,984 | | 7,937 | | 15,874 | | 7,937 | | 300,019 | |
| 2/14/2024 | 2,220 | | 8,879 | | 17,758 | | 8,879 | | 300,021 | |
Jackie Marks(2) | 12/11/2024 | | | | 26,835 | | 971,175 | |
Onur Erzan(2)(3) | 12/11/2024 | | | | 72,695 | | 2,630,851 | |
| 2/14/2024 | | | | 1,184 | | 40,007 | |
| 2/14/2024 | 199 | | 794 | | 1,588 | | 794 | | 30,013 | |
| 2/14/2024 | 222 | | 888 | | 1,776 | | 888 | | 30,006 | |
Chris Hogbin(2) | 12/11/2024 | | | | 71,153 | | 2,575,000 | |
| | | | | | |
Karl Sprules(2) | 12/11/2024 | | | | 49,047 | | 1,775,000 | |
(1)This column provides the aggregate grant date fair value of the awards calculated in accordance with FASB ASC Topic 718. For the assumptions made in determining the AB Holding Unit values, see Note 19 to AB's consolidated financial statements in Item 8.
(2)As discussed above in “Overview of 2024 Incentive Compensation Program” and “Compensation Elements for NEOs—Long-Term Incentive Compensation Awards,” long-term incentive compensation awards granted in December 2024 to our NEOs were denominated in restricted AB Holding Units. These awards vest in equal annual increments on each of December 1, 2025, 2026 and 2027. These awards are shown in the “All Other Stock Awards” column of this table, the “Stock Awards” column of the Summary Compensation Table for 2024 and the “AB Holding Unit and/or EQH Awards” columns of the Outstanding Equity Awards at 2024 Fiscal Year-End table.
(3)In February 2024, EQH granted to each of Mr. Bernstein and Mr. Erzan (i) a restricted stock unit award with a grant date fair value of $400,006 and $40,007, respectively, (ii) a TSR performance share award with a grant date fair value of $300,019 and $30,013, respectively, which can be earned subject to EQH's TSR relative to its peer group, and (iii) a EPS performance share award with a grant date fair value of $300,021 and $30,006, respectively, which can be earned subject to EQH's average of annual performance against Non-GAAP Common Operating EPS targets assigned each year. TSR is the total amount a company returns to investors during a designated period, including both share price appreciation and dividends. The number of TSR performance shares that are earned, which cliff vest on February 28, 2027, subject to continued service, will be determined at the end of the performance period (December 2026) by multiplying the number of unearned TSR performance shares by one of the following performance factors: 200% if EQH's TSR relative to its peers is in the 87.5th percentile or greater; 100% if in the 50th percentile; 25% if in the 30th percentile; and nothing if falls below the 30th percentile. Non-GAAP Common Operating EPS is the Non-GAAP Operating Earnings (subject to certain adjustments) divided by Diluted Common Shares Outstanding. The number of EPS performance shares that are earned, which cliff vest on February 28, 2027, subject to continued service, will be determined at the end of the performance period (December 2026) by multiplying the number of unearned EPS performance shares by the three-year average of the following initial EPS performance factors: 200% if Non-GAAP Common Operating EPS increase is 18% or greater over the Starting EPS Amount; 100% if increase is 12% over the Starting EPS Amount; 25% if increase is 3% over Starting EPS Amount; and nothing if increase is less than 3%. The Starting EPS Amount is assigned each year based on the comparative increase in Non-GAAP Common Operating EPS for each calendar year, over the Non-GAAP Operating EPS for the calendar year immediately preceding each calendar year. EQH performance shares receive dividend equivalents subject to the same vesting schedule and performance conditions as the performance shares themselves. The restricted stock unit awards, which vest in equal annual increments on each of February 28, 2025, 2026 and 2027, subject to continued service, increase or decrease in value depending on the price of an EQH common share. EQH restricted stock units receive dividend equivalents subject to the same vesting schedule as the restricted stock units themselves.
In 2024, the number of restricted AB Holding Units comprising year-end long-term incentive compensation awards granted to each NEO was determined based on the closing price of an AB Holding Unit as reported for NYSE composite transactions on December 11, 2024, the eighth business day of December as determined by the Compensation Committee. At the time of these awards, the Compensation Committee consisted of Mr. Stonehill (Chair) and Messrs. Kaye and Pearson; the Section 16 Subcommittee, which approved awards to our NEOs, consisted of Mr. Stonehill (Chair) and Mr. Kaye. For further information regarding the material terms of such awards, including the vesting terms and the formulas or criteria to be applied in determining the amounts payable, please refer to "Overview of 2024 Incentive Compensation Program" and "Compensation Elements for NEOs" above.
Outstanding Equity Awards at 2024 Fiscal Year-End
Outstanding equity awards held by our NEOs as of December 31, 2024 are as follows:
| | | | | | | | | | | | | | | | | | | | | | | |
| | Option Awards | | AB Holding Unit and/or EQH Awards |
| Name | Number of
Securities
Underlying
Unexercised
Options
Exercisable
(#) | Number of
Securities
Underlying
Unexercised
Options
Unexercisable
(#) | Option
Exercise
Price
($) | Option
Expiration
Date | | Number of
Shares
or Units of
Stock That
Have Not
Vested
(#) | Market Value of Shares or Units of Stock That Have Not Vested(10) ($) |
Seth Bernstein(1)(2)(4) | — | | — | | — | | — | | | 270,355 | | 10,027,477 | |
| — | | — | | — | | — | | | 23,411 | | 1,104,320 | |
| — | | — | | — | | — | | | 68,683 | | 3,239,777 | |
| — | | — | | — | | — | | | 18,184 | | 857,739 | |
Jackie Marks(5) | — | | — | | — | | — | | | 26,835 | | 995,327 | |
Onur Erzan(3)(4)(6) | — | | — | | — | | — | | | 139,193 | | 5,162,686 | |
| — | | — | | — | | — | | | 2,487 | | 117,319 | |
| — | | — | | — | | — | | | 7,422 | | 350,096 | |
| — | | — | | — | | — | | | 1,819 | | 85,802 | |
Chris Hogbin(7) | — | | — | | — | | — | | | 131,223 | | 4,867,051 | |
Karl Sprules(8) | — | | — | | — | | — | | | 92,889 | | 3,445,241 | |
Bill Siemers(9) | — | | — | | — | | — | | | 7,065 | | 262,030 | |
(1)Mr. Bernstein was awarded: (i) 140,232 restricted AB Holding Units in December 2024 that are scheduled to vest in equal increments on each December 1, 2025, 2026 and 2027; (ii) 136,289 restricted AB Holding Units in December 2023, one-third of which vested on December 1, 2024, and the remainder of which is scheduled to vest in equal increments on each of December 1, 2025 and 2026; (iii) 117,791 restricted AB Holding Units in December 2022, one-third of which vested on each of December 1, 2023 and 2024, and the remainder of which is scheduled to vest on December 1, 2025. For further information, see “Overview of Mr. Bernstein's Employment Agreement” above.
(2)EQH restricted stock unit awards, which are described for Mr. Bernstein in the second line of data in the above table, will vest ratably over a three-year vesting period subject to continued employment during the vesting period. EQH TSR performance share awards, which are described in the third line of data in the above table, and EQH EPS performance share awards, which are described in the fourth line of data in the above table, cliff vest on the third anniversary of the grant date subject to continued employment during the vesting period and meeting the applicable performance criteria. In February 2024, 2023 and 2022, EQH granted to Mr. Bernstein (i) a restricted stock unit award with a grant date fair value of $400,006, $332,029 and $400,033, respectively; (ii) a TSR performance share award with a grant date fair value of $300,019, $498,025 and $600,029, respectively; and (iii) a EPS performance share award with a grant date fair value of $300,021, respectively. The TSR performance share awards granted in 2024, 2023 and 2022 can be earned subject to EQH's TSR relative to its peer group. The EPS performance share award granted in 2024 can be earned subject to EQH's average of annual performance against Non-GAAP Common Operating EPS targets assigned each year. Actual and projected performance factors have been applied to the TSR performance share and EPS performance share awards reflected in the "Outstanding Equity Awards at 2024 Fiscal Year-End" table above. Please see the table above entitled "Grants of Plan-Based Awards in 2024" for additional information regarding the EQH awards.
(3)EQH restricted stock unit awards, which are described for Mr. Erzan in the second line of data in the above table, will vest ratably over a three-year vesting period subject to continued employment during the vesting period. EQH TSR performance share awards, which are described in the third line of data in the above table, and EQH EPS performance share awards, which are described in the fourth line of data in the above table, cliff vest on the third anniversary of grant date subject to continued employment during the vesting period and meeting the applicable performance criteria. In February 2024, 2023 and 2022, respectively, EQH granted to Mr. Erzan (i) a restricted stock unit award with a grant date fair value of $40,007, $40,024 and $40,021, respectively; (ii) a TSR performance share award with a grant date fair value of $30,013, $60,012 and $60,014, respectively; and (iii) a EPS performance share award with a grant date fair value of $30,006, respectively. The TSR performance share awards granted in 2024, 2023 and 2022 can be earned subject to EQH's TSR relative to its peer group. The EPS performance share award granted in 2024 can be earned subject to EQH's average of annual performance against Non-GAAP Common Operating EPS targets assigned each year. Actual and projected performance factors have been applied to the TSR performance share and EPS performance share awards reflected in the "Outstanding Equity Awards at 2024 Fiscal Year-End" table above. Please see the table above entitled "Grants of Plan-Based Awards in 2024" for additional information regarding the EQH awards.
(4)For further information regarding the equity awards granted to Mr. Bernstein and Mr. Erzan by EQH, please see "Compensation awarded by EQH to Mr. Bernstein and Mr. Erzan" above in CD&A.
(5)Ms. Marks was awarded 26,835 restricted AB Holding Units in December 2024 that are scheduled to vest in equal increments on each of December 1, 2025, 2026 and 2027.
(6)Mr. Erzan was awarded: (i) 72,695 restricted AB Holding Units in December 2024 that are scheduled to vest in equal increments on each of December 1, 2025, 2026 and 2027; and (ii) 80,362 restricted AB Holding Units in December 2023, of which one-third vested on December 1, 2024, and the remainder of which is scheduled to vest in equal increments on each of December 1, 2025 and 2026; and (iii) 38,771 restricted AB Holding Units in December 2022, one-third of which vested on December 1, 2023 and December 1, 2024, and the remainder of which is scheduled to vest on December 1, 2025.
(7)Mr. Hogbin was awarded 71,153 restricted AB Holding Units in December 2024 that are scheduled to vest in equal increments on each of December 1, 2025, 2026 and 2027. The total AB Holding Unit figure set forth in the table includes AB Holding Units granted in years prior to when Mr. Hogbin was deemed to be a NEO.
(8)Mr. Sprules was awarded (i) 49,047 restricted AB Holding Units in December 2024 that are scheduled to vest in equal increments on each of December 1, 2025 2026 and 2027; and (ii) 51,538 restricted AB Holding Units in December 2023, of which one-third vested on December 1, 2024, and the remainder of which is scheduled to vest in equal increments on each of December 1, 2025 and 2026; and (iii) 28,450 restricted AB Holding Units in December 2022, one-third of which vested on December 1, 2023 and December 1, 2024, and the remainder of which is scheduled to vest on December 1, 2025.
(9)Mr. Siemers was awarded: (i) 8,344 restricted AB Holding Units in December 2023, of which one-third vested on December 1, 2024, and the remainder of which is scheduled to vest in equal increments on each of December 1, 2025 and 2026; and (ii) 4,506 restricted AB Holding Units in December 2022, one-third of which vested on December 1, 2023 and December 1, 2024, and the remainder of which is scheduled to vest on December 1, 2025.
(10)The market values of restricted AB Holding Units (rounded to the nearest whole unit) set forth in this column were calculated assuming a price per AB Holding Unit of $37.09, which was the closing price on the NYSE of an AB Holding Unit on December 31, 2024, the last trading day of AB's last completed fiscal year. The market values of EQH shares set forth in this column were calculated assuming a price per share of $47.17, which was the closing price on the NYSE of an EQH share on December 31, 2024.
Option Exercises and AB Holding Units and EQH Shares Vested in 2024
AB Holding Units and EQH shares held by our NEOs that vested during 2024 are as follows:
| | | | | | | | | | | | | | | | | |
| | AB Holding Unit and EQH Option Awards | | AB Holding Unit and EQH Share Awards |
| Name | Number of AB
Holding Units
or EQH
Options
Acquired on
Exercise
(#) | Value Realized
on Exercise
($) | | Number of AB
Holding Units
or EQH Shares
Acquired on
Vesting
(#) | Value Realized
on Vesting
($) |
Seth Bernstein (1) | 122,655 | | 2,115,306 | | | 169,354 | | 6,100,635 | |
| Jackie Marks | — | | — | | | — | | — | |
Onur Erzan (2) | — | | — | | | 128,914 | | 4,670,899 | |
| Chris Hogbin | — | | — | | | 60,439 | | 2,192,128 | |
| Karl Sprules | — | | — | | | 44,040 | | 1,597,334 | |
| Bill Siemers | — | | — | | | 28,224 | | 956,107 | |
(1)Includes 20,602 EQH shares acquired with a value of $705,416 that vested during 2024.
(2)Includes 2,362 EQH shares acquired with a value of $80,857 that vested during 2024.
Pension Benefits
| | | | | | | | | | | | | | |
| Name | Plan Name | Number of Years of Credited Service(2) | Present Value of Accumulated Benefit ($)(3) | Payments During Last
Fiscal Year |
Karl Sprules (1) | AB Retirement Plan | 11 | 123,932 | — | |
(1)We have provided information for Mr. Sprules; he is the only one of our NEOs who participates in the AB Retirement Plan. For additional information regarding the AB Retirement Plan, see "Defined Benefit Plan" above in CD&A and Note 18 to AB's consolidated financial statements in Item 8 of this Form 10-K.
(2)Effective December 31, 2008, benefit accruals were frozen under the AB Retirement Plan.
(3)During 2024, the Compensation Committee of the AB Board of Directors approved the termination of the Retirement Plan, effective May 22, 2024. Certain participants elected lump sum disbursements. Mr. Sprules elected to receive a lump sum disbursement from the Retirement Plan which was distributed to him on December 3, 2024 in the amount of $123,932. For further discussion, see "Defined Benefit Plan" above in CD&A and Note 18 to AB's consolidated financial statements in Item 8 of this Form 10-K.
Potential Payments upon Termination or Change in Control
Estimated payments and benefits to which our NEOs would have been entitled upon a change in control of AB or the specified qualifying events of termination of employment as of December 31, 2024 are as follows:
| | | | | | | | | | | |
| Name and Trigger Event | Cash Payments(1) ($) | Acceleration of Restricted AB Holding Unit Awards(2) ($) | Other Benefits(3) ($) |
| Seth Bernstein | | | |
| Change in control | — | | 10,027,477 | | — | |
Termination by Mr. Bernstein for good reason(4) | 3,500,000 | | 10,027,477 | | 21,440 | |
Termination of Mr. Bernstein's employment by AB other than for Cause or due to Death or Disability(5)(6)(7) | 5,250,000 | | 10,027,477 | | 21,440 | |
Change in control + termination by Mr. Bernstein for good reason or termination of Mr. Bernstein's employment without cause(4) | 7,000,000 | | 10,027,477 | | 21,440 | |
Resignation (complies with applicable agreements and restrictive covenants) under ICAP(8) | — | | 10,027,477 | | — | |
Death or disability(7) | — | | 10,027,477 | | 21,440 | |
| Jackie Marks | | | |
| Change in control | — | | 995,327 | | — | |
| Change in control + employment terminated by AB other than for cause, termination by Ms. Marks for good reason, or termination due to death or disability | 3,657,650 | | 995,327 | | — | |
Resignation, retirement or termination by AB without cause (complies with applicable agreements and restrictive covenants) under ICAP; death or disability under ICAP(7)(8) | — | | 995,327 | | — | |
| Onur Erzan | | | |
| Change in control | — | | 5,162,686 | | — | |
| Change in control + employment terminated by AB other than for cause, termination by Mr. Erzan for good reason, or termination due to death or disability | 6,961,702 | | 5,162,686 | | — | |
Resignation, retirement or termination by AB without cause (complies with applicable agreements and restrictive covenants) under ICAP; death or disability under ICAP(7)(8) | — | | 5,162,686 | | — | |
| | | |
| | | | | | | | | | | |
| Name and Trigger Event | Cash Payments(1) ($) | Acceleration of Restricted AB Holding Unit Awards(2) ($) | Other Benefits(3) ($) |
| Chris Hogbin | | | |
| Change in control | — | | 4,867,051 | | — | |
| Change in control + employment terminated by AB other than for cause, termination by Mr. Hogbin for good reason, or termination due to death or disability | 6,850,000 | | 4,867,051 | | — | |
Resignation, retirement or termination by AB without cause (complies with applicable agreements and restrictive covenants) under ICAP; death or disability under ICAP(7)(8) | — | | 4,867,051 | | — | |
| Karl Sprules | | | |
| Change in control | — | | 3,445,241 | | — | |
| Change in control + employment terminated by AB other than for cause, termination by Mr. Sprules for good reason, or termination due to death or disability | 5,250,000 | | 3,445,241 | | — | |
Resignation, retirement or termination by AB without cause (complies with applicable agreements and restrictive covenants) under ICAP; death or disability under ICAP(7)(8) | — | | 3,445,241 | | — | |
Bill Siemers(9) | — | | — | | — | |
(1)It is possible that each NEO could receive a cash severance payment on the termination of his or her employment that is not contemplated in the CIC Plan. The amounts of any such cash severance payments would be determined at the time of such termination (other than for Mr. Bernstein), so we are unable to estimate such amounts. The amounts shown for Mr. Bernstein are described in the CEO Employment Agreement. The amounts shown for Ms. Marks, Mr. Erzan, Mr. Hogbin, and Mr. Sprules in the event of a change in control coupled with termination of employment are described in the CIC Plan.
(2)See Notes 2 and 19 in AB’s consolidated financial statements in Item 8 and “Long-Term Incentive Compensation Awards” above in CD&A for a discussion of the terms set forth in long-term incentive compensation award agreements relating to termination of employment.
(3)Reflects the value of group medical coverage to which Mr. Bernstein would be entitled.
(4)See "Overview of Mr. Bernstein's Employment Agreement" above for a discussion of the terms set forth in the CEO Employment Agreement relating to termination of employment.
(5)The CEO Employment Agreement defines “Disability” as a good faith determination by AB that Mr. Bernstein is physically or mentally incapacitated and has been unable for a period of 180 days in the aggregate during any 12-month period to perform substantially all of the duties for which he is responsible immediately before the commencement of the incapacity.
(6)Under the CEO Employment Agreement, upon termination of Mr. Bernstein’s employment due to death or disability, and after the COBRA period, AB will provide Mr. Bernstein and his spouse with access to participation in AB’s medical plans at Mr. Bernstein’s (or his spouse’s) sole expense based on a reasonably determined fair market value premium rate.
(7)“Disability” is defined in the ICAP award agreements of each NEO as the inability to engage in any substantial gainful activity by reason of any medically determinable physical or mental impairment that can be expected to last for a continuous period of not less than 12 months, as determined by the carrier of the long-term disability insurance program maintained by AB or its affiliate that covers the NEO.
(8)Applicable agreements and restrictive covenants in the ICAP award agreement include restrictions on competition and restrictions on employee and client solicitation.
(9)Mr. Siemers resigned from his position as Interim CFO on February 29, 2024, at which point he transitioned into the role of a Senior Advisor to AB. As a result, he was ineligible for any potential payment or benefit upon a change in control of AB as of December 31, 2024.
Additionally, estimated payments and benefits to which Mr. Bernstein or Mr. Erzan would have been entitled upon a change in control of EQH or the specified qualifying events of termination of employment as of December 31, 2024 are as follows (these amounts would be payable by EQH):
| | | | | |
| Reason for Employment Termination | Acceleration of EQH Option and Share Awards(5) ($) |
| Seth Bernstein | |
Retirement(1) | 1,994,206 | |
Death(2) | 3,378,171 | |
Disability(2) | 3,378,171 | |
Involuntary termination (no change in control)(3) | 1,994,206 | |
Change in control (without termination of employment)(4) | 3,006,232 | |
| Onur Erzan | |
Death(2) | 357,734 | |
Disability(2) | 357,734 | |
Involuntary termination (no change in control)(3) | 174,352 | |
Change in control (without termination of employment)(4) | 318,568 | |
(1)Reflects, as of December 31, 2024 the full value of the restricted stock unit and TSR performance share awards granted by EQH to Mr. Bernstein in 2022 and 2023. Excludes restricted stock unit, TSR performance share, and EPS performance share awards granted by EQH to Mr. Bernstein in 2024 due to minimum vesting requirements.
(2)Reflects, as of December 31, 2024, the full value associated with awards granted by EQH to Mr. Bernstein and Mr. Erzan; restricted stock unit awards (to each officer since 2022); TSR performance share awards (to each officer since 2022); and EPS performance share awards (to each officer since 2024). For additional information regarding these awards, please see the Summary Compensation Table for 2024, Grants of Plan-based Awards in 2024 and Outstanding Equity at 2024 Fiscal Year End above in this Item 11.
(3)Reflects, as of December 31, 2024, (i) the full value of the restricted stock unit and TSR performance share awards granted by EQH to Mr. Bernstein in 2022 and 2023, and (ii) the prorated value of the restricted stock unit and TSR performance share awards granted by EQH to Mr. Erzan in 2022 and 2023. Restricted stock unit, TSR performance share, and EPS performance share awards granted to Mr. Bernstein and Mr. Erzan in 2024 are excluded until a minimum of one year of vesting is reached.
(4)Reflects, as of December 31, 2024, (i) the full value of the restricted stock unit awards granted by EQH to Mr. Bernstein and Mr. Erzan in 2022, 2023 and 2024, and (ii) the target prorated value of 2024 TSR performance share and EPS performance share awards granted by EQH to Mr. Bernstein and Mr. Erzan in 2024 and (iii) the prorated value of the TSR performance share awards granted by EQH to Mr. Bernstein and Mr. Erzan in 2022 and 2023, with actual and projected performance factors applied.
(5)Acceleration of EQH awards is contingent on the award recipient's compliance with various agreements and restrictive covenants set forth in the applicable award agreement under the EQH 2024 Long-Term Incentive Compensation Program, including protection of confidential information, non-competition, non-solicitation of employees and non-solicitation of customers.
Director Compensation in 2024
During 2024, we compensated our directors, who satisfied applicable NYSE and SEC standards relating to independence (“Independent Directors”), as follows:
| | | | | | | | | | | |
| Name | Fees Earned or
Paid in Cash
($) | Stock Awards(1)(2) ($) | Total
($) |
Nella Domenici(3) | 4,506 | | — | | 4,506 | |
| Bruce Holley | 68,288 | | 170,000 | | 238,288 | |
| Daniel Kaye | 102,875 | | 170,000 | | 272,875 | |
| Joan Lamm-Tennant | 143,875 | | 170,000 | | 313,875 | |
| Das Narayandas | 110,218 | | 170,000 | | 280,218 | |
| Charles Stonehill | 151,375 | | 170,000 | | 321,375 | |
| Todd Walthall | 109,375 | | 170,000 | | 279,375 | |
(1)The aggregate number of restricted AB Holding Units underlying awards outstanding but not yet distributed at December 31, 2024, was: Ms. Domenici, zero AB Holding Units as she departed the Board in January of 2024; or Mr. Holley, 4,992 AB Holding Units; for Mr. Kaye, 10,787 AB Holding Units; for Ms. Lamm-Tennant, 10,259 AB Holding Units; for Mr. Narayandas, 10,787 AB Holding Units; for Mr. Stonehill, 10,787 AB Holding Units; and for Mr. Walthall, 10,359 AB Holding Units.
(2)Reflects the aggregate grant date fair value of the awards calculated in accordance with FASB ASC Topic 718. For the assumptions made in determining these values, see Note 19 to AB’s consolidated financial statements in Item 8.
(3)Ms. Domenici resigned from her position as Director effective January 16, 2024.
Independent Director Compensation Elements
The Board approved the compensation elements described immediately below for Independent Directors during its regular meeting held in May 2024 and has agreed to re-consider such compensation elements bi-annually:
•an annual retainer of $97,750 (paid quarterly after any quarter during which an Independent Director serves on the Board; annual retainers relating to Committee service, as described below, are paid quarterly in arrears as well);
•an annual retainer of $50,000 for acting as Independent Chair of the Board;
•an annual retainer of $37,500 for acting as Chair of the Audit Committee;
•an annual retainer of $20,000 for acting as Chair of the Compensation Committee;
•an annual retainer of $13,500 for acting as Chair of the Governance Committee;
•an annual retainer of $12,500 for serving as a member of the Audit Committee;
•an annual retainer of $9,000 for serving as a member of the Compensation Committee;
•an annual retainer of $3,000 for serving as a member of the Governance Committee; and
•an annual equity-based grant under an equity compensation plan consisting of restricted AB Holding Units with a grant date fair value of $170,000.
In 2024, the Board granted to each Independent Director then serving (which included Ms. Lamm-Tennant and Messrs. Holley, Kaye, Narayandas, Stonehill and Walthall) 4,992 restricted AB Holding Units. The number of AB Holding Units granted was determined by dividing the $170,000 grant date fair value noted above by the closing price of an AB Holding Unit on the date of the May 2024 Board Meeting, or $34.06 per unit, rounded up to the nearest whole unit. These awards are scheduled to vest in equal increments on each May 1, 2025, 2026 and 2027.
Further, in order to avoid any perception that our directors’ exercise of their fiduciary duties might be impaired, restricted AB Holding Unit grants to Independent Directors are not forfeitable, except if the director is terminated for “Cause,” as that term is defined in the 2017 Plan or the applicable award agreement. Accordingly, restricted AB Holding Units generally are delivered as soon as administratively feasible following an Independent Director’s resignation from the Board.
Equity grants to Independent Directors generally are made at the May meeting of the Board. The date of the May meeting is set by the Board at least a year in advance.
The General Partner may reimburse any director for reasonable expenses incurred in connection with attendance at Board meetings as well as additional Board responsibilities. AB Holding and AB, in turn, reimburse the General Partner for expenses incurred by the General Partner on their behalf, including amounts in respect of directors’ fees and expenses. These reimbursements are subject to any relevant provisions of the AB Holding Partnership Agreement and the AB Partnership Agreement.
Independent Director AB Holding Unit Ownership Guidelines
Each Independent Director, by the later of five years from the initial implementation date of these guidelines (February 2018) and the date as of which the director's tenure on the Board begins, shall accumulate, either through accumulating AB Holding Units awarded by the Board or purchasing Units on the open market, AB Holding Units with a market value equal to five (5) times the director's annual retainer. Each Independent Director must maintain this ownership level for the duration of the director's tenure on the Board.
As of December 31, 2024, each Independent Director then serving either complied with this policy or was on track to do so within the allotted time.
Item 12. Security Ownership of Certain Beneficial Owners and Management and Related Stockholder Matters
Securities Authorized for Issuance under Equity Compensation Plans
AB Holding Units to be issued pursuant to our equity compensation plans as of December 31, 2024 are as follows:
| | |
|
| Equity Compensation Plan Information |
|
| | | | | | | | | | | | | | |
| Plan Category | Number of
securities to
be issued upon
exercise of
outstanding
options, warrants
and rights | Weighted average
exercise price
of outstanding
options, warrants
and rights | Number of securities remaining available for future issuance(1) |
| Equity compensation plans approved by security holders | — | | | — | | 24,145,930 | |
| Equity compensation plans not approved by security holders | — | | | — | | — | |
| Total | — | | | — | | 24,145,930 | |
(1)All AB Holding Units remaining available for future issuance will be issued pursuant to the 2017 Plan, which was approved during a Special Meeting of AB Holding Unitholders held on September 29, 2017.
There are no AB Units to be issued pursuant to an equity compensation plan.
For information about our equity compensation plans, see Note 19 to AB’s consolidated financial statements in Item 8.
Principal Security Holders
As of December 31, 2024, we had no information that any person beneficially owned more than 5% of the outstanding AB Units, except as reported by EQH and certain of its subsidiaries. We have prepared the following table, and the note that follows, in reliance on information supplied by EQH:
| | | | | | | | | | | | | | |
| Name and Address of Beneficial Owner | Amount and Nature of
Beneficial Ownership
Reported on Schedule | | Percent of
Class |
Equitable Holdings(1) 1290 Avenue of the Americas New York, NY 10104 | 182,598,664 | | (1) | 61.9 | % | (1) |
(1)By reason of their relationships, EQH and its subsidiaries that hold AB Units may be deemed to share the power to vote or to direct the vote and to dispose or direct the disposition of all or a portion of these AB Units. The 61.9% includes the 1.0% general partnership interest held by EQH.
As of December 31, 2024, AB Holding was the record owner of 110,530,329, or 37.8%, of the issued and outstanding AB Units (or 37.5% including the 1.0% general partnership interest held by EQH).
Management
As of December 31, 2024, the beneficial ownership of AB Holding Units by each director and NEO of the General Partner and by all directors and executive officers as a group is as follows:
| | | | | | | | |
| Name of Beneficial Owner | Number of AB
Holding Units and
Nature of Beneficial
Ownership | Percent of Class |
Seth Bernstein(1)(2) | 773,294 | | * |
Onur Erzan(1)(3) | 218,348 | | * |
Christopher Hogbin(4) | 240,225 | | * |
Bruce Holley(1) | 4,992 | | * |
Jeffrey Hurd(1) | — | | * |
Daniel Kaye(1) | 44,702 | | * |
Joan Lamm-Tennant(1) | 16,225 | | * |
Nick Lane(1) | — | | * |
Mark Manley(1)(5) | 103,341 | | * |
Jackie Marks(6) | 26,835 | | * |
| Das Narayandas | 40,668 | | * |
Mark Pearson(1) | — | | * |
Bill Siemers(1)(7) | 67,338 | | * |
Thomas Simeone(8) | 43,730 | | * |
Cathy Spencer(9) | 105,427 | | * |
Karl Sprules(1)(10) | 216,135 | | * |
Charles Stonehill(1) | 25,923 | | * |
| Todd Walthall | 16,627 | | * |
All directors and executive officers as a group (18 persons)(11) | 1,943,810 | | 1.8 | % |
* Number of AB Holding Units listed represents less than 1% of the Units outstanding.
(1)Excludes AB Holding Units beneficially owned by EQH and its subsidiaries. Ms. Lamm-Tennant and Messrs. Bernstein, Hurd, Kaye, Lane, Pearson and Stonehill, each is a director and/or officer of EQH, Equitable Financial and/or Equitable America. Messrs. Bernstein, Erzan, Sprules and Siemers each is a director and/or officer of the General Partner.
(2)Includes 503,090 restricted AB Holding Units that have not yet vested or with respect to which Mr. Bernstein has deferred delivery. See “Overview of Mr. Bernstein's Employment Agreement – Compensation Elements – Restricted AB Holding Units,” “Grants of Plan-based Awards in 2024” and “Outstanding Equity Awards at 2024 Fiscal Year-End” in Item 11 for additional information.
(3)Includes 139,193 restricted AB Holding Units granted to Mr. Erzan that have not yet vested. For information regarding Mr. Erzan's long-term incentive compensation awards, see "Grants of Plan-based Awards in 2024” and “Outstanding Equity Awards at 2024 Fiscal Year-End” in Item 11.
(4)Includes 224,199 restricted AB Holding Units that have not yet vested or with respect to which Mr. Hogbin has deferred delivery. For information regarding Mr. Hogbin's long-term incentive compensation awards, see “Grants of Plan-based Awards in 2024” and “Outstanding Equity Awards at 2024 Fiscal Year-End” in Item 11.
(5)Includes 21,954 restricted AB Holding Units granted to Mr. Manley that have not yet vested. For information regarding Mr. Manley's long-term incentive compensation awards, see “Grants of Plan-based Awards in 2024” and “Outstanding Equity Awards at 2024 Fiscal Year-End” in Item 11.
(6)Includes 26,835 restricted AB Holding Units granted to Ms. Marks that have not yet vested. For information regarding Ms. Marks's long-term incentive compensation awards, see "Grants of Plan-based Awards in 2024” and “Outstanding Equity Awards at 2024 Fiscal Year-End” in Item 11.
(7)Includes 7,065 restricted AB Holding Units granted to Mr. Siemers that have not yet vested. Mr. Siemers resigned from his position as Interim CFO on February 29, 2024, at which point he transitioned into the role of a Senior Advisor to AB. For information regarding Mr. Siemers's long-term incentive compensation awards, see “Outstanding Equity Awards at 2024 Fiscal Year-End” in Item 11.
(8)Includes 19,175 restricted AB Holding Units granted to Mr. Simeone that have not yet vested. For information regarding Mr.Simeone's long-term incentive compensation awards, see “Grants of Plan-based Awards in 2024” and “Outstanding Equity Awards at 2024 Fiscal Year-End” in Item 11.
(9)Includes 32,716 restricted AB Holding Units granted to Ms. Spencer that have not yet vested. For information regarding Ms. Spencer's long-term incentive compensation awards, see "Grants of Plan-based Awards in 2024” and “Outstanding Equity Awards at 2024 Fiscal Year-End” in Item 11.
(10)Includes 92,889 restricted AB Holding Units granted to Mr. Sprules that have not yet vested. For information regarding Mr. Sprules's long-term incentive compensation awards, see “Grants of Plan-based Awards in 2024" and “Outstanding Equity Awards at 2024 Fiscal Year-End” in Item 11.
(11)Includes 1,067,116 restricted AB Holding Units awarded to the executive officers as a group as long-term incentive compensation that have not yet vested and/or with respect to which the executive officer has deferred delivery.
As of December 31, 2024, our directors and executive officers did not beneficially own any AB Units.
As of December 31, 2024, the beneficial ownership of the common stock of EQH by each director and named executive officer of the General Partner and by all directors and executive officers as a group is as follows:
| | | | | | | | | | | |
| Name of Beneficial Owner | Number of Shares and
Nature of Beneficial
Ownership | Percent of Class | |
| Joan Lamm-Tennant | 42,463 | | * | |
Seth Bernstein(1) | 88,612 | | * | |
Jeffrey Hurd(2) | 308,744 | | * | |
| Daniel Kaye | 58,063 | | * | |
Nick Lane(3) | 228,971 | | * | |
| Das Narayandas | — | | * | |
Mark Pearson(4) | 1,116,535 | | * | |
| Charles Stonehill | 34,064 | | * | |
| Todd Walthall | — | | * | |
Onur Erzan(5) | 4,520 | | * | |
| Chris Hogbin | — | | * | |
| Mark Manley | — | | * | |
| Jackie Marks | — | | * | |
| Bill Siemers | — | | * | |
| Cathy Spencer | — | | * | |
| Karl Sprules | — | | * | |
All directors and executive officers as a group (16 persons)(6) | 1,881,972 | | * | |
*Number of shares listed represents less than 1% of the outstanding EQH common stock.
(1)Includes (i) zero options Mr. Bernstein has the right to exercise within 60 days and (ii) 11,770 restricted stock units that will vest within 60 days and settle in EQH shares.
(2)Includes (i) 209,833 options Mr. Hurd has the right to exercise within 60 days and (ii) 28,520 restricted stock units that will vest within 60 days and settle in EQH shares.
(3)Includes (i) 79,417 options Mr. Lane has the right to exercise within 60 days and (ii) 32,487 restricted stock units that will vest within 60 days and settle in EQH shares.
(4)Includes (i) 466,400 options Mr. Pearson has the right to exercise within 60 days and (ii) 136,536 restricted stock units that will vest within 60 days and settle in EQH shares.
(5)Includes (i) zero options Mr. Erzan has the right to exercise within 60 days and (ii) 1,249 restricted stock units that will vest within 60 days and settle in EQH shares.
(6)Includes 755,650 options that may be exercised and 210,562 restricted stock units that will vest within 60 days and settle in EQH shares for the directors and executive officers as a group.
Partnership Matters
The General Partner makes all decisions relating to the management of AB and AB Holding. The General Partner has agreed that it will conduct no business other than managing AB and AB Holding, although it may make certain investments for its own account. Conflicts of interest, however, could arise between AB and AB Holding, the General Partner and the Unitholders of both Partnerships.
Section 17-403(b) of the Delaware Revised Uniform Limited Partnership Act (“Delaware Act”) states in substance that, except as provided in the Delaware Act or the applicable partnership agreement, a general partner of a limited partnership has the liabilities of a general partner in a general partnership governed by the Delaware Uniform Partnership Law (as in effect on July 11, 1999) to the partnership and to the other partners. In addition, as discussed below, Sections 17-1101(d) and 17-1101(f) of the Delaware Act generally provide that a partnership agreement may limit or eliminate fiduciary duties a partner may be deemed to owe to the limited partnership or to another partner, and any related liability, provided that the partnership agreement may not limit or eliminate the implied contractual covenant of good faith and fair dealing. Accordingly, while under Delaware law a general partner of a limited partnership is liable as a fiduciary to the other partners, those fiduciary obligations may be altered by the terms of the applicable partnership agreement. Each of the AB Partnership Agreement and AB Holding Partnership Agreement (each, a “Partnership Agreement” and, together, the “Partnership Agreements”) sets forth limitations on the duties and liabilities of the General Partner. Each Partnership Agreement provides that the General Partner is not liable for monetary damages for errors in judgment or for breach of fiduciary duty (including breach of any duty of care or loyalty), unless it is established (the person asserting such liability having the burden of proof) that the General Partner’s action or failure to act involved an act or omission undertaken with deliberate intent to cause injury, with reckless disregard for the best interests of the Partnerships or with actual bad faith on the part of the General Partner, or constituted actual fraud. Whenever the Partnership Agreements provide that the General Partner is permitted or required to make a decision (i) in its “discretion” or under a grant of similar authority or latitude, the General Partner is entitled to consider only such interests and factors as it desires and has no duty or obligation to consider any interest of or other factors affecting the Partnerships or any Unitholder of AB or AB Holding or (ii) in its “good faith” or under another express standard, the General Partner will act under that express standard and will not be subject to any other or different standard imposed by either Partnership Agreement or applicable law or in equity or otherwise. Each Partnership Agreement further provides that to the extent that, at law or in equity, the General Partner has duties (including fiduciary duties) and liabilities relating thereto to either Partnership or any partner, the General Partner acting under either Partnership Agreement, as applicable, will not be liable to the Partnerships or any partner for its good faith reliance on the provisions of the Partnership Agreement.
In addition, each Partnership Agreement grants broad rights of indemnification to the General Partner and its directors, officers and affiliates and authorizes AB and AB Holding to enter into indemnification agreements with the directors, officers, partners, employees and agents of AB and its affiliates and AB Holding and its affiliates. The Partnerships have granted broad rights of indemnification to officers and employees of AB and AB Holding. The foregoing indemnification provisions are not exclusive, and the Partnerships are authorized to enter into additional indemnification arrangements. AB and AB Holding have obtained directors and officers/errors and omissions liability insurance.
Each Partnership Agreement also allows transactions between AB and AB Holding and the General Partner or its affiliates, as we describe in “Policies and Procedures Regarding Transactions with Related Persons” in Item 13, so long as such transactions are on an arms-length basis. The Delaware courts have held that provisions in partnership or limited liability company agreements that permit affiliate transactions so long as they are on an arms-length basis operate to establish a contractually-agreed-to fiduciary duty standard of entire fairness on the part of the general partner or manager in connection with the approval of affiliate transactions. Also, each Partnership Agreement expressly permits all affiliates of the General Partner to compete, directly or indirectly, with AB and AB Holding, as we discuss in “Competition” in Item 1. The Partnership Agreements further provide that, except to the extent that a decision or action by the General Partner is taken with the specific intent of providing an improper benefit to an affiliate of the General Partner to the detriment of AB or AB Holding, there is no liability or obligation with respect to, and no challenge of, decisions or actions of the General Partner that would otherwise be subject to claims or other challenges as improperly benefiting affiliates of the General Partner to the detriment of the Partnerships or otherwise involving any conflict of interest or breach of a duty of loyalty or similar fiduciary obligation.
Section 17-1101(c) of the Delaware Act provides that it is the policy of the Delaware Act to give maximum effect to the principle of freedom of contract and to the enforceability of partnership agreements. Further, Section 17-1101(d) of the Delaware Act provides in part that to the extent that, at law or in equity, a partner has duties (including fiduciary duties) to a limited partnership or to another partner, those duties may be expanded, restricted, or eliminated by provisions in a partnership agreement (provided that a partnership agreement may not eliminate the implied contractual covenant of good faith and fair dealing). In addition, Section 17-1101(f) of the Delaware Act provides that a partnership agreement may limit or eliminate any or all liability of a partner to a limited partnership or another partner for breach of contract or breach of duties (including fiduciary duties); provided, however, that a partnership agreement may not limit or eliminate liability for any act or omission that constitutes a bad faith violation of the implied contractual covenant of good faith and fair dealing. Decisions of the Delaware courts have recognized the right of parties, under the above provisions of the Delaware Act, to alter by the terms of a partnership agreement otherwise applicable fiduciary duties and liability for breach of duties. However, the Delaware courts
have required that a partnership agreement make clear the intent of the parties to displace otherwise applicable fiduciary duties (the otherwise applicable fiduciary duties often being referred to as “default” fiduciary duties). Judicial inquiry into whether a partnership agreement is sufficiently clear to displace default fiduciary duties is necessarily fact driven and is made on a case by case basis. Accordingly, the effectiveness of displacing default fiduciary obligations and liabilities of general partners continues to be a developing area of the law and it is not certain to what extent the foregoing provisions of the Partnership Agreements are enforceable under Delaware law.
Item 13. Certain Relationships and Related Transactions, and Director Independence
Policies and Procedures Regarding Transactions with Related Persons
Each Partnership Agreement expressly permits EQH and its subsidiaries (collectively, “EQH Affiliates”), to provide services to AB and AB Holding if the terms of the transaction are approved by the General Partner in good faith as being comparable to (or more favorable to each such Partnership than) those that would prevail in a transaction with an unaffiliated party. This requirement is conclusively presumed to be satisfied as to any transaction or arrangement that (i) in the reasonable and good faith judgment of the General Partner meets that unaffiliated party standard, or (ii) has been approved by a majority of those directors of the General Partner who are not also directors, officers or employees of an affiliate of the General Partner.
In practice, our management pricing committees review investment advisory agreements with EQH Affiliates, which is the manner in which the General Partner reaches a judgment regarding the appropriateness of the fees. Other transactions with EQH Affiliates are submitted to the Audit Committee for their review and approval. (See “Committees of the Board” in Item 10 for details regarding the Audit Committee.) We are not aware of any transaction during 2024 between our company and any related person with respect to which these procedures were not followed.
Our relationships with EQH Affiliates also are subject to applicable provisions of the insurance laws and regulations of New York and other states. Under such laws and regulations, the terms of certain investment advisory and other agreements we enter into with EQH Affiliates are required to be fair and equitable and charges or fees for services performed must be reasonable. Also, in some cases, the agreements are subject to regulatory approval.
We have written policies regarding the employment of immediate family members of any of our related persons. Compensation and benefits for all of our employees is established in accordance with our people practices, taking into consideration the defined qualifications, responsibilities and nature of the role.
Financial Arrangements with EQH Affiliates
The General Partner has, in its reasonable and good faith judgment (based on its knowledge of, and inquiry with respect to, comparable arrangements with or between unaffiliated parties), approved the following arrangements with EQH Affiliates as being comparable to, or more favorable to AB than, those that would prevail in a transaction with an unaffiliated party.
See Note 12 Debt to AB’s consolidated financial statements in Item 8 for disclosures related to our credit facility with EQH. Significant transactions between AB and related persons during 2024 are as follows (the first table summarizes services we provide to related persons and the second table summarizes services our related persons provide to us):
| | | | | | | | | | | |
Parties(1) | General Description of Relationship(2) | Amounts Received or Accrued for in 2024 |
| (in thousands) |
| Equitable Financial | We provide investment management services and ancillary accounting, valuation, reporting, treasury and other services to the general and separate accounts of Equitable Financial and its insurance company subsidiaries. | | $ | 146,286 | |
| EQAT and Equitable Premier VIP Trust | We serve as sub-adviser to these open-end mutual funds, each of which is sponsored by a subsidiary of Equitable Holdings. | | 23,850 | |
| | | |
| Equitable Holdings | We provide investment management services and ancillary accounting services. | | 10,941 | |
| | | | | | | | | | | |
Parties(1) | General Description of Relationship | Amounts Paid or Accrued for in 2024 |
| (in thousands) |
| | | |
| Equitable Holdings | Distributes certain of our Retail Products; provides Private Wealth Management referrals; sells shares of our mutual funds under Distribution Service and Educational Support agreements; includes us as insured under various insurance policies. | | $ | 35,452 | |
| | | |
(1)AB or one of its subsidiaries is a party to each transaction.
(2)We provide investment management services unless otherwise indicated.
Arrangements with Immediate Family Members of Related Persons
During 2024, we did not have arrangements with immediate family members of our directors and executive officers.
Director Independence
See “Independence of Certain Directors” in Item 10.
Item 14. Principal Accounting Fees and Services
Fees for professional audit services rendered by PricewaterhouseCoopers LLP ("PwC") for the audit of AB’s and AB Holding’s annual financial statements for 2024 and 2023, respectively, and fees for other services rendered by PwC are as follows:
| | | | | | | | | | | | | | |
| 2024 | 2023 |
| (in thousands) |
Audit fees(1) | | $ | 6,440 | | | $ | 7,894 | |
Audit-related fees(2) | | 2,045 | | | 3,666 | |
Tax fees(3) | | 1,756 | | | 2,869 | |
All other fees(4) | | 2 | | | 6 | |
| Total | | $ | 10,243 | | | $ | 14,435 | |
(1)Includes $60,909 and $69,702 paid for audit services to AB Holding in 2024 and 2023, respectively.
(2)Audit-related fees consist principally of fees for audits of financial statements of certain employee benefit plans, internal control reviews and accounting consultation.
(3)Tax fees consist of fees for tax consultation and tax compliance services.
(4)All other fees consist primarily of miscellaneous non-audit services in 2024 and due diligence tax and audit services in 2023.
The Audit Committee has a policy to pre-approve audit and non-audit service engagements with the independent registered public accounting firm. The independent registered public accounting firm must provide annually a comprehensive and detailed schedule of each proposed audit and non-audit service to be performed. The Audit Committee then affirmatively indicates its approval of the listed engagements. Engagements that are not listed but that are of similar scope and size to those listed and approved may be deemed to be approved, if the fee for such service is less than $100,000. In addition, the Audit Committee has delegated to its chairman the ability to approve any permissible non-audit engagement where the fees are expected to be less than $100,000.
Item 15. Exhibits, Financial Statement Schedules
(a)There is no document filed as part of this Form 10-K.
Financial Statement Schedule.
Attached to this Form 10-K is a schedule describing Valuation and Qualifying Account-Allowance for Doubtful Accounts for the three years ended December 31, 2024, 2023 and 2022.
(b)Exhibits.
The following exhibits required to be filed by Item 601 of Regulation S-K are filed herewith or incorporated by reference herein, as indicated:
| | | | | |
| Exhibit | Description |
| 3.01 | |
| 3.02 | |
| 3.03 | |
| 3.04 | |
| 3.05 | |
| 3.06 | |
| 3.07 | |
| 3.08 | |
| 4.01 | |
| 10.01 | |
| 10.02 | |
| 10.03 | |
| 10.04 | |
| 10.05 | |
| 10.06 | |
| | | | | |
| Exhibit | Description |
| 10.07 | |
| 10.08 | |
| 10.09 | |
| 10.10 | |
| 10.11 | |
| 10.12 | |
| 10.13 | |
| 10.14 | |
| 10.15 | |
| 10.16 | |
| 10.17 | |
| 10.18 | |
| 10.19 | |
| 10.20 | |
| 10.21 | |
| 10.22 | |
| 10.23 | |
| 10.24 | |
| 10.25 | |
| | | | | |
| Exhibit | Description |
| 10.26 | |
| 10.27 | |
| 10.28 | Commercial Paper Dealer Agreement 4(a)(2) Program, dated as of June 1, 2015, between AllianceBernstein L.P., as Issuer, and Merrill Lynch, Pierce, Fenner & Smith Incorporated, as Dealer (incorporated by reference to Ex. 10.10 to Form 10-K for the fiscal year ended December 31, 2015, as filed February 11, 2016). |
| 10.29 | |
| 10.30 | |
| 10.31 | |
| 10.32 | |
| 10.33 | |
| 19.01 | |
| 21.01 | |
| 23.01 | |
| 31.01 | |
| 31.02 | |
| 32.01 | |
| 32.02 | |
| 97.01 | |
| 101.INS | XBRL Instance Document - the instance document does not appear in the Interactive Data File because its XBRL tags are embedded within the Inline XBRL document. |
| 101.SCH | XBRL Taxonomy Extension Schema. |
| 101.CAL | XBRL Taxonomy Extension Calculation Linkbase. |
| 101.LAB | XBRL Taxonomy Extension Label Linkbase. |
| 101.PRE | XBRL Taxonomy Extension Presentation Linkbase. |
| 101.DEF | XBRL Taxonomy Extension Definition Linkbase. |
| 104 | The cover page from the Company's Annual Report on Form 10-K for the year ended December 31, 2024, formatted in Inline XBRL (included in Exhibit 101). |
| * | Denotes a compensatory plan or arrangement |
Item 16. Form 10-K Summary
None.
Pursuant to the requirements of Section 13 or 15(d) of the Exchange Act, the Registrant has duly caused this report to be signed on its behalf by the undersigned, thereunto duly authorized.
| | | | | | | | |
| | AllianceBernstein L.P. |
| | | |
| Date: February 14, 2025 | By: | /s/ Seth Bernstein |
| | | Seth Bernstein |
| | | President & Chief Executive Officer |
Pursuant to the requirements of the Exchange Act, this report has been signed by the following persons on behalf of the Registrant and in the capacities and on the dates indicated.
| | | | | | | | |
| Date: February 14, 2025 | | /s/ Jackie Marks |
| | | Jackie Marks |
| | | Chief Financial Officer |
| | | | | | | | |
| Date: February 14, 2025 | | /s/ Thomas Simeone |
| | | Thomas Simeone |
| | | Controller & Chief Accounting Officer |
Directors
| | | | | | | | |
| /s/ Seth Bernstein | | /s/ Joan Lamm-Tennant |
| Seth Bernstein | | Joan Lamm-Tennant |
| President & Chief Executive Officer | | Chair of the Board |
| | |
| /s/ Bruce Holley | | /s/ Jeffrey Hurd |
| Bruce Holley | | Jeffrey Hurd |
| Director | | Director |
| | |
| /s/ Daniel Kaye | | /s/ Nick Lane |
| Daniel Kaye | | Nick Lane |
| Director | | Director |
| | |
| /s/ Das Narayandas | | /s/ Mark Pearson |
| Das Narayandas | | Mark Pearson |
| Director | | Director |
| | |
| /s/ Charles Stonehill | | /s/ Todd Walthall |
| Charles Stonehill | | Todd Walthall |
| Director | | Director |
| | |
SCHEDULE II
AllianceBernstein L.P.
Valuation and Qualifying Account - Allowance for Doubtful Accounts
For the Three Years Ending December 31, 2024, 2023 and 2022
| | | | | | | | | | | | | | | | | | | | | | | | | | | | | | | | |
| Description | | Balance at
Beginning
of Period | | Credited to
Costs and
Expenses | | Deductions | | Balance at End
of Period |
| | | (in thousands) |
| For the year ended December 31, 2024 | | $ | 299 | | | $ | 1,522 | | | $ | 577 | | | (a) | | $ | 1,244 | |
| | | | | | | | | | |
| For the year ended December 31, 2023 | | $ | 232 | | | $ | 72 | | | $ | 5 | | | (b) | | $ | 299 | |
| | | | | | | | | | |
| For the year ended December 31, 2022 | | $ | 328 | | | $ | — | | | $ | 96 | | | (c) | | $ | 232 | |
(a)Includes accounts written-off as uncollectible of $577.
(b)Includes accounts written-off as uncollectible of $5.
(c)Includes accounts written-off as uncollectible of $96.