
October 17, 2012
Adira Energy Ltd
Aba Hillel Silver #12
Ramat Gan 52506
Israel
Ladies and Gentlemen:
In accordance with your request, we have estimated the unrisked prospective resources, as of August 1, 2012, to the Adira Energy Ltd (Adira) interest for three prospects located in Block 388 (Samuel), offshore Israel. The preparation date of this report is September 25, 2012; we did not consider any geological, engineering, or financial data for this evaluation after that date. Prospective resourcesare those quantities of petroleum estimated, as of a given date, to be potentially recoverable from undiscovered accumulations by application of future development projects. The prospective resources included in this report should not be construed as reserves or contingent resources; they represent exploration opportunities and quantify the development potential in the event a petroleum discovery is made. A geologic risk assessment was performed for these prospects, as discussed in subsequent paragraphs. There is no certainty that any portion of the prospective resources will be discovered. If discovered, there is no certainty that it will be commercially viable to produce any portion of the prospective resources. This report does not include economic analysis for these prospects. Based on analogous field developments, it appears that, assuming a discovery is made, the unrisked best estimate prospective resources in this report have a reasonable chance of being commercial. The estimates in this report have been prepared in accordance with the definitions and guidelines set forth in Canadian National Instrument 51-101—Standards of Disclosure for Oil and Gas Activities and Section 5 of Volume 1, Second Edition, of the Canadian Oil and Gas Evaluation Handbook (COGEH), prepared jointly by the Society of Petroleum Evaluation Engineers (Calgary Chapter) and the Canadian Institute of Mining, Metallurgy & Petroleum (Petroleum Society) (the latter of which is now the Petroleum Society of Canada); definitions are presented immediately following this letter. Following the definitions are certificates of qualification and a list of abbreviations used in this report.
We estimate the unrisked gross (100 percent) prospective resources for these prospects, as of August 1, 2012, to be:
| | | | | Unrisked Gross (100 Percent) Prospective Resources |
| Prospect/ | | | | Light/Medium Oil | | Gas(1) | | Oil Equivalent |
| Prospective Reservoir | | Category | | (Mbbl) | | (MMcf) | | (MBOE) |
| | | | | | | | | |
| Cretaceous Reef | | | | | | | | |
| Talme Yafe | | Low Estimate | | 10,332 | | 10,332 | | 12,054 |
| | | Best Estimate | | 32,558 | | 32,558 | | 37,984 |
| | | High Estimate | | 93,359 | | 93,359 | | 108,919 |
| | | | | | | | | |
| Jurassic Reef | | | | | | | | |
| Upper Jurassic | | Low Estimate | | 11,700 | | 11,700 | | 13,650 |
| | | Best Estimate | | 31,132 | | 31,132 | | 36,321 |
| | | High Estimate | | 76,601 | | 76,601 | | 89,368 |
| | | | | | | | | |
| Jurassic Structural | | | | | | | | |
| Upper Jurassic | | Low Estimate | | 205 | | 205 | | 239 |
| | | Best Estimate | | 628 | | 628 | | 733 |
| | | High Estimate | | 1,749 | | 1,749 | | 2,041 |
| | | | | | | | | |
| Barnea Formation | | Low Estimate | | 498 | | 498 | | 581 |
| | | Best Estimate | | 1,499 | | 1,499 | | 1,749 |
| | | High Estimate | | 4,189 | | 4,189 | | 4,887 |
| (1) | Based on well test information, a gas-oil ratio of 1,000 standard cubic feet per barrel was estimated for each prospect's low, best, and high estimates. |


We estimate the unrisked company gross prospective resources to the Adira interest in these prospects, as of August 1, 2012, to be:
| | | | | Unrisked Company Gross Prospective Resources(1) |
| Prospect/ | | | | Light/Medium Oil | | Gas | | Oil Equivalent |
| Prospective Reservoir | | Category | | (Mbbl) | | (MMcf) | | (MBOE) |
| | | | | | | | | |
| Cretaceous Reef | | | | | | | | |
| Talme Yafe | | Low Estimate | | 4,262 | | 4,262 | | 4,972 |
| | | Best Estimate | | 13,430 | | 13,430 | | 15,669 |
| | | High Estimate | | 38,511 | | 38,511 | | 44,929 |
| | | | | | | | | |
| Jurassic Reef | | | | | | | | |
| Upper Jurassic | | Low Estimate | | 4,826 | | 4,826 | | 5,631 |
| | | Best Estimate | | 12,842 | | 12,842 | | 14,982 |
| | | High Estimate | | 31,598 | | 31,598 | | 36,864 |
| | | | | | | | | |
| Jurassic Structural | | | | | | | | |
| Upper Jurassic | | Low Estimate | | 85 | | 85 | | 99 |
| | | Best Estimate | | 259 | | 259 | | 302 |
| | | High Estimate | | 721 | | 721 | | 842 |
| | | | | | | | | |
| Barnea Formation | | Low Estimate | | 205 | | 205 | | 240 |
| | | Best Estimate | | 618 | | 618 | | 721 |
| | | High Estimate | | 1,728 | | 1,728 | | 2,016 |
(1) Adira owns a 41.25 percent working interest in these prospects.
The oil resources shown include light and medium crude oil only. Oil volumes are expressed in thousands of barrels (Mbbl); a barrel is equivalent to 42 United States gallons. Gas volumes are expressed in millions of cubic feet (MMcf) at standard temperature and pressure bases. Oil equivalent volumes are expressed in thousands of barrels of oil equivalent (MBOE), determined using the ratio of 6 MMcf of gas to 1 Mbbl of oil. MBOE, or other applicable units of equivalency, may be misleading, particularly if used in isolation.
The prospective resources shown in this report have been estimated using probabilistic methods and are dependent on a petroleum discovery being made. If a discovery is made and development is undertaken, the probability that the recoverable volumes will equal or exceed the unrisked estimated amounts is 90 percent for the low estimate, 50 percent for the best estimate, and 10 percent for the high estimate.
Unrisked prospective resources are estimated ranges of recoverable oil and gas volumes assuming their discovery and development and are based on estimated ranges of undiscovered in-place volumes. Geologic risking of prospective resources addresses the probability of success for the discovery of a significant quantity of potentially moveable petroleum; this risk analysis is conducted independent of estimations of petroleum volumes and without regard to the chance of development. Principal geologic risk elements of the petroleum system include (1) trap and seal characteristics; (2) reservoir presence and quality; (3) source rock capacity, quality, and maturity; and (4) timing, migration, and preservation of petroleum in relation to trap and seal formation. Risk assessment is a highly subjective process dependent upon the experience and judgment of the evaluators and is subject to revision with further data acquisition or interpretation. The geologic risk elements and overall probability of geologic success for each prospect are shown in the following table:
| | | Geologic Risk Element (Percent) | | Probability of |
| | | Trap | | Reservoir | | Source | | Timing/ | | Geologic Success |
| Prospect | | Integrity | | Quality | | Evaluation | | Migration | | (Percent) |
| | | | | | | | | | | |
| Cretaceous Reef | | 60 | | 70 | | 95 | | 50 | | 20 |
| Jurassic Reef | | 50 | | 60 | | 95 | | 60 | | 17 |
| Jurassic Structural | | 70 | | 70 | | 95 | | 70 | | 33 |
Each prospective reservoir was evaluated to determine ranges of in-place and recoverable petroleum and was risked as an independent entity without dependency between potential prospective reservoir drilling outcomes. If petroleum discoveries are made, smaller-volume prospective reservoirs may not be commercial to independently develop, although they may become candidates for satellite developments and tie-backs to existing infrastructure
at some future date. The development infrastructure and data obtained from early discoveries will alter both geologic risk and future economics of subsequent discoveries and developments.
It should be understood that the prospective resources discussed and shown herein are those undiscovered, highly speculative resources estimated beyond reserves or contingent resources where geological and geophysical data suggest the potential for discovery of petroleum but where the level of proof is insufficient for classification as reserves or contingent resources. The unrisked prospective resources shown in this report are the range of volumes that could reasonably be expected to be recovered in the event of the discovery and development of these prospects.
As shown in the Table of Contents, the Technical Discussion section of this report includes a discussion of the history of the properties, a regional geologic overview, a brief review of the data available for this assessment, and a discussion of the technical approach used in our analysis. Included in the Figures section are pertinent maps, a stratigraphic column, and a table.
For the purposes of this report, we did not perform any field inspection of the prospects. Based on the information provided by Adira, it is our opinion that a field visit was not required and would not materially affect our evaluation. We have not investigated possible environmental liability related to the prospects.
For the purposes of this report, we used technical data including, but not limited to, well logs, geologic maps, seismic data, and property ownership interests. The resources in this report have been estimated using probabilistic methods; these estimates have been prepared in accordance with generally accepted petroleum engineering and evaluation principles. We used standard engineering and geoscience methods, or a combination of methods, including volumetric analysis and analogy, that we considered to be appropriate and necessary to classify, categorize, and estimate volumes in accordance with COGEH definitions and guidelines. These resources are for undeveloped locations; such resources are based on estimates of reservoir volumes and recovery efficiencies along with analogy to properties with similar geologic and reservoir characteristics. As in all aspects of oil and gas evaluation, there are uncertainties inherent in the interpretation of engineering and geoscience data; therefore, our conclusions necessarily represent only informed professional judgment.
The data used in our estimates were obtained from Adira, public data sources, and the nonconfidential files of Netherland, Sewell & Associates, Inc. (NSAI) and were accepted as accurate. Supporting work data are on file in our office. The contractual rights to the prospects have not been examined by NSAI, nor has the actual degree or type of interest owned been independently confirmed. The technical persons responsible for preparing the estimates presented herein meet the requirements regarding qualifications, independence, objectivity, and confidentiality as provided in the standards pertaining to the estimating of oil and gas resources information included in the COGEH. We are independent petroleum engineers, geologists, geophysicists, and petrophysicists; we do not own an interest in these prospects nor are we employed on a contingent basis.
Sincerely,
NETHERLAND, SEWELL & ASSOCIATES, INC.
Texas Registered Engineering Firm F-2699
| | /s/ C.H. (Scott) Rees III |
| | By: |
| | C.H. (Scott) Rees III, P.E. |
| | Chairman and Chief Executive Officer |
| | |
| | |
| | |
| /s/ Richard B. Talley, Jr. | /s/ David E. Nice |
| By: | By: |
| Richard B. Talley, Jr., P.E. 102425 | David E. Nice, P.G. 346 |
| Vice President | Vice President |
| | |
| Date Signed: October 17, 2012 | Date Signed: October 17, 2012 |
DEN:DEG
Please be advised that the digital document you are viewing is provided by Netherland, Sewell & Associates, Inc. (NSAI) as a convenience to our clients. The digital document is intended to be substantively the same as the original signed document maintained by NSAI. The digital document is subject to the parameters, limitations, and conditions stated in the original document. In the event of any differences between the digital document and the original document, the original document shall control and supersede the digital document. |
DEFINITIONS OF RESOURCES
Sections 5.2 and 5.3 of Volume 1, Second Edition, of the Canadian Oil and Gas Evaluation Handbook, Prepared Jointly by the Society of Petroleum Evaluation Engineers (Calgary Chapter) and the Canadian Institute of Mining, Metallurgy & Petroleum (Petroleum Society) (the latter of which is now the Petroleum Society of Canada)

5.2 Definitions of Resources
The following definitions relate to the subdivisions in the resources classification framework of Figure 5-1 and use the primary nomenclature and concepts contained in the 2007 SPE-PRMS, with direct excerpts shown in italics.
Total Petroleum Initially-In-Place (PIIP) is that quantity of petroleum that is estimated to exist originally in naturally occurring accumulations. It includes that quantity of petroleum that is estimated, as of a given date, to be contained in known accumulations, prior to production, plus those estimated quantities in accumulations yet to be discovered (equivalent to "total resources").
Discovered Petroleum Initially-In-Place (equivalent to discovered resources)is that quantity of petroleum that is estimated, as of a given date, to be contained in known accumulations prior to production. The recoverable portion of discovered petroleum initially in place includes production, reserves, and contingent resources; the remainder is unrecoverable.
Production is the cumulative quantity of petroleum that has been recovered at a given date.
Reserves are estimated remaining quantities of oil and natural gas and related substances anticipated to be recoverable from known accumulations, as of a given date, based on the analysis of drilling, geological, geophysical, and engineering data; the use of established technology; and specified economic conditions, which are generally accepted as being reasonable. Reserves are further classified according to the level of certainty associated with the estimates and may be subclassified based on development and production status. Refer to the full definitions of reserves in Section 5.4.
Contingent Resources are those quantities of petroleum estimated, as of a given date, to be potentially recoverable from known accumulations using established technology or technology under development, but which are not currently considered to be commercially recoverable due to one or more contingencies. Contingencies may include factors such as economic, legal, environmental, political, and regulatory matters, or a lack of markets. It is also appropriate to classify as contingent resources the estimated discovered recoverable quantities associated with a
Definitions - Page 1 of 6
DEFINITIONS OF RESOURCES
Sections 5.2 and 5.3 of Volume 1, Second Edition, of the Canadian Oil and Gas Evaluation Handbook, Prepared Jointly by the Society of Petroleum Evaluation Engineers (Calgary Chapter) and the Canadian Institute of Mining, Metallurgy & Petroleum (Petroleum Society) (the latter of which is now the Petroleum Society of Canada)
project in the early evaluation stage.Contingent Resources are further classified in accordance with the level of certainty associated with the estimates and may be subclassified based on project maturity and/or characterized by their economic status.
Unrecoverable is that portion of Discovered or Undiscovered PIIP quantities which is estimated, as of a given date, not to be recoverable by future development projects. A portion of these quantities may become recoverable in the future as commercial circumstances change or technological developments occur; the remaining portion may never be recovered due to the physical/chemical constraints represented by subsurface interaction of fluids and reservoir rocks.
Undiscovered Petroleum Initially-In-Place (equivalent to undiscovered resources)is that quantity of petroleum that is estimated, on a given date, to be contained in accumulations yet to be discovered.The recoverable portion of undiscovered petroleum initially in place is referred to as "prospective resources," the remainder as "unrecoverable."
Prospective Resources are those quantities of petroleum estimated, as of a given date, to be potentially recoverable from undiscovered accumulations by application of future development projects. Prospective resources have both an associated chance of discovery and a chance of development. Prospective Resources are further subdivided in accordance with the level of certainty associated with recoverable estimates assuming their discovery and development and may be subclassified based on project maturity.
Unrecoverable: see above.
Reserves, contingent resources, and prospective resources should not be combined without recognition of the significant differences in the criteria associated with their classification. However, in some instances (e.g., basin potential studies) it may be desirable to refer to certain subsets of the total PIIP. For such purposes the term "resources" should include clarifying adjectives "remaining" and "recoverable," as appropriate. For example, the sum of reserves, contingent resources, and prospective resources may be referred to as "remaining recoverable resources." However, contingent and prospective resources estimates involve additional risks, specifically the risk of not achieving commerciality and exploration risk, respectively, not applicable to reserves estimates. Therefore, when resources categories are combined, it is important that each component of the summation also be provided, and it should be made clear whether and how the components in the summation were adjusted for risk.
5.3 Classification of Resources
For petroleum quantities associated with simple conventional reservoirs, the divisions between the resources categories defined in Section 5.2 may be quite clear, and in such instances the basic definitions alone may suffice for differentiation between categories. For example, the drilling and testing of a well in a simple structural accumulation may be sufficient to allow classification of the entire estimated recoverable quantity as contingent resources or reserves. However, as the industry trends toward the exploitation of more complex and costly petroleum sources, the divisions between resources categories are less distinct, and accumulations may have several categories of resources simultaneously. For example, in extensive "basin-center" low-permeability gas plays, the division between all categories of remaining recoverable quantities, i.e., reserves, contingent resources, and prospective resources, may be highly interpretive. Consequently, additional guidance is necessary to promote consistency in classifying resources. The following provides some clarification of the key criteria that delineate resources categories. Subsequent volumes of COGEH provide additional guidance.
5.3.1 Discovery Status
As shown in Figure 5-1, the total petroleum initially in place is first subdivided based on the discovery status of a petroleum accumulation. Discovered PIIP, production, reserves, and contingent resources are associated with known accumulations. Recognition as a known accumulation requires that the accumulation be penetrated by a well and have evidence of the existence of petroleum. COGEH Volume 2, Sections 5.3 and 5.4, provides additional clarification regarding drilling and testing requirements relating to recognition of known accumulations.
Definitions - Page 2 of 6
DEFINITIONS OF RESOURCES
Sections 5.2 and 5.3 of Volume 1, Second Edition, of the Canadian Oil and Gas Evaluation Handbook, Prepared Jointly by the Society of Petroleum Evaluation Engineers (Calgary Chapter) and the Canadian Institute of Mining, Metallurgy & Petroleum (Petroleum Society) (the latter of which is now the Petroleum Society of Canada)
5.3.2 Commercial Status
Commercial status differentiates reserves from contingent resources. The following outlines the criteria that should be considered in determining commerciality:
economic viability of the related development project;
a reasonable expectation that there will be a market for the expected sales quantities of production required to justify development;
evidence that the necessary production and transportation facilities are available or can be made available;
evidence that legal, contractual, environmental, governmental, and other social and economic concerns will allow for the actual implementation of the recovery project being evaluated;
a reasonable expectation that all required internal and external approvals will be forthcoming. Evidence of this may include items such as signed contracts, budget approvals, and approvals for expenditures, etc.;
evidence to support a reasonable timetable for development. A reasonable time frame for the initiation of development depends on the specific circumstances and varies according to the scope of the project. While five years is recommended as a maximum time frame for classification of a project as commercial, a longer time frame could be applied where, for example, development of economic projects are deferred at the option of the producer for, among other things, market-related reasons or to meet contractual or strategic objectives.
COGEH Volume 2, Sections 5.5 to 5.8, provides addition details relating to the foregoing aspects of commerciality relating to classification as reserves versus contingent resources.
5.3.3 Commercial Risk
In order to assign recoverable resources of any category, a development plan consisting of one or more projects needs to be defined. In-place quantities for which a feasible project cannot be defined using established technology or technology underdevelopment are classified as unrecoverable. In this context "technology underdevelopment" refers to technology that has been developed and verified by testing as feasible for future commercial applications to the subject reservoir. In the early stage of exploration or development, project definition will not be of the detail expected in later stages of maturity. In most cases recovery efficiency will be largely based on analogous projects.
Estimates of recoverable quantities are stated in terms of the sales products derived from a development program, assuming commercial development. It must be recognized that reserves, contingent resources, and prospective resources involve different risks associated with achieving commerciality. The likelihood that a project will achieve commerciality is referred to as the "chance of commerciality." The chance of commerciality varies in different categories of recoverable resources as follows:
Reserves: To be classified as reserves, estimated recoverable quantities must be associated with a project(s) that has demonstrated commercial viability. Under the fiscal conditions applied in the estimation of reserves, the chance of commerciality is effectively 100 percent.
Contingent Resources: Not all technically feasible development plans will be commercial. The commercial viability of a development project is dependent on the forecast of fiscal conditions over the life of the project. For contingent resources the risk component relating to the likelihood that an accumulation will be commercially developed is referred to as the "chance of development." For contingent resources the chance of commerciality is equal to the chance of development.
Prospective Resources: Not all exploration projects will result in discoveries. The chance that an exploration project will result in the discovery of petroleum is referred to as the "chance of discovery." Thus, for an undiscovered accumulation the chance of commerciality is the product of two risk components — the chance of discovery and the chance of development.
Definitions - Page 3 of 6
DEFINITIONS OF RESOURCES
Sections 5.2 and 5.3 of Volume 1, Second Edition, of the Canadian Oil and Gas Evaluation Handbook, Prepared Jointly by the Society of Petroleum Evaluation Engineers (Calgary Chapter) and the Canadian Institute of Mining, Metallurgy & Petroleum (Petroleum Society) (the latter of which is now the Petroleum Society of Canada)
5.3.4 Economic Status, Development, and Production Subcategories
a. Economic Status
By definition, reserves are commercially (and hence economically) recoverable. A portion of contingent resources may also be associated with projects that are economically viable but have not yet satisfied all requirements of commerciality. Accordingly, it may be a desirable option to subclassify contingent resources by economic status:
Economic Contingent Resources are those contingent resources that are currently economically recoverable.
Sub-Economic Contingent Resources are those contingent resources that are not currently economically recoverable.
Where evaluations are incomplete such that it is premature to identify the economic viability of a project, it is acceptable to note that project economic status is "undetermined" (i.e., "contingent resources – economic status undetermined").
In examining economic viability, the same fiscal conditions should be applied as in the estimation of reserves, i.e., specified economic conditions, which are generally accepted as being reasonable (refer to COGEH Volume 2, Section 5.8) .
b. Development and Production Status
Resources may be further subclassified based on development and production status. For reserves, the terms "developed" and "undeveloped" are used to express the status of development of associated recovery projects, and "producing" and "non-producing" indicate whether or not reserves are actually on production (see Section 5.4.2) .
Similarly, project maturity subcategories can be identified for contingent and prospective resources; the SPE-PRMS (Section 2.1.3.1) provides examples of subcategories that could be identified. For example, the SPE-PRMS identifies the highest project maturity subcategory as "development pending," defined as "a discovered accumulation where project activities are ongoing to justify commercial development in the foreseeable future."
5.3.5 Uncertainty Categories
Estimates of resources always involve uncertainty, and the degree of uncertainty can vary widely between accumulations/projects and over the life of a project. Consequently, estimates of resources should generally be quoted as a range according to the level of confidence associated with the estimates. An understanding of statistical concepts and terminology is essential to understanding the confidence associated with resources definitions and categories. These concepts, which apply to all categories of resources, are outlined in Sections 5.5.1 to 5.5.3.
The range of uncertainty of estimated recoverable volumes may be represented by either deterministic scenarios or by a probability distribution. Resources should be provided as low, best, and high estimates as follows:
Low Estimate: This is considered to be a conservative estimate of the quantity that will actually be recovered. It is likely that the actual remaining quantities recovered will exceed the low estimate. If probabilistic methods are used, there should be at least a 90 percent probability (P90) that the quantities actually recovered will equal or exceed the low estimate.
Best Estimate: This is considered to be the best estimate of the quantity that will actually be recovered. It is equally likely that the actual remaining quantities recovered will be greater or less than the best estimate. If probabilistic methods are used, there should be at least a 50 percent probability (P50) that the quantities actually recovered will equal or exceed the best estimate.
High Estimate: This is considered to be an optimistic estimate of the quantity that will actually be recovered. It is unlikely that the actual remaining quantities recovered will exceed the high estimate. If probabilistic methods are used, there should be at least a 10 percent probability (P10) that the quantities actually recovered will equal or exceed the high estimate.
This approach to describing uncertainty may be applied to reserves, contingent resources, and prospective resources. There may be significant risk that sub-commercial and undiscovered accumulations will not achieve commercial production. However, it is useful to consider and identify the range of potentially recoverable quantities independently of such risk.
Definitions - Page 4 of 6
DEFINITIONS OF RESERVES
Section 5.4 of Volume 1, Second Edition, of the Canadian Oil and Gas Evaluation Handbook, Prepared by the
Society of Petroleum Evaluation Engineers (Calgary Chapter) and Canadian Institute of Mining, Metallurgy & Petroleum (Petroleum Society)
5.4 Definitions of Reserves
The following reserves definitions and guidelines are designed to assist evaluators in making reserves estimates on a reasonably consistent basis, and assist users of evaluation reports in understanding what such reports contain and, if necessary, in judging whether evaluators have followed generally accepted standards.
The guidelines outline
general criteria for classifying reserves,
procedures and methods for estimating reserves,
confidence levels of individual entity and aggregate reserves estimates,
verification and testing of reserves estimates.
The determination of oil and gas reserves involves the preparation of estimates that have an inherent degree of associated uncertainty. Categories of proved, probable, and possible reserves have been established to reflect the level of these uncertainties and to provide an indication of the probability of recovery.
The estimation and classification of reserves requires the application of professional judgement combined with geological and engineering knowledge to assess whether or not specific reserves classification criteria have been satisfied. Knowledge of concepts including uncertainty and risk, probability and statistics, and deterministic and probabilistic estimation methods is required to properly use and apply reserves definitions. These concepts are presented and discussed in greater detail within the guidelines in Section 5.5.
The following definitions apply to both estimates of individual reserves entities and the aggregate of reserves for multiple entities.
5.4.1 Reserves Categories
Reserves are estimated remaining quantities of oil and natural gas and related substances anticipated to be recoverable from known accumulations, as of a given date, based on
analysis of drilling, geological, geophysical, and engineering data;
the use of established technology;
specified economic conditions, which are generally accepted as being reasonable, and shall be disclosed.
Reserves are classified according to the degree of certainty associated with the estimates.
a. Proved Reserves
Proved reserves are those reserves that can be estimated with a high degree of certainty to be recoverable. It is likely that the actual remaining quantities recovered will exceed the estimated proved reserves.
b. Probable Reserves
Probable reserves are those additional reserves that are less certain to be recovered than proved reserves. It is equally likely that the actual remaining quantities recovered will be greater or less than the sum of the estimated proved + probable reserves.
c. Possible Reserves
Possible reserves are those additional reserves that are less certain to be recovered than probable reserves. It is unlikely that the actual remaining quantities recovered will exceed the sum of the estimated proved + probable + possible reserves.
Other criteria that must also be met for the classification of reserves are provided in Section 5.5.4.
Definitions - Page 5 of 6
DEFINITIONS OF RESERVES
Section 5.4 of Volume 1, Second Edition, of the Canadian Oil and Gas Evaluation Handbook, Prepared by the
Society of Petroleum Evaluation Engineers (Calgary Chapter) and Canadian Institute of Mining, Metallurgy & Petroleum (Petroleum Society)
5.4.2 Development and Production Status
Each of the reserves categories (proved, probable, and possible) may be divided into developed and undeveloped categories.
a. Developed Reserves
Developed reserves are those reserves that are expected to be recovered from existing wells and installed facilities or, if facilities have not been installed, that would involve a low expenditure (e.g., when compared to the cost of drilling a well) to put the reserves on production. The developed category may be subdivided into producing and non-producing.
Developed producing reserves are those reserves that are expected to be recovered from completion intervals open at the time of the estimate. These reserves may be currently producing or, if shut in, they must have previously been on production, and the date of resumption of production must be known with reasonable certainty.
Developed non-producing reserves are those reserves that either have not been on production, or have previously been on production but are shut in and the date of resumption of production is unknown.
b. Undeveloped Reserves
Undeveloped reserves are those reserves expected to be recovered from known accumulations where a significant expenditure (e.g., when compared to the cost of drilling a well) is required to render them capable of production. They must fully meet the requirements of the reserves category (proved, probable, possible) to which they are assigned.
In multi-well pools, it may be appropriate to allocate total pool reserves between the developed and undeveloped categories or to subdivide the developed reserves for the pool between developed producing and developed non-producing. This allocation should be based on the estimator's assessment as to the reserves that will be recovered from specific wells, facilities, and completion intervals in the pool and their respective development and production status.
5.4.3 Levels of Certainty for Reported Reserves
The qualitative certainty levels contained in the definitions in Section 5.4.1 are applicable to "individual reserves entities," which refers to the lowest level at which reserves calculations are performed, and to "reported reserves," which refers to the highest level sum of individual entity estimates for which reserves estimates represented. Reported reserves should target the following levels of certainty under a specific set of economic conditions:
at least a 90 percent probability that the quantities actually recovered will equal or exceed the estimated proved reserves,
at least a 50 percent probability that the quantities actually recovered will equal or exceed the sum of the estimated proved + probable reserves,
at least a 10 percent probability that the quantities actually recovered will equal or exceed the sum of the estimated proved + probable + possible reserves.
Definitions - Page 6 of 6
CERTIFICATE OF QUALIFICATION
I, Richard B. Talley, Jr., Licensed Professional Engineer, 1221 Lamar Street, Suite 1200, Houston, Texas 77010, hereby certify:
I am an employee of Netherland, Sewell & Associates, Inc., which prepared a detailed analysis of certain prospects of Adira Energy Ltd (Adira). The effective date of this evaluation is August 1, 2012.
I do not have, nor do I expect to receive, any direct or indirect interest in the securities of Adira or its affiliated companies.
I attended Tulane University, and I graduated in 2001 with a Master of Business Administration Degree. I attended the University of Oklahoma, and I graduated in 1998 with a Bachelor of Science Degree in Mechanical Engineering; I am a Licensed Professional Engineer in the State of Texas, United States of America; and I have in excess of 13 years of experience in petroleum engineering studies and evaluations.
A personal field inspection of the prospects was not made; however, such an inspection was not considered necessary in view of the information available from public information or records, the files from Adira, and the appropriate provincial or state regulatory authorities.
| | /s/ Richard B. Talley, Jr. | |
| By: | | |
| | Richard B. Talley, Jr., P.E. | |
| | Vice President | |
| | Texas License No. 102425 | |
October 17, 2012
Houston, Texas
Please be advised that the digital document you are viewing is provided by Netherland, Sewell & Associates, Inc. (NSAI) as a convenience to our clients. The digital document is intended to be substantively the same as the original signed document maintained by NSAI. The digital document is subject to the parameters, limitations, and conditions stated in the original document. In the event of any differences between the digital document and the original document, the original document shall control and supersede the digital document. |
CERTIFICATE OF QUALIFICATION
I, David E. Nice, Licensed Professional Geoscientist, 1221 Lamar Street, Suite 1200, Houston, Texas 77010, hereby certify:
I am an employee of Netherland, Sewell & Associates, Inc., which prepared a detailed analysis of certain prospects of Adira Energy Ltd (Adira). The effective date of this evaluation is August 1, 2012.
I do not have, nor do I expect to receive, any direct or indirect interest in the securities of Adira or its affiliated companies.
I attended University of Wyoming, I graduated in 1985 with a Master of Science Degree in Geology, and I graduated in 1982 with a Bachelor of Science Degree in Geology; I am a Licensed Professional Geoscientist in the State of Texas, United States of America; and I have in excess of 26 years of experience in geological and geophysical studies and evaluations.
A personal field inspection of the prospects was not made; however, such an inspection was not considered necessary in view of the information available from public information or records, the files of Adira, and the appropriate provincial or state regulatory authorities.
| | /s/ David E. Nice | |
| By: | | |
| | David E. Nice, P.G. | |
| | Vice President | |
| | Texas License No. 346 | |
October 17, 2012
Houston, Texas
Please be advised that the digital document you are viewing is provided by Netherland, Sewell & Associates, Inc. (NSAI) as a convenience to our clients. The digital document is intended to be substantively the same as the original signed document maintained by NSAI. The digital document is subject to the parameters, limitations, and conditions stated in the original document. In the event of any differences between the digital document and the original document, the original document shall control and supersede the digital document. |
ABBREVIATIONS
| ° | degrees |
| Adira | Adira Energy Ltd |
| API | American Petroleum Institute |
| bbl | barrels |
| bopd | barrels of oil per day |
| bwpd | barrels of water per day |
| C2 | ethane |
| C4 | butane |
| COGEH | Canadian Oil and Gas Evaluation Handbook |
| km | kilometers |
| km2 | square kilometers |
| m | meters |
| MD | measured depth |
| Mbbl | thousands of barrels |
| MBOE | thousands of barrels of oil equivalent |
| MMcf | millions of cubic feet |
| NSAI | Netherland, Sewell & Associates, Inc. |
| OHIP | original hydrocarbons-in-place |
| ppg | pounds per gallon |
| rb/stb | reservoir barrels per stock tank barrel |
| TD | total depth |
| USA | United States of America |
TABLE OF CONTENTS
TECHNICAL DISCUSSION
FIGURES
TECHNICAL DISCUSSION
BLOCK 388 (SAMUEL)
OFFSHORE ISRAEL
| 1.0 | OVERVIEW __________________________________________________________________ |
| | |
| Netherland, Sewell & Associates, Inc. (NSAI) has estimated the unrisked prospective resources, as of August 1, 2012, for three prospects located in Block 388 (Samuel), offshore Israel. The preparation date of this report is September 25, 2012; we did not consider any geological, engineering, or financial data for this evaluation after that date. Prospective resources are those quantities of petroleum estimated, as of a given date, to be potentially recoverable from undiscovered accumulations by application of future development projects. The prospective resources included in this report should not be construed as reserves or contingent resources; they represent exploration opportunities and quantify the development potential in the event a petroleum discovery is made. A geologic risk assessment was performed for these prospects. There is no certainty that any portion of the prospective resources will be discovered. If discovered, there is no certainty that it will be commercially viable to produce any portion of the prospective resources. This report does not include economic analysis for these prospects. Based on analogous field developments, it appears that, assuming a discovery is made, the unrisked best estimate prospective resources in this report have a reasonable chance of being commercial. |
| | |
| Prospective resources were estimated for the Samuel Block because there are no well penetrations on the block. The three prospects evaluated in this report are in the southern portion of the Samuel Block, where there is 3-D seismic coverage. The northern two-thirds of the block is covered by various vintages of 2-D seismic data on an irregular spacing. There are exploration concepts that have been proposed for this area; however, because of the paucity of usable seismic data, no prospects have been evaluated on the block outside of the area covered by 3-D seismic data. |
| | |
| The estimates in this report have been prepared in accordance with the definitions and guidelines set forth in Canadian National Instrument 51-101—Standards of Disclosure for Oil and Gas Activities and Section 5 of Volume 1, Second Edition, of the Canadian Oil and Gas Evaluation Handbook (COGEH), prepared jointly by the Society of Petroleum Evaluation Engineers (Calgary Chapter) and the Canadian Institute of Mining, Metallurgy & Petroleum (Petroleum Society) (the latter of which is now the Petroleum Society of Canada). |
| | |
| 2.0 | BLOCK 388 (SAMUEL) HISTORY ________________________________________________ |
| | |
| The Samuel Block is located in the near offshore Israel, approximately 14 kilometers (km) southwest of Tel Aviv, as shown on the location map in Figure 1. The block covers an area of approximately 347 square kilometers (km2) and is in water depths that range from 0 meters (m) on the east side of the block, where it roughly parallels the coastline, to just over 165 m on the west side of the block. To date, no drilling has occurred on the block; however, several wells have been drilled near the block, both onshore and farther offshore. |
| | |
| The Barnea 1 well, located onshore near the southeast corner of the block, was drilled to a total depth (TD) of 3,675 m. The well was drilled from December 1969 to August 1970 by Lapidoth Israel Oil Prospectors Corp. Ltd. It encountered a probable Upper Miocene reef just below the Mavqim evaporates and a fractured limestone in the Upper Jurassic. The Jurassic limestones were cored, and visible vertical fractures had oil in them. The Upper Miocene unit was tested by drillstem test, with two tests failing and |
Page 1
one test recovering mud. The Jurassic section was also tested multiple times, but no oil was recovered in any of the tests.
Several other wells have been drilled near the city of Ashqelon. These wells encountered similar facies, where oil was again found in fractured Jurassic limestones. The Ashqelon 2 well tested 10 barrels of oil per day (bopd) and 50 barrels of water per day (bwpd) from the Jurassic.
Ashdod Field was discovered in 1976 near the city of Ashdod. The field, operated by Oil Exploration (Investments) Ltd., was put on production in 1978 and produced oil from dolomites in the Middle Jurassic Zohar Formation. The Ashdod 2 well produced 65,677 barrels (bbl) of oil from 1978 to 1997, and the Ashdod 5 well produced 149,678 bbl of oil from 1979 to 1991. It is thought that the Talme Yafe Formation may have been the carrier bed for oil to move from mature sources offshore into the porous dolomites of the Zohar Formation.
The Palmahim 1 well, located onshore near the north end of the block, was drilled by Israel National Oil Company Ltd. in 1989. The well was a dry hole but did encounter limestones in the Upper and Middle Jurassic sections, although they were wet.
The Bravo 1, located due west of the Samuel Block, is the first well drilled offshore Israel. Drilling commenced for the Bravo 1 well in January 1970, and it was plugged and abandoned in March 1970 by Belpetco-Israel et al. The Bravo 1 well had gas shows, predominantly methane with some heavier gases, and no oil shows on a structural high. The Echo 1 well was drilled 15 km to the northeast of the Bravo 1 well. It reached TD in Oligocene-aged chalks and did not test deeper closures. Little is known about this well.
The Yam Yafo 1 well, located approximately 21 km to the north of the Samuel Block, was drilled from January to August 1994 by Isramco Inc., Israel Branch and other partners in the Med Tel Aviv License. The well was drilled to test Jurassic carbonates on a large structure. The well reached a TD of 5,785 m measured depth (MD) in the Early Jurassic Qeren Formation. The Yam Yafo 1 well encountered oil and/or gas shows while drilling in the Middle Jurassic Barnea, Shederot, and Zohar Formations. All of these formations have hydrocarbon indications as evidenced by log analysis. The Barnea Formation, located below the Shederot Formation, was drillstem tested but recovered only 39.6 bbl of brine. The Barnea Formation was then acidized with 172 bbl of 15 percent hydrochloric acid and 130 bbl of water behind the acid. Only 187 bbl of brine was recovered, and the Barnea Formation testing was abandoned. The Shederot and Zohar Formations were tested together and flowed both oil and water at a rate of 821 bopd and 475 bwpd. After attempts were made to isolate the Shederot Formation, the Zohar Formation was re-tested but it also produced oil and water. The attempt to isolate what was thought to be water from the Shederot Formation was unsuccessful.
The Yam 2 well also tested the Middle Jurassic section in nearby waters. This well, located approximately 7.5 km west of the Samuel Block, tested 47° API gravity oil out of the Zohar Formation at a projected rate of 800 bopd with a water cut of 17 percent.
Both the Yam Yafo 1 and the Yam 2 wells experienced lost mud while drilling the Jurassic carbonate section, and specialized analysis of the well logs indicates that fractures are present in the Jurassic carbonates. The Yam 2 well, while drilling at 5,334 m MD, had a gas peak of 70 percent and mud weight was increased from 14.0 pounds per gallon (ppg) to 14.6 ppg. The hole was losing 20 bbl of mud per hour, so lost circulation material was pumped down the hole. The Yam Yafo 1 well lost 1,795 bbl of mud into the Jurassic carbonates while drilling, and it required mud weights of up to 16.1 ppg to control the well while drilling through the Jurassic section. Based on the amount of fluid lost while drilling the carbonate section in these two wells, it is thought that the produced water is mud filtrate and not formation water.
Page 2
| The Samuel Block is covered by various vintages of 2-D seismic lines in an irregular grid and a 222 km23-D seismic data set acquired using an ocean bottom cable system in 2011. The 3-D seismic data covers the southern part of the block and was processed in depth by ION Geophysical Corporation in London, United Kingdom. Additional work for attribute analysis and amplitude variation with offset is ongoing. |
| | |
| 3.0 | GEOLOGY___________________________________________________________________ |
| | |
| 3.1 | REGIONAL OVERVIEW |
| | |
| The Samuel Block is located in the Levant Basin of the eastern Mediterranean region. The eastern extent of the basin is marked by the Levant Transform Zone (Dead Sea Transform); the western edge of the basin is delineated by the Nile Delta Cone and the Eratosthenes Seamount; and the northern border is defined by the Taurus Fault Zone (Cyprian Arc). The basin has undergone at least three different episodes of structural deformation. The first phase of deformation started in the Late Paleozoic with rifting creating a series of horst and graben structures that evolved in several pulses. The rifting was followed by post-rift cooling and subsidence of the basin. From the Middle Jurassic to Early Tertiary, the basin was a major depocenter for the area. Late Cretaceous convergence of the Eurasian and Afro- Arabian plates may have caused compression of the Levant Basin margin and triggered the formation of a fold belt known as the Syrian Arc in the northeast corner of the basin. Reactivation, in a reverse motion, of normal faults created during the rifting stage accentuated the anticlines created by the convergence and preexisting rift blocks. |
| | |
| Uplift to the east of the Levant Basin and to the south on the Arabian platform is evidenced by an Eocene- aged regional unconformity. This unconformity separates the older, carbonate section from the overlying Oligo-Miocene siliclastics and marks the onset of widespread erosion, canyon development, and basinward transport of sediments on the shelf and into older parts of the basin. The Oligo-Miocene sediments are capped by a thick, Upper Miocene halite and anhydrite deposit formed during a major drop in sea level. This deposit is, in turn, covered by a Plio-Pleistocene fine-grained siliclastic wedge formed during gradual sea-level rise. |
| | |
| 3.2 | STRATIGRAPHY |
| | |
| Permo-Triassic rocks sit on crystalline basement in the nearshore Israel. These rocks probably thin toward the west such that Early Jurassic shallow marine carbonates are unconformably deposited on top of crystalline basement in the offshore, as shown on the stratigraphic column included as Figure 2. The Jurassic section is only partially penetrated in wells in offshore Israel. The oldest rock penetrated in offshore Israel is of Early Jurassic age. The Yam West 1 and Yam Yafo 1 wells penetrated several cycles of oolitic pelletal and intraclast grainstones and skeletal grainstones separated by thin shales of the Qeren Formation. These carbonates are thought to be allochthonous deposits from the shelf edge to the east. Above the Qeren Formation lies the Barnea Formation, a 240-to-300-m-thick sequence of carbonates and shales. Above the Barnea Formation is the Shederot Formation of probable Middle Jurassic age. The Shederot Formation is a carbonate of approximately 50 m in thickness. The 20-m- thick Karmon Formation lies above the Shederot Formation and is composed of marls and shales. The Middle Jurassic Zohar Formation is above the Karmon Formation and is approximately 65 m thick; it is composed predominantly of limestone with minor shale or marl intercalations. The Zohar Formation carbonates are thought to be Bathonian in age and consist of oolitic, pelletal, intraclast, and skeletal grainstones, mudstones, and packstones. Above the Callovian are Oxfordian-to-Kimmeridgian-age rocks of the Delta Formation. The basal part of this section is a transgressive unit that marks the end of the Middle Jurassic carbonate platform. The Delta Formation is composed predominantly of claystone with some limestones, which are occasionally chalky, and dolomites. The Tithonian Yam Formation lies |
Page 3
| conformably above the Delta Formation. This unit, interpreted as slope and basin deposits, is composed of dark, laminated shale and siltstone generally barren of fauna. |
| | |
| Unconformably overlying the Yam Formation is the Gevar Am Formation of Early Cretaceous age. This formation is composed of marine shales with conglomerate and sandstone intercalations. The sandstone deposits are thought to represent channel levee and crevasse splay deposits of proximal slope fans, which were deposited during a relative sea level fall caused by tectonic uplift. Uncomformably overlying the Gevar Am Formation is the Talme Yafe Formation, which is a deposit of carbonate debris marked by a coarse conglomerate at the base. The carbonate is thought to be from platform deposits on the shelf that were possibly deposited as debris flows during a pronounced drop in sea level. |
| | |
| The Late Cretaceous is represented by the Negba, Daliya, Ein Zetim, and Ghareb Formations. The basal Negba and Daliya Formations are pelagic chalks thought to represent the drowning of the offshore area during an extensive sea level rise. These pelagic chalks are overlain by a series of chalky limestones, separated by shales, which were deposited during periods of sea level rise that persisted until Middle Miocene time. |
| | |
| During Late Oligocene to early Middle Miocene time, sea level dropped abruptly and erosion and canyon development was renewed. Deepwater turbidites were deposited in the deepest parts of the basin. These turbidites are a primary reservoir target because of the recent Dalit, Leviathan, and Tamar Discoveries by Noble Energy, Inc. This lowstand is the start of the Late Miocene Messinian salinity crisis in the Mediterranean area and is represented by the Lakhish Formation composed of thick, sandy turbidites in the deeper parts of the basin and a dark, grey-green, silty claystone overlying the turbidites and extending to the shore. The Messinian Mavqim Formation was deposited unconformably above the Lakhish Formation and is a thick evaporitic series found throughout much of the Mediterranean area. The Mavqim Formation is composed of halite and anhydrite. It is thought that the Mediterranean area was isolated from the Atlantic Ocean because the sea level curves of the Mediterranean depart from the worldwide sea level curves. The waters in the isolated Mediterranean slowly evaporated, leaving the salts in the large topographic low of the greater Mediterranean Basin. |
| | |
| Sea levels in the Mediterranean again rose during the Pliocene because the feature that was isolating the area was breached, and marine waters again filled the basin. This resulted in the deposition of hemipelagic clays and marls of the Plio-Pleistocene Yafo Formation. The base of the Yafo Formation is marked by a highly condensed hemipelagic marl of the initial transgression. Another drop in sea level led to the deposition of potentially gas-bearing turbidite sands. Sea levels again rose, and hemipelagic deposition resumed. As the rate of sedimentation increased, progradation of highstand deposits occurred. In some areas, this resulted in over 1,000 m of sediment thickness of the Yafo Formation. The Pleshet Formation lies conformably above the Yafo Formation. The Pleshet Formation is a sequence of clays, sands, silts, and marls of Pleistocene age. |
| | |
| 3.3 | STRUCTURE AND HYDROCARBON MIGRATION |
| | |
| Structural trap formation in the Levant Basin occurred during the Late Cretaceous compressional event with inversion of previous structural lows into structural highs. This has created large anticlinal features in pre-Plio-Pleistocene sediments. The structural Syrian Arc ridge, often referred to as the Eastern Levant Ridge, is divided into three substructures: the Gabriella, Yam, and Yitzhak. Large faults that extend down to basement serve as conduits for the migration of hydrocarbon into these features. There is some seismic evidence that the compressional event has relaxed during Plio-Pleistocene to Recent times, which may suggest a chance for remigration of hydrocarbons from deeper to shallower traps. |
Page 4
| 4.0 | SOURCE EVALUATION ________________________________________________________ |
| | |
| To date, the only commercial discoveries in the Levant Basin have been gas, and no liquids associated with these discoveries have been reported. These gas deposits are thought to be biogenic in origin. Oil has been found in two wells, the Yam 2 and Yam Yafo 1, and there have been shows in other wells such as the Delta 1, Delta 1A, and Yam West 1 drilled in the offshore area. Numerous seafloor seeps are documented in the eastern Mediterranean. Senonian age source rocks are thought to be in the prime oil generation window now, but only gas shows with minor levels of C2to C4have been observed in offshore wells from the Cretaceous section. In the deepest part of the basin, Jurassic and Senonian age source rocks are thought to be in the early gas window at this time, and the oil found in the wells mentioned above is very light oil with gravities of 44° to 46° API reported. A recent assessment of undiscovered oil and gas resources of the Levant Basin, published by the United States Geological Survey, reports that there is potential to discover a mean estimate of 1.7 billion bbl of oil (10.2 trillion cubic feet of gas equivalent) and 122 trillion cubic feet of gas. Thus the basin appears to be predominantly a gas play with a slight chance for finding oil. |
| | |
| 5.0 | DATA AND METHODOLOGY____________________________________________________ |
| | |
| Data for the resources evaluation was transferred to NSAI from Adira Energy Ltd (Adira) and Gustavson Associates in Denver, Colorado. Included in the data transfer were reports, processed logs, and digital log curves or raster images for the Ashdod 2 through 6, Ashqelon 2 and 5, Barnea 1, Bravo 1, Yam 2, and Yam Yafo 1 wells; a Seismic Micro Technology project with 2-D and 3-D seismic data, well data, horizon and fault interpretations, and depth and time structure maps; a report titled "Summary Report for License #388 ('Samuel') Offshore Israel", November 2010; and numerous other reports and files on other wells located onshore and offshore Israel. |
| | |
| The prospects evaluated in this resources evaluation include the Cretaceous Reef, Jurassic Reef, and Jurassic Structural (with two prospective reservoirs evaluated). The prospective reservoirs evaluated in the Jurassic Structural Prospect are the Upper Jurassic and the Barnea Formation. Because of its positive seismic character and position in front of the shelf edge, the Cretaceous Reef Prospect is thought to be a patch reef that grew in an upper shelf slope position in water depths of 3 to 10 m during Talme Yafe time. The Jurassic Reef Prospect is thought to be a shelf margin reef that grew in water depths of 1 to 5 m as a low relief and discontinuous carbonate reef and bank. The Jurassic Structural Prospect is a structural high in the Upper Jurassic and at the Barnea Formation level. Although not reefs, these carbonates have been shown to have matrix and fracture porosity in both the offshore and onshore. The prospects and prospective reservoirs evaluated in this assessment are illustrated in Figure 3. |
| | |
| Where digital log data are available, petrophysical evaluations have been performed by Adira, NSAI, and Baker RDS. These evaluations are primarily on the Jurassic interval because that is where the most complete log suites are available. None of the wells had complete suites of log curves across the entire logged interval. The Yam Yafo 1 and Yam 2 wells had the most usable set of log curves for the Jurassic carbonates. However, over most of the upper intervals these wells had only a sonic log for porosity determination. None of the wells had a photoelectric curve, which makes lithology determination using log data difficult. Shale volumes were predicted using a linear gamma ray conversion when the gamma ray log was available. Total porosity was calculated predominantly from sonic log measurements or, where available, from bulk density or density/neutron measurements. Water saturation calculations were performed using two models, the standard Archie model and the Simandoux shaly sand model. A formation water resistivity of 0.04 ohm-meters was calculated from Pickett plot analysis. |
| | |
| Using the log analysis, a range of net rock intervals was determined using the following criteria: shale volume less than 50 percent and porosity greater than 3 percent. Gross interval thicknesses were |
Page 5
| determined for those intervals that calculated net rock. Net-to-gross ratios were calculated by dividing the net rock values by the gross interval thicknesses. Ranges for porosity and water saturation were then determined for input into the Monte Carlo simulation from the log analysis and published reports. |
| | |
| For the low side case, gross rock volumes were determined to a structural level that exhibits fault independent closure. For the high side case, gross rock volumes were determined to a structural elevation just above the spill point. |
| | |
| 6.0 | RESERVOIR PARAMETERS ____________________________________________________ |
| | |
| Reservoir parameters used to estimate resources are based on available data near the Samuel Block and our experience with similar depositional environments. Bottomhole pressure and temperature data are based on a regional geothermal gradient map and formation pressure test data. Values are estimated for each reservoir based on estimated depths to formation. Fluid properties are based on black oil and Z-factor correlations using estimated input values for pressure, temperature, oil/condensate and gas gravity, and total gas-oil ratio or yield. Primary recovery factors associated with original hydrocarbons-in- place (OHIP) are estimated based on anticipated fluid type, expected drive mechanism, and depositional environment. |
| | |
| Overall, for each prospective reservoir, probabilistic ranges for porosity, hydrocarbon saturation, initial formation volume factor, and recovery factor of OHIP were estimated for input into the Monte Carlo simulation. The input parameters are shown on the Monte Carlo Input Distribution Summary in Figure 4. |
Page 6
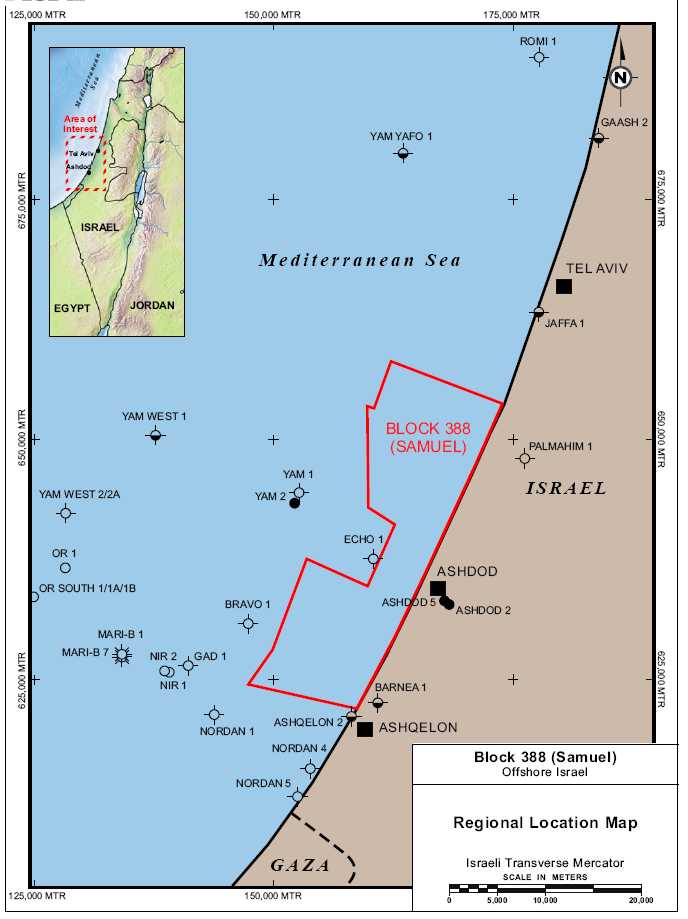
| All estimates and exhibits herein are part of this NSAI report and are subject to its parameters and conditions. | Figure 1 |
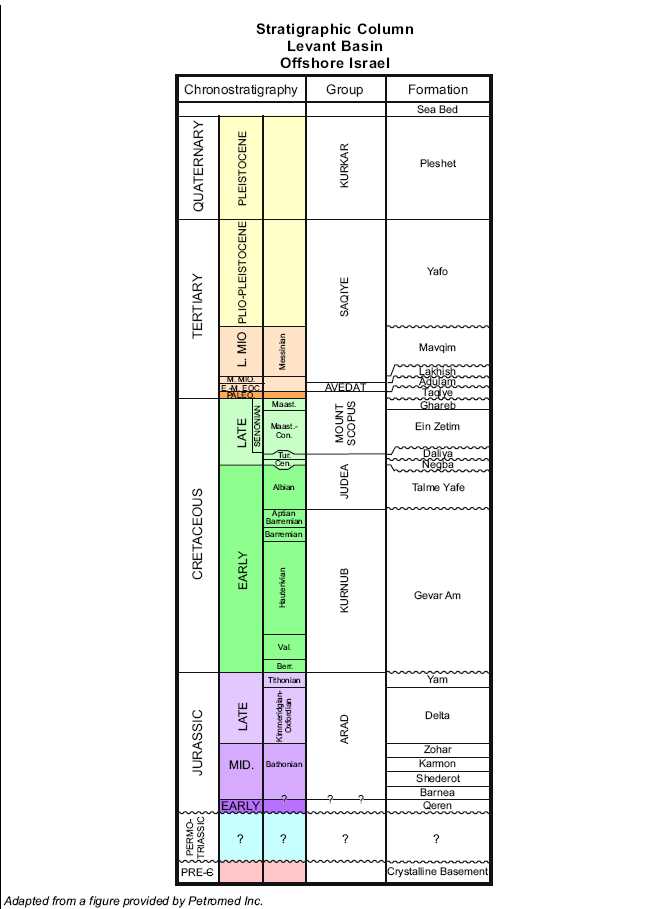
| All estimates and exhibits herein are part of this NSAI report and are subject to its parameters and conditions. | Figure 2 |

| All estimates and exhibits herein are part of this NSAI report and are subject to its parameters and conditions. | Figure 3 |
MONTE CARLO INPUT DISTRIBUTION SUMMARY
BLOCK 388 (SAMUEL)
OFFSHORE ISRAEL
AS OF AUGUST 1, 2012
| | | Gross Rock | | | | | | | | | | Net-to-Gross | | | | | | |
| | | Volume (Acre-feet) | | Area (Acres) | | Average Gross | | Ratio (Decimal) | | Matrix Porosity (Decimal) | | |
| Prospect/ | | Lognormal Distribution | | Lognormal Distribution | | Thickness(1)(Feet) | | Normal Distribution | | Normal Distribution | | |
| Prospective | | Low | | High | | Low | | High | | Low | | High | | Low | | High | | Low | | High | | |
| Reservoir | | Estimate | | Estimate | | Estimate | | Estimate | | Estimate | | Estimate | | Estimate | | Estimate | | Estimate | | Estimate | | |
Cretaceous Reef
Talme Yafe | | 288,122 | | 1,730,272 | | 1,699 | | 2,931 | | 170 | | 590 | | 0.40 | | 0.80 | | 0.02 | | 0.14 | | |
Jurassic Reef
Upper Jurassic | | 348,276 | | 1,220,138 | | 770 | | 2,775 | | 452 | | 440(2) | | 0.40 | | 0.80 | | 0.02 | | 0.14 | | |
Jurassic Structural
Upper Jurassic | | 6,267 | | 38,288 | | 121 | | 330 | | 52 | | 116 | | 0.50 | | 0.85 | | 0.02 | | 0.10 | | |
| Barnea Formation | | 16,136 | | 101,377 | | 103 | | 357 | | 157 | | 284 | | 0.50 | | 0.85 | | 0.02 | | 0.08 | | |
| | | | | | | | | Matrix Oil | | | | | | | | Initial Formation | | Oil Recovery |
| | | Fracture Porosity (Decimal) | | Saturation (Decimal) | | Fracture Oil Saturation (Decimal) | | Volume Factor (rb/stb)(3) | | Factor (Decimal) |
| Prospect/ | | Triangular Distribution | | Normal Distribution | | Triangular Distribution | | Normal Distribution | | Normal Distribution |
| Prospective | | Low | | Best | | High | | Low | | High | | Low | | Best | | High | | Low | | High | | Low | | High |
| Reservoir | | Estimate | | Estimate | | Estimate | | Estimate | | Estimate | | Estimate | | Estimate | | Estimate | | Estimate | | Estimate | | Estimate | | Estimate |
Cretaceous Reef
Talme Yafe | | 0.00 | | 0.01 | | 0.02 | | 0.60 | | 0.80 | | 0.80 | | 0.90 | | 1.00 | | 1.40 | | 1.20 | | 0.14 | | 0.26 |
Jurassic Reef
Upper Jurassic | | 0.00 | | 0.01 | | 0.02 | | 0.60 | | 0.80 | | 0.80 | | 0.90 | | 1.00 | | 1.40 | | 1.20 | | 0.14 | | 0.26 |
Jurassic Structural
Upper Jurassic | | 0.00 | | 0.01 | | 0.02 | | 0.60 | | 0.80 | | 0.80 | | 0.90 | | 1.00 | | 1.40 | | 1.20 | | 0.14 | | 0.26 |
| Barnea Formation | | 0.00 | | 0.01 | | 0.02 | | 0.60 | | 0.80 | | 0.80 | | 0.90 | | 1.00 | | 1.40 | | 1.20 | | 0.14 | | 0.26 |
Note: For the purposes of this report, we used technical data including, but not limited to, well logs, geologic maps, seismic data, and property ownership interests.
| (1) | Average gross thickness is calculated by dividing the gross rock volume by the area. |
| (2) | The structural character of the Jurassic Reef Prospect results in a lower average gross thickness in the high estimate case relative to the low estimate case. |
| (3) | The abbreviation rb/stb represents reservoir barrels per stock tank barrel. |
| All estimates and exhibits herein are part of this NSAI report and are subject to its parameters and conditions. | Figure 4 |