J u l y 2 0 1 9 INVESTOR PRESENTATION
FORWARD LOOKING STATEMENTS This presentation contains statements regarding our expectations, beliefs and views about our future financial performance and our business, trends and expectations regarding the markets in which we operate, and our future plans. Those statements constitute “forward-looking statements” within the meaning of Section 27A of the Securities Act of 1933, as amended, and Section 21E of the Securities Exchange Act of 1934, as amended, can be identified by the fact that they do not relate strictly to historical or current facts. Often, they include words such as “believe,” “expect,” “anticipate,” “intend,” “plan,” “estimate,” “project,” or words of similar meaning, or future or conditional verbs such as “will,” “would,” “should,” “could,” or “may”. Forward-looking statements are based on current information available to us and our assumptions about future events over which we do not have control. Moreover, our business and our markets are subject to a number of risks and uncertainties which could cause our actual financial performance in the future, and the future performance of our markets (which can affect both our financial performance and the market prices of our shares), to differ, possibly materially, from our expectations as set forth in the forward-looking statements contained in this presentation. In addition to the risk of incurring loan losses, which is an inherent risk of the banking business, these risks and uncertainties include, but are not limited to, the following: the risk that the economic recovery in the United States, which is still relatively fragile, will be adversely affected by domestic or international economic conditions, which could cause us to incur additional loan losses and adversely affect our results of operations in the future; the risk that our results of operations in the future will continue to be adversely affected by our exit from the wholesale residential mortgage lending business and the risk that our commercial banking business will not generate the additional revenues needed to fully offset the decline in our mortgage banking revenues within the next two to three years; the risk that our interest margins and, therefore, our net interest income will be adversely affected by changes in prevailing interest rates; the risk that we will not succeed in further reducing our remaining nonperforming assets, in which event we would face the prospect of further loan charge-offs and write-downs of other real estate owned and would continue to incur expenses associated with the management and disposition of those assets; the risk that we will not be able to manage our interest rate risks effectively, in which event our operating results could be harmed; the prospect that government regulation of banking and other financial services organizations will increase, causing our costs of doing business to increase and restricting our ability to take advantage of business and growth opportunities. Additional information regarding these and other risks and uncertainties to which our business is subject are contained in our Annual Report on Form 10-K for the year ended December 31, 2018 which is on file with the SEC as well as subsequent Quarterly Reports on Form 10-Q that we file with the SEC. Due to these and other risks and uncertainties to which our business is subject, you are cautioned not to place undue reliance on the forward-looking statements contained in this news release, which speak only as of its date, or to make predictions about our future financial performance based solely on our historical financial performance. We disclaim any obligation to update or revise any of the forward-looking statements as a result of new information, future events or otherwise, except as may be required by law. 2
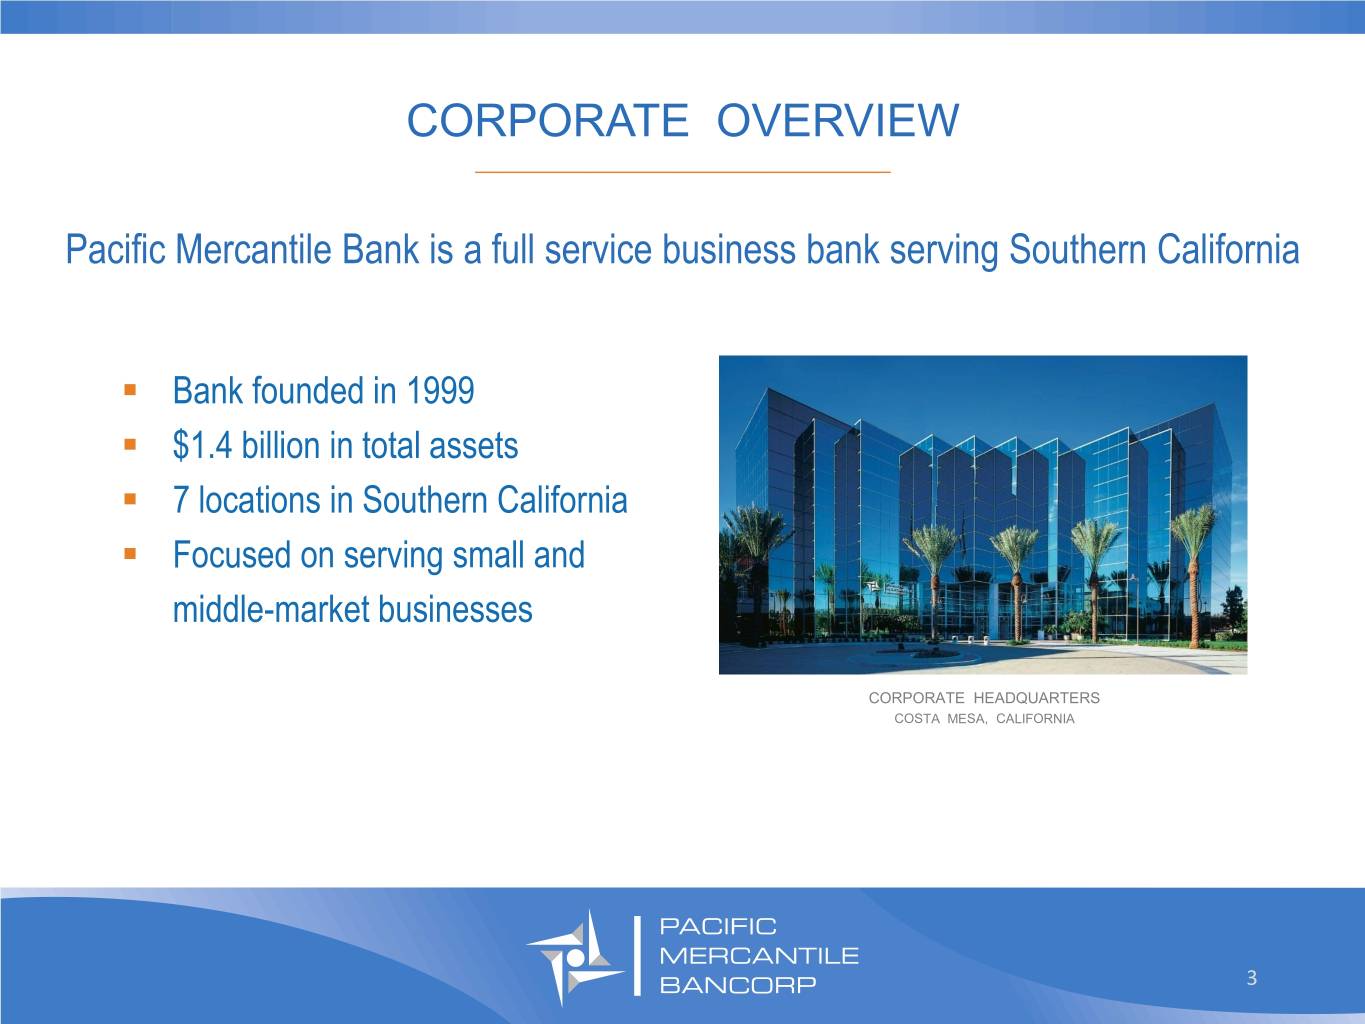
CORPORATE OVERVIEW _________________________________ Pacific Mercantile Bank is a full service business bank serving Southern California . Bank founded in 1999 . $1.4 billion in total assets . 7 locations in Southern California . Focused on serving small and middle-market businesses CORPORATE HEADQUARTERS COSTA MESA, CALIFORNIA 3

INVESTMENT HIGHLIGHTS _________________________________ . Growing commercial bank operating in attractive Southern California markets . Well defined value proposition drives new client acquisition without compromising on pricing and terms . Favorable shifts in loan and deposit mix adding to franchise value . Disciplined expense management driving improved efficiencies . Steady increases in profitability . Attractive valuation trading at 1.31x tangible book value(1) (1) Based on closing price on July 23, 2019 4
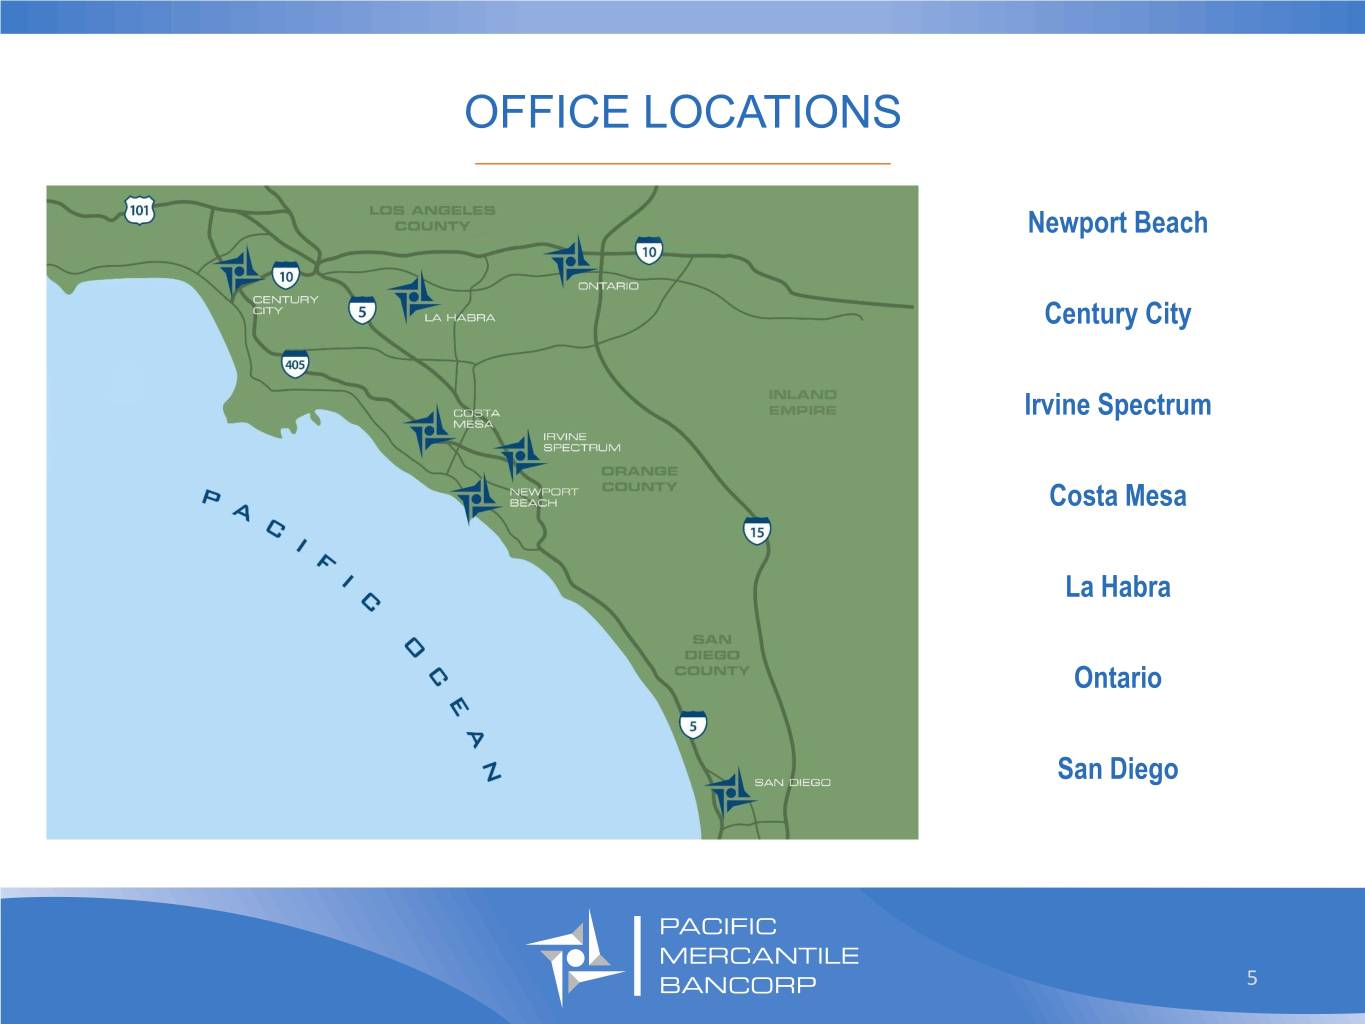
OFFICE LOCATIONS _________________________________ Newport Beach Century City Irvine Spectrum Costa Mesa La Habra Ontario San Diego 5

EXECUTIVE MANAGEMENT TEAM _________________________________ Financial Tenure at Name Title Services Select Experience PMB Experience President & . President of Commercial Banking at Pacific Mercantile Bank Thomas M. Vertin ~33 years ~7 years Chief Executive Officer . Chief Operating Officer at Silicon Valley Bank . EVP & CFO of Carpenter Community BancFund Executive Vice President & . Interim CFO at Manhattan Bancorp Curt A. Christianssen ~22 years ~5 years Chief Financial Officer . CFO and Director of Corporate Development for Dartmouth Capital Group and Eldorado Bancshares . EVP at Susquehanna Bancshares Executive Vice President & Thomas Inserra ~25 years ~3 years . Leadership roles with Citibank, FDIC and Household Chief Credit Officer International . EVP/Asset Based Lending at Pacific Mercantile Bank Executive Vice President & Robert Anderson ~23 years ~6 years . Various positions at Silicon Valley Bank including head of Chief Banking Officer Orange County office . Chief Information Officer at Bank of Manhattan Executive Vice President & Curtis Birkmann ~9 years ~4 years . Senior Software Engineer and Senior Program Manager at Chief Technology Officer Corcen Data International Executive Vice President & . Vice President/Compliance and BSA Manager at California Maxwell G. Sinclair ~23 years ~8 years Chief Compliance Officer Bank & Trust 6
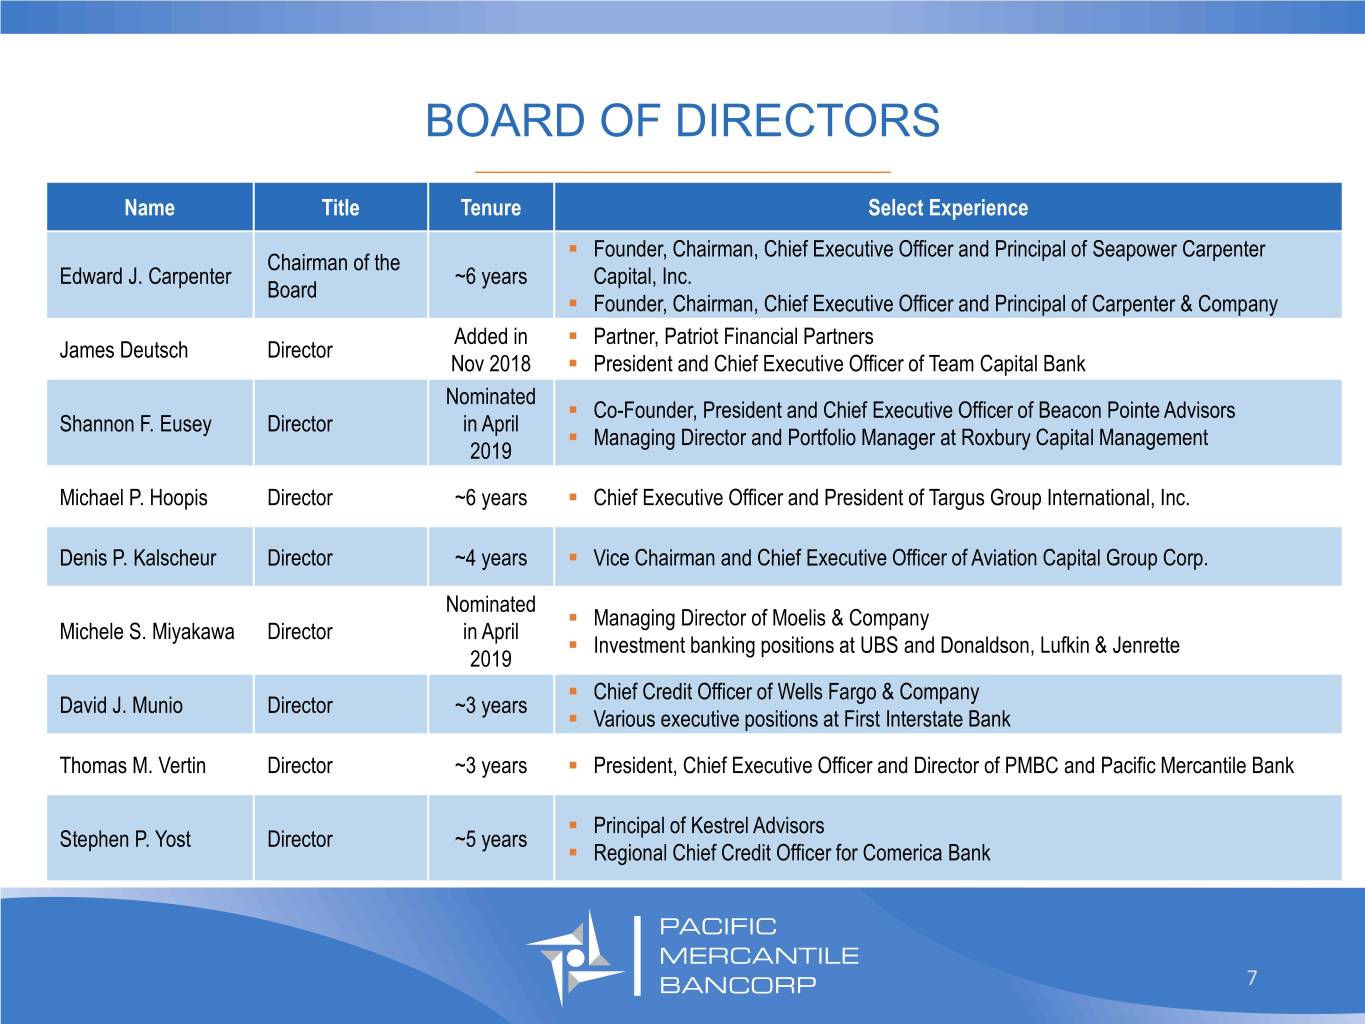
BOARD OF DIRECTORS _________________________________ Name Title Tenure Select Experience . Founder, Chairman, Chief Executive Officer and Principal of Seapower Carpenter Chairman of the Edward J. Carpenter ~6 years Capital, Inc. Board . Founder, Chairman, Chief Executive Officer and Principal of Carpenter & Company Added in . Partner, Patriot Financial Partners James Deutsch Director Nov 2018 . President and Chief Executive Officer of Team Capital Bank Nominated . Co-Founder, President and Chief Executive Officer of Beacon Pointe Advisors Shannon F. Eusey Director in April . Managing Director and Portfolio Manager at Roxbury Capital Management 2019 Michael P. Hoopis Director ~6 years . Chief Executive Officer and President of Targus Group International, Inc. Denis P. Kalscheur Director ~4 years . Vice Chairman and Chief Executive Officer of Aviation Capital Group Corp. Nominated . Managing Director of Moelis & Company Michele S. Miyakawa Director in April . Investment banking positions at UBS and Donaldson, Lufkin & Jenrette 2019 . Chief Credit Officer of Wells Fargo & Company David J. Munio Director ~3 years . Various executive positions at First Interstate Bank Thomas M. Vertin Director ~3 years . President, Chief Executive Officer and Director of PMBC and Pacific Mercantile Bank . Principal of Kestrel Advisors Stephen P. Yost Director ~5 years . Regional Chief Credit Officer for Comerica Bank 7
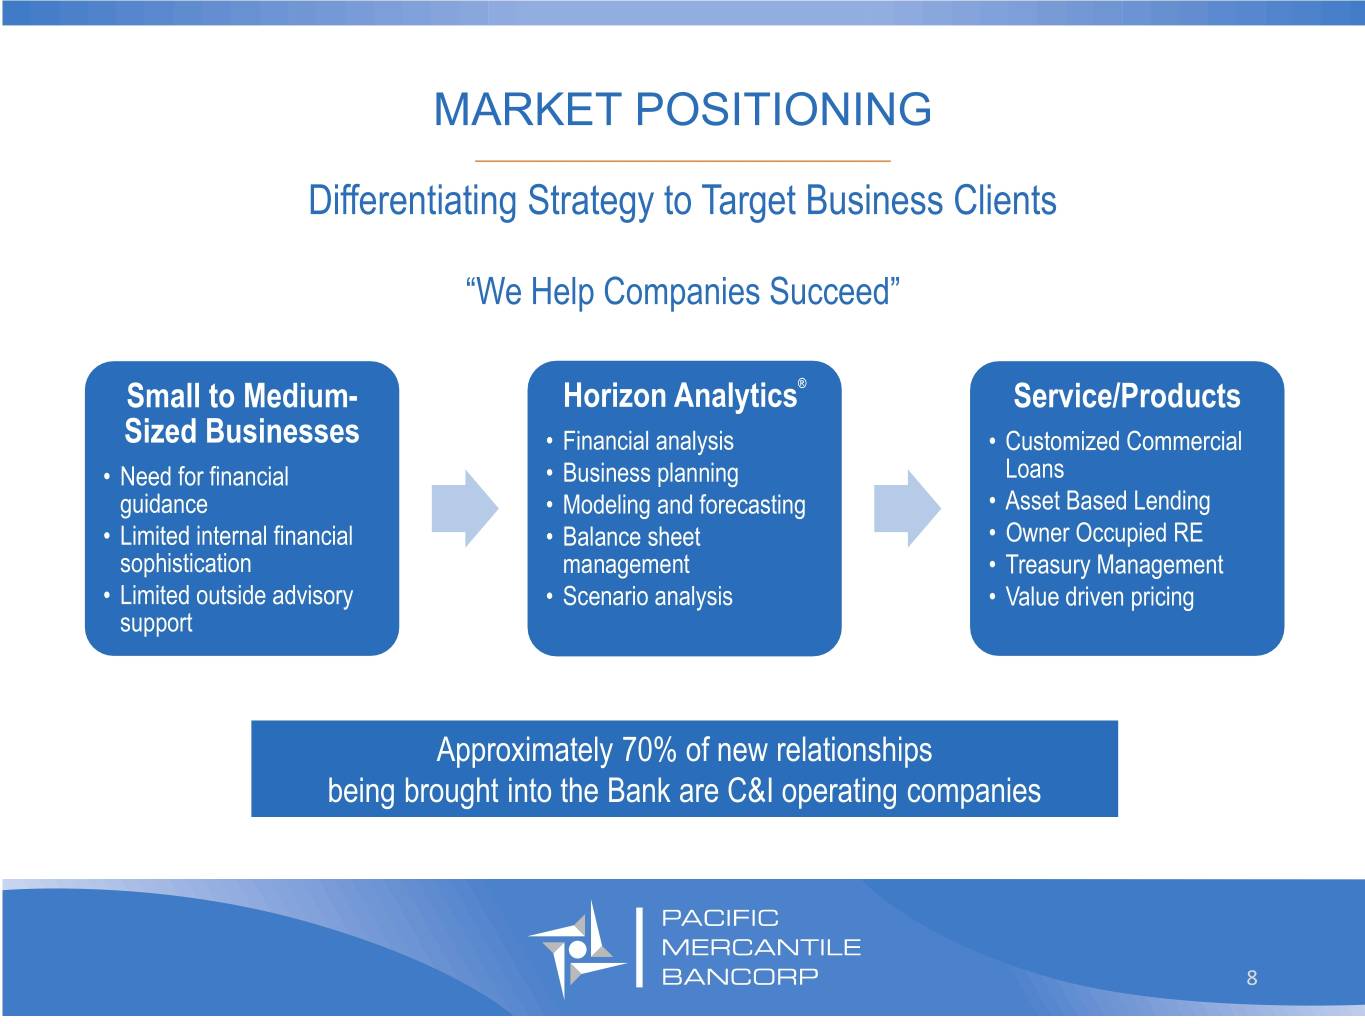
MARKET POSITIONING _________________________________ Differentiating Strategy to Target Business Clients “We Help Companies Succeed” Small to Medium- Horizon Analytics® Service/Products Sized Businesses • Financial analysis • Customized Commercial • Need for financial • Business planning Loans guidance • Modeling and forecasting • Asset Based Lending • Limited internal financial • Balance sheet • Owner Occupied RE sophistication management • Treasury Management • Limited outside advisory • Scenario analysis • Value driven pricing support Approximately 70% of new relationships being brought into the Bank are C&I operating companies 8

HORIZON ANALYTICS® _________________________________ A unique, game-changing tool that provides a deeper understanding of a Client’s company and industry, which enables us to tailor business discussions to Client needs Peer Company Financial Performance Comparison US and California Client Provided Industry Research Financials and Report Database Aspirations Interview Synthesis and Company Valuation Impact Analysis Scenario Modeling for Modeled Scenarios Private Company Financial Statement Database Comprised of Over 1 Million Sets of Financial Statements Recommended Next Steps Partnering with Pacific Mercantile Bank . Competitive advantage with 70% success rate when . Streamlines underwriting and allows loan pricing using Horizon Analytics flexibility (+25 to 50 bps) . Relationships include loans, deposits and treasury . Increases retention by providing ongoing analysis and management services recommendations 9

OPERATING COMPANY HIGHLIGHTS _________________________________ . Target operating companies with annual revenues between $10 million and $75 million . Identified industry verticals for which there are over 20,000 businesses in service area . Primarily manufacturing, distribution and service industries . 2017 – acquired 33 operating company relationships . 2018 – acquired 62 operating company relationships . First Half of 2019 – acquired 39 operating company relationships . Average loan commitment of ~$2.5 million; 30% - 40% self funded in core deposits 10
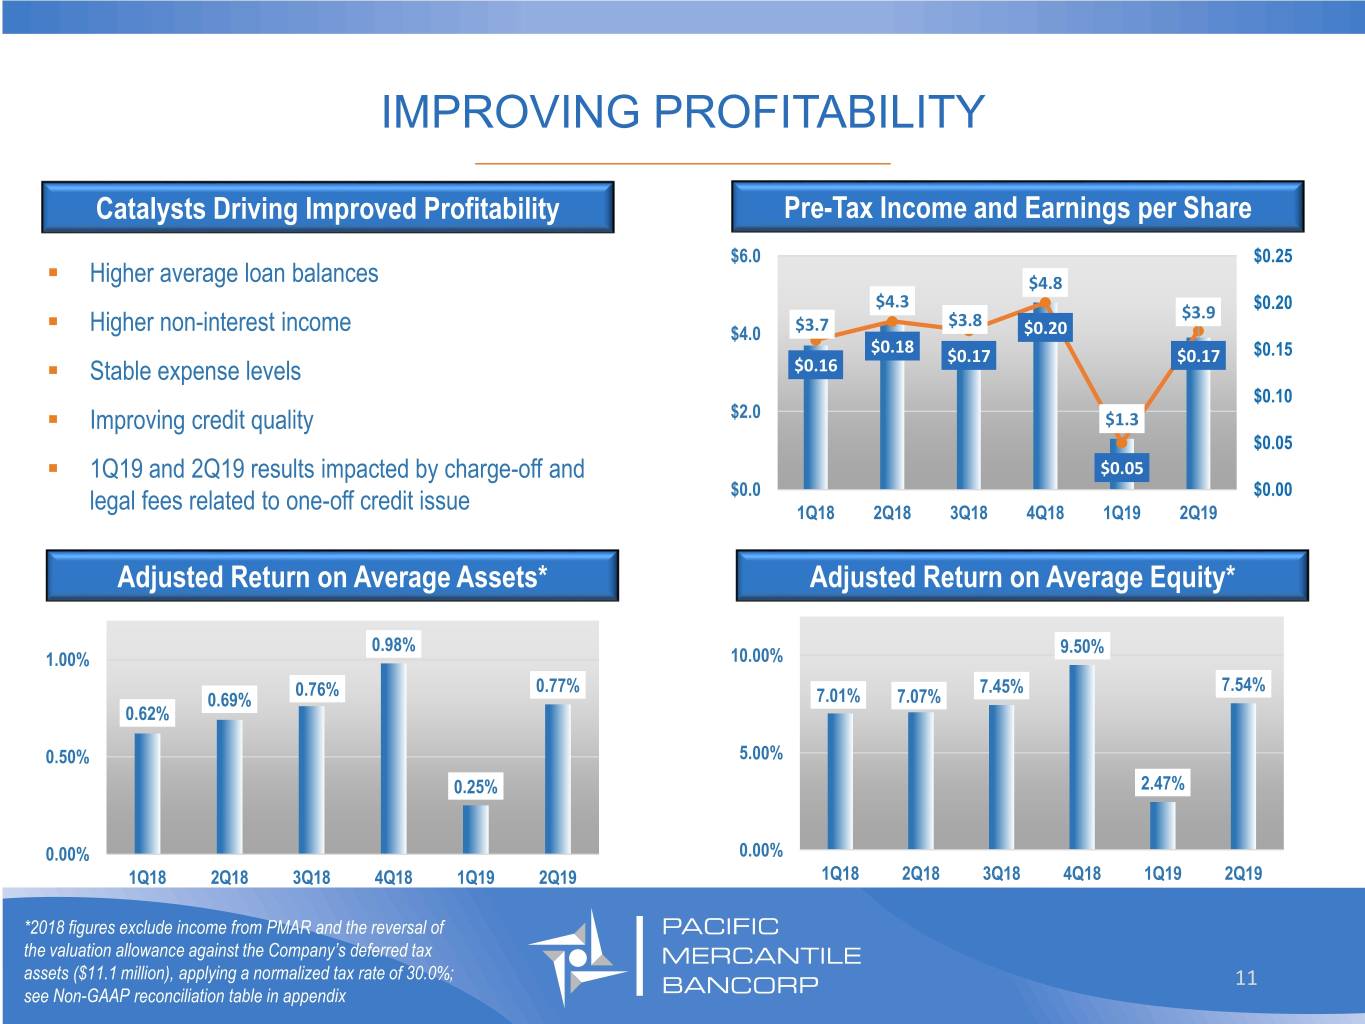
IMPROVING PROFITABILITY _________________________________ Catalysts Driving Improved Profitability Pre-Tax Income and Earnings per Share $6.0 $0.25 . Higher average loan balances $4.8 $4.3 $0.20 $3.8 $3.9 . Higher non-interest income $4.0 $3.7 $0.20 $0.18 $0.17 $0.17 $0.15 . Stable expense levels $0.16 $0.10 . Improving credit quality $2.0 $1.3 $0.05 . 1Q19 and 2Q19 results impacted by charge-off and $0.05 $0.0 $0.00 legal fees related to one-off credit issue 1Q18 2Q18 3Q18 4Q18 1Q19 2Q19 Adjusted Return on Average Assets* Adjusted Return on Average Equity* 0.98% 9.50% 1.00% 10.00% 0.76% 0.77% 7.45% 7.54% 0.69% 7.01% 7.07% 0.62% 0.50% 5.00% 0.25% 2.47% 0.00% 0.00% 1Q18 2Q18 3Q18 4Q18 1Q19 2Q19 1Q18 2Q18 3Q18 4Q18 1Q19 2Q19 *2018 figures exclude income from PMAR and the reversal of the valuation allowance against the Company’s deferred tax assets ($11.1 million), applying a normalized tax rate of 30.0%; 11 see Non-GAAP reconciliation table in appendix
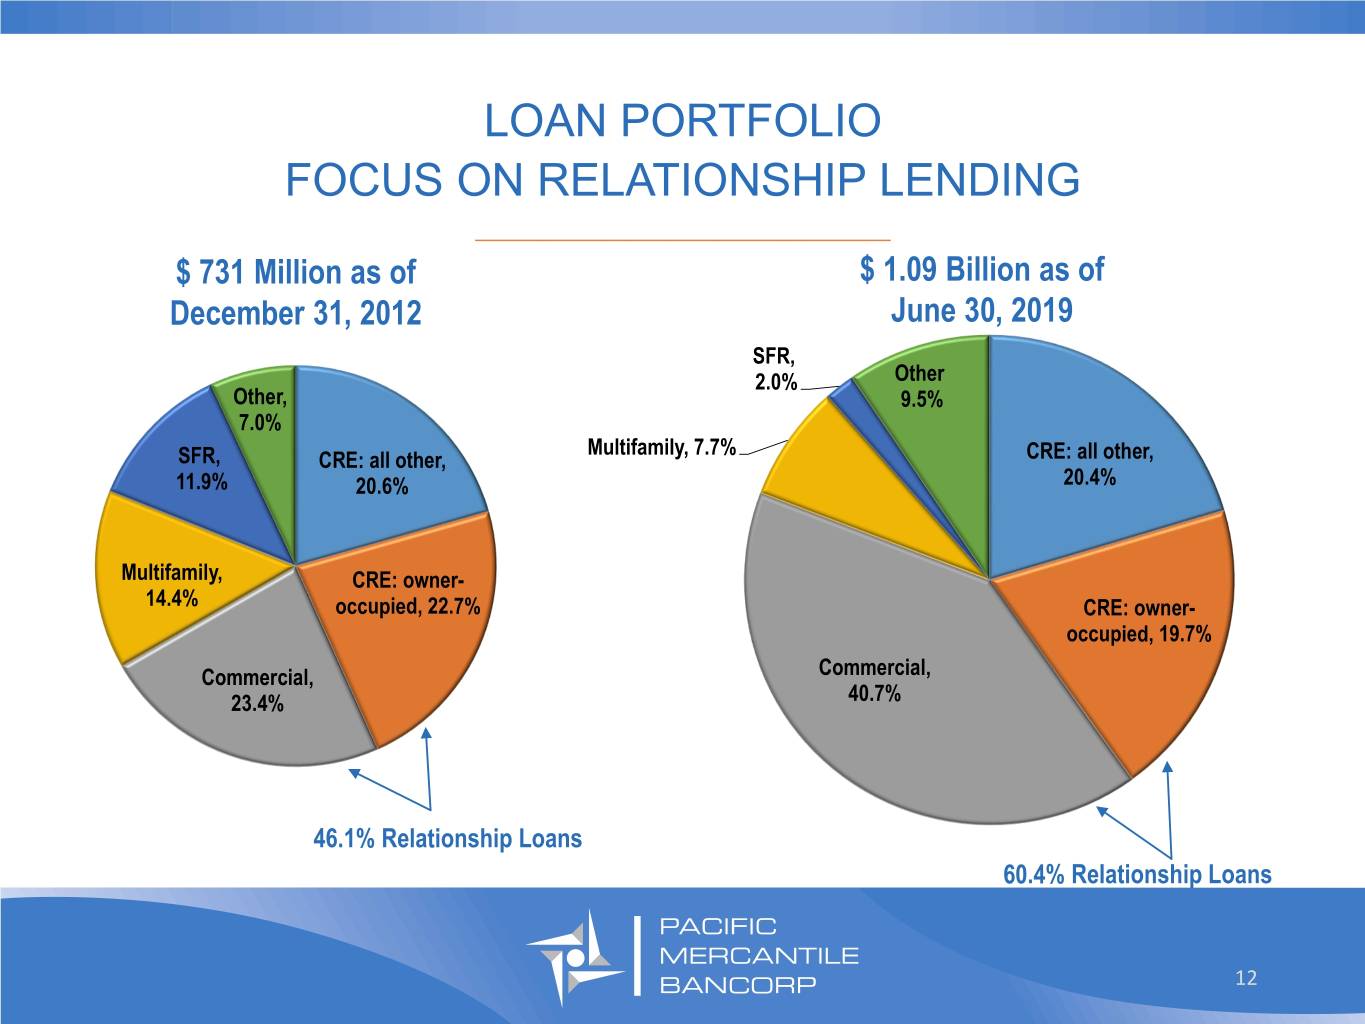
LOAN PORTFOLIO FOCUS ON RELATIONSHIP LENDING _________________________________ $ 731 Million as of $ 1.09 Billion as of December 31, 2012 June 30, 2019 SFR, 2.0% Other Other, 9.5% 7.0% Multifamily, 7.7% SFR, CRE: all other, CRE: all other, 11.9% 20.6% 20.4% Multifamily, CRE: owner- 14.4% occupied, 22.7% CRE: owner- occupied, 19.7% Commercial, Commercial, 23.4% 40.7% 46.1% Relationship Loans 60.4% Relationship Loans 12
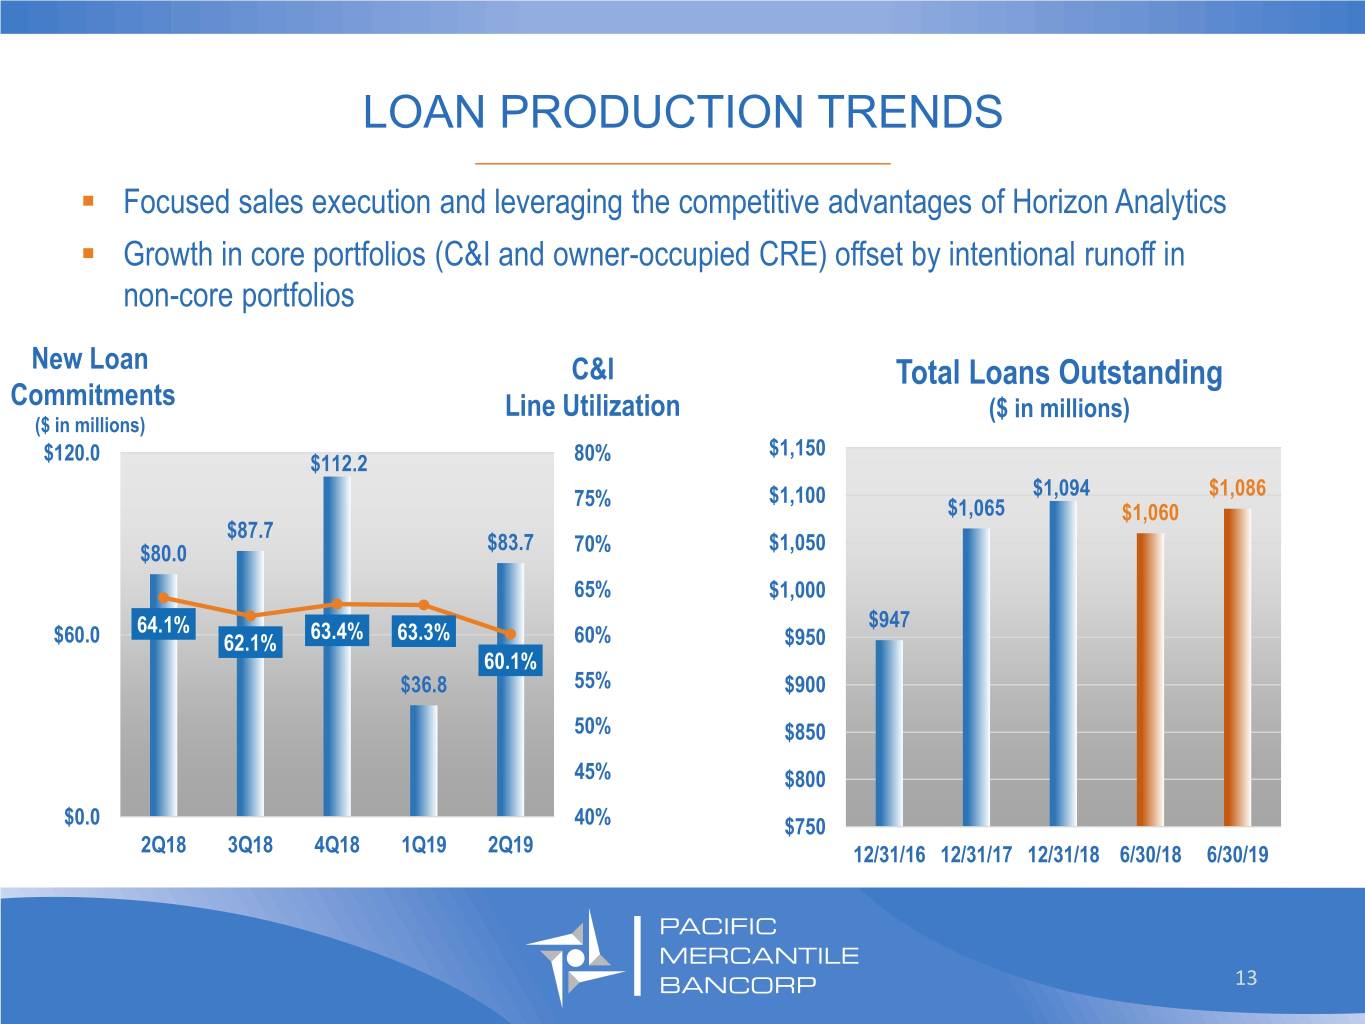
LOAN PRODUCTION TRENDS _________________________________ . Focused sales execution and leveraging the competitive advantages of Horizon Analytics . Growth in core portfolios (C&I and owner-occupied CRE) offset by intentional runoff in non-core portfolios New Loan C&I Total Loans Outstanding Commitments Line Utilization ($ in millions) ($ in millions) $1,150 $120.0 $112.2 80% 75% $1,100 $1,094 $1,086 $1,065 $1,060 $87.7 $80.0 $83.7 70% $1,050 65% $1,000 $947 64.1% 63.4% $60.0 62.1% 63.3% 60% $950 60.1% $36.8 55% $900 50% $850 45% $800 $0.0 40% $750 2Q18 3Q18 4Q18 1Q19 2Q19 12/31/16 12/31/17 12/31/18 6/30/18 6/30/19 13
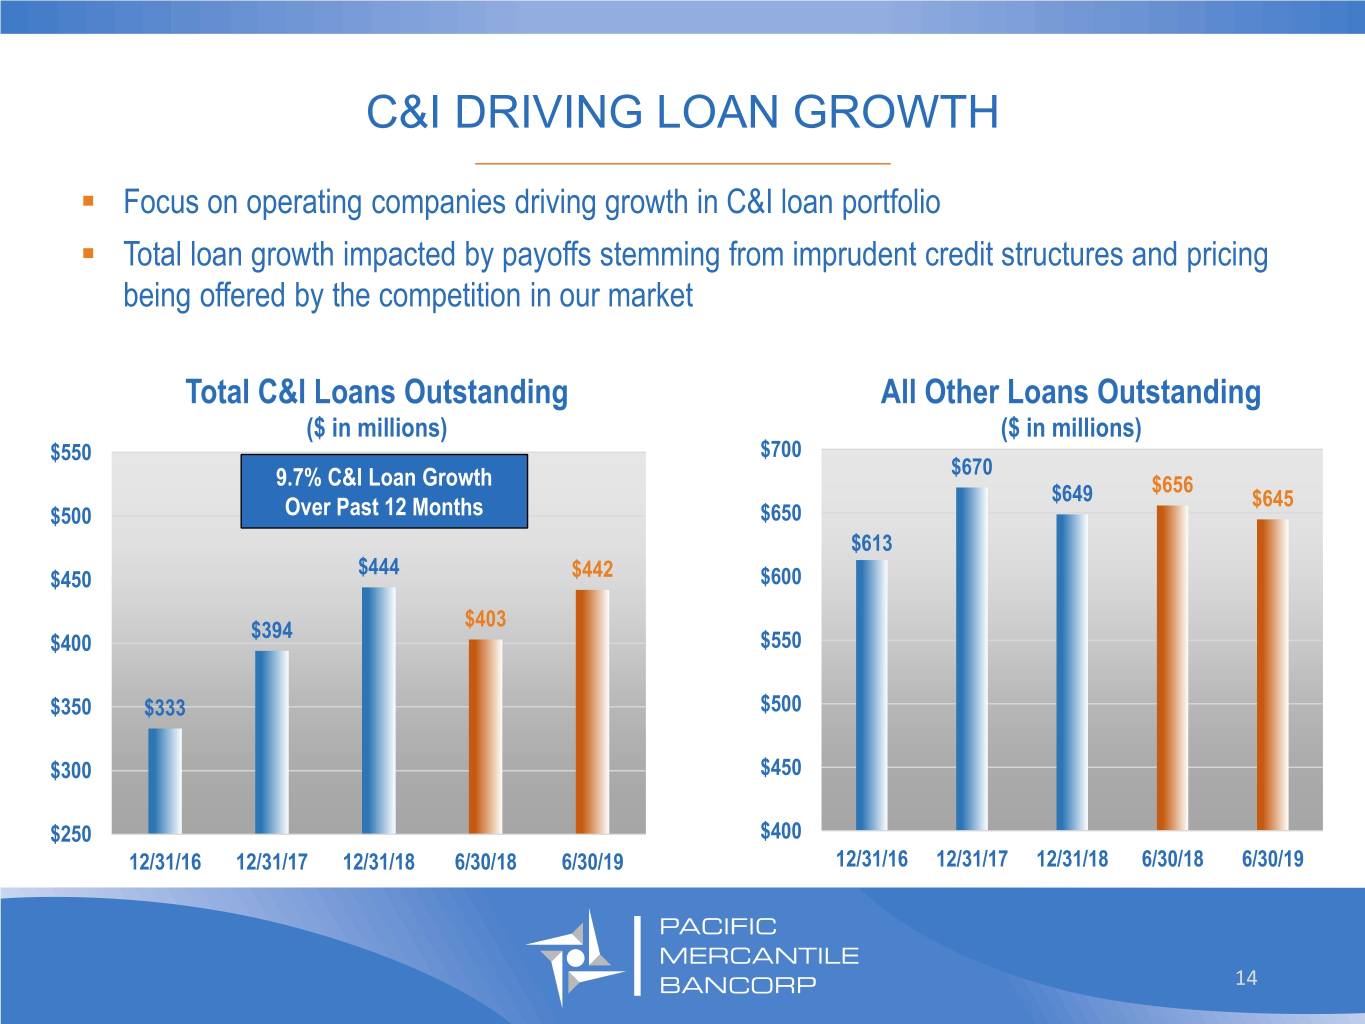
C&I DRIVING LOAN GROWTH _________________________________ . Focus on operating companies driving growth in C&I loan portfolio . Total loan growth impacted by payoffs stemming from imprudent credit structures and pricing being offered by the competition in our market Total C&I Loans Outstanding All Other Loans Outstanding ($ in millions) ($ in millions) $550 $700 $670 9.7% C&I Loan Growth $656 $649 $645 $500 Over Past 12 Months $650 $613 $444 $450 $442 $600 $403 $394 $400 $550 $350 $333 $500 $300 $450 $250 $400 12/31/16 12/31/17 12/31/18 6/30/18 6/30/19 12/31/16 12/31/17 12/31/18 6/30/18 6/30/19 14
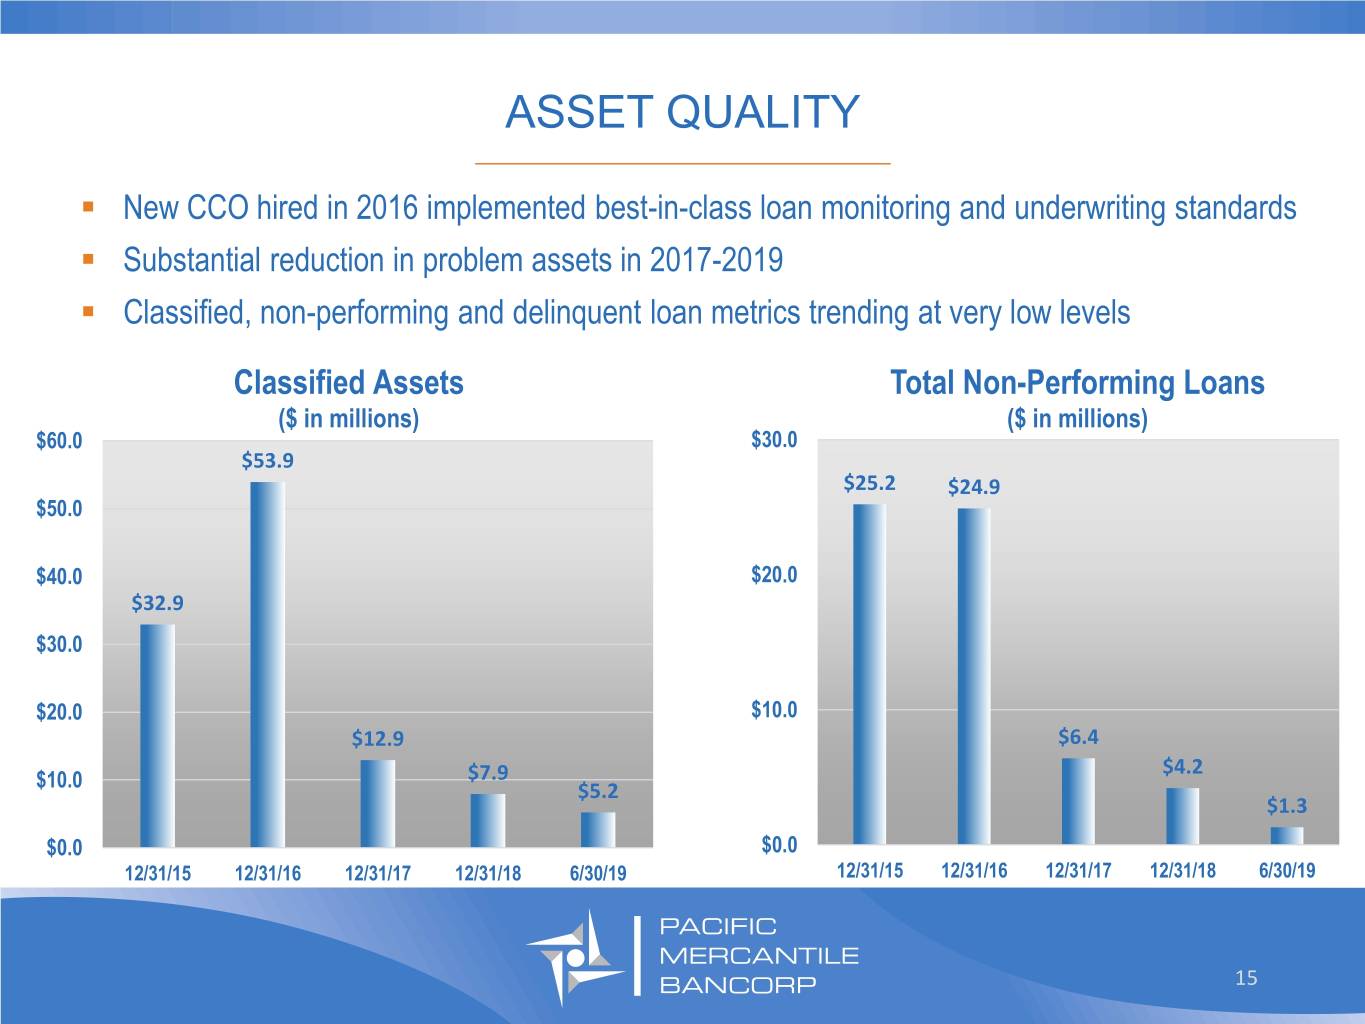
ASSET QUALITY _________________________________ . New CCO hired in 2016 implemented best-in-class loan monitoring and underwriting standards . Substantial reduction in problem assets in 2017-2019 . Classified, non-performing and delinquent loan metrics trending at very low levels Classified Assets Total Non-Performing Loans ($ in millions) ($ in millions) $60.0 $30.0 $53.9 $25.2 $24.9 $50.0 $40.0 $20.0 $32.9 $30.0 $20.0 $10.0 $12.9 $6.4 $4.2 $10.0 $7.9 $5.2 $1.3 $0.0 $0.0 12/31/15 12/31/16 12/31/17 12/31/18 6/30/19 12/31/15 12/31/16 12/31/17 12/31/18 6/30/19 15

DEPOSIT COMPOSITION FOCUSED ON CORE DEPOSITS _________________________________ Core Deposits as a Percentage of Total Deposits $ 1.20 Billion as of June 30, 2019 85.0% 78.4% 80.0% 76.1% 74.2% 75.0% Certificates of Deposit 70.0% 68.6% 68.3% 21.6% Non-Interest 65.0% Bearing 60.6% 31.5% 60.0% 55.0% 51.5% Savings/Money 50.0% Market 45.0% 43.1% 37.5% 40.0% Interest 12/31/12 12/31/13 12/31/14 12/31/15 12/31/16 12/31/17 12/31/18 6/30/19 Checking 9.4% 16
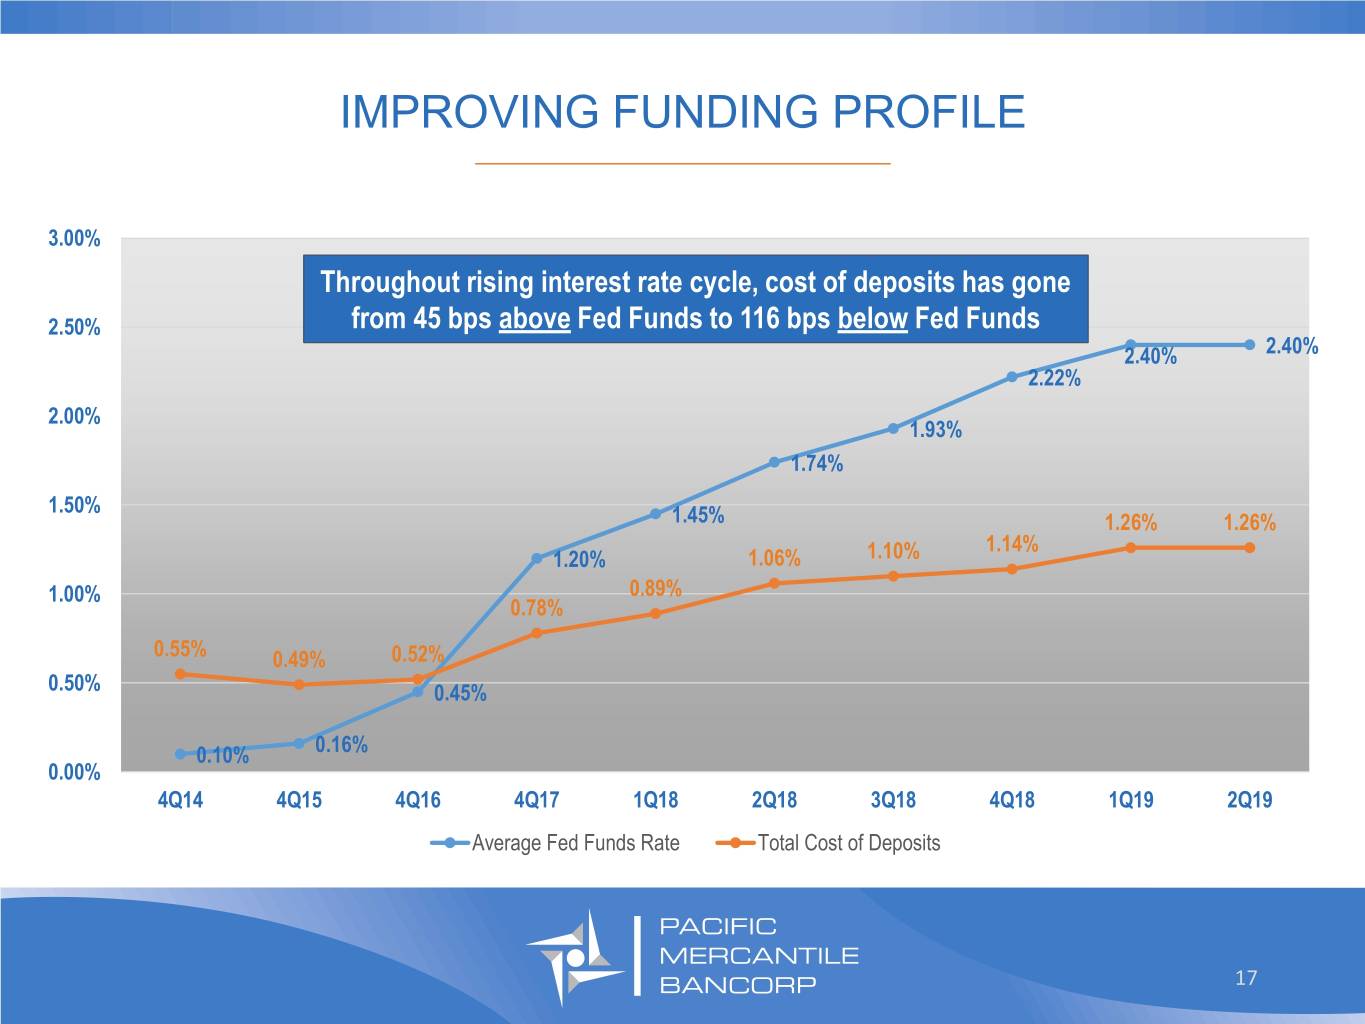
IMPROVING FUNDING PROFILE _________________________________ 3.00% Throughout rising interest rate cycle, cost of deposits has gone 2.50% from 45 bps above Fed Funds to 116 bps below Fed Funds 2.40% 2.40% 2.22% 2.00% 1.93% 1.74% 1.50% 1.45% 1.26% 1.26% 1.14% 1.20% 1.06% 1.10% 1.00% 0.89% 0.78% 0.55% 0.49% 0.52% 0.50% 0.45% 0.10% 0.16% 0.00% 4Q14 4Q15 4Q16 4Q17 1Q18 2Q18 3Q18 4Q18 1Q19 2Q19 Average Fed Funds Rate Total Cost of Deposits 17
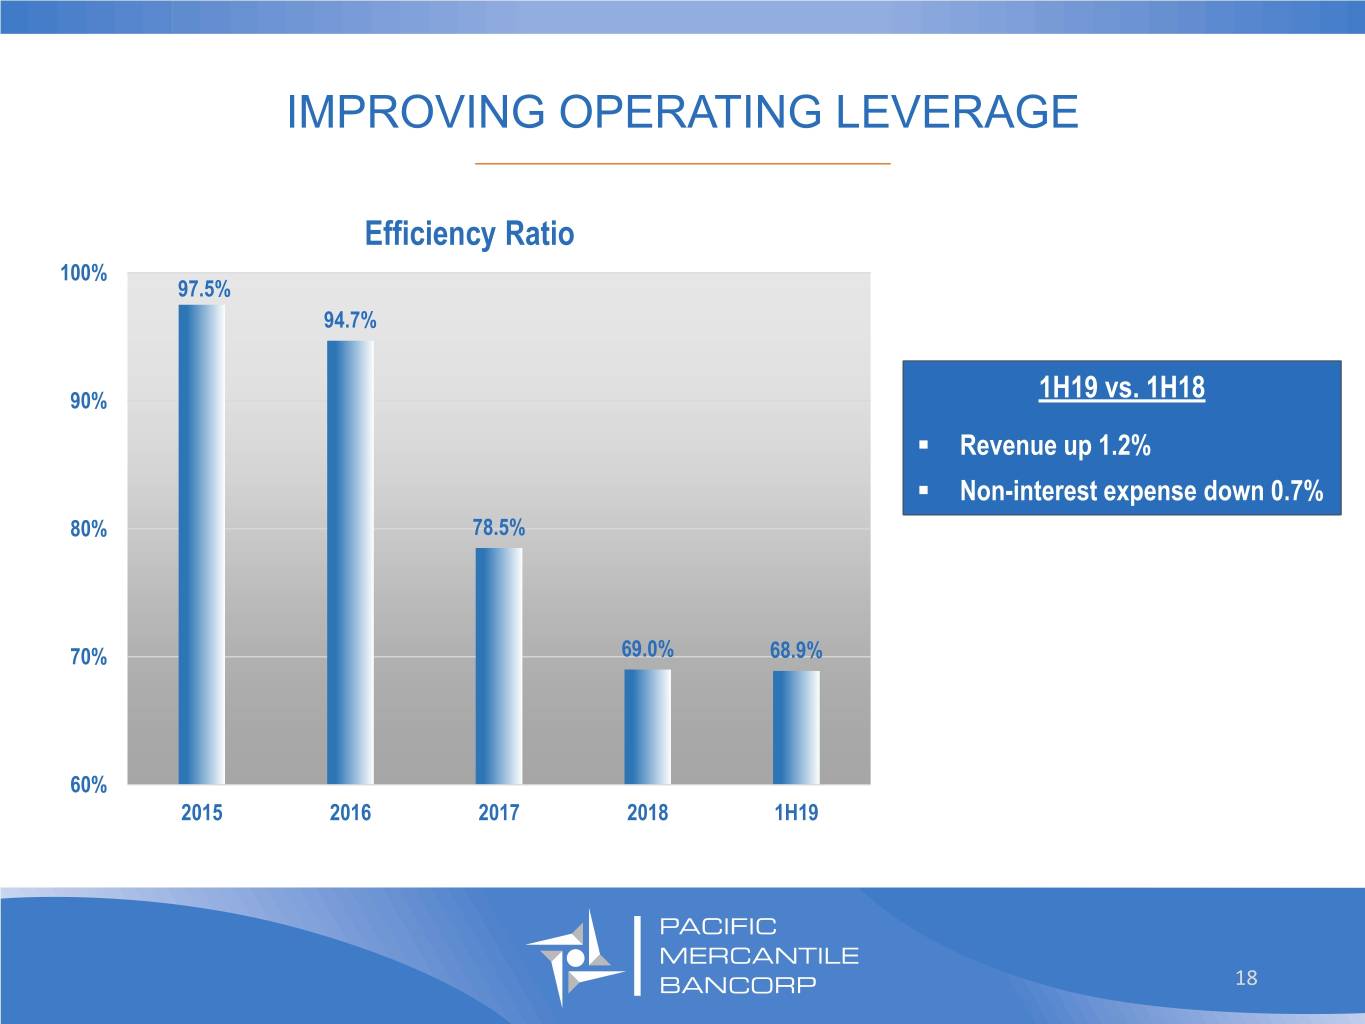
IMPROVING OPERATING LEVERAGE _________________________________ Efficiency Ratio 100% 97.5% 94.7% 90% 1H19 vs. 1H18 . Revenue up 1.2% . Non-interest expense down 0.7% 80% 78.5% 70% 69.0% 68.9% 60% 2015 2016 2017 2018 1H19 18

STRONG CAPITAL POSITION _________________________________ PM BANK WELL-CAPITALIZED REQUIREMENT 13.5% 15.0% 12.5% 12.5% 10.0% 10.0% 8.0% 6.5% 5.0% 0.0% COMMON EQUITY TIER 1 TIER 1 CAPITAL RATIO TOTAL CAPITAL RATIO CAPITAL RATIO As of June 30, 2019 19
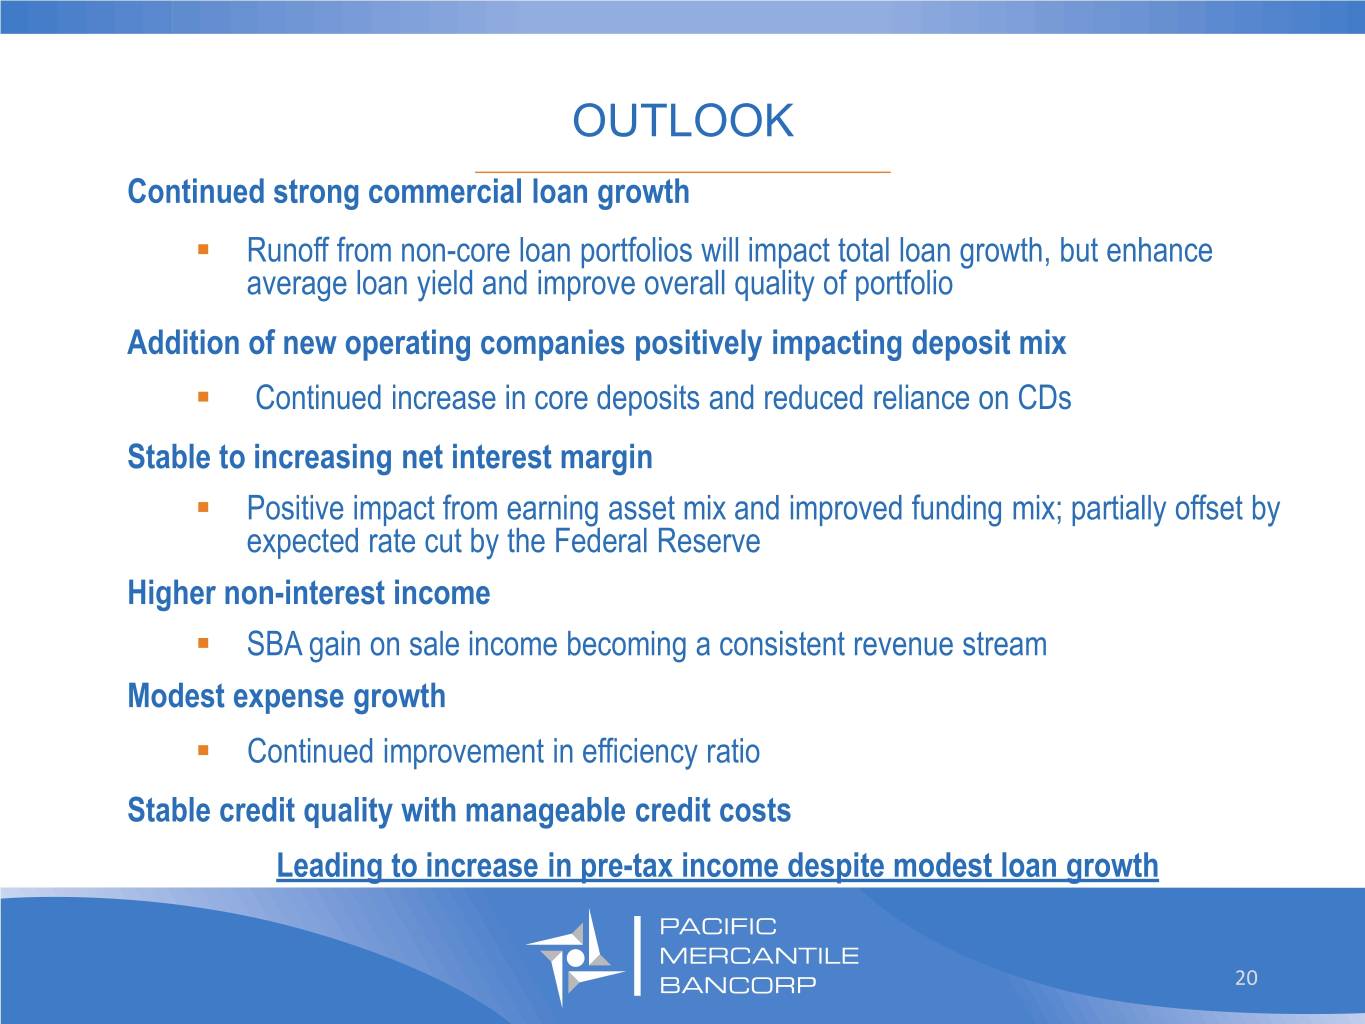
OUTLOOK _________________________________ Continued strong commercial loan growth . Runoff from non-core loan portfolios will impact total loan growth, but enhance average loan yield and improve overall quality of portfolio Addition of new operating companies positively impacting deposit mix . Continued increase in core deposits and reduced reliance on CDs Stable to increasing net interest margin . Positive impact from earning asset mix and improved funding mix; partially offset by expected rate cut by the Federal Reserve Higher non-interest income . SBA gain on sale income becoming a consistent revenue stream Modest expense growth . Continued improvement in efficiency ratio Stable credit quality with manageable credit costs Leading to increase in pre-tax income despite modest loan growth 20

Investor Relations: Curt Christianssen ( 7 1 4 ) 4 3 8 - 2 5 3 1 Curt.christianssen@pmbank.com 21
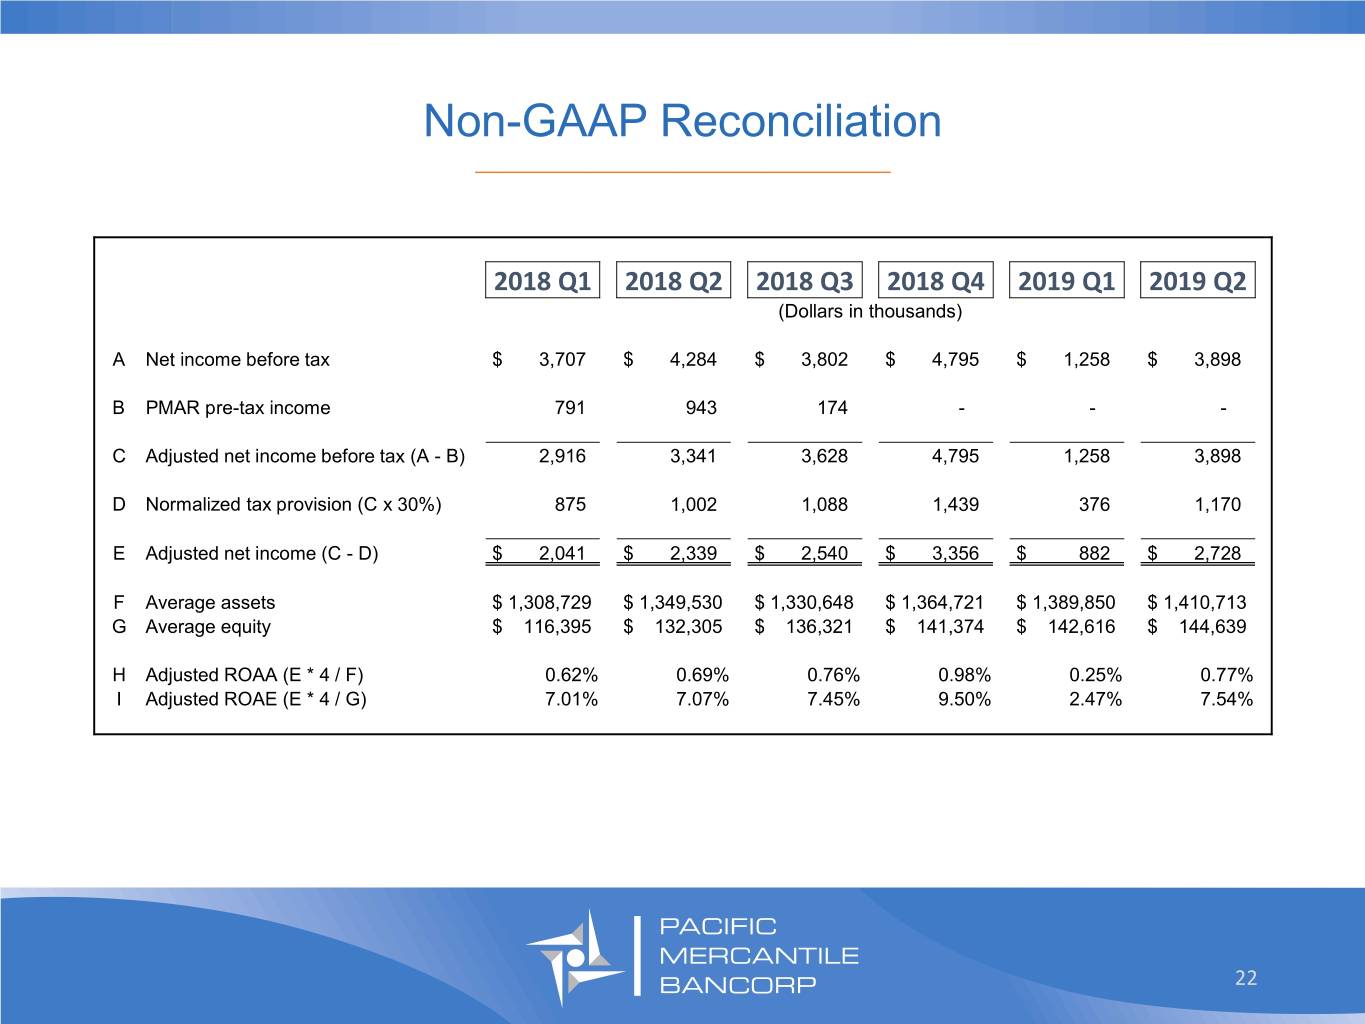
Non-GAAP Reconciliation _________________________________ 2018 Q1 2018 Q2 2018 Q3 2018 Q4 2019 Q1 2019 Q2 (Dollars in thousands) A Net income before tax $ 3,707 $ 4,284 $ 3,802 $ 4,795 $ 1,258 $ 3,898 B PMAR pre-tax income 791 943 174 - - - C Adjusted net income before tax (A - B) 2,916 3,341 3,628 4,795 1,258 3,898 D Normalized tax provision (C x 30%) 875 1,002 1,088 1,439 376 1,170 E Adjusted net income (C - D) $ 2,041 $ 2,339 $ 2,540 $ 3,356 $ 882 $ 2,728 F Average assets $ 1,308,729 $ 1,349,530 $ 1,330,648 $ 1,364,721 $ 1,389,850 $ 1,410,713 G Average equity $ 116,395 $ 132,305 $ 136,321 $ 141,374 $ 142,616 $ 144,639 H Adjusted ROAA (E * 4 / F) 0.62% 0.69% 0.76% 0.98% 0.25% 0.77% I Adjusted ROAE (E * 4 / G) 7.01% 7.07% 7.45% 9.50% 2.47% 7.54% 22


