bancofcal.com ACQUISITION OF PACIFIC MERCANTILE BANCORP March 2021
2 Forward Looking Statements Forward Looking Statements This investor presentation includes forward-looking information about Banc of California, Inc. (“BoC”), Pacific Mercantile Bancorp (“PMB”) and the combined company after the close of the transaction that is intended to be covered by the “Safe-Harbor” provisions of the Private Securities Litigation Reform Act of 1995. These statements are necessarily subject to risk and uncertainty and actual results could differ materially from those anticipated due to various factors, including those set forth from time to time in the documents filed or furnished by BoC and PMB with the Securities and Exchange Commission (“SEC”). The following factors, among others, could cause actual results to differ from those set forth in the forward-looking statements: (i) the possibility that the merger does not close when expected or at all because required regulatory, shareholder or other approvals, financial tests or other conditions to closing are not received or satisfied on a timely basis or at all; (ii) changes in BoC’s or PMB’s stock price before closing, including as a result of its financial performance prior to closing, or more generally due to broader stock market movements, and the performance of financial companies and peer group companies; (iii) the risk that the benefits from the transaction may not be fully realized or may take longer to realize than expected, including as a result of changes in general economic and market conditions, interest and exchange rates, monetary policy, laws and regulations and their enforcement, and the degree of competition in the geographic and business areas in which BoC and PMB operate; (iv) the ability to promptly and effectively integrate the businesses of BoC and PMB; (v) the reaction to the transaction of the companies’ clients, employees and counterparties; (vi) diversion of management time on merger-related issues; (vii) lower than expected revenues, credit quality deterioration or a reduction in real estate values or a reduction in net earnings; and (viii) other risks that are described in BoC’s and PMB’s public filings with the SEC. You should not place undue reliance on forward-looking statements and BoC and PMB undertake no obligation to update any such statements to reflect circumstances or events that occur after the date on which the forward-looking statement is made. Additional Information About the Merger and Where to Find It Investors and security holders are urged to carefully review and consider each of BoC’s and PMB’s public filings with the SEC, including but not limited to their Annual Reports on Form 10-K, their proxy statements, their Current Reports on Form 8-K and their Quarterly Reports on Form 10-Q. The documents filed by BoC with the SEC may be obtained free of charge at our website at www.bancofcal.com or at the SEC’s website at www.sec.gov. These documents may also be obtained free of charge from BoC by requesting them in writing to Banc of California, Inc., 3 MacArthur Place, Santa Ana, CA 92707; Attention: Investor Relations, by submitting an email request to ir@bancofcal.com or by telephone at (855) 361-2262. The documents filed by PMB with the SEC may be obtained free of charge at PMB’s website at www.pmbank.com or at the SEC’s website at www.sec.gov. These documents may also be obtained free of charge from PMB by requesting them in writing to Pacific Mercantile Bancorp, 949 South Coast Drive, Suite 300, Costa Mesa, CA 92626; Attention: Investor Relations, or by telephone at 714-438-2500. BoC intends to file a registration statement with the SEC which will include a joint proxy statement of BoC and PMB and a prospectus of BoC, and each party will file other documents regarding the proposed transaction with the SEC. Before making any voting or investment decision, investors and security holders of BoC and PMB are urged to carefully read the entire registration statement and joint proxy statement/prospectus, when they become available, as well as any amendments or supplements to these documents, because they will contain important information about the proposed transaction. A definitive joint proxy statement/prospectus will be sent to the shareholders of BoC and PMB seeking any required shareholder approvals. Investors and security holders will be able to obtain the registration statement and the joint proxy statement/prospectus free of charge from the SEC’s website or from BoC or PMB by writing to the addresses provided for each company set forth in the paragraphs above. BoC, PMB, their directors, executive officers and certain other persons may be deemed to be participants in the solicitation of proxies from BoC and PMB shareholders in favor of the approval of the transaction. Information about the directors and executive officers of BoC and their ownership of BoC common stock is set forth in the proxy statement for BoC’s 2020 annual meeting of stockholders, as previously filed with the SEC. Information about the directors and executive officers of PMB and their ownership of PMB common stock is set forth in the proxy statement for PMB’s 2020 annual meeting of shareholders, as previously filed with the SEC. Shareholders may obtain additional information regarding the interests of such participants by reading the registration statement and the joint proxy statement/prospectus when they become available.
3 Strategic Rationale • Quality deposit franchise: • 47% noninterest-bearing deposits (“NIBD”) • 0.27% total cost of deposits (spot rate @ 12/31/2020) • Commercially-focused client base; 100% of PMBC’s top business clients utilize account analysis • Efficient branches in BANC’s existing markets • Liquid balance sheet with 89% loan-to-deposit ratio • Accelerates shift towards lower-cost deposit mix; increases BANC’s NIBD / total deposits from 26% to 30% ¹ • 100% overlap with all acquired branches within two miles of existing BANC branches • Increased scale of pro forma Company will allow for better servicing of clients • BANC management has significant transaction execution and integration experience • Experienced and compatible management teams with shared focus on relationship-based business banking • Complementary business models & cultural fit provide opportunity to foster and expand relationships with SoCal customers • PMBC’s Horizon Analytics technology broadens the value-added services available to BANC’s existing customers • 12.9% EPS accretion in first full year post-closing (2022) • Tangible book value earnback of 2.3 years using crossover method • IRR of 15%+ • Adds $5 million+ recurring noninterest income annually • Pro forma capital ratios well in excess of regulatory minimums • Conservative cost savings assumptions of 35% Improves Deposit & Liquidity Position (Financial Data as of Q4 2020) Low Risk & Significant Efficiency Opportunities Compelling Financial Metrics 1) Pro forma excludes purchase accounting adjustments
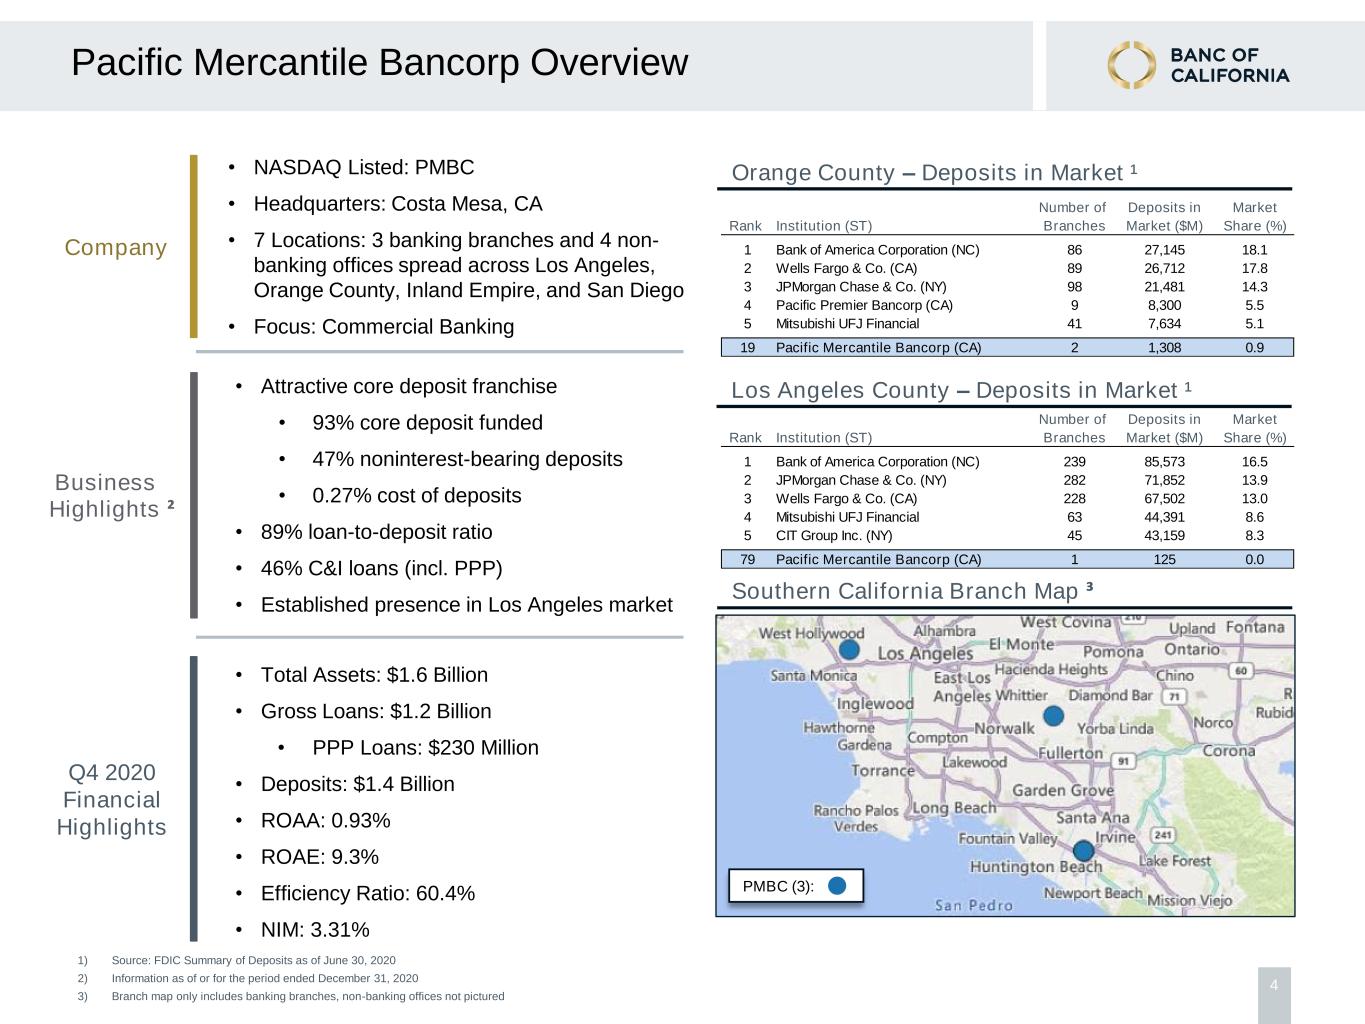
4 Pacific Mercantile Bancorp Overview 1) Source: FDIC Summary of Deposits as of June 30, 2020 2) Information as of or for the period ended December 31, 2020 3) Branch map only includes banking branches, non-banking offices not pictured Company • NASDAQ Listed: PMBC • Headquarters: Costa Mesa, CA • 7 Locations: 3 banking branches and 4 non- banking offices spread across Los Angeles, Orange County, Inland Empire, and San Diego • Focus: Commercial Banking Q4 2020 Financial Highlights • Total Assets: $1.6 Billion • Gross Loans: $1.2 Billion • PPP Loans: $230 Million • Deposits: $1.4 Billion • ROAA: 0.93% • ROAE: 9.3% • Efficiency Ratio: 60.4% • NIM: 3.31% Business Highlights ² • Attractive core deposit franchise • 93% core deposit funded • 47% noninterest-bearing deposits • 0.27% cost of deposits • 89% loan-to-deposit ratio • 46% C&I loans (incl. PPP) • Established presence in Los Angeles market Southern California Branch Map ³ Orange County – Deposits in Market ¹ Los Angeles County – Deposits in Market ¹ Number of Deposits in Market Rank Institution (ST) Branches Market ($M) Share (%) 1 Bank of America Corporation (NC) 86 27,145 18.1 2 Wells Fargo & Co. (CA) 89 26,712 17.8 3 JPMorgan Chase & Co. (NY) 98 21,481 14.3 4 Pacific Premier Bancorp (CA) 9 8,300 5.5 5 Mitsubishi UFJ Financial 41 7,634 5.1 19 Pacific Mercantile Bancorp (CA) 2 1,308 0.9 Number of Deposits in Market Rank Institution (ST) Branches Market ($M) Share (%) 1 Bank of America Corporation (NC) 239 85,573 16.5 2 JPMorgan Chase & Co. (NY) 282 71,852 13.9 3 Wells Fargo & Co. (CA) 228 67,502 13.0 4 Mitsubishi UFJ Financial 63 44,391 8.6 5 CIT Group Inc. (NY) 45 43,159 8.3 79 Pacific Mercantile Bancorp (CA) 1 125 0.0 PMBC (3):
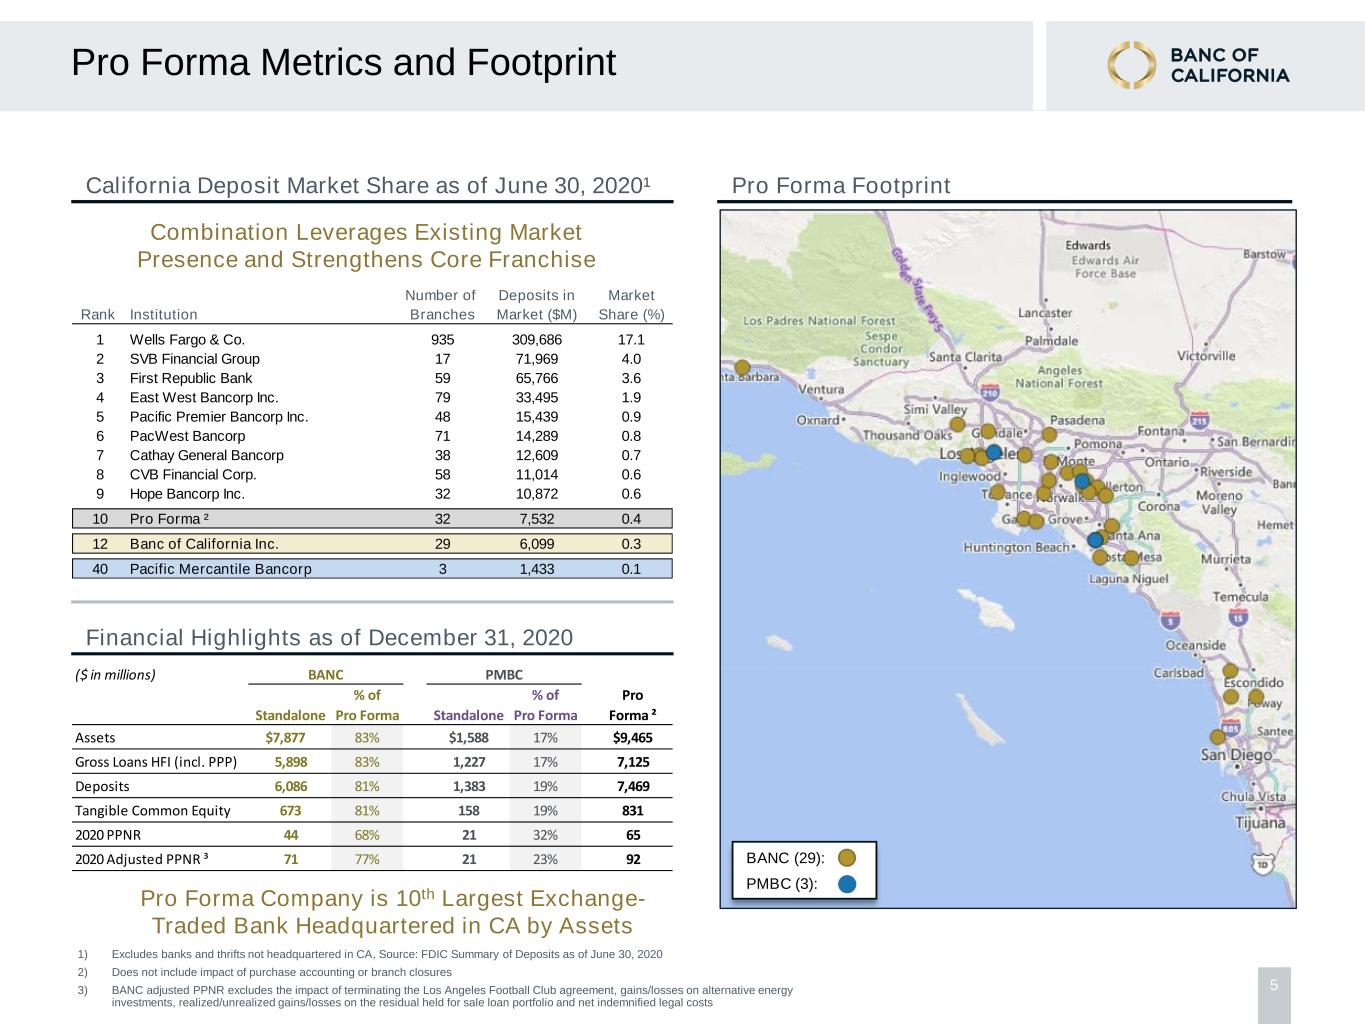
5 Pro Forma Metrics and Footprint 1) Excludes banks and thrifts not headquartered in CA, Source: FDIC Summary of Deposits as of June 30, 2020 2) Does not include impact of purchase accounting or branch closures 3) BANC adjusted PPNR excludes the impact of terminating the Los Angeles Football Club agreement, gains/losses on alternative energy investments, realized/unrealized gains/losses on the residual held for sale loan portfolio and net indemnified legal costs Pro Forma FootprintCalifornia Deposit Market Share as of June 30, 2020¹ Number of Deposits in Market Rank Institution Branches Market ($M) Share (%) 1 Wells Fargo & Co. 935 309,686 17.1 2 SVB Financial Group 17 71,969 4.0 3 First Republic Bank 59 65,766 3.6 4 East West Bancorp Inc. 79 33,495 1.9 5 Pacific Premier Bancorp Inc. 48 15,439 0.9 6 PacWest Bancorp 71 14,289 0.8 7 Cathay General Bancorp 38 12,609 0.7 8 CVB Financial Corp. 58 11,014 0.6 9 Hope Bancorp Inc. 32 10,872 0.6 10 Pro Forma ² 32 7,532 0.4 12 Banc of California Inc. 29 6,099 0.3 40 Pacific Mercantile Bancorp 3 1,433 0.1 BANC (29): PMBC (3): Combination Leverages Existing Market Presence and Strengthens Core Franchise Pro Forma Company is 10th Largest Exchange- Traded Bank Headquartered in CA by Assets Financial Highlights as of December 31, 2020 ($ in millions) BANC PMBC % of % of Pro Standalone Pro Forma Standalone Pro Forma Forma ² Assets $7,877 83% $1,588 17% $9,465 Gross Loans HFI (incl. PPP) 5,898 83% 1,227 17% 7,125 Deposits 6,086 81% 1,383 19% 7,469 Tangible Common Equity 673 81% 158 19% 831 2020 PPNR 44 68% 21 32% 65 2020 Adjusted PPNR ³ 71 77% 21 23% 92
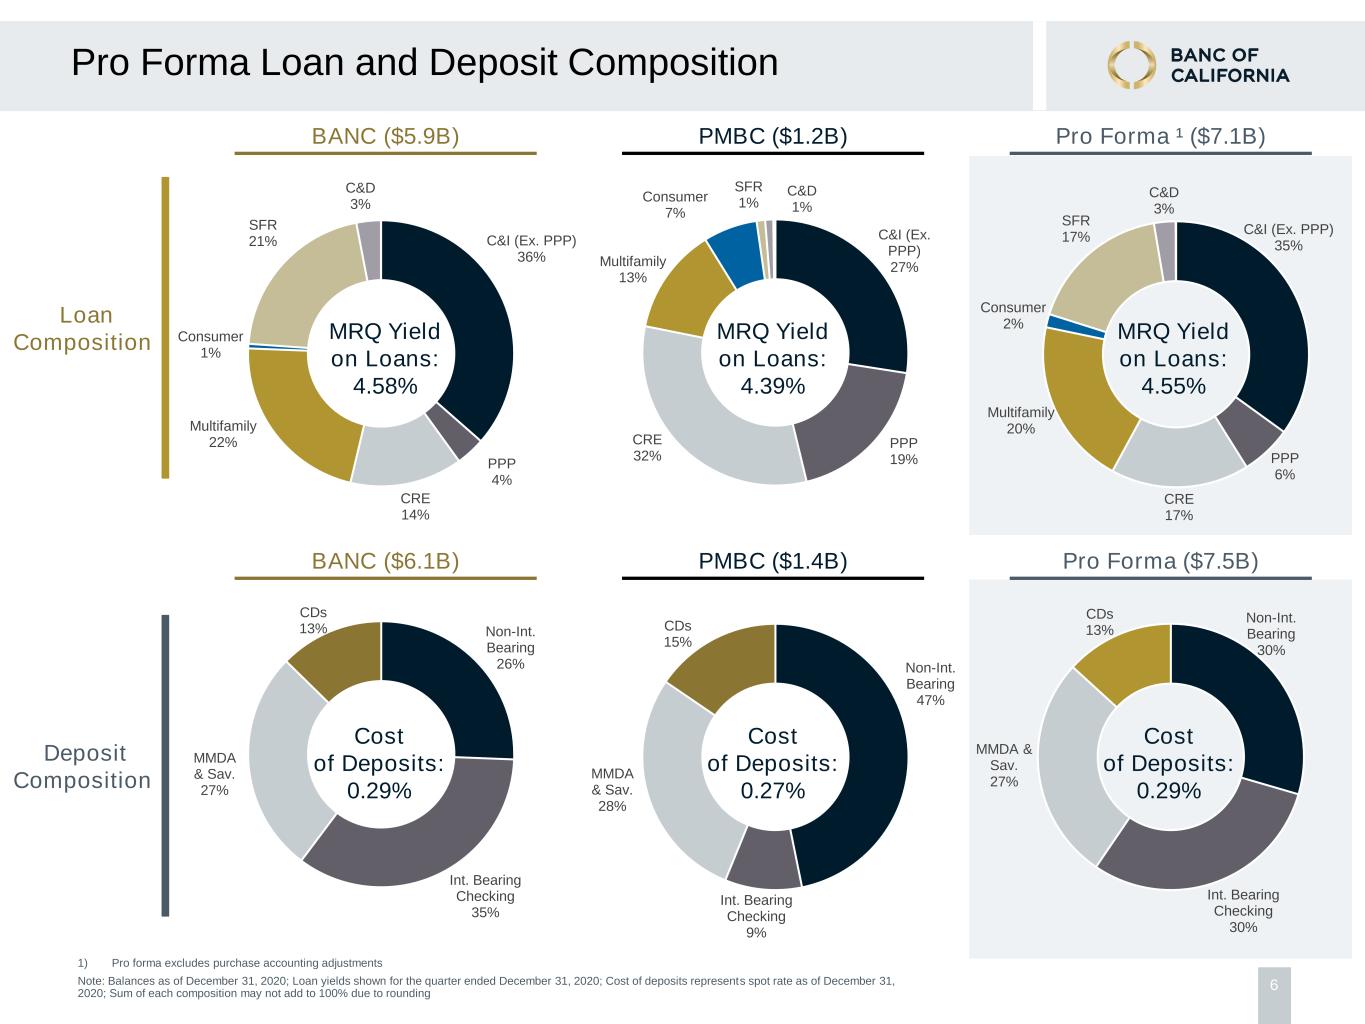
6 Non-Int. Bearing 30% Int. Bearing Checking 30% MMDA & Sav. 27% CDs 13% Non-Int. Bearing 47% Int. Bearing Checking 9% MMDA & Sav. 28% CDs 15% Non-Int. Bearing 26% Int. Bearing Checking 35% MMDA & Sav. 27% CDs 13% C&I (Ex. PPP) 27% PPP 19% CRE 32% Multifamily 13% Consumer 7% SFR 1% C&D 1% C&I (Ex. PPP) 36% PPP 4% CRE 14% Multifamily 22% Consumer 1% SFR 21% C&D 3% C&I (Ex. PPP) 35% PPP 6% CRE 17% Multifamily 20% Consumer 2% SFR 17% C&D 3% Pro Forma Loan and Deposit Composition Loan Composition Deposit Composition PMBC ($1.2B) MRQ Yield on Loans: 4.39% BANC ($5.9B) Pro Forma ¹ ($7.1B) PMBC ($1.4B)BANC ($6.1B) Pro Forma ($7.5B) MRQ Yield on Loans: 4.58% MRQ Yield on Loans: 4.55% Cost of Deposits: 0.27% Cost of Deposits: 0.29% Cost of Deposits: 0.29% 1) Pro forma excludes purchase accounting adjustments Note: Balances as of December 31, 2020; Loan yields shown for the quarter ended December 31, 2020; Cost of deposits represents spot rate as of December 31, 2020; Sum of each composition may not add to 100% due to rounding

7 Transaction Overview Capital Ratios At Close ³ BANC Financial Impact Transaction Valuation Transaction Summary • Per Share Purchase Price¹: • Aggregate Transaction Value¹: • Consideration Mix: • Treatment of In-The-Money Options, RSUs, & RSAs: • Fixed Exchange Ratio: • PMBC Pro Forma Ownership: • Anticipated Closing: • Price / 2022E EPS: • Price / Tangible Book Value: • Core Deposit Premium²: • 2022E EPS Accretion: • Pro Forma TBVPS Dilution at Close: • Tangible Book Value Earnback • IRR: • TCE / TA Ratio: • Tier 1 Leverage: • Tier 1 Capital Ratio: $9.77 $235 million 100% BANC common stock Cashed-out at close 0.50 shares of BANC common stock for each share of PMBC common stock ~19% Q3 2021 15.1x 1.46x 5.9% 12.9% 2.9% 2.3 years 15%+ 8.8% 9.8% 13.0% 1) Implied based on BANC closing stock price of $19.54 as of March 22, 2021. Value at close will be calculated using a volume weighted average price measured over 20 trading days 2) Core deposit premium is calculated as the aggregate transaction value less tangible common equity as a percentage of total deposits less jumbo time deposits, measured as of December 31, 2020 3) Capital ratios include the impact of redemption of Series D preferred stock in Q1 2021 Governance • Two PMBC Directors to join the BANC Board of Directors • Key PMBC management to support BANC in ensuring a successful integration
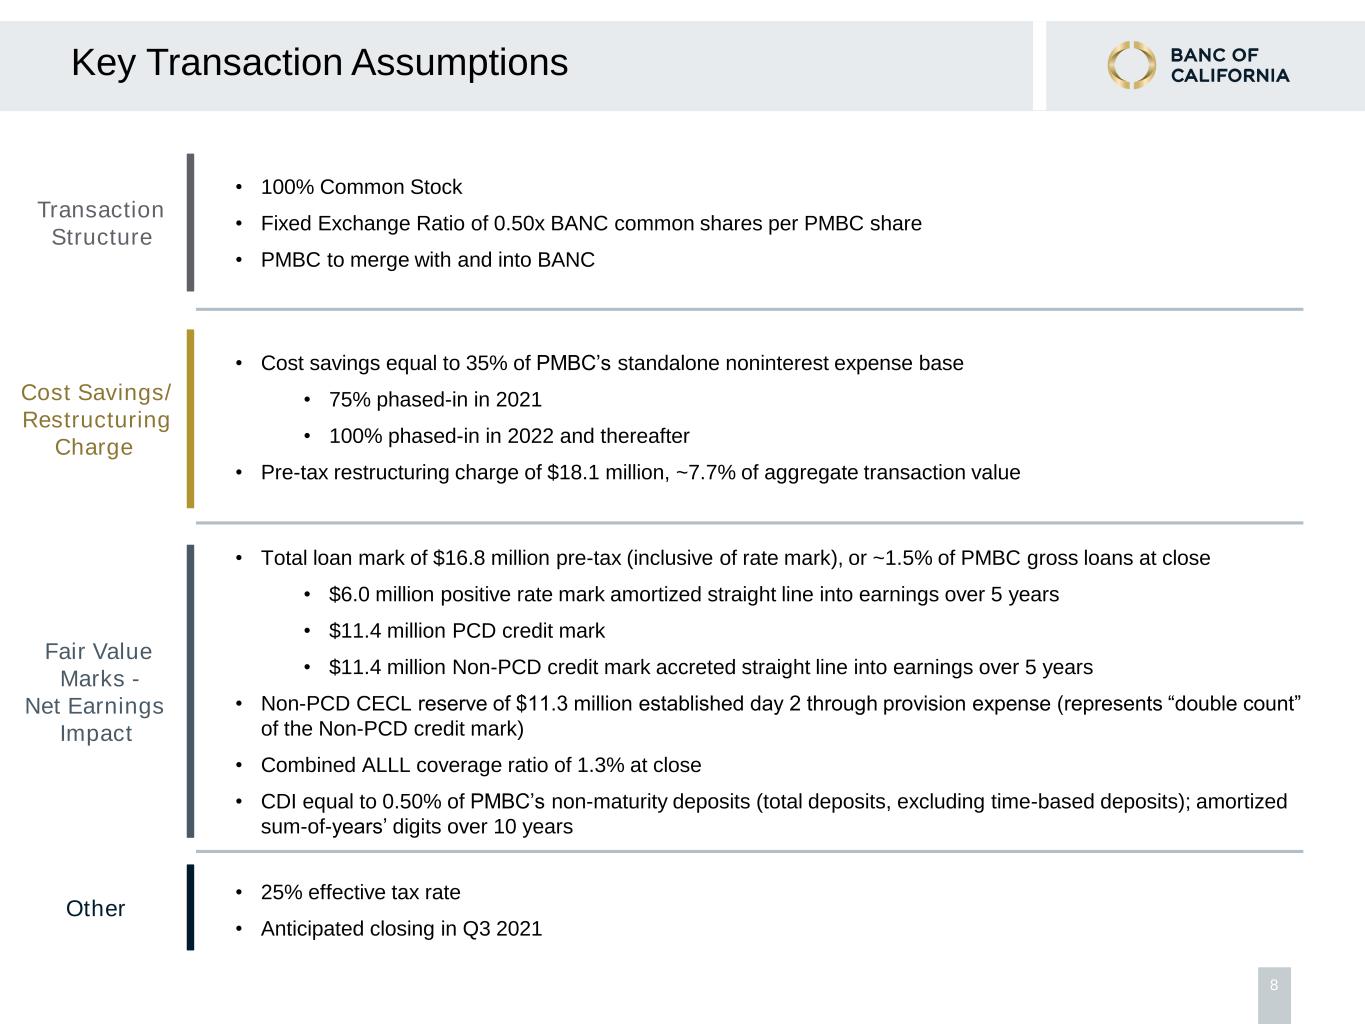
8 Key Transaction Assumptions Other Fair Value Marks - Net Earnings Impact Cost Savings/ Restructuring Charge • Cost savings equal to 35% of PMBC’s standalone noninterest expense base • 75% phased-in in 2021 • 100% phased-in in 2022 and thereafter • Pre-tax restructuring charge of $18.1 million, ~7.7% of aggregate transaction value • Total loan mark of $16.8 million pre-tax (inclusive of rate mark), or ~1.5% of PMBC gross loans at close • $6.0 million positive rate mark amortized straight line into earnings over 5 years • $11.4 million PCD credit mark • $11.4 million Non-PCD credit mark accreted straight line into earnings over 5 years • Non-PCD CECL reserve of $11.3 million established day 2 through provision expense (represents “double count” of the Non-PCD credit mark) • Combined ALLL coverage ratio of 1.3% at close • CDI equal to 0.50% of PMBC’s non-maturity deposits (total deposits, excluding time-based deposits); amortized sum-of-years’ digits over 10 years • 25% effective tax rate • Anticipated closing in Q3 2021 Transaction Structure • 100% Common Stock • Fixed Exchange Ratio of 0.50x BANC common shares per PMBC share • PMBC to merge with and into BANC
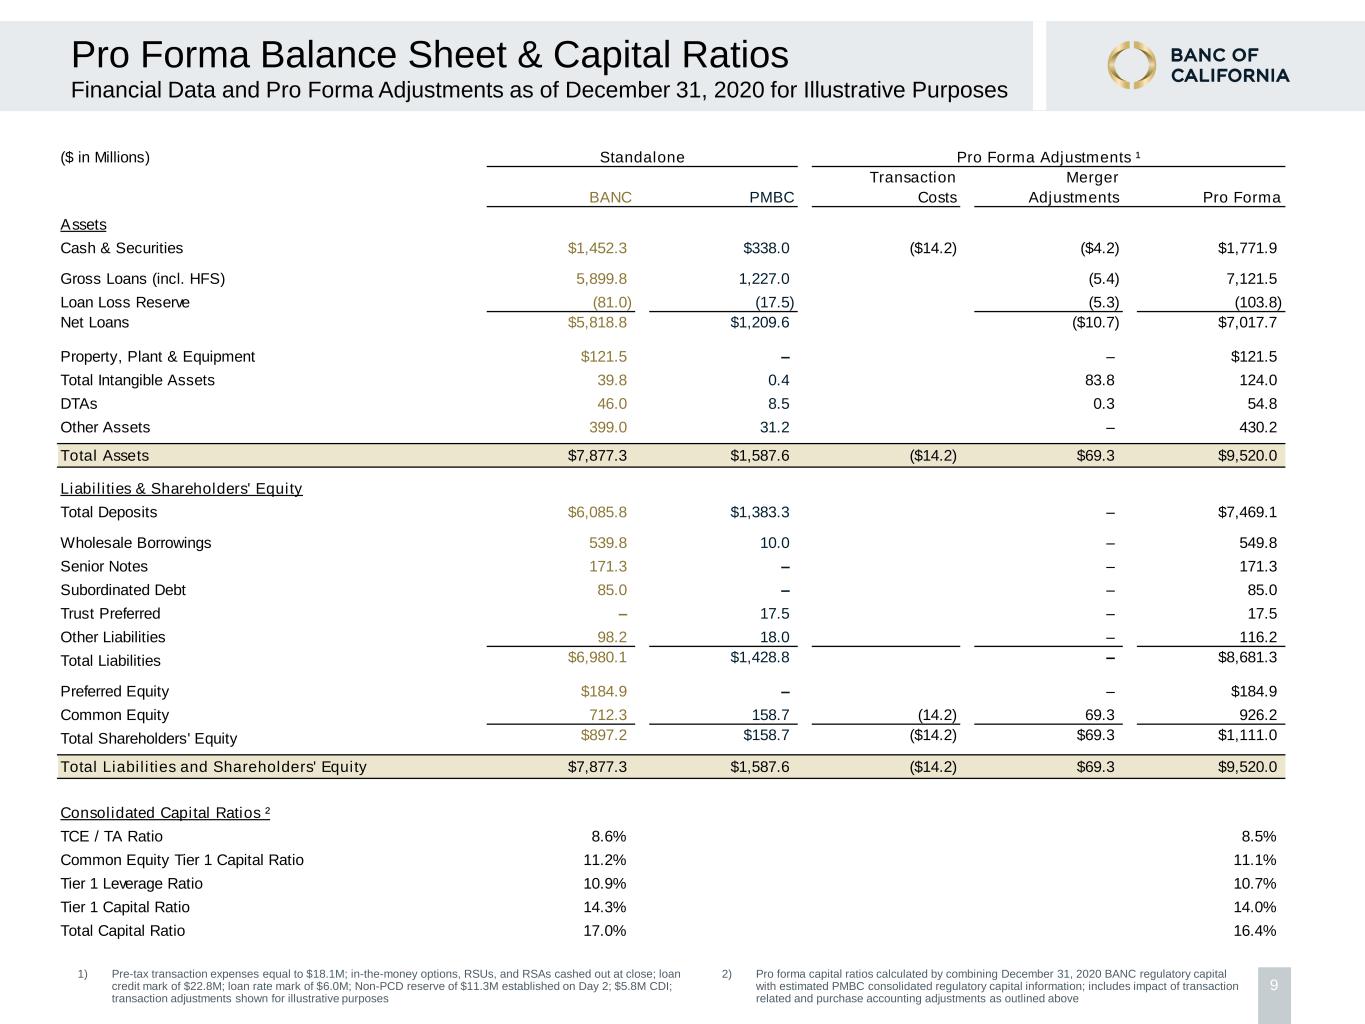
9 Pro Forma Balance Sheet & Capital Ratios 1) Pre-tax transaction expenses equal to $18.1M; in-the-money options, RSUs, and RSAs cashed out at close; loan credit mark of $22.8M; loan rate mark of $6.0M; Non-PCD reserve of $11.3M established on Day 2; $5.8M CDI; transaction adjustments shown for illustrative purposes Financial Data and Pro Forma Adjustments as of December 31, 2020 for Illustrative Purposes 2) Pro forma capital ratios calculated by combining December 31, 2020 BANC regulatory capital with estimated PMBC consolidated regulatory capital information; includes impact of transaction related and purchase accounting adjustments as outlined above ($ in Millions) Standalone Pro Forma Adjustments ¹ Transaction Merger BANC PMBC Costs Adjustments Pro Forma Assets Cash & Securities $1,452.3 $338.0 ($14.2) ($4.2) $1,771.9 Gross Loans (incl. HFS) 5,899.8 1,227.0 (5.4) 7,121.5 Loan Loss Reserve (81.0) (17.5) (5.3) (103.8) Net Loans $5,818.8 $1,209.6 ($10.7) $7,017.7 Property, Plant & Equipment $121.5 – – $121.5 Total Intangible Assets 39.8 0.4 83.8 124.0 DTAs 46.0 8.5 0.3 54.8 Other Assets 399.0 31.2 – 430.2 Total Assets $7,877.3 $1,587.6 ($14.2) $69.3 $9,520.0 Liabilities & Shareholders' Equity Total Deposits $6,085.8 $1,383.3 – $7,469.1 Wholesale Borrowings 539.8 10.0 – 549.8 Senior Notes 171.3 – – 171.3 Subordinated Debt 85.0 – – 85.0 Trust Preferred – 17.5 – 17.5 Other Liabilities 98.2 18.0 – 116.2 Total Liabilities $6,980.1 $1,428.8 – $8,681.3 Preferred Equity $184.9 – – $184.9 Common Equity 712.3 158.7 (14.2) 69.3 926.2 Total Shareholders' Equity $897.2 $158.7 ($14.2) $69.3 $1,111.0 Total Liabilities and Shareholders' Equity $7,877.3 $1,587.6 ($14.2) $69.3 $9,520.0 Consolidated Capital Ratios ² TCE / TA Ratio 8.6% 8.5% Common Equity Tier 1 Capital Ratio 11.2% 11.1% Tier 1 Leverage Ratio 10.9% 10.7% Tier 1 Capital Ratio 14.3% 14.0% Total Capital Ratio 17.0% 16.4%


