UNITED STATES
SECURITIES AND EXCHANGE COMMISSION
Washington, D.C. 20549
FORM N-CSR
CERTIFIED SHAREHOLDER REPORT OF REGISTERED
MANAGEMENT INVESTMENT COMPANIES
| Investment Company Act file number | 811-09911 | |
Hussman Investment Trust
(Exact name of registrant as specified in charter)
6021 University Boulevard, Suite 490 Ellicott City, Maryland | 21043 |
| (Address of principal executive offices) | (Zip code) |
David K. James
Ultimus Fund Solutions, LLC 225 Pictoria Drive, Suite 450 Cincinnati, Ohio 45246
(Name and address of agent for service)
| Registrant's telephone number, including area code: | (513) 587-3400 | |
| Date of fiscal year end: | June 30 | |
| | | |
| Date of reporting period: | June 30, 2024 | |
Form N-CSR is to be used by management investment companies to file reports with the Commission not later than 10 days after the transmission to stockholders of any report that is required to be transmitted to stockholders under Rule 30e-1 under the Investment Company Act of 1940 (17 CFR 270.30e-1). The Commission may use the information provided on Form N-CSR in its regulatory, disclosure review, inspection, and policymaking roles.
A registrant is required to disclose the information specified by Form N-CSR, and the Commission will make this information public. A registrant is not required to respond to the collection of information contained in Form N-CSR unless the Form displays a currently valid Office of Management and Budget (“OMB”) control number. Please direct comments concerning the accuracy of the information collection burden estimate and any suggestions for reducing the burden to Secretary, Securities and Exchange Commission, 450 Fifth Street, NW, Washington, DC 20549-0609. The OMB has reviewed this collection of information under the clearance requirements of 44 U.S.C. § 3507.
Explanatory Note: The Registrant is filing this amendment to its Form N-CSR for the reporting period ended June 30, 2024, originally filed with the Securities and Exchange Commission on September 6, 2024 (Accession Number 0001398344-24-017491). The sole purpose of this amendment is to correct Item 7. Financial Statements and Financial Highlights for Open-End Management Investment Companies – to remove the word “Unaudited” from the Report of Independent Registered Public Accounting Firm. Except as set forth above, this amendment does not amend, update or change any other items or disclosures found in the original Form N-CSR filing.
Item 1. Reports to Stockholders.
Hussman Strategic Growth Fund
Annual Shareholder Report - June 30, 2024
This annual shareholder report contains important information about Hussman Strategic Growth Fund for the period of July 1, 2023 to June 30, 2024. You can find additional information about the Fund at https://funddocs.filepoint.com/hussman/. You can also request this information by contacting us at (800) 487-7626.
What were the Fund’s costs for the last year?
(based on a hypothetical $10,000 investment)
| Fund Name | Costs of a $10,000 investment | Costs paid as a percentage of a $10,000 investment |
|---|
| Hussman Strategic Growth Fund | $115 | 1.15% |
How did the Fund perform during the reporting period?
During the fiscal year ended June 30, 2024, our most reliable equity market valuation measures reached the steepest extreme in U.S. financial history, exceeding levels observed at the 1929 and 2000 peaks. Narrow speculation among a handful of large-cap technology stocks, coupled with growing divergence across a broader range of market internals, continued to suggest underlying risk-aversion among investors. Weakness in leading economic measures, particularly new orders, backlogs, and a shift in labor composition from full-time to part-time employment, remained at levels consistent with emerging risk of recession. Short and intermediate-term market action also became increasingly overextended during this period.
Amid these conditions, the Fund maintained a defensively hedged investment stance, consistent with its long-term, full-cycle, risk-managed discipline. The Adviser continues to view the 2022-2024 period as the extended peak of the third great speculative bubble in U.S. history. Given its intentionally defensive stance, the Fund’s performance during the fiscal year did not materially deviate from what could be expected approaching such extremes. The -8.72% total return of the Fund was attributable partly to the difference in performance between the stocks held by the Fund and the indices used to hedge, and partly to the loss of time value on defensive index put option positions. The Fund’s investment stance is expected to change in response to shifts in observable market conditions.
The following equity holdings achieved gains in excess of $2 million during the fiscal year ended June 30, 2024: Super Micro Computer, Meta Platforms, Sweetgreen, AppLovin, Alphabet, NetApp, Hibbett Sports, Amazon and ACM Research. Equity holdings with portfolio losses in excess of $2 million during this period were Canadian Solar, SolarEdge Technologies, United Natural Foods and Array Tech.
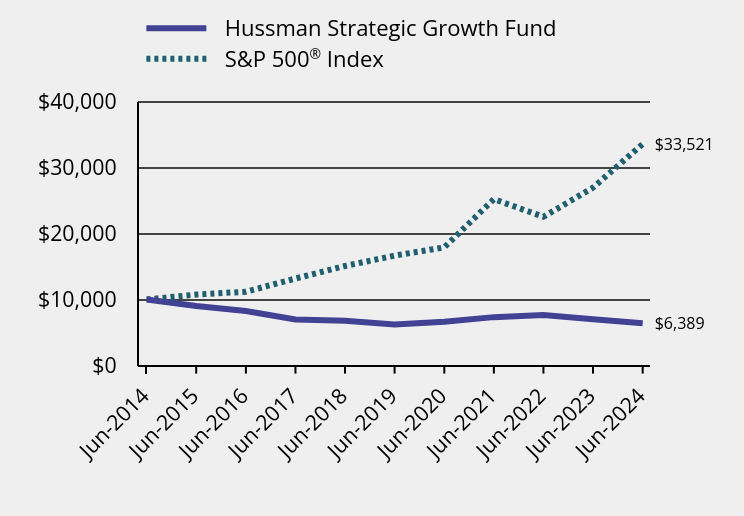
How has the Fund performed over the last ten years?
Total Return Based on $10,000 Investment
| Hussman Strategic Growth Fund | S&P 500® Index |
|---|
| Jun-2014 | $10,000 | $10,000 |
| Jun-2015 | $9,001 | $10,742 |
| Jun-2016 | $8,251 | $11,171 |
| Jun-2017 | $6,970 | $13,170 |
| Jun-2018 | $6,774 | $15,064 |
| Jun-2019 | $6,229 | $16,633 |
| Jun-2020 | $6,613 | $17,881 |
| Jun-2021 | $7,327 | $25,175 |
| Jun-2022 | $7,652 | $22,503 |
| Jun-2023 | $6,999 | $26,912 |
| Jun-2024 | $6,389 | $33,521 |
Average Annual Total Returns
| 1 Year | 5 Years | 10 Years |
|---|
| Hussman Strategic Growth Fund | | 0.51% | |
S&P 500® Index | 24.56% | 15.05% | 12.86% |
Past performance does not ensure future results.The graph and table do not reflect deduction of taxes that a shareholder would pay on fund distributions or redemption of fund shares. To the extent the Fund established leveraged or hedged investment positions as part of its investment program, its investment performance may deviate significantly from the performance of major stock indices for substantial portions of the market cycle. Call
(800) 487-7626 or visit https://funddocs.filepoint.com/hussman/ for current month end performance.
- Net Assets$323,686,535
- Number of Portfolio Holdings209
- Advisory Fee (net of waivers & recoupments)$3,530,509
- Portfolio Turnover113%
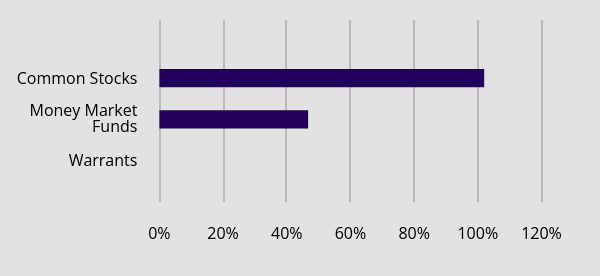
Asset Weighting (% of total investments)
| Value | Value |
|---|
| Warrants | 0.0% |
| Money Market Funds | 46.7% |
| Common Stocks | 102.0% |
As of June 30, 2024, 99.3% of the value of the Fund's equity investments were hedged with option combinations (long put options/short call options) on the S&P 500® Index and Russell 2000 Index.
What did the Fund invest in?
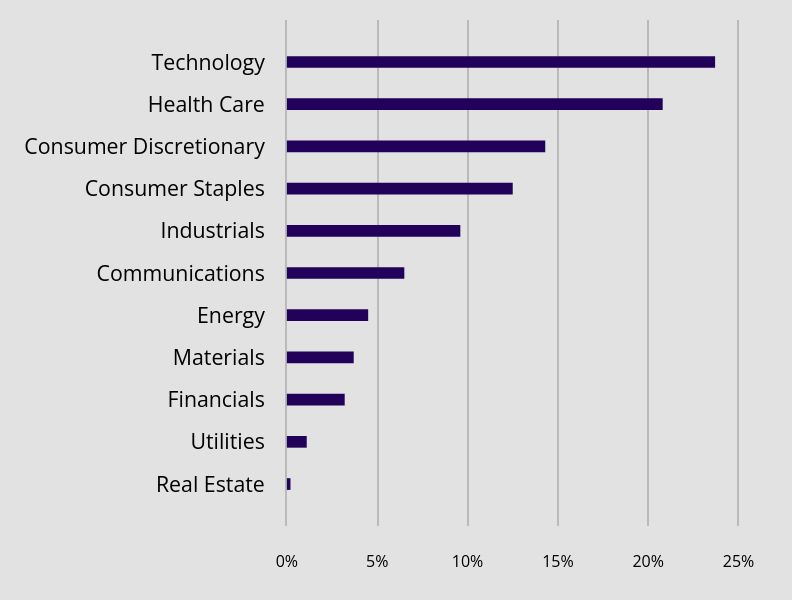
Sector Weighting (% of common stocks)
| Value | Value |
|---|
| Real Estate | 0.2% |
| Utilities | 1.1% |
| Financials | 3.2% |
| Materials | 3.7% |
| Energy | 4.5% |
| Communications | 6.5% |
| Industrials | 9.6% |
| Consumer Staples | 12.5% |
| Consumer Discretionary | 14.3% |
| Health Care | 20.8% |
| Technology | 23.7% |
Top 10 Equity Holdings (% of net assets)
| Holding Name | % of Net Assets |
| Novo Nordisk A/S - ADR | 1.8% |
| ACM Research, Inc. - Class A | 1.4% |
| Amgen, Inc. | 1.2% |
| Hershey Company (The) | 1.1% |
| Sweetgreen, Inc. - Class A | 1.1% |
| Campbell Soup Company | 1.1% |
| Akamai Technologies, Inc. | 1.1% |
| Cognizant Technology Solutions Corporation - Class A | 1.1% |
| Neurocrine Biosciences, Inc. | 1.0% |
| Verizon Communications, Inc. | 1.0% |
No material changes occurred during the year ended June 30, 2024.
Hussman Strategic Growth Fund (HSGFX)
Annual Shareholder Report - June 30, 2024
Where can I find additional information about the Fund?
Additional information is available on the Fund's website (https://funddocs.filepoint.com/hussman/), including its:
Prospectus
Financial information
Holdings
Proxy voting information
Hussman Strategic Allocation Fund
Annual Shareholder Report - June 30, 2024
This annual shareholder report contains important information about Hussman Strategic Allocation Fund for the period of July 1, 2023 to June 30, 2024. You can find additional information about the Fund at https://funddocs.filepoint.com/hussman/. You can also request this information by contacting us at (800) 487-7626.
What were the Fund’s costs for the last year?
(based on a hypothetical $10,000 investment)
| Fund Name | Costs of a $10,000 investment | Costs paid as a percentage of a $10,000 investment |
|---|
| Hussman Strategic Allocation Fund | $125 | 1.25% |
How did the Fund perform during the reporting period?
During the fiscal year ended June 30, 2024, our most reliable equity market valuation measures reached the steepest extreme in U.S. financial history, exceeding levels observed at the 1929 and 2000 peaks. Narrow speculation among a handful of large-cap technology stocks, coupled with growing divergence across a broader range of market internals, continued to suggest underlying risk-aversion among investors. Weakness in leading economic measures, particularly new orders, backlogs, and a shift in labor composition from full-time to part-time employment, remained at levels consistent with emerging risk of recession. Short and intermediate-term market action also became increasingly overextended during this period.
The Adviser continues to view the 2022-2024 period as the extended peak of the third great speculative bubble in U.S. history. Amid these conditions, the Fund maintained a largely hedged investment stance in equities, consistent with its long-term, full-cycle, risk-managed discipline. Short-term Treasury bill yields remained above 5% during the fiscal year, with lower yields prevailing on longer-term Treasury securities. The Fund held positions in bonds across the maturity spectrum, with an average duration of 2-4 years, and approximately 40-50% of bond holdings in Treasury inflation-protected securities. The 1.43% total return of the Fund reflected positive returns in the Fund’s fixed income holdings, while the hedged equity segment of the portfolio reduced overall performance due to a difference in performance between the stocks held by the Fund and the indices used to hedge. The Fund’s investment stance is expected to change in response to shifts in observable market conditions.
The following equity holdings achieved gains in excess of $100,000: Super Micro Computer, Meta Platforms, Sweetgreen, AppLovin, Alphabet, NetApp, Amazon and ACM Research. Equity holdings with portfolio losses in excess of $100,000 were Canadian Solar, SolarEdge Technologies, United Natural Foods and Array Tech.
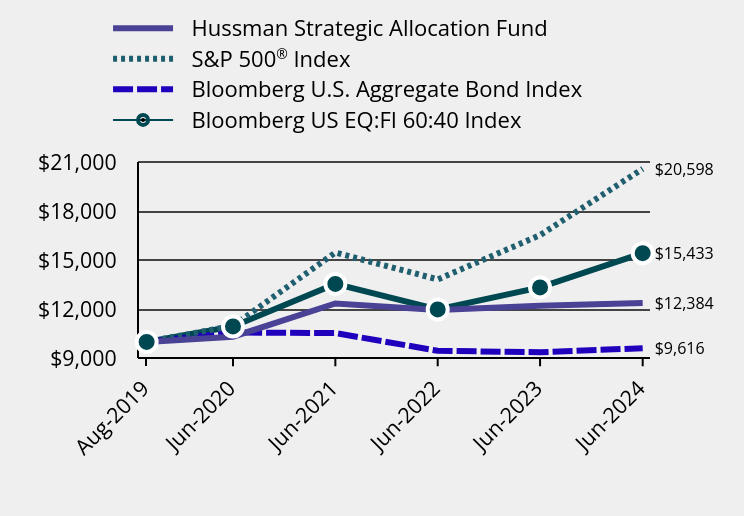
How has the Fund performed since inception?
Total Return Based on $10,000 Investment
| Hussman Strategic Allocation Fund | S&P 500® Index | Bloomberg U.S. Aggregate Bond Index | Bloomberg US EQ:FI 60:40 Index |
|---|
| Aug-2019 | $10,000 | $10,000 | $10,000 | $10,000 |
| Jun-2020 | $10,323 | $10,988 | $10,579 | $10,950 |
| Jun-2021 | $12,357 | $15,470 | $10,543 | $13,554 |
| Jun-2022 | $11,963 | $13,828 | $9,458 | $11,992 |
| Jun-2023 | $12,210 | $16,537 | $9,369 | $13,340 |
| Jun-2024 | $12,384 | $20,598 | $9,616 | $15,433 |
Average Annual Total Returns
| 1 Year | Since Inception (August 27, 2019) |
|---|
| Hussman Strategic Allocation Fund | 1.43% | 4.51% |
S&P 500® Index | 24.56% | 16.09% |
| Bloomberg U.S. Aggregate Bond Index | 2.63% | |
| Bloomberg US EQ:FI 60:40 Index | 15.69% | 9.37% |
Past performance does not ensure future results.The graph and table do not reflect deduction of taxes that a shareholder would pay on fund distributions or redemption of fund shares. To the extent the Fund established leveraged or hedged investment positions as part of its investment program, its investment performance may deviate significantly from the performance of major stock indices for substantial portions of the market cycle. Call
(800) 487-7626 or visit https://funddocs.filepoint.com/hussman/ for current month end performance.
- Net Assets$26,587,431
- Number of Portfolio Holdings219
- Advisory Fee (net of waivers)$0
- Portfolio Turnover129%
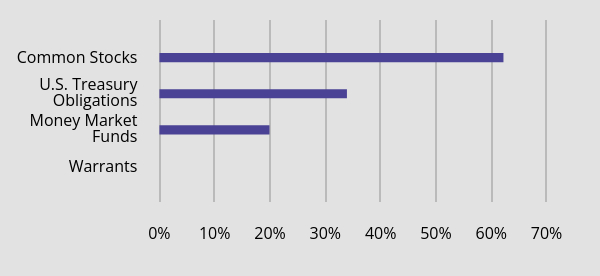
Asset Weighting (% of total investments)
| Value | Value |
|---|
| Warrants | 0.0% |
| Money Market Funds | 19.9% |
| U.S. Treasury Obligations | 33.9% |
| Common Stocks | 62.2% |
As of June 30, 2024, 89.4% of the value of the Fund's equity investments were hedged with option combinations (long put options/short call options) on the S&P 500® Index and Russell 2000 Index.
What did the Fund invest in?
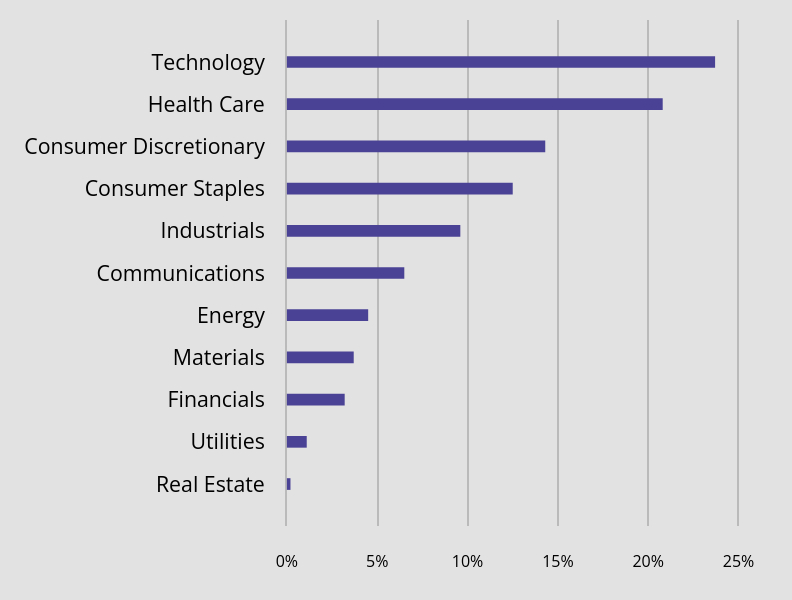
Sector Weighting (% of common stocks)
| Value | Value |
|---|
| Real Estate | 0.2% |
| Utilities | 1.1% |
| Financials | 3.2% |
| Materials | 3.7% |
| Energy | 4.5% |
| Communications | 6.5% |
| Industrials | 9.6% |
| Consumer Staples | 12.5% |
| Consumer Discretionary | 14.3% |
| Health Care | 20.8% |
| Technology | 23.7% |
Top 10 Holdings (% of net assets)
| Holding Name | % of Net Assets |
| U.S. Treasury Bills, 5.333%, due 10/31/24 | 7.4% |
| U.S. Treasury Bills, 5.318%, due 12/12/24 | 7.3% |
| U.S. Treasury Inflation-Protected Notes, 0.125%, due 04/15/26 | 4.3% |
| U.S. Treasury Notes, 4.500%, due 03/31/26 | 3.8% |
| U.S. Treasury Inflation-Protected Notes, 0.125%, due 01/15/31 | 2.0% |
| U.S. Treasury Inflation-Protected Notes, 0.125%, due 04/15/27 | 1.9% |
| U.S. Treasury Inflation-Protected Bonds, 2.125%, due 02/15/54 | 1.9% |
| U.S. Treasury Inflation-Protected Notes, 1.750%, due 01/15/34 | 1.9% |
| U.S. Treasury Notes, 0.625%, due 08/15/30 | 1.5% |
| U.S. Treasury Bond, 3.000%, due 05/15/47 | 1.5% |
No material changes occurred during the year ended June 30, 2024.
Hussman Strategic Allocation Fund (HSAFX)
Annual Shareholder Report - June 30, 2024
Where can I find additional information about the Fund?
Additional information is available on the Fund's website (https://funddocs.filepoint.com/hussman/), including its:
Prospectus
Financial information
Holdings
Proxy voting information
Hussman Strategic Total Return Fund
Annual Shareholder Report - June 30, 2024
This annual shareholder report contains important information about Hussman Strategic Total Return Fund for the period of July 1, 2023 to June 30, 2024. You can find additional information about the Fund at https://funddocs.filepoint.com/hussman/. You can also request this information by contacting us at (800) 487-7626.
What were the Fund’s costs for the last year?
(based on a hypothetical $10,000 investment)
| Fund Name | Costs of a $10,000 investment | Costs paid as a percentage of a $10,000 investment |
|---|
| Hussman Strategic Total Return Fund | $75 | 0.75% |
How did the Fund perform during the reporting period?
During the fiscal year ended June 30, 2024, short-term Treasury bill yields remained above 5%, with lower yields prevailing on longer-term Treasury securities. The Fund held positions in Treasury securities across the maturity spectrum, with an average duration of 2-4 years, and approximately 40-60% of bond holdings in Treasury inflation-protected securities.
The Fund held varying exposure in the stocks of companies in the precious metals industry, ranging between 5-15% of net assets. Historically, the strongest performance of precious metals shares has typically emerged either during periods of falling interest rates, or amid quite rapid and accelerating inflation. While inflationary pressures abated during the year, a combination of declining interest rates and emerging economic weakness continued to support exposure to this sector. The Fund held relatively smaller exposures in shares of companies in the utility and energy industries during the year. The Fund’s investment stance is expected to change in response to shifts in observable market conditions.
The 6.73% total return of the Fund during the fiscal year benefited from both the fixed income and equity holdings in the portfolio. The Fund has outperformed its benchmark, the Bloomberg U.S. Aggregate Total Return Index, for the past 1, 3, 5, 7, and 10 years, as well as since the Fund’s inception on September 12, 2002.
The following holdings achieved portfolio gains in excess of $250,000: Agnico Eagle Mines, NRG Energy, Anglogold Ashanti, Barrick Gold, Kinross Gold, SM Energy and a two U.S. Treasury Notes maturing in 2024 and 2025. Portfolio holdings with a loss in excess of $250,000 during this period were B2Gold and UGI.
How has the Fund performed over the last ten years?
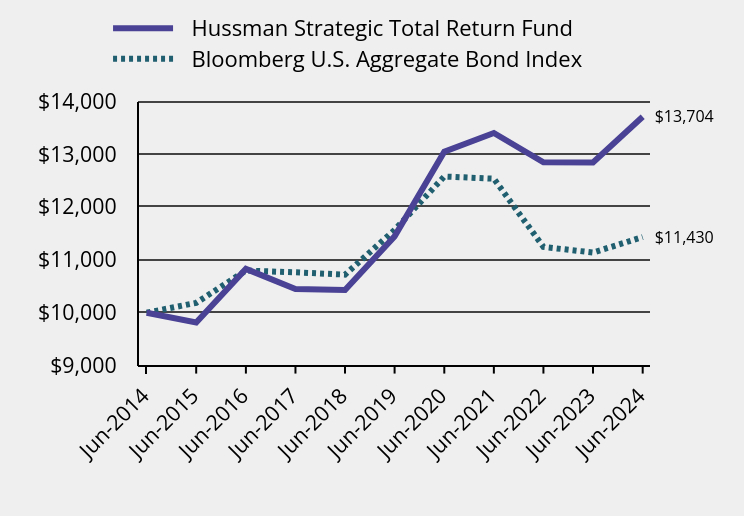
Total Return Based on $10,000 Investment
| Hussman Strategic Total Return Fund | Bloomberg U.S. Aggregate Bond Index |
|---|
| Jun-2014 | $10,000 | $10,000 |
| Jun-2015 | $9,814 | $10,186 |
| Jun-2016 | $10,828 | $10,797 |
| Jun-2017 | $10,449 | $10,763 |
| Jun-2018 | $10,430 | $10,720 |
| Jun-2019 | $11,443 | $11,564 |
| Jun-2020 | $13,045 | $12,575 |
| Jun-2021 | $13,397 | $12,533 |
| Jun-2022 | $12,843 | $11,243 |
| Jun-2023 | $12,839 | $11,137 |
| Jun-2024 | $13,704 | $11,430 |
Average Annual Total Returns
| 1 Year | 5 Years | 10 Years |
|---|
| Hussman Strategic Total Return Fund | 6.73% | 3.67% | 3.20% |
| Bloomberg U.S. Aggregate Bond Index | 2.63% | | 1.35% |
Past performance does not ensure future results.The graph and table do not reflect deduction of taxes that a shareholder would pay on fund distributions or redemption of fund shares. Call (800) 487-7626 or visit https://funddocs.filepoint.com/hussman/ for current month end performance.
- Net Assets$179,751,748
- Number of Portfolio Holdings53
- Advisory Fee (net of waivers)$847,014
- Portfolio Turnover55%
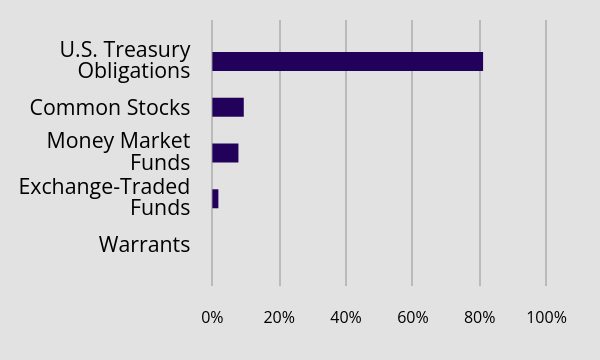
Asset Weighting (% of total investments)
| Value | Value |
|---|
| Warrants | 0.0% |
| Exchange-Traded Funds | 1.8% |
| Money Market Funds | 7.8% |
| Common Stocks | 9.4% |
| U.S. Treasury Obligations | 81.0% |
What did the Fund invest in?
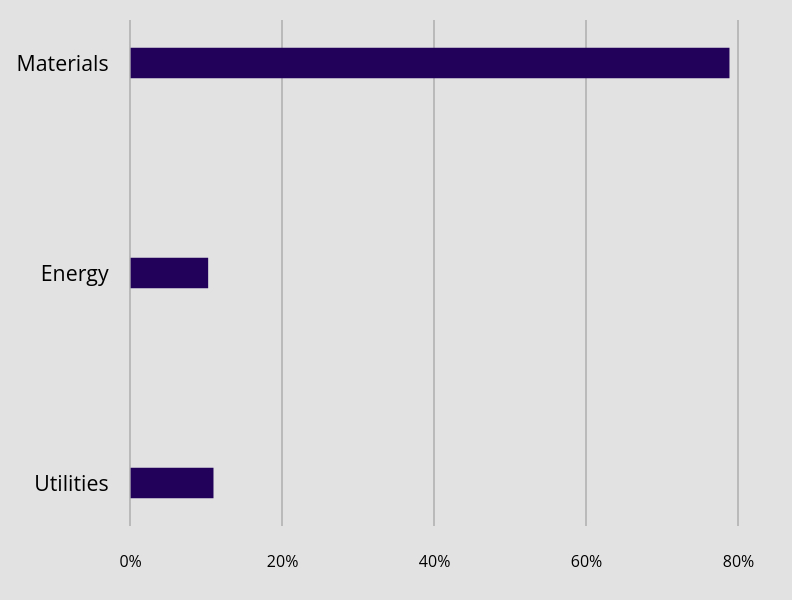
Sector Weighting (% of common stocks)
| Value | Value |
|---|
| Utilities | 10.9% |
| Energy | 10.2% |
| Materials | 78.8% |
Top 10 Holdings (% of net assets)
| Holding Name | % of Net Assets |
| U.S. Treasury Inflation-Protected Notes, 0.125%, due 04/15/27 | 11.6% |
| U.S. Treasury Bills, 5.318%, due 12/12/24 | 10.9% |
| U.S. Treasury Inflation-Protected Notes, 2.500%, due 01/15/29 | 8.3% |
| U.S. Treasury Notes, 1.375%, due 01/31/25 | 8.2% |
| U.S. Treasury Inflation-Protected Notes, 0.125%, due 04/15/26 | 6.4% |
| U.S. Treasury Inflation-Protected Notes, 0.125%, due 01/15/30 | 6.1% |
| U.S. Treasury Inflation-Protected Notes, 0.125%, due 01/15/31 | 5.9% |
| U.S. Treasury Notes, 4.500%, due 03/31/26 | 5.5% |
| U.S. Treasury Notes, 2.125%, due 05/31/26 | 5.3% |
| U.S. Treasury Notes, 1.500%, due 08/15/26 | 5.2% |
No material changes occurred during the year ended June 30, 2024.
Hussman Strategic Total Return Fund (HSTRX)
Annual Shareholder Report - June 30, 2024
Where can I find additional information about the Fund?
Additional information is available on the Fund's website (https://funddocs.filepoint.com/hussman/), including its:
Prospectus
Financial information
Holdings
Proxy voting information
Item 2. Code of Ethics.
As of the end of the period covered by this report, the registrant has adopted a code of ethics that applies to the registrant’s principal executive officer, principal financial officer, principal accounting officer or controller, or persons performing similar functions, regardless of whether these individuals are employed by the registrant or a third party. Pursuant to Item 13(a)(1), a copy of registrant’s code of ethics is filed as an exhibit to this Form N-CSR. During the period covered by this report, the code of ethics has not been amended, and the registrant has not granted any waivers, including implicit waivers, from the provisions of the code of ethics.
Item 3. Audit Committee Financial Expert.
The registrant’s board of trustees has determined that the registrant does not have an audit committee financial expert serving on its audit committee. The audit committee determined that, although none of its members meet the technical definition of an audit committee financial expert, the members have sufficient financial expertise to address any issues that are likely to come before the committee. After evaluation of the accounting environment within which the registrant operates, it was the consensus of the audit committee members that it is not necessary at the present time for the committee to seek to recruit an additional trustee who would qualify as an audit committee financial expert. It was the view of the committee that, if novel issues ever arise, it will hire an expert to assist it as needed.
Item 4. Principal Accountant Fees and Services.
| (a) | Audit Fees. The aggregate fees billed for professional services rendered by the principal accountant for the audit of the registrant’s annual financial statements or for services that are normally provided by the accountant in connection with statutory and regulatory filings or engagements were $48,000 and $48,000 with respect to the registrant’s fiscal years ended June 30, 2024 and 2023, respectively. |
| (b) | Audit-Related Fees. No fees were billed during the fiscal years ended June 30, 2024 and 2023 for assurance and related services by the principal accountant that are reasonably related to the performance of the audit of the registrant’s financial statements and are not reported under paragraph (a) of this Item. |
| (c) | Tax Fees. The aggregate fees billed for professional services rendered by the principal accountant for tax compliance, tax advice, and tax planning were $12,000 and $16,000 with respect to the registrant’s fiscal years ended June 30, 2024 and 2023, respectively. The services comprising these fees include the preparation of the registrant’s federal income tax returns and the preparation of the Funds’ excise tax returns (which includes review of the Funds’ required distributions). |
| (d) | All Other Fees. No fees were billed in either of the last two fiscal years for products and services provided by the principal accountant, other than the services reported in paragraphs (a) through (c) of this Item. |
| (e)(1) | The audit committee has adopted pre-approval policies and procedures described in paragraph (c)(7) of Rule 2-01 of Regulation S-X. Pursuant to the pre-approval policies and procedures, the audit committee has pre-approved certain audit, audit-related and tax services and has established, with respect to each fiscal year of the registrant, the following maximum fee levels for services covered under the pre-approval policies and procedures: |
| · | Services associated with SEC registration statements filed by the registrant with the SEC or other documents issued by the registrant in connection with securities offerings and assistance in responding to SEC comment letters – $6,000 |
| · | Consultations with management of the registrant as to the accounting or disclosure treatment of transactions or events and/or the actual or potential impact of final or proposed rules, standards or interpretations by the SEC, PCAOB or other regulatory or standard setting bodies – $6,000 |
| · | All additional tax services provided to the registrant in the aggregate – $6,000 |
| | | |
| (e)(2) | None of the services described in paragraph (b) through (d) of this Item were approved by the audit committee pursuant to paragraph (c)(7)(i)(C) of Rule 2-01 of Regulation S-X. |
| (f) | Less than 50% of hours expended on the principal accountant’s engagement to audit the registrant’s financial statements for the most recent fiscal year were attributed to work performed by persons other than the principal accountant’s full-time, permanent employees. |
| (g) | During the fiscal years ended June 30, 2024 and 2023, aggregate non-audit fees of $12,000 and $16,000, respectively, were billed by the registrant’s principal accountant for services rendered to the registrant. No non-audit fees were billed in either of the last two fiscal years by the registrant’s principal accountant for services rendered to the registrant’s investment adviser (not including any sub-adviser whose role is primarily portfolio management and is subcontracted with or overseen by another investment adviser), and any entity controlling, controlled by, or under common control with the adviser that provides ongoing services to the registrant. |
| (h) | The principal accountant has not provided any non-audit services to the registrant’s investment adviser (not including any sub-adviser whose role is primarily portfolio management and is subcontracted with or overseen by another investment adviser), and any entity controlling, controlled by, or under common control with the investment adviser that provides ongoing services to the registrant. |
Item 5. Audit Committee of Listed Registrants.
Not applicable
Item 6. Investments.
(a) The Registrant(s) schedule(s) of investments is included in the Financial Statements under Item 7 of this form.
(b) Not applicable
Item 7. Financial Statements and Financial Highlights for Open-End Management Investment Companies
(a)

HUSSMAN INVESTMENT TRUST
HUSSMAN STRATEGIC GROWTH FUND
HUSSMAN STRATEGIC ALLOCATION FUND
HUSSMAN STRATEGIC TOTAL RETURN FUND
FINANCIAL STATEMENTS
June 30, 2024
Table of Contents
| | |
Schedules of Investments | |
Hussman Strategic Growth Fund | 1 |
Hussman Strategic Allocation Fund | 12 |
Hussman Strategic Total Return Fund | 23 |
Statements of Assets and Liabilities | 26 |
Statements of Operations | 27 |
Statements of Changes in Net Assets | |
Hussman Strategic Growth Fund | 29 |
Hussman Strategic Allocation Fund | 30 |
Hussman Strategic Total Return Fund | 31 |
Financial Highlights | |
Hussman Strategic Growth Fund | 32 |
Hussman Strategic Allocation Fund | 33 |
Hussman Strategic Total Return Fund | 34 |
Notes to Financial Statements | 35 |
Report of Independent Registered Public Accounting Firm | 54 |
Other Information | 56 |
Federal Tax Information | 56 |
Approval of Investment Advisory Agreements | 57 |
Hussman Strategic Growth Fund
Schedule of Investments |
June 30, 2024 |
COMMON STOCKS — 100.9% | | Shares | | | Value | |
Communications — 6.6% | | | | | | | | |
Entertainment Content — 0.5% | | | | | | | | |
AppLovin Corporation - Class A (a)(b) | | | 20,000 | | | $ | 1,664,400 | |
| | | | | | | | | |
Internet Media & Services — 4.9% | | | | | | | | |
Airbnb, Inc. - Class A (a)(b) | | | 4,000 | | | | 606,520 | |
Alphabet, Inc. - Class C (a) | | | 10,000 | | | | 1,834,200 | |
Booking Holdings, Inc. (a) | | | 200 | | | | 792,300 | |
DoorDash, Inc. - Class A (a)(b) | | | 16,000 | | | | 1,740,480 | |
LifeMD, Inc. (a)(b) | | | 40,000 | | | | 274,400 | |
Lyft, Inc. - Class A (a)(b) | | | 140,000 | | | | 1,974,000 | |
Maplebear, Inc. (a)(b) | | | 40,000 | | | | 1,285,600 | |
Match Group, Inc. (a)(b) | | | 20,000 | | | | 607,600 | |
Meta Platforms, Inc. - Class A (a) | | | 6,000 | | | | 3,025,320 | |
Netflix, Inc. (a)(b) | | | 1,000 | | | | 674,880 | |
Shutterstock, Inc. (a) | | | 40,000 | | | | 1,548,000 | |
Uber Technologies, Inc. (a)(b) | | | 20,000 | | | | 1,453,600 | |
| | | | | | | | 15,816,900 | |
Telecommunications — 1.2% | | | | | | | | |
AST SpaceMobile, Inc. (a)(b) | | | 50,000 | | | | 580,500 | |
Verizon Communications, Inc. (a) | | | 80,000 | | | | 3,299,200 | |
| | | | | | | | 3,879,700 | |
Consumer Discretionary — 14.4% | | | | | | | | |
Apparel & Textile Products — 1.2% | | | | | | | | |
Carter’s, Inc. (a) | | | 40,000 | | | | 2,478,800 | |
Kontoor Brands, Inc. (a) | | | 20,000 | | | | 1,323,000 | |
| | | | | | | | 3,801,800 | |
Automotive — 0.3% | | | | | | | | |
Tesla, Inc. (a)(b) | | | 4,000 | | | | 791,520 | |
| | | | | | | | | |
Consumer Services — 0.6% | | | | | | | | |
Coursera, Inc. (a)(b) | | | 160,000 | | | | 1,145,600 | |
Perdoceo Education Corporation (a) | | | 40,000 | | | | 856,800 | |
| | | | | | | | 2,002,400 | |
E-Commerce Discretionary — 1.0% | | | | | | | | |
Amazon.com, Inc. (a)(b) | | | 10,000 | | | | 1,932,500 | |
Etsy, Inc. (a)(b) | | | 20,000 | | | | 1,179,600 | |
| | | | | | | | 3,112,100 | |
Hussman Strategic Growth Fund
Schedule of Investments (continued) |
June 30, 2024 |
COMMON STOCKS — 100.9% (continued) | | Shares | | | Value | |
Consumer Discretionary — 14.4% (continued) |
Home & Office Products — 0.5% | | | | | | | | |
Arhaus, Inc. (a) | | | 100,000 | | | $ | 1,694,000 | |
| | | | | | | | | |
Home Construction — 0.6% | | | | | | | | |
Forestar Group, Inc. (a)(b) | | | 60,000 | | | | 1,919,400 | |
| | | | | | | | | |
Leisure Facilities & Services — 3.9% | | | | | | | | |
Dave & Buster’s Entertainment, Inc. (a)(b) | | | 14,000 | | | | 557,340 | |
Domino’s Pizza, Inc. (a) | | | 4,000 | | | | 2,065,320 | |
Jack in the Box, Inc. (a) | | | 20,000 | | | | 1,018,800 | |
Norwegian Cruise Line Holdings Ltd. (a)(b) | | | 140,000 | | | | 2,630,600 | |
Shake Shack, Inc. - Class A (a)(b) | | | 6,000 | | | | 540,000 | |
Starbucks Corporation (a) | | | 30,000 | | | | 2,335,500 | |
Sweetgreen, Inc. - Class A (a)(b) | | | 120,000 | | | | 3,616,800 | |
| | | | | | | | 12,764,360 | |
Retail - Discretionary — 6.3% | | | | | | | | |
American Eagle Outfitters, Inc. (a) | | | 120,000 | | | | 2,395,200 | |
Buckle, Inc. (The) (a) | | | 80,000 | | | | 2,955,200 | |
Designer Brands, Inc. - Class A (a) | | | 200,000 | | | | 1,366,000 | |
Gap, Inc. (The) (a) | | | 60,000 | | | | 1,433,400 | |
Home Depot, Inc. (The) (a) | | | 4,000 | | | | 1,376,960 | |
Kohl’s Corporation (a) | | | 40,000 | | | | 919,600 | |
lululemon athletica, inc. (a)(b) | | | 10,000 | | | | 2,987,000 | |
Macy’s, Inc. (a) | | | 50,000 | | | | 960,000 | |
Sally Beauty Holdings, Inc. (a)(b) | | | 100,000 | | | | 1,073,000 | |
Signet Jewelers Ltd. (a) | | | 12,000 | | | | 1,074,960 | |
Urban Outfitters, Inc. (a)(b) | | | 80,000 | | | | 3,284,000 | |
Warby Parker, Inc. - Class A (a)(b) | | | 40,000 | | | | 642,400 | |
| | | | | | | | 20,467,720 | |
Consumer Staples — 12.6% | | | | | | | | |
Beverages — 1.3% | | | | | | | | |
Coca-Cola Company (The) (a) | | | 16,000 | | | | 1,018,400 | |
PepsiCo, Inc. (a) | | | 20,000 | | | | 3,298,600 | |
| | | | | | | | 4,317,000 | |
Hussman Strategic Growth Fund
Schedule of Investments (continued) |
June 30, 2024 |
COMMON STOCKS — 100.9% (continued) | | Shares | | | Value | |
Consumer Staples — 12.6% (continued) | | | | | | | | |
Food — 7.5% | | | | | | | | |
BellRing Brands, Inc. (a)(b) | | | 10,000 | | | $ | 571,400 | |
Campbell Soup Company (a) | | | 80,000 | | | | 3,615,200 | |
Flowers Foods, Inc. (a) | | | 30,000 | | | | 666,000 | |
Fresh Del Monte Produce, Inc. (a) | | | 20,000 | | | | 437,000 | |
General Mills, Inc. (a) | | | 50,000 | | | | 3,163,000 | |
Hershey Company (The) (a) | | | 20,000 | | | | 3,676,600 | |
Ingredion, Inc. (a) | | | 24,000 | | | | 2,752,800 | |
J.M. Smucker Company (The) (a) | | | 20,000 | | | | 2,180,800 | |
Kellanova (a) | | | 50,000 | | | | 2,884,000 | |
Kraft Heinz Company (The) (a) | | | 36,000 | | | | 1,159,920 | |
Lamb Weston Holdings, Inc. (a) | | | 30,000 | | | | 2,522,400 | |
Post Holdings, Inc. (a)(b) | | | 8,000 | | | | 833,280 | |
| | | | | | | | 24,462,400 | |
Household Products — 1.3% | | | | | | | | |
Colgate-Palmolive Company (a) | | | 20,000 | | | | 1,940,800 | |
Kimberly-Clark Corporation (a) | | | 16,000 | | | | 2,211,200 | |
| | | | | | | | 4,152,000 | |
Retail - Consumer Staples — 2.1% | | | | | | | | |
BJ’s Wholesale Club Holdings, Inc. (a)(b) | | | 10,000 | | | | 878,400 | |
Kroger Company (The) (a) | | | 40,000 | | | | 1,997,200 | |
Natural Grocers by Vitamin Cottage, Inc. (a) | | | 100,000 | | | | 2,120,000 | |
Ollie’s Bargain Outlet Holdings, Inc. (a)(b) | | | 10,000 | | | | 981,700 | |
Walgreens Boots Alliance, Inc. (a) | | | 60,000 | | | | 725,700 | |
| | | | | | | | 6,703,000 | |
Wholesale - Consumer Staples — 0.4% | | | | | | | | |
United Natural Foods, Inc. (a)(b) | | | 100,000 | | | | 1,310,000 | |
| | | | | | | | | |
Energy — 4.5% | | | | | | | | |
Oil & Gas Producers — 3.0% | | | | | | | | |
APA Corporation (a) | | | 40,000 | | | | 1,177,600 | |
California Resources Corporation (a) | | | 60,000 | | | | 3,193,200 | |
CVR Energy, Inc. (a) | | | 60,000 | | | | 1,606,200 | |
Diamondback Energy, Inc. (a) | | | 10,000 | | | | 2,001,900 | |
SM Energy Company (a) | | | 20,000 | | | | 864,600 | |
Vital Energy, Inc. (a)(b) | | | 20,000 | | | | 896,400 | |
| | | | | | | | 9,739,900 | |
Hussman Strategic Growth Fund
Schedule of Investments (continued) |
June 30, 2024 |
COMMON STOCKS — 100.9% (continued) | | Shares | | | Value | |
Energy — 4.5% (continued) |
Renewable Energy — 1.5% | | | | | | | | |
Array Technologies, Inc. (a)(b) | | | 160,000 | | | $ | 1,641,600 | |
Canadian Solar, Inc. (a)(b) | | | 180,000 | | | | 2,655,000 | |
SolarEdge Technologies, Inc. (a)(b) | | | 20,000 | | | | 505,200 | |
| | | | | | | | 4,801,800 | |
Financials — 3.2% | | | | | | | | |
Banking — 1.6% |
Customers Bancorp, Inc. (a)(b) | | | 60,000 | | | | 2,878,800 | |
UMB Financial Corporation (a) | | | 30,000 | | | | 2,502,600 | |
| | | | | | | | 5,381,400 | |
Banks — 0.5% | | | | | | | | |
JPMorgan Chase & Company (a) | | | 8,000 | | | | 1,618,080 | |
| | | | | | | | | |
Insurance — 1.1% | | | | | | | | |
Aflac, Inc. (a) | | | 10,000 | | | | 893,100 | |
Unum Group (a) | | | 50,000 | | | | 2,555,500 | |
| | | | | | | | 3,448,600 | |
Health Care — 21.0% | | | | | | | | |
Biotech & Pharma — 15.9% | | | | | | | | |
Absci Corporation (b) | | | 120,000 | | | | 369,600 | |
ACADIA Pharmaceuticals, Inc. (a)(b) | | | 40,000 | | | | 650,000 | |
Amgen, Inc. (a) | | | 12,000 | | | | 3,749,400 | |
Amneal Pharmaceuticals, Inc. (a)(b) | | | 140,000 | | | | 889,000 | |
Amphastar Pharmaceuticals, Inc. (a)(b) | | | 60,000 | | | | 2,400,000 | |
ANI Pharmaceuticals, Inc. (a)(b) | | | 40,000 | | | | 2,547,200 | |
Biogen, Inc. (a)(b) | | | 6,000 | | | | 1,390,920 | |
C4 Therapeutics, Inc. (a)(b) | | | 40,000 | | | | 184,800 | |
Catalyst Pharmaceuticals, Inc. (a)(b) | | | 100,000 | | | | 1,549,000 | |
Corcept Therapeutics, Inc. (a)(b) | | | 100,000 | | | | 3,249,000 | |
Dynavax Technologies Corporation (a)(b) | | | 80,000 | | | | 898,400 | |
Eli Lilly & Company (a) | | | 2,000 | | | | 1,810,760 | |
Exelixis, Inc. (a)(b) | | | 140,000 | | | | 3,145,800 | |
Gilead Sciences, Inc. (a) | | | 40,000 | | | | 2,744,400 | |
Halozyme Therapeutics, Inc. (a)(b) | | | 40,000 | | | | 2,094,400 | |
Harmony Biosciences Holdings, Inc. (a)(b) | | | 20,000 | | | | 603,400 | |
Incyte Corporation (a)(b) | | | 30,000 | | | | 1,818,600 | |
Innoviva, Inc. (a)(b) | | | 80,000 | | | | 1,312,000 | |
Johnson & Johnson (a) | | | 16,000 | | | | 2,338,560 | |
Hussman Strategic Growth Fund
Schedule of Investments (continued) |
June 30, 2024 |
COMMON STOCKS — 100.9% (continued) | | Shares | | | Value | |
Health Care — 21.0% (continued) |
Biotech & Pharma — 15.9% (continued) | | | | | | | | |
Kiniksa Pharmaceuticals International plc (b) | | | 140,000 | | | $ | 2,613,800 | |
Marinus Pharmaceuticals, Inc. (b) | | | 80,000 | | | | 93,600 | |
Neurocrine Biosciences, Inc. (a)(b) | | | 24,000 | | | | 3,304,080 | |
Novo Nordisk A/S - ADR (a) | | | 40,000 | | | | 5,709,600 | |
Pacira BioSciences, Inc. (a)(b) | | | 20,000 | | | | 572,200 | |
Pfizer, Inc. (a) | | | 40,000 | | | | 1,119,200 | |
Praxis Precision Medicines, Inc. (a)(b) | | | 20,000 | | | | 827,200 | |
Recursion Pharmaceuticals, Inc. - Class A (a)(b) | | | 100,000 | | | | 750,000 | |
Roivant Sciences Ltd. (a)(b) | | | 100,000 | | | | 1,057,000 | |
Vertex Pharmaceuticals, Inc. (a)(b) | | | 3,000 | | | | 1,406,160 | |
Voyager Therapeutics, Inc. (a)(b) | | | 50,000 | | | | 395,500 | |
| | | | | | | | 51,593,580 | |
Health Care Facilities & Services — 4.3% | | | | | | | | |
Centene Corporation (a)(b) | | | 20,000 | | | | 1,326,000 | |
CVS Health Corporation (a) | | | 20,000 | | | | 1,181,200 | |
DaVita, Inc. (a)(b) | | | 18,000 | | | | 2,494,260 | |
HCA Healthcare, Inc. (a) | | | 6,000 | | | | 1,927,680 | |
Patterson Companies, Inc. (a) | | | 100,000 | | | | 2,412,000 | |
Progyny, Inc. (a)(b) | | | 60,000 | | | | 1,716,600 | |
UnitedHealth Group, Inc. (a) | | | 2,000 | | | | 1,018,520 | |
Universal Health Services, Inc. - Class B (a) | | | 10,000 | | | | 1,849,300 | |
| | | | | | | | 13,925,560 | |
Medical Equipment & Devices — 0.8% | | | | | | | | |
Avita Medical, Inc. (a)(b) | | | 40,000 | | | | 316,800 | |
Exact Sciences Corporation (a)(b) | | | 40,000 | | | | 1,690,000 | |
Zynex, Inc. (a)(b) | | | 50,000 | | | | 466,000 | |
| | | | | | | | 2,472,800 | |
Industrials — 9.7% | | | | | | | | |
Commercial Support Services — 1.0% | | | | | | | | |
Cimpress plc (a)(b) | | | 24,000 | | | | 2,102,640 | |
H&R Block, Inc. (a) | | | 20,000 | | | | 1,084,600 | |
| | | | | | | | 3,187,240 | |
Hussman Strategic Growth Fund
Schedule of Investments (continued) |
June 30, 2024 |
COMMON STOCKS — 100.9% (continued) | | Shares | | | Value | |
Industrials — 9.7% (continued) |
Electrical Equipment — 4.1% | | | | | | | | |
Allegion plc (a) | | | 20,000 | | | $ | 2,363,000 | |
American Superconductor Corporation (a)(b) | | | 120,000 | | | | 2,806,800 | |
Bel Fuse, Inc. - Class B (a) | | | 12,000 | | | | 782,880 | |
Bloom Energy Corporation - Class A (a)(b) | | | 50,000 | | | | 612,000 | |
NEXTracker, Inc. - Class A (a)(b) | | | 40,000 | | | | 1,875,200 | |
OSI Systems, Inc. (a)(b) | | | 10,000 | | | | 1,375,200 | |
Select Water Solutions, Inc. (a) | | | 100,000 | | | | 1,070,000 | |
Veritiv Holdings Company - Class A (a) | | | 10,000 | | | | 865,700 | |
Vontier Corporation (a) | | | 40,000 | | | | 1,528,000 | |
| | | | | | | | 13,278,780 | |
Engineering & Construction — 1.1% | | | | | | | | |
Dycom Industries, Inc. (a)(b) | | | 10,000 | | | | 1,687,600 | |
Primoris Services Corporation (a) | | | 40,000 | | | | 1,995,600 | |
| | | | | | | | 3,683,200 | |
Industrial Intermediate Products — 0.1% | | | | | | | | |
Xometry, Inc. - Class A (a)(b) | | | 40,000 | | | | 462,400 | |
| | | | | | | | | |
Industrial Support Services — 0.4% | | | | | | | | |
MSC Industrial Direct Company, Inc. - Class A (a) | | | 14,000 | | | | 1,110,340 | |
| | | | | | | | | |
Machinery — 1.0% | | | | | | | | |
Symbotic, Inc. (a)(b) | | | 90,000 | | | | 3,164,400 | |
| | | | | | | | | |
Transportation & Logistics — 1.5% | | | | | | | | |
FedEx Corporation (a) | | | 10,000 | | | | 2,998,400 | |
Heartland Express, Inc. (a) | | | 40,000 | | | | 493,200 | |
United Parcel Service, Inc. - Class B (a) | | | 10,000 | | | | 1,368,500 | |
| | | | | | | | 4,860,100 | |
Transportation Equipment — 0.5% | | | | | | | | |
Allison Transmission Holdings, Inc. (a) | | | 20,000 | | | | 1,518,000 | |
| | | | | | | | | |
Materials — 3.7% | | | | | | | | |
Chemicals — 1.5% | | | | | | | | |
Celanese Corporation (a) | | | 10,000 | | | | 1,348,900 | |
CF Industries Holdings, Inc. (a) | | | 10,000 | | | | 741,200 | |
Mosaic Company (The) (a) | | | 100,000 | | | | 2,890,000 | |
| | | | | | | | 4,980,100 | |
Hussman Strategic Growth Fund
Schedule of Investments (continued) |
June 30, 2024 |
COMMON STOCKS — 100.9% (continued) | | Shares | | | Value | |
Materials — 3.7% (continued) |
Metals & Mining — 2.2% | | | | | | | | |
Agnico Eagle Mines Ltd. (a) | | | 32,000 | | | $ | 2,092,800 | |
Anglogold Ashanti plc (a) | | | 32,000 | | | | 804,160 | |
Barrick Gold Corporation (a) | | | 120,000 | | | | 2,001,600 | |
Kinross Gold Corporation (a) | | | 40,000 | | | | 332,800 | |
Newmont Corporation (a) | | | 32,000 | | | | 1,339,840 | |
Royal Gold, Inc. (a) | | | 4,000 | | | | 500,640 | |
| | | | | | | | 7,071,840 | |
Real Estate — 0.2% | | | | | | | | |
Real Estate Owners & Developers — 0.2% | | | | | | | | |
Dream Finders Homes, Inc. - Class A (a)(b) | | | 20,000 | | | | 516,400 | |
| | | | | | | | | |
Technology — 23.9% | | | | | | | | |
Semiconductors — 4.9% | | | | | | | | |
ACM Research, Inc. - Class A (a)(b) | | | 200,000 | | | | 4,612,000 | |
Allegro MicroSystems, Inc. (a)(b) | | | 20,000 | | | | 564,800 | |
Applied Materials, Inc. (a) | | | 3,000 | | | | 707,970 | |
Axcelis Technologies, Inc. (a)(b) | | | 10,000 | | | | 1,421,900 | |
Intel Corporation (a) | | | 100,000 | | | | 3,097,000 | |
NVE Corporation (a) | | | 18,000 | | | | 1,344,420 | |
NVIDIA Corporation (a) | | | 2,000 | | | | 247,080 | |
Photronics, Inc. (a)(b) | | | 120,000 | | | | 2,960,400 | |
QUALCOMM, Inc. (a) | | | 4,000 | | | | 796,720 | |
| | | | | | | | 15,752,290 | |
Software — 7.8% | | | | | | | | |
Adobe, Inc. (a)(b) | | | 4,000 | | | | 2,222,160 | |
Akamai Technologies, Inc. (a)(b) | | | 40,000 | | | | 3,603,200 | |
Asana, Inc. - Class A (a)(b) | | | 20,000 | | | | 279,800 | |
Bandwidth, Inc. - Class A (a)(b) | | | 120,000 | | | | 2,025,600 | |
Confluent, Inc. - Class A (a)(b) | | | 20,000 | | | | 590,600 | |
Couchbase, Inc. (a)(b) | | | 20,000 | | | | 365,200 | |
Dropbox, Inc. - Class A (a)(b) | | | 70,000 | | | | 1,572,900 | |
Dynatrace, Inc. (a)(b) | | | 10,000 | | | | 447,400 | |
Elastic N.V. (a)(b) | | | 20,000 | | | | 2,278,200 | |
Fastly, Inc. - Class A (a)(b) | | | 160,000 | | | | 1,179,200 | |
Gen Digital, Inc. (a) | | | 20,000 | | | | 499,600 | |
Informatica, Inc. - Class A (a)(b) | | | 20,000 | | | | 617,600 | |
IonQ, Inc. (a)(b) | | | 340,000 | | | | 2,390,200 | |
Hussman Strategic Growth Fund
Schedule of Investments (continued) |
June 30, 2024 |
COMMON STOCKS — 100.9% (continued) | | Shares | | | Value | |
Technology — 23.9% (continued) |
Software — 7.8% (continued) | | | | | | | | |
Microsoft Corporation (a) | | | 200 | | | $ | 89,390 | |
MongoDB, Inc. (a)(b) | | | 2,000 | | | | 499,920 | |
Qualys, Inc. (a)(b) | | | 20,000 | | | | 2,852,000 | |
Salesforce, Inc. (a) | | | 4,000 | | | | 1,028,400 | |
Schrodinger, Inc. (a)(b) | | | 20,000 | | | | 386,800 | |
Twilio, Inc. - Class A (a)(b) | | | 12,000 | | | | 681,720 | |
Zoom Video Communications, Inc. - Class A (a)(b) | | | 30,000 | | | | 1,775,700 | |
| | | | | | | | 25,385,590 | |
Technology Hardware — 7.0% | | | | | | | | |
Apple, Inc. (a) | | | 200 | | | | 42,124 | |
Applied Optoelectronics, Inc. (a)(b) | | | 170,000 | | | | 1,409,300 | |
Benchmark Electronics, Inc. (a) | | | 20,000 | | | | 789,200 | |
Ciena Corporation (a)(b) | | | 20,000 | | | | 963,600 | |
Cisco Systems, Inc. (a) | | | 40,000 | | | | 1,900,400 | |
Clearfield, Inc. (a)(b) | | | 20,000 | | | | 771,200 | |
Dell Technologies, Inc. - Class C (a) | | | 10,000 | | | | 1,379,100 | |
F5, Inc. (a)(b) | | | 16,000 | | | | 2,755,680 | |
Flex Ltd. (a)(b) | | | 60,000 | | | | 1,769,400 | |
InterDigital, Inc. (a) | | | 20,000 | | | | 2,331,200 | |
Jabil, Inc. (a) | | | 20,000 | | | | 2,175,800 | |
NetApp, Inc. (a) | | | 20,000 | | | | 2,576,000 | |
Pure Storage, Inc. - Class A (a)(b) | | | 2,000 | | | | 128,420 | |
Super Micro Computer, Inc. (a)(b) | | | 1,000 | | | | 819,350 | |
Ubiquiti, Inc. (a) | | | 20,000 | | | | 2,913,200 | |
| | | | | | | | 22,723,974 | |
Technology Services — 4.2% | | | | | | | | |
Cognizant Technology Solutions Corporation - Class A (a) | | | 50,000 | | | | 3,400,000 | |
Corpay, Inc. (a)(b) | | | 10,000 | | | | 2,664,100 | |
Infosys Ltd. - ADR (a) | | | 120,000 | | | | 2,234,400 | |
International Business Machines Corporation (a) | | | 10,000 | | | | 1,729,500 | |
Pagseguro Digital Ltd. - Class A (a)(b) | | | 200,000 | | | | 2,338,000 | |
PayPal Holdings, Inc. (a)(b) | | | 20,000 | | | | 1,160,600 | |
| | | | | | | | 13,526,600 | |
Hussman Strategic Growth Fund
Schedule of Investments (continued) |
June 30, 2024 |
COMMON STOCKS — 100.9% (continued) | | Shares | | | Value | |
Utilities — 1.1% | | | | | | | | |
Electric Utilities — 0.4% | | | | | | | | |
Fluence Energy, Inc. (a)(b) | | | 40,000 | | | $ | 693,600 | |
NRG Energy, Inc. (a) | | | 10,000 | | | | 778,600 | |
| | | | | | | | 1,472,200 | |
Water Utilities — 0.7% | | | | | | | | |
Consolidated Water Company, Ltd. (a) | | | 80,000 | | | | 2,123,200 | |
| | | | | | | | | |
Total Common Stocks (Cost $340,706,776) | | | | | | $ | 326,657,074 | |
WARRANTS — 0.0%(c) | | Shares | | | Value | |
Energy — 0.0% (c) | | | | | | | | |
Oil & Gas Services & Equipment — 0.0% (c) | | | | | | | | |
Nabors Industries Ltd., expires 06/11/2026 (Cost $0) | | | 8,000 | | | $ | 52,800 | |
EXCHANGE-TRADED PUT OPTION CONTRACTS — 1.5% | | Contracts | | | Notional
Amount | | | Value | |
Russell 2000® Index Option, 08/16/2024 at $2,000 | | | 730 | | | $ | 149,481,443 | | | $ | 2,102,400 | |
S&P 500® Index Option, 08/16/2024 at $5,500 | | | 320 | | | | 174,735,360 | | | | 2,848,000 | |
Total Put Option Contracts (Cost $6,445,941) | | | | | | $ | 324,216,803 | | | $ | 4,950,400 | |
| | | | | | | | | | | | | |
Total Investments at Value — 102.4% (Cost $347,152,717) | | | | | | | | | | $ | 331,660,274 | |
Hussman Strategic Growth Fund
Schedule of Investments (continued) |
June 30, 2024 |
MONEY MARKET FUNDS — 46.3% | | Shares | | | Value | |
Invesco Treasury Portfolio - Institutional Class, 5.23% (d) (Cost $149,687,846) | | | 149,687,846 | | | $ | 149,687,846 | |
| | | | | | | | | |
Total Investments and Money Market Funds at Value — 148.7% (Cost $496,840,563) | | | | | | $ | 481,348,120 | |
| | | | | | | | | |
Written Call Option Contracts — (49.7%) | | | | | | | (160,991,730 | ) |
| | | | | | | | | |
Other Assets in Excess of Liabilities — 1.0% | | | | | | | 3,330,145 | |
| | | | | | | | | |
Net Assets — 100.0% | | | | | | $ | 323,686,535 | |
ADR - American Depositary Receipt. |
(a) | All or portion of the security is used as collateral to cover written call options. The total value of the securities held as collateral as of June 30, 2024 was $323,580,090. |
(b) | Non-income producing security. |
(c) | Percentage rounds to less than 0.1%. |
(d) | The rate shown is the 7-day effective yield as of June 30, 2024. |
See accompanying notes to financial statements. |
Hussman Strategic Growth Fund
Schedule of Open Written Option Contracts |
June 30, 2024 |
EXCHANGE-TRADED WRITTEN CALL OPTION CONTRACTS | | Contracts | | | Notional
Amount | | | Strike
Price | | | Expiration
Date | | | Value of
Options | |
Call Option Contracts |
Russell 2000® Index Option | | | 730 | | | $ | 149,481,443 | | | $ | 1,200 | | | | 09/20/2024 | | | $ | 62,415,730 | |
S&P 500® Index Option | | | 320 | | | | 174,735,360 | | | | 2,400 | | | | 09/20/2024 | | | | 98,576,000 | |
Total Written Call Option Contracts (Premiums received $155,204,710) | | | | | | $ | 324,216,803 | | | | | | | | | | | $ | 160,991,730 | |
See accompanying notes to financial statements. |
Hussman Strategic Allocation Fund
Schedule of Investments |
June 30, 2024 |
COMMON STOCKS — 61.4% | | Shares | | | Value | |
Communications — 4.0% | | | | | | | | |
Entertainment Content — 0.3% | | | | | | | | |
AppLovin Corporation - Class A (a)(b) | | | 1,000 | | | $ | 83,220 | |
| | | | | | | | | |
Internet Media & Services — 3.0% | | | | | | | | |
Airbnb, Inc. - Class A (b) | | | 200 | | | | 30,326 | |
Alphabet, Inc. - Class C (a) | | | 500 | | | | 91,710 | |
Booking Holdings, Inc. | | | 10 | | | | 39,615 | |
DoorDash, Inc. - Class A (a)(b) | | | 800 | | | | 87,024 | |
LifeMD, Inc. (a)(b) | | | 2,000 | | | | 13,720 | |
Lyft, Inc. - Class A (a)(b) | | | 7,000 | | | | 98,700 | |
Maplebear, Inc. (a)(b) | | | 2,000 | | | | 64,280 | |
Match Group, Inc. (b) | | | 1,000 | | | | 30,380 | |
Meta Platforms, Inc. - Class A (a) | | | 300 | | | | 151,266 | |
Netflix, Inc. (a)(b) | | | 50 | | | | 33,744 | |
Shutterstock, Inc. (a) | | | 2,000 | | | | 77,400 | |
Uber Technologies, Inc. (a)(b) | | | 1,000 | | | | 72,680 | |
| | | | | | | | 790,845 | |
Telecommunications — 0.7% | | | | | | | | |
AST SpaceMobile, Inc. (b) | | | 2,500 | | | | 29,025 | |
Verizon Communications, Inc. (a) | | | 4,000 | | | | 164,960 | |
| | | | | | | | 193,985 | |
Consumer Discretionary — 8.7% | | | | | | | | |
Apparel & Textile Products — 0.7% | | | | | | | | |
Carter’s, Inc. (a) | | | 2,000 | | | | 123,940 | |
Kontoor Brands, Inc. (a) | | | 1,000 | | | | 66,150 | |
| | | | | | | | 190,090 | |
Automotive — 0.1% | | | | | | | | |
Tesla, Inc. (b) | | | 200 | | | | 39,576 | |
| | | | | | | | | |
Consumer Services — 0.4% | | | | | | | | |
Coursera, Inc. (a)(b) | | | 8,000 | | | | 57,280 | |
Perdoceo Education Corporation | | | 2,000 | | | | 42,840 | |
| | | | | | | | 100,120 | |
E-Commerce Discretionary — 0.6% | | | | | | | | |
Amazon.com, Inc. (a)(b) | | | 500 | | | | 96,625 | |
Etsy, Inc. (a)(b) | | | 1,000 | | | | 58,980 | |
| | | | | | | | 155,605 | |
Hussman Strategic Allocation Fund
Schedule of Investments (continued) |
June 30, 2024 |
COMMON STOCKS — 61.4% (continued) | | Shares | | | Value | |
Consumer Discretionary — 8.7% (continued) | | | | | | | | |
Home & Office Products — 0.3% | | | | | | | | |
Arhaus, Inc. (a) | | | 5,000 | | | $ | 84,700 | |
| | | | | | | | | |
Home Construction — 0.4% | | | | | | | | |
Forestar Group, Inc. (a)(b) | | | 3,000 | | | | 95,970 | |
| | | | | | | | | |
Leisure Facilities & Services — 2.4% | | | | | | | | |
Dave & Buster’s Entertainment, Inc. (b) | | | 700 | | | | 27,867 | |
Domino’s Pizza, Inc. (a) | | | 200 | | | | 103,266 | |
Jack in the Box, Inc. (a) | | | 1,000 | | | | 50,940 | |
Norwegian Cruise Line Holdings Ltd. (a)(b) | | | 7,000 | | | | 131,530 | |
Shake Shack, Inc. - Class A (a)(b) | | | 300 | | | | 27,000 | |
Starbucks Corporation (a) | | | 1,500 | | | | 116,775 | |
Sweetgreen, Inc. - Class A (a)(b) | | | 6,000 | | | | 180,840 | |
| | | | | | | | 638,218 | |
Retail - Discretionary — 3.8% | | | | | | | | |
American Eagle Outfitters, Inc. (a) | | | 6,000 | | | | 119,760 | |
Buckle, Inc. (The) (a) | | | 4,000 | | | | 147,760 | |
Designer Brands, Inc. - Class A (a) | | | 10,000 | | | | 68,300 | |
Gap, Inc. (The) (a) | | | 3,000 | | | | 71,670 | |
Home Depot, Inc. (The) (a) | | | 200 | | | | 68,848 | |
Kohl’s Corporation (a) | | | 2,000 | | | | 45,980 | |
lululemon athletica, inc. (a)(b) | | | 500 | | | | 149,350 | |
Macy’s, Inc. (a) | | | 2,500 | | | | 48,000 | |
Sally Beauty Holdings, Inc. (a)(b) | | | 5,000 | | | | 53,650 | |
Signet Jewelers Ltd. | | | 600 | | | | 53,748 | |
Urban Outfitters, Inc. (a)(b) | | | 4,000 | | | | 164,200 | |
Warby Parker, Inc. - Class A (b) | | | 2,000 | | | | 32,120 | |
| | | | | | | | 1,023,386 | |
Consumer Staples — 7.7% | | | | | | | | |
Beverages — 0.8% | | | | | | | | |
Coca-Cola Company (The) | | | 800 | | | | 50,920 | |
PepsiCo, Inc. (a) | | | 1,000 | | | | 164,930 | |
| | | | | | | | 215,850 | |
Food — 4.6% | | | | | | | | |
BellRing Brands, Inc. (a)(b) | | | 500 | | | | 28,570 | |
Campbell Soup Company (a) | | | 4,000 | | | | 180,760 | |
Flowers Foods, Inc. (a) | | | 1,500 | | | | 33,300 | |
Hussman Strategic Allocation Fund
Schedule of Investments (continued) |
June 30, 2024 |
COMMON STOCKS — 61.4% (continued) | | Shares | | | Value | |
Consumer Staples — 7.7% (continued) |
Food — 4.6% (continued) | | | | | | | | |
Fresh Del Monte Produce, Inc. (a) | | | 1,000 | | | $ | 21,850 | |
General Mills, Inc. (a) | | | 2,500 | | | | 158,150 | |
Hershey Company (The) (a) | | | 1,000 | | | | 183,830 | |
Ingredion, Inc. (a) | | | 1,200 | | | | 137,640 | |
J.M. Smucker Company (The) (a) | | | 1,000 | | | | 109,040 | |
Kellanova (a) | | | 2,500 | | | | 144,200 | |
Kraft Heinz Company (The) (a) | | | 1,800 | | | | 57,996 | |
Lamb Weston Holdings, Inc. (a) | | | 1,500 | | | | 126,120 | |
Post Holdings, Inc. (a)(b) | | | 400 | | | | 41,664 | |
| | | | | | | | 1,223,120 | |
Household Products — 0.8% | | | | | | | | |
Colgate-Palmolive Company (a) | | | 1,000 | | | | 97,040 | |
Kimberly-Clark Corporation (a) | | | 800 | | | | 110,560 | |
| | | | | | | | 207,600 | |
Retail - Consumer Staples — 1.3% | | | | | | | | |
BJ’s Wholesale Club Holdings, Inc. (a)(b) | | | 500 | | | | 43,920 | |
Kroger Company (The) (a) | | | 2,000 | | | | 99,860 | |
Natural Grocers by Vitamin Cottage, Inc. | | | 5,000 | | | | 106,000 | |
Ollie’s Bargain Outlet Holdings, Inc. (a)(b) | | | 500 | | | | 49,085 | |
Walgreens Boots Alliance, Inc. (a) | | | 3,000 | | | | 36,285 | |
| | | | | | | | 335,150 | |
Wholesale - Consumer Staples — 0.2% | | | | | | | | |
United Natural Foods, Inc. (a)(b) | | | 5,000 | | | | 65,500 | |
| | | | | | | | | |
Energy — 2.7% | | | | | | | | |
Oil & Gas Producers — 1.8% | | | | | | | | |
APA Corporation (a) | | | 2,000 | | | | 58,880 | |
California Resources Corporation | | | 3,000 | | | | 159,660 | |
CVR Energy, Inc. (a) | | | 3,000 | | | | 80,310 | |
Diamondback Energy, Inc. (a) | | | 500 | | | | 100,095 | |
SM Energy Company (a) | | | 1,000 | | | | 43,230 | |
Vital Energy, Inc. (a)(b) | | | 1,000 | | | | 44,820 | |
| | | | | | | | 486,995 | |
Hussman Strategic Allocation Fund
Schedule of Investments (continued) |
June 30, 2024 |
COMMON STOCKS — 61.4% (continued) | | Shares | | | Value | |
Energy — 2.7% (continued) |
Renewable Energy — 0.9% | | | | | | | | |
Array Technologies, Inc. (a)(b) | | | 8,000 | | | $ | 82,080 | |
Canadian Solar, Inc. (a)(b) | | | 9,000 | | | | 132,750 | |
SolarEdge Technologies, Inc. (a)(b) | | | 1,000 | | | | 25,260 | |
| | | | | | | | 240,090 | |
Financials — 2.0% | | | | | | | | |
Banking — 1.0% |
Customers Bancorp, Inc. (a)(b) | | | 3,000 | | | | 143,940 | |
UMB Financial Corporation (a) | | | 1,500 | | | | 125,130 | |
| | | | | | | | 269,070 | |
Banks — 0.3% | | | | | | | | |
JPMorgan Chase & Company (a) | | | 400 | | | | 80,904 | |
| | | | | | | | | |
Insurance — 0.7% | | | | | | | | |
Aflac, Inc. (a) | | | 500 | | | | 44,655 | |
Unum Group (a) | | | 2,500 | | | | 127,775 | |
| | | | | | | | 172,430 | |
Health Care — 12.8% | | | | | | | | |
Biotech & Pharma — 9.7% | | | | | | | | |
Absci Corporation (b) | | | 6,000 | | | | 18,480 | |
ACADIA Pharmaceuticals, Inc. (a)(b) | | | 2,000 | | | | 32,500 | |
Amgen, Inc. (a) | | | 600 | | | | 187,470 | |
Amneal Pharmaceuticals, Inc. (a)(b) | | | 7,000 | | | | 44,450 | |
Amphastar Pharmaceuticals, Inc. (a)(b) | | | 3,000 | | | | 120,000 | |
ANI Pharmaceuticals, Inc. (a)(b) | | | 2,000 | | | | 127,360 | |
Biogen, Inc. (a)(b) | | | 300 | | | | 69,546 | |
C4 Therapeutics, Inc. (b) | | | 2,000 | | | | 9,240 | |
Catalyst Pharmaceuticals, Inc. (a)(b) | | | 5,000 | | | | 77,450 | |
Corcept Therapeutics, Inc. (a)(b) | | | 5,000 | | | | 162,450 | |
Dynavax Technologies Corporation (a)(b) | | | 4,000 | | | | 44,920 | |
Eli Lilly & Company (a) | | | 100 | | | | 90,538 | |
Exelixis, Inc. (a)(b) | | | 7,000 | | | | 157,290 | |
Gilead Sciences, Inc. (a) | | | 2,000 | | | | 137,220 | |
Halozyme Therapeutics, Inc. (a)(b) | | | 2,000 | | | | 104,720 | |
Harmony Biosciences Holdings, Inc. (a)(b) | | | 1,000 | | | | 30,170 | |
Incyte Corporation (a)(b) | | | 1,500 | | | | 90,930 | |
Innoviva, Inc. (a)(b) | | | 4,000 | | | | 65,600 | |
Johnson & Johnson (a) | | | 800 | | | | 116,928 | |
Hussman Strategic Allocation Fund
Schedule of Investments (continued) |
June 30, 2024 |
COMMON STOCKS — 61.4% (continued) | | Shares | | | Value | |
Health Care — 12.8% (continued) |
Biotech & Pharma — 9.7% (continued) | | | | | | | | |
Kiniksa Pharmaceuticals International plc (b) | | | 7,000 | | | $ | 130,690 | |
Marinus Pharmaceuticals, Inc. (b) | | | 4,000 | | | | 4,680 | |
Neurocrine Biosciences, Inc. (a)(b) | | | 1,200 | | | | 165,204 | |
Novo Nordisk A/S - ADR (a) | | | 2,000 | | | | 285,480 | |
Pacira BioSciences, Inc. (a)(b) | | | 1,000 | | | | 28,610 | |
Pfizer, Inc. | | | 2,000 | | | | 55,960 | |
Praxis Precision Medicines, Inc. (a)(b) | | | 1,000 | | | | 41,360 | |
Recursion Pharmaceuticals, Inc. - Class A (a)(b) | | | 5,000 | | | | 37,500 | |
Roivant Sciences Ltd. (a)(b) | | | 5,000 | | | | 52,850 | |
Vertex Pharmaceuticals, Inc. (a)(b) | | | 150 | | | | 70,308 | |
Voyager Therapeutics, Inc. (a)(b) | | | 2,500 | | | | 19,775 | |
| | | | | | | | 2,579,679 | |
Health Care Facilities & Services — 2.6% | | | | | | | | |
Centene Corporation (a)(b) | | | 1,000 | | | | 66,300 | |
CVS Health Corporation | | | 1,000 | | | | 59,060 | |
DaVita, Inc. (a)(b) | | | 900 | | | | 124,713 | |
HCA Healthcare, Inc. (a) | | | 300 | | | | 96,384 | |
Patterson Companies, Inc. (a) | | | 5,000 | | | | 120,600 | |
Progyny, Inc. (a)(b) | | | 3,000 | | | | 85,830 | |
UnitedHealth Group, Inc. (a) | | | 100 | | | | 50,926 | |
Universal Health Services, Inc. - Class B (a) | | | 500 | | | | 92,465 | |
| | | | | | | | 696,278 | |
Medical Equipment & Devices — 0.5% | | | | | | | | |
Avita Medical, Inc. (b) | | | 2,000 | | | | 15,840 | |
Exact Sciences Corporation (a)(b) | | | 2,000 | | | | 84,500 | |
Zynex, Inc. (a)(b) | | | 2,500 | | | | 23,300 | |
| | | | | | | | 123,640 | |
Industrials — 5.9% | | | | | | | | |
Commercial Support Services — 0.6% | | | | | | | | |
Cimpress plc (a)(b) | | | 1,200 | | | | 105,132 | |
H&R Block, Inc. (a) | | | 1,000 | | | | 54,230 | |
| | | | | | | | 159,362 | |
Electrical Equipment — 2.5% | | | | | | | | |
Allegion plc (a) | | | 1,000 | | | | 118,150 | |
American Superconductor Corporation (a)(b) | | | 6,000 | | | | 140,340 | |
Bel Fuse, Inc. - Class B | | | 600 | | | | 39,144 | |
Hussman Strategic Allocation Fund
Schedule of Investments (continued) |
June 30, 2024 |
COMMON STOCKS — 61.4% (continued) | | Shares | | | Value | |
Industrials — 5.9% (continued) |
Electrical Equipment — 2.5% (continued) |
Bloom Energy Corporation - Class A (a)(b) | | | 2,500 | | | $ | 30,600 | |
NEXTracker, Inc. - Class A (b) | | | 2,000 | | | | 93,760 | |
OSI Systems, Inc. (a)(b) | | | 500 | | | | 68,760 | |
Select Water Solutions, Inc. (a) | | | 5,000 | | | | 53,500 | |
Veritiv Holdings Company - Class A (a) | | | 500 | | | | 43,285 | |
Vontier Corporation (a) | | | 2,000 | | | | 76,400 | |
| | | | | | | | 663,939 | |
Engineering & Construction — 0.7% | | | | | | | | |
Dycom Industries, Inc. (a)(b) | | | 500 | | | | 84,380 | |
Primoris Services Corporation (a) | | | 2,000 | | | | 99,780 | |
| | | | | | | | 184,160 | |
Industrial Intermediate Prod — 0.1% | | | | | | | | |
Xometry, Inc. - Class A (b) | | | 2,000 | | | | 23,120 | |
| | | | | | | | | |
Industrial Support Services — 0.2% | | | | | | | | |
MSC Industrial Direct Company, Inc. - Class A (a) | | | 700 | | | | 55,517 | |
| | | | | | | | | |
Machinery — 0.6% | | | | | | | | |
Symbotic, Inc. (a)(b) | | | 4,500 | | | | 158,220 | |
| | | | | | | | | |
Transportation & Logistics — 0.9% | | | | | | | | |
FedEx Corporation (a) | | | 500 | | | | 149,920 | |
Heartland Express, Inc. (a) | | | 2,000 | | | | 24,660 | |
United Parcel Service, Inc. - Class B (a) | | | 500 | | | | 68,425 | |
| | | | | | | | 243,005 | |
Transportation Equipment — 0.3% | | | | | | | | |
Allison Transmission Holdings, Inc. (a) | | | 1,000 | | | | 75,900 | |
| | | | | | | | | |
Materials — 2.3% | | | | | | | | |
Chemicals — 1.0% |
Celanese Corporation (a) | | | 500 | | | | 67,445 | |
CF Industries Holdings, Inc. | | | 500 | | | | 37,060 | |
Mosaic Company (The) (a) | | | 5,000 | | | | 144,500 | |
| | | | | | | | 249,005 | |
Hussman Strategic Allocation Fund
Schedule of Investments (continued) |
June 30, 2024 |
COMMON STOCKS — 61.4% (continued) | | Shares | | | Value | |
Materials — 2.3% (continued) |
Metals & Mining — 1.3% | | | | | | | | |
Agnico Eagle Mines Ltd. (a) | | | 1,600 | | | $ | 104,640 | |
Anglogold Ashanti plc | | | 1,600 | | | | 40,208 | |
Barrick Gold Corporation (a) | | | 6,000 | | | | 100,080 | |
Kinross Gold Corporation | | | 2,000 | | | | 16,640 | |
Newmont Corporation (a) | | | 1,600 | | | | 66,992 | |
Royal Gold, Inc. | | | 200 | | | | 25,032 | |
| | | | | | | | 353,592 | |
Real Estate — 0.1% | | | | | | | | |
Real Estate Owners & Developers — 0.1% |
Dream Finders Homes, Inc. - Class A (a)(b) | | | 1,000 | | | | 25,820 | |
| | | | | | | | | |
Technology — 14.5% | | | | | | | | |
Semiconductors — 2.9% | | | | | | | | |
ACM Research, Inc. - Class A (a)(b) | | | 10,000 | | | | 230,600 | |
Allegro MicroSystems, Inc. (a)(b) | | | 1,000 | | | | 28,240 | |
Applied Materials, Inc. (a) | | | 150 | | | | 35,398 | |
Axcelis Technologies, Inc. (a)(b) | | | 500 | | | | 71,095 | |
Intel Corporation (a) | | | 5,000 | | | | 154,850 | |
NVE Corporation | | | 900 | | | | 67,221 | |
NVIDIA Corporation | | | 100 | | | | 12,354 | |
Photronics, Inc. (a)(b) | | | 6,000 | | | | 148,020 | |
QUALCOMM, Inc. (a) | | | 200 | | | | 39,836 | |
| | | | | | | | 787,614 | |
Software — 4.8% | | | | | | | | |
Adobe, Inc. (a)(b) | | | 200 | | | | 111,108 | |
Akamai Technologies, Inc. (a)(b) | | | 2,000 | | | | 180,160 | |
Asana, Inc. - Class A (b) | | | 1,000 | | | | 13,990 | |
Bandwidth, Inc. - Class A (a)(b) | | | 6,000 | | | | 101,280 | |
Confluent, Inc. - Class A (b) | | | 1,000 | | | | 29,530 | |
Couchbase, Inc. (b) | | | 1,000 | | | | 18,260 | |
Dropbox, Inc. - Class A (a)(b) | | | 3,500 | | | | 78,645 | |
Dynatrace, Inc. (a)(b) | | | 500 | | | | 22,370 | |
Elastic N.V. (b) | | | 1,000 | | | | 113,910 | |
Fastly, Inc. - Class A (a)(b) | | | 8,000 | | | | 58,960 | |
Gen Digital, Inc. (a) | | | 1,000 | | | | 24,980 | |
Informatica, Inc. - Class A (a)(b) | | | 1,000 | | | | 30,880 | |
IonQ, Inc. (a)(b) | | | 17,000 | | | | 119,510 | |
Hussman Strategic Allocation Fund
Schedule of Investments (continued) |
June 30, 2024 |
COMMON STOCKS — 61.4% (continued) | | Shares | | | Value | |
Technology — 14.5% (continued) |
Software — 4.8% (continued) | | | | | | | | |
Microsoft Corporation (a) | | | 10 | | | $ | 4,469 | |
MongoDB, Inc. (b) | | | 100 | | | | 24,996 | |
Qualys, Inc. (a)(b) | | | 1,000 | | | | 142,600 | |
Salesforce, Inc. (a) | | | 200 | | | | 51,420 | |
Schrodinger, Inc. (a)(b) | | | 1,000 | | | | 19,340 | |
Twilio, Inc. - Class A (a)(b) | | | 600 | | | | 34,086 | |
Zoom Video Communications, Inc. - Class A (a)(b) | | | 1,500 | | | | 88,785 | |
| | | | | | | | 1,269,279 | |
Technology Hardware — 4.3% | | | | | | | | |
Apple, Inc. | | | 10 | | | | 2,106 | |
Applied Optoelectronics, Inc. (a)(b) | | | 8,500 | | | | 70,465 | |
Benchmark Electronics, Inc. (a) | | | 1,000 | | | | 39,460 | |
Ciena Corporation (a)(b) | | | 1,000 | | | | 48,180 | |
Cisco Systems, Inc. (a) | | | 2,000 | | | | 95,020 | |
Clearfield, Inc. (a)(b) | | | 1,000 | | | | 38,560 | |
Dell Technologies, Inc. - Class C (a) | | | 500 | | | | 68,955 | |
F5, Inc. (a)(b) | | | 800 | | | | 137,784 | |
Flex Ltd. (a)(b) | | | 3,000 | | | | 88,470 | |
InterDigital, Inc. (a) | | | 1,000 | | | | 116,560 | |
Jabil, Inc. (a) | | | 1,000 | | | | 108,790 | |
NetApp, Inc. (a) | | | 1,000 | | | | 128,800 | |
Pure Storage, Inc. - Class A (b) | | | 100 | | | | 6,421 | |
Super Micro Computer, Inc. (a)(b) | | | 50 | | | | 40,968 | |
Ubiquiti, Inc. (a) | | | 1,000 | | | | 145,660 | |
| | | | | | | | 1,136,199 | |
Technology Services — 2.5% | | | | | | | | |
Cognizant Technology Solutions Corporation - Class A (a) | | | 2,500 | | | | 170,000 | |
Corpay, Inc. (a)(b) | | | 500 | | | | 133,205 | |
Infosys Ltd. - ADR (a) | | | 6,000 | | | | 111,720 | |
International Business Machines Corporation | | | 500 | | | | 86,475 | |
Pagseguro Digital Ltd. - Class A (a)(b) | | | 10,000 | | | | 116,900 | |
PayPal Holdings, Inc. (a)(b) | | | 1,000 | | | | 58,030 | |
| | | | | | | | 676,330 | |
Utilities — 0.7% | | | | | | | | |
Electric Utilities — 0.3% | | | | | | | | |
Fluence Energy, Inc. (b) | | | 2,000 | | | | 34,680 | |
Hussman Strategic Allocation Fund
Schedule of Investments (continued) |
June 30, 2024 |
COMMON STOCKS — 61.4% (continued) | | Shares | | | Value | |
Utilities — 0.7% (continued) | | | | | | | | |
Electric Utilities — 0.3% (continued) | | | | | | | | |
NRG Energy, Inc. | | | 500 | | | $ | 38,930 | |
| | | | | | | | 73,610 | |
Water Utilities — 0.4% |
Consolidated Water Company, Ltd. (a) | | | 4,000 | | | | 106,160 | |
| | | | | | | | | |
Total Common Stocks (Cost $17,024,586) | | | | | | $ | 16,332,853 | |
U.S. TREASURY OBLIGATIONS — 33.5% | | Par Value | | | Value | |
U.S. Treasury Bills (c) — 14.7% | | | | | | | | |
5.333%, due 10/31/2024 | | $ | 2,000,000 | | | $ | 1,964,993 | |
5.318%, due 12/12/2024 | | | 2,000,000 | | | | 1,953,390 | |
| | | | | | | | 3,918,383 | |
U.S. Treasury Bonds — 1.5% | | | | | | | | |
3.000%, due 05/15/2047 | | | 500,000 | | | | 384,746 | |
| | | | | | | | | |
U.S. Treasury Inflation-Protected Bonds — 1.9% | | | | | | | | |
2.125%, due 02/15/2054 | | | 511,070 | | | | 501,548 | |
| | | | | | | | | |
U.S. Treasury Inflation-Protected Notes — 10.1% | | | | | | | | |
0.125%, due 04/15/2026 | | | 1,195,450 | | | | 1,142,188 | |
0.125%, due 04/15/2027 | | | 555,255 | | | | 522,566 | |
0.125%, due 01/15/2031 | | | 602,165 | | | | 532,505 | |
1.750%, due 01/15/2034 | | | 510,545 | | | | 496,824 | |
| | | | | | | | 2,694,083 | |
U.S. Treasury Notes — 5.3% | | | | | | | | |
4.500%, due 03/31/2026 | | | 1,000,000 | | | | 994,883 | |
0.625%, due 08/15/2030 | | | 500,000 | | | | 401,250 | |
| | | | | | | | 1,396,133 | |
| | | | | | | | | |
Total U.S. Treasury Obligations (Cost $9,083,854) | | | | | | $ | 8,894,893 | |
WARRANTS — 0.0% (d) | | Shares | | | Value | |
Energy — 0.0% (d) | | | | | | | | |
Oil & Gas Services & Equipment — 0.0% (d) | | | | | | | | |
Nabors Industries Ltd., expires 06/11/2026 (Cost $0) | | | 240 | | | $ | 1,584 | |
Hussman Strategic Allocation Fund
Schedule of Investments (continued) |
June 30, 2024 |
EXCHANGE-TRADED PUT OPTION CONTRACTS — 0.0% (d) | | Contracts | | | Notional
Amount | | | Value | |
Russell 2000® Index Option, 09/20/2024 at $1,600 | | | 34 | | | $ | 6,962,149 | | | $ | 10,880 | |
S&P 500® Index Option, 09/20/2024 at $3,600 | | | 14 | | | | 7,644,672 | | | | 3,290 | |
Total Put Option Contracts (Cost $25,604) | | | | | | $ | 14,606,821 | | | $ | 14,170 | |
| | | | | | | | | | | | | |
Total Investments at Value — 94.9% (Cost $26,134,044) | | | | | | | | | | $ | 25,243,500 | |
MONEY MARKET FUNDS — 19.7% | | Shares | | | Value | |
Invesco Treasury Portfolio - Institutional Class, 5.23% (e) (Cost $5,225,966) | | | 5,225,966 | | | $ | 5,225,966 | |
| | | | | | | | | |
Total Investments and Money Market Funds at Value — 114.6% (Cost $31,360,010) | | | | | | $ | 30,469,466 | |
| | | | | | | | | |
Written Call Option Contracts - (15.9%) | | | | | | | (4,229,580 | ) |
| | | | | | | | | |
Other Assets in Excess of Liabilities — 1.3% | | | | | | | 347,545 | |
| | | | | | | | | |
Net Assets — 100.0% | | | | | | $ | 26,587,431 | |
ADR - American Depositary Receipt. |
(a) | All or portion of the security is used as collateral to cover written call options. The total value of the securities held as collateral as of June 30, 2024 was $14,659,450. |
(b) | Non-income producing security. |
(c) | Rate shown is the annualized yield at time of purchase, not a coupon rate. |
(d) | Percentage rounds to less than 0.1%. |
(e) | The rate shown is the 7-day effective yield as of June 30, 2024. |
See accompanying notes to financial statements. |
Hussman Strategic Allocation Fund
Schedule of Open Written Option Contracts |
June 30, 2024 |
EXCHANGE-TRADED WRITTEN CALL OPTION CONTRACTS | | Contracts | | | Notional
Amount | | | Strike
Price | | | Expiration
Date | | | Value of
Options | |
Call Option Contracts |
Russell 2000® Index Option | | | 34 | | | $ | 6,962,149 | | | $ | 1,600 | | | | 09/20/2024 | | | $ | 1,571,820 | |
S&P 500® Index Option | | | 14 | | | | 7,644,672 | | | | 3,600 | | | | 09/20/2024 | | | | 2,657,760 | |
Total Written Call Option Contracts (Premiums received $4,074,814) | | | | | | $ | 14,606,821 | | | | | | | | | | | $ | 4,229,580 | |
See accompanying notes to financial statements. |
Hussman Strategic Total Return Fund
Schedule of Investments |
June 30, 2024 |
COMMON STOCKS — 9.4% | | Shares | | | Value | |
Energy — 1.0% | | | | | | | | |
Oil & Gas Producers — 1.0% | | | | | | | | |
California Resources Corporation | | | 15,000 | | | $ | 798,300 | |
DT Midstream, Inc. | | | 500 | | | | 35,515 | |
Vital Energy, Inc. (a) | | | 20,000 | | | | 896,400 | |
| | | | | | | | 1,730,215 | |
Materials — 7.4% | | | | | | | | |
Metals & Mining — 7.4% | | | | | | | | |
Agnico Eagle Mines Ltd. | | | 48,000 | | | | 3,139,200 | |
Anglogold Ashanti plc | | | 48,000 | | | | 1,206,240 | |
B2Gold Corporation | | | 1,000,000 | | | | 2,700,000 | |
Barrick Gold Corporation | | | 180,000 | | | | 3,002,400 | |
Kinross Gold Corporation | | | 60,000 | | | | 499,200 | |
Newmont Corporation | | | 48,000 | | | | 2,009,760 | |
Royal Gold, Inc. | | | 6,000 | | | | 750,960 | |
| | | | | | | | 13,307,760 | |
Utilities — 1.0% | | | | | | | | |
Electric Utilities — 1.0% | | | | | | | | |
AES Corporation (The) | | | 1,000 | | | | 17,570 | |
ALLETE, Inc. | | | 1,000 | | | | 62,350 | |
Ameren Corporation | | | 100 | | | | 7,111 | |
American Electric Power Company, Inc. | | | 100 | | | | 8,774 | |
Avangrid, Inc. | | | 1,000 | | | | 35,530 | |
Avista Corporation | | | 1,000 | | | | 34,610 | |
Black Hills Corporation | | | 500 | | | | 27,190 | |
Consolidated Edison, Inc. | | | 1,000 | | | | 89,420 | |
Dominion Energy, Inc. | | | 500 | | | | 24,500 | |
DTE Energy Company | | | 100 | | | | 11,101 | |
Duke Energy Corporation | | | 500 | | | | 50,115 | |
Edison International | | | 500 | | | | 35,905 | |
Entergy Corporation | | | 500 | | | | 53,500 | |
Exelon Corporation | | | 1,000 | | | | 34,610 | |
FirstEnergy Corporation | | | 1,000 | | | | 38,270 | |
Hawaiian Electric Industries, Inc. | | | 1,000 | | | | 9,020 | |
NorthWestern Energy Group, Inc. | | | 1,000 | | | | 50,080 | |
NRG Energy, Inc. | | | 12,000 | | | | 934,320 | |
Hussman Strategic Total Return Fund
Schedule of Investments (continued) |
June 30, 2024 |
COMMON STOCKS — 9.4% (continued) | | Shares | | | Value | |
Utilities — 1.0% (continued) | | | | | | | | |
Electric Utilities — 1.0% (continued) | | | | | | | | |
Otter Tail Corporation | | | 1,000 | | | $ | 87,590 | |
Pinnacle West Capital Corporation | | | 1,000 | | | | 76,380 | |
Portland General Electric Company | | | 1,000 | | | | 43,240 | |
PPL Corporation | | | 1,000 | | | | 27,650 | |
Public Service Enterprise Group, Inc. | | | 500 | | | | 36,850 | |
Southern Company (The) | | | 500 | | | | 38,785 | |
| | | | | | | | 1,834,471 | |
Gas & Water Utilities — 0.0% (b) | | | | | | | | |
Global Water Resources, Inc. | | | 1,000 | | | | 12,100 | |
| | | | | | | | | |
Total Common Stocks (Cost $15,617,909) | | | | | | $ | 16,884,546 | |
EXCHANGE-TRADED FUNDS — 1.8% | | Shares | | | Value | |
Invesco CurrencyShares British Pound Sterling Trust | | | 10,000 | | | $ | 1,217,206 | |
Invesco CurrencyShares Euro Currency Trust | | | 12,500 | | | | 1,237,000 | |
Invesco CurrencyShares Japanese Yen Trust (a) | | | 12,500 | | | | 719,062 | |
Total Exchange-Traded Funds (Cost $3,329,990) | | | | | | $ | 3,173,268 | |
U.S. TREASURY OBLIGATIONS — 81.0% | | Par Value | | | Value | |
U.S. Treasury Bills (c) — 10.9% | | | | | | | | |
5.318%, due 12/12/2024 | | $ | 20,000,000 | | | $ | 19,533,898 | |
| | | | | | | | | |
U.S. Treasury Bonds — 2.1% | | | | | | | | |
3.000%, due 05/15/2047 | | | 5,000,000 | | | | 3,847,461 | |
| | | | | | | | | |
U.S. Treasury Inflation-Protected Bonds — 2.8% | | | | | | | | |
2.125%, due 02/15/2054 | | | 5,110,700 | | | | 5,015,485 | |
| | | | | | | | | |
U.S. Treasury Inflation-Protected Notes — 41.0% | | | | | | | | |
0.125%, due 04/15/2026 | | | 11,954,500 | | | | 11,421,882 | |
0.125%, due 04/15/2027 | | | 22,210,200 | | | | 20,902,644 | |
2.500%, due 01/15/2029 | | | 14,602,100 | | | | 14,866,555 | |
0.125%, due 01/15/2030 | | | 12,185,300 | | | | 10,980,351 | |
0.125%, due 01/15/2031 | | | 12,043,300 | | | | 10,650,102 | |
1.750%, due 01/15/2034 | | | 5,105,450 | | | | 4,968,235 | |
| | | | | | | | 73,789,769 | |
Hussman Strategic Total Return Fund
Schedule of Investments (continued) |
June 30, 2024 |
U.S. TREASURY OBLIGATIONS — 81.0% (continued) | | Par Value | | | Value | |
U.S. Treasury Notes — 24.2% | | | | | | | | |
1.375%, due 01/31/2025 | | $ | 15,000,000 | | | $ | 14,664,381 | |
4.500%, due 03/31/2026 | | | 10,000,000 | | | | 9,948,828 | |
2.125%, due 05/31/2026 | | | 10,000,000 | | | | 9,524,609 | |
1.500%, due 08/15/2026 | | | 10,000,000 | | | | 9,359,766 | |
| | | | | | | | 43,497,584 | |
| | | | | | | | | |
Total U.S. Treasury Obligations (Cost $150,359,052) | | | | | | $ | 145,684,197 | |
WARRANTS — 0.0% (b) | | Shares | | | Value | |
Energy — 0.0% (b) | | | | | | | | |
Oil & Gas Services & Equipment — 0.0% (b) | | | | | | | | |
Nabors Industries Ltd., expires 06/11/2026 (Cost $0) | | | 8,000 | | | $ | 52,800 | |
| | | | | | | | | |
Total Investments at Value — 92.2% (Cost $169,306,951) | | | | | | $ | 165,794,811 | |
MONEY MARKET FUNDS — 7.8% | | Shares | | | Value | |
Invesco Treasury Portfolio - Institutional Class, 5.23% (d) (Cost $14,026,018) | | | 14,026,018 | | | $ | 14,026,018 | |
| | | | | | | | | |
Total Investments and Money Market Funds at Value — 100.0% (Cost $183,332,969) | | | | | | $ | 179,820,829 | |
| | | | | | | | | |
Liabilities in Excess of Other Assets — 0.0% (b) | | | | | | | (69,081 | ) |
| | | | | | | | | |
Net Assets — 100.0% | | | | | | $ | 179,751,748 | |
(a) | Non-income producing security. |
(b) | Percentage rounds to less than 0.1%. |
(c) | Rate shown is the annualized yield at time of purchase, not a coupon rate. |
(d) | The rate shown is the 7-day effective yield as of June 30, 2024. |
See accompanying notes to financial statements. |
Hussman Investment Trust
Statements of Assets and Liabilities |
June 30, 2024 |
| | | Hussman
Strategic
Growth Fund | | | Hussman
Strategic
Allocation Fund | | | Hussman
Strategic Total
Return Fund | |
ASSETS | | | | | | | | | | | | |
Investments in securities: | | | | | | | | | | | | |
At cost | | $ | 347,152,717 | | | $ | 26,134,044 | | | $ | 169,306,951 | |
At value (Note 1) | | $ | 331,660,274 | | | $ | 25,243,500 | | | $ | 165,794,811 | |
Investments in money market funds | | | 149,687,846 | | | | 5,225,966 | | | | 14,026,018 | |
Due from Adviser (Note 3) | | | — | | | | 9,808 | | | | — | |
Receivable for capital shares sold | | | 150,224 | | | | 52 | | | | 11,503 | |
Receivable for investment securities sold | | | 9,805,232 | | | | 483,149 | | | | — | |
Dividends and interest receivable | | | 709,961 | | | | 58,236 | | | | 647,837 | |
Tax reclaims receivable | | | 8,509 | | | | 181 | | | | — | |
Other assets | | | 56,563 | | | | 31,921 | | | | 66,439 | |
Total Assets | | | 492,078,609 | | | | 31,052,813 | | | | 180,546,608 | |
| | | | | | | | | | | | | |
LIABILITIES | | | | | | | | | | | | |
Written call options, at value (Notes 1 and 4) (premiums received $155,204,710 and $4,074,814) | | | 160,991,730 | | | | 4,229,580 | | | | — | |
Distributions payable | | | — | | | | 4,332 | | | | 193,540 | |
Payable for capital shares redeemed | | | 895,963 | | | | 8,591 | | | | 497,956 | |
Payable for investment securities purchased | | | 6,233,697 | | | | 193,473 | | | | — | |
Accrued investment advisory fees (Note 3) | | | 190,767 | | | | — | | | | 53,887 | |
Payable to administrator (Note 3) | | | 27,900 | | | | 6,220 | | | | 16,300 | |
Accrued account maintenance and shareholder servicing fees (Note 3) | | | 24,030 | | | | 629 | | | | 10,980 | |
Other accrued expenses | | | 27,987 | | | | 22,557 | | | | 22,197 | |
Total Liabilities | | | 168,392,074 | | | | 4,465,382 | | | | 794,860 | |
NET ASSETS | | $ | 323,686,535 | | | $ | 26,587,431 | | | $ | 179,751,748 | |
| | | | | | | | | | | | | |
Net assets consist of: | | | | | | | | | | | | |
Paid-in capital | | $ | 1,262,363,189 | | | $ | 29,813,396 | | | $ | 229,319,441 | |
Accumulated deficit | | | (938,676,654 | ) | | | (3,225,965 | ) | | | (49,567,693 | ) |
NET ASSETS | | $ | 323,686,535 | | | $ | 26,587,431 | | | $ | 179,751,748 | |
| | | | | | | | | | | | | |
Shares of beneficial interest outstanding (unlimited number of shares authorized, no par value) | | | 57,344,401 | | | | 2,869,286 | | | | 12,763,512 | |
| | | | | | | | | | | | | |
Net asset value, offering price and redemption price per share (Note 1) | | $ | 5.64 | | | $ | 9.27 | | | $ | 14.08 | |
See accompanying notes to financial statements. |
Hussman Investment Trust
Statements of Operations |
For the Year Ended June 30, 2024 |
| | | Hussman
Strategic
Growth Fund | | | Hussman
Strategic
Allocation Fund | | | Hussman
Strategic Total
Return Fund | |
INVESTMENT INCOME | | | | | | | | | | | | |
Dividends | | $ | 14,665,549 | | | $ | 661,001 | | | $ | 1,479,585 | |
Foreign withholding taxes on dividends | | | (55,531 | ) | | | (2,474 | ) | | | (71,540 | ) |
Interest | | | — | | | | 219,735 | | | | 5,563,794 | |
Total Investment Income | | | 14,610,018 | | | | 878,262 | | | | 6,971,839 | |
| | | | | | | | | | | | | |
EXPENSES | | | | | | | | | | | | |
Investment advisory fees (Note 3) | | | 3,562,996 | | | | 207,859 | | | | 982,386 | |
Administration fees (Note 3) | | | 276,886 | | | | 24,000 | | | | 137,500 | |
Trustees’ fees and expenses (Note 3) | | | 104,186 | | | | 104,186 | | | | 104,186 | |
Account maintenance and shareholder services fees (Note 3) | | | 159,481 | | | | 5,872 | | | | 77,169 | |
Fund accounting fees (Note 3) | | | 70,553 | | | | 32,776 | | | | 49,643 | |
Legal fees | | | 44,464 | | | | 44,464 | | | | 44,464 | |
Registration and filing fees | | | 38,799 | | | | 40,653 | | | | 39,088 | |
Insurance expense | | | 63,428 | | | | 12,186 | | | | 33,479 | |
Transfer agent fees (Note 3) | | | 51,605 | | | | 18,000 | | | | 24,631 | |
Custodian and bank service fees | | | 55,703 | | | | 13,611 | | | | 13,876 | |
Compliance service fees (Note 3) | | | 33,081 | | | | 9,260 | | | | 20,159 | |
Audit and tax services fees | | | 20,749 | | | | 20,749 | | | | 20,749 | |
Postage and supplies | | | 35,961 | | | | 4,615 | | | | 15,758 | |
Printing of shareholder reports | | | 13,192 | | | | 9,267 | | | | 10,816 | |
Borrowing expense (Note 6) | | | — | | | | — | | | | 843 | |
Other expenses | | | 42,676 | | | | 43,350 | | | | 32,199 | |
Total Expenses | | | 4,573,760 | | | | 590,848 | | | | 1,606,946 | |
Previous fee waivers and Fund expenses recovered by the Adviser (Note 3) | | | 16,996 | | | | — | | | | — | |
Less fee waivers and Fund expenses absorbed by the Adviser (Note 3) | | | (49,483 | ) | | | (244,935 | ) | | | (135,372 | ) |
Net Expenses | | | 4,541,273 | | | | 345,913 | | | | 1,471,574 | |
| | | | | | | | | | | | | |
NET INVESTMENT INCOME | | | 10,068,745 | | | | 532,349 | | | | 5,500,265 | |
Hussman Investment Trust
Statements of Operations (continued) |
For the Year Ended June 30, 2024 |
| | | Hussman
Strategic
Growth Fund | | | Hussman
Strategic
Allocation Fund | | | Hussman
Strategic Total
Return Fund | |
| | | | | | | | | | | | | |
REALIZED AND UNREALIZED GAINS (LOSSES) ON INVESTMENTS AND WRITTEN OPTION CONTRACTS | | | | | | | | | | | | |
Net realized gains (losses) from: | | | | | | | | | | | | |
Investments | | | 18,376,941 | | | | 2,152,520 | | | | 1,748,632 | |
Written option contracts (Note 4) | | | (83,875,457 | ) | | | (3,140,313 | ) | | | — | |
Net change in unrealized appreciation (depreciation) on: | | | | | | | | | | | | |
Investments | | | 221,161 | | | | 136,770 | | | | 5,218,492 | |
Written option contracts (Note 4) | | | 23,099,967 | | | | 708,206 | | | | — | |
| | | | | | | | | | | | | |
NET REALIZED AND UNREALIZED GAINS (LOSSES) ON INVESTMENTS AND WRITTEN OPTION CONTRACTS | | | (42,177,388 | ) | | | (142,817 | ) | | | 6,967,124 | |
| | | | | | | | | | | | | |
NET INCREASE (DECREASE) IN NET ASSETS RESULTING FROM OPERATIONS | | $ | (32,108,643 | ) | | $ | 389,532 | | | $ | 12,467,389 | |
See accompanying notes to financial statements. |
Hussman Strategic Growth Fund
Statements of Changes in Net Assets |
|
| | Year Ended
June 30,
2024 | | | Year Ended
June 30,
2023 | |
FROM OPERATIONS | | | | | | | | |
Net investment income | | $ | 10,068,745 | | | $ | 10,088,237 | |
Net realized gains (losses) from: | | | | | | | | |
Investments | | | 18,376,941 | | | | (41,105,139 | ) |
Written option contracts | | | (83,875,457 | ) | | | (17,435,013 | ) |
Net change in unrealized appreciation (depreciation) on: | | | | | | | | |
Investments | | | 221,161 | | | | 56,242,173 | |
Written option contracts | | | 23,099,967 | | | | (53,515,266 | ) |
Net decrease in net assets resulting from operations | | | (32,108,643 | ) | | | (45,725,008 | ) |
| | | | | | | | | |
DISTRIBUTIONS TO SHAREHOLDERS (Note 1) | | | (11,452,340 | ) | | | (5,831,678 | ) |
| | | | | | | | | |
FROM CAPITAL SHARE TRANSACTIONS | | | | | | | | |
Proceeds from shares sold | | | 44,141,635 | | | | 151,356,699 | |
Net asset value of shares issued in reinvestment of distributions to shareholders | | | 10,191,098 | | | | 5,079,128 | |
Proceeds from redemption fees collected (Note 1) | | | — | | | | 81,726 | |
Payments for shares redeemed | | | (153,313,133 | ) | | | (145,729,897 | ) |
Net increase (decrease) in net assets from capital share transactions | | | (98,980,400 | ) | | | 10,787,656 | |
| | | | | | | | | |
TOTAL DECREASE IN NET ASSETS | | | (142,541,383 | ) | | | (40,769,030 | ) |
| | | | | | | | | |
NET ASSETS | | | | | | | | |
Beginning of year | | | 466,227,918 | | | | 506,996,948 | |
End of year | | $ | 323,686,535 | | | $ | 466,227,918 | |
| | | | | | | | | |
CAPITAL SHARE ACTIVITY | | | | | | | | |
Shares sold | | | 7,162,272 | | | | 21,891,908 | |
Shares reinvested | | | 1,678,929 | | | | 717,391 | |
Shares redeemed | | | (24,688,026 | ) | | | (21,393,905 | ) |
Net increase (decrease) in shares outstanding | | | (15,846,825 | ) | | | 1,215,394 | |
Shares outstanding at beginning of year | | | 73,191,226 | | | | 71,975,832 | |
Shares outstanding at end of year | | | 57,344,401 | | | | 73,191,226 | |
See accompanying notes to financial statements. |
Hussman Strategic Allocation Fund
Statements of Changes in Net Assets |
|
| | | Year Ended
June 30,
2024 | | | Year Ended
June 30,
2023 | |
FROM OPERATIONS | | | | | | | | |
Net investment income | | $ | 532,349 | | | $ | 316,543 | |
Net realized gains (losses) from: | | | | | | | | |
Investments | | | 2,152,520 | | | | (1,167,181 | ) |
Written option contracts | | | (3,140,313 | ) | | | 844,051 | |
Net change in unrealized appreciation (depreciation) on: | | | | | | | | |
Investments | | | 136,770 | | | | 2,226,022 | |
Written option contracts | | | 708,206 | | | | (1,695,308 | ) |
Net increase net assets resulting from operations | | | 389,532 | | | | 524,127 | |
| | | | | | | | | |
DISTRIBUTIONS TO SHAREHOLDERS (Note 1) | | | (535,135 | ) | | | (4,234,623 | ) |
| | | | | | | | | |
FROM CAPITAL SHARE TRANSACTIONS | | | | | | | | |
Proceeds from shares sold | | | 3,663,683 | | | | 12,848,025 | |
Net asset value of shares issued in reinvestment of distributions to shareholders | | | 520,588 | | | | 4,105,135 | |
Proceeds from redemption fees collected (Note 1) | | | — | | | | 2,551 | |
Payments for shares redeemed | | | (5,190,049 | ) | | | (7,079,434 | ) |
Net increase (decrease) in net assets from capital share transactions | | | (1,005,778 | ) | | | 9,876,277 | |
| | | | | | | | | |
TOTAL INCREASE (DECREASE) IN NET ASSETS | | | (1,151,381 | ) | | | 6,165,781 | |
| | | | | | | | | |
NET ASSETS | | | | | | | | |
Beginning of year | | | 27,738,812 | | | | 21,573,031 | |
End of year | | $ | 26,587,431 | | | $ | 27,738,812 | |
| | | | | | | | | |
CAPITAL SHARE ACTIVITY | | | | | | | | |
Shares sold | | | 391,423 | | | | 1,307,195 | |
Shares reinvested | | | 55,603 | | | | 430,014 | |
Shares redeemed | | | (554,240 | ) | | | (735,346 | ) |
Net increase (decrease) in shares outstanding | | | (107,214 | ) | | | 1,001,863 | |
Shares outstanding at beginning of year | | | 2,976,500 | | | | 1,974,637 | |
Shares outstanding at end of year | | | 2,869,286 | | | | 2,976,500 | |
See accompanying notes to financial statements. |
Hussman Strategic Total Return Fund
Statements of Changes in Net Assets |
|
| | | Year Ended
June 30,
2024 | | | Year Ended
June 30,
2023 | |
FROM OPERATIONS | | | | | | | | |
Net investment income | | $ | 5,500,265 | | | $ | 5,511,582 | |
Net realized gains (losses) from investments | | | 1,748,632 | | | | (7,647,733 | ) |
Net change in unrealized appreciation (depreciation) on investments | | | 5,218,492 | | | | 994,293 | |
Net increase (decrease) in net assets resulting from operations | | | 12,467,389 | | | | (1,141,858 | ) |
| | | | | | | | | |
DISTRIBUTIONS TO SHAREHOLDERS (Note 1) | | | (5,681,172 | ) | | | (5,172,237 | ) |
| | | | | | | | | |
FROM CAPITAL SHARE TRANSACTIONS | | | | | | | | |
Proceeds from shares sold | | | 8,070,359 | | | | 18,315,533 | |
Net asset value of shares issued in reinvestment of distributions to shareholders | | | 5,214,599 | | | | 4,774,620 | |
Proceeds from redemption fees collected (Note 1) | | | — | | | | 8,496 | |
Payments for shares redeemed | | | (55,574,518 | ) | | | (65,216,881 | ) |
Net decrease in net assets from capital share transactions | | | (42,289,560 | ) | | | (42,118,232 | ) |
| | | | | | | | | |
TOTAL DECREASE IN NET ASSETS | | | (35,503,343 | ) | | | (48,432,327 | ) |
| | | | | | | | | |
NET ASSETS | | | | | | | | |
Beginning of year | | | 215,255,091 | | | | 263,687,418 | |
End of year | | $ | 179,751,748 | | | $ | 215,255,091 | |
| | | | | | | | | |
CAPITAL SHARE ACTIVITY | | | | | | | | |
Shares sold | | | 587,235 | | | | 1,336,689 | |
Shares reinvested | | | 376,750 | | | | 353,794 | |
Shares redeemed | | | (4,044,540 | ) | | | (4,808,370 | ) |
Net decrease in shares outstanding | | | (3,080,555 | ) | | | (3,117,887 | ) |
Shares outstanding at beginning of year | | | 15,844,067 | | | | 18,961,954 | |
Shares outstanding at end of year | | | 12,763,512 | | | | 15,844,067 | |
See accompanying notes to financial statements. |
Financial Highlights
Hussman Strategic Growth Fund
Financial Highlights |
Selected Per Share Data and Ratios for a Share Outstanding Throughout Each Year |
| | | Year
Ended
June 30,
2024 | | | Year
Ended
June 30,
2023 | | | Year
Ended
June 30,
2022 | | | Year
Ended
June 30,
2021 | | | Year
Ended
June 30,
2020 | |
Net asset value at beginning of year | | $ | 6.37 | | | $ | 7.04 | | | $ | 6.77 | | | $ | 6.12 | | | $ | 5.87 | |
| | | | | | | | | | | | | | | | | | | | | |
Income (loss) from investment operations: | | | | | | | | | | | | | | | | | | | | |
Net investment income | | | 0.19 | | | | 0.13 | | | | 0.05 | | | | 0.01 | | | | 0.06 | |
Net realized and unrealized gains (losses) on investments and written option contracts | | | (0.73 | ) | | | (0.72 | ) | | | 0.25 | | | | 0.65 | | | | 0.29 | |
Total from investment operations | | | (0.54 | ) | | | (0.59 | ) | | | 0.30 | | | | 0.66 | | | | 0.35 | |
| | | | | | | | | | | | | | | | | | | | | |
Less distributions from: | | | | | | | | | | | | | | | | | | | | |
Net investment income | | | (0.19 | ) | | | (0.08 | ) | | | (0.03 | ) | | | (0.01 | ) | | | (0.10 | ) |
| | | | | | | | | | | | | | | | | | | | | |
Proceeds from redemption fees collected (Note 1) | | | — | | | | 0.00 | (a) | | | 0.00 | (a) | | | 0.00 | (a) | | | 0.00 | (a) |
| | | | | | | | | | | | | | | | | | | | | |
Net asset value at end of year | | $ | 5.64 | | | $ | 6.37 | | | $ | 7.04 | | | $ | 6.77 | | | $ | 6.12 | |
| | | | | | | | | | | | | | | | | | | | | |
Total return (b) | | | (8.72 | %) | | | (8.54 | %) | | | 4.43 | % | | | 10.80 | % | | | 6.17 | % |
| | | | | | | | | | | | | | | | | | | | | |
Net assets at end of year (000’s) | | $ | 323,687 | | | $ | 466,228 | | | $ | 506,997 | | | $ | 412,898 | | | $ | 308,774 | |
| | | | | | | | | | | | | | | | | | | | | |
Ratio of total expenses to average net assets | | | 1.16 | % | | | 1.12 | % | | | 1.14 | % | | | 1.19 | % | | | 1.26 | % |
| | | | | | | | | | | | | | | | | | | | | |
Ratio of net expenses to average net assets (c) | | | 1.15 | % | | | 1.15 | % | | | 1.15 | % | | | 1.15 | % | | | 1.15 | % |
| | | | | | | | | | | | | | | | | | | | | |
Ratio of net investment income to average net assets (c) | | | 2.55 | % | | | 1.97 | % | | | 0.74 | % | | | 0.09 | % | | | 0.87 | % |
| | | | | | | | | | | | | | | | | | | | | |
Portfolio turnover rate | | | 113 | % | | | 79 | % | | | 113 | % | | | 198 | % | | | 167 | % |
(a) | Amount rounds to less than $0.01 per share. |
(b) | Total return is a measure of the change in value of an investment in the Fund over the period covered, which assumes any dividends or capital gains distributions are reinvested in shares of the Fund. Returns do not reflect the deduction of taxes a shareholder would pay on Fund distributions or the redemption of Fund shares. |
(c) | Ratio was determined after advisory fee waivers and/or recovery. (Note 3). |
See accompanying notes to financial statements. |
Hussman Strategic Allocation Fund
Financial Highlights |
Selected Per Share Data and Ratios for a Share Outstanding Throughout Each Period |
| | | Year
Ended
June 30,
2024 | | | Year
Ended
June 30,
2023 | | | Year
Ended
June 30,
2022 | | | Year
Ended
June 30,
2021 | | | Period
Ended
June 30,
2020 (a) | |
Net asset value at beginning of period | | $ | 9.32 | | | $ | 10.93 | | | $ | 11.70 | | | $ | 10.32 | | | $ | 10.00 | |
| | | | | | | | | | | | | | | | | | | | | |
Income (loss) from investment operations: | | | | | | | | | | | | | | | | | | | | |
Net investment income (loss) | | | 0.18 | | | | 0.12 | | | | 0.04 | | | | (0.02 | ) | | | 0.03 | |
Net realized and unrealized gains (losses) on investments and written option contracts | | | (0.05 | ) | | | 0.13 | | | | (0.42 | ) | | | 1.98 | | | | 0.29 | |
Total from investment operations | | | 0.13 | | | | 0.25 | | | | (0.38 | ) | | | 1.96 | | | | 0.32 | |
| | | | | | | | | | | | | | | | | | | | | |
Less distributions from: | | | | | | | | | | | | | | | | | | | | |
Net investment income | | | (0.18 | ) | | | (0.12 | ) | | | (0.04 | ) | | | (0.01 | ) | | | (0.00 | )(b) |
Net realized gains | | | — | | | | (1.74 | ) | | | (0.35 | ) | | | (0.57 | ) | | | — | |
Total distributions | | | (0.18 | ) | | | (1.86 | ) | | | (0.39 | ) | | | (0.58 | ) | | | (0.00 | )(b) |
| | | | | | | | | | | | | | | | | | | | | |
Proceeds from redemption fees collected (Note 1) | | | — | | | | 0.00 | (b) | | | 0.00 | (b) | | | 0.00 | (b) | | | 0.00 | (b) |
| | | | | | | | | | | | | | | | | | | | | |
Net asset value at end of period | | $ | 9.27 | | | $ | 9.32 | | | $ | 10.93 | | | $ | 11.70 | | | $ | 10.32 | |
| | | | | | | | | | | | | | | | | | | | | |
Total return (c) | | | 1.43 | % | | | 2.06 | % | | | (3.19 | %) | | | 19.70 | % | | | 3.23 | %(d) |
| | | | | | | | | | | | | | | | | | | | | |
Net assets at end of period (000’s) | | $ | 26,587 | | | $ | 27,739 | | | $ | 21,573 | | | $ | 19,881 | | | $ | 8,093 | |
| | | | | | | | | | | | | | | | | | | | | |
Ratio of total expenses to average net assets | | | 2.14 | % | | | 2.16 | % | | | 2.08 | % | | | 2.87 | % | | | 4.67 | %(e) |
| | | | | | | | | | | | | | | | | | | | | |
Ratio of net expenses to average net assets (f) | | | 1.25 | % | | | 1.25 | % | | | 1.25 | % | | | 1.25 | % | | | 1.25 | %(e) |
| | | | | | | | | | | | | | | | | | | | | |
Ratio of net investment income (loss) to average net assets (f) | | | 1.92 | % | | | 1.32 | % | | | 0.42 | % | | | (0.11 | %) | | | 0.34 | %(e) |
| | | | | | | | | | | | | | | | | | | | | |
Portfolio turnover rate | | | 129 | % | | | 79 | % | | | 98 | % | | | 163 | % | | | 94 | %(d) |
(a) | Represents the period from the commencement of operations (August 27, 2019) through June 30, 2020. |
(b) | Amount rounds to less than $0.01 per share. |
(c) | Total return is a measure of the change in value of an investment in the Fund over the period covered, which assumes any dividends or capital gains distributions are reinvested in shares of the Fund. Returns do not reflect the deduction of taxes a shareholder would pay on Fund distributions or the redemption of Fund shares. |
(d) | Not annualized. |
(e) | Annualized. |
(f) | Ratio was determined after advisory fee waivers and absorption of Fund expenses by the Adviser (Note 3). |
See accompanying notes to financial statements. |
Hussman Strategic Total Return Fund
Financial Highlights |
Selected Per Share Data and Ratios for a Share Outstanding Throughout Each Year |
| | | Year
Ended
June 30,
2024 | | | Year
Ended
June 30,
2023 | | | Year
Ended
June 30,
2022 | | | Year
Ended
June 30,
2021 | | | Year
Ended
June 30,
2020 | |
Net asset value at beginning of year | | $ | 13.59 | | | $ | 13.91 | | | $ | 14.76 | | | $ | 14.50 | | | $ | 12.83 | |
| | | | | | | | | | | | | | | | | | | | | |
Income (loss) from investment operations: | | | | | | | | | | | | | | | | | | | | |
Net investment income | | | 0.40 | | | | 0.33 | | | | 0.26 | | | | 0.14 | | | | 0.13 | |
Net realized and unrealized gains (losses) on investments | | | 0.50 | | | | (0.34 | ) | | | (0.86 | ) | | | 0.25 | | | | 1.66 | |
Total from investment operations | | | 0.90 | | | | (0.01 | ) | | | 0.60 | | | | 0.39 | | | | 1.79 | |
| | | | | | | | | | | | | | | | | | | | | |
Less distributions from: | | | | | | | | | | | | | | | | | | | | |
Net investment income | | | (0.41 | ) | | | (0.31 | ) | | | (0.25 | ) | | | (0.13 | ) | | | (0.12 | ) |
| | | | | | | | | | | | | | | | | | | | | |
Proceeds from redemption fees collected (Note 1) | | | — | | | | 0.00 | (a) | | | 0.00 | (a) | | | 0.00 | (a) | | | 0.00 | (a) |
| | | | | | | | | | | | | | | | | | | | | |
Net asset value at end of year | | $ | 14.08 | | | $ | 13.59 | | | $ | 13.91 | | | $ | 14.76 | | | $ | 14.50 | |
| | | | | | | | | | | | | | | | | | | | | |
Total return (b) | | | 6.73 | % | | | (0.03 | %) | | | (4.14 | %) | | | 2.70 | % | | | 14.00 | % |
| | | | | | | | | | | | | | | | | | | | | |
Net assets at end of year (000’s) | | $ | 179,752 | | | $ | 215,255 | | | $ | 263,687 | | | $ | 316,539 | | | $ | 290,129 | |
| | | | | | | | | | | | | | | | | | | | | |
Ratio of total expenses to average net assets | | | 0.82 | % | | | 0.78 | % | | | 0.75 | % | | | 0.75 | % | | | 0.81 | % |
| | | | | | | | | | | | | | | | | | | | | |
Ratio of net expenses to average net assets (c) | | | 0.75 | % | | | 0.75 | % | | | 0.75 | % | | | 0.75 | % | | | 0.75 | % |
| | | | | | | | | | | | | | | | | | | | | |
Ratio of net investment income to average net assets (c) | | | 2.81 | % | | | 2.36 | % | | | 1.73 | % | | | 0.93 | % | | | 0.87 | % |
| | | | | | | | | | | | | | | | | | | | | |
Portfolio turnover rate | | | 55 | % | | | 42 | % | | | 22 | % | | | 38 | % | | | 88 | % |
(a) | Amount rounds to less than $0.01 per share. |
(b) | Total return is a measure of the change in value of an investment in the Fund over the period covered, which assumes any dividends or capital gains distributions are reinvested in shares of the Fund. Returns do not reflect the deduction of taxes a shareholder would pay on Fund distributions or the redemption of Fund shares. |
(c) | Ratio was determined after advisory fee waivers (Note 3). |
See accompanying notes to financial statements. |
Hussman Investment Trust
Notes to Financial Statements |
June 30, 2024 |
1. ORGANIZATION AND SIGNIFICANT ACCOUNTING POLICIES
Hussman Strategic Growth Fund, Hussman Strategic Allocation Fund and Hussman Strategic Total Return Fund (each, a “Fund,” and collectively, the “Funds”) are diversified, separate series of Hussman Investment Trust (the “Trust”), which is registered under the Investment Company Act of 1940, as amended (the “1940 Act”), as an open-end management investment company. Each Fund is authorized to issue an unlimited number of shares.
Hussman Strategic Growth Fund’s investment objective seeks to achieve long-term capital appreciation, with added emphasis on protection of capital during unfavorable market conditions.
Hussman Strategic Allocation Fund’s investment objective seeks to achieve total return through a combination of income and capital appreciation.
Hussman Strategic Total Return Fund’s investment objective seeks to achieve long-term total return from income and capital appreciation.
The following is a summary of significant accounting policies followed by the Funds. The policies are in conformity with accounting principles generally accepted in the United States of America (“GAAP”). Each Fund follows accounting and reporting guidance under Financial Accounting Standards Board Accounting Standards Codification Topic 946 “Financial Services – Investment Companies.”
Regulatory Update – Tailored Shareholder Reports for Mutual Funds and Exchange-Traded Funds (“ETFs”) – Effective January 24, 2023, the Securities and Exchange Commission (the “SEC”) adopted rule and form amendments to require mutual funds and ETFs to transmit concise and visually engaging streamlined annual and semiannual reports to shareholders that highlight key information. Other information, including financial statements, will no longer appear in a streamlined shareholder report but must be available online, delivered free of charge upon request, and filed on a semiannual basis on Form N-CSR. The rule and form amendments have a compliance date of July 24, 2024. The Funds have implemented the rule and form requirements, as applicable, and are currently adhering to the requirements.
Securities, Options and Futures Valuation — The Funds’ portfolio securities are valued at market value as of the close of regular trading on the New York Stock Exchange (“NYSE”) (normally, 4:00 p.m. Eastern time) on each business day the NYSE is open. Securities listed on the NYSE or other exchanges, other than options, are valued on the basis of their last sale prices on the exchanges on which they are primarily traded. However, if the last sale price on the NYSE is different than the last
Hussman Investment Trust
Notes to Financial Statements (continued) |
June 30, 2024 |
sale price on any other exchange, the NYSE price will be used. If there are no sales on that day, the securities are valued at the last bid price on the NYSE or other primary exchange for that day. Securities quoted by NASDAQ are valued at the NASDAQ Official Closing Price. If there are no sales on that day, the securities are valued at the last bid price as reported by NASDAQ. Securities traded in over-the-counter markets, other than NASDAQ quoted securities, are valued at the last sales price, or if there are no sales on that day, at the mean of the closing bid and ask prices.
Pursuant to procedures approved by the Board of Trustees, options traded on a national securities exchange are valued at prices between the closing bid and ask prices determined by Hussman Strategic Advisors, Inc. (the “Adviser”) to most closely reflect market value as of the time of computation of the net asset value (“NAV”). As of June 30, 2024, all options held by Hussman Strategic Growth Fund and Hussman Strategic Allocation Fund have been valued in this manner. Options not traded on a national securities exchange or board of trade, but for which over-the-counter market quotations are readily available, are valued at the mean between their closing bid and ask prices. Futures contracts and options thereon, if any, which are traded on commodities exchanges, are valued at their last sale prices as of the close of regular trading on the NYSE or, if not available, at the mean between their bid and ask prices.
Fixed income securities traded over-the-counter and not traded or dealt in upon any securities exchange, but for which market quotations are readily available, generally are valued at the mean of their closing bid and ask prices. Fixed income securities may also be valued on the basis of prices provided by an independent pricing service. Debt securities with remaining maturities of 60 days or less may be valued at amortized cost if the Adviser, under the supervision of the Board of Trustees, determines that the amortized cost value of the security represents fair value.
Investments in shares of other open-end investment companies, other than shares of exchange-traded funds, are valued at their NAVs per share as reported by such companies.
In the event that market quotations are not readily available or are determined by the Adviser, as the valuation designee, to not be reflective of fair market value due to market events or developments, securities and other financial instruments will be valued at fair value as determined by the Adviser in accordance with procedures adopted by the Board of Trustees pursuant to Rule 2a-5 under the 1940 Act. Methods used to determine fair value may include, but are not limited to: multiple of earnings, multiple of book value, discount from market of a similar freely traded security, purchase price of the security, subsequent private transactions in the security or related securities, or a combination of these and other factors.
Hussman Investment Trust
Notes to Financial Statements (continued) |
June 30, 2024 |
GAAP establishes a single authoritative definition of fair value, sets out a framework for measuring fair value and requires additional disclosures about fair value measurements.
Various inputs are used in determining the values of the Funds’ investments. These inputs are summarized in the three broad levels listed below:
| | ● | Level 1 – quoted unadjusted prices for identical instruments in active markets to which the Fund has access at the date of measurement. |
| | ● | Level 2 – quoted prices for similar instruments in active markets; quoted prices for identical or similar instruments in markets that are not active; and model-derived valuations in which all significant inputs and significant value drivers are observable in active markets. |
| | ● | Level 3 – model-derived valuations in which one or more significant inputs or significant value drivers are unobservable. Unobservable inputs are those inputs that reflect the Fund’s own assumptions that market participants would use to price the asset or liability based on the best available information. |
Option contracts purchased or written by Hussman Strategic Growth Fund and Hussman Strategic Allocation Fund are classified as Level 2 since they are valued using “other significant observable inputs” at prices between the closing bid and ask prices determined by the Adviser to most closely reflect fair value. U.S. Treasury obligations held by Hussman Strategic Allocation Fund and Hussman Strategic Total Return Fund are classified as Level 2 since values are based on prices provided by an independent pricing service that utilizes various “other significant observable inputs,” including bid and ask quotations, prices of similar securities and interest rates, among other factors.
Determining the fair value of portfolio securities involves reliance on judgment, and a security’s fair value may differ depending on the method used for determining value. With respect to a portfolio security that has been valued at fair value, there can be no assurance that a Fund could purchase or sell that security at a price equal to the fair value of such security used in calculating the Fund’s NAV. Because of the inherent uncertainty in determining fair value and the various factors considered in making such determinations, there can be significant deviations between the fair value at which a portfolio security is being carried and the price at which it can be sold.
The inputs or methodology used for valuing securities are not necessarily an indication of the risks associated with investing in those securities. The inputs used to measure the value of a particular security may fall into more than one level of the
Hussman Investment Trust
Notes to Financial Statements (continued) |
June 30, 2024 |
fair value hierarchy. In such cases, for disclosure purposes, the level in the fair value hierarchy within which the fair value measurement of that security is determined to fall in its entirety is the lowest level input that is significant to the fair value measurement.
The following is a summary of each Fund’s investments and other financial instruments and the inputs used to value the investments and other financial instruments as of June 30, 2024 by security type:
Hussman Strategic Growth Fund
| | | Level 1 | | | Level 2 | | | Level 3 | | | Total | |
Investments in Securities and Money Market Funds: | | | | | | | | | | | | | | | | |
Common Stocks | | $ | 326,657,074 | | | $ | — | | | $ | — | | | $ | 326,657,074 | |
Warrants | | | 52,800 | | | | — | | | | — | | | | 52,800 | |
Exchange-Traded Put Option Contracts | | | — | | | | 4,950,400 | | | | — | | | | 4,950,400 | |
Money Market Funds | | | 149,687,846 | | | | — | | | | — | | | | 149,687,846 | |
Total Investments in Securities and Money Market Funds | | $ | 476,397,720 | | | $ | 4,950,400 | | | $ | — | | | $ | 481,348,120 | |
| | | | | | | | | | | | | | | | | |
Other Financial Instruments: | | | | | | | | | | | | | | | | |
Exchange-Traded Written Call Option Contracts | | $ | — | | | $ | (160,991,730 | ) | | $ | — | | | $ | (160,991,730 | ) |
Total Other Financial Instruments | | $ | — | | | $ | (160,991,730 | ) | | $ | — | | | $ | (160,991,730 | ) |
Hussman Strategic Allocation Fund
| | | Level 1 | | | Level 2 | | | Level 3 | | | Total | |
Investments in Securities and Money Market Funds: | | | | | | | | | | | | | | | | |
Common Stocks | | $ | 16,332,853 | | | $ | — | | | $ | — | | | $ | 16,332,853 | |
U.S. Treasury Obligations | | | — | | | | 8,894,893 | | | | — | | | | 8,894,893 | |
Warrants | | | 1,584 | | | | — | | | | — | | | | 1,584 | |
Exchange-Traded Put Option Contracts | | | — | | | | 14,170 | | | | — | | | | 14,170 | |
Money Market Funds | | | 5,225,966 | | | | — | | | | — | | | | 5,225,966 | |
Total Investments in Securities and Money Market Funds | | $ | 21,560,403 | | | $ | 8,909,063 | | | $ | — | | | $ | 30,469,466 | |
| | | | | | | | | | | | | | | | | |
Other Financial Instruments: | | | | | | | | | | | | | | | | |
Exchange-Traded Written Call Option Contracts | | $ | — | | | $ | (4,229,580 | ) | | $ | — | | | $ | (4,229,580 | ) |
Total Other Financial Instruments | | $ | — | | | $ | (4,229,580 | ) | | $ | — | | | $ | (4,229,580 | ) |
Hussman Investment Trust
Notes to Financial Statements (continued) |
June 30, 2024 |
Hussman Strategic Total Return Fund
| | | Level 1 | | | Level 2 | | | Level 3 | | | Total | |
Investments in Securities and Money Market Funds: | | | | | | | | | | | | | | | | |
Common Stocks | | $ | 16,884,546 | | | $ | — | | | $ | — | | | $ | 16,884,546 | |
Exchange-Traded Funds | | | 3,173,268 | | | | — | | | | — | | | | 3,173,268 | |
U.S. Treasury Obligations | | | — | | | | 145,684,197 | | | | — | | | | 145,684,197 | |
Warrants | | | 52,800 | | | | — | | | | — | | | | 52,800 | |
Money Market Funds | | | 14,026,018 | | | | — | | | | — | | | | 14,026,018 | |
Total Investments in Securities and Money Market Funds | | $ | 34,136,632 | | | $ | 145,684,197 | | | $ | — | | | $ | 179,820,829 | |
Each Fund’s Schedule of Investments identifies the specific securities (by type of security and sector and industry type) that comprise that Fund’s holdings within the Level 1 and Level 2 categories shown in the tables above. The Funds did not have any assets or liabilities that were measured at fair value on a recurring basis using significant unobservable inputs (Level 3) as of June 30, 2024.
Option Transactions — Hussman Strategic Growth Fund and Hussman Strategic Allocation Fund may purchase and write call and put options on broad-based stock indices and also may purchase and write call and put option contracts on individual securities. Each of the Funds may use related option contracts to hedge against changes in the market value of its portfolio securities. Hussman Strategic Total Return Fund may also purchase foreign currency options to manage its exposures to foreign currencies.
Hussman Strategic Growth Fund and Hussman Strategic Allocation Fund may each use option contracts on stock indices for the purpose of seeking to reduce the market risk that would otherwise be associated with the securities in which it invests.
When a Fund writes an index option, an amount equal to the net premium (the premium less the commission) received by the Fund is recorded as a liability on the Fund’s Statement of Assets and Liabilities and is subsequently marked-to-market daily. If an index option written by a Fund expires unexercised on the stipulated expiration date or if a Fund enters into a closing purchase transaction, it will realize a gain or a loss depending on whether the cost of a closing purchase transaction is less than or exceeds the net premium received when the option was sold and the liability related to such option will be eliminated. If an index option written by a Fund is exercised, the Fund will be required to pay the difference between the closing index value and the exercise price of the option. In this event, the proceeds of the sale will be increased by
Hussman Investment Trust
Notes to Financial Statements (continued) |
June 30, 2024 |
the net premium originally received and the Fund will realize a gain or loss. To secure the obligation of a Fund to settle index options it has written, common stocks owned by the Fund are held in escrow by the Fund’s custodian bank (or by a securities depository acting for the custodian bank) for the benefit of the Options Clearing Corporation (the “OCC”). Escrow is maintained with the OCC on a daily basis until written options expire unexercised or when the Fund enters into a closing purchase transaction.
Share Valuation and Redemption Fees — The NAV per share of each Fund is calculated as of the close of regular trading on the NYSE (normally 4:00 p.m., Eastern time) on each day that the NYSE is open for business. NAV per share of a Fund is calculated by dividing the total value of the Fund’s assets, less its liabilities, by the number of its shares outstanding. The offering price and redemption price per share of each Fund is equal to the NAV per share next computed after receipt of an order to purchase or to redeem shares. Prior to April 1, 2023, a redemption fee of 1.5%, payable to the applicable Fund, generally was applied to shares that were redeemed 60 days or less from the date of purchase. During the year ended June 30, 2023, proceeds from redemption fees, recorded in capital totaled: $81,726, $2,551 and $8,496 for Hussman Strategic Growth Fund, Hussman Strategic Allocation Fund and Hussman Strategic Total Return Fund, respectively. Effective April 1, 2023, the Funds eliminated the redemption fees being charged, regardless of how long shares are held.
Investment Income — Interest income is accrued as earned. Dividend income is recorded on the ex-dividend date. Non-cash dividends included in dividend income, if any, are recorded at the value of the security received. Discounts and premiums on fixed income securities are amortized using the effective interest method. Withholding taxes on foreign dividends have been recorded in accordance with the Trust’s understanding of the applicable country’s rules and tax rates.
Distributions to Shareholders — Dividends from net investment income, if any, are declared and paid annually to shareholders of Hussman Strategic Growth Fund and are declared and paid quarterly to shareholders of Hussman Strategic Allocation Fund and Hussman Strategic Total Return Fund. Dividends are recorded on the ex-dividend date. Net realized short-term capital gains, if any, may be distributed throughout the year and net realized long-term capital gains, if any, are generally distributed annually. The amount of distributions from net investment income and net realized capital gains are determined in accordance with federal income tax regulations, which may differ from GAAP. These “book/tax” differences are either temporary or permanent in nature and are primarily due to timing differences in the recognition of capital gains or losses on options and futures transactions and losses deferred due to wash sales.
Hussman Investment Trust
Notes to Financial Statements (continued) |
June 30, 2024 |
The tax character of distributions paid during the years ended June 30, 2024 and 2023 was as follows:
Year Ended | | Ordinary
Income | | | Long-Term
Capital Gains | | | Total
Distributions* | |
Hussman Strategic Growth Fund | | | | | | | | | | | | |
June 30, 2024 | | $ | 11,452,340 | | | $ | — | | | $ | 11,452,340 | |
June 30, 2023 | | $ | 5,831,678 | | | $ | — | | | $ | 5,831,678 | |
Hussman Strategic Allocation Fund | | | | | | | | | | | | |
June 30, 2024 | | $ | 533,397 | | | $ | — | | | $ | 533,397 | |
June 30, 2023 | | $ | 2,188,035 | | | $ | 2,045,274 | | | $ | 4,233,309 | |
Hussman Strategic Total Return Fund | | | | | | | | | | | | |
June 30, 2024 | | $ | 5,604,291 | | | $ | — | | | $ | 5,604,291 | |
June 30, 2023 | | $ | 5,210,037 | | | $ | — | | | $ | 5,210,037 | |
* | Total Distributions may not tie to the amounts listed on the Statements of Changes in Net Assets due to dividends payable amounts. |
Investment Transactions — Investment transactions are accounted for on trade date for financial reporting purposes. Realized gains and losses on investments sold are determined on a specific identification basis.
Common Expenses — Expenses of the Trust not attributable solely to one of the Funds are allocated among the Funds based on the relative net assets of each Fund or based on the nature of the expense and its relative applicability to each Fund.
Accounting Estimates — The preparation of financial statements in conformity with GAAP requires management to make estimates and assumptions that affect the reported amounts of assets and liabilities and the disclosure of contingent assets and liabilities as of the date of the financial statements and the reported amounts of increase (decrease) in net assets from operations during the reporting period. Actual results could differ from these estimates.
Federal Income Tax — Each Fund has qualified and intends to continue to qualify each year as a “regulated investment company” under Subchapter M of the Internal Revenue Code of 1986, as amended (the “Code”). By so qualifying, a Fund generally will not be subject to federal income taxes to the extent that it distributes its net investment income and any net realized capital gains in accordance with the Code. Accordingly, no provision for income taxes has been made.
Hussman Investment Trust
Notes to Financial Statements (continued) |
June 30, 2024 |
In order to avoid imposition of a federal excise tax applicable to regulated investment companies, it is each Fund’s intention to declare and pay as dividends in each calendar year at least 98% of its net investment income (earned during the calendar year) and 98.2% of its net realized capital gains (earned during the twelve months ended October 31) plus undistributed amounts from prior years.
The tax character of distributable earnings (accumulated deficit) as of June 30, 2024 was as follows:
| | | Hussman
Strategic
Growth Fund | | | Hussman
Strategic
Allocation Fund | | | Hussman
Strategic Total
Return Fund | |
Net unrealized depreciation | | $ | (15,282,897 | ) | | $ | (924,311 | ) | | $ | (5,791,709 | ) |
Undistributed ordinary income | | | 4,589,613 | | | | 6,741 | | | | 560,203 | |
Accumulated capital and other losses | | | (927,983,370 | ) | | | (2,304,063 | ) | | | (44,142,647 | ) |
Other temporary differences | | | — | | | | (4,332 | ) | | | (193,540 | ) |
Total accumulated deficit | | $ | (938,676,654 | ) | | $ | (3,225,965 | ) | | $ | (49,567,693 | ) |
The following information is based upon the federal income tax cost of investment securities as of June 30, 2024:
| | | Hussman
Strategic
Growth Fund | | | Hussman
Strategic
Allocation Fund | | | Hussman
Strategic Total
Return Fund | |
Cost of investments | | $ | 185,951,441 | | | $ | 21,938,231 | | | $ | 171,586,520 | |
Gross unrealized appreciation | | $ | 25,527,664 | | | $ | 1,364,649 | | | $ | 1,984,801 | |
Gross unrealized depreciation | | | (40,810,561 | ) | | | (2,288,960 | ) | | | (7,776,510 | ) |
Net unrealized depreciation | | $ | (15,282,897 | ) | | $ | (924,311 | ) | | $ | (5,791,709 | ) |
The difference between the federal income tax cost of investments and the financial statement cost of investments for each Fund is due to certain timing differences in the recognition of capital gains or losses under income tax regulations and GAAP. These “book/tax” differences are temporary in nature and are primarily due to losses deferred due to wash sales, derivatives and adjustments to basis for publicly traded partnerships, passive foreign investment companies and grantor trusts.
Hussman Investment Trust
Notes to Financial Statements (continued) |
June 30, 2024 |
As of June 30, 2024, the Funds had the following capital loss carryforwards for federal income tax purposes:
| | | Hussman
Strategic
Growth Fund | | | Hussman
Strategic
Allocation Fund | | | Hussman
Strategic Total
Return Fund | |
Short-term capital loss carryforwards | | $ | 505,517,253 | | | $ | — | | | $ | 36,862,464 | |
Long-term capital loss carryforwards | | | 422,466,117 | | | | 2,304,062 | | | | 7,280,183 | |
Total | | $ | 927,983,370 | | | $ | 2,304,062 | | | $ | 44,142,647 | |
These capital loss carryforwards, which do not expire, may be utilized by the Funds in future years to offset their net realized capital gains, if any, prior to distributing such gains to shareholders.
During the year ended June 30, 2024, Hussman Strategic Total Return Fund utilized $357,147 of capital loss carryforwards against current year gains.
For the year ended June 30, 2024, the following reclassifications were made as a result of permanent differences between the financial statement and income tax reporting requirements due to adjustments for nondeductible expenses from publicly traded partnerships:
| | | Hussman
Strategic
Growth Fund | | | Hussman
Strategic
Allocation Fund | | | Hussman
Strategic Total
Return Fund | |
Paid-in capital | | $ | (73 | ) | | $ | (1 | ) | | $ | (73 | ) |
Accumulated earnings (deficit) | | $ | 73 | | | $ | 1 | | | $ | 73 | |
Such reclassifications have no effect on each Fund’s total net assets or NAVs per share.
Each Fund recognizes the tax benefits or expenses of uncertain tax positions only when the position is “more likely than not” to be sustained assuming examination by tax authorities. Management has reviewed each Fund’s tax positions taken on federal income tax returns for all open years (generally, tax returns that have been filed within the past three years) and all major jurisdictions and has concluded that no provisions for unrecognized tax benefits or expenses is required in these financial statements. Therefore, no tax expense (including interest and penalties) was recorded in the current year and no adjustments were made to prior periods.
Each Fund recognizes interest and penalties, if any, related to unrecognized tax benefits as income tax expenses on the Statements of Operations. During the year ended June 30, 2024, the Funds did not incur any interest or penalties.
Hussman Investment Trust
Notes to Financial Statements (continued) |
June 30, 2024 |
2. INVESTMENT TRANSACTIONS
During the year ended June 30, 2024, cost of purchases and proceeds from sales and maturities of investment securities, other than short-term investments and U.S. government securities, were as follows:
| | | Hussman
Strategic
Growth Fund | | | Hussman
Strategic
Allocation Fund | | | Hussman
Strategic Total
Return Fund | |
Purchases of investment securities | | $ | 474,826,614 | | | $ | 25,708,022 | | | $ | 39,434,930 | |
Proceeds from sales and maturities of investment securities | | $ | 676,805,988 | | | $ | 30,128,189 | | | $ | 70,521,094 | |
During the year ended June 30, 2024, cost of purchases and proceeds from sales and maturities of long-term U.S. government securities were as follows:
| | | Hussman
Strategic
Growth Fund | | | Hussman
Strategic
Allocation Fund | | | Hussman
Strategic Total
Return Fund | |
Purchases of investment securities | | $ | — | | | $ | 5,209,693 | | | $ | 58,121,527 | |
Proceeds from sales and maturities of investment securities | | $ | — | | | $ | 3,917,115 | | | $ | 97,851,155 | |
3. TRANSACTIONS WITH AFFILIATES
Advisory Agreement
Under the terms of an Advisory Agreement between the Trust and the Adviser, Hussman Strategic Growth Fund pays the Adviser a fee, which is computed and accrued daily and paid monthly, at annual rates of: 0.90% of the first $2 billion of the Fund’s average daily net assets; 0.85% of the next $3 billion of such assets; and 0.80% of such assets over $5 billion. Under the terms of a separate Advisory Agreement between the Trust and the Adviser, Hussman Strategic Allocation Fund pays the Adviser a fee, which is computed and accrued daily and paid monthly, at annual rates of: 0.75% of the first $2 billion of the Fund’s average daily net assets; 0.70% of the next $3 billion of such assets; and 0.65% of such assets over $5 billion. Under the terms of a separate Advisory Agreement between the Trust and the Adviser, Hussman Strategic Total Return Fund pays the Adviser a fee, which is computed and accrued daily and paid monthly, at annual rates of: 0.50% of the first $1 billion of the Fund’s average daily net assets; 0.45% of the next $1.5 billion of such assets; and 0.40% of such assets over $2.5 billion.
Hussman Investment Trust
Notes to Financial Statements (continued) |
June 30, 2024 |
The Adviser has contractually agreed that, until November 1, 2024, it will waive its advisory fees and/or absorb operating expenses of each Fund to the extent necessary so that operating expenses of Hussman Strategic Growth Fund, Hussman Strategic Allocation Fund and Hussman Strategic Total Return Fund (excluding fees and expenses incurred on investments in other investment companies and pooled investment vehicles, brokerage commissions, taxes, interest expense and any extraordinary expenses) do not exceed annually an amount equal to 1.15%, 1.25% and 0.75%, respectively, of such Fund’s average daily net assets. During the year ended June 30, 2024, the Adviser waived advisory fees in the amount of $49,483, $207,859 and $135,372 with respect to Hussman Strategic Growth Fund, Hussman Strategic Allocation Fund and Hussman Strategic Total Return Fund, respectively. Additionally, during the year ended June 30, 2024, the Adviser absorbed operating expenses of $37,076 with respect to Hussman Strategic Allocation Fund.
Pursuant to the Expense Limitation Agreements governing these arrangements, each Fund is obligated to reimburse the Adviser the amount of advisory fees previously waived and expenses previously absorbed by the Adviser for a period of three years from the date such fees or expenses were waived or absorbed, but only if such reimbursement does not cause the Fund’s operating expenses (after the reimbursement is taken into account) to exceed the lesser of: (i) the expense limitation in effect at the time such fees and expenses were waived or absorbed; and (ii) the expense limitation in effect at the time the Adviser seeks reimbursement of such fees and expenses. The Expense Limitation Agreements may not be terminated by the Adviser without the approval of the Board of Trustees. During the year ended June 30, 2024, Hussman Strategic Growth Fund recovered $16,996 of past advisory fees waived. As of June 30, 2024, the amount of fee waivers and expense reimbursements available for possible recovery by the Adviser from Hussman Strategic Growth Fund, Hussman Strategic Allocation Fund and Hussman Strategic Total Return Fund is $49,483, $634,341 and $208,250, respectively. The portions of these amounts that the Adviser may recover expire as of the following dates:
| | | June 30,
2025 | | | June 30,
2026 | | | June 30,
2027 | | | Total | |
Hussman Strategic Growth Fund | | $ | — | | | $ | — | | | $ | 49,483 | | | | $49,483 | |
Hussman Strategic Allocation Fund | | $ | 171,615 | | | $ | 217,791 | | | $ | 244,935 | | | | $634,341 | |
Hussman Strategic Total Return Fund | | $ | 10,253 | | | $ | 62,625 | | | $ | 135,372 | | | | $208,250 | |
The Adviser may agree to continue after November 1, 2024 the current arrangement to limit the Funds’ expenses or to implement a similar arrangement, but it is not obligated to do so.
Hussman Investment Trust
Notes to Financial Statements (continued) |
June 30, 2024 |
Certain officers of the Trust are also officers of the Adviser.
Other Service Providers
Ultimus Fund Solutions, LLC (“Ultimus”) provides administration, fund accounting and transfer agency services to the Funds. The Funds pay Ultimus fees for these services in accordance with various servicing agreements. In addition, the Funds reimburse Ultimus for certain out-of-pocket expenses incurred in providing services to the Funds, including, but not limited to, postage, supplies and costs related to the pricing of the Funds’ portfolio securities. Certain officers of the Trust are also officers of Ultimus, or Ultimus Fund Distributors, LLC (the “Distributor”), the principal underwriter of the Funds. The Distributor is a wholly-owned subsidiary of Ultimus.
Under the terms of a Consulting Agreement with the Trust, Northern Lights Compliance Services, LLC (“NLCS”) provides a Chief Compliance Officer and an Anti-Money Laundering Officer to the Trust, as well as related compliance services. Under the terms of the agreement, NLCS receives fees from the Funds. NLCS is a wholly-owned subsidiary of Ultimus.
The Funds compensate certain financial intermediaries for providing account maintenance and shareholder services to shareholder accounts held through such intermediaries. During year ended June 30, 2024, Hussman Strategic Growth Fund, Hussman Strategic Allocation Fund and Hussman Strategic Total Return Fund paid $159,481, $5,872 and $77,169, respectively, to financial intermediaries for such services.
Trustee Compensation
Trustees and officers affiliated with the Adviser or Ultimus are not compensated by the Funds for their services. Each Trustee who is not an “interested person,” as defined by the 1940 Act, of the Trust or an affiliated person of the Adviser or Ultimus (an “Independent Trustee”) receives from the Trust: an annual retainer of $50,000, payable quarterly; a fee of $7,000 for attendance at each regular quarterly meeting of the Board of Trustees other than the annual meeting of the Board, for which each Independent Trustee receives an attendance fee of $12,000; a fee of $4,000 for attendance at each special meeting of the Board of Trustees; a fee of $3,000 for attendance at each meeting of any committee of the Board of Trustees that is not held on the same day as a Board of Trustees meeting; and a fee of $1,500 for participation in each informal monthly telephone conference call of the Board of Trustees. In addition, the Independent Trustees are reimbursed for travel and other expenses incurred in attending meetings. Each Fund pays its proportionate share of the Independent Trustees’ fees and expenses.
Hussman Investment Trust
Notes to Financial Statements (continued) |
June 30, 2024 |
Principal Holder of Fund Shares
As of June 30, 2024, Charles Schwab & Co. (for the benefit of its customers) owned of record 31.2% and 36.1% of the outstanding shares of Hussman Strategic Growth Fund and Hussman Strategic Total Return Fund, respectively, and an officer of the Adviser owned of record 52.4% of the outstanding shares of Hussman Strategic Allocation Fund. A shareholder owning of record or beneficially 25% or more of a Fund’s outstanding shares may be considered a controlling person. That shareholder’s vote could have a more significant effect on matters presented at a shareholders’ meeting.
4. DERIVATIVES TRANSACTIONS
The locations in the Statements of Assets and Liabilities of the derivative positions of Hussman Strategic Growth Fund and Hussman Strategic Allocation Fund are as follows:
Hussman Strategic Growth Fund
| | | | | Fair Value | | | Average Monthly | |
Type of
Derivative | Risk | Location | | Asset Derivatives | | | Liability
Derivatives | | | Notional Value
During the
Year Ended
June 30, 2024* | |
Index put options purchased | Equity | Investments in securities at value | | $ | 4,950,400 | | | $ | — | | | $ | 410,320,091 | |
Index call options purchased | Equity | Investments in securities at value | | | — | | | | — | | | | 1,328,989 | |
Index call options written | Equity | Written call options, at value | | | — | | | | (160,991,730 | ) | | | (410,320,091 | ) |
* | The average monthly notional value generally represents the Fund’s derivative activity throughout the year. |
Hussman Investment Trust
Notes to Financial Statements (continued) |
June 30, 2024 |
Hussman Strategic Allocation Fund
| | | | | Fair Value | | | Average Monthly | |
Type of
Derivative | Risk | Location | | Asset Derivatives | | | Liability
Derivatives | | | Notional Value
During the
Year Ended
June 30, 2024* | |
Index put options purchased | Equity | Investments in securities at value | | $ | 14,170 | | | $ | — | | | $ | 18,220,372 | |
Index call options written | Equity | Written call options, at value | | | — | | | | (4,229,580 | ) | | | (18,220,372 | ) |
* | The average monthly notional value generally represents the Fund’s derivative activity throughout the year. |
Realized and unrealized gains and losses associated with transactions in derivative instruments for Hussman Strategic Growth Fund and Hussman Strategic Allocation Fund during the year ended June 30, 2024 are recorded in the following locations on the Statements of Operations:
Hussman Strategic Growth Fund
Type of
Derivative | | Risk | | Location | | Realized Losses | | | Location | | Change in
Unrealized
Appreciation
(Depreciation) | |
Index put options purchased | | Equity | | Net realized gains (losses) from investments | | $ | (32,140,169 | ) | | Net change in unrealized appreciation (depreciation) on investments | | $ | 2,922,976 | |
Index call options purchased | | Equity | | Net realized gains (losses) from investments | | | (2,858,054 | ) | | Net change in unrealized appreciation (depreciation) on investments | | | — | |
Index call options written | | Equity | | Net realized gains (losses) from written option contracts | | | (83,875,457 | ) | | Net change in unrealized appreciation (depreciation) on written option contracts | | | 23,099,967 | |
Hussman Investment Trust
Notes to Financial Statements (continued) |
June 30, 2024 |
Hussman Strategic Allocation Fund
Type of
Derivative | | Risk | | Location | | Realized Gains
(Losses) | | | Location | | Change in
Unrealized
Appreciation
(Depreciation) | |
Index put options purchased | | Equity | | Net realized gains (losses) from investments | | $ | (386,321 | ) | | Net change in unrealized appreciation (depreciation) on investments | | $ | 130,486 | |
Index call options written | | Equity | | Net realized gains (losses) from written option contracts | | | (3,140,313 | ) | | Net change in unrealized appreciation (depreciation) on written option contracts | | | 708,206 | |
Hussman Strategic Total Return Fund had no transactions in derivative instruments during the year ended June 30, 2024.
In the ordinary course of business, Hussman Strategic Growth Fund and Hussman Strategic Allocation Fund may enter into transactions subject to enforceable netting agreements or other similar arrangements (“netting agreements”). Generally, the right to offset in netting agreements allows each Fund to offset the exposure it has on any transaction with a specific counterparty with any collateral it has received or delivered in connection with other transactions with that counterparty. Generally, the Funds manage their cash collateral and securities collateral on a counterparty basis.
Hussman Investment Trust
Notes to Financial Statements (continued) |
June 30, 2024 |
The offsetting of financial liabilities and derivative liabilities as of June 30, 2024 are as follows:
Hussman Strategic Growth Fund
Description | | Gross
Amounts of
Recognized
Liabilities | | | Gross
Amounts
Offset on
Statements
of Assets and
Liabilities | | | Net Amounts
of Liabilities
Presented on
Statements
of Assets and
Liabilities | | | Collateral
Pledged* | | | Net Amount | |
Written options at market value | | $ | (160,991,730 | ) | | $ | — | | | $ | (160,991,730 | ) | | $ | 160,991,730 | | | $ | — | |
Total subject to a master netting or similar arrangement | | $ | (160,991,730 | ) | | $ | — | | | $ | (160,991,730 | ) | | $ | 160,991,730 | | | $ | — | |
* | Common stocks owned by the Fund are held in escrow by the Fund’s custodian (or by a security depository) to secure the Fund’s obligations to settle outstanding call option contracts it has written (Note 1). Amounts in collateral pledged in the table above are limited to the net amounts presented on the Statements of Assets and Liabilities. |
Hussman Strategic Allocation Fund
Description | | Gross
Amounts of
Recognized
Liabilities | | | Gross
Amounts
Offset on
Statements
of Assets and
Liabilities | | | Net Amounts
of Liabilities
Presented on
Statements
of Assets and
Liabilities | | | Collateral
Pledged* | | | Net Amount | |
Written options at market value | | $ | (4,229,580 | ) | | $ | — | | | $ | (4,229,580 | ) | | $ | 4,229,580 | | | $ | — | |
Total subject to a master netting or similar arrangement | | $ | (4,229,580 | ) | | $ | — | | | $ | (4,229,580 | ) | | $ | 4,229,580 | | | $ | — | |
* | Common stocks owned by the Fund are held in escrow by the Fund’s custodian (or by a security depository) to secure the Fund’s obligations to settle outstanding call option contracts it has written (Note 1). Amounts in collateral pledged in the table above are limited to the net amounts presented on the Statements of Assets and Liabilities. |
Hussman Investment Trust
Notes to Financial Statements (continued) |
June 30, 2024 |
5. CERTAIN INVESTMENTS AND ASSOCIATED RISKS
The securities in which the Funds invest, as well as the risks associated with these securities and with the investment programs of the Funds, are described in each Fund’s Prospectus. Among these risks are those associated with investments in derivative instruments, investments in shares of money market funds, and concentration of investments within a particular business sector.
Risks of Derivative Instruments — The purchase and sale of derivative instruments, including options and futures contracts, and other derivative transactions involve risks different from those involved with direct investments in securities and also require different skills from the Adviser in managing each Fund’s portfolio of investments. While utilization of options, futures contracts and similar instruments may be advantageous to the Funds, if the Adviser is not successful in employing such instruments in managing a Fund’s investments or in anticipating general market movements, the Fund’s performance will be worse than if the Fund did not make such investments. It is possible that there will be imperfect correlation, or even no correlation, between price movements of the investments held by the Funds and the options, futures or other derivative instruments used to hedge those investments. It is also possible that a Fund may be unable to close out or liquidate its hedges during unusual periods of illiquidity in the options, futures or other markets. In addition, a Fund will pay commissions and other costs in connection with its transactions in such instruments, which may increase its expenses and reduce its investment performance.
Investments in Money Market Funds — In order to maintain sufficient liquidity to implement investment strategies, or for temporary defensive purposes, each Fund may at times invest a significant portion of its assets in shares of money market funds. As of June 30, 2024, Hussman Strategic Growth Fund had 46.3% of the value of its net assets invested in shares of a money market fund registered under the 1940 Act. The annual report, along with the report of the independent registered public accounting firm is included in the money market fund’s N-CSR available at www.sec.gov. An investment in a money market fund is not insured or guaranteed by the Federal Deposit Insurance Corporation or any other governmental agency, entity or person. While investor losses in money market funds have been rare, they are possible. The Fund, as investors in money market funds, indirectly bear the fees and expenses of those funds, which are in addition to the fees and expenses of the Fund.
Sector Risk — If a Fund has significant investments in the securities of issuers in industries within a particular business sector, any development generally affecting that sector will have a greater impact on the value of the net assets of the Fund than would be the case if the Fund did not have significant investments in that sector. This
Hussman Investment Trust
Notes to Financial Statements (continued) |
June 30, 2024 |
may increase the risk of loss of an investment in a Fund and increase the volatility of a Fund’s NAV per share. From time to time, circumstances may affect a particular sector and the companies within such sector. For instance, economic or market factors, regulation or deregulation, and technological or other developments, may negatively impact all companies in a particular sector and therefore the value of a Fund’s portfolio could be adversely affected if it has significant holdings of securities of issuers in that sector. As of June 30, 2024, none of the Funds had 25% or more of the value of their net assets invested in a particular sector.
6. BANK LINE OF CREDIT
The Trust has established a $15,000,000 unsecured bank line of credit with its custodian bank which collectively allows the Funds to borrow up to this line. Any borrowings under these arrangements bear interest at the Prime Rate, currently 8.50% as of June 30, 2024. During the year ended June 30, 2024, Hussman Strategic Growth Fund and Hussman Strategic Allocation Fund did not borrow under their line of credit. Hussman Strategic Total Return Fund incurred $843 of interest expense related to borrowings. The average debt outstanding and the average interest rate for the days with borrowing during the year ended June 30, 2024 were $1,786,000 and 8.50%, respectively.
7. CONTINGENCIES AND COMMITMENTS
The Trust’s officers and Trustees are entitled to indemnification from the Funds for certain liabilities to which they may become subject in connection with the performance of their duties to the Funds. Additionally, in the normal course of business, the Funds enter into contracts that contain a variety of representations and warranties and which may require the Funds to indemnify the other parties to the contracts in the event of certain losses. The Funds’ maximum exposure under these arrangements is unknown, as this would involve potential claims for indemnification for losses that may or may not be incurred in the future. However, based on experience, the Trust believes the risk of loss to be remote.
8. SUBSEQUENT EVENTS
The Funds are required to recognize in their financial statements the effects of all subsequent events that provide additional evidence about conditions that existed as of the date of the Statements of Assets and Liabilities. For non-recognized subsequent events that must be disclosed to keep the financial statements from being misleading, the Funds are required to disclose the nature of the event as well as an estimate of its
Hussman Investment Trust
Notes to Financial Statements (continued) |
June 30, 2024 |
financial effect, or a statement that such an estimate cannot be made. Management has evaluated subsequent events through the date of issuance of these financial statements and has noted no such events.
Hussman Investment Trust
Report of Independent Registered
Public Accounting Firm |
To the Shareholders and Board of Trustees of
Hussman Investment Trust
Opinion on the Financial Statements
We have audited the accompanying statements of assets and liabilities, including the schedules of investments and open written options contracts, of Hussman Investment Trust comprising Hussman Strategic Growth Fund, Hussman Strategic Allocation Fund, and Hussman Strategic Total Return Fund (the “Funds”) as of June 30, 2024, the related statements of operations for the year then ended, the statements of changes in net assets for each of the two years in the period then ended, the financial highlights for each of the four years in the period then ended, and the related notes (collectively referred to as the “financial statements”). In our opinion, the financial statements present fairly, in all material respects, the financial position of each of the Funds as of June 30, 2024, the results of their operations for the year then ended, the changes in net assets for each of the two years in the period then ended, and the financial highlights for each of the four years in the period then ended, in conformity with accounting principles generally accepted in the United States of America.
The Funds’ financial highlights for the periods ended June 30, 2020, and prior, were audited by other auditors whose report dated August 20, 2020, expressed an unqualified opinion on those financial statements and financial highlights.
Basis for Opinion
These financial statements are the responsibility of the Funds’ management. Our responsibility is to express an opinion on the Funds’ financial statements based on our audits. We are a public accounting firm registered with the Public Company Accounting Oversight Board (United States) (“PCAOB”) and are required to be independent with respect to the Funds in accordance with the U.S. federal securities laws and the applicable rules and regulations of the Securities and Exchange Commission and the PCAOB.
We conducted our audits in accordance with the standards of the PCAOB. Those standards require that we plan and perform the audit to obtain reasonable assurance about whether the financial statements are free of material misstatement whether due to error or fraud.
Our audits included performing procedures to assess the risks of material misstatement of the financial statements, whether due to error or fraud, and performing procedures that respond to those risks. Such procedures included examining, on a test basis, evidence
Hussman Investment Trust
Report of Independent Registered
Public Accounting Firm (continued) |
regarding the amounts and disclosures in the financial statements. Our procedures included confirmation of securities owned as of June 30 2024, by correspondence with the custodian and brokers. Our audits also included evaluating the accounting principles used and significant estimates made by management, as well as evaluating the overall presentation of the financial statements. We believe that our audits provide a reasonable basis for our opinion.
We have served as the Funds’ auditor since 2021.

COHEN & COMPANY, LTD.
Milwaukee, Wisconsin
August 26, 2024
Hussman Investment Trust
Other Information (Unaudited) |
|
A description of the policies and procedures the Funds use to determine how to vote proxies relating to portfolio securities is available without charge upon request by calling toll-free 1-800-HUSSMAN (1-800-487-7626), or on the SEC’s website at www.sec.gov. Information regarding how the Funds voted proxies relating to portfolio securities during the most recent 12-month period ended June 30 is also available without charge upon request by calling toll-free 1-800-HUSSMAN, or on the SEC’s website at www.sec.gov.
Each Fund files a complete listing of portfolio holdings with the SEC as of the end of the first and third quarters of each fiscal year as an exhibit to each Fund’s Form N-PORT. The filings are available upon request, by calling 1-800-HUSSMAN (1-800-487-7626). You may also obtain copies of these filings on the SEC’s website at www.sec.gov and the Funds’ website at www.hussmanfunds.com.
Federal Tax Information (Unaudited) |
|
In accordance with federal tax requirements, the following provides shareholders with information concerning distributions from ordinary income made by the Funds during the fiscal year ended June 30, 2024. Certain dividends paid by the Funds may be subject to the maximum tax rate. For the fiscal year ended June 30, 2024, 79.62%, 57.68% and 5.92% of the dividends paid from ordinary income by Hussman Strategic Growth Fund, Hussman Strategic Allocation Fund and Hussman Strategic Total Return Fund, respectively, qualified for the dividends received deduction for corporations.
As required by federal regulations, the Trust will send to each shareholder complete information regarding dividends and other distributions of the Funds for 2024 on Form 1099-DIV.
Hussman Investment Trust
Approval of Investment Advisory Agreements |
(Unaudited) |
At a meeting held on June 10, 2024, the Board of Trustees (the “Board”) of Hussman Investment Trust, including the Trustees who are not “interested persons,” as defined by the Investment Company Act of 1940, of the Trust (the “Independent Trustees”) voting separately, reviewed and unanimously approved the continuance, for an additional annual period, of the Investment Advisory Agreements between the Trust and Hussman Strategic Advisors, Inc. (the “Adviser”) on behalf of each of Hussman Strategic Growth Fund (the “Growth Fund”), Hussman Strategic Allocation Fund (the “Allocation Fund”), and Hussman Strategic Total Return Fund (the “Total Return Fund,” and together with the Growth Fund and the Allocation Fund, the “Funds”).
In determining whether to approve continuances of the Investment Advisory Agreements of the Funds (the “Advisory Agreements”), the Independent Trustees requested and received from the Adviser such information as they deemed reasonably necessary to evaluate the terms of the Advisory Agreements and to assess whether the Advisory Agreements continue to be in the best interests of the Funds and their shareholders. In addition to reviewing and considering this information, the Independent Trustees considered information relating to the Funds and the Adviser that was provided to them in connection with meetings of the Board held throughout the year. They reviewed and considered, among other things: (i) the nature, extent and quality of the services provided by the Adviser to each of the Funds; (ii) the investment performance of each of the Funds; (iii) comparisons of the advisory fees and expenses of the Funds to the fees and expenses of peer groups of mutual funds; (iv) the Adviser’s costs of providing services to the Funds and the profits realized by the Adviser from its relationship with the Funds; (v) whether economies of scale in the Adviser’s costs of providing services have been realized from growth of the Funds’ assets; and (vi) whether the advisory fees payable by each Fund reflect an appropriate sharing of any such economies with such Fund for the benefit of the Fund and its shareholders. The Independent Trustees also reviewed the background, qualifications, education and experience of the Adviser’s investment professionals and support personnel, and discussed and considered: (i) the quality of shareholder communications, administrative functions and other services provided by the Adviser to the Trust and each of the Funds; (ii) the quality of the Adviser’s compliance program; (iii) the Adviser’s role in coordinating and supervising services provided to the Trust; and (iv) indirect benefits, if any, that the Adviser may derive from its relationship with the Funds. The Independent Trustees were advised and supported in this process by independent legal counsel and, prior to voting, met with and asked questions of representatives of the Adviser, including Dr. John Hussman, and met separately with their counsel.
Hussman Investment Trust
Approval of Investment Advisory Agreements |
(Unaudited) (continued) |
The Adviser provided the Independent Trustees with extensive information to assist them in analyzing both the absolute and risk-adjusted returns of the Funds over various periods. In these materials, the returns of each Fund were compared to the returns of relevant indices and to the average returns of one or more selected peer groups of mutual funds.
The analyses and comparisons provided by the Adviser showed the alternative nature of the Funds and that each of the Hussman Funds has the objective of achieving long-term returns with managed risk and are not intended to track the market over shorter segments of the market cycle. The information provided to the Independent Trustees showed that the Growth Fund underperformed the S&P 500 Index as well as the blended benchmark year-to-date through June 10, 2024. The information provided showed that since inception, the Growth Fund’s hedging strategies have generally been successful in reducing the volatility of an investment in the Fund as compared to the volatility of relevant securities indices. The Independent Trustees noted that, although the Growth Fund underperformed the S&P 500 Index from 2009 to date, the Adviser information provided to the Independent Trustees characterized this period as representing a largely uncorrected advance to historic valuation extremes, that the Fund’s outperformance was substantial during periods of market losses occurring over the past year due to the use of hedging strategies and that the Fund’s return/risk characteristics have remained consistent with its stated investment strategy during the period. The Independent Trustees reviewed the Growth Fund’s performance over various periods as compared to the performance of mutual funds categorized by Bloomberg Strategy: Equity Hedge. They recognized that the Growth Fund’s performance during various recent multi-year periods lagged the average performance of these other mutual funds. Information provided to the Board indicated that, over the long term, the Adviser’s stock selection record for the Growth Fund has been generally favorable and that the underperformance of the Fund in recent years is largely attributable to the Fund’s use of hedging techniques and the nature of the Fund’s alternative investment approach, which is not intended to track general stock market movements. In evaluating the Growth Fund’s investment performance, the Independent Trustees recognized that the use of hedging is an integral part of the Fund’s investment program and that, although this has caused the Fund’s significant underperformance since 2009, the Adviser has managed the investment portfolio of the Growth Fund in a manner consistent with the Fund’s investment objective and policies, and with the Adviser’s investment methodology, as described in the Fund’s prospectus. The Independent Trustees also recognized that the Adviser has adapted and refined the models and analytics it uses in managing the Growth Fund in seeking to address the Fund’s underperformance and noted that the Adviser has from time to
Hussman Investment Trust
Approval of Investment Advisory Agreements |
(Unaudited) (continued) |
time implemented various modifications in its analytics and restrictions in its hedging approach with the goals of improving the investment performance of the Fund over the long term and reducing the risks and costs of its hedging strategy.
With respect to the Allocation Fund, the Independent Trustees noted that the Fund has maintained a defensive stance since inception (with a significant portion of the Fund’s stock portfolio hedged against general market fluctuations) and that the Fund has experienced significantly less downside risk than a passive investment approach, although the Fund has not been in existence long enough to evaluate its investment performance over a full market cycle.
In reviewing the performance of the Total Return Fund, the Independent Trustees took note of the fact that the Total Return Fund underperformed the Bloomberg Barclays U.S. Aggregate Bond Index year-to-date. In addition, the Independent Trustees reviewed comparisons of the performance of the Total Return Fund for various periods to the performance of mutual funds categorized by Bloomberg Strategy: Aggregate. They noted that the performance of the Total Return Fund for the one-year period ended April 30, 2024 has been competitive and that the Fund performs well over longer periods (3-, 5- and 10-year periods ended April 30, 2024, as well as since inception of the Fund).
In evaluating the advisory fees payable by the Funds and the Funds’ expense ratios, the Independent Trustees reviewed comparative expense and advisory fee information for peer groups of mutual funds based on investment style.
With respect to advisory fees, the Independent Trustees concluded that the advisory fee of the Growth Fund, computed at the annual rate of 0.90% of average daily net assets (based on the Fund’s then current asset level), compares favorably to the average advisory fees payable by mutual funds categorized by Bloomberg Strategy: Equity Hedge. The Independent Trustees also reviewed comparative advisory fee information for the Allocation Fund, computed at the annual rate of 0.75% of average daily net assets (based on the Fund’s then current asset level), and noted that the advisory fee of the Fund compares favorably to the average advisory fees of other funds of similar size investing in similar securities. With respect to the Total Return Fund, the Independent Trustees concluded that the advisory fee of the Fund, computed at the annual rate of 0.50% of average daily net assets (based on the Fund’s then current asset level), compares favorably to the average of advisory fees of other funds of similar size investing in similar securities. The Independent Trustees determined that the Adviser’s implementation of the Funds’ investment strategies requires special skills and a substantially different set of analytical tools, trading and investment activities than are required for more passively managed funds. With respect to each of the Funds,
Hussman Investment Trust
Approval of Investment Advisory Agreements |
(Unaudited) (continued) |
the Independent Trustees determined that the fees payable to the Adviser appropriately reflect the nature and scope of services provided by the Adviser (which are broader than the norm) and the value to the Funds of the Adviser’s experience, expertise, and analytic capabilities. They also determined that the advisory fee schedules of the Funds, which include breakpoints in the fee rates applicable to net assets in excess of specified levels, provide the opportunity for each of the Funds and its shareholders to participate in economies of scale in the Adviser’s costs of providing services that may be associated with potential future growth of the Funds’ assets.
With respect to the total expenses of the Funds, the Independent Trustees considered the fact that the expense ratios of the Growth Fund and the Total Return Fund, both before and after advisory fee reductions pursuant to the Adviser’s agreement to waive its fees or to absorb expenses of the Funds as necessary to maintain the operating expenses of the Funds (excluding acquired fund fees and expenses, brokerage commissions, taxes, interest expense and any extraordinary expenses) at specified levels, are less than the averages for their respective peer group funds. They noted in this regard that the Growth Fund has one of the lowest expense ratios among mutual funds categorized by Bloomberg Strategy: Equity Hedge. With respect to the Total Return Fund, the Independent Trustees noted that the Fund’s expense ratio is less than the average expense ratio of mutual funds categorized by Bloomberg Strategy: Aggregate. They also noted that, from time to time since each such Fund’s inception, its expense ratio was reduced through the introduction of advisory fee breakpoints. In addition, the Independent Trustees considered the fact that, since March 2013, the Adviser has contractually been waiving a portion of its fees to reduce the total ordinary operating expenses of the Growth Fund and the Total Return Fund.
The Independent Trustees also reviewed comparative information relating to the total expenses of the Allocation Fund. They noted that the expense ratio of the Allocation Fund is average compared to many other mutual funds that have similar investment strategies. However, the Independent Trustees considered the fact that the higher expense ratio is attributable, in part, to the relatively small size of the Fund and took into consideration the expense limitation arrangements under which the Adviser has contractually agreed to waive its advisory fees or to absorb operating expenses of the Fund, to the extent necessary to limit total annual ordinary operating expenses of the Allocation Fund (excluding acquired fund fees and expenses, brokerage commissions, taxes, interest expense and any extraordinary expenses) to 1.25% of average daily net assets.
Hussman Investment Trust
Approval of Investment Advisory Agreements |
(Unaudited) (continued) |
In evaluating the expense ratios of the Funds, the Independent Trustees recognized that, although under the expense limitation agreements currently in effect the Adviser may be entitled to be reimbursed by a Fund for all or a portion of fees waived and expenses absorbed by the Adviser, any such reimbursement could not result in the expense ratio of a Fund (excluding acquired fund fees and expenses, brokerage commissions, taxes, interest expense and any extraordinary expenses) exceeding the lesser of: (i) the expense limitation in effect for the Fund at the time of the fee waiver or expense absorption by the Adviser; and (ii) the expense limitation (if any) in effect at the time of reimbursement by the Fund. The Independent Trustees were cognizant of the fact that the current expense limitation agreement for each Fund remains in effect only until November 1, 2024 but recognized that the Adviser has historically agreed to continuing such agreements in effect from year to year (either without change or with only relatively minor upward adjustment in the applicable expense limitation) and has expressed no current intention to alter its practice. The Independent Trustees concluded that each Fund has benefited and continues to benefit from these expense limitation arrangements, which have enabled each Fund to maintain an expense ratio within the expense ratios of its peer group funds.
The Independent Trustees also reviewed recent financial statements of the Adviser, as well as schedules showing the Adviser’s estimated revenues, expenses and profitability with respect to each of the Funds for calendar years 2021, 2022 and 2023 and for the first four months of 2024. They noted that the Adviser has waived its fees (and, in some cases, absorbed expenses of a Fund), thereby reducing its profitability, pursuant to expense limitation agreements. In evaluating the Adviser’s profitability, the Independent Trustees considered the broad and unique skill set and talent that is required for the Adviser to pursue and to adhere to the Funds’ well-defined and disciplined investment programs, which has been a primary attraction of the Funds to investors. They determined that, based on the Adviser’s revenues and profitability, the Adviser has sufficient financial resources to enable it to continue to provide all required services to the Funds, without diminution of service quality or scope. The Independent Trustees noted that the Adviser’s profitability with respect to each of the Funds was not excessive when viewed in light of the scope of services provided by the Adviser and the Adviser’s adherence to its stated investment philosophy and the investment programs of the Funds.
Based on a careful review of the investment performance and risk characteristics of the Funds and consideration of other matters deemed by them to be pertinent (including, but not limited to, the factors and information discussed above), the Independent Trustees concluded that the Adviser has provided all required services to
Hussman Investment Trust
Approval of Investment Advisory Agreements |
(Unaudited) (continued) |
the Funds in a satisfactory manner. They determined that this conclusion is supported by the nature and scope of advisory services required by the Funds, which are broader and more sophisticated than those required by many other mutual funds due to the nature of the Funds’ investment programs and which involve extensive use of risk-management techniques. The Independent Trustees also considered the fact that the Adviser has generally achieved lower volatility of investment returns for the Funds than would have resulted from use of a passive investment approach. They recognized that challenges associated with the Adviser’s hedging approach have reduced the returns of the Growth Fund in the period since 2009 but noted that the Adviser has implemented meaningful changes in its methodologies since 2009 that may operate to reduce the frequency of similar challenges in future market cycles while maintaining the favorable attributes that the Adviser’s hedging strategies exhibited in the years prior to 2009.
The Independent Trustees concluded that the Adviser has consistently taken a proactive stance with regard to shareholder protections, service quality and ethical standards. Among other things, they noted that the Adviser: (i) does not derive any material indirect benefits from its relationship with the Funds; (ii) does not derive any economic benefit in connection with transactions in shares of the Funds; and (iii) adheres to a brokerage placement policy that seeks to obtain best execution and low commissions on all of the Funds’ brokerage transactions and does not direct transactions to obtain “soft dollar” services, which has resulted in significant savings to the Funds and their shareholders by reducing transaction costs (which are not reflected in the expense ratios of the Funds) and has operated to increase the Funds’ investment performance after expenses. The Independent Trustees thought it was significant that Dr. John Hussman and other personnel of the Adviser, and their immediate family members and charitable entities, maintain substantial investments in the Funds, which helps to align the interests of the Adviser and its personnel with the interests of shareholders.
The Independent Trustees also considered the profitability of the Adviser from its relationship with each Fund and concluded that the Adviser’s profitability was not excessive when viewed in light of the scope of services provided by the Adviser and the Adviser’s adherence to its stated investment philosophy and the investment programs of the Funds. They noted that the Adviser has been willing to share in the economies of scale that have been realized from the growth in the assets of the Funds. In addition, they noted that, although the Adviser benefits from its relationship with the Funds to the extent that the growth of the Funds’ assets increase the dollar amount
Hussman Investment Trust
Approval of Investment Advisory Agreements |
(Unaudited) (continued) |
of advisory fees payable to the Adviser, such a result is appropriate and there are no other benefits for which an economic benefit can readily be determined that are realized by the Adviser.
After evaluating all pertinent factors and information (including but not limited to the factors and information discussed above), the Board determined that the fees payable by each Fund pursuant to the Advisory Agreements are appropriate in view of the nature, scope and quality of services provided by the Adviser, and further determined that continuances of the Advisory Agreements are in the best interests of the Funds and their shareholders. Accordingly, the Board voted unanimously to approve the continuance of each of the Advisory Agreements for an additional one-year term. No single factor was considered in isolation or to be determinative to this decision.
THIS PAGE INTENTIONALLY LEFT BLANK.
THIS PAGE INTENTIONALLY LEFT BLANK.

INVESTMENT ADVISER
Hussman Strategic Advisors, Inc.
6021 University Boulevard, Suite 490
Ellicott City, Maryland 21043
www.hussmanfunds.com
1-800-HUSSMAN (1-800-487-7626)
ADMINISTRATOR/TRANSFER AGENT
Ultimus Fund Solutions, LLC
225 Pictoria Drive, Suite 450
Cincinnati, Ohio 45246
CUSTODIAN
U.S. Bank, N.A.
425 Walnut Street
Cincinnati, Ohio 45202
INDEPENDENT REGISTERED
PUBLIC ACCOUNTING FIRM
Cohen & Company, Ltd.
342 N. Water Street
Suite 830
Milwaukee, Wisconsin 53202
LEGAL COUNSEL
Troutman Pepper Hamilton Sanders LLP
3000 Two Logan Square
Eighteenth and Arch Streets
Philadelphia, PA 19103
This Report is authorized for
distribution only if accompanied or preceded
by a current Prospectus of the Funds.
(b) Included in (a)
Item 8. Changes in and Disagreements with Accountants for Open-End Management Investment Companies.
Not applicable
Item 9. Proxy Disclosures for Open-End Management Investment Companies.
Not applicable
Item 10. Remuneration Paid to Directors, Officers, and Others of Open-End Management Investment Companies.
Included under Item 7
Item 11. Statement Regarding Basis for Approval of Investment Advisory Contract.
Included under Item 7
Item 12. Disclosure of Proxy Voting Policies and Procedures for Closed-End Management Investment Companies.
Not applicable
Item 13. Portfolio Managers of Closed-End Management Investment Companies.
Not applicable
Item 14. Purchases of Equity Securities by Closed-End Management Investment Company and Affiliated Purchasers.
Not applicable
Item 15. Submission of Matters to a Vote of Security Holders.
The registrant has not adopted procedures by which shareholders may recommend nominees to the registrant’s board of trustees.
Item 16. Controls and Procedures.
(a) Based on their evaluation of the registrant’s disclosure controls and procedures (as defined in Rule 30a-3(c) under the Investment Company Act of 1940) as of a date within 90 days of the filing date of this report, the registrant’s principal executive officer and principal financial officer have concluded that such disclosure controls and procedures are reasonably designed and are operating effectively to ensure that material information relating to the registrant, including its consolidated subsidiaries, is made known to them by others within those entities, particularly during the period in which this report is being prepared, and that the information required in filings on Form N-CSR is recorded, processed, summarized, and reported on a timely basis.
(b) There were no changes in the registrant’s internal control over financial reporting (as defined in Rule 30a-3(d) under the Investment Company Act of 1940) that occurred during the period covered by this report that have materially affected, or are reasonably likely to materially affect, the registrant’s internal control over financial reporting.
Item 17. Disclosure of Securities Lending Activities for Closed-End Management Investment Companies.
Not applicable
Item 18. Recovery of Erroneously Awarded Compensation.
(a) Not applicable
(b) Not applicable
Item 19. Exhibits.
File the exhibits listed below as part of this Form. Letter or number the exhibits in the sequence indicated.
(a)(1) Any code of ethics, or amendment thereto, that is the subject of the disclosure required by Item 2, to the extent that the registrant intends to satisfy the Item 2 requirements through filing of an exhibit: Attached hereto
(a)(2) A separate certification for each principal executive officer and principal financial officer of the registrant as required by Rule 30a-2(a) under the Act (17 CFR 270.30a-2(a)): Attached hereto
(1) Not applicable
(2) Change in the registrant’s independent public accountant: Not applicable
(b) Certifications required by Rule 30a-2(b) under the Act (17 CFR 270.30a-2(b)): Attached hereto
SIGNATURES
Pursuant to the requirements of the Securities Exchange Act of 1934 and the Investment Company Act of 1940, the registrant has duly caused this report to be signed on its behalf by the undersigned, thereunto duly authorized.
| (Registrant) | Hussman Investment Trust | |
| | | |
| By (Signature and Title)* | /s/ John P. Hussman | |
| | | |
| | John P. Hussman, President and Chief Executive Officer |
| | | |
| Date | October 10, 2024 | |
Pursuant to the requirements of the Securities Exchange Act of 1934 and the Investment Company Act of 1940, this report has been signed below by the following persons on behalf of the registrant and in the capacities and on the dates indicated.
| By (Signature and Title)* | /s/ John P. Hussman | |
| | | |
| | John P. Hussman, President and Chief Executive Officer |
| | | |
| Date | October 10, 2024 | |
| | | |
| By (Signature and Title)* | /s/ Mark J. Seger | |
| | | |
| | Mark J. Seger, Treasurer and Chief Financial Officer |
| | | |
| Date | October 10, 2024 | |
| * | Print the name and title of each signing officer under his or her signature. |