EXHIBIT 1

FOR IMMEDIATE RELEASE
| Global Sources Press Contact in Asia | Global Sources Investor Contact in Asia |
| Camellia So | Investor Relations Department |
| Tel: (852) 2555-5021 | Tel: (852) 2555-4777 |
e-mail: cso@globalsources.com | e-mail: investor@globalsources.com |
| Global Sources Press Contact in U.S. | Global Sources Investor Contacts in U.S. |
| James W.W. Strachan | Christiane Pelz & Kirsten Chapman |
| Tel: (480) 664 8309 | Lippert/Heilshorn & Associates, Inc. |
e-mail: strachan@globalsources.com | Tel: (415) 433-3777 e-mail: investor@globalsources.com |
Global Sources Reports First Quarter Results
- Revenue of $40.6 Million, Up 16% Compared to First Quarter 2007 Driven by Online Revenue Growth of 27% -
- First Quarter GAAP EPS of $0.17 and Non-GAAP EPS of $0.14 - -
- Increases Guidance for Second Quarter 2008 and First Half 2008 Revenue and EPS - -
NEW YORK, May 22, 2008 – Global Sources Ltd. (NASDAQ: GSOL) (http://www.globalsources.com) reported financial results for the first quarter ended March 31, 2008.
Global Sources' chairman and CEO, Merle A. Hinrichs, said: “We are very pleased with our first quarter performance. Our online services grew 27% and our exhibitions grew 24%, compared to the same period last year. The acceleration of online growth demonstrates the progress we are making with our new Global Sources Online 2.0 website, Six-Star supplier ranking system, new service packages and our expanding sales representation. Underlying all of this is our market leadership in helping buyers to distinguish between verified and unverified suppliers.
“Regarding exhibitions, during the first quarter, the largest-ever International IC-China Conference & Exhibition was held. More than 1,400 booths were sold, up 37% compared to last year. In addition, our April China Sourcing Fairs in Hong Kong featured over 6,700 booths, up approximately 6% from April 2007.”
Financial Highlights: First Quarter 2008 Compared to First Quarter 2007
| · | Revenue was $40.6 million, up 16% from $34.9 million. |
| * | Online revenue was $21.9 million, up 27% from $17.3 million. |
| * | Exhibitions revenue was $6.0 million, up 24% from $4.8 million. |
| * | Print revenue was $11.6 million, down 1% from $11.8 million. |
| * | Revenue from mainland China was $24.1 million, up 30% from $18.4 million. |
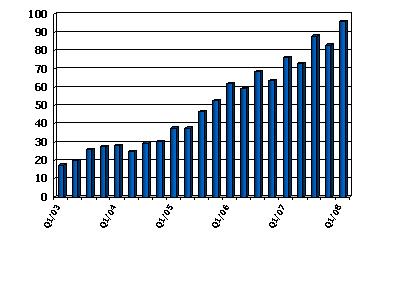
| · | Total deferred income and customer prepayments were $96.1 million as at March 31, 2008, up 26% from $76.1 million as at March 31, 2007. |
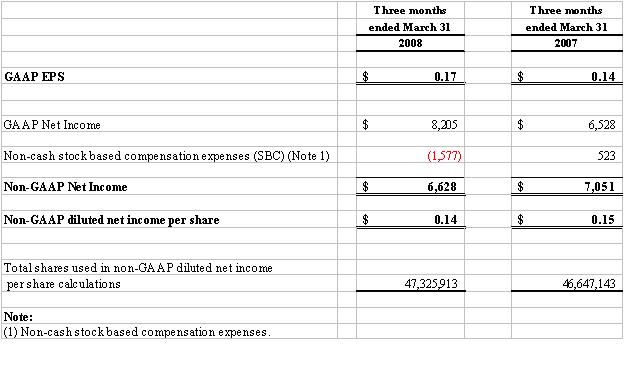
In accordance with generally accepted accounting principles (GAAP), first quarter 2008 net income was $8.2 million, or $0.17 per diluted share, which included a credit of $1.6 million, or $0.03 per share, to non-cash stock based compensation expense (SBC) based on a stock price of $14.85 on March 31, 2008. For the first quarter of 2007, GAAP net income was $6.5 million, or $0.14 per diluted share. Non-GAAP net income for the first quarter of 2008 was $6.6 million, compared to $7.1 million for the first quarter of 2007. Non-GAAP EPS for the first quarter of 2008 was $0.14, compared to $0.15 for the first quarter of 2007.
Non-GAAP Metrics
Management believes non-GAAP metrics are useful measures of operations and provides GAAP to non-GAAP reconciliation tables at the end of this press release. Global Sources defines non-GAAP net income as net income excluding non-cash stock based compensation (SBC) expense or credit, gains or losses on acquisitions and investments, and/or impairment charges, for all historical and future references to non-GAAP metrics. Non-GAAP EPS is defined as non-GAAP net income divided by the weighted average of diluted common shares outstanding.
Global Sources’ CFO, Eddie Heng, said: “Our first quarter was stronger than expected, primarily due to strong online revenue growth, which included 38% revenue growth from China. Deferred income and customer prepayments were also healthy, up 26% compared to the same time last
year, and up 16% compared to the end of the fourth quarter of 2007, resulting in positive cash flow from operations of $15.7 million in the first quarter of 2008. For the rest of 2008, we expect online and trade shows to continue to serve as the main growth drivers, and we anticipate revenue from China to continue growing faster than overall revenue. We also expect a positive impact from expanding sales representation for all of our products.”
Financial Expectations for Second Quarter and First Half 2008
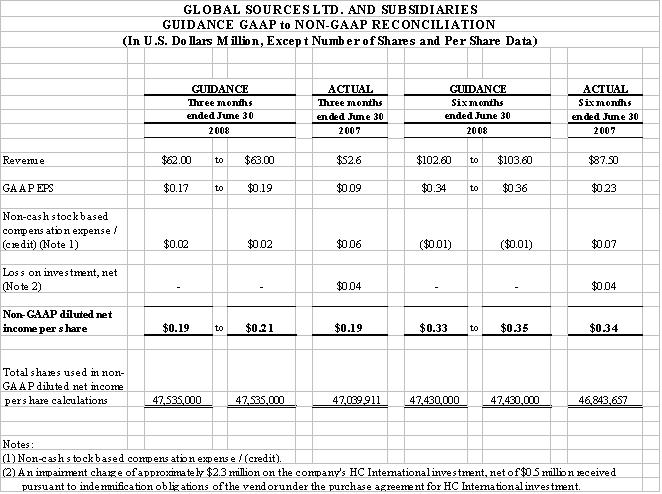
Due primarily to online revenue growth, guidance for both revenue and earnings is being increased for the second quarter 2008 and first half 2008.
| · | Second Quarter 2008 Ending June 30, 2008: |
| * | Guidance for revenue has been increased to be between $62.0 million and $63.0 million, representing growth of 18% to 20% over the second quarter of 2007. Based on the stock price of $15.04 on May 12, 2008, SBC is estimated to be $0.02 per diluted share. |
| * | GAAP EPS is expected to be between $0.17 and $0.19. |
| * | Non-GAAP EPS is expected to be between $0.19 and $0.21, compared to $0.19 per diluted share in the second quarter of 2007. |
| · | First Half 2008 Ending June 30, 2008: |
| * | Revenue is expected to be in the range of $102.6 million to $103.6 million. Compared to $87.5 million for the first six months of 2007, this represents an increase of 17% to 18%. Using the stock price of $15.04 on May 12, 2008, SBC is estimated to be a credit of $0.01 per diluted share. |
| * | GAAP EPS is expected to be in the range of $0.34 to $0.36, as compared to $0.23 per diluted share in the first half of 2007. |
| * | Non-GAAP EPS is expected to be in the range of $0.33 to $0.35, compared to $0.34 per diluted share for the same period in 2007. |
Recent Corporate Highlights
| · | The largest ever International IC-China Conference & Exhibition was held in March, featuring more than 1,400 booths. Expansion plans for 2009 include additional locations and time slots in the fall. |
| · | Held 5 China Sourcing Fairs in Hong Kong in April featuring over 6,700 booths. |
| · | Achieved record lead generation, which is measured as requests for information (RFIs) from buyers to suppliers through Global Sources Online. There were 32.6 million RFIs for the 12 months ended March 31, 2008, up more than 137% compared to the same period last year. |
| · | Increased Global Sources’ independently certified community of active buyers to more than 700,000 at the end of the first quarter, 16% higher than the same time last year. |
| · | The Private Sourcing Events were expanded to India and to the United States, where an event ran concurrently with the Consumer Electronics Show in Las Vegas. |
| · | Honored by Investor Relations Global Rankings (IRGR) for best IR website, corporate governance section and financial disclosure procedures in the small/mid cap category. |
Conference Call for Global Sources First Quarter 2008 Earnings
Chairman and CEO, Merle A. Hinrichs, and Eddie Heng, CFO, are scheduled to conduct a conference call at 8:00 a.m. ET on May 22, 2008 (8:00 p.m. on May 22, 2008 in Hong Kong) to review these results in more detail. Investors in the United States may participate in the call by dialing (888) 212-8315, and international participants may dial (706) 643-0144. Investors in Hong Kong may call (852) 3011-4522. A live webcast of the conference call is scheduled to be available on Global Sources' corporate site at http://www.investor.globalsources.com .
For those who cannot listen to the live broadcast, a webcast replay of the call is scheduled to be available on the company’s corporate site for at least 30 days. A telephone replay of the call is also scheduled to be available through May 26, 2008. To listen to the telephone replay, dial (800) 642-1687, or dial (706) 645-9291 outside the United States, and enter pass code 43874234#. For those in the Hong Kong area, the replay dial-in number is (852) 3011-4541, and the pass code is 43874234#.
About Global Sources
Global Sources is a leading business-to-business media company and a primary facilitator of trade with Greater China. The core business is facilitating trade from Greater China to the world, using a wide range of English-language media. The other business segments facilitate trade from the world to Greater China, and trade within China, using Chinese-language media.
The company provides sourcing information to volume buyers and integrated marketing services to suppliers. It helps a community of over 700,000 active buyers source more profitably from
complex overseas supply markets. With the goal of providing the most effective ways possible to advertise, market and sell, Global Sources enables suppliers to sell to hard-to-reach buyers in over 230 countries.
The company offers the most extensive range of media and export marketing services in the industries it serves. It delivers information on 2.6 million products and more than 195,000 suppliers annually through 14 online marketplaces, 13 monthly magazines, over 100 sourcing research reports and 9 specialized trade shows which run 27 times a year across eight cities.
Suppliers receive more than 32 million sales leads annually from buyers through Global Sources Online (http://www.globalsources.com) alone.
Global Sources has been facilitating global trade for 37 years. Global Sources' network covers more than 69 cities worldwide. In mainland China, Global Sources has over 2,100 team members in more than 44 locations, and a community of over 1 million registered online users and magazine readers for Chinese-language media.
Safe Harbor Statement
This news release contains forward-looking statements within the meaning of Section 27-A of the Securities Act of 1933, as amended and Section 21-E of the Securities Exchange Act of 1934, as amended. The company's actual results could differ materially from those set forth in the forward-looking statements as a result of the risks associated with the company's business, changes in general economic conditions, and changes in the assumptions used in making such forward-looking statements.
- Tables to Follow -
GLOBAL SOURCES LTD. AND SUBSIDIARIES
CONSOLIDATED BALANCE SHEETS
(In U.S. Dollars Thousands, Except Number of Shares and Per Share Data)
At March 31 | At December 31 | |||||||
| 2008 | 2007 | |||||||
| (Unaudited) | ||||||||
| ASSETS | ||||||||
| Current Assets: | ||||||||
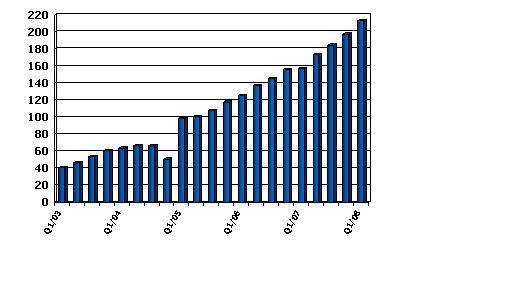
| Cash and cash equivalents | $ | 206,957 | $ | 197,825 | ||||
| Available-for-sale securities | 6,431 | - | ||||||
| Accounts receivable, net | 5,714 | 6,665 | ||||||
| Receivables from sales representatives | 13,711 | 12,303 | ||||||
| Inventory | 957 | 1,108 | ||||||
| Prepaid expenses and other current assets | 22,734 | 15,333 | ||||||
| Deferred tax assets | 46 | 46 | ||||||
| Total Current Assets | 256,550 | 233,280 | ||||||
| Property and equipment, net | 35,085 | 35,352 | ||||||
| Long term investments | 100 | 100 | ||||||
| Bonds held to maturity, at amortized cost | 100 | 99 | ||||||
| Deferred tax assets – long term | 196 | 196 | ||||||
| Other assets | 3,119 | 2,781 | ||||||
| Total Assets | $ | 295,150 | $ | 271,808 | ||||
| LIABILITIES AND SHAREHOLDERS’ EQUITY | ||||||||
| Current Liabilities: | ||||||||
| Accounts payable | $ | 6,018 | $ | 5,577 | ||||
| Deferred income and customer prepayments | 90,285 | 78,141 | ||||||
| Accrued liabilities | 13,812 | 12,546 | ||||||
| Income taxes payable | 850 | 694 | ||||||
| Total Current Liabilities | 110,965 | 96,958 | ||||||
| Deferred income and customer prepayments – long term | 5,820 | 4,934 | ||||||
| Deferred tax liability | 294 | 283 | ||||||
| Total Liabilities | 117,079 | 102,175 | ||||||
| Minority interest | 5,567 | 4,940 | ||||||
| Shareholders’ equity: | ||||||||
| Common shares, US$0.01 par value; 75,000,000 shares authorized; | ||||||||
| 46,702,092 (2007: 46,572,092) shares issued and outstanding | 467 | 466 | ||||||
| Additional paid in capital | 133,295 | 133,987 | ||||||
| Retained earnings | 37,034 | 28,829 | ||||||
| Accumulated other comprehensive income | 1,708 | 1,411 | ||||||
| Total Shareholders’ Equity | 172,504 | 164,693 | ||||||
| Total Liabilities and Shareholders’ Equity | $ | 295,150 | $ | 271,808 | ||||
GLOBAL SOURCES LTD. AND SUBSIDIARIES
CONSOLIDATED STATEMENTS OF INCOME
(In U.S. Dollars Thousands, Except Number of Shares and Per Share Data)
Three months ended March 31, | ||||||||
2008 | 2007 | |||||||
| (Unaudited) | (Unaudited) | |||||||
| Revenue: | ||||||||
Online and other media services (Note 1) | $ | 33,532 | $ | 29,045 | ||||
Exhibitions | 5,961 | 4,816 | ||||||
Miscellaneous | 1,121 | 1,086 | ||||||
| 40,614 | 34,947 | |||||||
| Operating Expenses: | ||||||||
Sales (Note 2) | 12,316 | 11,136 | ||||||
Event production | 1,005 | 613 | ||||||
Community (Note 2) | 6,043 | 5,273 | ||||||
General and administrative (Note 2) | 11,228 | 9,953 | ||||||
Online services development (Note 2) | 1,479 | 1,286 | ||||||
Amortization of software costs . | 40 | 40 | ||||||
| Total Operating Expenses | 32,111 | 28,301 | ||||||
| Income from Operations | 8,503 | 6,646 | ||||||
Interest and dividend income | 1,297 | 1,392 | ||||||
Foreign exchange gains (losses), net | (256 | ) | (274 | ) | ||||
| Income before Income Taxes | 9,544 | 7,764 | ||||||
| Income Tax Expense | (233 | ) | (219 | ) | ||||
| Net Income before Minority Interest | $ | 9,311 | $ | 7,545 | ||||
| Minority interest | (1,106 | ) | (1,017 | ) | ||||
| Net Income | $ | 8,205 | $ | 6,528 | ||||
| Diluted net income per share | $ | 0.17 | $ | 0.14 | ||||
| Total shares used in diluted net income per share calculations. | 47,325,913 | 46,647,143 | ||||||
| Note : | 1. | Online and other media services consists of: |
Three months ended March 31, | ||||||||
2008 | 2007 | |||||||
| (Unaudited) | (Unaudited) | |||||||
Online services | $ | 21,930 | $ | 17,270 | ||||
Print services | 11,602 | 11,775 | ||||||
| $ | 33,532 | $ | 29,045 | |||||
| Note : | 2. | Non-cash compensation expenses associated with the employee equity compensation plans and Directors Purchase Plan included under various categories of expenses are as follows:. |
Three months ended March 31, | ||||||||
2008 | 2007 | |||||||
| (Unaudited) | (Unaudited) | |||||||
Sales | $ | (1,393 | ) | $ | (133 | ) | ||
Community | 15 | 85 | ||||||
General administrative | (247 | ) | 509 | |||||
Online services development | 48 | 62 | ||||||
| $ | (1,577 | ) | $ | 523 | ||||
GLOBAL SOURCES LTD. AND SUBSIDIARIES
CONSOLIDATED STATEMENTS OF CASH FLOWS
(In U.S. Dollars Thousands, Except Number of Shares and Per Share Data)
| Three months ended March 31, | ||||||||
| 2008 | 2007 | |||||||
| (Unaudited) | (Unaudited) | |||||||
| Cash flows from operating activities: | ||||||||
| Net income | $ | 8,205 | $ | 6,528 | ||||
Adjustments to reconcile net income to net cash provided by operating activities | ||||||||
| Depreciation and amortization | 1,269 | 1,072 | ||||||
| Accretion of U.S. Treasury strips zero % coupons | (1 | ) | (4 | ) | ||||
| Provision for doubtful debts (written back) | (64 | ) | 100 | |||||
| Non-cash compensation expense (credit) | (1,577 | ) | 523 | |||||
| Income attributable to minority shareholder | 1,106 | 1,017 | ||||||
| Equipment written off | - | 4 | ||||||
| Exchange rate realignment | (123 | ) | - | |||||
| 8,815 | 9,240 | |||||||
| Changes in assets and liabilities: | ||||||||
| Accounts receivables | 1,015 | (14 | ) | |||||
| Receivables from sales representatives | (1,404 | ) | (4,095 | ) | ||||
| Inventory | 151 | (123 | ) | |||||
| Prepaid expenses and other current assets | (7,377 | ) | (5,939 | ) | ||||
| Long term assets | (333 | ) | (1,051 | ) | ||||
| Accounts payable | 407 | (254 | ) | |||||
| Accrued liabilities and liabilities for incentive and bonus plans | 1,231 | (2,260 | ) | |||||
| Deferred income and customer prepayments | 13,021 | 12,309 | ||||||
| Tax liability | 142 | 143 | ||||||
| Net cash provided by operating activities | 15,668 | 7,956 | ||||||
| Cash flows from investing activities: | ||||||||
| Purchase of property and equipment | (569 | ) | (592 | ) | ||||
Purchase of available-for-sale securities | (6,467 | ) | - | |||||
Proceeds from sale of available-for-sale securities | - | 7 | ||||||
Payment of dividend to minority shareholder by a subsidiary | (479 | ) | - | |||||
| Net cash used in investing activities | (7,515 | ) | (585 | ) | ||||
| Cash flows from financing activities: | ||||||||
| Amount received towards directors purchase plan | 886 | 422 | ||||||
| Net cash generated from financing activities | 886 | 422 | ||||||
| Effect of exchange rate changes on cash equivalents | 93 | - | ||||||
| Net increase in cash and cash equivalents | 9,039 | 7,793 | ||||||
| Cash and cash equivalents, beginning of the period | 197,825 | 135,093 | ||||||
| Cash and cash equivalents, end of the period | $ | 206,957 | $ | 142,886 | ||||
| Supplemental cash flow disclosures: | ||||||||
| Income tax paid | $ | 66 | $ | 76 | ||||
| GLOBAL SOURCES LTD. AND SUBSIDIARIES |
| ACTUAL GAAP to NON-GAAP RECONCILIATION |
| (In U.S. Dollars Thousands, Except Number of Shares and Per Share Data) |
GLOBAL SOURCES LTD. AND SUBSIDIARIES
Total Cash and Securities
US$ Millions
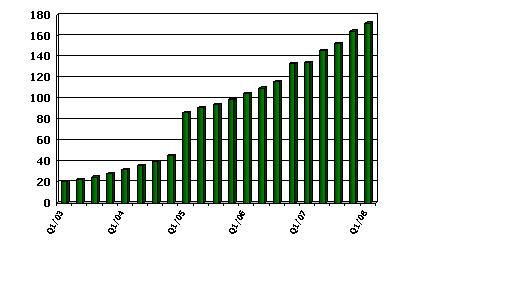
Total Shareholders’ Equity
US$ Millions
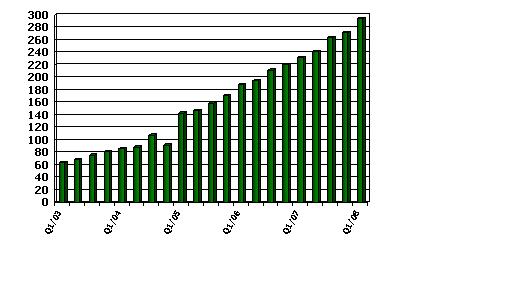
Total Assets
US$ Millions
Total Deferred Income
Customer Prepayments
US$ Millions