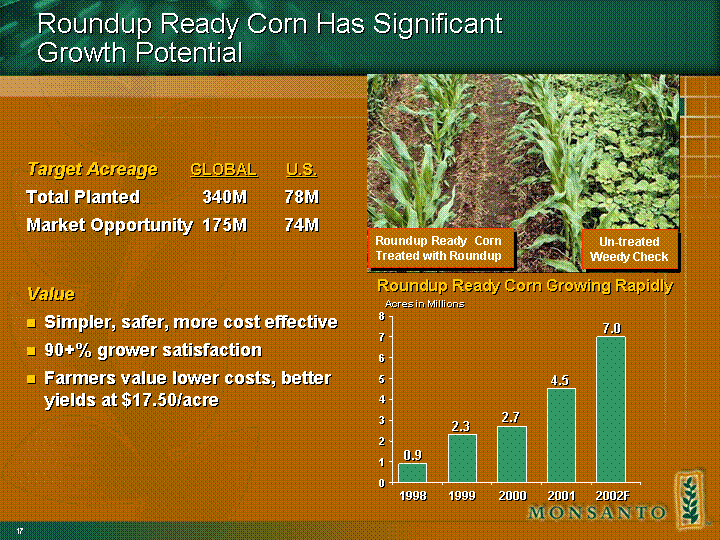
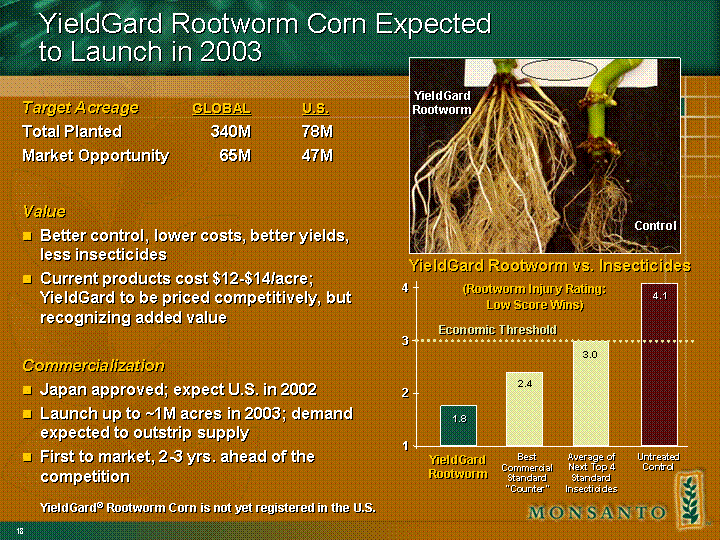
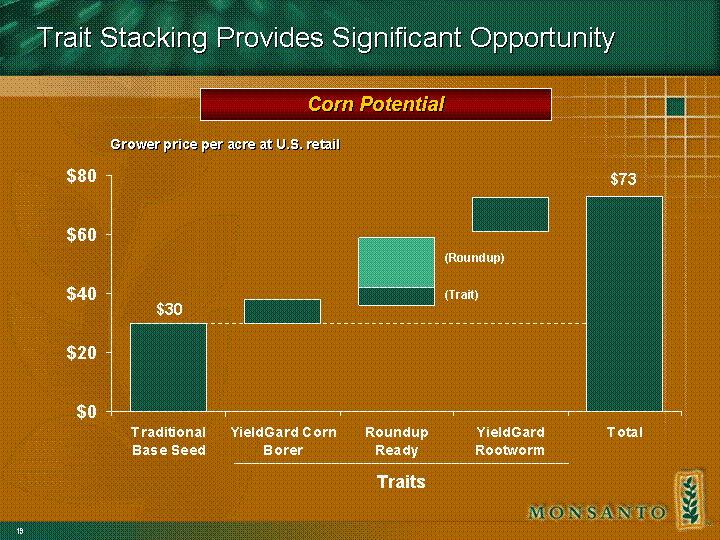
Grower price per acre at U.S. retail
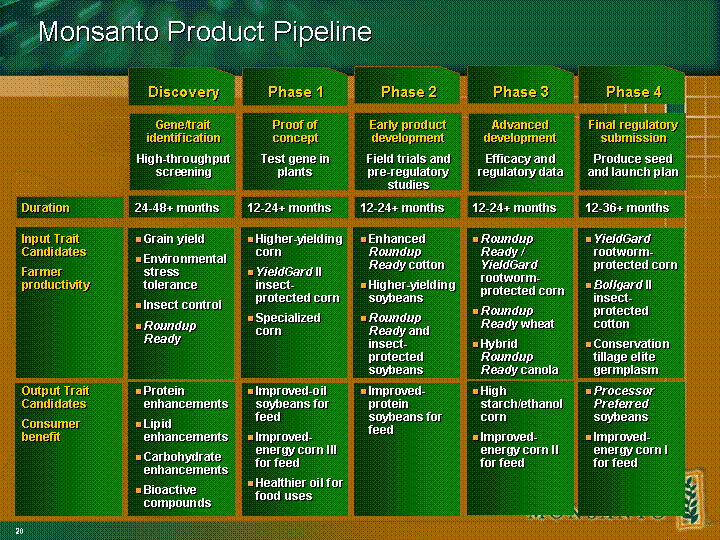
Monsanto Product Pipeline
Discovery
Gene/trait identification
High-throughput screening
Duration
24-48+ months
Input Trait Candidates
Farmer productivity
Grain yield
Environmental stress tolerance
Insect control
Roundup Ready
Output Trait Candidates
Consumer benefit
Protein enhancements
Lipid enhancements
Carbohydrate enhancements
Bioactive compounds
Phase 1
Proof of concept
Test gene in plants
Duration
12-24+ months
Input Trait Candidates
Farmer productivity
Higher-yielding corn
YieldGard II insect-protected corn
Specialized corn
Output Trait Candidates
Consumer benefit
Improved-oil soybeans for feed
Improved-energy corn III for feed
Healthier oil for food uses
Phase 2
Early product development
Field trials and pre-regulatory studies
Duration
12-24+ months
Input Trait Candidates
Farmer productivity
Enhanced Roundup Ready cotton
Higher-yielding soybeans
Roundup Ready and insect-protected soybeans
Output Trait Candidates
Consumer benefit
Improved-protein soybeans for feed
Phase 3
Advanced development
Efficacy and regulatory data
Duration
12-24+ months
Input Trait Candidates
Farmer productivity
Roundup Ready / YieldGard rootworm-protected corn
Roundup Ready wheat
Hybrid Roundup Ready canola
Output Trait Candidates
Consumer benefit
High starch/ethanol corn
Improved-energy corn II for feed
Phase 4
Final regulatory submission
Produce seed and launch plan
Duration
12-36+ months
Input Trait Candidates
Farmer productivity
YieldGard rootworm-protected corn
Bollgard II insect-protected cotton
Conservation tillage elite germplasm
Output Trait Candidates
Consumer benefit
Processor Preferred soybeans
Improved-energy corn I for feed
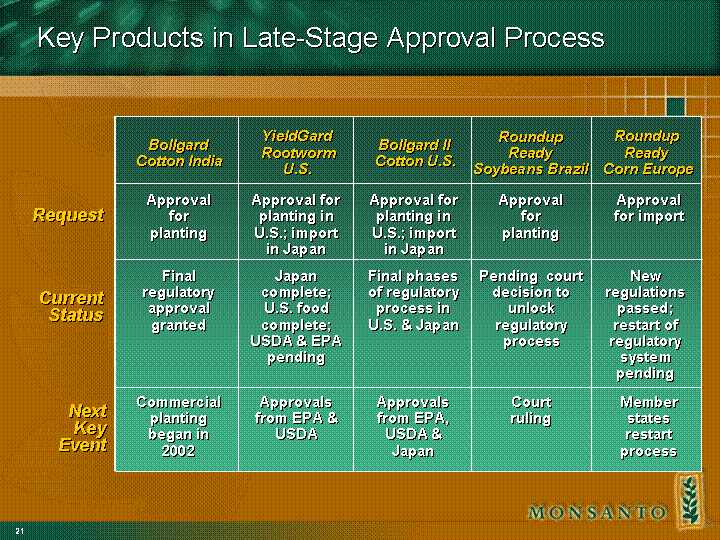
Key Products in Late-Stage Approval Process
Bollgard Cotton India
Request
Approval for planting
Current Status
Final regulatory approval granted
Next Key Event
Commercial planting began in 2002
YieldGard Rootworm U.S.
Request
Approval for planting in U.S.; import in Japan
Current Status
Japan complete; U.S. food complete; USDA & EPA pending
Next Key Event
Approvals from EPA & USDA
Bollgard II Cotton U.S.
Request
Approval for planting in U.S.; import in Japan
Current Status
Final phases of regulatory process in U.S. & Japan
Next Key Event
Approvals from EPA, USDA & Japan
Roundup Ready Soybeans Brazil
Request
Approval for planting
Current Status
Pending court decision to unlock regulatory process
Next Key Event
Court ruling
Roundup Ready Corn Europe
Request
Approval for import
Current Status
New regulations passed; restart of regulatory system pending
Next Key Event
Member states restart process
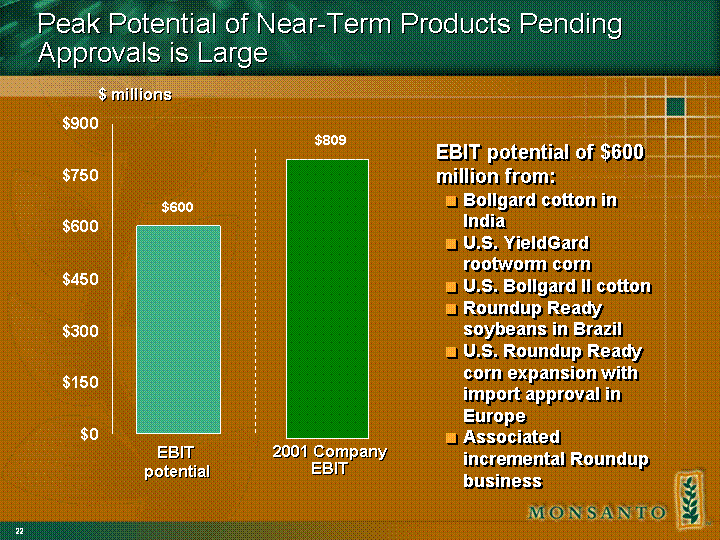
Peak Potential of Near-Term Products Pending Approvals is Large
$ millions
EBIT potential - $600
2001 Company EBIT - $809
EBIT potential of $600 million from:
- Bollgard cotton in India
- U.S. YieldGard rootworm corn
- U.S. Bollgard II cotton
- Roundup Ready soybeans in Brazil
- U.S. Roundup Ready corn expansion with import approval in Europe
- Associated incremental Roundup business
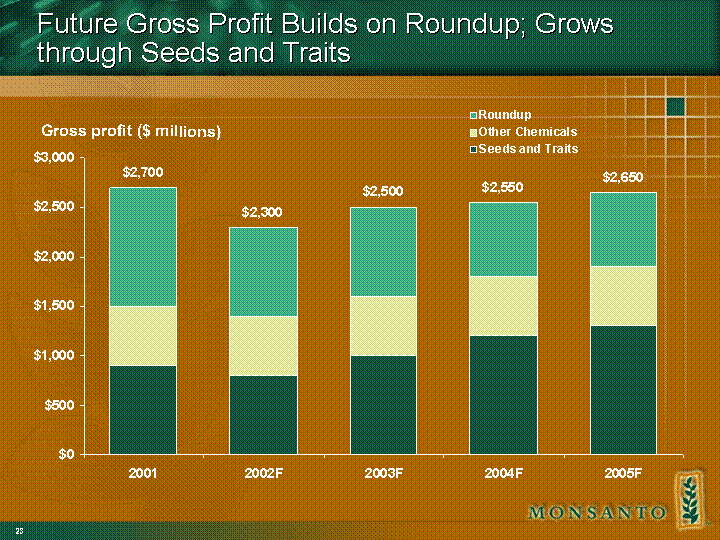
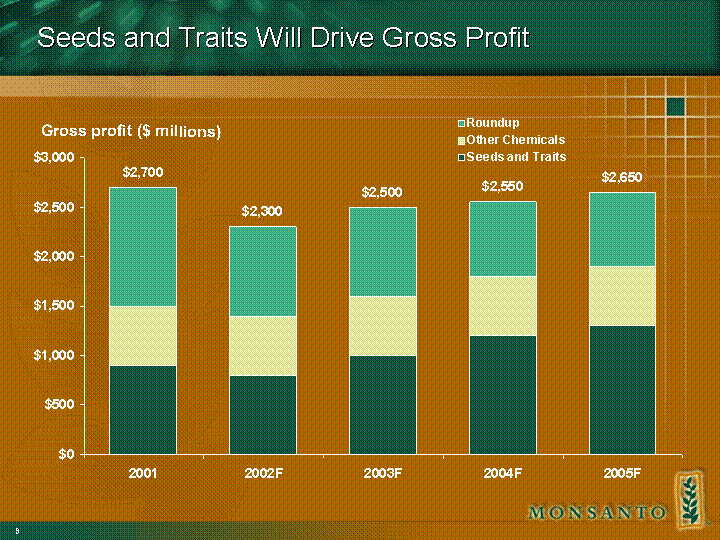
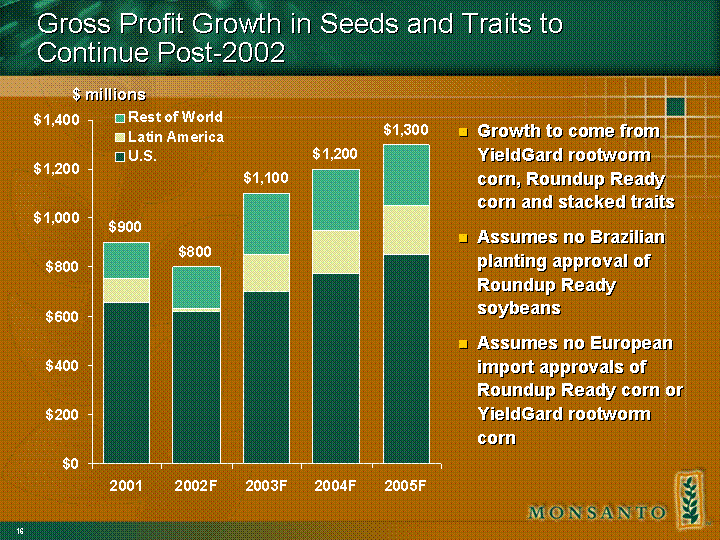
Future Gross Profit Builds on Roundup; Grows through Seeds and Traits
Gross profit ($ millions)
| | 2001 | | 2002F | | 2003F | | 2004F | | 2005F | |
| Seeds and Traits | 900 | | 800 | | 1000 | | 1200 | | 1300 | |
| Other Chemicals | 600 | | 600 | | 600 | | 600 | | 600 | |
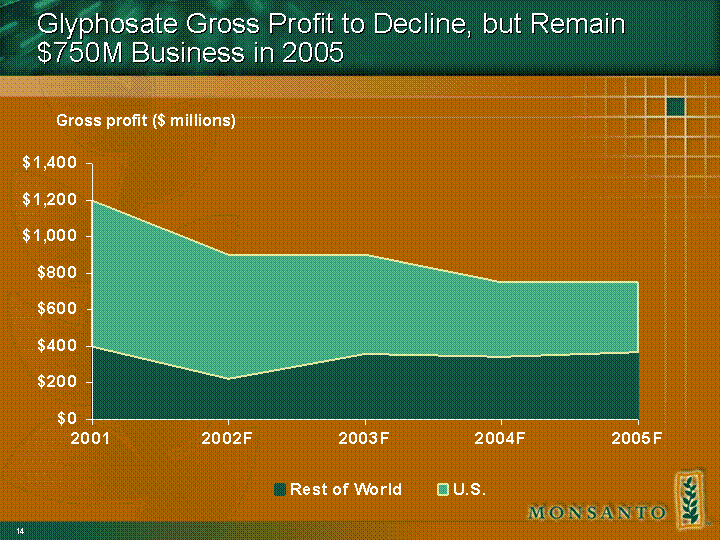
| Roundup | 1200 | | 900 | | 900 | | 750 | | 750 | |
| Total | 2700 | | 2300 | | 2500 | | 2550 | | 2650 | |
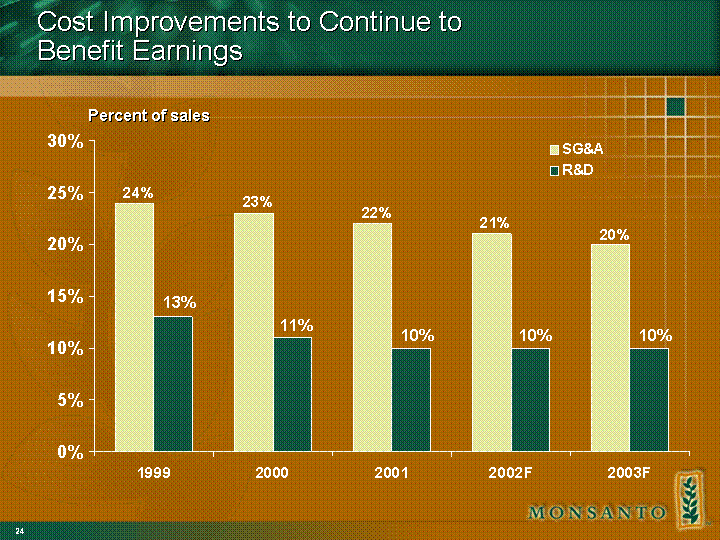
Cost Improvements to Continue to Benefit Earnings
Percent of sales
| | 1999 | | 2000 | | 2001 | | 2002F | | 2003F | |
| SG&A | 24% | | 23% | | 22% | | 21% | | 20% | |
| R&D | 13% | | 11% | | 10% | | 10% | | 10% | |
Longer-term objective: SG&A 18% of sales
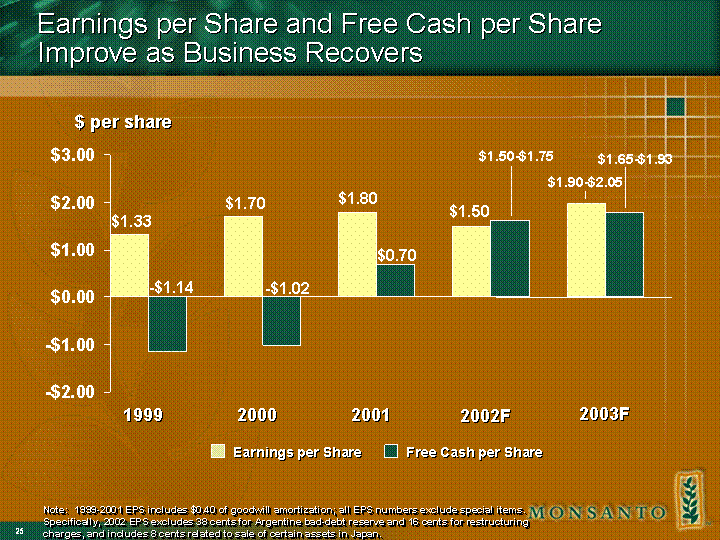
Earnings per Share and Free Cash per Share Improve as Business Recovers
$ per share
Earnings per Share
1999 - $1.33
2000 - $1.70
2001 - $1.80
2002F - $1.50
2003F - $1.90-$2.05
Free Cash per Share
1999 - ($1.14)
2000 - ($1.02)
2001 - $0.70
2002F - $1.50-$1.75
2003F - $1.65-$1.93
Note: 1999-2001 EPS includes $0.40 of goodwill amortization; all EPS numbers exclude special items. Specifically, 2002 EPS excludes 38 cents for Argentine bad-debt reserve and 16 cents for restructuring charges, and includes 8 cents related to sale of certain assets in Japan.
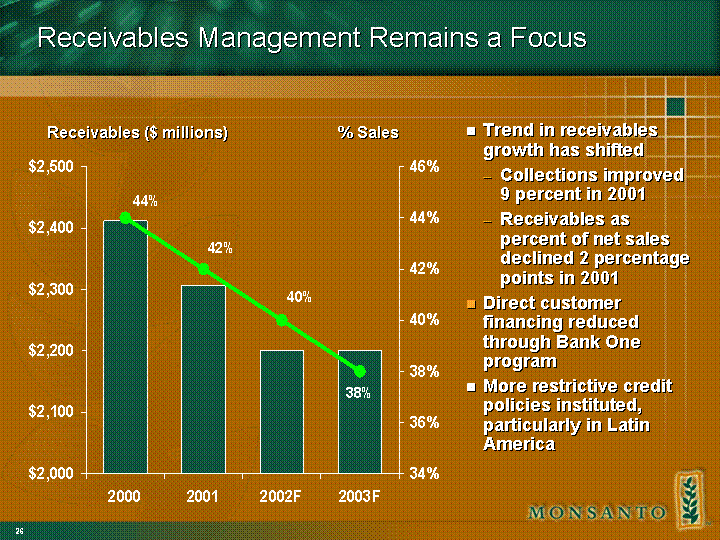
Receivables Management Remains a Focus
Receivables ($ millions)
2000 - 2,412
2001 - 2,307
2002F -2,200
2003F - 2,200
% Sales
2000 - 44%
2001 - 42%
2002F - 40%
2003F - 38%
- Trend in receivables growth has shifted
— Collections improved 9 percent in 2001
— Receivables as percent of net sales declined 2 percentage points in 2001 - Direct customer financing reduced through Bank One program
- More restrictive credit policies instituted, particularly in Latin America
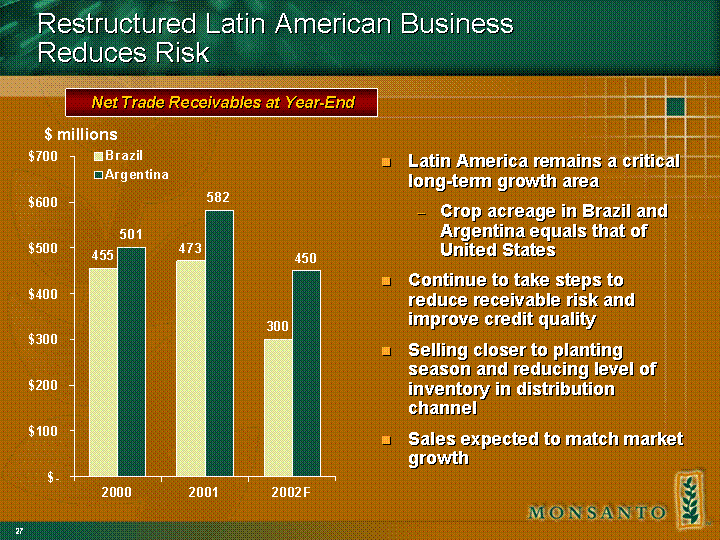
Restructured Latin American Business Reduces Risk
Net Trade Receivables at Year-End
$ millions
Argentina
2000 - 501
2001 - 582
2002F - 450
Brazil
2000 - 455
2001 - 473
2002F - 300
- Latin America remains a critical long-term growth area
— Crop acreage in Brazil and Argentina equals that of United States - Continue to take steps to reduce receivable risk and improve credit quality
- Selling closer to planting season and reducing level of inventory in distribution channel
- Sales expected to match market growth
Use of Free Cash Flow
- Maintain current credit ratings with targeted debt/total capitalization of less than 25 percent at year-end; 30 percent at seasonal peak
— Currently marketing long-term funding in early August; $750 million - $1 billion with multi-tranche maturities
— Use free cash in 2002 to pay down debt to manage seasonal peaks - Potential for smaller investments in business to support integrated solutions
- May consider share repurchase in 2003
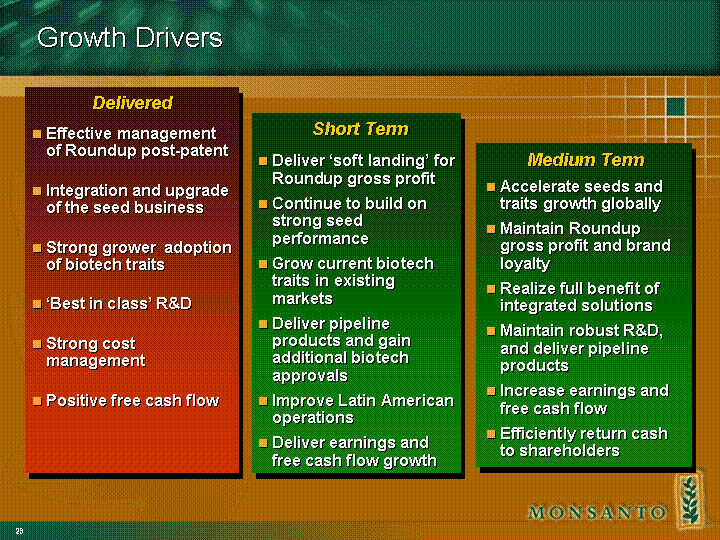
Growth Drivers
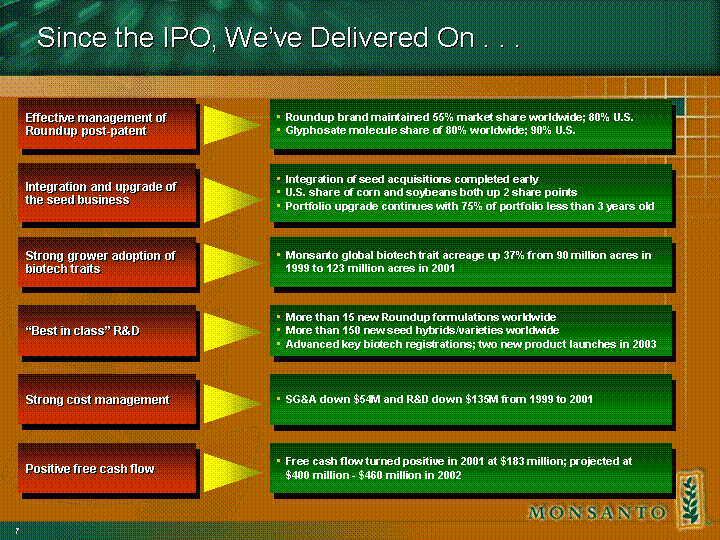
Delivered
- Effective management of Roundup post-patent
- Integration and upgrade of the seed business
- Strong grower adoption of biotech traits
- 'Best in class' R&D
- Strong cost management
- Positive free cash flow
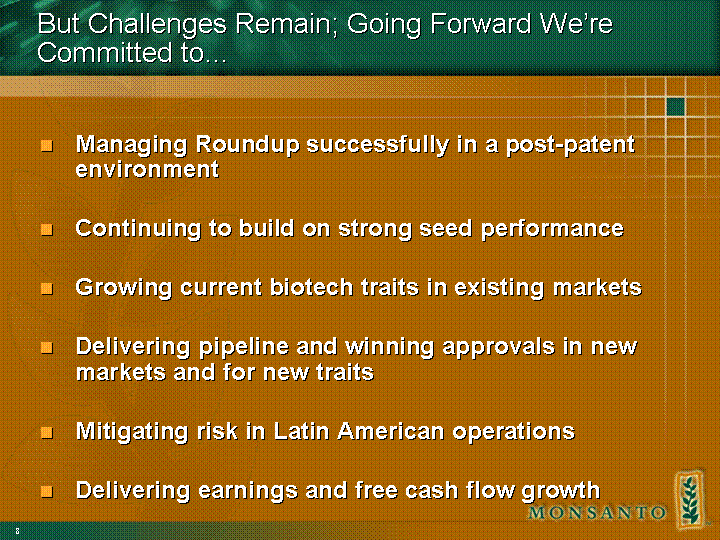
Short Term
- Deliver 'soft landing' for Roundup gross profit
- Continue to build on strong seed performance
- Grow current biotech traits in existing markets
- Deliver pipeline products and gain additional biotech approvals
- Improve Latin American operations
- Deliver earnings and free cash flow growth
Medium Term
- Accelerate seeds and traits growth globally
- Maintain Roundup gross profit and brand loyalty
- Realize full benefit of integrated solutions
- Maintain robust R&D, and deliver pipeline products
- Increase earnings and free cash flow
- Efficiently return cash to shareholders
