Management Presentation
November 2005
1

This presentation includes forward-looking statements within
the meaning of the Securities Litigation Reform Act of 1995
regarding future events and the future financial performance of
Valero L.P. All forward-looking statements are based on the
partnership's beliefs as well as assumptions made by and
information currently available to the partnership. These
statements reflect the partnership's current views with respect
to future events and are subject to various risks, uncertainties
and assumptions. These risks, uncertainties and assumptions
are discussed in Valero L.P.’s 2004 annual report on Form 10-K
and subsequent filings with the Securities and Exchange
Commission.
Forward Looking Statements
2
Valero L.P. Overview
6th largest publicly traded MLP in the U.S. (NYSE:VLI)
Valero Energy owns 23% (21% limited partner, 2% general partner)
Market cap at IPO (April 2001) of $470 million; currently $2.7 billion
Total unitholder return of over 200% since IPO
Has delivered outstanding distribution growth while maintaining
one of the strongest distribution coverage ratios in our peer group
Increased quarterly distribution from $0.60 to $0.855 per unit
Owns and operates diversified portfolio of logistics assets
Over 9,100 miles of crude and refined product pipelines
94 terminal facilities and 60 crude oil storage tanks
Around 77 million barrels of storage capacity
Serves 7 Valero Energy refineries
3
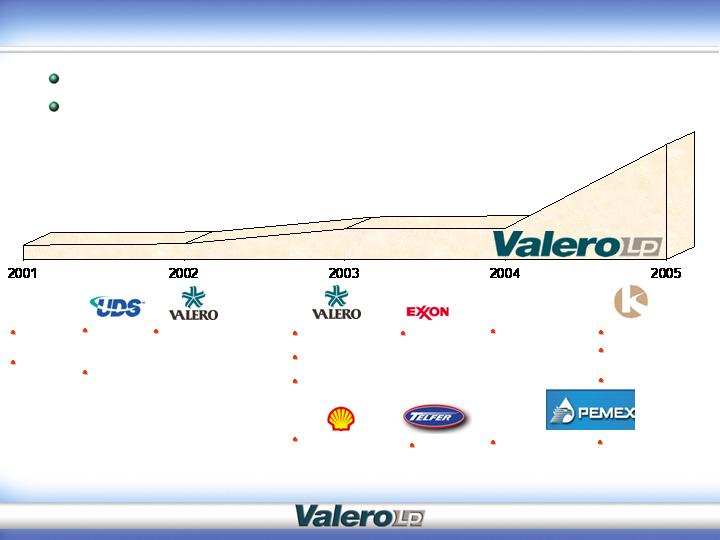
Assets have grown more than eight times since April 2001
Have acquired $2.8 billion in assets
Total Assets
(Year Ended)
$3.2 billion Est.
South Texas
pipeline system
58 crude oil storage
tanks
Southlake, Texas
refined product
pipeline
Wichita Falls, Texas
Business
(272-mile pipeline
and 4 crude oil
storage tanks)
Paulsboro, NJ
refined product
terminal
28% Interest in
Amarillo/Abernathy/
Lubbock, Texas
refined product
pipeline
Asphalt
terminal
(Pittsburg, CA)
April 2001
IPO
Acquired
by Valero
Energy
January
2002
Royal Trading Co.
2 asphalt
terminals
(Oklahoma &
New Mexico
Joint Venture - Dos
Laredos propane
terminal and
pipeline system in
South Texas/Mexico
Southlake,
Texas
terminal
Crude oil
storage
facilities at
Ringgold,
Texas
Kaneb acquisition
4 pipeline systems;
over 5,000 miles
79 terminal facilities
Construction of 110
miles of pipeline in
Northern Mexico/
South Texas
$387 million
Growth through Acquisitions and Growth Projects
4
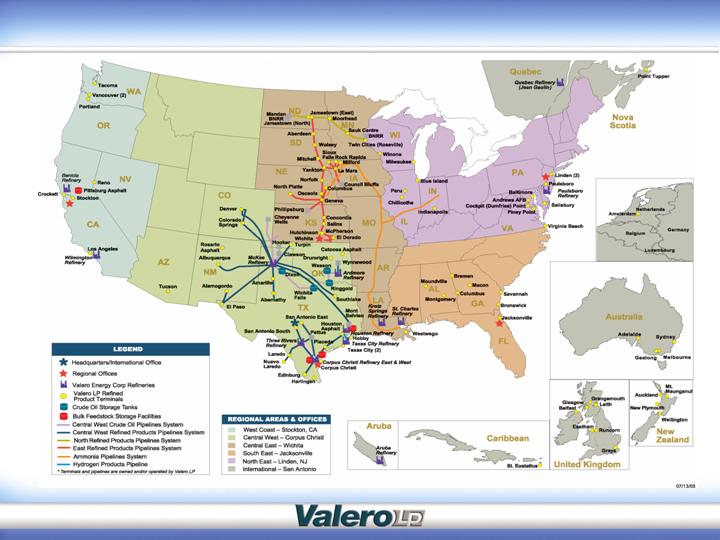
Valero L.P. System Overview
5
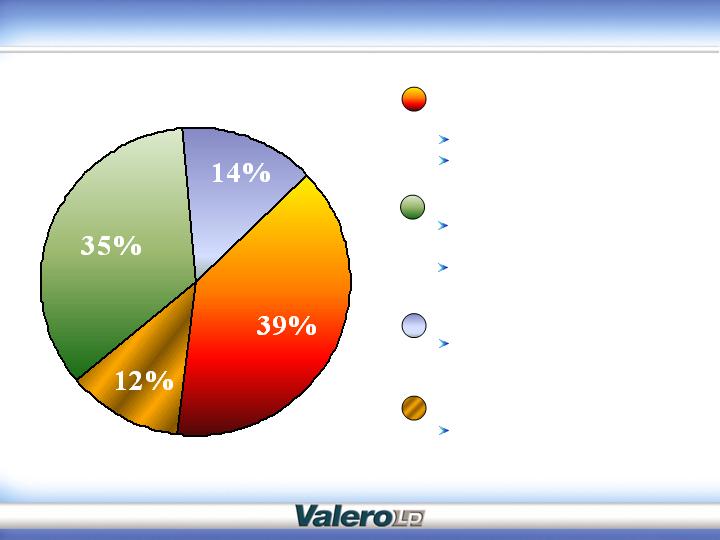
Valero L.P.
Operating Income by Segment*
Refined Product Pipelines
Refined Product
Terminals/Bunkering
Crude Oil Pipelines
Crude Oil Storage Tanks
6,350 miles of refined product
pipelines
2,000 mile ammonia pipeline
94 terminal facilities
Large international presence
800 miles of crude oil pipelines
60 crude oil storage tanks with
12.5 million barrels of capacity
* Based on estimated 2006 operating income.
Diversified Operations
6
Valero L.P. Strategy
Improve safety and reliability
Investments required to raise safety and reliability of Kaneb
assets to Valero L.P. standards
Continuous improvement in operations
Expand use of underutilized assets
Control costs
Remain committed to growth
Focus on abundance of strategic growth projects
Longer term focus on acquiring stable, fee-based assets,
which are immediately accretive to earnings per unit and
distributable cash flow
Strong balance sheet and stable cash flows support growth
strategy
7

Abundance of strategic growth projects from expanded geographic
presence
Reliability capex increases primarily due to investments required to
upgrade Kaneb assets to Valero standards
(Dollars in Millions)
Strategic
Reliability
$80
$105
$30
Projected Capital Expenditures
Note: Reliability capital expenditures include maintenance, regulatory and safety & environmental. 2005 includes
capital expenditures on former Kaneb assets beginning July 1, 2005.
8
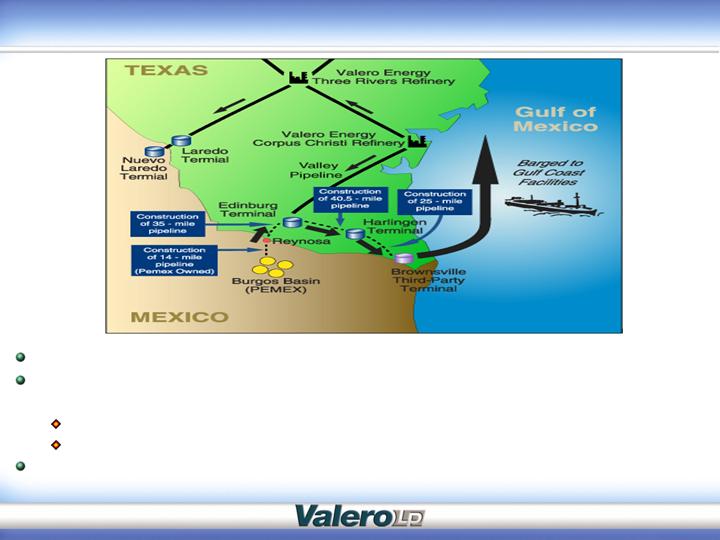
Expansion of Valley Pipeline by 10,000 barrels per day completed
Construction of more than 110 miles of pipeline from Burgos gas fields in
northeastern Mexico to third-party terminal in Brownsville
Total investment of approximately $58 million
Scheduled for completion in May 2006
Expected throughputs of approximately 36,000 barrels per day of oil
products
Burgos/Valley Pipeline Projects
9
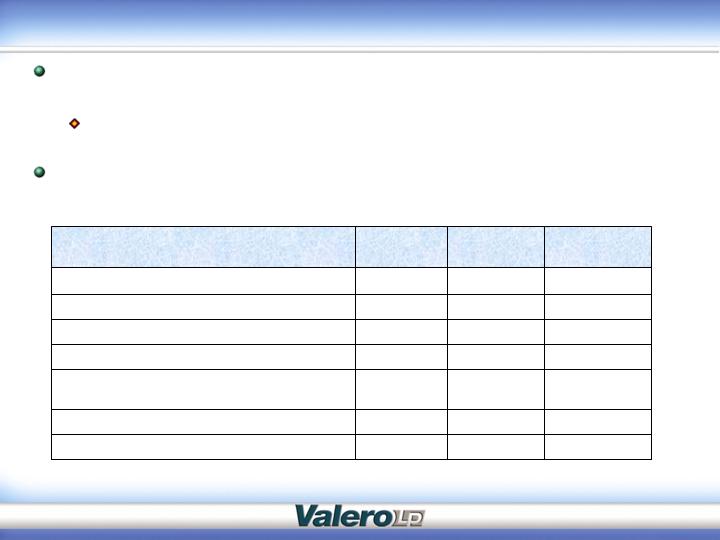
Portfolio of assets provide for solid long-term growth
opportunities
Identified over $100 million of accretive strategic growth projects from
2006 through 2008*
Kaneb assets provide Valero L.P. with ample high return
investment opportunities
West Region
2Q07
$4.9
Portland Storage
Central West
3Q06
$4.0
Texas City Black Oil System Expansion
Legacy
Kaneb assets
2006
$4.9
IS Automation Upgrades
Central West
3Q07
$8.0
Denver Terminal Expansion
4Q06
2Q06-4Q07
2Q06
Completion
Dates
$5.0
$16.9
$58.0
Estimated
CAPEX
Central East
Ammonia Pipeline Laterals & Storage
Northeast
Linden Terminal Optimization
Central West
Region
Burgos – Valley Pipeline Extension
Strategic Projects
(Dollars in Millions)
Strategic Growth Projects
* Includes approximately $15.7 million carryover from Burgos Project started in 2005.
10

(Dollars and units in thousands, except per unit amounts)
4th quarter 2005 earnings expected to be in range of 65 to 70 cents per unit
Primarily due to loss of held separate businesses, higher power costs, asphalt
seasonality, higher maintenance expense and Valero Energy McKee refinery
turnaround
2005 Financial Highlights
11
Q105
Q205
Q305
Revenues
$56,635
$58,306
$263,546
Cost of Sales
-
-
101,217
Operating Expense
19,685
21,645
71,358
G&A Expense
3,503
3,561
10,391
Depreciation Expense
8,732
8,791
23,902
Interest Expense
5,829
5,878
15,315
Income Tax Expense
-
-
2,147
Income from Continuing Ops.
19,264
18,852
40,757
Income from Discontinued Ops.
-
-
4,410
Net Income Applicable to LPs
$17,788
$17,005
$41,275
EPU applicable to LPs:
Continuing Ops.
$0.77
$0.74
$0.79
Discontinued Ops.
-
-
0.09
$0.77
$0.74
$0.88
EBITDA
$33,825
$33,521
$91,221
Distributable Cash Flow
$26,193
$24,867
$63,574
Weighted Avg. Units Outstanding
23,041
23,041
46,810
Coverage Ratio applicable to LPs
1.25x
1.12x
1.37x

Valero L.P. 2006 Outlook
Operations expected to be impacted first half of 2006
Primarily due to heavy turnaround activity at some of Valero Energy
refineries
Higher maintenance expense to upgrade legacy Kaneb assets
By second half of 2006, throughput levels expected to return to
more normal levels
Additional volumes from strategic growth projects and increased tariff
and throughput fees
* Excludes throughputs related to the storage lease and bunkering operations acquired in the Kaneb acquisition.
12
Estimated Throughputs (thousand barrels per day):
Q106
Q206
Q306
Q406
Crude Oil Pipelines
395-400
390-395
415-420
410-415
Refined Product Pipelines
680-685
690-695
730-735
720-725
Refined Product Terminals*
275-280
275-280
295-300
275-280
Crude Oil Storage Tanks
490-495
510-515
515-520
525-530

(Dollars in Millions)
Debt Position
(As of September 30, 2005)
* Guaranteed by Valero L.P., non-recourse to Valero Energy.
Note: $482 million of proceeds from assets sales in third quarter of 2005 used to pay off $180
million of $400 million revolver and and partially pay off $525 term loan.
13
Issuer
Amount
Maturity
Valero Logistics Operations (6.875%)*
$100
2012
Valero Logistics Operations (6.05%)*
250
2013
Valero Logistics Operations (Port of Corpus
Christi)
8.7
2015
Kaneb Pipe Line Operating Partnership,
L.P. (5.875%)
250
2013
Kaneb Pipe Line Operating Partnership,
L.P. (7.75%)
250
2012
Write-up to FMV of Kaneb Debt
53
Kaneb UK Debt
37
New Valero Logistics Operations
- Term debt
230
2010
- $400 mm revolving credit facility and
other bank borrowings
-
5-Year Revolver
Public Debt Rating
Moodys – baa3, stable
S&P – BBB minus, stable
Fitch – BBB minus, stable
Public Debt Covenants
Limitation on liens
Limitation on sale/leasebacks
Bank Debt Covenants
Debt-to-EBITDA typically not to exceed 4.75x
EBITDA-to-Interest cover to be greater than 3x
Limitation on liens & sale/leasebacks
$167.5 million of fixed-to-floating interest rate swaps
65% fixed versus 35% floating rate debt
Debt Position
14
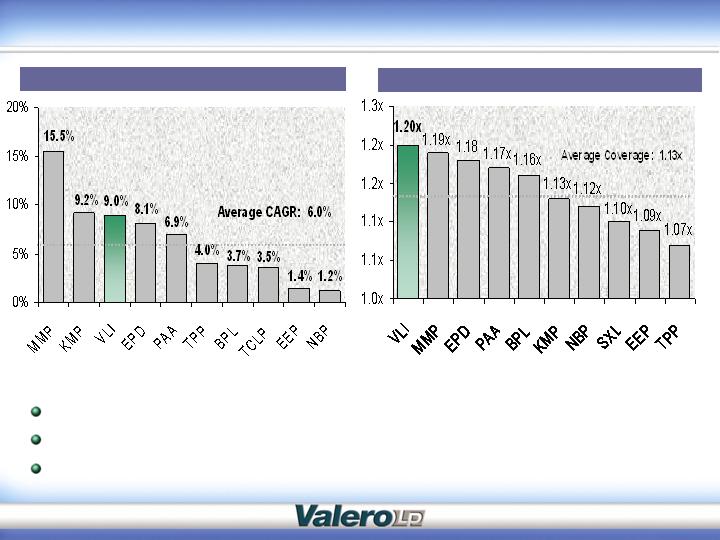
Distribution growth key driver of unit price performance
Target distribution growth in line with top of peer group
Distribution growth of around 9% vs. MLP average of 6.0%
___________________________
(1)
Compound annual growth rates of quarterly distributions to L.P. unitholders since the third quarter distribution of 2001 through the
third quarter distribution of 2005.
(2)
Based on 2006 estimated distributable cash flow per L.P. unit and annualized 3Q05 cash distributions per L.P. unit, per Wall
Street estimates.
Distribution CAGR Since Valero LP IPO (1)
Total Distribution Coverage (2)
Strong Distribution Growth & Coverage
15

207% total unitholder return since IPO (price appreciation
plus yield)
42.5% increase in distribution / L.P. unit
(1)
Buckeye Partners, Enbridge Energy Partners, Enterprise Products Partners, Kinder Morgan Energy Partners, Magellan Midstream
Partners, Northern Border Partners, Plains All American Pipeline, Sunoco Logistics Partners, TEPPCO Partners.
% Change
Valero L.P.: 207%
Peer Group: 111%
S&P 500: 10%
Peer Group(1)
S&P 500
Valero L.P.
Valero L.P. Unit Performance
16
Proven growth and value creation through accretive
acquisitions and internal growth projects
Kaneb acquisition enhances earnings stability
Expands geographic presence
Diversifies customer base
Incentive distribution payments to our general partner
capped at 25 percent
Low cost of capital
Solid financial position
Strong balance sheet and investment grade ratings
Track record of strong and consistent cash flow generation
Committed to top-tier distribution growth and
maintaining strong distribution coverage
Key Investment Highlights
17

Appendix
18

Reconciliation of Net Income to EBITDA and Distributable
Cash Flow
The following is a reconciliation of net income to EBITDA and distributable cash flow (in thousands):
19
Q105
Q205
Q305
Net Income
$19,264
$18,852
$45,167
Plus net interest expense & other
5,829
5,878
20,005
Plus income tax expense
-
-
2,147
Plus depreciation & amortization
8,732
8,79
23,902
EBITDA
33,825
33,521
91,221
Less equity income from joint ventures
(378)
(421)
(1,541)
Less interest expense, net
(5,829)
(5,878)
(20,005)
Less reliability capital expenditures
(1,425)
(2,468)
(8,476)
Plus distributions from joint ventures
-
113
2,375
Distributable Cash Flow
$26,193
$24,867
$63,574