
1
NAPTP MLP Conference
May 22, 2008
Steve Blank
Senior VP, CFO & Treasurer

2
This presentation contains certain estimates, predictions, projections, assumptions
and other forward-looking statements that involve various risks and uncertainties.
While these forward-looking statements, and any assumptions upon which they are
based, are made in good faith and reflect our current judgment regarding the direction
of our business, actual results will almost always vary, sometimes materially, from any
estimates, predictions, projections, assumptions or other future performance
suggested in this report. These forward-looking statements can generally be identified
by the words "anticipates," "believes," "expects," "plans," "intends," "estimates,"
"forecasts," "budgets," "projects," "will," "could," "should," "may" and similar
expressions. These statements reflect our current views with regard to future events
and are subject to various risks, uncertainties and assumptions. For a discussion of
certain of those risks, please read "Risk Factors" in Item 1A of NuStar Energy L.P's and
NuStar GP Holdings, LLC's Form 10-K for the year ended December 31, 2007 and
subsequent quarterly reports as filed with the Securities and Exchange Commission.
Forward Looking Statements
3
A leading publicly traded growth-
oriented partnership (NYSE: NS)
One of the largest independent
petroleum pipeline and terminal
operators in the U.S.
One of the largest asphalt refiners and
marketers in the U.S.
Total unitholder return of approximately
230% since IPO in April 2001
Recently reported record 1Q08
earnings
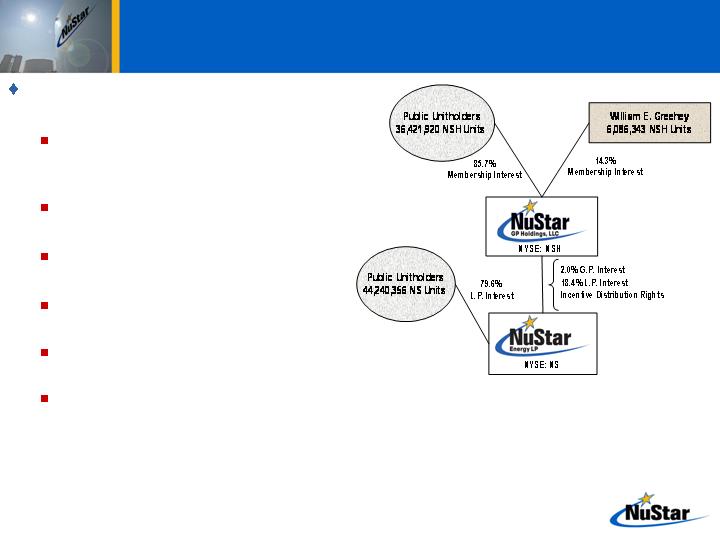
Public owns approximately 80% of
NuStar Energy L.P.’s common units
NuStar GP Holdings, LLC (NYSE: NSH)
holds remaining ownership of NuStar
Energy L.P. including 2% general
partner interest, around 18% of NuStar
Energy L.P.’s common units and all of
the incentive distribution rights
NuStar Overview
4
4
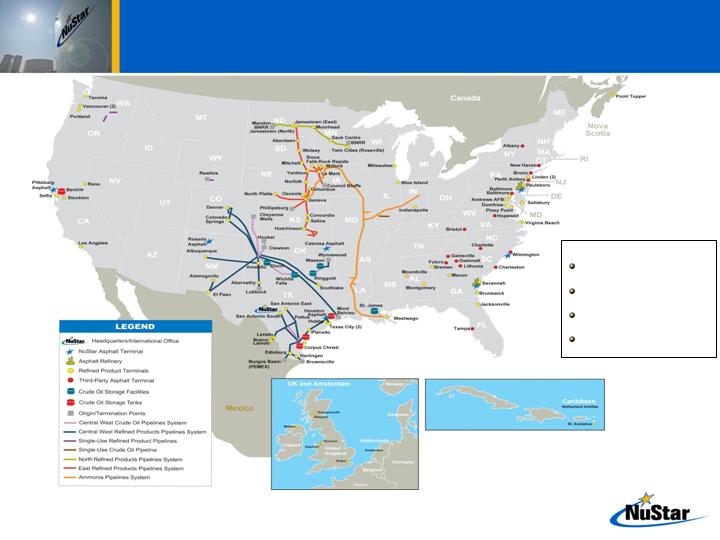
Well-Diversified Asset Base
Assets Stats:
9,063 miles of crude oil and refined
product pipelines
85 terminal facilities and four crude
oil storage tank facilities
Over 86 million barrels of storage
capacity
2 asphalt refineries capable of
processing 104,000 bpd of crude oil
5
5
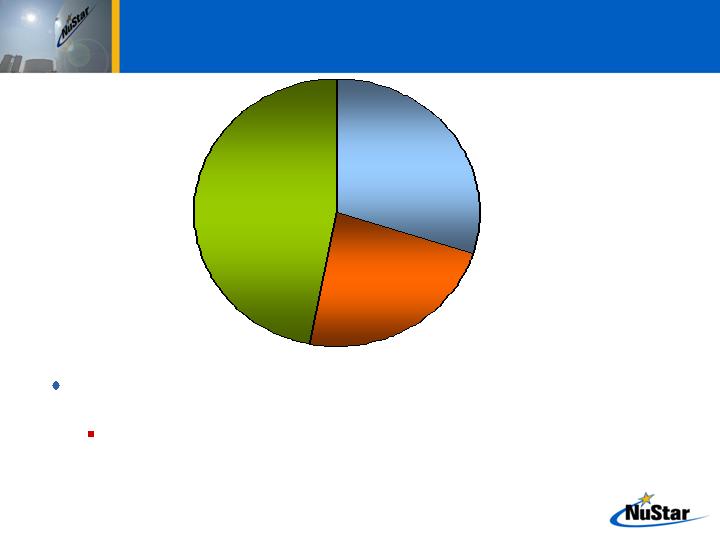
Primarily Fee-Based Assets
Nearly 80% of segment assets at NuStar Energy generate stable, fee-based
income
Includes refined product terminals, refined product and crude oil pipelines and crude
oil storage tanks
Storage
(Terminals & Tanks)
Transportation
(Refined Product & Crude
Oil Pipelines)
Refining & Marketing
47%
30%
23%
Note: Percentages are based on March 31, 2008 asset values, including a preliminary purchase price allocation for the CITGO
Asphalt Refining acquisition. Recently combined business segments into three primary segments instead of five
segments.
6
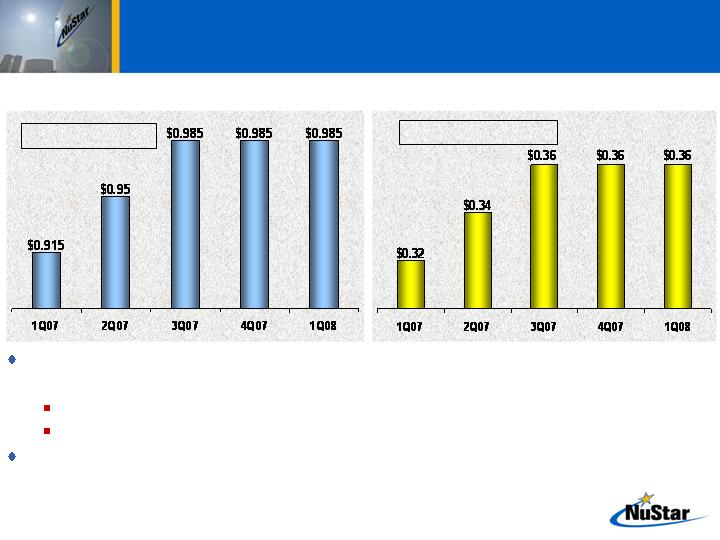
Good Distribution Growth
NuStar Energy L.P.
Quarterly Distribution Increases
NuStar Energy L.P. declared a 1st quarter 2008 distribution of $0.985 per unit, or $3.94 per unit,
on an annual basis
Healthy coverage ratio of 1.36 times applicable to the limited partners for 1st quarter of 2008
Cost of capital lower as incentive distribution rights are capped at 25%
NuStar GP Holdings, LLC declared a 1st quarter 2008 distribution to $0.36 per unit, or $1.44
per unit, on an annual basis
~8% Y-o-Y growth
NuStar GP Holdings, LLC
Quarterly Distribution Increases
~12.5% Y-o-Y growth
7
7
(Dollars in Millions)
P = Phase
Strategic Project Update
* Projects still under evaluation
Majority of projects under $400 million construction program expected to be complete by
the end of 2008
Recently announced $500 million of new pipeline and terminal projects to help fuel
partnership’s growth beyond 2008
Does not include other potential projects from acquisition of CITGO Asphalt Refining Company
Expect IRRs to be in the range of 15% to 20% for all projects
Completed
Completed
Total Capital
In-Service Dates
Major Projects Investment 1Q08 2Q08 3Q08 4Q08 2009-2011
Major Projects Completed in Late 2006 & 2007
~$90.0
Amsterdam Expansion – Partial P1
50.0
St. Eustatius Expansion – P3
19.5
Amsterdam Expansion – Partial P1 & P2
30.0
Linden, NJ Optimization
7.9
Texas City, TX Expansion
33.1
St. James, LA Expansion
52.1
Amsterdam Expansion – P3
28.5
Jacksonville Expansion
21.0
Texas City, TX Expansion
12.8
New Pipeline and Terminal Construction
Program*
500
Total
~$845
8
8
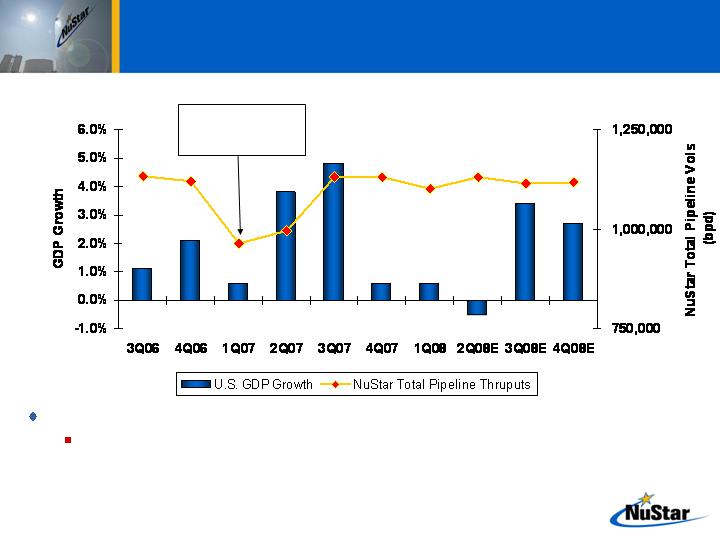
Slower Economic Growth Not Expected to
Materially Impact NuStar’s Throughputs
GDP Growth vs. NuStar Total Pipeline Throughputs
Majority of NuStar’s terminalling business supported by customer contracts
Approximately 90% of new terminal expansions supported by contracts ranging from 5 to 10 years
1.1%
2.1%
0.6%
3.8%
4.8%
0.6%
0.6%
(0.5)%
3.4%
2.7%
Impact of Fire at
Valero Energy’s
McKee Refinery
Source: U.S. Department of Commerce – Bureau of Economic Analysis: Historical GDP figures
Global Insight – Estimated 2008 Quarterly GDP Figures
Notes: Graph starts from 3Q06 to reflect last pipeline deal done at NuStar Energy L.P.

9
9
New Asphalt Business
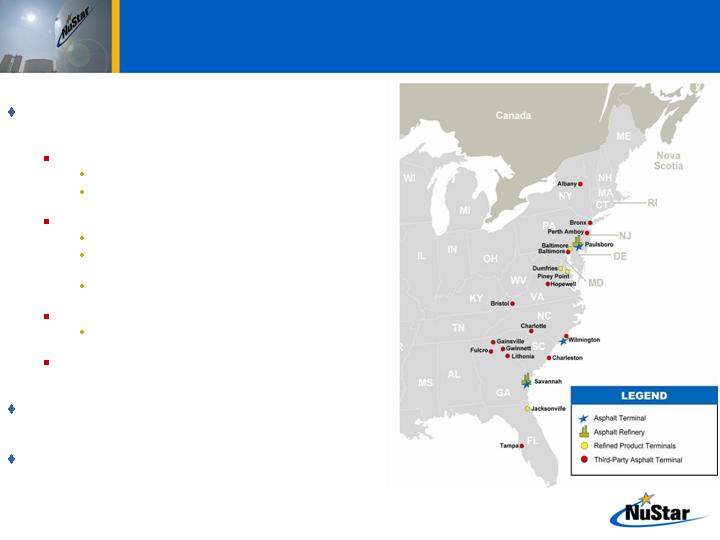
10
Business comprised of two refineries, three owned
terminals, and leases on 14 third-party terminals
Paulsboro, NJ Refinery: 74 mbpd
Asphalt production is shipped to the Northeast
Total storage capacity of 3.4 million barrels
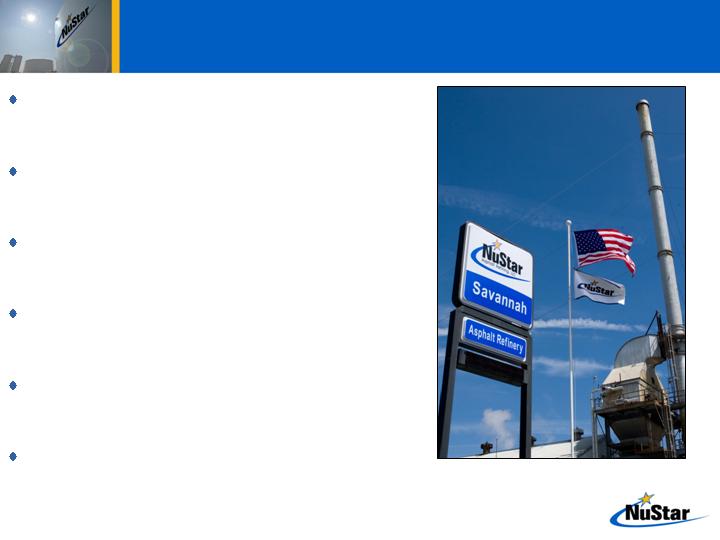
Savannah, GA Refinery: 30 mbpd
Asphalt production shipped to the Southeast
Sole refinery and asphalt producer on the Southeast
seaboard
Total storage capacity of 1.2 million barrels
Wilmington, North Carolina Terminal
Total storage capacity of 240,000 barrels
14 third-party leased terminals with total asphalt storage
capacity of 1.7 million barrels
Commitment by PDVSA to supply NuStar an annual
average of 75,000 bpd of crude oil
Right of first offer to purchase nearly 11,000 bpd of paving
grade asphalt and over 13,000 bpd of roofing flux asphalt
each year to the extent exported by PDVSA
Asphalt Asset Overview
11
Strategic Rationale
Compelling opportunity to buy assets at 50% of
replacement value
Over the long-term expect to benefit from higher
asphalt margins due to a tightening market
Provides exposure to one of the best asphalt
markets in the U.S.
Continues to diversify NuStar’s customer base and
expands geographic presence
Complements our existing asphalt marketing and
terminals business
Additional strategic projects expected to benefit
results from asphalt business
12
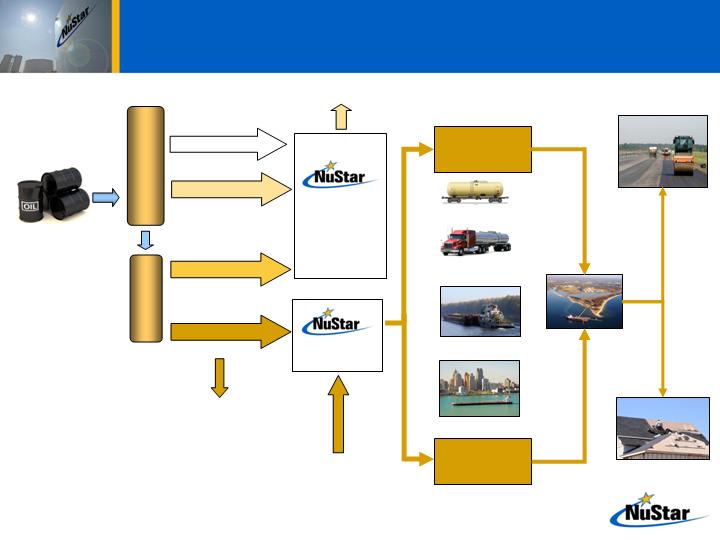
Asphalt Refining -
A Simple Process
Atmospheric
Distillation Tower
Vacuum
Unit
Naphtha
Vacuum Gas Oil
Marine Diesel Oil
Asphalt
~70% Yield
~3% Yield
~9% Yield
~18% Yield
Intermediate
Products
Marketing
Asphalt
Marketing
Paving Contractors
& Hot Mix Producers
80-90%
Asphalt Cement
10-20%
Roofing Flux
Rail
Truck
Barge
Ship
Roofing & Shingle
Manufacturers
Sold to 3rd Party
Refineries
NuStar Owned
& Network of
3rdParty
Terminals
Retail
Sales
(~85%)
Asphalt Imports
Wholesale
Asphalt Sales
(~15%)
13
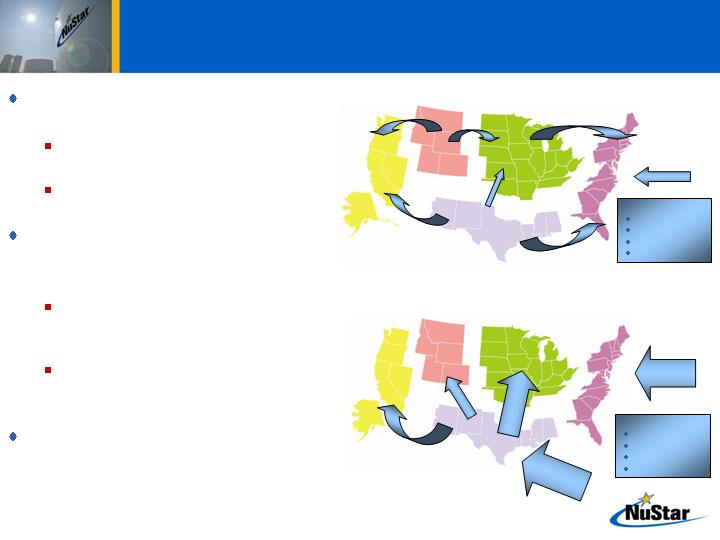
Imports from:
Latin America
Canada
Europe
Africa
East Coast and West Coast are currently
net short asphalt
Excess production in Mid-Continent and
Gulf Coast used to meet current demand
East Coast is also supplemented by
imports
New coker projects in Gulf Coast and
Mid-Continent expected to reduce asphalt
supply
Resulting imbalance expected to result in
higher call on imports and/or cutting back
on coker capacity
Level of coker projects has remained
constant despite recent weak gasoline
margins
Shifting trade flows expected to drive
asphalt margins higher
Imports from:
Latin America
Canada
Europe
Africa
2006 U.S. Inter-PADD Asphalt Flows
(thousands of barrels per day)
Projected 2012 U.S. Inter-PADD Asphalt Flows
(thousands of barrels per day)
15
5
13
19
3
8
3
63
82
53
18
25
Sources: Poten & Partners; PIRA Refinery
Database, Energy Information Agency
Note: Assumes no reduction in coker utilization rates
and fuel oil production
Asphalt Supply Drivers
14
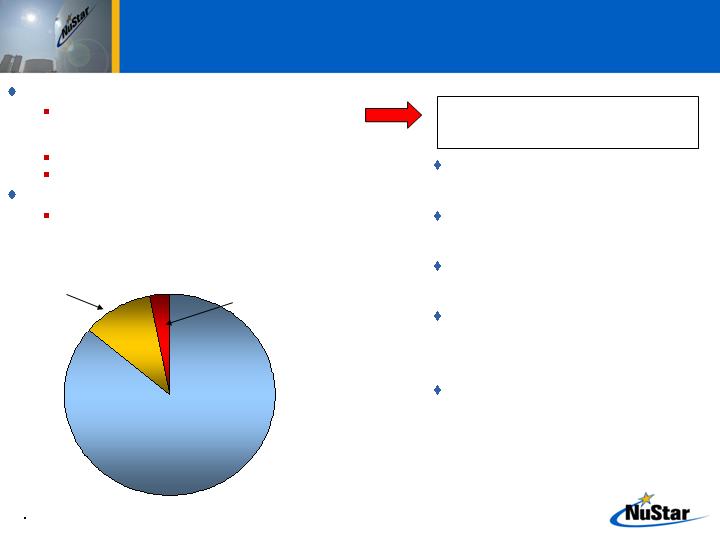
Asphalt Demand Drivers
U.S. Asphalt Demand
Asphalt Paving
~86%
Roofing
~11%
Other*
~3%
Paving
Aging highway system, increased focus on preventative
road maintenance and increases in total highway miles
driven
Residential and commercial construction
Federal, state and local funding for highway projects
Roofing
Re-roofing projects account for majority of asphalt
demand versus new builds
Consists of coating and sealer markets and asphalt consumed in
industrial applications such as paint, paper and steel manufacturing
Only spending a fraction of what we
should to maintain roads
Approximately 33% of roads are in fair
to poor condition**
Currently spending around $70 billion
annually on highways***
Estimated $185 billion required each
year to maintain roads in current
condition***
Estimated $200 billion required to
upgrade roads to good condition***
Significant Infrastructure
Needs in the U.S.
** Source: TRIP
*** Source: National Surface Transportation
Policy & Revenue Commission
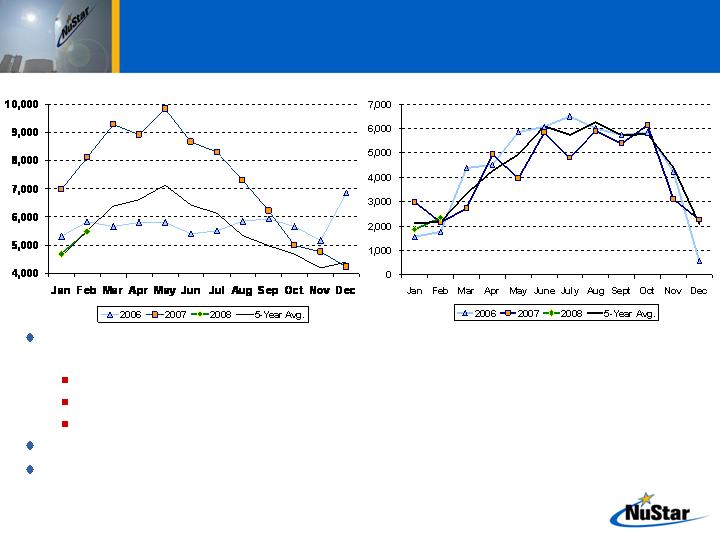
15
15
Expect PADD I (i.e. East Coast) asphalt margins to recover from the first part of 2008 and
fourth quarter 2007 levels due to:
Seasonal asphalt demand ramping up during the second quarter
Low inventory levels on the U.S. East Coast compared to last year
Level of asphalt imports to PADD I has declined over the past six months
Expect a decrease in asphalt demand due to higher asphalt prices in PADD I
Continue to be bullish on long-term fundamentals given the coker projects coming on-stream
over the next few years
PADD I Asphalt
Current Supply & Demand Fundamentals
PADD I Asphalt Inventories (000 barrels)
PADD I Asphalt Demand (000 barrels)
Source of data for graphs: Energy Information Administration
16
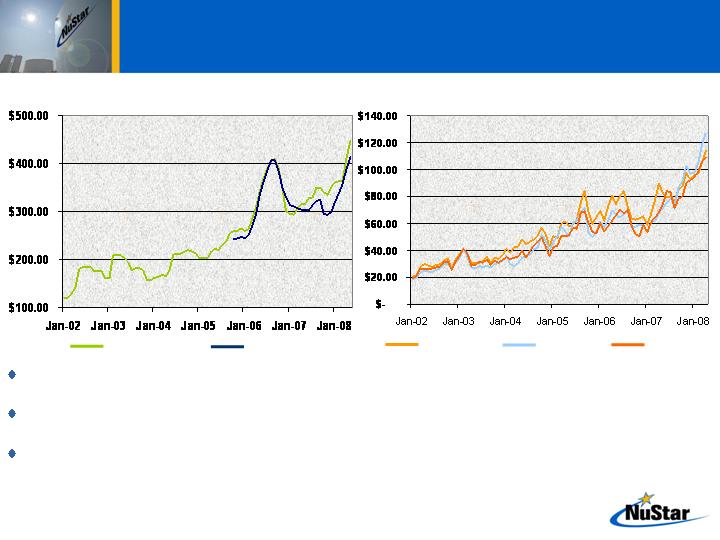
Increasing Product Prices
Asphalt and intermediate product prices have been generally increasing although have lagged the
rapid run-up in crude oil prices
Expect asphalt prices of $430 to $475 per short ton for the second and third quarters of 2008
reflective of seasonal demand
Prices for intermediate products continue to strengthen providing valuable contribution to NuStar’s
results
Asphalt Cement Price Index ($ per short ton)*
State of New Jersey State of Georgia
* Source: State of New Jersey Dept. of Transportation and State of Georgia Dept. of Transportation
** Source: OPIS
Note: Prices for intermediate products above are shown as proxies only for NuStar’s intermediate products
Intermediate Products - Proxy Prices
($ per barrel)**
USGC Naphtha
USGC LCO
USGC HSVGO

17
Buying Crude Oil Feedstocks
at Deep Discounts
Despite recent run-up in crude oil prices, NuStar is paying significant discounts for the
crude oil it is buying from Venezuela (i.e. BCF-13 and Boscan crude oils)
BCF-13 and Boscan crude oils are very low-quality crudes purchased at a deep-discount to
sweet crudes (i.e. WTI) and to other heavy-sour crudes (i.e. Mexican Maya)
Crude feedstocks are ideal to run at NuStar’s refineries since they produce a high yield
of asphalt
Comparative Crude Oil Prices ($ per barrel)
WTI *
Mexican Maya *
BCF-13 **
Boscan **
Discount b/w WTI and
Maya currently around
$22/bbl.
Venezuelan crudes
further discounted to
Maya crude by
approx. $15/bbl.
* Source: Platts
** Source: Company

18
18
Business Strategies
Complete existing $400 million construction program on time and on budget
Quickly integrate recently acquired asphalt business
Prioritize and execute projects on recently acquired asphalt business
Continue to focus on pipeline, transportation, storage and terminalling operations
Continue to expand terminals and storage in key hub locations and pipelines through internal growth
projects and acquisitions
Recently announced $500 million construction program beyond 2008 (excluding CITGO Asphalt
Refining Company)
Continue to expand opportunities for marketing business
Maintain financial strength, flexibility and investment grade debt rating
We believe this strategy will allow NuStar to continue to provide further
distribution growth