Free signup for more
- Track your favorite companies
- Receive email alerts for new filings
- Personalized dashboard of news and more
- Access all data and search results
Filing tables
Filing exhibits
NS similar filings
- 15 Feb 24 Results of Operations and Financial Condition
- 22 Jan 24 Entry into a Material Definitive Agreement
- 22 Jan 24 Sunoco LP to Acquire NuStar Energy L.P. in Transaction Valued at $7.3 Billion
- 5 Dec 23 Investor Presentation December 2023
- 2 Nov 23 Results of Operations and Financial Condition
- 19 Sep 23 Regulation FD Disclosure
- 12 Sep 23 Other Events
Filing view
External links
Exhibit 99.1
Investor Presentation December 2023
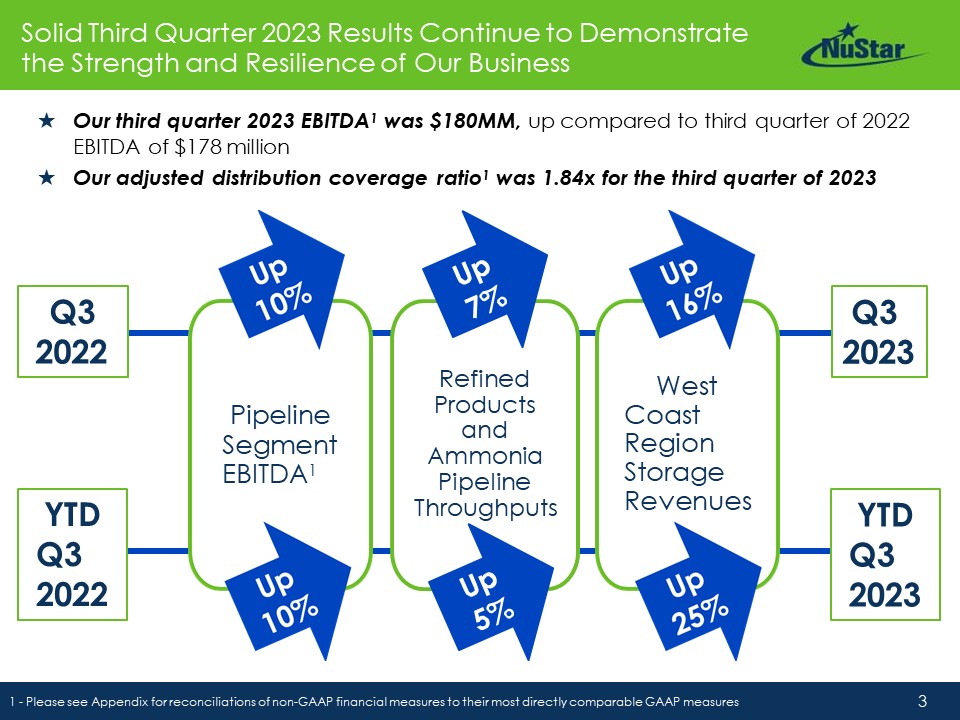
2 Statements contained in this presentation other than statements of historical fact are forward-looking statements. While these forward-looking statements, and any assumptions upon which they are based, are made in good faith and reflect our current judgment regarding the direction of our business, actual results will likely vary, sometimes materially, from any estimates, predictions, projections, assumptions or other future performance presented or suggested in this presentation. These forward-looking statements can generally be identified by the words "anticipates," "believes," "expects," "plans," "intends," "estimates," "forecasts," "budgets," "projects," "could," "should," "may" and similar expressions. These statements reflect our current views with regard to future events and are subject to various risks, uncertainties and assumptions. We undertake no duty to update any forward-looking statement to conform the statement to actual results or changes in the company’s expectations. For more information concerning factors that could cause actual results to differ from those expressed or forecasted, see NuStar Energy L.P.’s annual report on Form 10-K and quarterly reports on Form 10-Q, filed with the SEC and available on NuStar’s website at www.nustarenergy.com. We use financial measures in this presentation that are not calculated in accordance with U.S. generally accepted accounting principles (“non-GAAP”), and our reconciliations of non-GAAP financial measures to financial measures calculated in accordance with U.S. generally accepted principles (“GAAP”) are located in the appendix to this presentation. These non-GAAP financial measures should not be considered an alternative to GAAP financial measures. Forward-Looking Statements
3 YTD Q3 2022 Solid Third Quarter 2023 Results Continue to Demonstrate the Strength and Resilience of Our Business ★ Our third quarter 2023 EBITDA1 was $180MM, up compared to third quarter of 2022 EBITDA of $178 million ★ Our adjusted distribution coverage ratio1 was 1.84x for the third quarter of 2023 1 - Please see Appendix for reconciliations of non-GAAP financial measures to their most directly comparable GAAP measures Q3 2023 West Coast Region Storage Revenues Refined Products and Ammonia Pipeline Throughputs Q3 2022 Pipeline Segment EBITDA1 YTD Q3 2023
4 …And We Have Redeemed the Remaining 1/3 Series D Preferred Units While Continuing to Maintain a Healthy Debt-to- EBITDA Ratio In mid-August, we issued 14.95 million common units for net proceeds of $222 million (including exercise of overallotment option) to complete our redemption of the Series D The equity offering is immediately accretive to cash flows through cost savings on distributions The offering is also slightly accretive to our leverage metric, and we continue to target a healthy debt-to-EBITDA ratio of below 4.0x by year-end 2023 Redeeming the remaining Series D eliminates an obligation senior to our common unitholders, simplifies our capital structure and increases our financial resilience and flexibility We redeemed the remaining one-third of Series D Preferred Units on September 12th, which represents an expedited timeline compared to our previously announced target of YE 2024 Over 12 months ahead of previous plan
5 Due to Progress Made on Strengthening Our Balance Sheet, NuStar is on Target to Deliver Another Strong Year in 2023, and We Plan to Continue Maximizing FCF in 2024 and Beyond 1 - Please see Appendix for reconciliations of non-GAAP financial measures to their most directly comparable GAAP measures. Strong EBITDA Generating Expecting to generate Adjusted EBITDA of $720-740MM1 in 2023 Series D Preferred Units Redeemed Healthy Debt-to-EBITDA Metric Targeting Aiming to maintain at 4.0x or better Free Cash Flow Increasing Working to position NuStar to return increasing value in the future 1 Completed tw1 o-thirds redemption of the Series D in last 12 months Accelerated redemption of remaining one-third into 3Q 2023 by using the equity proceeds
6 In 2023, We Continue to Focus Our Strategic Capital Program on Our Core Asset Footprint Total Estimated Crude Supply/Export Renewable Fuels Refined Products Permian Crude System Corpus Christi Crude System St. James Terminal Midcontinent Colorado/NM/Texas Northern Mexico Established: West Coast Network Ethanol & bio-diesel blending Developing: Ammonia System 2023 Strategic Spending: 120-130MM West Coast Renewable Fuels Storage (~$25MM in 2023) Permian Crude Pipel ine System ($35-45MM in 2023) Ammonia Pipel ine (~$25MM in 2023) Additional Pipel ine (~$25MM in 2023) Additional Storage (~$5MM in 2023)
7 Carbon Emissions Reduction Goals Generate Growing Demand for NuStar’s Well-positioned Midstream Logistics, now and in the Foreseeable Future Stockton Selby Wilmington Gulf Coast Supply Singapore Supply Exports to Canada Tacoma Portland ★ Regulatory priorities on the West Coast and in Canada continue to dramatically increase demand for renewable fuels in the region ★ At the same time, obtaining permits for greenfield projects is difficult, which increases the value of existing assets ★ Our West Coast terminals have the access and optionality to receive and distribute renewable fuels across the West Coast 0 50 100 150 200 Diesel Volume, MBPD 2020 2021 2022 2023 2024 2025 2026 2027 2028 2029 2030 Fossil Diesel Biomass-Based + Renewable Diesel Source: IHS Markit California’s Transportation Fuel Supply With Low- Carbon Fuel Standard Compliance From Petroleum Diesel Alternatives 250 Renewable Fuels
8 ★ We expect our renewable fuels EBITDA to increase in 2023, along with associated market share, as we complete additional projects presently in planning or under construction We intend to continue converting tankage to renewable fuels as the market demands ★ Our facilities are positioned to benefit from new production and conversion projects for renewable diesel, sustainable aviation fuel (SAF), ethanol and other renewable fuels across the region BIODIESEL ETHANOL RENEWABLE DIESEL 3% 13% 16% 75% NuStar’s Proportionate Share of California’s Renewable Fuels Market (Total Volume for the Four Quarters Ended June 30, 20231) Source: California Air Resource Board (CARB) 1 – Most recent data available We Have Captured a Significant Proportion of the Region’s Renewable Fuels Supply… SUSTAINABLE AVIATION FUEL Renewable Fuels
9 3000 2000 1000 0 7000 6000 5000 4000 Portland Selby Stockton Wilmington NuStar’s West Coast Terminals Renewable Fuel Growth* 2017 2018 2019 2020 2021 2022 2023E MBPY 8000 Portland Convert 210,000 bbls to renewable diesel Convert 36,000 bbls to biodiesel Selby Construct additional 400,000 bbls of renewable diesel storage 4Q24 Est. Construct truck-loading for renewable diesel Multimodal shipment of SAF Convert 208,000 to SAF Modify rail to handle renewable feedstock offloading Stockton Convert 30,000 bbls to biodiesel Convert 73,000 bbls to renewable diesel and expand renewable diesel handling to all 15 rail spots Convert 151,000 bbls to renewable diesel Connect to ethanol unit train offload facility Wilmington Convert 160,000 bbls to renewable diesel Reconfigure dock for enhanced marine capability 1H26 Est. … And We Continue to Partner With Key Customers to Develop Our Renewable Fuels Network, as LCFS Mandates Expand to Additional Markets ★ Since establishing ourselves as an “early mover” in the renewable fuels logistics market on the West Coast over five years ago, we have developed an extensive renewable fuels logistics network to serve key global producers that spans across our West Coast footprint ★ Our West Coast assets now generate 40-45% of our storage segment revenues Renewable Fuels Projects completed-to-date and under construction: * Includes biodiesel, ethanol, renewable diesel, renewable feedstock and SAF; 2023 estimated based on volumes through October 2023 Renewable Fuels
10 Ammonia is a Critical Chemical for the World’s Food Supply, and a Key Component of DEF, Which Reduces Harmful Emissions Ammonia is the basic building block for all types of nitrogen fertilizer which is an essential nutrient for growing plants About 80% of the 200 million tons of ammonia produced each year is used for fertilizer About 50% of the world’s food production depends on ammonia Ammonia is also used to make urea, a critical component of Diesel Exhaust Fluid (“DEF”) DEF converts the nitrous oxide (NOx) emitted by diesel engines into water and nitrogen Virtually all diesel engines, from those powering light-duty vehicles to heavy-duty trucks to industrial machinery, require DEF to comply with tightening emissions standards in the U.S., and also in nations around the world Global DEF demand is expected to continue to grow by an expected ~20% from 2023 to 2026 d 50% of World’s Foo Production Depends on NH3 Renewable Fuels Global Demand for DEF Expected to Grow From 2023 to 2026 by ~20% Sources: Science Magazine, IHS Markit, Argus, Research & Markets Global Ammonia Report
11 Ammonia, the World’s Second-most Widely Used Chemical, Offers Significant “Greening” Opportunities Traditional fossil-fuel ammonia production is estimated to contribute about 1.0% of global CO2 emissions, which has driven interest in its de-carbonization “Blue” ammonia is produced with natural gas, but the associated emissions are captured and stored “Green” ammonia is produced using “renewable” electricity to power an electrolyser to extract hydrogen from water and an air separation unit to extract nitrogen from air, which are then combined through a chemical reaction powered by renewable electricity, to produce ammonia In addition, “blue” and “green” ammonia have potential for use as lower-carbon alternative fuels: for engines/turbines to generate electricity, in alkaline fuel cells, as an up-to-70% blend ICE vehicles and for the maritime industry Ammonia can also be a lower-cost option for transporting hydrogen, which can be used for fuel cells or other applications. Ammonia is easier to transport and store than hydrogen, as it doesn’t require cryogenic or high- pressure storage, and can be relatively easily cracked to convert it to hydrogen NH3 Gas Turbine NH3 Fuel-cell Ship 70% NH3-fueled Car Sources: Science Magazine, IHS Markit, Argus, Research & Markets Global Ammonia Report Renewable Fuels Gray Ammonia Blue Ammonia Green Ammonia Derived from natural gas, nearly all of the world’s production made utilizing the Haber-Bosch process Gray Ammonia for which by-product CO2 has been captured and stored, reducing climate impact Produced with hydrogen from water electrolysis powered by renewable energy
12 Our Ammonia System has Capacity to Serve Growing Low- Carbon Ammonia Demand Our Ammonia System spans approximately 2,000 miles from Louisiana north along the Mississippi River to Missouri, and then Northwest and East, to Nebraska and Indiana Today, we provide the lowest-cost option for transporting both imported and domestically produced ammonia to fertilize crops in our nation’s “breadbasket” We have capacity available to transport additional volumes, including “blue” or “green” ammonia Currently running ~30 MBPD (~3,500 STPD1), but have operating capacity close to ~50 MBPD (~5,500 STPD) Our Ammonia System currently represents 5-10% of our pipeline segment revenues We expect the system’s utilization, and its revenue contribution, to see strong growth starting in early 2024 We have near-term opportunities for low capex projects that we expect to meaningfully increase our system utilization, and we are discussing larger, longer-term ammonia opportunities for our system, as well as for our St. James facility 1 – short tons per day Renewable Fuels Third-party terminal NuStar Energy L.P. St. James
13 We have partnered with OCI Global (OCI) to build a new 14-mile pipeline segment that will connect OCI’s facility in Wever, IA to our existing ammonia pipeline OCI’s facility uses ammonia to make fertilizer and to meet growing demand for DEF (Diesel Exhaust Fluid) We have agreed to provide transportation services under a long- term contract Healthy-return, low-capital project will increase utilization Expected completion in January 2024 OCI has committed $30 million in capital expenditures for new ammonia cooling and storage infrastructure at their Wever facility and is expected to bring an additional 1.1 million tons of blue ammonia capacity online in 2025 from the Gulf Coast OCI’s facility in Wever, IA Terminal NuStar Energy L.P. NuStar West Leg We Have Signed an Agreement With OCI Global to Deliver Ammonia into the Midwest Renewable Fuels
14 U.S. Refined Product Demand is Expected to Remain Strong Through 2024 ★ Gasoline demand was steady in the United States throughout 2023 and is on track for modest growth in 2024 ★ Diesel demand has continued its strong performance in 2023 and is expected to remain at or exceed Pre-COVID levels in 2024 Source: ESAI Refined Products 93% 98% 96% 94% 93% 98% 98% 95% 103% 102% 100% 105% 105% 102% 101% 105% 75% 80% 85% 90% 95% 100% 105% 110% 2023 Q1 2023 Q2 2023 Q3 2023 Q4 Gasoline 2024 Q1 Diesel 2024 Q2 2024 Q3 2024 Q4 U.S. Gasoline & Diesel Demand (as a % of Pre-COVID Demand)
Midcontinent Systems- ★ CENTRAL EAST: A 2,500-mile pipeline system with multiple delivery options East Pipeline – This system serves important markets across the Midwest/West, with flexible refined product supply from refineries in McPherson, Kansas, El Dorado, Kansas and Ponca City, Oklahoma North Pipeline – System flows from North Dakota to the Twin Cities, serving both rural markets and large cities with refined product supply from Mandan, North Dakota refinery ★ CENTRAL WEST: Approximately 2,000 miles of structurally exclusive pipeline, supplied from the McKee, Texas refinery serving markets in Texas and nearby states South Texas Systems- ★ Around 700 miles, a majority of which are structurally exclusive pipeline, supplied from refineries located in Corpus Christi and Three Rivers, Texas serving markets in Texas and northern Mexico 15 NuStar’s Refined Products Systems Serve Key Markets Across the Midcontinent and Texas… Refined Products
16 70% 94% 100% 95% 105% 105% 97% 99% 99% 98% 97% 107% 100% 104% 60% 40% 20% 0% 80% 100% 120% 140% Apr-20 1 Aug-20 1 … And Our Markets Have Proven Resilient (and We Expect to Continue to See Strong, Consistent Demand) Total Refined Products Percentage of Pre-COVID Demand Oct-201 1Q 20212 2Q 20211 3Q 20211 4Q 20211 1Q 2022 2 2Q 2022 1 3Q 20221 4Q 20221 1Q 20232 2Q 2023 1 3Q 20231 Central West Region South Texas Central East Region Overall Our resilient asset base recovered quickly from April 2020’s pandemic low Third quarter 2023 refined product throughputs were 104% of pre-COVID levels 1 – Comparison versus 2019 demand; applicable periods adjusted for Northern Mexico projects for a comparable presentation; includes on-road product demand in our storage system; 2 – Comparison versus 2020 demand; applicable periods adjusted for Northern Mexico projects; includes on-road product demand in our storage system 1 Refined Products
17 Refinery Utilization has Risen Steadily Since the Pandemic Through 2023 Source: ESAI 1 - 2024 average projections 89% 57% 4 79% 86% 54% 76% 87% 86% 2019 2020 2021 2022 2023 Avg. Low Avg. Avg. Avg. Global Refinery Utilization (2019-2023) U.S. Refinery Utilization (by PADD, 2019-2024) 87% 78% 83% 85% 86% 2019 Avg 2020 Low 2021 Avg 2022 Avg 2023E Avg ★ Global refinery utilization has been rising steadily since the pandemic, with the U.S. (90%), Asia (90%), and Europe (93%) gaining ground, while Russia (70%) and the Middle East (82%) continue to lag1 ★ U.S. refinery utilization is currently expected to be at 93% in 2023, up 2% over the over 2022 average Total U.S. 92% 75% 85% 91% 93% 90% 2024 Avg. PADD 1 88% 57% 81% 92% 88% 84% PADD 2 96% 81% 89% 95% 97% 93% PADD 3 92% 79% 86% 93% 93% 91% PADD 4 89% 61% 85% 89% 89% 86% PADD 5 88% 58% 79% 82% 88% 86% 85% 2024E Avg Refined Products Crude Supply/Export
18 Permian Oil Production Sensitivity WTI @ $100 WTI @ $80 WTI @ $60 Actuals MMBPD 8 7 6 5 4 3 2 ★ Because of its superior geology and low breakeven costs, the Permian Basin’s production: Exited 2022 at 5.7 MMBPD, representing approximately 45% of the nation’s total output Is projected to exit 2023 at 5.9 MMBPD, representing 3% growth compared to 2022 exit ★ We have been pleased with our system’s performance since we acquired it in 2017, and we expect our system to continue to generate strong results in 2023 and in the years ahead Source: Enverus, ESAI - Crude Supply/Export Our Permian System Continues to Benefit from the Strength of the Basin 4.9 4.4 5.2 5.7 5.9 6.2 6.4 6.2 6.6 6.9 2 0 6 4 8 MMBPD Permian Basin Oil Production Outlook (exit rates as of October 2023) 2019 2020 2021 2022 2023 2024 2025 ESAI Enverus 400% 360% 320% 280% 240% 200% 160% 120% 80% 40% 0% Cumulative Monthly Growth (%) Annual Growth: NuStar’s Permian System vs. the Permian Basin NS Cumulative Growth Permian Cumulative Growth
19 Please see Appendix for reconciliations of non-GAAP financial measures to their most directly comparable GAAP measures Our “Core of the Core” Location has Attracted Active Top-tier Customers Whose Activity is Supporting Steady Growth ★ The quality of geological formations underlying our system has attracted top-tier customers ~69% of our system’s revenue is generated from investment- grade (IG) rated and Non-IG BB-rated entities1 NS System Producer-type2 (% Average Daily Volume) Major 47% Private 24% Other 29% Public Producer Average Cost of Debt, Weighted by Acreage: 6.7%3 ★ We averaged 523 MBPD in 3Q23, more than 15 Mbpd higher than 2Q23, and averaged 533 MBPD in October We expect the rest of 2023 to continue to rebound, backed by capital projects already in progress And expect to average ~540 MBPD in 4Q23 ★ As volumes flex, we also expect to flex our capital expenditures and project 2023 spending to be in the range of $35 – 45MM $7 $12$14$12 $19 $27$27 $23 $31 $35 $39$38 $38 $33 $33 $37 $43$46$47$49 $56 $62$63 $56$55 $59 139 159 187 266 211 327349 314 370 395 400 423418 450 402 502516510 522 580 584 543 508 523 2Q17 3Q17 4Q17 1Q18 2Q18 3Q18 4Q18 1Q19 2Q19 3Q19 4Q19 1Q20 2Q20 3Q20 4Q20 1Q21 2Q21 3Q21 4Q21 1Q22 2Q22 3Q22 4Q22 1Q23 2Q23 3Q23 EBITDA ($MM) System Receipts (Avg MBPD) NS Permian Crude System Performance (by Quarter) * Adjusted 435 453 * 3 – As of November 14, 2023 – For the year ended September 30, 2023 – For the month ended September 30, 2023 Crude Supply/Export
20 Since 2017, We Have Expanded Our Permian System to Meet Our Producers’ Needs Dedicated Acres 500,000 AMI 4,200,000 May 2017 Current System Capacity 220,000 700,000 Receipt Points 122 363 Pipeline Miles ~600 ~1,025 Storage (bbls) 900,000 1,600,000 Third-party Connections NuStar Terminals NuStar Truck Unloading Facilities Delivery Locations Midland: ★ Plains Cactus I & II, Basin, Sunrise and others ★ Enterprise Midland to Echo ★ Sunoco Permian Express ★ EPIC ★ Energy Transfer Centurion ★ Wink-to-Webster Colorado City: ★ Sunoco WTG, Permian Express ★ Bridgetex ★ Plains Basin ★ Sunrise II Other: ★ Delek Big Spring Refinery Crude Supply/Export
21 59% 24% 5% 12% U.S. Gulf Coast Crude Exports by Hub (2023 YTD) Corpus Christi Houston Beaumont Louisiana 90.1 96.6 99.7 102.0 103.6 104.6 105.4 105.9 100 95 90 85 105 2020 2021 2022 2023 2024 2025 2026 2027 MMbpd As Global Demand Continues to Grow, Corpus Christi is Expected to Continue to be the Export Hub Best Positioned for Future Growth Corpus Christi has remained the dominant Gulf Coast crude exports hub since 2020 In 2023, 59% of the U.S. Gulf Coast’s total export volumes left via Corpus Christi-based terminals U.S. Gulf Coast crude exports are projected to continue at record volumes due to the global oil demand forecasted over the upcoming years Improved global refined product demand should continue to lead the way to further recovery in global crude demand Source: RBN Energy, ESAI Global Crude Oil Demand Global Refined Product Demand* *Comprised of gasoline and diesel demand Crude Supply/Export 49.2 52.7 54.1 55.2 55.8 56.0 56.0 56.0 57 55 53 51 49 47 45 2020 2021 2022 2023 2024 2025 2026 2027 MMbpd
22 Our Corpus Christi Crude System’s MVCs- for Export and Local Refinery Supply- Provide Strength & Stability ★ Our Corpus Christi Crude System (CCCS) is comprised of our 16” South Texas Crude Oil Pipeline System, our 12” Three Rivers Supply Pipeline, our 30” pipeline from Taft and our North Beach Export Terminal, which also receives volumes from Harvest’s 16” Pipeline and delivers to local refineries ★ In July 2022, we extended our MVC contract with Trafigura for an additional year and a half, through December 2024 In-bound Capacity Storage Capacity Outbound Capacity ★ Unlike most other midstream operators in the Port of Corpus Christi, NuStar provides optionality for marine exports and extensive connectivity to local refineries ★ U.S. shale production growth and improving global demand are expected to drive the recovery and growth in our CCCS volumes TOTAL: 3.9MMbbl Potential expansion 0.4MMbbl TOTAL: 1.2MMBPD South Texas Crude System 16” Pipeline - 240MBPD Taft 30”- 720MBPD and expandable Harvest 16” Pipeline - 240MBPD TOTAL: 1.2MMBPD Export Docks- 750MBPD to 1.0MMBPD Refinery Supply- 220MBPD Crude Supply/Export 71% 65% 74% 69% 66% 29% 35% 26% 31% 34% 0 200 400 3Q 2022 4Q 2022 1Q 2023 2Q 2023 3Q 2023 2024 MBPD CCCS Refinery Throughputs CCCS Dock Throughputs CCCS MVCs NuStar’s Corpus Christi Crude System Average Throughputs/Quarter 246 341 368 369 239 269
23 In 2023, We Will Continue to Focus on NuStar’s Strategic Priorities That We Set Back in 2022 Maximizing Our Cash Flow Maintaining a Healthy Debt Metric 3. Providing Safe & Reliable Transportation & Storage of Essential Energy Our Strategic Priorities: 2. 1.
Big Springs, TX Appendix
25 NuStar By-the-numbers NYSE: NS $1.60 8.3% Common Unit Price(1): $19.18 Distribution/CU/Year: Yield(1): Market Cap(1): ~$2.5 billion Ba3 (Stable) BB- (Positive) BB (Stable) Credit Ratings: Moody’s: S&P: Fitch: Enterprise Value(1): Total Assets: ~$6.5 billion ~$5.0 billion ~9,500 1.8MMBPD Pipeline Miles: Pipeline Volumes(2): Storage Capacity: ~49MMB Storage Throughput Volumes(2): 410MBPD As of December 1, 2023 Average daily volume for the quarter ended September 30, 2023
26 NuStar Sustainability Highlights Issued 2022 Sustainability Report including Scope 1 & 2 GHG Emissions 2 - US only; See Sustainability report on NuStar website for additional information 2
27 Long-term Commitments From Creditworthy Customers 67% 13% 20% Investment-grade Large Private or International (Not rated) Other NuStar Investment-grade Customers (% Pipeline/Storage 2023 YTD Revenues as of September 30, 2023) 30% 42% 28% Structurally Exclusive Other Pipeline Segment Contracted1 Revenues (% 2023 Forecast – as of 3Q23) Take-or-pay Contracts 69% 31% Take-or-pay Contracts Other Storage Segment Contracted Revenues (% 2023 Forecast – as of 3Q23) 1 - Committed through take or pay contracts or through structural exclusivity (uncommitted lines serving refinery customers with no competition); 2 - Most crude pipelines have rates that are subject to floors and caps, which is common in the industry. ~95% of revenues are tied to PPI-FG2 Most storage revenues are tied to regional CPI
28 $665 $403 $322 $600 $500 $550 $600 $73 $330 $4 $0 $250 $500 $750 $1,000 Liquidity 2023 2023-2024 2025 2026 2027 2028-2029 2030 2038-2041 2043 Revolver Receivables Financing Senior Unsecured Notes GO Zone Financing Sub Notes $669 LIQUIDITY ($MM)1 Liquidity and Debt Maturity Schedule ★ In the past few years, we utilized cash flows, proceeds from asset sales and monetization of our corporate real estate to continue to reduce debt balances, which enabled us to repurchase about 2/3 of the Series D preferred units through July 2023 ★ And on September 12th, we redeemed the remaining 1/3 of the Series D preferred units with proceeds of ~$222 from the ~15 million units of equity we issued in August 2023 Thus, strengthening our balance sheet and simplifying our capital structure ★ In June 2023, we also extended the term of our $1.0 billion revolver through January 2027 and our receivables financing agreement through July 2026 Debt Maturities ($MM)1 1 – Balances as of September 30, 2023
29 Capital Structure as of September 30, 2023 ($ in Millions) $1.0B Credit Facility $ 330 NuStar Logistics Notes (5.625%) 550 NuStar Logistics Notes (5.75%) 600 NuStar Logistics Notes (6.00%) 500 NuStar Logistics Notes (6.375%) 600 NuStar Logistics Sub Notes 403 GO Zone Bonds 322 Receivables Financing 73 Finance Lease Liability 55 Other (30) Total Debt $3,403 Common Equity and AOCI $ 286 Series A, B and C Preferred Units 756 Total Equity 1,042 Total Capitalization $4,445 ★ As of September 30, 2023: Credit facility availability ~$665MM Debt-to-EBITDA ratio1 3.83x 1 - Please see Appendix for reconciliations of non-GAAP financial measures to their most directly comparable GAAP measures
30 Reconciliation of Non-GAAP Financial Information
31 Reconciliation of Non-GAAP Financial Information (continued)
32 Reconciliation of Non-GAAP Financial Information (continued)
33 Reconciliation of Non-GAAP Financial Information (continued)
34 Reconciliation of Non-GAAP Financial Information (continued)
35 NuStar Contact Information INVESTOR RELATIONS (210) 918-INVR (4687) InvestorRelations@NuStarEnergy.com SUSTAINABILITY Sustainability@NuStarEnergy.com And for additional information about corporate sustainability at NuStar, visit https://sustainability.nustarenergy.com/