Exhibit 99.1
Updated Item 1. Business
PART I
Unless otherwise indicated, the terms “NuStar Energy L.P.,” “the Partnership,” “we,” “our” and “us” are used in this report to refer to NuStar Energy L.P., to one or more of our consolidated subsidiaries or to all of them taken as a whole. In the following Items, we make certain forward-looking statements, including statements regarding our plans, strategies, objectives, expectations, intentions and resources. The words “forecasts,” “intends,” “believes,” “expects,” “plans,” “scheduled,” “goal,” “may,” “anticipates,” “estimates” and similar expressions identify forward-looking statements. We do not undertake to update, revise or correct any of the forward-looking information. You are cautioned that such forward-looking statements should be read in conjunction with our disclosures under the heading: “CAUTIONARY STATEMENT REGARDING FORWARD-LOOKING INFORMATION.”
OVERVIEW
NuStar Energy L.P., a Delaware limited partnership, completed its initial public offering of common units on April 16, 2001 (NuStar Energy). Our common units are traded on the New York Stock Exchange (NYSE) under the symbol “NS.” Our principal executive offices are located at 2330 North Loop 1604 West, San Antonio, Texas 78248 and our telephone number is (210) 918-2000.
We are engaged in the crude oil and refined product transportation, terminalling and storage business in the United States, the Netherland Antilles, Canada, Mexico, the Netherlands and the United Kingdom. Also, we purchase certain petroleum products for resale to third parties.
We manage our operations through the following three operating segments: storage, transportation and asphalt and fuels marketing. As of December 31, 2007, our assets included:
| | • | | 61 refined product terminal facilities providing approximately 58.5 million barrels of storage capacity and one crude oil terminal facility providing approximately 3.4 million barrels of storage capacity; |
| | • | | 60 crude oil storage tanks providing storage capacity of 12.5 million barrels; |
| | • | | 8,251 miles of refined product pipelines, including 2,000 miles of anhydrous ammonia pipelines, with 21 associated terminals providing storage capacity of 4.6 million barrels and two tank farms providing storage capacity of 1.2 million barrels; and |
| | • | | 812 miles of crude oil pipelines with 11 associated storage tanks providing storage capacity of 1.7 million barrels. |
We conduct our operations through our wholly owned subsidiaries, primarily NuStar Logistics, L.P. (NuStar Logistics) and Kaneb Pipe Line Operating Partnership, L.P. (KPOP). Our revenues include:
| | • | | tariffs for transporting crude oil, refined products and anhydrous ammonia through our pipelines; |
| | • | | fees for the use of our terminals and crude oil storage tanks and related ancillary services; |
| | • | | sales of bunker fuel to marine vessels; |
| | • | | sales of heavy fuels, asphalt and refined products to third parties; and |
| | • | | the mark-to-market impact of our limited trading program. |
Our business strategy is to increase per unit cash distributions to our partners through:
| | • | | continuous improvement of our operations by improving safety and environmental stewardship, cost controls and asset reliability and integrity; |
| | • | | internal growth through enhancing the utilization of our existing assets by expanding our business with current and new customers as well as investments in strategic expansion projects; |
| | • | | external growth from acquisitions that meet our financial and strategic criteria; and |
| | • | | complementary operations such as our product marketing and trading organization, which we created to capitalize on opportunities to optimize the use and profitability of our assets. |
Our internet website address ishttp://www.nustarenergy.com. Information contained on our website is not part of this report. Our annual reports on Form 10-K, quarterly reports on Form 10-Q and current reports on Form 8-K filed with (or furnished to) the Securities and Exchange Commission (SEC) are available on our internet website (in the “Investors” section), free of charge, as soon as reasonably practicable after we file or furnish such material. We also post our corporate governance guidelines, code of business conduct and ethics, code of ethics for senior financial officers and the charters of our board’s committees in the same website location. Our governance documents are available in print to any unitholder that makes a written request to Corporate Secretary, NuStar Energy L.P., 2330 North Loop 1604 West, San Antonio, Texas 78248.
The term “throughput” as used in this document generally refers to the crude oil or refined product barrels or tons of ammonia, as applicable, that pass through each pipeline, terminal or storage tank.
RECENT DEVELOPMENTS
On December 10, 2007, NuStar Logistics replaced the existing $600 million revolving credit agreement with a $1.25 billion five-year revolving credit agreement (the 2007 Revolving Credit Agreement). NuStar Logistics borrowed $528.4 million under the 2007 Revolving Credit Agreement to repay in full the balance on its $600 million revolving credit agreement and $525 million term loan agreement.
On November 19, 2007, we issued 2,600,000 common units representing limited partner interests at a price of $57.20 per unit. We received proceeds of $146.1 million, including a contribution of $3.0 million from our general partner to maintain its 2% general partner interest, net of issuance costs. The proceeds were used to repay a portion of the outstanding principal balance under our then active $600 million revolving credit agreement.
On November 6, 2007, we entered into a definitive agreement to acquire CITGO Asphalt Refining Company’s asphalt operations and assets (East Coast Asphalt Operations) for approximately $450.0 million, plus an inventory adjustment. The East Coast Asphalt Operations include a 74,000 barrels-per-day (BPD) asphalt refinery in Paulsboro, New Jersey, a 30,000 BPD asphalt refinery in Savannah, Georgia and three asphalt terminals on the East Coast with a combined storage capacity of 4.8 million barrels.
ACQUISITIONS AND DISPOSITIONS
On December 1, 2006, we acquired a crude oil storage and blending facility in St. James, Louisiana from Koch Supply and Trading, L.P. for approximately $141.7 million. The acquisition includes 17 crude oil tanks with a total capacity of approximately 3.4 million barrels. Additionally, the facility has three docks with barge and ship access. The facility is located on the west bank of the Mississippi River approximately 60 miles west of New Orleans. We funded the acquisition with borrowings under our revolving credit agreement.
On March 30, 2006, we sold our subsidiaries located in Australia and New Zealand to ANZ Terminals Pty. Ltd., for total proceeds of $70.1 million. This transaction included the sale of eight terminals with an aggregate storage capacity of 1.1 million barrels.
On July 1, 2005, we completed our acquisition (the Kaneb Acquisition) of Kaneb Services LLC (KSL) and Kaneb Pipe Line Partners, L.P. (KPP, and, together with KSL, Kaneb). We acquired all of KSL’s outstanding equity securities for approximately $509 million in cash. Additionally, we issued approximately 23.8 million of our common units valued at approximately $1.45 billion in exchange for all of the outstanding common units of KPP.
2
ORGANIZATIONAL STRUCTURE
Our operations are managed by NuStar GP, LLC, the general partner of Riverwalk Logistics, L.P., our general partner. NuStar GP, LLC is a wholly owned subsidiary of NuStar GP Holdings, LLC (NuStar GP Holdings) (NYSE: NSH). We use the term “general partner” in this report to refer to Riverwalk Logistics, L.P., NuStar GP, LLC, Riverwalk Holdings, LLC and/or NuStar GP Holdings.
In two separate public offerings in 2006, Valero Energy Corporation (Valero Energy) sold their ownership interest in NuStar GP Holdings. NuStar GP Holdings did not receive any proceeds from either public offering, and Valero Energy’s ownership interest in NuStar GP Holdings was reduced to zero.
On April 1, 2007, we changed our name to NuStar Energy L.P. (formerly Valero L.P.), and Valero GP Holdings, LLC changed its name to NuStar GP Holdings, LLC. Prior to April 1, 2007, our common units traded on the NYSE under the symbol “VLI” and the common units of NuStar GP Holdings traded under the symbol “VEH.”
3
The following chart depicts our organizational structure at December 31, 2007.

4
SEGMENTS
Our three reportable business segments are storage, transportation and asphalt and fuels marketing. Detailed financial information about our segments is included in Note 20 in the Notes to Consolidated Financial Statements in Item 8. “Financial Statements and Supplementary Data.”
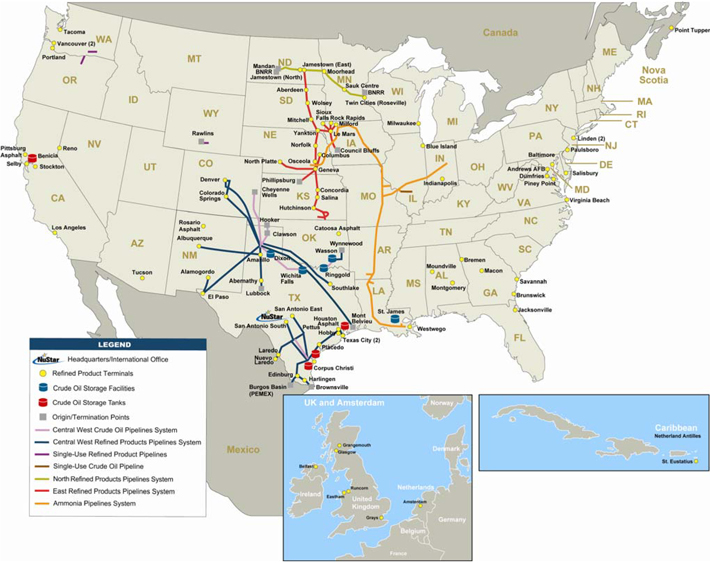
The following map depicts our operations at December 31, 2007.
5
STORAGE
Our storage segment includes terminal facilities that provide storage and handling services on a fee basis for petroleum products, specialty chemicals, crude oil and other liquids and crude oil storage tanks used to store and deliver crude oil to Valero Energy’s refineries in Benicia, Corpus Christi and Texas City. In addition, our terminals located on the island of St. Eustatius, Netherlands Antilles and in Point Tupper, Nova Scotia provide services such as pilotage, tug assistance, line handling, launch service, emergency response services and other ship services. As of December 31, 2007, we owned and operated:
| | • | | 52 terminals in the United States, with a total storage capacity of approximately 34.9 million barrels; |
| | • | | A terminal on the island of St. Eustatius, Netherlands Antilles with a tank capacity of 13.0 million barrels and a transshipment facility; |
| | • | | A terminal located in Point Tupper, Nova Scotia with a tank capacity of 7.4 million barrels and a transshipment facility; |
| | • | | Six terminals located in the United Kingdom and one terminal located in Amsterdam, the Netherlands, having a total storage capacity of approximately 6.6 million barrels; |
| | • | | A terminal located in Nuevo Laredo, Mexico; and |
| | • | | 60 crude oil and intermediate feedstock storage tanks and related assets in Texas and California with aggregate storage capacity of approximately 12.5 million barrels. |
Our five largest terminal facilities are located on the island of St. Eustatius, Netherlands Antilles; in Point Tupper, Nova Scotia; in Piney Point, Maryland; in Linden, New Jersey (50% owned joint venture); and in St. James, Louisiana.
Description of Largest Terminal Facilities
St. Eustatius, Netherlands Antilles.We own and operate a 13.0 million barrel petroleum storage and terminalling facility located on the Netherlands Antilles island of St. Eustatius, which is located at a point of minimal deviation from major shipping routes. This facility is capable of handling a wide range of petroleum products, including crude oil and refined products, and it can accommodate the world’s largest tankers for loading and discharging crude oil and other petroleum products. A two-berth jetty, a two-berth monopile with platform and buoy systems, a floating hose station and an offshore single point mooring buoy with loading and unloading capabilities serve the terminal’s customers’ vessels. The St. Eustatius facility has a total of 58 tanks. The fuel oil and petroleum product facilities have in-tank and in-line blending capabilities, while the crude tanks have tank-to-tank blending capability as well as in-tank mixers. In addition to the storage and blending services at St. Eustatius, this facility has the flexibility to utilize certain storage capacity for both feedstock and refined products to support our atmospheric distillation unit. This unit is capable of processing up to 25,000 barrels per day of feedstock, ranging from condensates to heavy crude oil. We own and operate all of the berthing facilities at the St. Eustatius terminal. Separate fees apply for the use of the berthing facilities as well as associated services, including pilotage, tug assistance, line handling, launch service, spill response services and other ship services.
Point Tupper, Nova Scotia.We own and operate a 7.4 million barrel terminalling and storage facility located at Point Tupper on the Strait of Canso, near Port Hawkesbury, Nova Scotia, which is located approximately 700 miles from New York City and 850 miles from Philadelphia. This facility is the deepest independent, ice-free marine terminal on the North American Atlantic coast, with access to the East Coast and Canada as well as the Midwestern United States via the St. Lawrence Seaway and the Great Lakes system. With one of the premier jetty facilities in North America, the Point Tupper facility can accommodate substantially all of the world’s largest, fully laden very large crude carriers and ultra large crude carriers for loading and discharging crude oil, petroleum products and petrochemicals. Crude oil and petroleum product movements at the terminal are fully automated. Separate fees apply for the use of the jetty facility as well as associated services, including pilotage, tug assistance, line handling, launch service, spill response services and other ship services. We also charter tugs, mooring launches and other vessels to assist with the movement of vessels through the Strait of Canso and the safe berthing of vessels at the terminal facility.
Piney Point, Maryland.Our terminal and storage facility in Piney Point, Maryland is located on approximately 400 acres on the Potomac River. The Piney Point terminal has approximately 5.4 million barrels of storage capacity in 28 tanks and is the closest deep-water facility to Washington, D.C. This terminal competes with other large petroleum terminals in the East Coast water-borne market extending from New York Harbor to Norfolk, Virginia. The terminal currently stores petroleum products consisting primarily of fuel oils and asphalt. The terminal has a dock with a 36-foot draft for tankers and four berths for barges. It also has truck-loading facilities, product-blending capabilities and is connected to a pipeline that supplies residual fuel oil to two power generating stations.
6
Linden, New Jersey.We own 50% of ST Linden Terminal LLC, which owns a terminal and storage facility in Linden, New Jersey. The terminal is located on a 44-acre facility that provides it with deep-water terminalling capabilities at New York Harbor. This terminal primarily stores petroleum products, including gasoline, jet fuel and fuel oils. The facility has a total capacity of approximately 4.1 million barrels in 24 tanks, can receive products via ship, barge and pipeline and delivers product by ship, barge, pipeline and truck. The terminal includes two docks and leases a third with draft limits of 36, 26 and 20 feet, respectively.
St. James, Louisiana.Our terminal has 17 crude oil storage tanks with a total capacity of approximately 3.4 million barrels. Additionally, the facility has a rail-loading facility and three docks with barge and ship access. The facility is located on approximately 220 acres of land on the west bank of the Mississippi River approximately 60 miles west of New Orleans and has an additional 675 acres of undeveloped land.
In 2007, we began construction of four crude oil storage tanks with capacity of approximately 1.5 million barrels at our St. James facility, with estimated completion in the fourth quarter of 2008.
In addition, we are constructing 18 tanks with storage capacity of approximately 2.7 million barrels at our Amsterdam terminal with estimated completion in phases throughout 2008.
Terminal Facilities and Crude Oil Storage Tanks
The following table sets forth information about our terminal facilities:
| | | | | | |
Facility | | Tank
Capacity | | Number of
Tanks | | Primary Products Handled |
Major U.S. Terminals: | | | | | | |
Piney Point, MD | | 5,404,000 | | 28 | | Petroleum products, asphalt |
Linden, NJ (a) | | 4,055,000 | | 24 | | Petroleum products |
St. James, LA | | 3,357,000 | | 17 | | Crude oil and feedstocks |
Selby, CA | | 2,829,000 | | 22 | | Petroleum products, ethanol |
Jacksonville, FL | | 2,057,000 | | 30 | | Petroleum products, asphalt |
Texas City, TX | | 2,131,000 | | 103 | | Chemicals, petrochemicals, petroleum products |
| | | |
Other U.S. Terminals: | | | | | | |
Montgomery, AL | | 162,000 | | 7 | | Petroleum products |
Moundville, AL | | 310,000 | | 6 | | Petroleum products |
Tucson, AZ (b) | | 85,000 | | 4 | | Petroleum products |
Los Angeles, CA | | 606,000 | | 19 | | Petroleum products |
Pittsburg, CA | | 361,000 | | 10 | | Asphalt |
Stockton, CA | | 803,000 | | 33 | | Petroleum products, ethanol, fertilizer |
Colorado Springs, CO | | 320,000 | | 7 | | Petroleum products, ethanol |
Denver, CO | | 110,000 | | 9 | | Petroleum products, ethanol |
Bremen, GA | | 178,000 | | 8 | | Petroleum products |
Brunswick, GA | | 160,000 | | 2 | | Fertilizer, pulp liquor |
Macon, GA | | 307,000 | | 10 | | Petroleum products |
Savannah, GA | | 857,000 | | 21 | | Petroleum products, caustic |
Blue Island, IL | | 729,000 | | 15 | | Petroleum products, ethanol |
Indianapolis, IN | | 412,000 | | 18 | | Petroleum products |
Westwego, LA | | 852,000 | | 53 | | Molasses, caustic, chemicals, lube oil, fertilizer |
Andrews AFB, MD | | 72,000 | | 3 | | Petroleum products |
Baltimore, MD | | 837,000 | | 49 | | Chemicals, asphalt |
Salisbury, MD | | 177,000 | | 14 | | Petroleum products |
Reno, NV | | 98,000 | | 7 | | Petroleum products |
Linden, NJ | | 439,000 | | 9 | | Petroleum products |
Paulsboro, NJ | | 69,000 | | 9 | | Petroleum products |
Alamogordo, NM | | 120,000 | | 5 | | Petroleum products |
Albuquerque, NM | | 245,000 | | 10 | | Petroleum products, ethanol |
Rosario, NM | | 160,000 | | 8 | | Asphalt |
7
| | | | | | |
Facility | | Tank
Capacity | | Number of
Tanks | | Primary Products Handled |
Catoosa, OK | | 340,000 | | 24 | | Asphalt |
Portland, OR | | 1,197,000 | | 31 | | Petroleum products, ethanol |
Abernathy, TX | | 155,000 | | 7 | | Petroleum products |
Amarillo, TX | | 255,000 | | 8 | | Petroleum products |
Corpus Christi, TX | | 357,000 | | 11 | | Petroleum products |
Edinburg, TX | | 267,000 | | 6 | | Petroleum products |
El Paso, TX (b) | | 343,000 | | 12 | | Petroleum products |
Harlingen, TX | | 315,000 | | 7 | | Petroleum products |
Houston, TX (Hobby Airport) | | 106,000 | | 4 | | Petroleum products |
Houston, TX | | 90,000 | | 6 | | Asphalt |
Laredo, TX | | 320,000 | | 7 | | Petroleum products |
Placedo, TX | | 97,000 | | 4 | | Petroleum products |
San Antonio (east), TX | | 148,000 | | 5 | | Petroleum products |
San Antonio (south), TX | | 215,000 | | 5 | | Petroleum products |
Southlake, TX | | 285,000 | | 5 | | Petroleum products, ethanol |
Texas City, TX | | 146,000 | | 12 | | Petroleum products |
Dumfries, VA | | 548,000 | | 14 | | Petroleum products, asphalt |
Virginia Beach, VA | | 41,000 | | 2 | | Petroleum products |
Tacoma, WA | | 359,000 | | 14 | | Petroleum products, ethanol |
Vancouver, WA | | 301,000 | | 14 | | Chemicals |
Vancouver, WA | | 408,000 | | 7 | | Petroleum products |
Milwaukee, WI | | 308,000 | | 7 | | Petroleum products, ethanol |
| | | | | | |
Total U.S. Terminals | | 34,903,000 | | 772 | | |
| | | | | | |
| | | |
Foreign Terminals: | | | | | | |
St. Eustatius, Netherlands Antilles | | 12,997,000 | | 58 | | Petroleum products, crude oil |
Point Tupper, Canada | | 7,376,000 | | 37 | | Petroleum products, crude oil |
Grays, England | | 1,945,000 | | 53 | | Petroleum products |
Eastham, England | | 2,185,000 | | 162 | | Chemicals, petroleum products, animal fats |
Runcorn, England | | 146,000 | | 4 | | Molten sulfur |
Grangemouth, Scotland | | 530,000 | | 46 | | Petroleum products, chemicals and molasses |
Glasgow, Scotland | | 344,000 | | 16 | | Petroleum products |
Belfast, Northern Ireland | | 407,000 | | 41 | | Petroleum products |
Amsterdam, the Netherlands | | 1,024,000 | | 24 | | Petroleum products |
Nuevo Laredo, Mexico | | 34,000 | | 5 | | Petroleum products |
| | | | | | |
Total Foreign Terminals | | 26,988,000 | | 446 | | |
| | | | | | |
| (a) | We own 50% of this terminal through a joint venture. |
| (b) | We own a 66.67% undivided interest in the El Paso refined product terminal and a 50% undivided interest in the Tucson refined product terminal. The tankage capacity and number of tanks represent the proportionate share of capacity attributable to our ownership interest. |
In 2007, we sold three refined product terminals with approximately 700,000 barrels of storage capacity for total proceeds of approximately $3.6 million.
8
The following table sets forth information about our crude oil storage tanks:
| | | | | | | | | | | | |
Location | | Valero
Energy
Refinery | | Capacity | | Number
of Tanks | | Mode of
Receipt | | Mode
of
Delivery | | Throughput
Year Ended
December 31,
2007 |
| | | | | (Barrels) | | | | | | | | (Barrels/Day) |
Benicia, CA | | Benicia | | 3,815,000 | | 16 | | marine/
pipeline | | pipeline | | 136,729 |
Corpus Christi, TX | | Corpus Christi | | 4,023,000 | | 26 | | marine | | pipeline | | 152,442 |
Texas City, TX | | Texas City | | 3,087,000 | | 14 | | marine | | pipeline | | 187,605 |
Corpus Christi, TX (North Beach) | | Three Rivers | | 1,600,000 | | 4 | | marine | | pipeline | | 72,247 |
| | | | | | | | | | | | |
Total | | | | 12,525,000 | | 60 | | | | | | 549,023 |
| | | | | | | | | | | | |
The land underlying these crude oil storage tanks is subject to long-term operating leases.
Storage Operations
Revenues for the storage segment include fees for tank storage agreements, whereby a customer agrees to pay for a certain amount of storage in a tank over a period of time (storage lease revenues), and throughput agreements, whereby a customer pays a fee per barrel for volumes moving through our terminals (throughput revenues). We charge a fee for each barrel of crude oil and certain other feedstocks that we deliver to Valero Energy’s Benicia, Corpus Christi West and Texas City refineries from our crude oil storage tanks. Also, our terminals provide blending, additive injections, handling and filtering services. Our facilities at Point Tupper and St. Eustatius charge fees to provide services such as pilotage, tug assistance, line handling, launch service, emergency response services and other ship services.
Demand for Refined Petroleum Products
The operations of our refined product terminals depend in large part on the level of demand for products stored in our terminals in the markets served by those assets. The majority of products stored in our terminals are refined petroleum products. Demand for our terminalling services will generally increase or decrease with demand for refined petroleum products, and demand for refined petroleum products tends to increase or decrease with the relative strength of the economy.
Customers
We provide storage and terminalling services for crude oil and refined petroleum products to many of the world’s largest producers of crude oil, integrated oil companies, chemical companies, oil traders and refiners. The largest customer of our storage segment is Valero Energy, which accounted for $115.4 million, or 28.1% of the total revenues of the segment, for the year ended December 31, 2007. No other customer accounted for more than 10% of the revenues of the segment for this period. Our crude oil transshipment customers include an oil producer that leases and utilizes 5.0 million barrels of storage at St. Eustatius and a major international oil company which leases and utilizes 3.6 million barrels of storage at Point Tupper, both of which have long-term contracts with us. In addition, two different international oil companies each lease and utilize more than 1.0 million barrels of clean products storage at St. Eustatius and Point Tupper. Also in Canada, a consortium consisting of major oil companies sends natural gas liquids via pipeline to certain processing facilities on land leased from us. After processing, certain products are stored at the Point Tupper facility under a long-term contract. In addition, our blending capabilities have attracted customers who have leased capacity primarily for blending purposes.
Competition and Business Considerations
Many major energy and chemical companies own extensive terminal storage facilities. Although such terminals often have the same capabilities as terminals owned by independent operators, they generally do not provide terminalling services to third parties. In many instances, major energy and chemical companies that own storage and terminalling facilities are also significant customers of independent terminal operators. Such companies typically have strong demand for terminals owned by independent operators when independent terminals have more cost-effective locations near key transportation links, such as deep-water ports. Major energy and chemical companies also need independent terminal storage when their owned storage facilities are inadequate, either because of size constraints, the nature of the stored material or specialized handling requirements.
9
Independent terminal owners generally compete on the basis of the location and versatility of terminals, service and price. A favorably located terminal will have access to various cost-effective transportation modes both to and from the terminal. Transportation modes typically include waterways, railroads, roadways and pipelines. Terminals located near deep-water port facilities are referred to as “deep-water terminals,” and terminals without such facilities are referred to as “inland terminals,” although some inland facilities located on or near navigable rivers are served by barges.
Terminal versatility is a function of the operator’s ability to offer complex handling requirements for diverse products. The services typically provided by the terminal include, among other things, the safe storage of the product at specified temperature, moisture and other conditions, as well as receipt at and delivery from the terminal, all of which must be in compliance with applicable environmental regulations. A terminal operator’s ability to obtain attractive pricing is often dependent on the quality, versatility and reputation of the facilities owned by the operator. Although many products require modest terminal modification, operators with versatile storage capabilities typically require less modification prior to usage, ultimately making the storage cost to the customer more attractive.
The main competition at our St. Eustatius and Point Tupper locations for crude oil handling and storage is from “lightering,” which is the process by which liquid cargo is transferred to smaller vessels, usually while at sea. The price differential between lightering and terminalling is primarily driven by the charter rates for vessels of various sizes. Lightering generally takes significantly longer than discharging at a terminal. Depending on charter rates, the longer charter period associated with lightering is generally offset by various costs associated with terminalling, including storage costs, dock charges and spill response fees. However, terminalling is generally safer and reduces the risk of environmental damage associated with lightering, provides more flexibility in the scheduling of deliveries and allows our customers to deliver their products to multiple locations. Lightering in U.S. territorial waters creates a risk of liability for owners and shippers of oil under the U.S. Oil Pollution Act of 1990 and other state and federal legislation. In Canada, similar liability exists under the Canadian Shipping Act. Terminalling also provides customers with the ability to access value-added terminal services.
Our crude oil storage tanks are physically integrated with and principally serve refineries owned by Valero Energy. Additionally, we have entered into various agreements with Valero Energy governing the usage of these tanks. As a result, we believe that we will not face significant competition for our services provided to those refineries owned by Valero Energy. Please read the disclosure contained in Note 14 of Notes to Consolidated Financial Statements in Item 8. “Financial Statements and Supplementary Data” for additional information.
TRANSPORTATION
Our pipeline operations consist primarily of the transportation of refined petroleum products as a common carrier in Texas, Oklahoma, Colorado, New Mexico, Kansas, Nebraska, Iowa, South Dakota, North Dakota and Minnesota and cover approximately 6,251 miles. In addition, we own a 2,000 mile anhydrous ammonia pipeline located in Louisiana, Arkansas, Missouri, Illinois, Indiana, Iowa and Nebraska. As of December 31, 2007, we owned and operated:
| | • | | 26 refined product pipelines with an aggregate length of 3,911 miles that connect Valero Energy’s McKee, Three Rivers, Corpus Christi and Ardmore refineries to certain of NuStar Energy’s terminals, or to interconnections with third-party pipelines or terminals for further distribution, including a 25-mile crude hydrogen pipeline (collectively, the Central West System); |
| | • | | a 1,900-mile refined product pipeline originating in southern Kansas and terminating at Jamestown, North Dakota, with a western extension to North Platte, Nebraska and an eastern extension into Iowa (the East Pipeline); |
| | • | | a 440-mile refined product pipeline originating at Tesoro Corporation’s Mandan, North Dakota refinery (the Tesoro Mandan refinery) and terminating in Minneapolis, Minnesota (the North Pipeline); and |
| | • | | a 2,000-mile anhydrous ammonia pipeline originating at the Louisiana delta area that travels north through the midwestern United States forking east and west to terminate in Nebraska and Indiana (the Ammonia Pipeline). |
As of December 31, 2007, we also had an ownership interest in eleven crude oil pipelines in Texas, Oklahoma, Kansas Colorado and Illinois with an aggregate length of 812 miles and four crude oil storage facilities in Texas and Oklahoma that are located along the crude oil pipelines.
10
We charge tariffs on a per barrel basis for transporting refined products, crude oil and other feedstocks in our refined product and crude oil pipelines and on a per ton basis for transporting anhydrous ammonia in our ammonia pipeline.
Description of Pipelines
Central West System.The pipelines included in the Central West System were constructed to support the refineries to which they are connected. These pipelines are physically integrated with and principally serve refineries owned by Valero Energy. We have entered into various agreements with Valero Energy governing the usage of these pipelines. Please read the disclosure contained in Note 14 of Notes to Consolidated Financial Statements in Item 8. “Financial Statements and Supplementary Data” for additional information.
The refined products transported in these pipelines include gasoline, distillates (including diesel and jet fuel), natural gas liquids (such as propane and butane), blendstocks and other products produced primarily by Valero Energy’s refineries. These pipelines connect certain of Valero Energy’s refineries to key markets in Texas, New Mexico and Colorado.
The following table lists information about each of our refined product pipelines included in the Central West System:
| | | | | | | | | | | | | | |
| | | | | | | | | | | | Year Ended
December 31, 2007 | |
Origin and Destination | | Valero Energy
Refinery | | Length | | Ownership | | | Capacity | | Throughput | | Capacity
Utilization | |
| | | | | (Miles) | | | | | (Barrels/Day) | | (Barrels/Day) | | | |
McKee to El Paso, TX | | McKee | | 408 | | 67 | % | | 40,000 | | 28,436 | | 71 | % |
McKee to Colorado Springs, CO (a) | | McKee | | 256 | | 100 | % | | 38,000 | | 11,559 | | 63 | % |
Colorado Springs, CO to Airport | | McKee | | 2 | | 100 | % | | 14,000 | | 1,018 | | 7 | % |
Colorado Springs to Denver, CO | | McKee | | 101 | | 100 | % | | 32,000 | | 13,058 | | 41 | % |
McKee to Denver, CO | | McKee | | 321 | | 30 | % | | 9,870 | | 7,760 | | 79 | % |
McKee to Amarillo, TX (6”) (a)(b) | | McKee | | 49 | | 100 | % | | 51,000 | | 17,837 | | 42 | % |
McKee to Amarillo, TX (8”) (a)(b) | | McKee | | 49 | | 100 | % | | | | | | | |
Amarillo to Abernathy, TX (a) | | McKee | | 102 | | 67 | % | | 11,733 | | 4,633 | | 46 | % |
Amarillo, TX to Albuquerque, NM | | McKee | | 293 | | 50 | % | | 17,150 | | 5,823 | | 34 | % |
Abernathy to Lubbock, TX (a) | | McKee | | 19 | | 46 | % | | 8,029 | | 790 | | 10 | % |
McKee to Skellytown, TX | | McKee | | 53 | | 100 | % | | 52,000 | | 5,053 | | 10 | % |
Skellytown to Mont Belvieu,TX | | McKee | | 572 | | 50 | % | | 26,000 | | 11,750 | | 45 | % |
McKee to Southlake, TX | | McKee | | 375 | | 100 | % | | 27,300 | | 9,956 | | 36 | % |
Three Rivers to San Antonio, TX | | Three Rivers | | 81 | | 100 | % | | 33,600 | | 29,574 | | 88 | % |
Three Rivers to US/Mexico International Border near Laredo, TX | | Three Rivers | | 108 | | 100 | % | | 32,000 | | 25,232 | | 79 | % |
Corpus Christi to Three Rivers, TX | | Corpus Christi | | 68 | | 100 | % | | 32,000 | | 7,060 | | 22 | % |
Three Rivers to Corpus Christi, TX | | Three Rivers | | 72 | | 100 | % | | 15,000 | | 10,886 | | 73 | % |
Three Rivers to Pettus to San Antonio, TX | | Three Rivers | | 103 | | 100 | % | | 30,000 | | 24,272 | | 81 | % |
Three Rivers to Pettus to Corpus Christi, TX (c) | | Three Rivers | | 87 | | 100 | % | | 15,000 | | — | | 0 | % |
Ardmore to Wynnewood, OK (d) | | Ardmore | | 31 | | 100 | % | | 84,000 | | 59,692 | | 66 | % |
El Paso, TX to Kinder Morgan | | McKee | | 12 | | 67 | % | | 64,000 | | 22,696 | | 35 | % |
Corpus Christi to Pasadena, TX | | Corpus Christi | | 208 | | 100 | % | | 105,000 | | 87,344 | | 83 | % |
Corpus Christi to Brownsville, TX | | Corpus Christi | | 194 | | 100 | % | | 45,000 | | 40,289 | | 90 | % |
US/Mexico International Border near Penitas, TX to Edinburg, TX | | N/A | | 33 | | 100 | % | | 24,000 | | 6,157 | | 26 | % |
Clear Lake, TX to Texas City, TX | | N/A | | 25 | | 100 | % | | N/A | | N/A | | N/A | |
Other refined product pipeline (e) | | N/A | | 289 | | 50 | % | | N/A | | N/A | | N/A | |
| | | | | | | | | | | | | | |
Total | | | | 3,911 | | | | | 806,682 | | 430,875 | | | |
| | | | | | | | | | | | | | |
| (a) | This pipeline transports barrels relating to two tariff routes. The first route begins at this pipeline’s origin and ends at this pipeline’s destination. The second route is a longer tariff route with an origin or destination on another pipeline of ours that connects to this pipeline. Throughput disclosed above for this pipeline reflects only the barrels subject to the tariff route beginning at this pipeline’s origin and ending at this pipeline’s destination. To accurately determine the actual capacity utilization of the pipeline, as well as aggregate capacity utilization, all barrels passing through the pipeline have been taken into account. |
11
| (b) | The throughput, capacity and capacity utilization information disclosed above for the McKee to Amarillo, Texas 6-inch pipeline reflects both McKee to Amarillo, Texas pipelines on a combined basis. |
| (c) | The refined product pipeline from Three Rivers to Pettus to Corpus Christi, Texas is temporarily idled. In the fourth quarter of 2005, an eight-mile portion of this pipeline was permanently idled. As a result, we recorded an impairment charge of $2.1 million included in “Other income (expense), net” in the consolidated statements of income for the year ended December 31, 2005. |
| (d) | Included in this segment are two refined product storage tanks with a total capacity of 180,000 barrels located at Wynnewood, Oklahoma. Refined products may be stored and batched prior to shipment into a third party pipeline. |
| (e) | This category consists of the temporarily idled 6-inch Amarillo, Texas to Albuquerque, New Mexico refined product pipeline. |
East Pipeline.The East Pipeline covers 1,900 miles and moves refined products north in pipelines ranging in size from 6 inches to 16 inches. The East Pipeline system also includes 22 product tanks with total storage capacity of approximately 1.2 million barrels at our two tanks farms at McPherson and El Dorado, Kansas. The East Pipeline transports refined petroleum products to our terminals along the system and to receiving pipeline connections in Kansas. Shippers on the East Pipeline obtain refined petroleum products from refineries in southeast Kansas connected to the East Pipeline or through other pipelines directly connected to the pipeline system. The East Pipeline transported approximately 56.5 million barrels for the year ended December 31, 2007.
North Pipeline.The North Pipeline runs from west to east approximately 440 miles from its origin at the Tesoro Mandan refinery to the Minneapolis, Minnesota area. The North Pipeline crosses our East Pipeline near Jamestown, North Dakota where the two pipelines are connected. While the North Pipeline is currently supplied primarily by the Tesoro Mandan refinery, it is capable of delivering or receiving products to or from the East Pipeline. The North Pipeline transported approximately 16.8 million barrels for the year ended December 31, 2007.
The East and North Pipelines also include 21 truck-loading terminals through which refined petroleum products are delivered to storage tanks and then loaded into petroleum transport trucks. Revenues earned at these terminals relate solely to the volumes transported on the pipeline. In the case of the North Pipeline, separate fees are not charged for the use of these terminals. Instead, the terminalling fees are a portion of the transportation rate included in the pipeline tariff. In the case of the East Pipeline, separate fees are charged for the use of the terminals, even though such fees are separately stated within the filed pipeline tariff. As a result, these terminals are included in this segment instead of the storage segment.
12
The following table lists information about the tanks we own as of December 31, 2007 at each of our refined petroleum product terminals connected to the East or North Pipelines:
| | | | | | |
Location of Terminals | | Tank Capacity | | Number of
Tanks | | Related Pipeline
System |
Iowa: | | | | | | |
LeMars | | 103,000 | | 8 | | East |
Milford | | 172,000 | | 11 | | East |
Rock Rapids | | 223,000 | | 5 | | East |
| | | |
Kansas: | | | | | | |
Concordia | | 79,000 | | 6 | | East |
Hutchinson | | 115,000 | | 5 | | East |
Salina | | 86,000 | | 8 | | East |
| | | |
Minnesota: | | | | | | |
Moorhead | | 518,000 | | 10 | | North |
Sauk Centre | | 116,000 | | 7 | | North |
Roseville | | 479,000 | | 10 | | North |
| | | |
Nebraska: | | | | | | |
Columbus | | 171,000 | | 8 | | East |
Geneva | | 674,000 | | 37 | | East |
Norfolk | | 182,000 | | 15 | | East |
North Platte | | 247,000 | | 23 | | East |
Osceola | | 79,000 | | 7 | | East |
| | | |
North Dakota: | | | | | | |
Jamestown (North) | | 139,000 | | 6 | | North |
Jamestown (East) | | 176,000 | | 11 | | East |
| | | |
South Dakota: | | | | | | |
Aberdeen | | 181,000 | | 12 | | East |
Mitchell | | 63,000 | | 6 | | East |
Sioux Falls | | 381,000 | | 12 | | East |
Wolsey | | 148,000 | | 20 | | East |
Yankton | | 245,000 | | 25 | | East |
| | | | | | |
Total | | 4,577,000 | | 252 | | |
| | | | | | |
Ammonia Pipeline.The 2,000 mile pipeline originates in the Louisiana delta area, where it has access to three marine terminals and three anhydrous ammonia plants on the Mississippi River. It runs north through Louisiana and Arkansas into Missouri, where at Hermann, Missouri, one branch splits and goes east into Illinois and Indiana, while the other branch continues north into Iowa and then turns west into Nebraska. The Ammonia Pipeline is connected to multiple third-party-owned terminals, which include industrial facility delivery locations. Product is supplied to the pipeline from anhydrous ammonia plants in Louisiana and imported product delivered through the marine terminals. Anhydrous ammonia is primarily used as agricultural fertilizer. It is also used as a feedstock to produce other nitrogen derivative fertilizers and explosives. The Ammonia Pipeline transported approximately 13.8 million barrels (converted from tons) for the year ended December 31, 2007.
Crude Oil Pipelines. Our crude oil pipelines primarily transport crude oil and other feedstocks, such as gas oil, from various points in Texas, Oklahoma, Kansas and Colorado to Valero Energy’s McKee, Three Rivers and Ardmore refineries. Also, we can use our four crude oil storage facilities in Texas and Oklahoma, located along the crude oil pipelines, to store and batch crude oil prior to shipment in the crude oil pipelines.
13
The following table sets forth information about each of our crude oil pipelines:
| | | | | | | | | | | | | | |
| | | | | | | | | | | | Year Ended December 31,
2007 | |
Origin and Destination | | Valero
Energy
Refinery | | Length | | Ownership | | | Capacity | | Throughput | | Capacity
Utilization | |
| | | | | (Miles) | | | | | (Barrels/Day) | | (Barrels/Day) | | | |
Cheyenne Wells, CO to McKee | | McKee | | 210 | | 100 | % | | 17,500 | | 7,041 | | 40 | % |
Dixon, TX to McKee | | McKee | | 44 | | 100 | % | | 45,000 | | 35,661 | | 79 | % |
Hooker, OK to Clawson, TX (a) | | McKee | | 41 | | 50 | % | | 22,000 | | 13,038 | | 59 | % |
Clawson, TX to McKee (b) | | McKee | | 31 | | 100 | % | | 36,000 | | 17,502 | | 85 | % |
Wichita Falls, TX to McKee | | McKee | | 272 | | 100 | % | | 110,000 | | 48,454 | | 44 | % |
Corpus Christi, TX to Three Rivers | | Three Rivers | | 70 | | 100 | % | | 120,000 | | 81,466 | | 68 | % |
Ringgold, TX to Wasson, OK (b) | | Ardmore | | 44 | | 100 | % | | 90,000 | | 58,894 | | 65 | % |
Healdton to Ringling, OK | | Ardmore | | 4 | | 100 | % | | 52,000 | | 2,521 | | 5 | % |
Wasson, OK to Ardmore (8”-10”) (c) | | Ardmore | | 24 | | 100 | % | | 90,000 | | 48,975 | | 54 | % |
Wasson, OK to Ardmore (8”) | | Ardmore | | 15 | | 100 | % | | 40,000 | | 32,624 | | 82 | % |
Patoka, IL to Wood River, IL | | N/A | | 57 | | 23.8 | % | | 60,600 | | 31,464 | | 52 | % |
| | | | | | | | | | | | | | |
Total | | | | 812 | | | | | 683,100 | | 377,640 | | | |
| | | | | | | | | | | | | | |
| (a) | We receive 50% of the tariff with respect to 100% of the barrels transported in the Hooker, Oklahoma to Clawson, Texas pipeline. Accordingly, the capacity, throughput and capacity utilization are given with respect to 100% of the pipeline. |
| (b) | This pipeline transports barrels relating to two tariff routes. The first route begins at the pipeline’s origin and ends at its destination. The second route begins with an origin or destination on another of our connecting pipelines. Throughput disclosed above for this pipeline reflects only the barrels subject to the tariff route beginning at this pipeline’s origin and ending at this pipeline’s destination. To accurately determine the actual capacity utilization of the pipeline, as well as aggregate capacity utilization, all barrels passing through the pipeline have been taken into account. |
| (c) | The Wasson, Oklahoma to Ardmore (8”- 10”) pipelines referred to above originate at Wasson as two pipelines but merge into one pipeline prior to reaching Ardmore. |
The following table sets forth information about the crude oil storage facilities located along our crude oil pipelines:
| | | | | | | | | | | | |
Location | | Valero
Energy
Refinery | | Capacity | | Number
of Tanks | | Mode of
Receipt | | Mode of
Delivery | | Throughput
Year Ended
December 31,
2007 |
| | | | | (Barrels) | | | | | | | | (Barrels/Day) |
Dixon, TX | | McKee | | 240,000 | | 3 | | pipeline | | pipeline | | 35,661 |
Ringgold, TX | | Ardmore | | 600,000 | | 2 | | pipeline | | pipeline | | 58,894 |
Wichita Falls, TX | | McKee | | 660,000 | | 4 | | pipeline | | pipeline | | 48,454 |
Wasson, OK | | Ardmore | | 225,000 | | 2 | | pipeline | | pipeline | | 81,599 |
| | | | | | | | | | | | |
Total | | | | 1,725,000 | | 11 | | | | | | 244,608 |
| | | | | | | | | | | | |
Other Pipelines.We also own three single-use pipelines, located near Umatilla, Oregon, Rawlings, Wyoming and Pasco, Washington, each of which supplies diesel fuel to a railroad fueling facility.
Pipeline Operations
Revenues for the refined product pipelines in the Central West System and the crude oil pipelines are based upon throughput volumes traveling through our pipelines and the related tariffs. Revenues for the East Pipeline, North Pipeline and Ammonia Pipeline are based upon volumes and the distance the product is shipped and the related tariffs.
14
In general, a shipper on one of our refined petroleum product pipelines delivers products to the pipeline from refineries or third-party pipelines that connect to the pipelines. Each shipper transporting product on a pipeline is required to supply us with a notice of shipment indicating sources of products and destinations. All shipments are tested or receive refinery certifications to ensure compliance with our specifications. Refined product shippers are generally invoiced by us upon delivery for the Central West, North and Ammonia pipelines and upon the product entering our East pipeline. Tariffs for transportation are charged to shippers based upon transportation from the origination point on the pipeline to the point of delivery.
Shippers on our crude oil pipelines deliver crude oil to the pipelines for transport to refineries that connect to the pipelines. The costs associated with the crude oil storage facilities located along the crude oil pipelines are considered in establishing the tariffs charged for transporting crude oil from the crude oil storage facilities to the refineries.
The refined product pipelines in the Central West System, the East Pipeline, the North Pipeline, the Ammonia Pipeline and the crude oil pipelines are subject to federal regulation by one or more of the following governmental agencies or laws: the Federal Energy Regulatory Commission (the FERC), the Surface Transportation Board (the STB), the Department of Transportation (DOT), the Environmental Protection Agency (EPA) and the Homeland Security Act. Additionally, the operations and integrity of the pipelines are subject to the respective state jurisdictions along the route of the systems.
The majority of our pipelines are common carrier and are subject to federal tariff regulation. In general, we are authorized by the FERC to adopt market-based rates. Common carrier activities are those for which transportation through our pipelines is available at published tariffs filed, in the case of interstate petroleum product shipments, with the FERC or, in the case of intrastate petroleum product shipments in Colorado, Kansas, North Dakota, Oklahoma and Texas, with the relevant state authority, to any shipper of refined petroleum products who requests such services and satisfies the conditions and specifications for transportation. The Ammonia Pipeline is subject to federal regulation by the STB and state regulation by Louisiana.
We use Supervisory Control and Data Acquisition remote supervisory control software programs to continuously monitor and control the pipelines. The system monitors quantities of products injected in and delivered through the pipelines and automatically signals the appropriate personnel upon deviations from normal operations that require attention.
Demand for and Sources of Refined Products
The operations of our Central West, East and North Pipelines depend in large part on the level of demand for refined products in the markets served by the pipelines and the ability and willingness of refiners and marketers having access to the pipelines to supply such demand by deliveries through the pipelines.
Virtually all of the refined products delivered through the pipelines in the Central West System are gasoline and diesel fuel that originate at refineries owned by Valero Energy. Demand for these products fluctuates as prices for these products fluctuate. Prices fluctuate for a variety of reasons including the overall balance in supply and demand, which is affected by refinery utilization rates, among other factors. Prices for gasoline and diesel fuel tend to increase in the warm weather months as more people drive automobiles.
The majority of the refined products delivered through the North Pipeline are delivered to the Minneapolis, Minnesota metropolitan area and consist primarily of gasoline and diesel fuel. Demand for those products fluctuates based on general economic conditions and with changes in the weather as more people drive during the warmer months.
Much of the refined products delivered through the East Pipeline and volumes on the North Pipeline that are not delivered to Minneapolis are ultimately used as fuel for railroads or in agricultural operations, including fuel for farm equipment, irrigation systems, trucks used for transporting crops and crop drying facilities. Demand for refined products for agricultural use, and the relative mix of products required, is affected by weather conditions in the markets served by the East and North Pipelines. The agricultural sector is also affected by government agricultural policies and crop prices. Although periods of drought suppress agricultural demand for some refined products, particularly those used for fueling farm equipment, the demand for fuel for irrigation systems often increases during such times. The mix of refined products delivered for agricultural use varies seasonally, with gasoline demand peaking in early summer, diesel fuel demand peaking in late summer and propane demand higher in the fall. In addition, weather conditions in the areas served by the East Pipeline affect the mix of the refined products delivered through the East Pipeline, although historically any overall impact on the total volumes shipped has not been significant.
15
Our refined product pipelines are also dependent upon adequate levels of production of refined products by refineries connected to the pipelines, directly or through connecting pipelines. The refineries are, in turn, dependent upon adequate supplies of suitable grades of crude oil. The pipelines in the Central West System and our crude oil pipelines are connected to refineries owned by Valero Energy and generally are subject to long-term throughput agreements with Valero Energy. Valero Energy’s refineries connected directly to our pipelines obtain crude oil from a variety of foreign and domestic sources. The refineries connected directly to the East Pipeline obtain crude oil from producing fields located primarily in Kansas, Oklahoma and Texas, and, to a much lesser extent, from other domestic or foreign sources. In addition, refineries in Kansas, Oklahoma and Texas are also connected to the East Pipeline through other pipelines. These refineries obtain their supplies of crude oil from a variety of sources. The pipelines in our Central West System and our crude oil pipelines are dependent upon the refineries owned by Valero Energy to which they connect. If operations at one of these refineries were discontinued or reduced, it could have a material adverse effect on our operations, although we would endeavor to minimize the impact by seeking alternative customers for those pipelines. The North Pipeline is heavily dependent on the Tesoro Mandan refinery, which primarily runs North Dakota crude oil (although it has the ability to run other crude oils). If operations at the Tesoro Mandan refinery were interrupted, it could have a material effect on our operations. Other than the Valero Energy refineries described above and the Tesoro Mandan refinery, if operations at any one refinery were discontinued, we believe (assuming unchanged demand for refined products in markets served by the refined product pipelines) that the effects thereof would be short-term in nature and our business would not be materially adversely affected over the long term because such discontinued production could be replaced by other refineries or other sources.
Virtually all of the refined products transported through the pipelines in the Central West System are produced by refineries owned by Valero Energy. The majority of the refined products transported through the East Pipeline are produced at three refineries located at McPherson and El Dorado, Kansas and Ponca City, Oklahoma, which are operated by the National Cooperative Refining Association (NCRA), Frontier Oil Corporation and ConocoPhillips Company, respectively. The NCRA and Frontier Refining refineries are connected directly to the East Pipeline. The East Pipeline also has direct access by third party pipelines to four other refineries in Kansas, Oklahoma and Texas and to Gulf Coast supplies of products through connecting pipelines that receive products from pipelines originating on the Gulf Coast.
Demand for and Sources of Anhydrous Ammonia
The Ammonia Pipeline is one of two major anhydrous ammonia pipelines in the United States and the only one capable of receiving foreign production directly into the system and transporting anhydrous ammonia into the nation’s corn belt.
Our Ammonia Pipeline operations depend on overall nitrogen fertilizer use, management practice, the level of demand for direct application of anhydrous ammonia as a fertilizer for crop production (Direct Application), the weather, as Direct Application is not effective if the ground is too wet or too dry, and the price of natural gas, the primary component of anhydrous ammonia.
Corn producers have fertilizer alternatives such as liquid or dry nitrogen fertilizers. Liquid and dry nitrogen fertilizers are both upgrades of anhydrous ammonia and therefore are generally more costly but are less sensitive to weather conditions during application. However, anhydrous ammonia has the highest nitrogen content of any nitrogen derivative fertilizer.
Customers
The largest customer of our transportation segment was Valero Energy, which accounted for $147.6 million, or 49.7% of the total segment revenues, for the year ended December 31, 2007. In addition to Valero Energy, we had a total of approximately 54 shippers for the year ended December 31, 2007, including integrated oil companies, refining companies, farm cooperatives and a railroad. No other customer accounted for greater than 10% of the total revenues of transportation segment for the year ended December 31, 2007.
Competition and Business Considerations
Because pipelines are generally the lowest cost method for intermediate and long-haul movement of refined petroleum products, our more significant competitors are common carrier and proprietary pipelines owned and operated by major integrated and large independent oil companies and other companies in the areas where we deliver products. Competition between common carrier pipelines is based primarily on transportation charges, quality of customer service and proximity
16
to end users. We believe high capital costs, tariff regulation, environmental considerations and problems in acquiring rights-of-way make it unlikely that other competing pipeline systems comparable in size and scope to our pipelines will be built in the near future, as long as our pipelines have available capacity to satisfy demand and our tariffs remain at economically reasonable levels.
The costs associated with transporting products from a loading terminal to end users limit the geographic size of the market that can be served economically by any terminal. Transportation to end users from our loading terminals is conducted primarily by trucking operations of unrelated third parties. Trucks may competitively deliver products in some of the areas served by our pipelines. However, trucking costs render that mode of transportation uncompetitive for longer hauls or larger volumes. We do not believe that trucks are, or will be, effective competition to our long-haul volumes over the long-term.
Our refined product pipelines within the Central West System and our crude oil pipelines are physically integrated with and principally serve refineries owned by Valero Energy. Additionally, we have entered into various agreements with Valero Energy governing the usage of these pipelines. As a result, we believe that we will not face significant competition for transportation services provided to the Valero Energy refineries we serve. Please read the disclosure contained in Note 14 of Notes to Consolidated Financial Statements in Item 8. “Financial Statements and Supplementary Data” for additional information on our agreements with Valero Energy.
The East and North Pipelines compete with an independent, regulated common carrier pipeline system owned by Magellan Midstream Partners, L.P. (Magellan), formerly the Williams Companies, Inc., that operates approximately 100 miles east of and parallel to the East Pipeline and in close proximity to the North Pipeline. The Magellan system is a substantially more extensive system than the East and North Pipelines. Competition with Magellan is based primarily on transportation charges, quality of customer service and proximity to end users. In addition, refined product pricing at either the origin or terminal point on a pipeline may outweigh transportation costs. Certain of the East Pipeline’s and the North Pipeline’s delivery terminals are in direct competition with Magellan’s terminals.
Competitors of the Ammonia Pipeline include another anhydrous ammonia pipeline that originates in Oklahoma and Texas and terminates in Iowa. The competing pipeline has the same Direct Application demand and weather issues as the Ammonia Pipeline but is restricted to domestically produced anhydrous ammonia. Midwest production barges, nitrogen fertilizer substitutes and railroads represent other forms of direct competition to the pipeline under certain market conditions.
ASPHALT AND FUELS MARKETING
Our asphalt and fuels marketing segment operations consist primarily of purchasing petroleum products for resale to third parties. As part of its operations, our asphalt and fuels marketing segment may utilize storage space in certain of our refined products terminals and terminals operated by third parties. The asphalt and fuels marketing segment may also obtain transportation services from our refined products pipelines and other third party providers. Generally, the storage and throughput rates charged by our storage segment to the asphalt and fuels marketing segment are consistent with rates charged to third parties. Because the majority of our pipelines are common carrier pipelines, the tariffs charged to the asphalt and fuels marketing segment from the transportation segment are based upon the published tariff applicable to all shippers.
We primarily market the following products:
| • | | Heavy fuels, including bunker fuel used to supply marine vessels and refinery feedstocks; |
| • | | Refined products consisting primarily of gasoline and distillates; and |
The operations of the asphalt and fuels marketing segment are meant to provide us the opportunity to generate additional margin while complementing the activities of our storage and transportation segments. Specifically, sales of bunker fuel occur from our terminal locations at St. Eustatius and Point Tupper where we also store bunker fuel for third parties. The strategic location of these two facilities and their storage capabilities provide us with a reliable supply of product and the ability to capture incremental sales margin. Additionally, we purchase gasoline, distillates, refinery feedstocks and asphalt to take advantage of arbitrage opportunities. Such opportunities can arise during contango markets (when the price for future deliveries exceeds current prices) or from geographic differences. During a contango market, we can utilize storage
17
at strategically located terminals, including our own terminals, to deliver products at favorable prices. Additionally, we may take advantage of geographic arbitrage opportunities by utilizing transportation and storage assets, including our own terminals and pipelines, to deliver products from one geographic region to another with more favorable pricing.
Since the operations of our asphalt and fuels marketing segment expose us to commodity price risk, we enter into derivative instruments to mitigate the effect of commodity price fluctuations. We record the fair value of our derivative instruments in our consolidated balance sheet, with the change in fair value recorded in earnings. The derivative instruments we use consist primarily of futures contracts and swaps traded on the NYMEX for the purposes of hedging the outright price risk of our physical inventory. However, not all of our derivative instruments qualify for hedge accounting treatment under United States generally accepted accounting principles. In such cases, changes in the fair values of the derivative instrument, which are included in cost of product sales, generally are offset, at least partially, by changes in the values of the hedged physical inventory. However, the market fluctuations in inventory are not recognized until the physical sale takes place, unless the market price of inventory falls below our cost. In such as circumstance, we reduce the value of our inventory to market immediately. Therefore, our results for a period may include the gain or loss related to the derivative instrument without including the offsetting effect of the hedged physical inventory, which could result in greater earnings volatility.
On a limited basis, we also enter into derivative commodity instruments based on our analysis of market conditions in order to profit from market fluctuations. These derivative instruments are financial positions entered into without underlying physical inventory and are not considered hedges. We record the mark-to-market adjustments resulting from these derivatives in revenues.
Competition and Business Considerations
In the sale of bunker fuel, we compete with ports offering bunker fuels to which, or from which, each vessel travels or are along the route of travel of the vessel. We also compete with bunker fuel delivery locations around the world. In the Western Hemisphere, alternative bunker fuel locations include ports on the U.S. East Coast and Gulf Coast and in Panama, Puerto Rico, the Bahamas, Aruba, Curacao and Halifax, Nova Scotia.
18
EMPLOYEES
Our operations are managed by the general partner of our general partner, NuStar GP, LLC. As of December 31, 2007, NuStar GP, LLC had 1,104 employees performing services for our U.S. operations. Certain of our wholly owned subsidiaries had 332 employees performing services for our international operations. We believe that NuStar GP, LLC and our subsidiaries each have satisfactory relationships with their employees.
RATE REGULATION
Several of our petroleum pipelines are interstate common carrier pipelines, which are subject to regulation by the FERC under the ICA and the Energy Policy Act of 1992 (the EP Act). The ICA and its implementing regulations give the FERC authority to regulate the rates charged for service on interstate common carrier pipelines and generally require the rates and practices of interstate oil pipelines to be just, reasonable and nondiscriminatory. The ICA also requires tariffs to be maintained on file with the FERC that set forth the rates it charges for providing transportation services on its interstate common carrier liquids pipelines as well as the rules and regulations governing these services. The EP Act deemed certain rates in effect prior to its passage to be just, reasonable and limited the circumstances under which a complaint can be made against such “grandfathered” rates. The EP Act and its implementing regulations also allow interstate common carrier oil pipelines to annually index their rates up to a prescribed ceiling level. In addition, the FERC retains cost-of-service ratemaking, market-based rates and settlement rates as alternatives to the indexing approach.
Our interstate anhydrous ammonia pipeline is subject to regulation by the STB under the current version of the ICA. The ICA and its implementing regulations give the STB authority to regulate the rates we charge for service on our ammonia pipeline and generally require that our rates and practices be just, reasonable and nondiscriminatory.
Additionally, the rates and practices for our intrastate common carrier pipelines are subject to regulation by state commissions in Colorado, Kansas, Louisiana, North Dakota and Texas. Although the applicable state statutes and regulations vary, they generally require that intrastate pipelines publish tariffs setting forth all rates, rules and regulations applying to intrastate service, and generally require that pipeline rates and practices be just, reasonable and nondiscriminatory. Shippers may also challenge our intrastate tariff rates and practices on our pipelines.
Neither the FERC nor the state commissions have investigated our rates or practices, and none of those rates are currently subject to challenge or complaint. We do not currently believe that it is likely that there will be a challenge to the tariffs on our petroleum products or crude oil pipelines by a current shipper that would materially affect our revenues or cash flows. In addition, Valero Energy is a significant shipper on many of our pipelines. Valero Energy has committed to refrain from challenging several of our petroleum products and crude oil tariffs until at least April 2008. Valero Energy has also agreed to be responsible for certain ICA liabilities with respect to activities or conduct occurring during periods prior to April 16, 2001. However, the FERC, the STB or a state regulatory commission could investigate our tariffs on their own motion or at the urging of a third party. Also, since our pipelines are common carrier pipelines, we may be required to accept new shippers who wish to transport in our pipelines and who could potentially decide to challenge our tariffs.
ENVIRONMENTAL AND SAFETY REGULATION
Our operations are subject to extensive federal, state and local environmental laws and regulations, including those relating to the discharge of materials into the environment, waste management and pollution prevention measures. Our operations are also subject to extensive federal and state health and safety laws and regulations, including those relating to pipeline safety. The principal environmental and safety risks associated with our operations relate to unauthorized emissions into the air, unauthorized releases into soil, surface water or groundwater and personal injury and property damage. Compliance with these environmental and safety laws, regulations and permits increases our capital expenditures and our overall cost of business, and violations of these laws, regulations and/or permits can result in significant civil and criminal liabilities, injunctions or other penalties.
We have adopted policies, practices and procedures in the areas of pollution control, pipeline integrity, operator qualifications, public relations and education, product safety, occupational health and the handling, storage, use and disposal of hazardous materials that are designed to prevent material environmental or other damage, to ensure the safety of our pipelines, our employees, the public and the environment and to limit the financial liability that could result from
19
such events. Future governmental action and regulatory initiatives could result in changes to expected operating permits and procedures, additional remedial actions or increased capital expenditures and operating costs that cannot be assessed with certainty at this time. In addition, contamination resulting from spills of crude oil and refined products occurs within the industry. Risks of additional costs and liabilities are inherent within the industry, and there can be no assurances that significant costs and liabilities will not be incurred in the future.
WATER
The Federal Water Pollution Control Act of 1972, as amended, also known as the Clean Water Act, and analogous or more stringent state statutes impose restrictions and strict controls regarding the discharge of pollutants into state waters or waters of the United States. The discharge of pollutants into state waters or waters of the United States is prohibited, except in accordance with the terms of a permit issued by applicable federal or state authorities. The Oil Pollution Act, enacted in 1990, amends provisions of the Clean Water Act as they pertain to prevention and response to oil spills. Spill prevention control and countermeasure requirements of the Clean Water Act and some state laws require the use of dikes and similar structures to help prevent contamination of state waters or waters of the United States in the event of an overflow or release.
AIR EMISSIONS
Our operations are subject to the Federal Clean Air Act, as amended, and analogous or more stringent state and local statutes. The Clean Air Act Amendments of 1990, along with more restrictive interpretations of the Clean Air Act, may result in the imposition over the next several years of certain pollution control requirements with respect to air emissions from the operations of our pipelines, storage tanks and terminals. The Environmental Protection Agency (EPA) has been developing, over a period of many years, regulations to implement these requirements, including the revisions to the fuel content requirement under Section 211 of the Clean Air Act tightening diesel fuel specifications and effectively eliminating the use of MTBE in gasoline. These revisions, as well as any new EPA regulations or requirements that may be imposed by state and local regulatory authorities, may require us or our customers to incur further capital expenditures over the next several years for air pollution control equipment in connection with maintaining or obtaining operating permits and approvals and addressing other air emission-related issues. Until such time as the new Clean Air Act requirements are completely implemented, we are unable to estimate the effect on our financial condition or results of operations or the amount and timing of such required expenditures. At this time, however, we do not believe that we will be materially affected by any such requirements.
The Kyoto Protocol to the United Nations Framework Convention on Climate Change became effective February 2005. Under the Protocol, participating nations are required to implement programs to reduce emissions of certain gases, generally referred to as greenhouse gases, which are suspected of contributing to global warming. The United States is not currently a participant in the Protocol. In November 2007, the Senate Subcommittee on Private Sector and Consumer Solutions to Global Warming and Wildlife Protection approved SB 2191, America’s Climate and Security Act of 2007, which would requirwe companies to scale back certain emissions to 2005 levels by 2012 and to 1990 levels by 2020. SB 2191 is currently before the Senate Environment and Public Works Committee. The state of California adopted the California Global Warming Solutions Act of 2006, which requires a 25% reduction in greenhouse gas emissions by 2020. This legislation requires the California Air Resources Board to adopt regulations by 2012 that limit emissions until an overall reduction of 25% from all omission sources in California is achieved by 2020. Recently, the California Air Resources Board announced its intention to have a proposed draft of its 1990 baseline and mandatory reporting regulation by mid 2008 and commence mandatory reporting of Green House Gas emissions by mid-2009. The state of New Mexico and states that are a part of the Western Climate Initiative are proposing similar regulations. New Jersey, has adopted legislation addressing greenhouse gas emissions from various sources, primarily power plants. The oil and natural gas industry is a direct source of greenhouse gas emissions, namely carbon dioxide and methane, and future restrictions on such emissions could have an impact on our future operations. It is not possible, at this time to estimate accurately how regulations to be adopted by the California Air Resources Board in 2012 or that may be adopted by other states to address greenhouse gas emissions would affect our business.
SOLID WASTE
We generate non-hazardous and minimal quantities of hazardous solid wastes that are subject to the requirements of the federal Resource Conservation and Recovery Act (RCRA) and analogous or more stringent state statutes. We are not currently required to comply with a substantial portion of RCRA requirements because our operations generate minimal
20
quantities of hazardous wastes. However, it is possible that additional wastes, which could include wastes currently generated during operations, will also be designated as “hazardous wastes.” Hazardous wastes are subject to more rigorous and costly disposal requirements than are non-hazardous wastes.
HAZARDOUS SUBSTANCES
The Comprehensive Environmental Response, Compensation and Liability Act, referred to as CERCLA and also known as Superfund, and analogous or more stringent state laws, imposes liability, without regard to fault or the legality of the original act, on some classes of persons that contributed to the release of a “hazardous substance” into the environment. These persons include the owner or operator of the site and entities that disposed or arranged for the disposal of the hazardous substances found at the site. CERCLA also authorizes the EPA and, in some instances, third parties to act in response to threats to the public health or the environment and to seek recovery from the responsible classes of persons for the costs that they incur. In the course of our ordinary operations, we may generate waste that falls within CERCLA’s definition of a “hazardous substance.”
We currently own or lease, and have in the past owned or leased, properties where hydrocarbons are being or have been handled. Although we have utilized operating and disposal practices that were standard in the industry at the time, hydrocarbons or other wastes may have been disposed of or released on or under the properties owned or leased by us or on or under other locations where these wastes have been taken for disposal. In addition, many of these properties have been operated by third parties whose treatment and disposal or release of hydrocarbons or other wastes was not under our control. These properties and wastes disposed thereon may be subject to CERCLA, RCRA and analogous state laws. Under these laws, we could be required to remove or remediate previously disposed wastes (including wastes disposed of or released by prior owners or operators), to clean up contaminated property (including contaminated groundwater) or to perform remedial operations to prevent future contamination. In addition, we may be exposed to joint and several liability under CERCLA for all or part of the costs required to clean up sites at which hazardous substances may have been disposed of or released into the environment.
Remediation of subsurface contamination is in process at many of our pipeline and terminal sites. Based on current investigative and remedial activities, we believe that the cost of these activities will not materially affect our financial condition or results of operations. Such costs, however, are often unpredictable and, therefore, there can be no assurances that the future costs will not become material.
PIPELINE INTEGRITY AND SAFETY
Our pipelines are subject to extensive federal and state laws and regulations governing pipeline integrity and safety. The federal Pipeline Safety Improvement Act of 2002 and its implementing regulations (collectively, PSIA) generally require pipeline operators to maintain qualification programs for key pipeline operating personnel, to review and update their existing pipeline safety public education programs, to provide information for the National Pipeline Mapping System, to maintain spill response plans, to conduct spill response training and to implement integrity management programs for pipelines that could affect high consequence areas (i.e., areas with concentrated populations, navigable waterways and other unusually sensitive areas). While compliance with PSIA and analogous or more stringent state laws may affect our capital expenditures and operating expenses, we believe that the cost of such compliance will not materially affect our competitive position and will not have a material effect on our financial condition or results of operations.
21