 Management Presentation – Investor Meetings February 2009 Exhibit 99.1 |
 This presentation contains certain estimates, predictions, projections, assumptions and other forward-looking statements that involve various risks and uncertainties. While these forward-looking statements, and any assumptions upon which they are based, are made in good faith and reflect our current judgment regarding the direction of our business, actual results will almost always vary, sometimes materially, from any estimates, predictions, projections, assumptions or other future performance suggested in this report. These forward-looking statements can generally be identified by the words "anticipates," "believes," "expects," "plans," "intends," "estimates," "forecasts," "budgets," "projects," "will," "could," "should," "may" and similar expressions. These statements reflect our current views with regard to future events and are subject to various risks, uncertainties and assumptions. For a discussion of certain of those risks, please read "Risk Factors" in Item 1A of both NuStar Energy L.P's and NuStar GP Holdings, LLC's respective annual reports on Form 10-K for the year ended December 31, 2007 and each entity’s subsequent quarterly reports as filed with the Securities and Exchange Commission. Forward Looking Statements 2 |
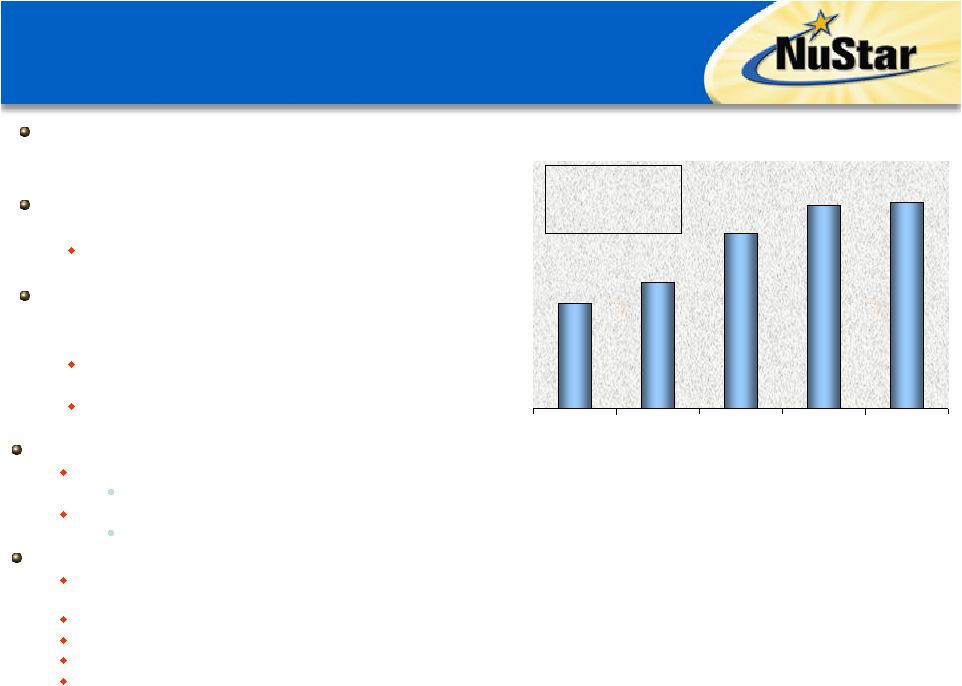
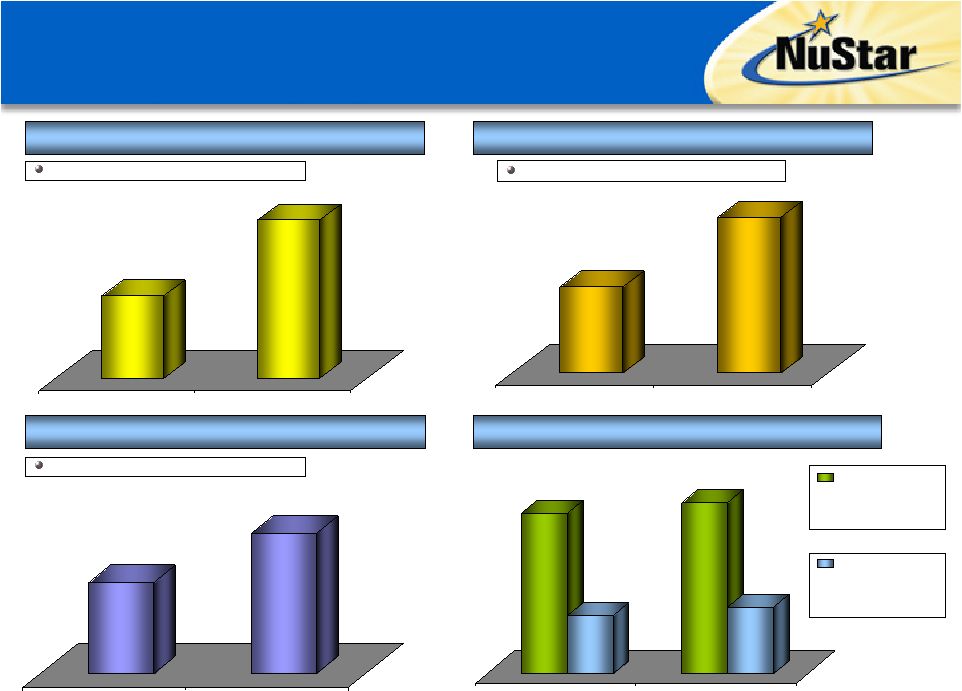 $221 $319 2007 2008 $353 $492 2007 2008 $2.74 $4.22 2007 2008 NS 2008 vs. 2007 Growth: ~7% Earnings Per LP Unit Distributable Cash Flow ($ in Millions) EBITDA ($ in Millions) Distribution per Unit 2008 A Record Year Financially Increase in Earnings Primarily Due to Contribution from Asphalt Operations and Growth Projects 54% Increase 2008 Actual Over 2007 Actual 44% Increase 2008 Actual Over 2007 Actual 3 NSH 2008 vs. 2007 Growth: ~15% $3.835 $1.38 $4.085 $1.58 2007 2008 39% Increase 2008 Actual Over 2007 Actual |
 NuStar Recognized in 2008 as One of the Best Places to Work in America 4 NuStar’s culture that encourages giving back to the community, treating every employee with respect and providing outstanding pay and benefits is a reflection of the awards received in 2008 Expect to be ranked on the Fortune 500 Listing for the first time ever based on record 2008 revenues of $4.8 billion – over 225% higher than 2007 |
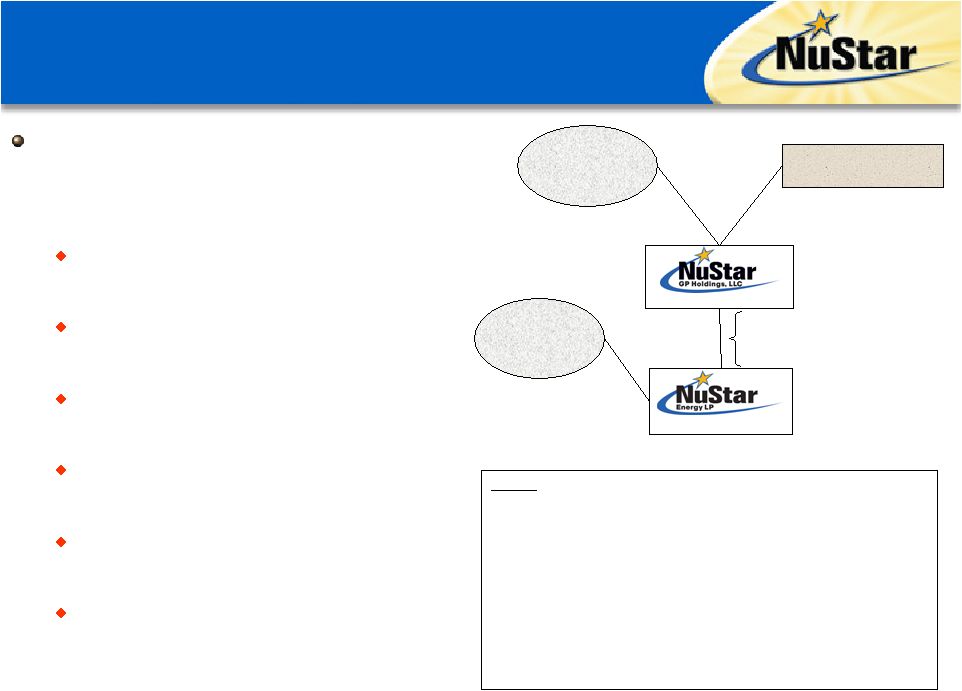 NuStar Energy L.P. is a leading publicly traded growth-oriented partnership (NYSE: NS) General partner owned by NuStar GP Holdings, LLC (NYSE: NSH) One of the largest independent petroleum pipeline and terminal operators in the U.S. One of the largest asphalt refiners and marketers in the U.S. Large and diverse asset footprint with operations in seven different countries Expect to be listed on the Fortune 500 for the first time ever based on 2008 results Experienced management team with substantial equity ownership NuStar Overview 5 NSNSH IPO Date: 4/16/2001 7/19/2006 Unit Price (2/4/09): $47.86 $18.20 Annual Distribution/Unit: $4.23 $1.72 Yield (2/4/09): 8.84% 9.45% Market Equity Capitalization: $2,606 million $774 million Enterprise Value: $4,456 million $779 million Total Assets (12/31/08): $4,460 million $573 million Debt/Capitalization (12/31/08): 46.2% n/a 83.8% Membership Interest 79.6% L.P. Interest Public Unitholders 35,669,951 NSH Units Public Unitholders 44,210,016 NS Units 16.2% Membership Interest 2.0% G.P. Interest 18.4% L.P. Interest Incentive Distribution Rights William E. Greehey 6,878,920 NSH Units NYSE: NSH NYSE: NS |
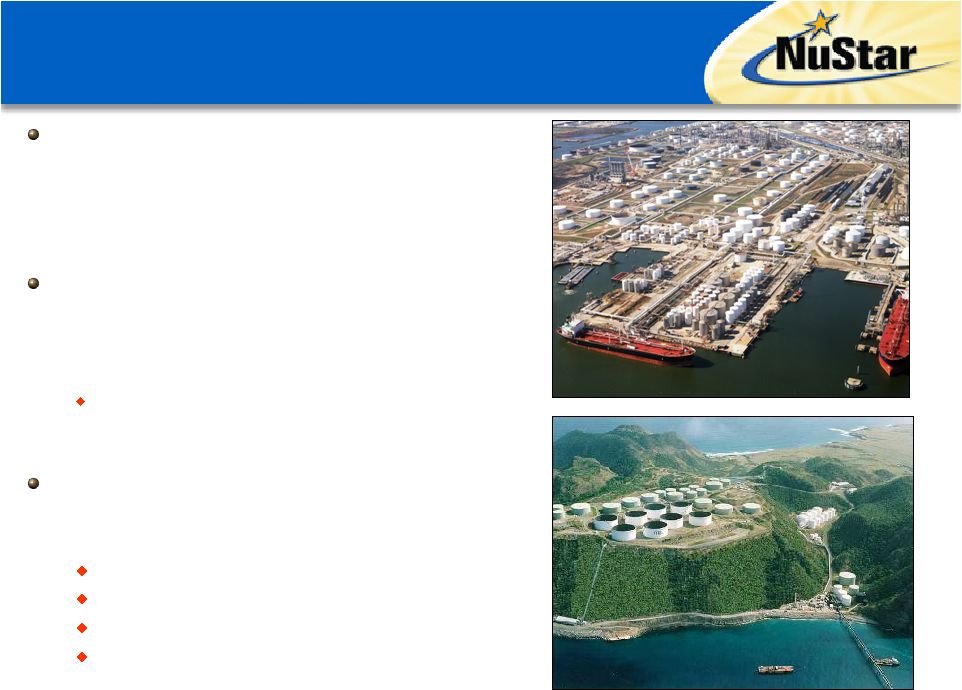
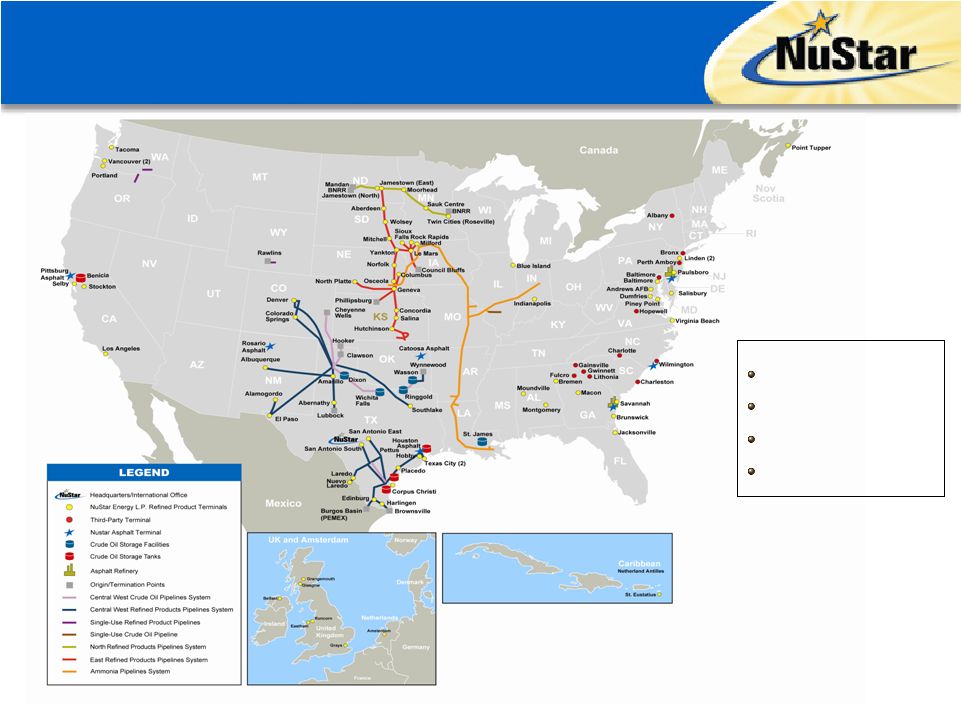 Assets Stats: 8,491 miles of crude oil and refined product pipelines 82 terminal facilities and four crude oil storage tank facilities Over 90 million barrels of storage capacity 2 asphalt refineries capable of processing 104,000 bpd of crude oil Asset Overview 6 |
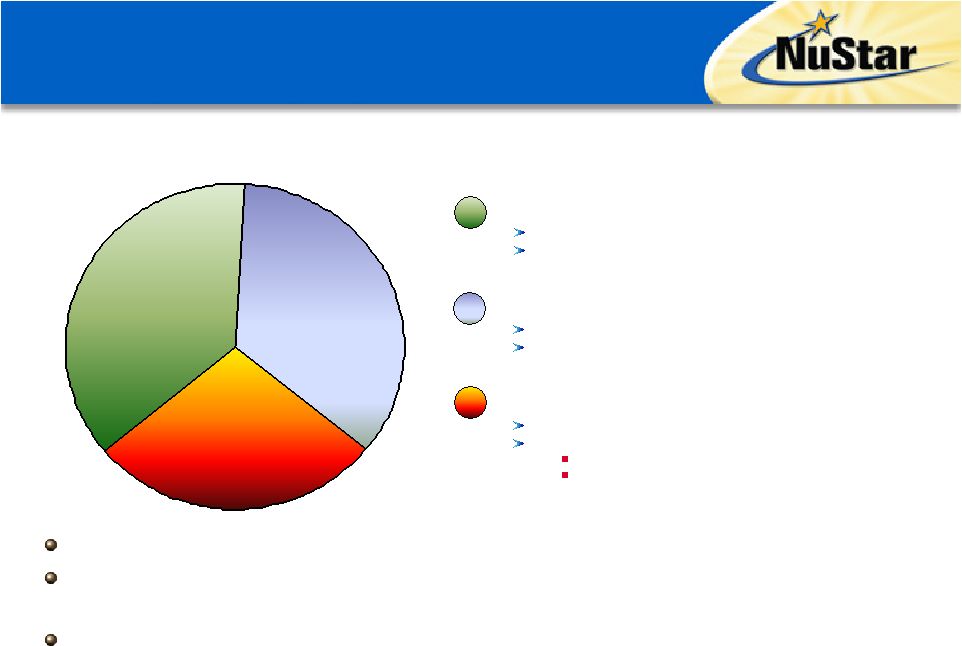 37% 35% 28% Percent of 2008 Segment Operating Income Diversification of operations provide various earnings streams and reduces risk Approximately 72% of NuStar Energy’s segment operating income in 2008 resulted from stable, fee-based operations Remainder of segment operating income related to margin-based asphalt and fuels marketing segment Storage (~37%) Transportation (~35%) Refined Product Terminals Crude Oil Storage Refined Product Pipelines Crude Oil Pipelines Asphalt & Fuels Marketing (~28%) Asphalt Fuels Marketing Product Supply, Wholesale and Fuel Oil Marketing Bunkering/Other Diversified Operations 7 |
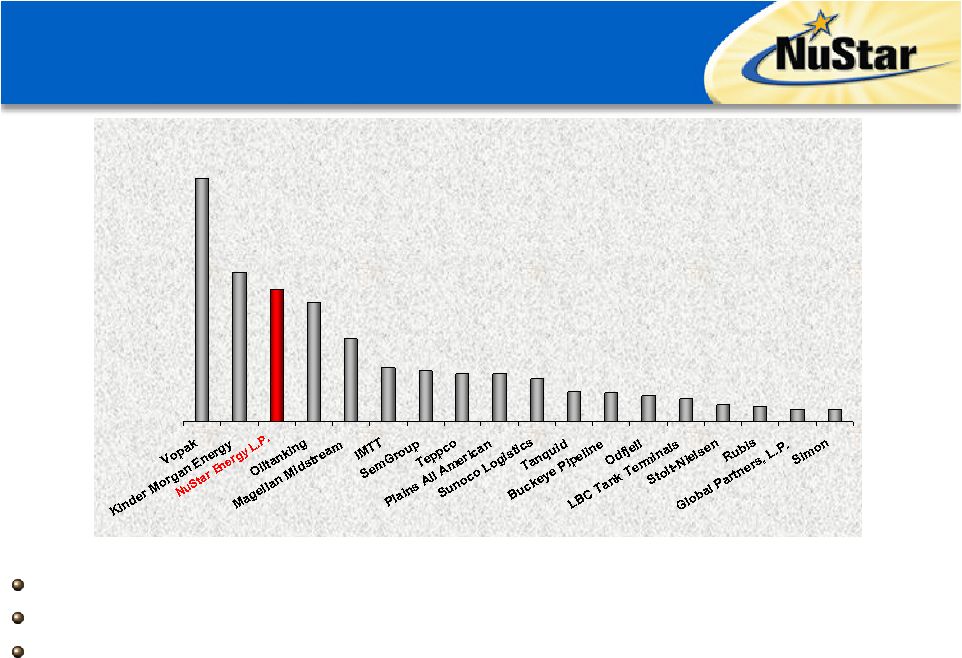 Independent Liquids Storage Capacity (Millions of Barrels) 8 8 10 12 16 18 20 21 29 33 33 35 37 57 82 91 103 167 Global Leader in Independent Liquids Storage NuStar is the third largest independent liquids terminal operator in the world The CITGO Asphalt Refining Co. acquisition added 4.8 million barrels of storage Finished with majority of expansion projects under our $400 million construction program, which contributed around 8.5 million barrels of incremental storage capacity Source: Company Websites & Management Presentations 8 |
 9 2009 Outlook – Transportation Segment Comparable volumes and a tariff increase of around 7.5% effective July 1, 2009, should contribute higher operating income in 2009 over 2008 Despite a sluggish economy, expect transportation pipeline volumes will be comparable in 2009 versus 2008 New pipeline business, an anticipated reduced refinery maintenance schedule and a new pipeline project expected to start-up in June should help NuStar achieve these volumes in 2009 Although not included in the current forecast, expect a gradual recovery in refined product demand by the second half of 2009 due to a combination of lower fuels prices and an improving economy Heavy planned refinery maintenance, primarily at the Valero Energy refineries we serve, expected to negatively impact first quarter 2009 pipeline volumes Expect a much lighter maintenance schedule for the remainder of the year |
 10 2009 Outlook – Storage Segment Storage segment should also see better results in 2009 as we benefit from a full year’s contribution from the projects completed under our $400 million construction program, or an incremental $23 million of operating income Lower throughputs in our storage segment, primarily due to heavy planned refinery maintenance at Valero Energy refineries we serve, should not have a material impact to our results 90% of our revenues in the storage segment come from leased assets, so, 10% lower throughputs only represent 1% of the storage segments revenue Expect to benefit from contango markets to the extent that certain of our storage contract revenues are up for renewal: 29% - 1 Year or Less 28% - 1 to 3 Years 23% - 3 to 5 Years 19% - Greater than 5 Years |
 11 2009 Outlook – Asphalt Operations Continue to expect the 2009 EBITDA contribution from asphalt operations to be in the same range previously communicated in the fourth quarter 2008 earnings conference call Expect a higher margin per barrel, but slightly lower sales volumes (excluding the proposed economic stimulus package) for the full year of 2009 OPEC has cut crude oil supplies globally to meet lower demand NuStar has received notification from PDVSA that it will cut two 300,000 barrel Boscan cargoes in February and two in March Although we have not received notification of any cuts beyond March 2009, our forecast reflects further reductions Cuts are not expected to have a material impact to our financial results in 2009, as NuStar is able to run alternative asphaltic crudes with similar netbacks Continue to expect first quarter 2009 earnings to be in the range of 25 to 50 cents per unit |
 2005 2006 2007 2008 2009 Highway construction expenditures are dependent upon spending by federal, state and local governments and from the private sector Current federal highway funding bill passed in August 2005 (i.e. SAFETEA-LU) fully funded through 2009 Bipartisan victory on recent $8 billion payback to the Highway Trust Fund, which fully funds the account through 2009 Federal funds typically require states to match some portion of the federal contribution as an incentive to spend more on road construction States are expecting comparable funding in 2009 as they received in 2008 States will lose matched federal funding if they don’t spend money on highways Status of U.S. Highway Funding Stimulus Package Expected to Benefit Asphalt Demand 12 *Source: NAPA - National Asphalt Pavement Association Annual Federal Highway Funding Under SAFETEA-LU ($ in billions)* $37.1 $38.1 $40.4 $41.8 $42.0 ~$200 billion in total Highway Funding SAFETEA-LU expires at the end of FY 2009 Congress to begin debate on how to fund the reauthorization in early 2009 Chairman of the House Transportation and Infrastructure Committee seeking $300-500 Billion Funding options Federal gas tax increase, indexing user fees for inflation adjustment, bonds, tolls Proposed economic stimulus package expected to augment highway funding Package could include an additional $45 billion, or more, in transportation infrastructure investments; $30 billion of which would be dedicated to highway and bridge projects Funds must be obligated between 90 – 180 days 100% federal financing– no matching criteria If states don’t use funding, they lose it Could increase asphalt demand by as much as 10%, or more |
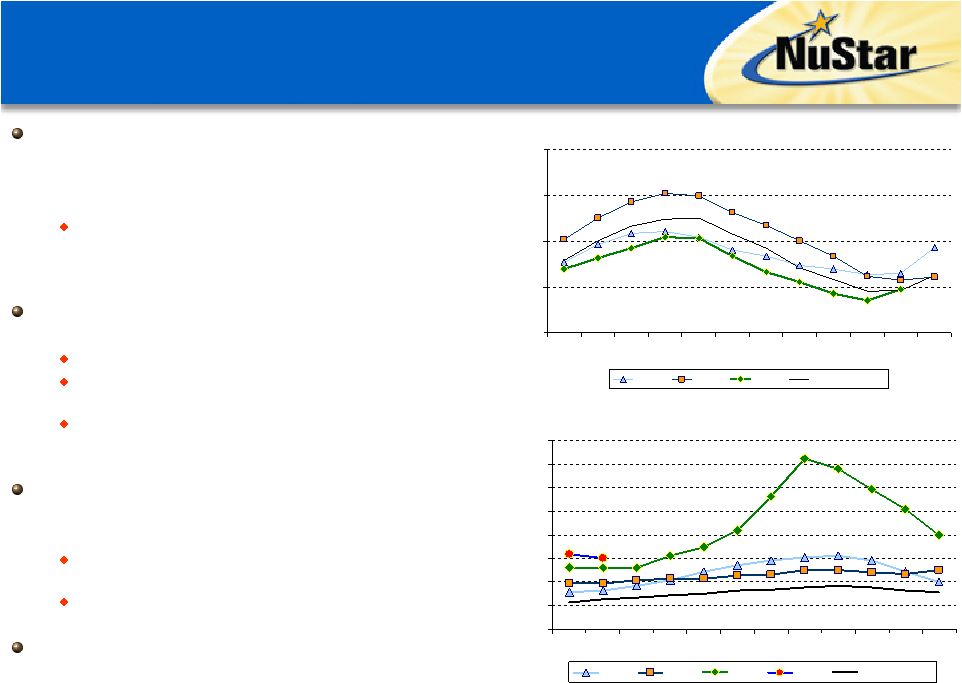 U.S. asphalt demand in 2008 has remained below last year’s levels; however, reduction in supply has offset negative impact of reduction in demand resulting in higher asphalt prices and margins Although 2008 YTD U.S. demand was lower by around 16% compared to 2007 YTD, U.S. asphalt production was lower by around 10% and imports were down by nearly 44% resulting in inventories being down over 9% Continue to expect the same factors that caused the asphalt markets to be tight in 2008 to be present in 2009 Competitor in PADD I has discontinued producing asphalt Venezuela has not exported any asphalt to the U.S. since January 2008 Lower utilization rates due to weak fuels margins have resulted in refinery run cuts in the U.S. Mid-West/Mid- Continent regions Expect asphalt demand to be slightly lower in 2009 versus 2008, excluding the impact of the stimulus package Second stimulus package that funds additional highway projects could benefit asphalt demand in 2009 and beyond Lower crude oil and lower asphalt prices could also be positive for asphalt demand Coker projects should continue to impact asphalt markets in 2010 and 2011 as they come online U.S. Asphalt Inventories (000 barrels) Source of data for graphs: U.S. Energy Information Administration and New Jersey Department of Transportation Asphalt Fundamentals NJ Asphalt Cement Price Index ($ per short ton) 13 10,000 20,000 30,000 40,000 50,000 Jan Feb Mar Apr May June July Aug Sept Oct Nov Dec 2006 2007 2008 5-Year Avg. $100 $200 $300 $400 $500 $600 $700 $800 $900 Jan Feb Mar Apr May Jun Jul Aug Sep Oct Nov Dec 2006 2007 2008 2009 5-Year Avg. |
 Current U.S. Coker Capacity Projects: (Includes firm and probable expansions) Impact of Coker Projects Still Intact Despite Some Projects Delayed/Cancelled Source: PIRA Refinery Database; Company Information 14 Most of the coker projects on our list are either already complete or have a high likelihood of completion (i.e. firm projects) The few projects that have been either cancelled or delayed were small in scope and/or were at the back end of our list Additional coker capacity additions of around 604,000 barrels per day only slightly lower than the 650,000 barrels per day previously expected Asphalt markets have already begun to tighten and asphalt margins should continue to increase as more coker projects are completed No. Refinery PADD Announced Coker Capacity (Mbpd) Announced Crude Capacity (Mbpd) Start Up Date Status 1 Coffeyville Resources - Coffeyville, Kansas II 2.0 8.0 1Q 2007 Complete 2 BP - Toledo, Ohio II 2.0 10.0 1Q 2007 Complete 3 Valero - Port Arthur, Texas III 25.0 75.0 1Q 2007 Complete 4 Frontier - Cheyenne, Wyoming IV 4.3 - 3Q 2007 Complete 5 Chevron - El Segundo, California V 15.0 - 4Q 2007 Complete 6 Sinclair – Sinclair, Wyoming IV 20.0 11.0 4Q 2007 Complete 7 ConocoPhillips - Borger, Texas III 25.0 - 4Q 2007 Complete 8 Cenex - Laurel, Montana IV 15.0 - 1Q 2008 Complete 9 Frontier - El Dorado, Kansas II 3.0 11.0 2Q 2008 Complete 10 Tesoro - Martinez, California V 4.4 - 2Q 2008 Complete 11 ConocoPhillips - Los Angeles, California V 5.0 - 4Q 2008 Complete 12 Sinclair - Tulsa, Oklahoma II 28.5 - 2Q 2009 Firm 13 Marathon - Garyville, Louisiana III 44.0 180.0 4Q 2009 Firm 14 Valero - St. Charles, Lousiana III 10.0 45.0 1Q 2010 Firm 15 Hunt - Tuscaloosa, Alabama III 18.5 15.0 3Q 2010 Firm 16 ConocoPhillips - Wood River, Illinois II 65.0 55.0 1Q 2011 Firm 17 Atofina Petrochemicals Inc.- Port Arthur, Texas III 50.0 - 1Q 2011 Firm 18 BP/Husky - Toledo, Ohio II 25.0 - 1Q 2011 Firm 19 Motiva - Port Arthur, Texas III 40.0 325.0 1Q 2011 Firm 20 Pasadena Refining System - Pasadena, Texas III 29.0 100.0 2Q 2011 Probable 21 BP - Whiting, Indiana II 95.0 30.0 1Q 2012 Firm 22 ConocoPhillips - Borger, Texas III 20.0 34.0 2Q 2012 Probable 23 Marathon - Detroit, Michigan II 28.0 13.0 2Q 2012 Probable 24 ConocoPhillips - Wood River, Illinois II 30.0 25.0 2Q 2016 Probable Total US Expansion 603.7 937.0 |
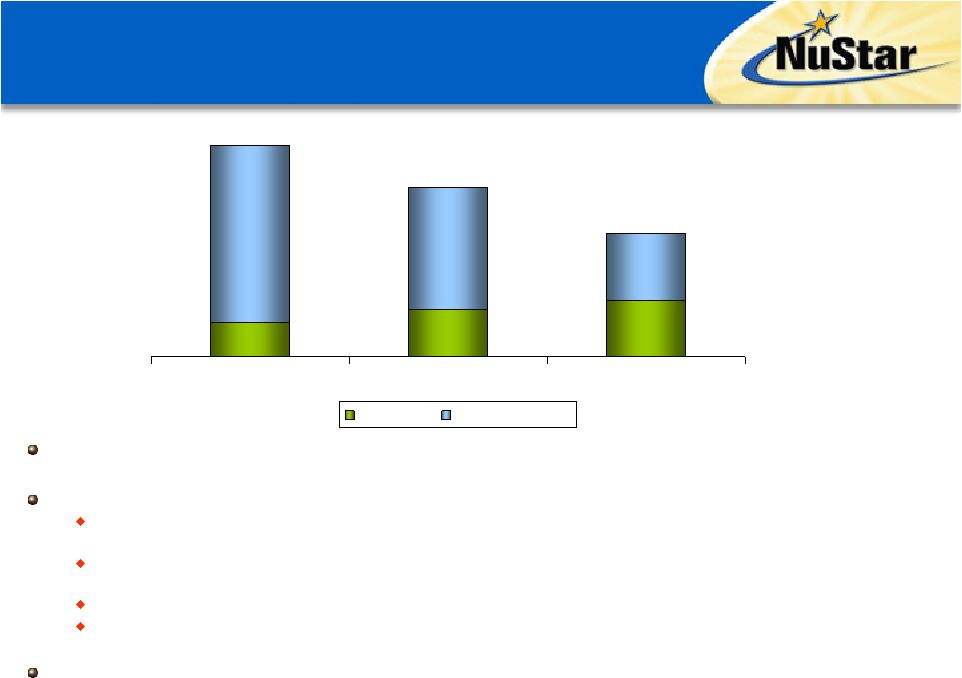 2007 2008 2009 Reliability Strategic/Other 15 Capital Spending Continue to conservatively target around $80 million of strategic growth capital spending for 2009 in light of challenging economic and capital market conditions Major 2009 strategic projects include: Approximately $15 million on pipeline projects on NuStar’s East pipeline, ammonia pipeline and at our St. James facility to increase the capacity and flexibility of our two pipeline and to accommodate new and existing customers Approximately $7 million to finish up tank expansion projects at NuStar’s Texas City and Amsterdam facilities as part of our $400 million construction program Approximately $30 million at our Texas City facility to improve and upgrade it to make a world class terminal Approximately $14.5 million at our Paulsboro and Savannah asphalt facilities to improve crude flexibility and rates, improve the energy efficiency of the refineries and increase the production of polymer modified asphalt Cash flows from operations and over $600 million of availability under $1.2 billion revolving credit facility expected to finance capital requirements and distribution payments in 2009 (Dollars in Millions) $251 $211 $40 $202 $55 $147 $145 - $150 ~$80 ~$65 - $70 |
 One of the largest independent petroleum pipeline and terminal liquids operators in the world Provides world class pipeline and terminalling services to some of the world’s largest crude oil producers, integrated oil companies, chemical companies, oil traders and refineries Pipeline and storage businesses somewhat recession proof One of the largest asphalt refiners and marketers in the U.S. Expect to benefit from better-than-historic asphalt margins as supply continues to tighten Proposed economic stimulus package could provide significant increase in U.S. asphalt demand Large and diversified asset footprint in the U.S. and internationally allows for ample acquisition and internal growth opportunities Despite lower expected strategic capital for 2009, continue to have plenty of opportunities to grow the business over the next few years One of a few partnerships to have a large international presence One of only a few partnerships with incentive distribution rights capped at 25% Lower cost of capital provides NuStar Energy L.P. a competitive advantage Investment grade rating and demonstrated access to capital in difficult markets Experienced management team with substantial ownership and insider buying Higher earnings expected in 2009 despite weak global economic outlook Investment Highlights 16 |
 Questions & Answers |
 Appendix 18 |
 Reconciliation of Net Income to EBITDA to Distributable Cash Flow 19 (a) Distributable cash flow excludes the impact of mark-to-market gains and losses which arise from valuing certain derivative contracts. NuStar Energy L.P. utilizes two financial measures, EBITDA and distributable cash flow, which are not defined in United States generally accepted accounting principles. Management uses these financial measures because they are widely accepted financial indicators used by investors to compare partnership performance. In addition, management believes that these measures provide investors an enhanced perspective of the operating performance of the partnership's assets and the cash that the business is generating. Neither EBITDA nor distributable cash flow are intended to represent cash flows for the period, nor are they presented as an alternative to net income. They should not be considered in isolation or as substitutes for a measure of performance prepared in accordance with United States generally accepted accounting principles. (Dollars in Thousands) Year Ended December 31, 2008 2007 Net income 254,018 $ 150,298 $ Plus interest expense, net 90,818 76,516 Plus income tax expense 11,006 11,448 Plus depreciation and amortization expense 135,709 114,293 EBITDA 491,551 352,555 Less equity earnings from joint ventures (8,030) (6,833) Less interest expense, net (90,818) (76,516) Less reliability capital expenditures (55,669) (40,337) Less income tax expense (11,006) (11,448) Plus distributions from joint ventures 2,835 544 Mark-to-market impact on hedge transactions (a) (9,784) 3,131 Distributable cash flow 319,079 $ 221,096 $ |