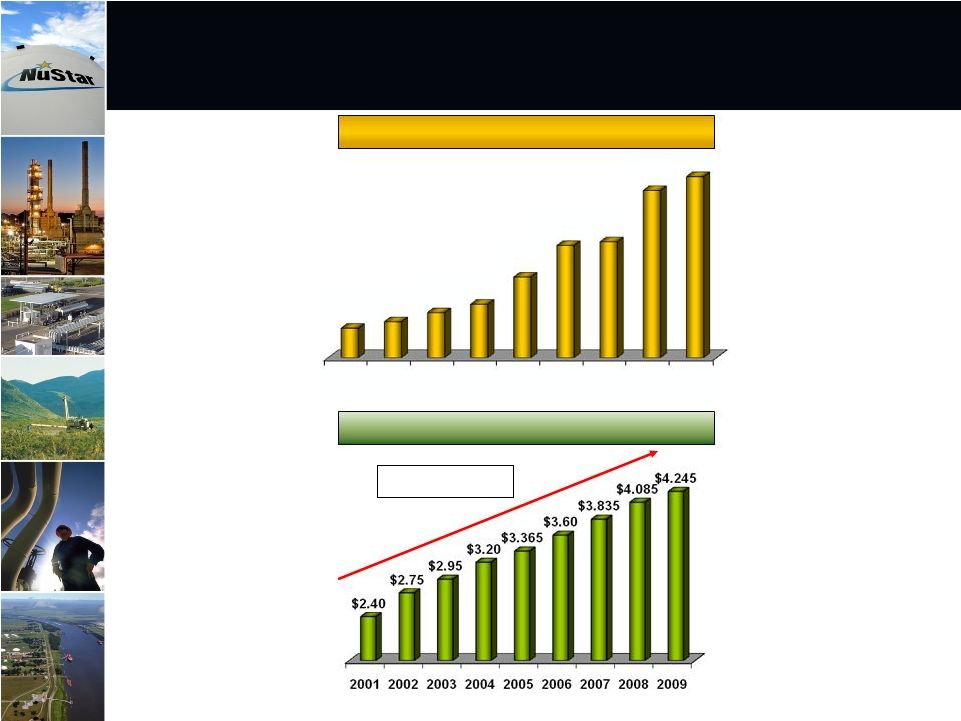
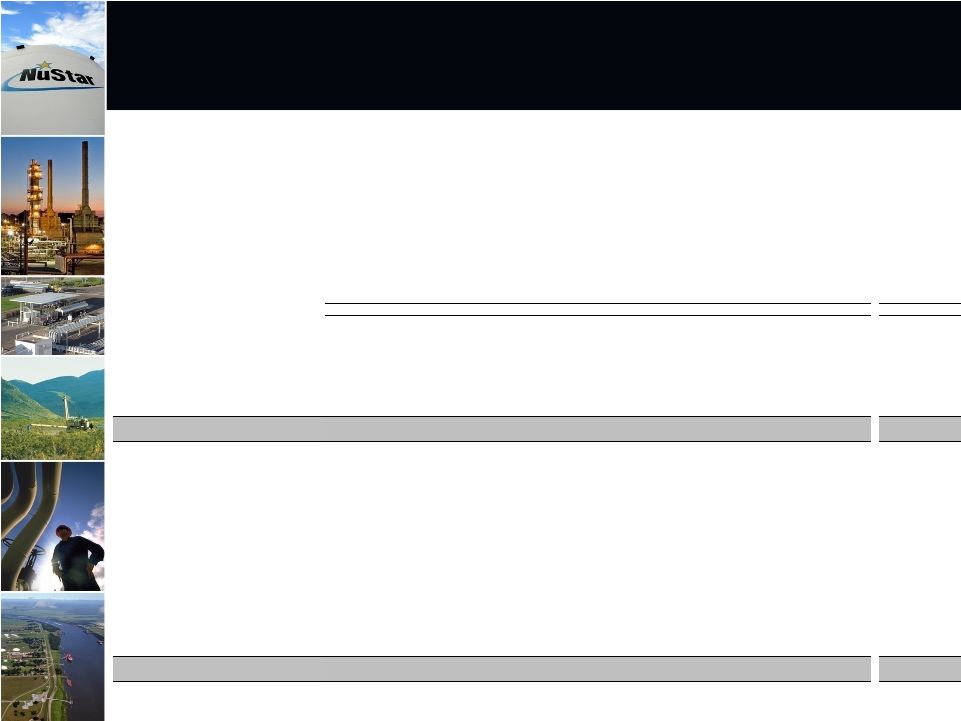
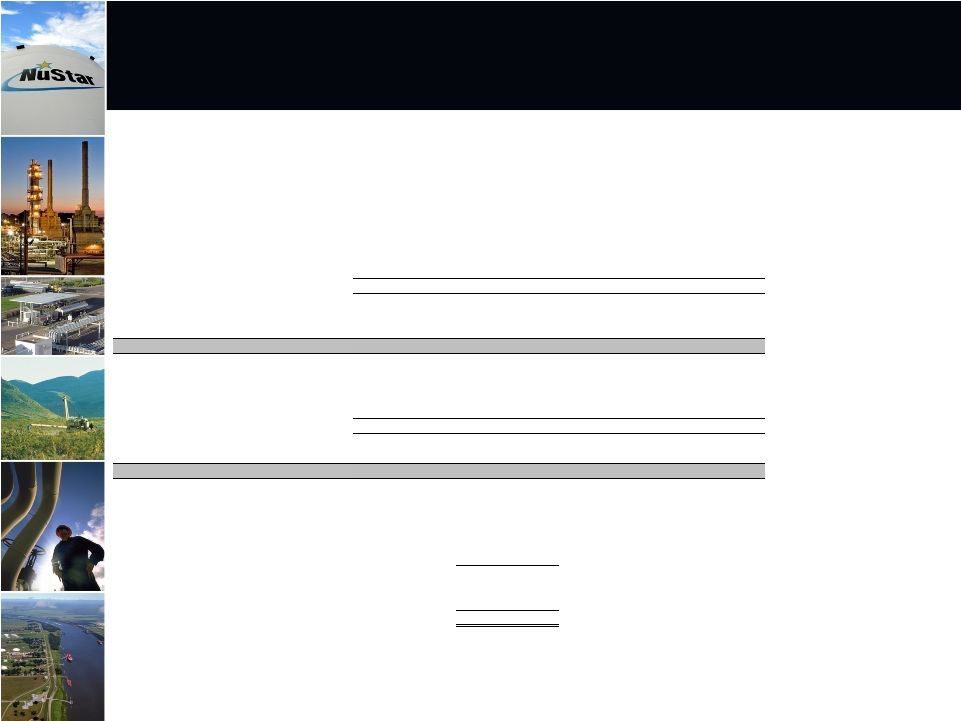
(Unaudited, Dollars in Thousands) 24 Reconciliation of Non-GAAP Financial Information: EBITDA and Distributable Cash Flow Year Ended December 31, Quarter Ended March 31, 2001 2002 2003 2004 2005 2006 2007 2008 2009 2010 Net income $ 45,873 $ 55,143 $ 69,593 $ 78,418 $ 107,675 $ 149,906 $ 150,298 $ 254,018 $ 224,875 $ 19,703 Plus interest expense, net 3,811 4,880 15,860 20,950 41,388 66,266 76,516 90,818 79,384 18,586 Plus income tax expense - 395 - - 4,713 5,861 11,448 11,006 10,531 4,800 Plus depreciation and amortization expense 13,390 16,440 26,267 33,149 64,895 100,266 114,293 135,709 145,743 37,929 EBITDA 63,074 76,858 111,720 132,517 218,671 322,299 352,555 491,551 460,533 Less equity earnings from joint ventures 3,179 3,188 2,416 1,344 2,319 5,882 6,833 8,030 9,615 3,015 Less interest expense, net 3,811 4,880 15,860 20,950 41,388 66,266 76,516 90,818 79,384 18,586 Less reliability capital expenditures 2,786 3,943 10,353 9,701 23,707 35,803 40,337 55,669 45,163 12,355 Less income tax expense - - - - 4,713 5,861 11,448 11,006 10,531 4,800 Plus mark-to-market impact on hedge transactions - - - - - - 3,131 (9,784) 19,970 (12,613) Plus charges reimbursed by general partner - - - - - 575 - - - - Plus distributions from joint ventures 2,874 3,590 2,803 1,373 4,657 5,141 544 2,835 9,700 2,400 Plus other non-cash items - - - - 2,672 - - - - - Distributable cash flow $ 56,172 $ 68,437 $ 85,894 $ 101,895 $ 153,873 $ 214,203 $ 221,096 $ 319,079 NuStar Energy L.P. utilizes two financial measures, EBITDA and distributable cash flow, which are not defined in United States generally accepted accounting principles (GAAP). Management uses these financial measures because they are a widely accepted financial indicators used by investors to compare partnership performance. In addition, management believes that these measures provide investors an enhanced perspective of the operating performance of the partnership's assets and the cash that the business is generating. Neither EBITDA nor distributable cash flow are intended to represent cash flows for the period, nor are they presented as an alternative to net income. They should not be considered in isolation or as a substitute for a measure of performance prepared in accordance with GAAP. The following is a reconciliation of net income to EBITDA and distributable cash flow: 81,018 $ 32,049 $ 345,510 Note: 2005 and 2006 distributable cash flow and EBITDA are from continuing operations. |
