![]() Exhibit 99.1 |
![]() Statements contained in this presentation that state management’s expectations or predictions of the future are forward-looking statements intended to be covered by the safe harbor provisions of the Securities Act of 1933 and the Securities Exchange Act of 1934. The words “believe,” “expect,” “should,” “targeting,” “estimates,” and other similar expressions identify forward-looking statements. It is important to note that actual results could differ materially from those projected in such forward-looking statements. We undertake no duty to update any forward-looking statement to conform the statement to actual results or changes in the company’s expectations. For more information concerning factors that could cause actual results to differ from those expressed or forecasted, see NuStar Energy L.P.’s annual report on Form 10-K and quarterly reports on Form 10-Q, filed with the Securities and Exchange Commission and available on NuStar’s website at www.nustarenergy.com. 2 Forward Looking Statements |
![]() Agenda Topic Presenter* Page # NuStar Overview (15 minutes) Curt Anastasio 4 Storage Segment Overview (15 minutes) Danny Oliver 13 Transportation Segment Overview (10 minutes) Danny Oliver 22 Asphalt Industry Outlook (5 minutes) Mike Hoeltzel 28 Asphalt & Fuels Marketing Overview (15 Minutes) Paul Brattlof 32 Acquisition & Divestiture Opportunities (10 minutes) Mike Hoeltzel 39 Continuous Improvement & Operations (5 minutes) Rick Bluntzer 44 Finance Overview (5 minutes) Steve Blank 49 Texas City Terminal Overview (15 minutes) Kyle Oppliger 55 Closing Remarks Curt Anastasio 67 Q&A Break/Board Bus for Texas City Terminal * Bios of management team can be found in the appendix starting on page 68 3 UPDATE TIMES |
![]() NuStar Overview NuStar Overview Curt Anastasio Curt Anastasio CEO & President CEO & President 4 |
![]() When we created the 2010 budget in the Fall of 2009, we knew that 2010 would be a “transitional” year because our decision in the Fall of 2008 to cut 2009 growth capex meant less projects coming on-line in 2010. Nonetheless, we entered 2010 with a budget that assumed improved profitability in our Asphalt business and some incremental EBITDA from several internal growth projects. Those earnings improvements were expected to be partially offset by reduced pipeline tariffs in the last half of 2010 and increased power costs due to rising natural gas prices. Through June 2010 actual earnings results exceeded budget targets due to better throughputs and power costs that were only modestly higher As we entered the 3rd quarter it became apparent that asphalt demand was substantially less than we had anticipated. As a result, earnings guidance for the last half of 2010 and the full year 2010 was reduced for asphalt operations. Federal Stimulus spending in 2010 will be close to expected levels Demand in the private sector, primarily residential and commercial real estate, is much lower than expected In late August, NS started seeing stronger results in our Transportation and Asphalt & Fuels Marketing businesses. 3rd quarter throughput on our refined products and ammonia pipelines were higher than anticipated Revenue enhancement plans and cost control initiatives improved earnings in the Asphalt business Tight asphalt supply in the Upper Midwest and Northeast due to heavy crude oil supply issues and improving crack spreads also contributed to improved margins Based on this improved outlook, we expect 2010 EBITDA for NS to be $20 to $40 million higher than 2009. 45 2010 EBITDA Expected to Exceed 2009 Results…. Stronger than Expected Results in the 2nd Half of the Year have led to an Improved Outlook for 2010 |
![]() In May we closed on the acquisition of three storage terminals in Mobile County, Alabama. By December we expect to close the acquisition of a majority, operating interest in two terminals in Mersin, Turkey. Total purchase price for both acquisitions is ~$100 million. Ten internal growth projects totaling an investment of approximately $135 million, which are expected to generate an additional $35-$40 million of annual EBITDA going forward, will be completed this year. Larger EBITDA projects (St. Eustatius project and Texas City project) will not be on-line until 4 th Quarter of 2010. Accessed the Capital markets twice during the year to improve our balance sheet and increase our revolver availability Issued $240 million of equity in May. Proceeds were used to finance the May terminal acquisition and to improve our balance sheet by paying off a portion of the borrowings outstanding under our revolver. Issued $450 million of Senior Notes in August with a coupon of 4.8%. Proceeds were used to pay down a significant portion of our revolver. Continued to maintain an outstanding safety record and obtain results far superior to our industry peers. Obtained VPP Star Site status in our Central West Region South. Continue to be ranked nationally, regionally and locally as one of the top places to work in America. 56 During 2010 NuStar has grown through Acquisitions and Internal Growth Projects…Improved the Condition of our Balance Sheet…Continued to Receive Recognition for Outstanding Safety Results and being a Great Place to Work |
![]() EBITDA ($ in Millions) 7 Weaker than expected asphalt and fuels marketing results caused 2009 EBITDA to drop. 2010 EBITDA expected to exceed 2009 levels by $20 to $40 million. All of our segments should perform better than last year. 2011 EBITDA projected to be higher than 2010. Internal growth projects in storage segment alone should increase 2011 EBITDA by $30 to $40 million EBITDA Expected to restart growth trend in 2010 and continue into 2011 2002 2003 2004 2005 2006 2007 2008 2009 $77 $112 $133 $219 $322 $353 $492 $461 |
![]() Majority of 2011 Internal Growth Capital Will to be spent in the Storage Segment 8 2011 Total CAPEX CAPEX Asphalt & Fuels Marketing Paulsboro Alternative Crude Project $11 $11 Storage: St. James Crude Oil Expansion-Phase 1 $88 $120 St. James Crude Oil Expansion-Phase 2 $23 $129 St. Eustatius Tank Expansion & Conversion for Diesel Storage$27 $45 Jacksonville Terminal Expansion $10 $25 Turkey Terminal Expansions (Giresun & Mersin) $20 $20 Denver Terminal Expansion $11 $13 Transportation Pettus South Eagle Ford Crude $5 $8 Corporate New Office Building $54 $95 Major Projects >$5 Million: Annual Internal Growth Spending By Business Segment (Dollars in Millions) $146 $222 $325 $164 $22 $4 |
![]() 2001 2002 2003 2004 2005 2006 2007 2008 2009 $2.40 $2.75 $2.95 $3.20 $3.365 $3.60 $3.835 $4.085 $4.245 * * Based on NS annualized distribution of $0.60 per unit in 2001 9 NS increased the 3 rd quarter 2010 distribution to $1.075 per unit 2010 distribution will total $4.28 per unit if $1.075 per unit distribution held flat in 4 th quarter Distributions have been increased every year since in 2001 NS Distribution increased at a 7.4% CAGR since IPO |
![]() 2006 2007 2008 2009 $1.28 $1.38 $1.58 $1.73 * ** Based on NSH annualized distribution of $0.32 per unit in 2006 ** 10 NSH Distribution increased at a 10.6% CAGR since IPO NSH increased the 3 rd quarter 2010 distribution to $0.48 per unit 2010 distribution will total $1.87 per unit if $0.48 per unit distribution held flat in 4 th quarter. Total 2010 distribution ~8% higher than total 2009 distribution. 2010 distribution increases driven mostly by higher general partner distributions and higher incentive distribution rights paid to general partner as a result of NS November 2009 and May 2010 equity offerings |
![]() Safety and Environmental Performance in 2010 Continues to Exceed Industry Benchmarks NuStar Injury Incident Frequency Rates *Through September 2010 11 * NuStar 2010 Safety and Environmental Awards Independent Liquid Terminals Association Safety Excellence Award NPRA Distinguished Safety Award Savannah Refinery Perfect Record Award - National Safety Council Million Hours Award - National Safety Council Safety Leadership Award - National Safety Council Occupational Excellence Award- National Safety Council Texas General Land Office-2009 Oil Spill Prevention & Response Program Award Industry Benchmarks 1.49 1.36 0.76 0.31 0.72 0.14 0.19 0.15 0.00 0.07 2006 2007 2008 2009 2010 TRIR LTIR TRIR 2006 2007 2008 Refineries 1.4 1.6 1.1 Pipelines 2.2 2.0 1.6 Terminals 5.6 5.8 6.4 LTIR 2006 2007 2008 Refineries 0.5 0.3 0.2 Pipelines 0.6 0.5 0.5 Terminals 1.1 1.7 1.8 TRIR – Total Recordable Incidents Rate LTIR – Lost Time Incidents Rate |
![]() Recognized for our significant growth over the past few years Ranked No. 1 among large companies for growth, Fast Track Awards, San Antonio Business Journal Placed 2 nd among the Top 50 Fastest Growing Energy Companies in the World, Platts Earned recognition on a national, state and local level for being a great place to work Recently named #1 large employer in San Antonio Strengthened organization by adding key management team members and reorganizing a couple of departments Improved service to internal customers through changes in the IS and HR departments Positioned organization so it’s better able to evaluate, acquire and integrate new assets Expanded training programs to improve employees’ skills and develop managers’ leadership abilities NuStar Continues to be a World-Class Organization Earned a reputation as a great corporate citizen in all of our communities in just three years Set new records for charitable giving and volunteerism to the United Way, Haven for Hope and countless charities in our communities 12 |
![]() Storage Segment Overview Storage Segment Overview Danny Oliver Danny Oliver Senior VP – Senior VP – Marketing & Business Marketing & Business Development Development 13 |
![]() 2010 Storage Segment Results Should be Improved over 2009.. 2011 EBITDA Expected to be Higher than 2010 due to Benefits from Internal Growth Program 14 Storage Segment EBITDA (in Millions) 2010 Summary Results should be $14-$18 million higher than 2009. Storage tank renewals and escalations increased revenues significantly during the year. Two acquisitions should be closed during the year. (Mobile, AL. and Mersin, Turkey) St. Eustatius terminal reconfiguration project and Texas City Strategic Ike project to be completed in Dec. 2010. 2011 Outlook Demand for storage should remain strong Internal growth projects should increase EBITDA by $30 to $40 million St. James storage expansion project to be completed in August 2011 through January 2012. Full year of EBITDA from two acquisitions, St. Eustatius and Texas City 2010 projects. 2006 2007 2008 2009 $162 $177 $208 $242 |
![]() Demand for Storage Continues to be strong… 33% of Existing customer storage leases have remaining lives of three years or more 15 Storage Contract Renewals (% of Revenues) NuStar continues to enter into storage agreements with large credit worthy customers Current customers and potential new customers continue to approach us about constructing new tankage at several of our terminal locations. Storage rate increases not expected to be as large in 2011 as the rate increases we saw in 2010. < 1 Year 1 to 3 Years 3 to 5 Years > 5 Years 28% 39% 21% 12% |
![]() 16 Plan to continue to optimize and grow our existing storage asset base St. James, LA. Terminal Expansion St. Eustatius Terminal Expansion Denver Terminal Expansion Jacksonville Terminal Expansion Five internal growth storage projects costing from $10 million to $130 million per project will be completed in 2011 through 2013 |
![]() 17 Phase 1 - Third Party Crude Oil Storage Construct 3.1 million barrels of crude oil storage for trading companies Projected CAPEX of $110 to $130 million, with average annual EBITDA of $15 to $25 million Expected in-service August 2011 through January 2012 Phase 2 - Third Party Crude Oil Storage Project in early planning stages Should be similar in size to Phase 1 project Could grow in size based on customer demand Expected in-service in 2013 St. James, Louisiana terminal expansion will occur in two phases |
![]() 18 Conversion Project Convert 600,000 barrels of storage from fuel oil to distillate service to capture higher storage fees Expansion Project Construct 900,000 barrels of new storage for distillate service Interested customers include several national oil companies Combined conversion and expansion projected CAPEX of $40 to $50 million, with average annual EBITDA of $5 to $10 million Expected in-service by February 2012 (Conversion Project) and September 2012 (Expansion Project) St. Eustatius project will convert existing tanks and construct new tanks for distillate service |
![]() 19 Jacksonville Storage Expansion Construct 500,000 barrels of clean products storage to support a major refiner’s expansion Projected CAPEX of $20 to $30 million, with average annual EBITDA of $5 to 10 million Expected in-service by March 2012 Denver Terminal Expansion Construct a new truck loading rack to serve a Denver refiner’s refined product output and attract incremental volumes from other new customers Projected CAPEX of $10 to $15 million, with average annual EBITDA of $1 to $5 million Expected in-service by January 2012 Jacksonville expansion constructs new tankage …Denver expansion constructs new loading rack |
![]() 20 Linden Fuel Oil Conversion (Joint Venture Terminal) Convert two, 320,000 barrel tanks currently in fuel oil service to clean light products service to capture higher storage fees and reduce anticipated maintenance capital and operating expenses Projected CAPEX $1 to $5 million, with average annual EBITDA of $1 to $3 million EBITDA will be included in equity in earnings of the Joint Venture Expected in-service by February 2011 Selby Truck Rack Expansion Add an additional loading position to the existing loading rack to support additional light clean products and ethanol throughput Projected CAPEX $2 to $5 million, with average annual EBITDA of $3 to $5 million Expected in-service by June 2011 South Texas Valley System Ethanol Convert Edinburg and Harlingen Terminals to ethanol blending, and create a Rio Grande Valley ethanol distribution Hub at Harlingen Terminal Projected CAPEX $4 to $8 million, with average annual EBITDA of $2 to $4 million Expected in-service by July 2011 Additional projects with spend of less than $10 million planned…should be in service by end of 2011 |
![]() 21 Texas City, TX Expansion Additional St. Eustatius Expansion Project Linden, NJ Terminal Expansion Selby, CA Terminal Expansion Portland, OR Terminal Expansion Numerous storage projects being evaluated… several could be approved in 2011 |
![]() Transportation Segment Overview Transportation Segment Overview Danny Oliver Danny Oliver Senior VP – Senior VP – Marketing & Business Marketing & Business Development Development 22 |
![]() 2006 2007 2008 2009 $170 $176 $186 $190 2010 Transportation Segment Results Should be Improved over 2009.. 2011 EBITDA Expected to be slightly less than 2010 23 Transportation Segment EBITDA (in Millions) 2010 Summary Results $5-$10 million higher than 2009. Throughputs higher than 2009. Improving economy and customer turnaround delayed into 2011. July 1, 2010 tariff decrease 1.3%. Tariffs were 7.6% higher than 2009 for the first half of 2010. 2011 Outlook $1-$5 million of additional EBITDA from internal growth projects. Recently announced Eagle Ford shale crude project to be completed in mid-2011. Revised FERC Escalator in place July 1, 2011. Tariffs budgeted up 4.5%. (Assumed 1.3% FERC Escalator) Throughputs budgeted down 1.6%. Segment EBITDA down slightly in 2011. |
![]() 24 Transportation Segment Assets in close proximity to key Shale Formations Shale Development Strategy There are four key shale developments located in NuStar’s Mid-Continent and Gulf Coast regions, including the Bakken, Niobrara, Barnett, and Eagle Ford developments Our strategy is to optimize and grow the existing asset base, and maximize the value of the assets located in or near shale developments |
![]() 25 Companies agreed to a pipeline connection and capacity lease agreement Allows NuStar to reactivate a 60 mile pipeline that has been idle since November 2005 Project connects our existing Pettus, Texas to Corpus Christi pipeline segment to Koch’s existing pipeline Initial capacity agreement for 30MBPD, could grow to 50MBPD Project cost $5 to $10 million, with a guaranteed return Expected in-service date mid-2011 Recently announced agreement with Koch Pipeline first NuStar project in Eagle Ford Shale |
![]() 26 NuStar has other South Texas transportation and storage assets that could serve to provide pipeline, storage, and marine facilities for Eagle Ford production To maximize the value of the assets located in the Eagle Ford Shale region, NuStar is currently engaged in discussions with other companies to develop logistics solutions that would create value higher than is currently being captured Could see additional deals closed in 2011 around the Eagle Ford Shale Pursuing additional projects in the Eagle Ford Shale |
![]() 27 Clawson to McKee Pipeline Expansion planned for 2011 Increase capacity of the Clawson to McKee crude oil pipeline by 6,000 barrels per day to deliver additional regional crude oil production to customer’s McKee refinery Projected CAPEX of $1 to $3 million, with average annual EBITDA of almost $ 1 million Expected in-service by July 2011 Projects being evaluated: San Antonio, TX Expansion Southlake System Service Conversion Colorado crude gathering, and Southlake and Ardmore crude delivery systems Bakken Shale Propane to North System Terminals Additional projects planned or being evaluated in the Transportation Segment |
![]() Asphalt Industry Outlook Asphalt Industry Outlook Mike Hoeltzel Mike Hoeltzel Senior VP – Senior VP – Corporate Development Corporate Development 28 |
![]() 29 U.S. Asphalt Supply Outlook Continues to be Shaped by New Cokers During 2011-2013 Lower Coker utilization rates have been positive for asphalt margins In the 2003-2006 “Golden Age of Refining,” heavy crude supply exceeded the ability of Cokers to convert to light products During this period, asphalt sold at a slight premium to its fuel oil blending value – well below Coker yield values Starting in 2007, new Cokers combined with declining heavy crude (primarily Mexican Maya) resulted in sparing of less efficient Cokers U.S. Coker utilization dropped from 83% in 2006 to recent 72% level (August 2009 through July 2010) Despite asphalt demand destruction, asphalt prices have averaged 30-40% of Coker yield values vs. fuel oil blending value A significant volume of current PADD 2 asphalt production will be consumed by new Cokers at Wood River, Whiting and Detroit by late 2012 Midwest region will transition from a net exporter to a net importer from adjacent regions Imports from East Coast and Gulf Coast areas represent the logical supply sources to make up this shortfall Existing NuStar refineries can cover a portion of this shortfall 2010 NuStar crude runs are 58,000 bpd vs. nameplate capacity of 104,000 bpd Remaining shortfall satisfied from various sources: New or restarted on-purpose asphalt refineries Imports from Caribbean, European or Canadian refiners that can redirect production from fuel oil Further sparing of Coker capacity, diverting heavy crude to asphalt production in fuels refineries Shortfall expected to drive asphalt margins toward Coker yield values |
![]() Start-up Dates for most of the Coker Projects have not changed significantly 30 Announced Capacity MBPD No. Refinery PADD Coker Crude Start Up Status Previous Time-line 1 Cenex - Laurel, Montana IV 15.0 - 1Q 2008 Complete 2 Frontier - El Dorado, Kansas II 3.0 11.0 2Q 2008 Complete 3 Tesoro - Martinez, CA V 4.4 - 2Q 2008 Complete 4 ConocoPhillips - LA, CA V 5.0 - 4Q 2008 Complete 5 Marathon - Garyville, Louisiana III 44.0 180.0 1Q 2010 Complete Previous 4Q2009 6 Hunt - Tuscaloosa, Alabama III 18.5 15.0 4Q 2010 Firm Previous 3Q2010 7 ConocoP - Wood River, IL II 65.0 55.0 2Q 2011 Firm Previous 1Q011 8 Atofina - Port Arthur, Texas III 50.0 - 1Q 2011 Firm 9 BP - Whiting, Indiana II 95.0 30.0 1Q 2012 Firm 10 Motiva - Port Arthur, Texas III 95.0 325.0 3Q 2012 Firm Previous 4Q 2010 11 Marathon - Detroit, Michigan II 28.0 13.0 2012 2nd Half Firm Total US Expansion 422.9 629.0 Expansions through 2009 27.4 11.0 Firm Expansions 2010-2013 395.5 618.0 Highlighted facilities with asphalt production capabilities |
![]() 31 Asphalt Business Environment is Challenging in 2011 Before Significantly Improving in 2012+ 2011 Outlook Early year asphalt supply/demand balance will mirror 2010 as demand remains depressed and fuels refinery throughputs and asphalt production are on par with 2010 Expect slight uptick in asphalt demand, particularly related to residential construction as housing starts begin to recover from the recession Tightening of supply/demand balance is expected; mid-year start up of Conoco Wood River Coker can provide an opportunity for improved asphalt margins late in year Export opportunities will be comparable to 2010 with primary focus on stable demand in Caribbean and South American markets 2012 Outlook Asphalt supply/demand balance will tighten further as demand recovers and fuels refinery asphalt production shrinks with full year impact of Conoco Wood River Coker Additional reduction in asphalt supply is expected with start up of BP Whiting and Marathon Detroit Cokers Wholesale asphalt pricing is expected to achieve a higher percentage of Coker yield value Export opportunities are expected to improve with tightening global supply/demand balance New asphalt suppliers are expected to be positioning to enter market 2013-2015 Outlook Asphalt supply will continue to tighten as demand recovers with U.S. economic recovery and continued moderate growth in private residential asphalt demand market Fuels refinery asphalt production will reflect full year impacts of BP Whiting and Marathon Detroit Coker projects Although wholesale asphalt pricing should continue to achieve a high percentage of Coker yield value, this may taper off with increased Western Canadian heavy crude production Expect new asphalt suppliers to enter market |
![]() Asphalt & Fuels Marketing Overview Asphalt & Fuels Marketing Overview Paul Brattlof Paul Brattlof Senior VP – Senior VP – Supply & Trading Supply & Trading 32 |
![]() $3.78 $8.78 $6.37 Improved Earnings in Bunkering, Heavy Fuel, Product and Crude Trading Businesses Should Improve Segment in 2010…Segment Should See Slightly Improved Results in 2011 Asphalt & Fuels Marketing U.S. East Coast Product Margin ($ per barrel) 33 2009 Actual 2008 Actual 2000-2007 Average 2010 Summary Asphalt results expected to be comparable to 2009. Due to weak demand in the residential and commercial real estate markets, private sector industry asphalt demand was down substantially in 2010 Higher refinery margins increased refinery utilization rates higher than expected, causing VTB and asphalt supply to increase during the year. During the 3 quarter, pipeline disruptions of Canadian crude reduced heavy crude runs in the Northeast reducing asphalt supply. However, the Fuels Marketing portion of segment will be $25 to $35 million higher than 2009. Increased Bunker Marketing earnings are due to the consistent activity at St. Eustatius and higher sales volumes and increased margins from our Texas City facility. Fuel Oil Trading business also at Texas City, expected to contribute to year over year increase by blending supply for Bunker Marketing group 2011 Outlook Tighter Asphalt supply in the last half of 2011, due to Conoco Wood River coker coming on-line, should cause asphalt operations EBITDA to be improved. Other operations in this segment should realize comparable results to 2010. EBITDA (MM$) 2006 2007 2008 2009 $27 $22 $37 $10 $90 $70 Asphalt Fuels Marketing $127 $80 rd |
![]() 34 Supply Initiatives: Address Crude Availability/Price and Asphalt Supply Cost Working to Diversify our Crude Slate from Dependence on Venezuelan crudes Current PDV contract ends in the first quarter of 2015 We are in the process of negotiating a contract to secure future volume of heavy asphaltic crude from non-Venezuelan source Mid-Continent and Gulf Coast Asphalt Marketing dependent on purchases of finished asphalt and asphalt component blending Strategy is to negotiate asphalt off-take agreement with regional suppliers to reduce supply cost and assure availability |
![]() 35 Product Initiatives: Develop Alliances with Emulsion Customers and Specialty Product Suppliers to Increase Maintenance Product Sales NuStar product mix is historically weighted with Hot Mix Asphalt products (new construction) versus Emulsion products (maintenance) Downturn in Private/Commercial markets relative to Public Spending since 2005 has resulted in lower hot mix sales relative to maintenance products Private and Commercial paving markets are primarily hot mix asphalt Public Highway spending is shifting toward maintenance products We are developing alliances to increase our sales of Emulsions and specialty maintenance products Recent alliance with Road Science (RS) is a major step towards increasing sales of specialty maintenance products Initiatives active to increase sales with regional emulsion and maintenance customers in all market areas |
![]() Heavy Oil Trading – Texas City Rail Blending Hub has become dependable outlet for Midwest Refiners Market Update In our first year of operation at Texas City, the Domestic Heavy Oil Gathering Strategy is on pace to meet 2010 goals even in the current challenging margin environment We started slow as refinery utilization rates in 4Q09 and 1Q10 averaged 81.4% keeping VTB supply tight. The 2Q10 and 3Q10 utilization rates were over 87% increasing VTB supply and margins, full year 2011 rates are projected to be over 86% Currently buying product from 20 out of 34 identified refiners in the Midwest and Rockies, becoming a reliable and dependable outlet for their production Most of the Heavy Oil bought is blended into Bunker Fuel and sold internally to our Bunker Marketing Group at Texas City; the remainder is sold into the Houston area spot market 36 Source: Energy Information Administration |
![]() Market Update Currently selling 1,300 m bbls per month of bunkers from 4 locations: St. Eustatius 800 m bbls per month plus 180 m bbls per month Bulk Pt. Tupper 80 m bbls per month Texas City 350 m bbls per month Los Angeles 150 m bbls per month On July 1 st new 1% Low Sulfur was required for all Sulfur Emission Control Areas (SECA) mainly in areas around Europe and in U.S. waters We are seeing incremental demand in St.Eustatius and Texas City where we can make both High and Low Sulfur grades available Overall demand is up 3% over last year but showing up mainly at the larger ports Small ports are still seeing less traffic Bunker Marketing – 2010 Looks to be 2 nd Best Year Ever St. Eustatius Texas City Pt Tupper Los Angeles 37 |
![]() Crude Trading – Continue Expansion of Manifest Rail Gathering System at St. James Market Update St. James is a Hub Terminal located in the center of the Gulf Coast domestic crude trading and blending market Since beginning Bakken Crude Oil rail gathering operations at St. James in May: Through August, sold 4,000 barrels per day of Bakken Beginning in September, we will upgrade Heavy Louisiana Sweet (HLS) by blending with Bakken and sell as Light Louisiana Sweet (LLS) 38 |
![]() Acquisition and Divestiture Opportunities Acquisition and Divestiture Opportunities Mike Hoeltzel Mike Hoeltzel Senior VP – Senior VP – Corporate Development Corporate Development 39 |
![]() 40 Upon Projected November Closing, Acquired Assets in Turkey Provide Platform for Internal Growth Turkey Geopolitical Highlights Major constitutional referendum was approved September 12, 2010 Further shifts Turkey to a western-style democratic system Turkey’s military’s empowerment weakened Potential now for full rewrite of current constitution in 2011 Recognized candidate for full EU membership in 1999 Began process for admission into the EU in 2005 Expectation is full EU member status by 2015 NATO member and strong U.S. ally Projected 6% to 7% GDP growth per annum Joint Venture (JV) Overview NuStar entered into a $50-$60 million JV agreement with S-Oil and Aves Oil, two Turkish companies The JV will own 100% of two terminals in Mersin and land in Giresun and Ceyhan NuStar will own 75% of the JV and will operate the terminals Both terminals connect via pipeline to an offshore platform (SAVKA) 5 km off the Turkish coastline The JV will own 67% of SAVKA Growth Opportunities Expansion project under development at Mersin Expands existing storage by about 70 percent Potential to tie into NATO Pipeline Provides access to markets for military fuels New terminal at Giresun 37 acre site with access to Black Sea ports 200,000 barrel fuel oil terminal under development Second phase build-out to 1.9 million barrels under evaluation New terminal at Ceyhan Ceyhan is the destination for pipelines delivering crude from northern Iraq and the Caspian area to the Mediterranean 173 acre property is well-suited for building up to 6.3 million barrels of storage and marine jetty |
![]() 41 Adjacent oil terminals in Mersin, Turkey (100% owned by the JV) One terminal built in 2003, other completed this year Combined sites of approximately 26 acres 1.35 million barrels of storage Five pipelines to SAVKA docks Each terminal has truck racks to serve local light products market SAVKA (67% owned by JV) Fixed platform 5 km off the coast of Turkey Can handle up to two Aframax size vessels (80,000 dwt each) simultaneously Maximum draft of 12.8 meters (39 feet) Started operations in April 2010 Acquisition includes Two Terminals in Mersin, Turkey |
![]() 42 Ongoing Acquisition Strategy to Focus on Large Fee-Based Acquisitions Our primary targets are fee-based acquisitions to add immediate accretion to distributable cash flow with minimum margin volatility Domestic opportunities include pipeline and storage assets that are synergistic with current assets We continue to evaluate international expansion in hub storage locations Primary target is Amsterdam-Rotterdam-Antwerp (“ARA”) region Acquisition in Turkey provides synergies for further expansion in Mediterranean and Middle East We are looking at expanding Caribbean presence in locations in shipping lanes that are expanding by changing trade flows Increasing crude oil production from Brazil may provide storage and bunkering opportunities Increased bunker demand from expansion of Panama Canal |
![]() Continuous Improvement in Operations Continuous Improvement in Operations Rick Bluntzer Rick Bluntzer Senior VP – Senior VP – Operations Operations 43 |
![]() 44 Operational Improvement & Stewardship Safety and Environmental Attained OSHA’s Voluntary Protection Program (VPP) Star Status for the Central West Region Additional VPP compliance audits scheduled throughout 2011 in each region and the Paulsboro Refinery Continue Process Safety Management (PSM) implementation system wide Improve our overall emergency response and incident command capabilities Implement “Safety Behavioral Awareness” training programs Ensure operating and environmental permit compliance through audit programs Continue refinement of our pipeline and tank integrity management program Continue spill prevention and mitigation programs |
![]() 45 Operations Stewardship & Continuous Improvement Reliability Continue to identify and improve on equipment bad actors program Progression of the IMP program; third generation tool runs, allows for better integrity analysis and development of a proactive improvement plan Adhere to API 650 and 653 guidelines and inspection plan Evaluate current Preventive Maintenance Program to ensure schedule compliance and effectiveness Improve cathodic protection with equipment upgrades, enhanced monitoring program and frequencies Enhanced Pipeline Leak Detection project for Control Center in progress Implement full Distributed Controls Systems (DCS) at both refineries; optimize margins and energy efficiency and improves operational reliability and troubleshooting |
![]() 46 Transportation Continuous Improvement & EBITDA Initiatives Crude Oil Transportation 2010 spot freight market rates increased slightly, but continued to be favorable for charters Average 2010 base freight rate = $1.85/bbl vs. 2009 average of $1.46/bbl Time charter update Time charter rates have remained at the low levels reached in late 2009 with minimal activity 2010 fleet strategy was to monitor and potentially charter one Panamax and one Aframax vessel 2011 strategy will be modified to fit changing long term crude sourcing Reduce fleet size, if new crude contracts are set up to purchase on delivered basis Potential to look at specialized vessel(s) to meet current port restrictions Will continue to monitor spot vs. time charter rates Over the long term time charters have opportunity for significant annual freight cost savings ($1.25 million) Current spot and time charter rates at 10 year lows Time charter rates are currently in excess of spot rate charter rate by $5,000-$10,000/day Freight market expected to improve with increase oil demand in 2011 Strategy to lock in longer rate due to multi year lows and achieve maximum upside benefit |
![]() 47 Demurrage Maintain focus on rebillable demurrage Continued biannual meetings to settle claims Implement demurrage reduction projects at Texas City for intermediates Work with Texas City Operations and Supply and Marketing to identify issues Explore options for loading bunker barges on less used berths Back cast performance of Paulsboro demurrage reduction project after construction completion Continue integration of rail car fleet across commercial department business lines Expand and develop fleet requirements for existing new commercial trade flows Texas City Fuel Oil Blending St. James Crude Oil blending to include unit train operations Continue to bring on younger/more efficient cars into the fleet on East Coast Transportation Continuous Improvement & EBITDA Initiatives |
![]() Finance Overview Finance Overview Steve Blank Steve Blank Senior VP – Senior VP – CFO & Treasurer CFO & Treasurer 48 |
![]() Since November of 2009 NuStar has issued $529 million of equity $289 million in November 2009 and $240 million in May 2010 Proceeds were used to pay off borrowings under the Revolver and fund terminal acquisitions Issued $450 million of Senior Notes in August 2010 Notes issued at a 4.8% coupon Proceeds used to pay off borrowings under the Revolver Notes swapped to floating to maintain 50/50 fixed to floating rate debt structure To date swaps have also minimized negative carry associated with bonds by approximately 2.5% Entered into $500 million of forward starting interest rate swaps in 3 rd Qtr. 2010 Swaps relate to approximately 60% of our 2012 and 2013 senior note maturities Locked in 3.34% average 10 year treasury rates for 2012 and 2013 maturities Issued $150 million of Go Zone Bonds during 2010 Bonds are tax-exempt Municipal bonds issued by St. James Parish Louisiana Proceeds will be used to finance a portion of the St. James storage expansion project NuStar took Advantage of the Open Equity Capital Markets and the Strong Bond Market in late 2009 and 2010 49 |
![]() 50 9/30/10 Revolver Availability NuStar Revolver Availability has increased due to Equity Issuances and Senior Note Issuance - Credit Ratings and Metrics have Improved as a Result Total Bank Credit $1,210 Less: Borrowings (138) Letters of Credit Go Zone Financing (157) Other (10) Revolver Availability $905 Standard & Poor’s: BBB- (Stable Outlook) Moody’s: Baa3 (Stable Outlook) Fitch: BBB- (Stable Outlook) Debt/EBITDA (9/30/10): 4.6x Debt/Capitalization (9/30/10): 42.5% Credit Ratings/Metrics (Dollars in Millions) 5.0x Revolver Debt/EBITDA covenant limits true Revolver availability to ~$200 million at 9/30/10 All three Rating Agencies upgraded NuStar to Stable Outlook from Negative Outlook during 2010 |
![]() $1.2 billion Credit Facility $138 NuStar Logistics Notes (4.80%) 452 NuStar Logistics Notes (7.65%) 349 NuStar Logistics Notes (6.875%) 104 NuStar Logistics Notes (6.05%) 239 NuStar Pipeline Notes(5.875%) 256 NuStar Pipeline Notes (7.75%) 261 Other Debt 192 Total Debt $1,991 (Dollars in Millions) No Significant Debt Maturities Until 2012 2010 $0.8 2011 $0.8 2012 $536* 2013 $496 2014 $0 Thereafter $957 * Primarily includes maturity of $138 million revolver balance and $366 million of senior notes 9/30/10 Debt Structure 9/30/10 Debt Structure Maturities 51 No significant debt maturities until 2012 at which time the revolver and some senior notes become due New Credit Revolver terms and pricing seem to be improving as economy improves Current plan is to hold off closing on a new Revolver until 2012 |
![]() 52 All Three Segments see EBITDA growth in 2010….Total NuStar EBITDA should be higher in 2011 EBITDA Guidance Summary Transportation up $5 to $10 million in 2010. Down slightly in 2011. Storage up $14 to $18 million in 2010. Internal growth projects should add $30 to $40 million to 2011 EBITDA. Asphalt & Fuels Marketing Asphalt Refining & Marketing operations for 2010 comparable to 2009. 2011 results should be slightly higher than 2010 Fuels Marketing 2010 results should be $25 to $35 million higher than 2009. 2011 results comparable to 2010 2010 NuStar EBITDA projected to be in the $480 to $500 million range. 2011 EBITDA higher, mostly driven by storage internal growth projects. |
![]() 53 Large internal growth program continues … NS distribution increase should be higher in 2011 Capital Spending Summary Reliability capital spending should be $50 to $55 million in 2010 and 2011. Strategic capital spending should be $215 to $225 million in 2010 and $320 to $330 million in 2011. NS Distribution Growth for 2011 should be higher than 2010 No plans to issue equity or any additional debt in the remainder of 2010 and 2011 Plans could change if NuStar closes on a large acquisition. |
![]() Texas City Terminal Overview Texas City Terminal Overview Kyle Oppliger Kyle Oppliger Vice President &General Manager Vice President &General Manager – – Gulf Region Gulf Region 54 |
![]() 55 Texas City, TX. Terminal then… July 1, 2005 Tanks 128 tanks Capacity: 2,003,000 barrels Employees 55 employees Utilization Rate 98% Size Range 1,000 to 112,000 barrels Products Chemicals & Petroleum Modes Served Vessel, Barge, Pipeline, Rail, Truck - 3 Ship/Barge Docks (2 have vessel capacity) - 78 Rail Load/Unload Spots - 53 Truck Load/Unload spots Rail/Spur Data Over 3,000 feet of private and leased track served by the Texas City Terminal Railway, Burlington Northern Santa Fe and Union Pacific |
![]() 56 NuStar’s Vision and Strategy Transform the asset into the premier USGC black oil hub location Black Oil Hub Strategy Integrate NuStar marketing, supply and trading into landscape Fuel Oil Trading Plan Demonstrate excellence in safety and environmental performance, operations, customer service and community involvement With a solid strategy and NuStar’s proven record of success, we went to work! Vision and Strategy for Texas City Terminal |
![]() 57 Commitment and Focus on Safety NuStar Culture – Employees are #1 Asset! Process Safety Management (PSM) Best- in-Class safety equipment & tools Improved Safety Performance Pre-merger Lost Time Injury Rate = 57 Current Lost Time Injury Rate = 0 3 years without a lost time injury (Oct 6 th ) Improved Environmental Performance Reportable spills – Zero in 2009, 2 in 2010 Compliance calendar and audits Modern tank integrity program – API 653 driven Equipment upgrades and preventive maintenance programs Implemented NuStar Culture…Improved Safety & Environmental Performance PSM Elements: 1.Employee participation 2.Hazard analysis 3.Training 4.Pre-start safety review 5.Permit to Work 6.Incident investigation 7.Compliance audits 8.Process safety info 9.Operating procedures 10.Contractor control 11.Mechanical integrity 12.Management of change 13.Emergency planning and response 14.Trade secrets |
![]() 58 Improved Customer Service Established central control room for managing operation of facility Implemented new movement and inventory tracking software along with platform for controlling terminal’s automated equipment Systems include integrated on-line interface for customers Focus on strategic customers Improved operability, flexibility, and reliability through strategic projects Striving for Operational Excellence Creation of piping infrastructure that maximizes ability for intra-terminal trading Increase pumping rates to maximize marine dock utilization |
![]() 59 Investing in our community and employees: Investing in our Community & Employees Community On pace to exceed 4,000 volunteer hours in 2010! United Way recognized NuStar employees with highest per capita contribution award Several terminal employees on Service Organization boards Employees Best in class benefits / security Health assessments and wellness challenge programs Focus on employee development associated with terminal transition Operations, maintenance and business system training Equip our personnel with quality tools to do the job Improved communication programs via roundtables, safety committees |
![]() 60 2006 – Fuel Oil System Upgrades Upgrade existing 120,000 barrel tank and heating systems Upgrade existing heavy oil rail systems 2007 – Leased additional 26 acres for expansion 2007 – Vacuum Gas Oil Storage Construct 200,000 barrels of new heated storage Provide connectivity to local refinery 2008 – Fuel Oil Storage Construct 630,000 barrels of new heated storage Provide connectivity to local refinery Implementing the Strategy |
![]() 61 Hurricane Ike Delivers Heavy Blow 09/13/2008 Extensive damage to non-strategic, small chemical storage tanks, utilities infrastructure and buildings Demolished 36 small chemical storage tanks Insurance proceeds upgrade facility infrastructure and accelerate Hub and Trading Strategies Hurricane Ike Creates Additional Opportunity Before After |
![]() 62 2008 to 2010 – NuStar Fuel Oil Trading Plan Upgrade 170,000 barrels of existing storage – In Service Upgrade 40,000 barrels of existing storage and bunker fuel delivery systems – In Service 200,000 barrels of new heated storage and piping systems – In Service Construct heated railcar unloading facility for 60 railcars – In Service Remaining 100,000 barrel tank due in service Dec 2010 Implementing the Strategy |
![]() 63 Texas City, Texas Terminal today….. October 27, 2010 Tanks 74 tanks Capacity: 2,815,000 barrels Employees 57 employees Utilization Rate 98% Size Range 8,000 to 200,000 barrels Products Petroleum & Petrochemicals Modes Served Vessel, Barge, Pipeline, Rail, Truck 3 Ship/Barge Docks (2 have vessel capacity) 68 Petroleum (heated) Rail unload spots 11 Chemical Rail Load/ unload spots 2 Centralized Truck Load/ unload spots Connectivity to BP, Marathon, Valero Rail/Spur Data Over 7,000 feet of private and leased track served by the Texas City Terminal Railway, Burlington Northern Santa Fe and Union Pacific |
![]() 64 Strong customer interest supports further expansion of Trading Hub Expand NuStar’s fuel oil blending and bunkering operations Footprint for 1 to 1.4 million barrels of additional expansion Texas City Tomorrow |
![]() 65 In 5 short years, NuStar has transformed the Texas City terminal into to a premier black oil blending and trading location asset Upgraded approximately 450,000 barrels of existing tankage Constructed in excess of 1.1 million barrels of new tankage Constructed premier Gulf Coast heated railcar off-loading facility Demonstrating best-in-class operations, excellence in safety and environmental performance, customer service and community involvement Texas City’s future is bright as customer interest remains strong with industry recognition of hub strategy Summary |
![]() Closing Remarks Closing Remarks and Q&A and Q&A Curt Anastasio Curt Anastasio CEO & President CEO & President 66 |
![]() Management Management Team Bios Team Bios 67 |
![]() Management Bios Management Bios Curt Anastasio, CEO & President President and CEO of NuStar Energy L. P. (NYSE: NS) and NuStar GP Holdings, LLC (NYSE: NSH) Anastasio has been President of NuStar Energy L.P. and its predecessors since December 1999, and he assumed the position of CEO of NuStar GP Holdings, LLC in 2006. Prior to becoming President of NuStar GP, LLC in 1999, Anastasio held various positions in supply, trading, transportation, marketing, development and legal. He has 22 years of industry experience. Curt serves on the Board of the National Association of Publicly Traded Partnerships. In addition to participating in various volunteer activities, Curt serves on the Board of Trustees of the United Way of San Antonio and Bexar County, and is the communitywide United Way Campaign Chairman for 2011. He also serves as a board member of the San Antonio Medical Foundation, Southwest Research Institute, the Southwest Foundation for Biomedical Research, the Greater San Antonio Chamber of Commerce, the Alamo Area Council of the Boy Scouts of America, and the Economic Development Foundation – all in San Antonio. In addition, Anastasio belongs to various professional organizations and has lectured and written on legal and business topics. Curt received a Juris Doctorate degree from Harvard Law School in 1981 and a Bachelor of Arts degree, Magna cum Laude, from Cornell University in 1978. After graduation, he practiced law in New York City. 68 |
![]() Management Bios Management Bios Steve Blank, Senior VP - CFO & Treasurer Chief Financial Officer, Senior Vice President and Treasurer of NuStar Energy L.P. In this position, he is responsible for corporate finance, external reporting, accounting, budgeting and forecasting, investor relations, risk management, tax, treasury and credit. Before that, Steve held a variety of positions with Ultramar Diamond Shamrock and Valero Energy in New York, London and San Antonio, including Director, Planning and Development (1980-83); Assistant Treasurer – Corporate Finance (1983-90); Vice President of Investor Relations (1991-95); Vice President – Information Technology (1996); and Vice President – Finance and Treasurer (1996-01). Before joining Ultramar Diamond Shamrock in 1980, Steve worked for two years with National Westminster Bank in New York. Steve received a BA in History from the State of University of New York in 1976. He went on to obtain a Master’s in International Affairs, with a specialization in Business, from Columbia University in 1978. 69 |
![]() Management Bios Management Bios Rick Bluntzer, Senior VP - Operations Rick Bluntzer, Senior Vice President of Operations oversees NuStar Energy L.P.’s extensive pipeline, terminal, international and asphalt refining operations. Additionally he oversees NuStar’s engineering, information systems (operations) and procurement organizations. Rick began his career with Valero Refining Company in 1976, serving in various operating and management systems until 1979, when he became a part of Valero’s refinery acquisition team. Rick joined the Valero L.P. organization after the Valero/UDS merger and held various senior operating and management positions, contributing to the success and transition of today’s NuStar organization. 70 |
![]() Management Bios Management Bios Brad Barron, Senior VP - General Counsel 71 Brad Barron serves as Senior Vice President and General Counsel of NuStar Energy L.P. and NuStar GP Holdings, LLC, both of which are headquartered in San Antonio, TX. As such, he provides legal counsel on all major transactions, assures compliance with securities laws, provides legal counsel to the boards of directors and principal officers, manages real estate and right-of-way issues, and oversees health, safety and environmental compliance. Prior to joining the company, Mr. Barron was with Valero Energy Corporation. Mr. Barron began his legal career with Vinson & Elkins LLP and continued in private practice until he joined Valero in 2001. A committed volunteer, Mr. Barron is also active in the San Antonio community. He serves on the boards of directors of the Witte Museum, Alamo Bowl and Family Service Association, and he previously volunteered as a board member of the Boys and Girls Club of San Antonio. He also serves on the Texas Tech Foundation Board. Mr. Barron holds a B.B.A. from Texas Tech University and a J.D. from the University of Texas School of Law. In addition, Mr. Barron holds a M.L.A. from St. John’s College. |
![]() Management Bios Management Bios Paul Brattlof, Senior VP - Supply and Trading 72 Paul Brattlof leads NuStar Energy L.P.’s Marketing, Supply and Trading organization, which includes products trading, crude supply & trading, heavy fuels trading bunker marketing and asphalt marketing. Under Mr. Brattlof’s leadership, this organization capitalizes on opportunities to optimize the use and profitability of the company’s worldwide portfolio of assets, manages risk as NuStar diversifies its business, and enhances the company’s competitive position when pursuing acquisitions. Mr. Brattlof has more than two decades of experience in cash markets, futures markets and derivatives trading. Previously, he served as Vice President of Trading for Valero Energy Corporation, where he worked for 10 years. Prior to that, he spent 11 years with Kerr-McGee Refining and two years with Mieco, a Long Beach-based trading company. A graduate of Rice University, Mr. Brattlof holds a Bachelor of Arts degree in Managerial Studies. |
![]() Management Bios Management Bios Mike Hoeltzel, Senior VP - Corporate Development Senior Vice President of Corporate Development for NuStar Energy L.P. Joined NuStar in February 2007 with 30 years refinery experience. Valero Energy's Corporate Development Department from 2000 to 2007. Primary responsibility was valuation of refinery acquisitions during this period of growth from 6 to 19 refineries. Also supported growth of Valero L.P. during 2002-2006 when M&A opportunities for both companies were developed in a common department. Worked in CITGO's Corpus Christi refinery from 1991-2000 in various Project Management, Planning & Economics, and Strategic Planning positions. Worked in Kerr-McKee's Corpus Christi refinery from 1977-1991 in Project Management and Planning & Economics positions. Worked for Exxon in Oil Production from 1971-1973 and Dupont from 1973- 1977, project engineering assignments with both companies. Graduated from Oklahoma State University in 1971 with BS and MS degrees in Mechanical Engineering. Also received MBA from Corpus Christi State University (now Texas A&M Corpus Christi) in 1983 73 |
![]() Management Bios Management Bios Danny Oliver, Senior VP - Marketing and Business Development 74 Danny Oliver, Senior Vice President of Marketing & Business Development for NuStar Energy L.P., oversees the company’s commercial activities for its pipelines and terminals business. Previously, he served as Vice President of Product Supply & Trading for NuStar where he was instrumental in building the company’s successful trading operations from the ground up. He brings nearly 20 years of industry experience – the majority of which was spent trading energy commodities. Prior to joining NuStar in 2007, Mr. Oliver spent 10 years at Valero Energy holding management positions in Product Supply & Trading where he helped to build a world-class refined product trading organization and played a key role in the company’s aggressive acquisition of refinery and logistics assets. He previously worked at Enron Corp. in the International Trading division where he was responsible for the company’s worldwide MTBE and Methanol trading activities, and also held several positions at Kerr-McGee Refining & Marketing in products scheduling and accounting, with an emphasis in reporting and analyzing trading activities. Mr. Oliver graduated from Texas State University with a B.B.A. in Accounting. Committed to the community in which he works and lives, Mr. Oliver currently serves on the boards of directors of San Antonio Sports and the Harmony Ridge Association. He is also actively involved with his church and the United Way of Bexar County. |
![]() Management Bios Management Bios Kyle Oppliger, VP GM - Operations 75 Kyle Oppliger serves as the Vice President and General Manager of the NuStar Gulf Coast region. As such, he manages all aspects of the region’s operations, maintenance, capital projects, safety and environmental compliance, quality assurance and security initiatives for NuStar terminal assets in Texas, Louisiana, Alabama, Georgia and Florida. He brings over 15 years of experience in refining and terminal operations. Prior to joining NuStar in 2006, Mr. Oppliger spent 10 years at Valero Energy holding leadership roles in operations, planning and economics and laboratory departments. He has played a key role in the aggressive integration and development of acquired assets in NuStar’s Gulf Coast region. He previously worked for Phibro and Basis refining companies, and prior to working in the refining industry, Mr. Oppliger worked as a chemist in research and development. As a committed volunteer, Mr. Oppliger has been active in communities in which NuStar does business, including United Way organizations throughout the Gulf region. Additionally he has been active in youth mentoring programs, Big Brothers & Big Sisters and Boy Scouts of America. Mr. Oppliger received his undergraduate degree in Chemistry from Sam Houston State University and his Master’s degree in Business from University of Houston. |
![]() Appendix Appendix 76 |
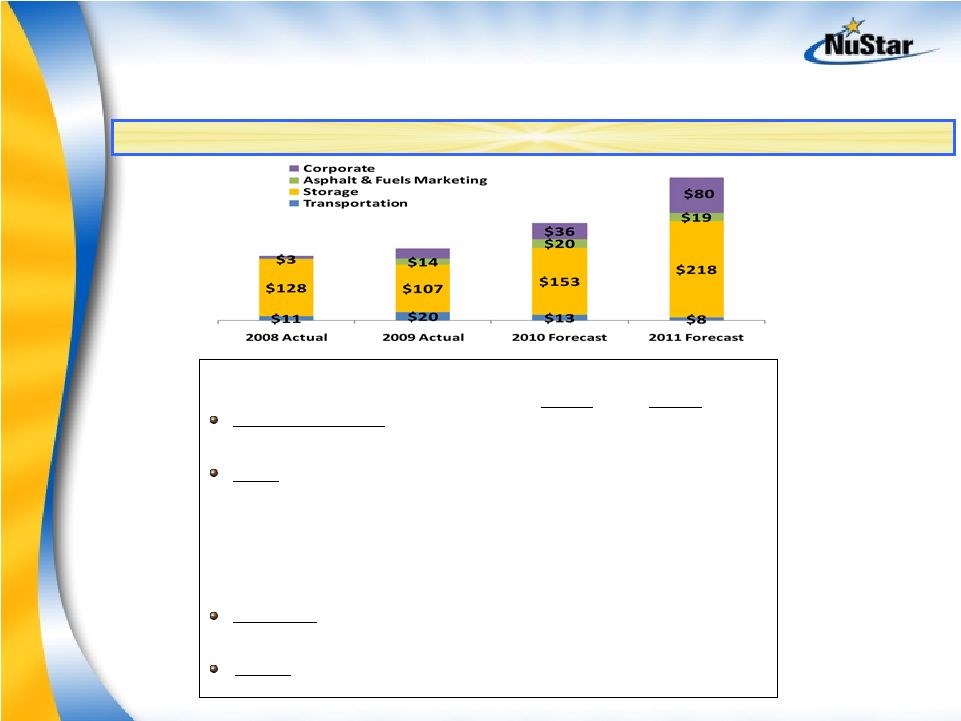
![]() Reconciliation of Non-GAAP Financial Reconciliation of Non-GAAP Financial Information: EBITDA Information: EBITDA (Unaudited, Dollars in Thousands) The following is a reconciliation of net income to EBITDA: 2002 2003 2004 2005 2006 2007 2008 2009 Net income 55,143 $ 69,593 $ 78,418 $ 107,675 $ 149,906 $ 150,298 $ 254,018 $ 224,875 $ Plus interest expense, net 4,880 15,860 20,950 41,388 66,266 76,516 90,818 79,384 Plus income tax expense 395 - - 4,713 5,861 11,448 11,006 10,531 Plus depreciation and amortization expense 16,440 26,267 33,149 64,895 100,266 114,293 135,709 145,743 EBITDA 76,858 111,720 132,517 218,671 322,299 352,555 491,551 460,533 Note: 2005 and 2006 EBITDA are from continuing operations. Projected net income range Plus projected interest expense range Plus projected income tax expense range Plus projected depreciation and amortization expense range Projected EBITDA range Less year ended December 31, 2009 EBITDA (a) Projected incremental EBITDA range (a) As filed in NuStar Energy L.P.'s Current Report on Form 8-K filed January 29, 2010. Year Ended December 31, 2010 Year Ended December 31, NuStar Energy L.P. utilizes EBITDA, which is not defined in United States generally accepted accounting principles. Management uses this financial measure because it is a widely accepted financial indicator used by investors to compare partnership performance. In addition, management believes that this measure provides investors an enhanced perspective of the operating performance of the partnership's assets and the cash that the business is generating. EBITDA is not intended to represent cash flows for the period or as an alternative to net income. EBITDA should not be considered in isolation or as a substitute for a measure of performance prepared in accordance with United States generally accepted accounting principles. The following is a reconciliation of the projected net income to projected EBITDA and projected incremental EBITDA for the year ended December 31, 2010: $ 19,467 - 39,467 77,000 - 78,000 $ 236,000 - 253,000 14,000 - 15,000 153,000 - 154,000 $ 480,000 - 500,000 (460,533) 77 |
![]() Reconciliation of Non-GAAP Financial Reconciliation of Non-GAAP Financial Information: EBITDA (continued) Information: EBITDA (continued) 78 (Unaudited, Dollars in Thousands) Total Internal Growth Program Projected annual operating income range $ 30,000 - 33,000 Plus projected annual depreciation and amortization expense range 5,000 - 7,000 Projected annual adjusted EBITDA range $ 35,000 - 40,000 The following is a reconciliation of projected annual operating income to projected annual adjusted EBITDA related to our internal growth program: EBITDA in the following reconciliation relates to our reportable segments or a portion of a reportable segment. We do not allocate general and administrative expenses to our reportable segments because those expenses relate primarily to the overall management at the entity level. Therefore, EBITDA reflected in the following reconciliation excludes any allocation of general and administrative expenses consistent with our policy for determining segmental operating income, the most directly comparable GAAP measure. EBITDA should not be considered in isolation or as a substitute for a measure of performance prepared in accordance with GAAP. |
![]() Reconciliation of Non-GAAP Financial Reconciliation of Non-GAAP Financial Information: Storage Segment Information: Storage Segment 79 (Unaudited, Dollars in Thousands) The following is a reconciliation of operating income to EBITDA for the Storage Segment: 2006 2007 2008 2009 Operating income 108,486 $ 114,635 $ 141,079 $ 171,245 $ Plus depreciation and amortization expense 53,121 62,317 66,706 70,888 EBITDA 161,607 $ 176,952 $ 207,785 $ 242,133 $ Projected incremental operating income range $ 8,000 - 11,000 Plus projected incremental depreciation and amortization expense range 6,000 - 7,000 Projected incremental adjusted EBITDA range $ 14,000 - 18,000 Projected incremental operating income range $ 26,000 - 33,000 Plus projected incremental depreciation and amortization expense range 4,000 - 7,000 Projected incremental adjusted EBITDA range $ 30,000 - 40,000 The following is a reconciliation of projected incremental operating income to projected incremental adjusted EBITDA related to our internal growth program for the year ended December 31, 2011 comparred to the year ended December 31, 2010: Storage Segment EBITDA in the following reconciliations relate to our reportable segments or a portion of a reportable segment. We do not allocate general and administrative expenses to our reportable segments because those expenses relate primarily to the overall management at the entity level. Therefore, EBITDA reflected in the following reconciliations excludes any allocation of general and administrative expenses consistent with our policy for determining segmental operating income, the most directly comparable GAAP measure. EBITDA should not be considered in isolation or as a substitute for a measure of performance prepared in accordance with GAAP. Year Ended December 31, The following is a reconciliation of projected incremental operating income to projected incremental adjusted EBITDA for the year ended December 31, 2010: Storage Segment |
![]() Reconciliation of Non-GAAP Financial Reconciliation of Non-GAAP Financial Information: Transportation Segment Information: Transportation Segment 80 (Unaudited, Dollars in Thousands) The following is a reconciliation of operating income to EBITDA for the Transportation Segment: 2006 2007 2008 2009 Operating income 122,714 $ 126,508 $ 135,086 $ 139,869 $ Plus depreciation and amortization expense 47,145 49,946 50,749 50,528 EBITDA 169,859 $ 176,454 $ 185,835 $ 190,397 $ Projected incremental operating income range $ 5,000 - 9,000 Plus projected incremental depreciation and amortization expense range 0 - 1,000 Projected incremental adjusted EBITDA range $ 5,000 - 10,000 Projected incremental operating income range $ 1,000 - 4,000 Plus projected incremental depreciation and amortization expense range 0 - 1,000 Projected incremental adjusted EBITDA range $ 1,000 - 5,000 The following is a reconciliation of projected incremental operating income to projected incremental adjusted EBITDA related to our internal growth program for the year ended December 31, 2011 comparred to the year ended December 31, 2010: Transportation Segment EBITDA in the following reconciliations relate to our reportable segments or a portion of a reportable segment. We do not allocate general and administrative expenses to our reportable segments because those expenses relate primarily to the overall management at the entity level. Therefore, EBITDA reflected in the following reconciliations excludes any allocation of general and administrative expenses consistent with our policy for determining segmental operating income, the most directly comparable GAAP measure. EBITDA should not be considered in isolation or as a substitute for a measure of performance prepared in accordance with GAAP. Transportation Segment Year Ended December 31, The following is a reconciliation of projected incremental operating income to projected incremental adjusted EBITDA for the year ended December 31, 2010: |
![]() Reconciliation of Non-GAAP Financial Reconciliation of Non-GAAP Financial Information: Internal Growth Program Information: Internal Growth Program 81 (Unaudited, Dollars in Thousands) St. James, LA Terminal Expansion Phase 1 St. James, LA Terminal Expansion Phases 1 & 2 St. Eustatius Distillate Project Jacksonville Storage Expansion Projected annual operating income range $ 11,000 - 20,000 $ 26,000 - 34,000 $ 4,000 - 8,000 $ 4,500 - 9,000 Plus projected annual depreciation and amortization expense range 4,000 - 5,000 9,000 - 11,000 1,000 - 2,000 500 - 1,000 Projected annual adjusted EBITDA range $ 15,000 - 25,000 $ 35,000 - 45,000 $ 5,000 - 10,000 $ 5,000 - 10,000 Denver Terminal Expansion Linden Fuel Oil Conversion Selby Truck Rack Expansion South Texas Valley System Ethanol Projected annual operating income range $ 500 - 4,000 $ 900 - 2,500 $ 2,900 - 4,500 $ 1,900 - 3,500 Plus projected annual depreciation and amortization expense range 500 - 1,000 100 - 500 100 - 500 100 - 500 Projected annual adjusted EBITDA range $ 1,000 - 5,000 $ 1,000 - 3,000 $ 3,000 - 5,000 $ 2,000 - 4,000 Clawson to McKee Pipeline Expansion Projected annual operating income range $ 400 - 800 Plus projected annual depreciation and amortization expense range 100 - 200 Projected annual adjusted EBITDA range $ 500 - 1,000 The following is a reconciliation of projected annual operating income to projected annual adjusted EBITDA for a project in our transportation segment related to our internal growth program: EBITDA in the following reconciliations relate to our reportable segments or a portion of a reportable segment. We do not allocate general and administrative expenses to our reportable segments because those expenses relate primarily to the overall management at the entity level. Therefore, EBITDA reflected in the following reconciliations excludes any allocation of general and administrative expenses consistent with our policy for determining segmental operating income, the most directly comparable GAAP measure. EBITDA should not be considered in isolation or as a substitute for a measure of performance prepared in accordance with GAAP. The following is a reconciliation of projected annual operating income to projected annual adjusted EBITDA for certain projects in our storage segment related to our internal growth program: |
![]() Reconciliation of Non-GAAP Financial Reconciliation of Non-GAAP Financial Information: Asphalt & Fuels Marketing Segment Information: Asphalt & Fuels Marketing Segment 82 (Unaudited, Dollars in Thousands) The following are reconciliations of operating income to EBITDA for the Asphalt and Fuels Marketing Segment: Fuels Marketing Operations Asphalt Operations Asphalt and Fuels Marketing Segment Operating income 9,919 $ 50,710 $ 60,629 $ Plus depreciation and amortization expense - 19,463 19,463 EBITDA 9,919 $ 70,173 $ 80,092 $ Fuels Marketing Operations Asphalt Operations Asphalt and Fuels Marketing Segment Operating income 36,239 $ 76,267 $ 112,506 $ Plus depreciation and amortization expense 552 14,182 14,734 EBITDA 36,791 $ 90,449 $ 127,240 $ Year Ended December 31, 2007 Year Ended December 31, 2006 Operating income 21,111 $ 26,915 $ Plus depreciation and amortization expense 423 - EBITDA 21,534 $ 26,915 $ Fuels Marketing Operations Asphalt Operations Asphalt and Fuels Marketing Segment Projected incremental operating income range $ 25,000 - 35,000 - $ $ 25,000 - 35,000 Plus projected incremental depreciation and amortization expense range - - - Projected incremental adjusted EBITDA range $ 25,000 - 35,000 - $ $ 25,000 - 35,000 Year Ended December 31, 2010 Compared to the Year Ended December 31, 2009 Year Ended December 31, 2009 Year Ended December 31, 2008 EBITDA in the following reconciliations relate to our reportable segments or a portion of a reportable segment. We do not allocate general and administrative expenses to our reportable segments because those expenses relate primarily to the overall management at the entity level. Therefore, EBITDA reflected in the following reconciliations excludes any allocation of general and administrative expenses consistent with our policy for determining segmental operating income, the most directly comparable GAAP measure. EBITDA should not be considered in isolation or as a substitute for a measure of performance prepared in accordance with GAAP. The following is a reconciliation of projected incremental operating income to projected incremental adjusted EBITDA for the asphalt and fuels marketing segment: The following are reconciliations of operating income to EBITDA for the Asphalt and Fuels Marketing Segment. As we had no asphalt operations prior to 2008, the following amounts relate solely to our Fuels Marketing Operations: |