 Yanfeng 3-09 Financial Statements June 28, 2013 Exhibit 99.1 Yanfeng Visteon Electronics Interiors Our Family of Businesses |
 Page 2 Overview Rule 3-09 requires separate financial statements be filed for significant subsidiaries that meet certain conditions as set forth by the SEC YFV meets these conditions and Visteon filed separate YFV financial statements for historical periods on June 28, 2013 on a Form 10-K/A (amended 2012 annual filing) IFRS basis; initial adoption January 1, 2011 Presented full-year 2011 and 2012 The separate financial statements include the following items in RMB under IFRS: Statement of Income, including revenue, gross profit and net profit Statement of Financial Position with typical balance sheet categories Statement of Shareholders’ Equity Statement of Cash Flows Notes to Financial Statements YFV Rule 3-09 Separate Statements YFV Financial Statements Required on Annual Basis Only |
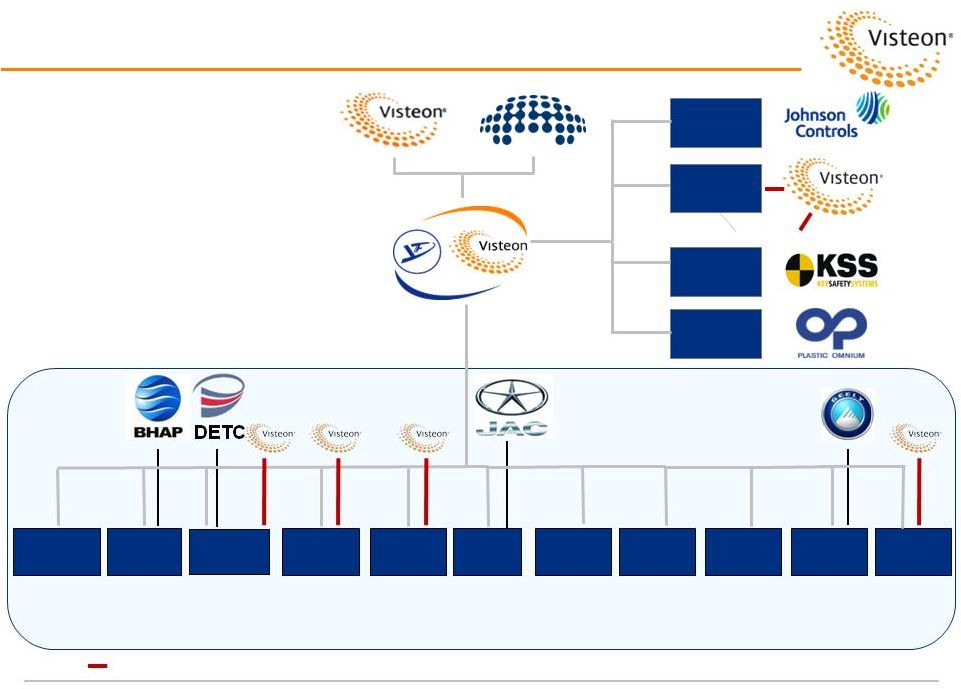 Page 3 YFV Structure • The financials in the 3-09 financial statements relate to the 50% / 50% JV between Visteon and HASCO (SAIC) • The 3-09 financial statements exclude Visteon’s direct interests in Yanfeng affiliates (i.e. Dongfeng, Halol India, Jinqiao, Tooling, Toppower YFV Electronics) 50% 50% YFV Beijing 2002 75% YFV Tooling 2006 50% Dongfeng Visteon (1) 2003 40% YFV Jinqiao 2004 75% 60% 2002 50.1% 2004 YF Key Safety 50.05% 2007 YFV Hefei 2007 80% YFV Jiqiang 2008 51% YFV Nanjing 2010 80% YFV NJ FEM 2010 51% YFV Zhejiang 2011 60% 50.01% YFJCI Seating 1997 YFV Chongqing 2001 99% YFV Halol India 2011 50% 20% 12.5% 25% 50% Toppower 58.44% YFV Electronics (1) Visteon interest sold in June 2013. 40% Represent Visteon direct interests in YFV affiliates (these direct interests are not included in YFV consolidated results) YFPO Exterior Interiors Operations 29.092% |
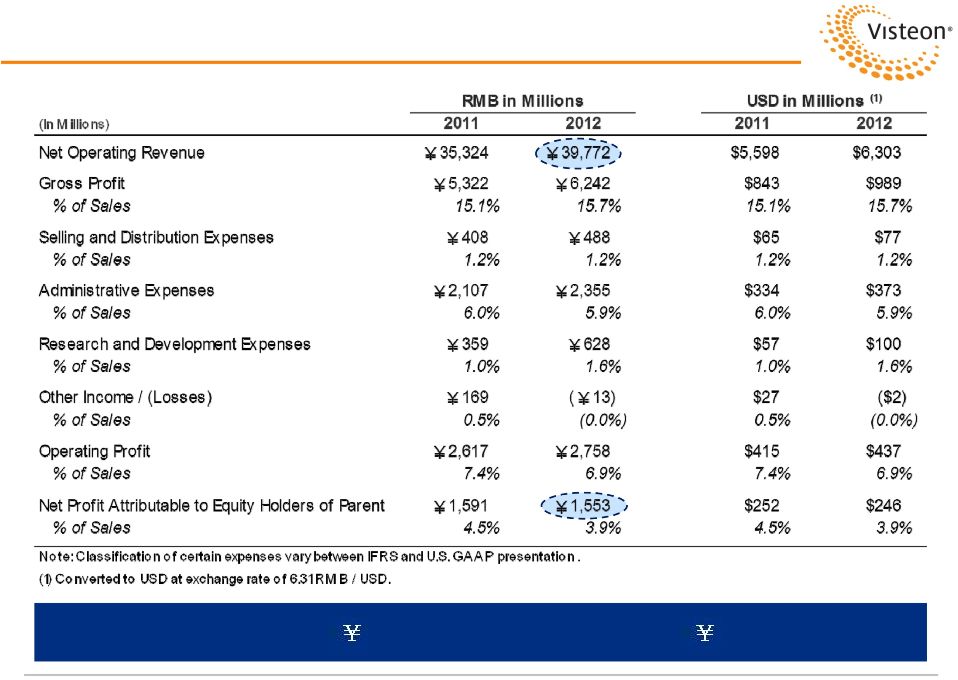 Page 4 YFV 3-09 Financial Highlights (2011-2012) Under IFRS, YFV Generated 39.8 Billion in Sales in 2012 and 1.6 Billion in Profit Note: See Visteon Corporation’s amended Annual Report on Form 10-K/A for additional information. |
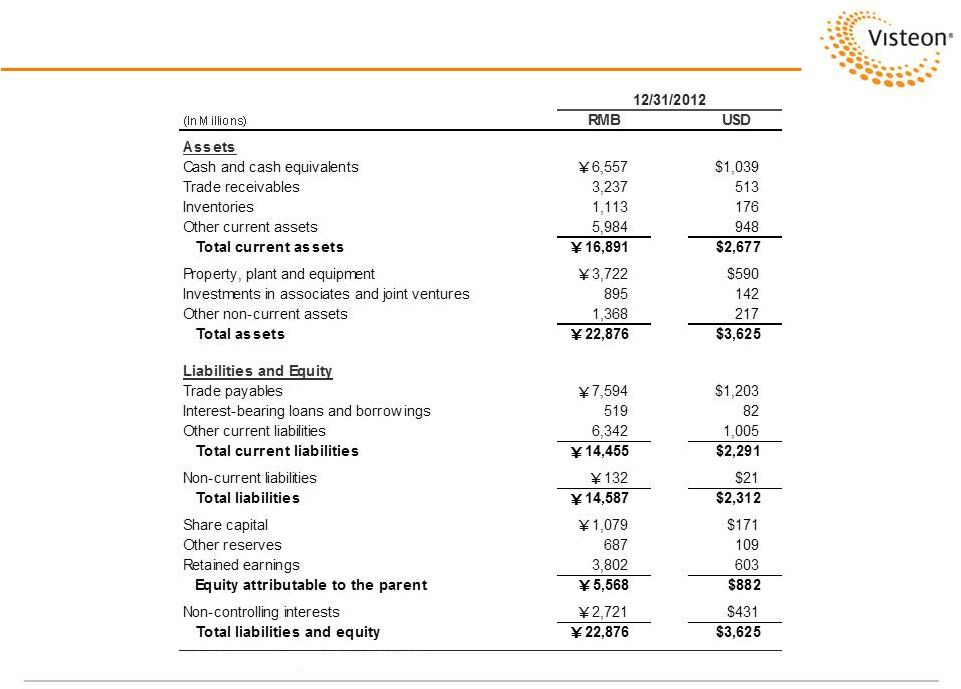 Page 5 YFV Balance Sheet (December 31, 2012) Note: Assumes exchange rate of 6.31 RMB / USD. Note: See Visteon Corporation’s amended Annual Report on Form 10-K/A for additional information. |
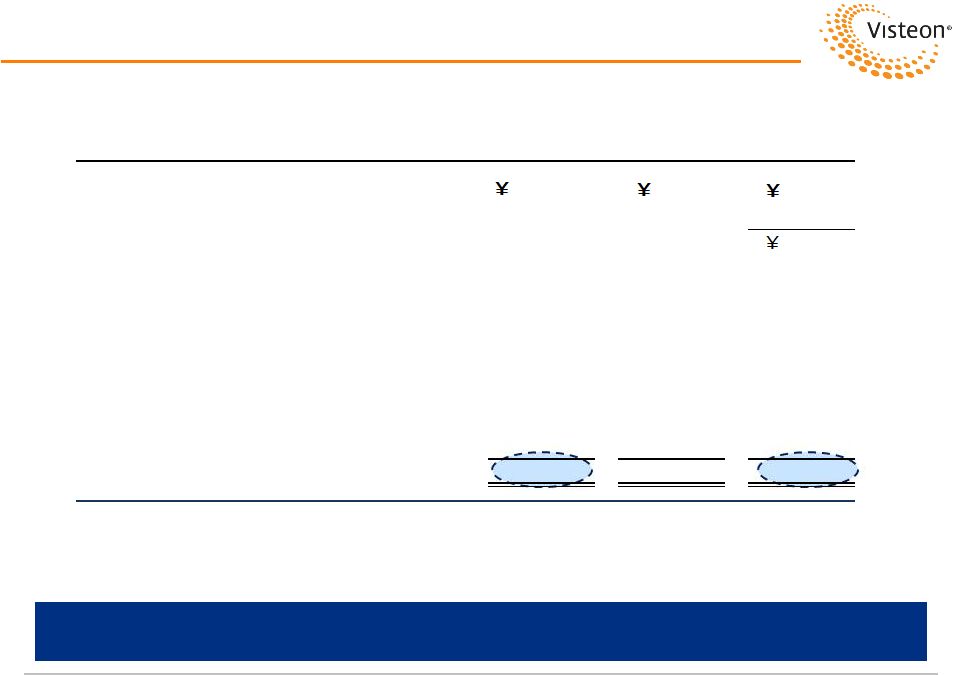 Page 6 Walk to Visteon Reported 10-K Financials (FY 2012) As Reported in Visteon’s 2012 Financial Statements, YFV Earned $369 Million in Net Income Including $126 Million Non-Cash Gain Gross Net Currency Revenue Margin Income IFRS RMB 39,772 6,242 2,602 Less: Non-controlling interests (1,049) Equity holders of the parent 1,553 Exchange rate assumption 6.31 6.31 6.31 Translation USD $6,303 $989 $246 Reconciling Differences: Classification USD (14) (13) - Affiliate Consolidation (b) USD (1,119) (192) 126 Timing / Other USD 1 (2) (3) Visteon 2012 10-K Financial Statements $5,171 $782 $369 (In Millions) (a) a) Classification differences between U.S. GAAP and IFRS. b) Affiliate Consolidation for U.S. GAAP purposes effective June 2012, resulting in non-cash gain of $126 million. |
 Page 7 Reconciliation to Visteon Reported Equity Income (FY 2012) Visteon Recognized $211 Million in 2012 Equity Income Related to YFV and Affiliates Visteon Equity (USD in millions) Net Income Income Total Yanfeng Visteon $369 $181 Visteon Direct Interests in Yanfeng Affiliates 30 Total Yanfeng and Affiliates $211 Other Visteon Non-Consolidated Affiliates 15 Total Equity Income to Visteon $226 |
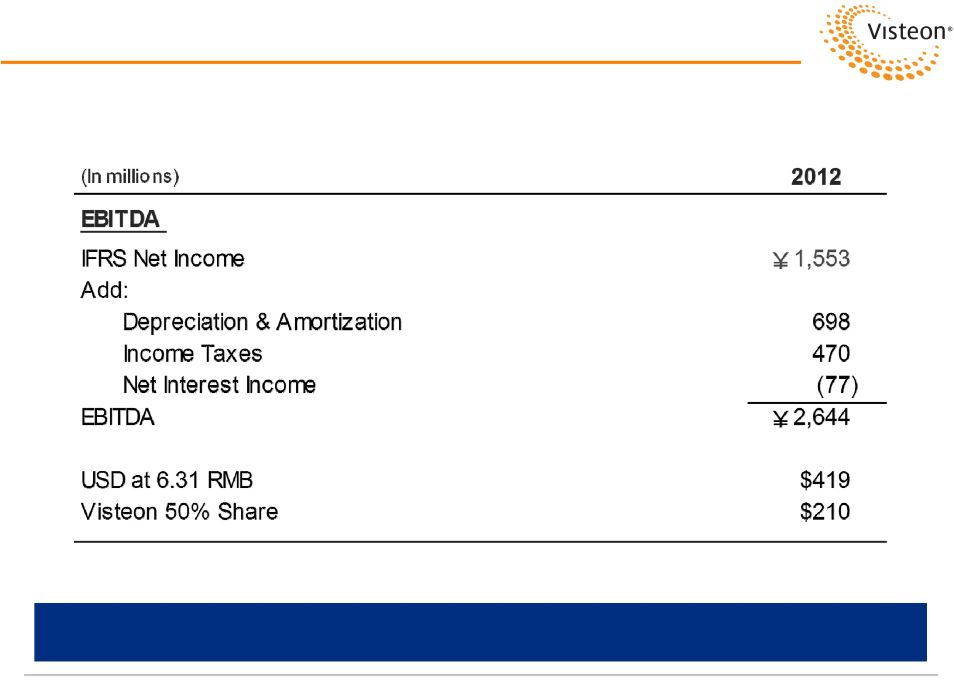 Page 8 YFV 2012 EBITDA Visteon’s 50% Share of YFV’s 2012 EBITDA Translates Into $210 Million Note: All financial information included in the 3-09 financial statements relates to YFV Consolidated only. Visteon’s direct stakes in Yanfeng affiliates are not considered for this reporting. |