 Delivering Value J.P. Morgan Conference – August 2013 Exhibit 99.1 Yanfeng Visteon Electronics Interiors Our Family of Businesses |
 Page 2 Today We Will… Provide Q2 2013 highlights Update the status of the Company’s “Value Creation Plan” first presented on September 19, 2012 Review the YFV transaction Outline the Visteon vision |
 Q2 2013 Highlights J.P. Morgan Conference – August 2013 Yanfeng Visteon Electronics Interiors Our Family of Businesses |
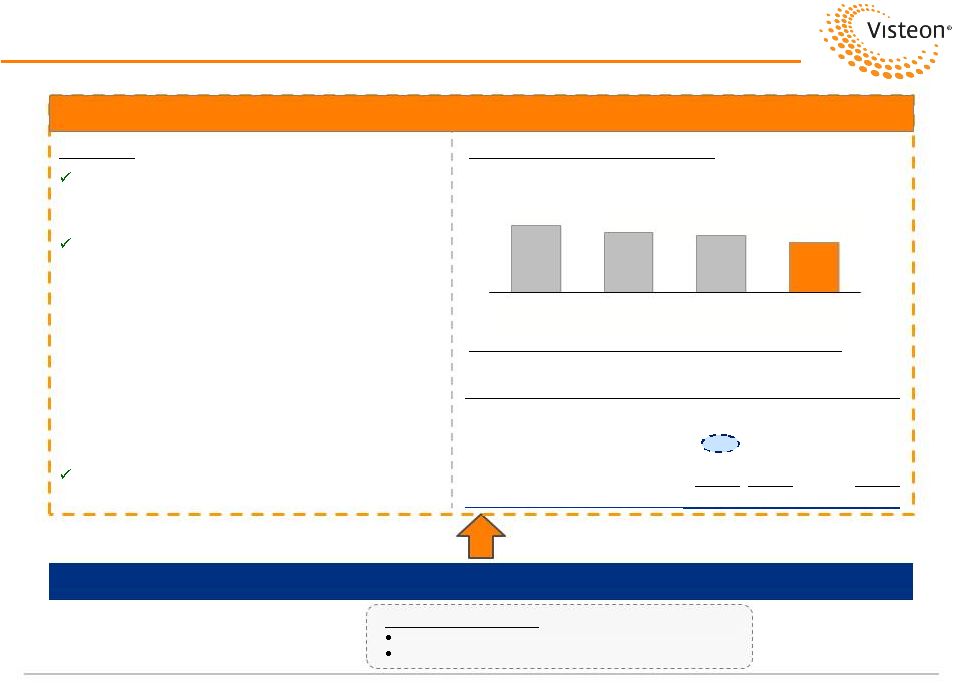
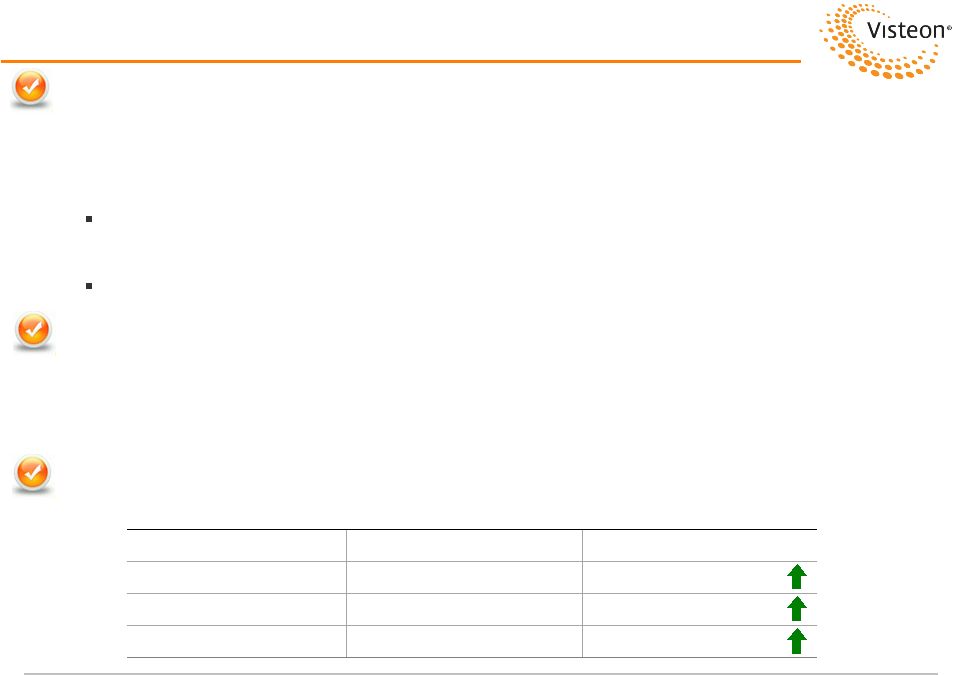 Page 4 Second Quarter 2013 Recent Highlights Strong Second-Quarter 2013 Performance – Sales of $1.9 billion vs. $1.7 billion in second-quarter 2012 – Adjusted EBITDA of $187 million vs. $147 million in second-quarter 2012 – Adjusted net income of $71 million Adjusted EPS of $1.41 – Strength in Climate and Electronics product groups Year-over-year Adjusted EBITDA up 38% and 17%, respectively Over $1 Billion of Liquidity at June 30, 2013, Despite $175 Million Share Buyback and $50 Million Bond Repurchase During Last 12 Months – Cash of $1,008 million (up $306 million Y/Y); $114 million of U.S. ABL availability – Debt of $799 million; 1.2x Debt / Adjusted EBITDA Increasing 2013 Financial Guidance Please see appendix for important disclosures regarding “Forward Looking Information“ and “Use of Non-GAAP Financial Information” Prior Revised Sales $7.3 - $7.5 billion $7.3 - $7.5 billion Adjusted EBITDA $620 - $660 million $660 - $690 million Adjusted FCF $100 - $150 million $135 - $170 million Adjusted EPS $4.04 - $5.52 $4.83 - $6.11 |
 Yanfeng Visteon Electronics Interiors Our Family of Businesses Status of “Value Creation” Plan J.P. Morgan Conference – August 2013 |
 Page 6 Decision Cornerstones Base strategic decisions on “industrial logic” and a realistic assessment of strengths and weaknesses – No smaller than #3 in relevant market presence – Core strengths must include technology or “know-how” leverage Provide customers with well financed, international-capable businesses with exciting products – Financial performance must support R&D and capex investment – Must have presence where customers want to be – Capable of weathering economic challenges Shareholder performance is an outcome of optimal strategic decisions and robust execution – Lean, fast, driven and global – Focused, minimal overhead with strong leadership Focused on Continued Strategy of Optimizing Visteon’s Business Portfolio to Maximize Shareholder Value Please see appendix for important disclosures regarding “Forward Looking Information“ |
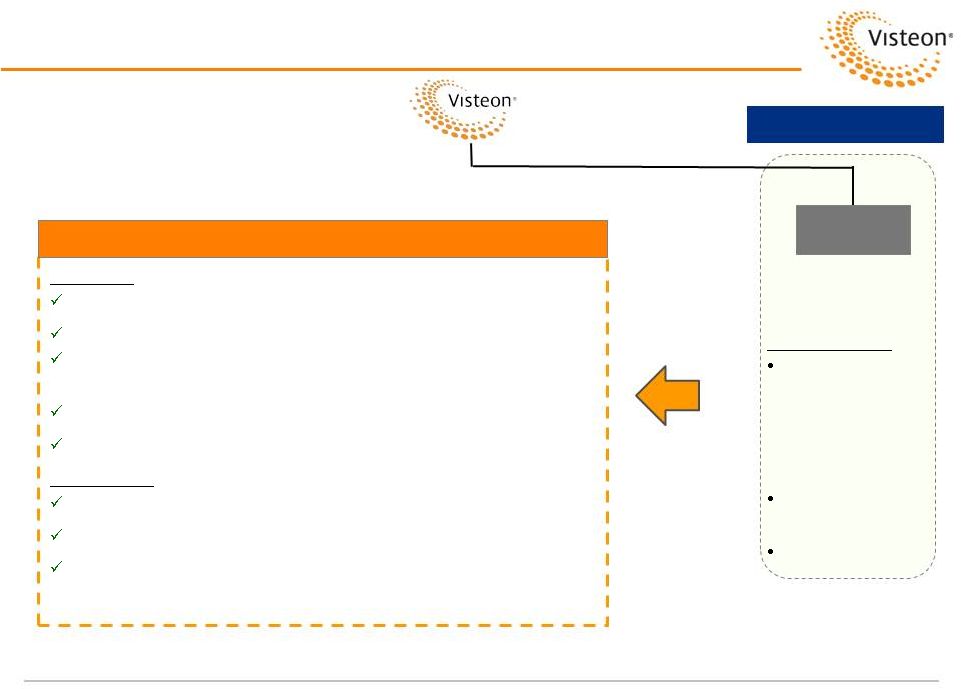
 Page 7 Visteon: The Plan (September 19, 2012) Visteon Climate Yanfeng Visteon 70% 100% 50% 100% 100% Visteon Interiors Visteon Electronics Sell Visteon Climate to HCC for cash Establishes “New Halla-Visteon Climate Group” (HVCG) as single consolidated Climate presence with leadership of all global Climate operations Consolidation of these two operations into one has been a major customer demand Headquartered in Korea with global customer presence and Korean leadership supported by international management team Visteon is equity holder (70%) in HVCG Transfer limited SG&A and operating resources to make business globally self-capable Target transaction completion by Q1 2013 Remains non-core Continue to pursue options Interiors will be exited at a time when value objectives are met Electronics #5 global market position Significant integration and technology synergies with YFVE Focused on optimizing global scale and ownership YFV Electronics 60% 40% Yanfeng Visteon YFV and affiliated Visteon Electronics represent a dynamic marriage of global presence with Asian- centric power, low-cost operations and technological prowess Core YFV business is Interiors, which Visteon is exiting Need to monetize at right value at right time Rothschild and Goldman Sachs Were Engaged by Visteon to Pursue Strategic Options to Enhance Customer, Partner and Shareholder Value Please see appendix for important disclosures regarding “Forward Looking Information“ Corporate Rightsizing Minimal footprint Staff businesses with lean and only “necessary” support |
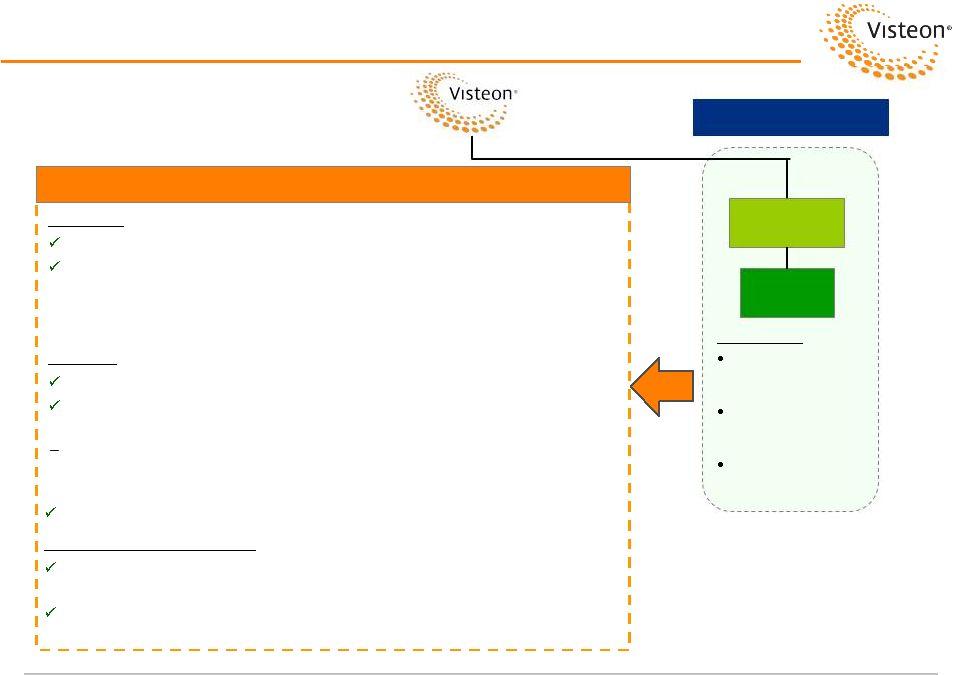
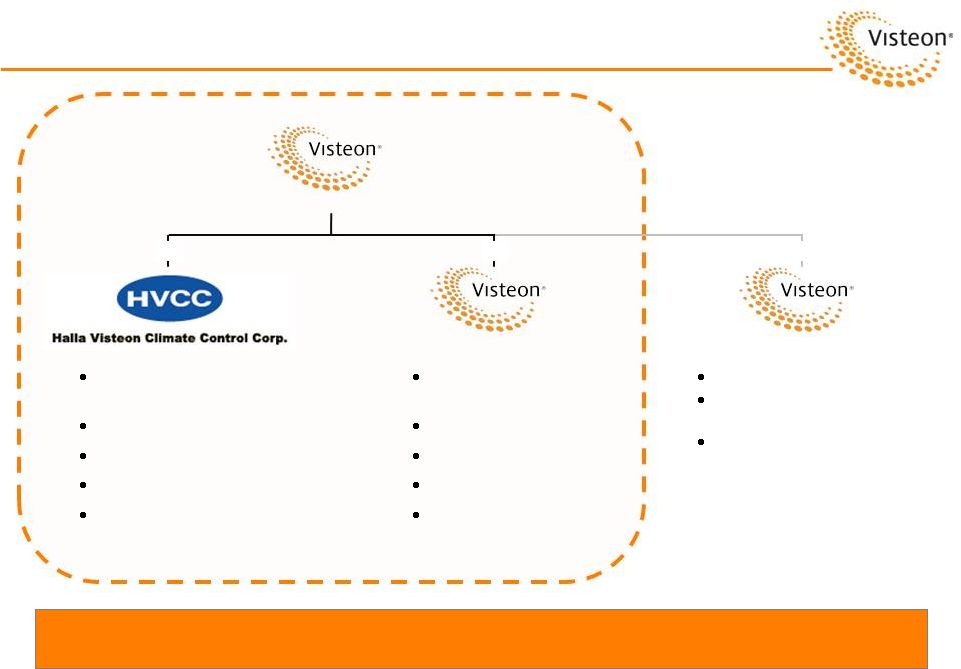
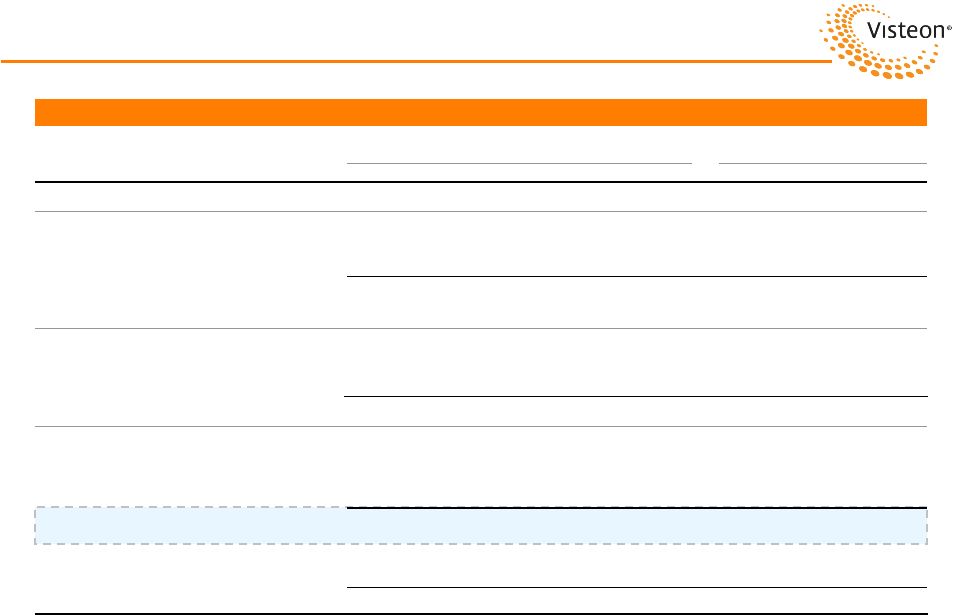
 Page 8 Visteon: The Status (August 13, 2013) Visteon Status The Plan Visteon Climate 70% 100% Sell Visteon Climate to HCC for cash – Establishes “New Halla-Visteon Climate Group” (HVCG) as single consolidated Climate presence with leadership of all global Climate operations – Consolidation of these two operations into one has been a major customer demand – Headquartered in Korea with global customer presence and Korean leadership supported by international management team – Visteon is equity holder (70%) in HVCG Transfer limited SG&A and operating resources to make business globally self-capable Target transaction completion by Q1 2013 Overview Completed Q1 2013 HVCC now #2 largest global auto climate business in the world Significant synergies already achieved, further opportunities in process HVCC stock price up over 30% YTD, up over 60% since 52-week low Financial Order book supports 7%+ global sales CAGR through 2015 Project +$1 billion of new business wins in 2013 – 70% rewins / 30% incremental 2013 YTD performance – Revenue up $387 million (19%) – Adjusted EBITDA up $62 million (36%) Significant margin enhancement opportunities; increase margins 100-150 bps between 2012 - 2016 Technology Awarded prestigious award for technical breakthrough on environmentally sensitive issue of system fluid sealing integrity Key supplier to new BMW i3 with innovative battery cooling technology Please see appendix for important disclosures regarding “Forward Looking Information“ and “Use of Non-GAAP Financial Information” |
 Page 9 Yanfeng Visteon 50% Yanfeng Visteon YFV and affiliated Visteon Electronics represent a dynamic marriage of global presence with Asian- centric power, low-cost operations and technological prowess Core YFV business is Interiors, which Visteon is exiting Need to monetize at right value at right time Visteon: The Status (August 13, 2013) The Plan Please see appendix for important disclosures regarding “Forward Looking Information“ and “Use of Non-GAAP Financial Information” Overview Definitive agreement to sell YFV (ex. YFVE) signed August 12, 2013 Overall transaction valued at $1.5 billion Visteon will sell non-Electronics position for $1.2 billion in cash (tax exposure ~10%) Visteon will retain and increase direct ownership in majority of YFVE Most transactions expected to close Q4 2013 / Q1 2014 Key Benefits Simplifies Visteon corporate structure Improves integration of global Electronics business Visteon will consolidate a majority of the existing YFVE operations, and a JV will be established with HASCO, focused on specific Chinese market opportunities Visteon Status |
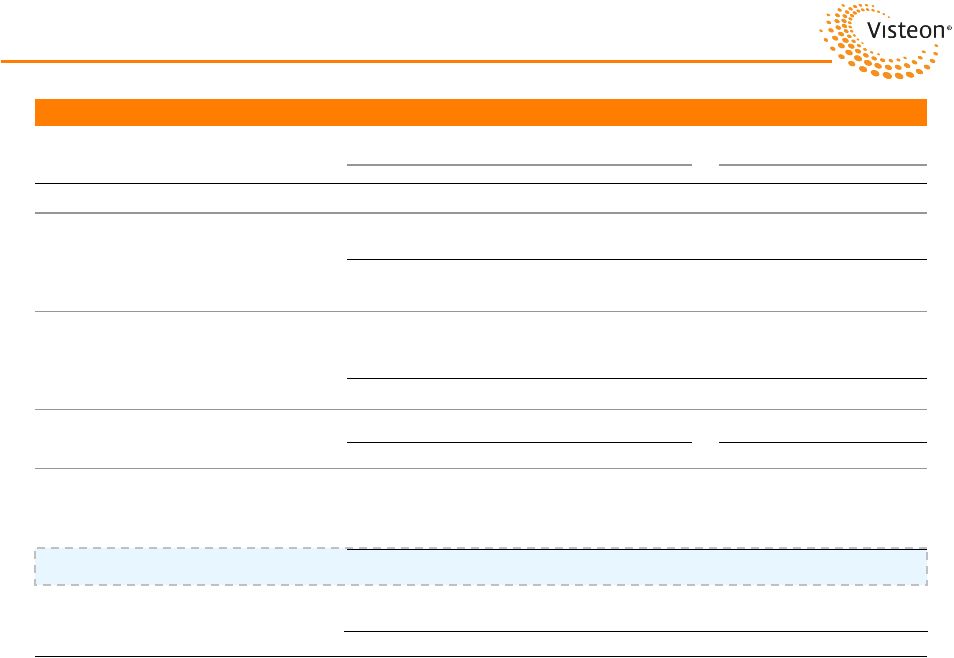
 Page 10 100% Visteon Electronics Electronics #5 global market position (pre YFVE consolidation) Significant integration and technology synergies with YFVE Focused on optimizing global scale and ownership YFV Electronics 40% Visteon: The Status (August 13, 2013) Overview Solidifies #3 global position in driver information and controls Visteon Electronics will consolidate majority of YFVE’s former operations, creating: – ~$1.7 billion in 2013E sales ($350 to $400 million from YFVE) – $150+ million in 2013E Adjusted EBITDA ($40 to $45 million from YFVE) Financial Order book supports 12%+ sales CAGR in Cockpit Electronics through 2016 Project +$600 million of new business wins in 2013 – 33% rewins / 67% incremental The Plan Visteon Status Please see appendix for important disclosures regarding “Forward Looking Information“ and “Use of Non-GAAP Financial Information” 2013 YTD performance – Revenue up $86 million (14%) – Adjusted EBITDA up $7 million (12%) Significant potential for margin enhancement/synergies Operations and Technology Market leader for worldwide delivery with complete global footprint – 11,000 people at 31 sites in 15 countries; technical centers in every region Recognized internationally for technical innovation – eBee vehicle receives major customer endorsements |
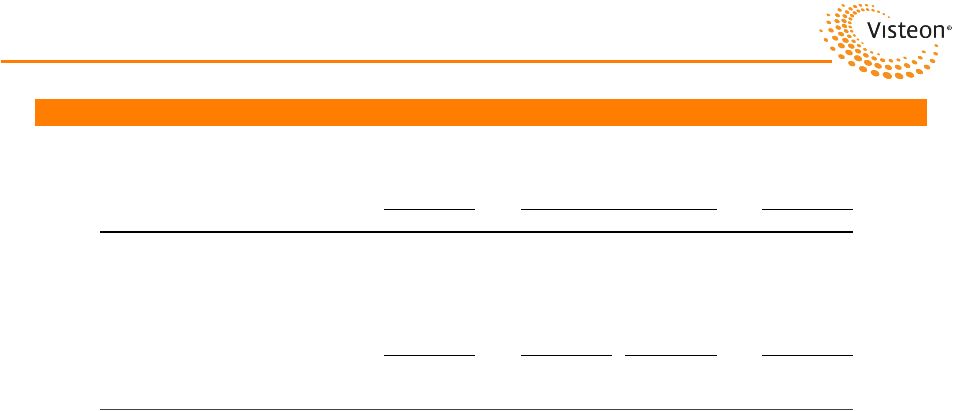
 Page 11 Corporate Rightsizing Minimal footprint Staff businesses with lean and only “necessary” support Visteon: The Status (August 13, 2013) Overview “Corporate centric” business model being replaced with “stand-alone” capable business units Opportunity to relocate and/or charge shared service centers to better match profitable locations, improve tax efficiency – Today Visteon generates profits in certain regions (namely Asia), incurs losses in other regions (includes restructuring and transformation expenses, and net interest expense) – Losses partially funded with dividends….creates significant tax leakage and inefficiencies in our structure Significant opportunity to minimize losses and increase the efficiency of structure going forward The Plan Fixed Costs and SG&A Spend (Originally Presented at DB Conference in Jan 2013 / Updated for 2012 Actual and 2013 Latest Outlook) (Dollars in Millions) $340-$380 2012 Full-Year Tax Provision and Cash Taxes (Presented During Q4 2012 Earnings Call) Visteon Status (1) (2) Please see appendix for important disclosures regarding “Forward Looking Information“ (1) U.S. GAAP basis equity in net income of non-consolidated affiliates. (2) Pro forma effective tax rate not in conformity with U.S. GAAP. (3) Including Non-U.S. withholding taxes related to consolidated dividends, royalties, and other distributions. U.S. GAAP U.S. GAAP Implied Cash (Dollars in Millions) PBT Tax Expense Tax Rate Taxes Halla Climate Control Corp and Affiliates $257 $60 23% $75 Visteon and Affiliates (Profitable) 127 32 25% 35 Visteon and Affiliates (Non-Profitable) (319) 3 (1%) 4 Visteon Non-U.S. Withholding Tax on Non-Consol 226 21 9% 9 Other (3) - 5 N/M 10 Total $291 $121 $133 $485 $437 $412 2011 2012 2013E Goal 42% |
 Yanfeng Visteon Electronics Interiors Our Family of Businesses The YFV Transaction J.P. Morgan Conference – August 2013 |
 Page 13 YFV Transaction: Overview Transaction Visteon is selling its 50% stake in YFV as well as direct stakes in certain Yanfeng-related affiliates (i.e. Halol, Jinqiao, Tooling, Toppower) Visteon is increasing ownership stake in YFVE – Purchasing 11% of YFVE to bring Visteon’s stake to 51% – Purchasing 50% of a New HoldCo which will own 49% of Toppower as well as own stakes in the other YFV electronics-related entities $1,183 million net cash proceeds – $1,053 million gross proceeds for YFV and other direct stakes sold (1) – ($68) million net investment for increased stake in YFVE and electronics-related entities (2) – Cash Consideration Most transactions expected to close during late 2013 / early 2014 Timing subject to customary government and regulatory approvals Timing (1) Excludes proceeds from sale of Toppower. (2) Includes proceeds from sale of Toppower. (3) Actual distribution could vary between $184 million and $211 million due to the proration of certain distributions which depend on the closing date of the transaction.. Please see appendix for important disclosures regarding “Forward Looking Information“ and “Use of Non-GAAP Financial Information” $198 million distribution from existing cash (3) |
 Page 14 YFV Transaction: YFVE Structure YFVE Simplified Structure Future YFVE Structure Proposed YFVE Structure Will Contribute $350 to $400 Million of Consolidated Sales and $40 to $45 Million of EBITDA (Including Equity Income) to the Electronics Product Group Post the transaction, Visteon will own: – 51% stake in YFVE and its main fully owned operations in Songjiang, China – 50% of a New HoldCo which will own 49% of Toppower as well as own stakes in the other YFV electronics-related entities Steps Increase stake in YFVE to 51% through capital increase Capitalize New HoldCo – New HoldCo to acquire 49% stake in Toppower as well as stakes in other YFV electronics-related entities from YFVE Future Consolidated by Visteon 21% 7% 72% % of Total YFVE Sales Please see appendix for important disclosures regarding “Forward Looking Information“ and “Use of Non-GAAP Financial Information” YF Visteon New HoldCo YFVE Other entities Toppower 50% 50% 49% 51% 51% 49% 100% YFV Visteon Sky Captain Songjiang Other entities YFVE Toppower 60% 40% 29.1% 12.5% 58.4% Songjiang Current |
 Page 15 YFV Transaction: Proceeds (Dollars in Millions) Transaction Proceeds Total Transaction Value of Approximately $1.5 Billion YFVE Valuation YFVE EBITDA (3) $43 Eliminate YFV Support Costs 7 Total EBITDA $50 Multiple Based on Comps 6.0x Valuation $300 (2) Amount Paid Value of YFV 50% Stake $928 At Close Direct Stakes in Other Interiors JVs 96 June 2015 (1) Dividends from Other Interiors JVs 28 June 2014 / June 2015 Gross Proceeds $1,053 Cash Distribution 198 At or Near Close Gross Proceeds w/ Distribution $1,251 Payment to Gain YFVE Consolidation (68) At Close Net Cash Proceeds $1,183 YFVE Valuation 300 Total Transaction Value $1,483 Please see appendix for important disclosures regarding “Forward Looking Information“ and “Use of Non-GAAP Financial Information” (1) Substantially all the funds will be received by June 2015. (2) Actual distribution could vary between $184 million and $211 million due to the proration of certain distributions which depend on the closing date of the transaction. (3) Represents YFVE 2013 YTD EBITDA annualized. |
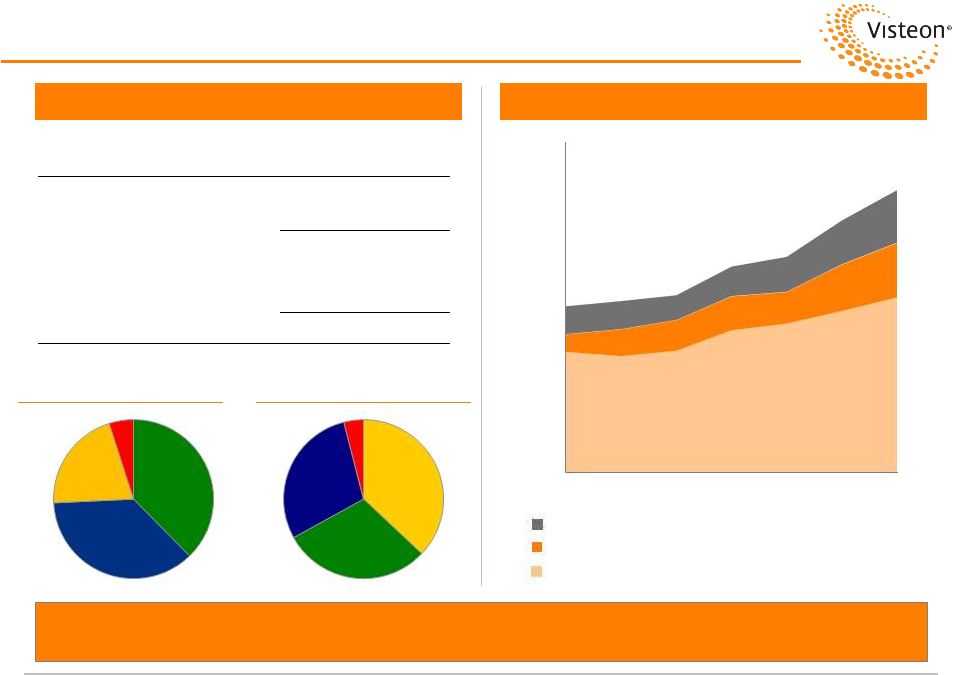 Visteon Electronics Business Page 16 Transaction Solidifies #3 Global Position in Driver Information and Controls Sales Adjusted EBITDA $1,274 $126 Remove YFVE Equity Income – (14) VC Electronics (ex. YFVE) $1,274 $112 New YFVE 457 40 Elims (137) – Adjusted $1,594 $152 Visteon Electronics – 2012 (Dollars in Millions) Visteon Cockpit Electronics Business Pre-YFVE Transaction Post-YFVE Transaction Please see appendix for important disclosures regarding “Forward Looking Information“ and “Use of Non-GAAP Financial Information” Note: Consistent with Visteon’s reporting practices, Adjusted EBITDA includes equity in affiliates and deduction for non-controlling interests. EU 38% NA 37% AP 21% SA 4% AP 37% EU 30% NA 29% SA 4% $0 $500 $1,000 $1,500 $2,000 $2,500 $3,000 2010 2011 2012 2013E 2014E 2015E 2016E Historical Visteon Consolidated Electronics Consolidated YFVE Sales Other Non-Consolidated Sales (China, Indonesia) Visteon Electronics – Base |
 Page 17 YFV Transaction: Impacts to Visteon (Dollars in Millions) 2009 $35 2010 $12 2011 $42 2012 $70 YFV + Visteon Direct Stakes (1) Est. YFVE Est. YFV Non- YFVE YFVE EBITDA Post Deal Support Costs Net Impact 2012 ($126) ($23) $40 $5-10 ($99)-(104) 2013 YTD ($69) ($13) $21 $3-7 ($54)-(58) R YFV Dividend History (ex. Electronics) Impact to Visteon Reported Adjusted EBITDA (Visteon EBITDA Includes YFV Equity Income) Visteon Will Recognize Approximately $100 Million Less in Adjusted EBITDA and Will Gain Approximately $1.1 Billion in After-Tax Cash Proceeds Please see appendix for important disclosures regarding “Forward Looking Information“ and “Use of Non-GAAP Financial Information” (1) Represents equity income from Yanfeng and related entities that is included in Visteon’s Adjusted EBITDA. Note: Visteon will also consolidate YFVE cash post the transaction. YFVE cash balance was $40 million at 6/30/2013. |
 Yanfeng Visteon Electronics Interiors Our Family of Businesses Post YFV J.P. Morgan Conference – August 2013 |
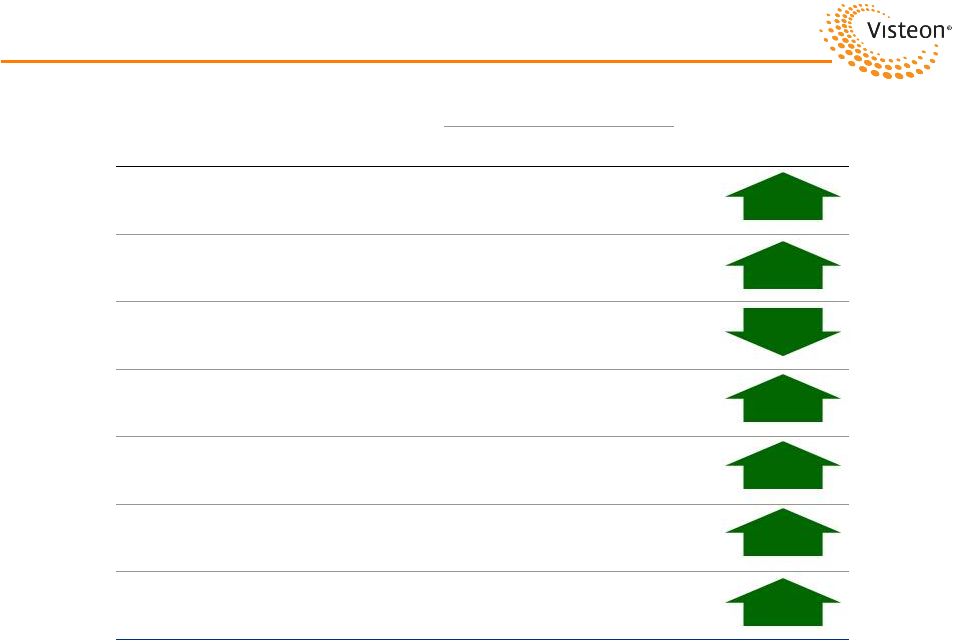
 Page 19 Visteon: Post YFV #2 in the world in high-growth climate market 7%+ Revenue CAGR Powerful technology Strong balance sheet Generates cash Please see appendix for important disclosures regarding “Forward Looking Information“ Electronics #3 in the world in driver information and controls 12%+ Revenue CAGR Powerful technology Strong balance sheet Generates cash Interiors World-class IP technology Managing through Europe downturn Restructuring business for future growth while exploring divestment opportunities Visteon Consolidating Around Two World-class Core Businesses 70% 100% 100% |
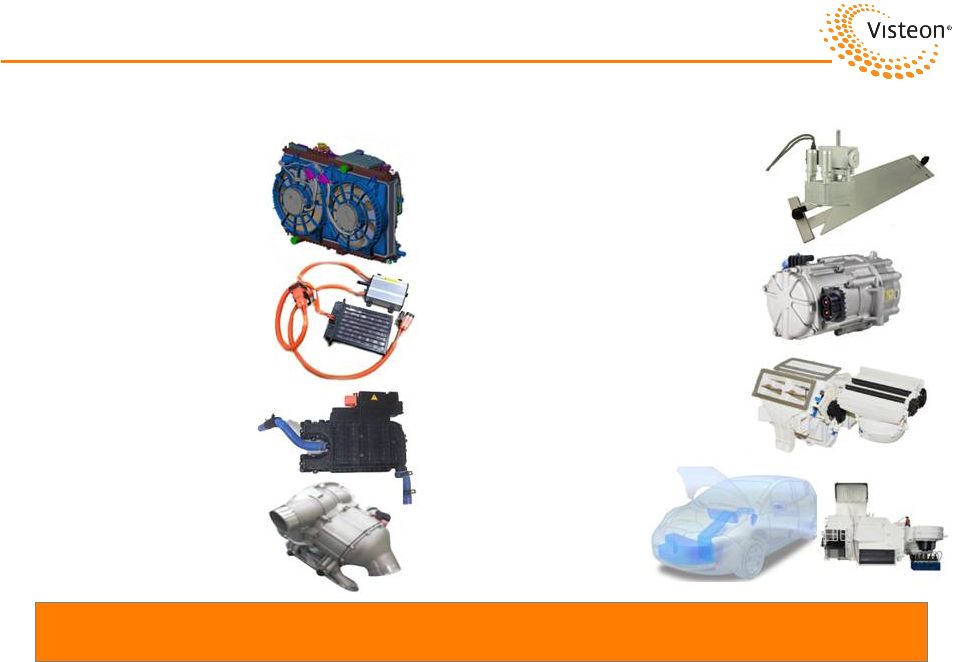
 Climate Segment Undergoing Revolution in Product Compressors Powertrain Cooling EV & Hybrid Battery Cooling Fluid Transport HVAC Page 20 Please see appendix for important disclosures regarding “Forward Looking Information“ HVCC: One of Only Two Climate Companies With A Complete Product Line |
 Page 21 Visteon: HVCC Driving Climate Technology Please see appendix for important disclosures regarding “Forward Looking Information“ Redefining the Climate Portfolio, Generating Content Growth and Margin Expansion Cathode Oxygen Depletion Heater Brushless DC Cooling Module High-Voltage Positive Temperature Coefficient (PTC) Heater Turbo Blower Fuel Cell Vehicle Technologies Hybrid and Electric Vehicle Technologies Battery Chiller and Contact Heat Exchanger Precise battery temperature control Electric Compressor Lightweight, High-Performance (5.6 kW cooling capacity) HVAC with High-Efficiency Blower Scroll Significant reduction in power consumption and noise Integrated Climate System Module Revolutionizes cockpit design by relocating HVAC in engine compartment |
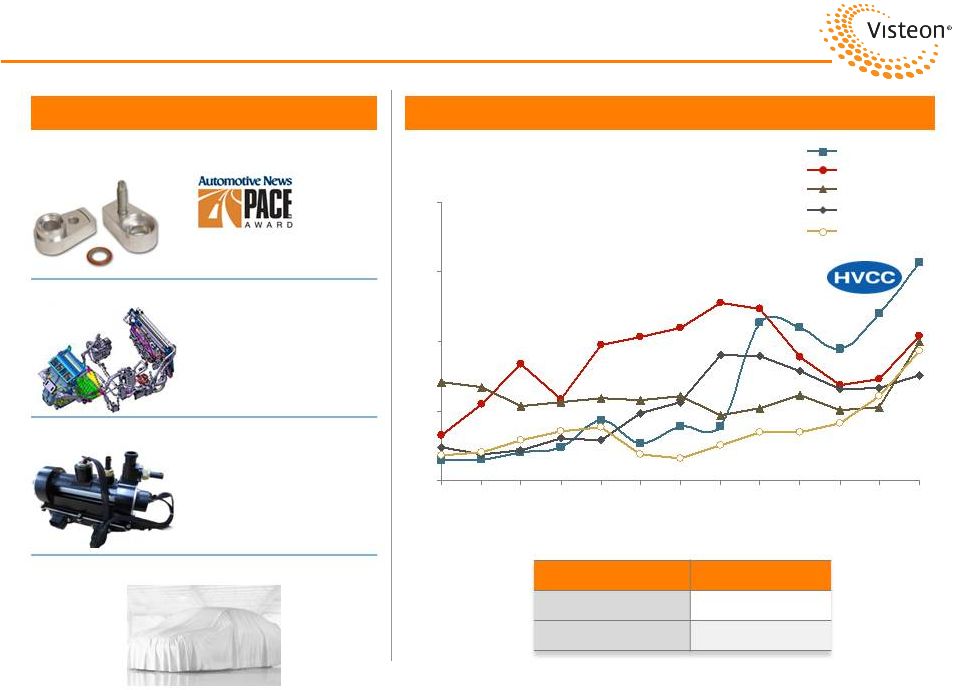 Visteon: HVCC Innovative Technologies and Strong IP Page 22 Please see appendix for important disclosures regarding “Forward Looking Information“ Intellectual Property Innovative Technologies TF* Coolant Heater for Electric Vehicle World First Rapid Cabin Heating & Compact Structure More Innovation To Come * Thin Film. Heat Pump System for Electric Vehicle Metal Seal Fitting for Reducing Refrigerant Leakage 2010 2009 2008 2007 2006 2005 2004 2003 2002 2001 2000 2012 0 100 200 300 400 2011 Publication Year # of Released Patents Competitor D Competitor C Competitor B HVCC Competitor A Source: Boston Consulting Group. 2013 PACE Award 2012 New Excellent Technology (NET) Certificate IP Application Registration 2,279 7,538 HVCC |
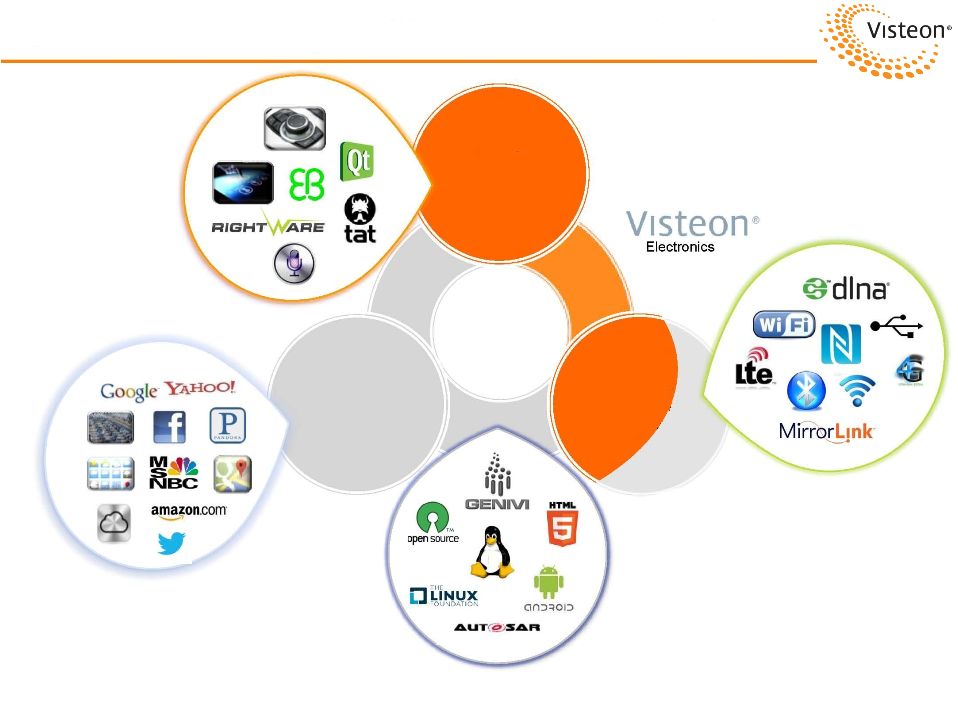 Automotive Converges with Consumer Electronics Page 23 Please see appendix for important disclosures regarding “Forward Looking Information“ Note: Logos above are trademarks and copyrights of the respective companies. Next Generation User Interface Open Source Software Environment Cloud Content & Services Always Connected “Pipeline” |
 Page 24 Visteon: Driving Electronics Technology Advanced Instrument Clusters • Third generation reconfigurable clusters • Leading 3-D graphics • Superior display resolution Next Generation Display Technologies • Consumer electronics-driven user interaction • OEM styling freedom • Optimized viewability Open Architecture Infotainment • Contextual, intuitive HMI • Car-to-Cloud connectivity • “SmartScreen” smartphone integration Redefining the Electronics Portfolio, Generating Content Growth and Margin Expansion |
 Page 25 Visteon: Driving Technology Please see appendix for important disclosures regarding “Forward Looking Information“ Generating Growth, Generating Value |
 Page 26 Visteon: Post YFV (Financial Outlook) Revenue Adjusted EBITDA Cash $7.3 - $7.5B $7.8 - $8.0B $660 - $690M $600 - $640M $1.0B $2.1B $7.3 - $7.5B $620 - $660M KRW (1) 1,094 1,120 1,110 Euro $1.30 $1.30 $1.30 Interiors (ex. YFV) Visteon 2014 Adjusted EBITDA Post YFV Transaction is 3% Below Our Original 2013 Guidance and We Have $1.1 Billion of Additional After-tax Cash Proceeds Note: Consistent with Visteon’s reporting practices, Adjusted EBITDA includes equity in affiliates and deduction for non-controlling interests. (1) Effective rate with hedges. Please see appendix for important disclosures regarding “Forward Looking Information“ and “Use of Non-GAAP Financial Information” 6/30/2013 6/30/2013 PF for YFV Transaction 2013 Original Guidance 2013 Revised Guidance 2014 Post YFV 2013 Original Guidance 2013 Revised Guidance 2014 Post YFV |
 Page 27 Going Forward Visteon Focusing on Core Value Creating Assets – Both core businesses among industry leaders – Both exhibit higher than segment growth – Bottom line being enhanced by Corporate fixed cost & SG&A reductions YFV Transaction Affords Significant Balance Sheet Optimization… The Plan: $1 Billion Share Buyback – Board authorized an upsize of remaining share repurchase program to $1 billion though December 2015 Visteon Well Positioned to Continue Value Creation – Balance sheet optimization – Above industry growth in core operations with expanding margins Visteon Focused on Continuing to Drive Shareholder Value Please see appendix for important disclosures regarding “Forward Looking Information“ |
 Appendix J.P. Morgan Conference – August 2013 Yanfeng Visteon Electronics Interiors Our Family of Businesses |
 Page 29 Forward-Looking Information This presentation contains "forward-looking statements" within the meaning of the Private Securities Litigation Reform Act of 1995. Forward-looking statements are not guarantees of future results and conditions but rather are subject to various factors, risks and uncertainties that could cause our actual results to differ materially from those expressed in these forward- looking statements, including, but not limited to, conditions within the automotive industry, including (i) the automotive vehicle production volumes and schedules of our customers, and in particular Ford's and Hyundai-Kia’s vehicle production volumes, (ii) the financial condition of our customers and the effects of any restructuring or reorganization plans that may be undertaken by our customers, including work stoppages at our customers, and (iii) possible disruptions in the supply of commodities to us or our customers due to financial distress, work stoppages, natural disasters or civil unrest; our ability to satisfy future capital and liquidity requirements; including our ability to access the credit and capital markets at the times and in the amounts needed and on terms acceptable to us; our ability to comply with financial and other covenants in our credit agreements; and the continuation of acceptable supplier payment terms; our ability to execute on our transformational plans and cost-reduction initiatives in the amounts and on the timing contemplated; our ability to satisfy pension and other post-employment benefit obligations; our ability to access funds generated by foreign subsidiaries and joint ventures on a timely and cost effective basis; general economic conditions, including changes in interest rates and fuel prices; the timing and expenses related to internal restructurings, employee reductions, acquisitions or dispositions and the effect of pension and other post- employment benefit obligations; increases in raw material and energy costs and our ability to offset or recover these costs, increases in our warranty, product liability and recall costs or the outcome of legal or regulatory proceedings to which we are or may become a party; and those factors identified in our filings with the SEC (including our Annual Report on Form 10-K for the fiscal year ended December 31, 2012). Caution should be taken not to place undue reliance on our forward-looking statements, which represent our view only as of the date of this presentation, and which we assume no obligation to update. New business wins and re-wins do not represent firm orders or firm commitments from customers, but are based on various assumptions, including the timing and duration of product launches, vehicle productions levels, customer price reductions and currency exchange rates. |
 Page 30 Because not all companies use identical calculations, Adjusted Gross Margin, Adjusted SG&A, Adjusted EBITDA, Adjusted Net Income, Adjusted EPS, Free Cash Flow and Adjusted Free Cash Flow used throughout this presentation may not be comparable to other similarly titled measures of other companies. In order to provide the forward-looking non-GAAP financial measures for full-year 2013, the Company is providing reconciliations to the most directly comparable GAAP financial measures on the subsequent slides. The provision of these comparable GAAP financial measures is not intended to indicate that the Company is explicitly or implicitly providing projections on those GAAP financial measures, and actual results for such measures are likely to vary from those presented. The reconciliations include all information reasonably available to the Company at the date of this presentation and the adjustments that management can reasonably predict. Use of Non-GAAP Financial Information |
 Page 31 Reconciliation of Non-GAAP Financial Information Sales The Company defines Adjusted Gross Margin as gross margin, adjusted to eliminate the impacts of employee severance, pension settlements, other non-operating costs and stock-based compensation expense. Adjusted Gross Margin The Company defines Adjusted SG&A as SG&A, adjusted to eliminate the impacts of employee severance, pension settlements, other non- operating costs and stock- based compensation expense. Adjusted SG&A 2012 2013 (Dollars in Millions) 1st Qtr 2nd Qtr 3rd Qtr 4th Qtr Full Year 1st Qtr 2nd Qtr $1,856 $1,819 $1,656 $1,823 $7,154 $1,856 $1,892 Less: Discontinued operations 139 126 32 - 297 - - Net sales, products $1,717 $1,693 $1,624 $1,823 $6,857 $1,856 $1,892 2012 2013 (Dollars in Millions) 1st Qtr 2nd Qtr 3rd Qtr 4th Qtr Full Year 1st Qtr 2nd Qtr Gross margin (incl. discontinued operations) $150 $141 $133 $198 $622 $154 $185 Less: Discontinued operations 16 13 4 - 33 - - Gross margin $134 $128 $129 $198 $589 $154 $185 Less: Employee severance, pension settlements and other (4) (2) - (11) (17) - - Subtotal ($4) ($2) $0 ($11) ($17) $0 $0 Adjusted gross margin $138 $130 $129 $209 $606 $154 $185 2012 2013 (Dollars in Millions) 1st Qtr 2nd Qtr 3rd Qtr 4th Qtr Full Year 1st Qtr 2nd Qtr SG&A (incl. discontinued operations) $94 $90 $90 $102 $376 $86 $91 Less: Discontinued operations 3 3 1 0 7 0 0 SG&A $91 $87 $89 $102 $369 $86 $91 Less: Employee severance, pension settlements and other 1 - 4 5 10 - - Stock-based compensation expense 7 6 6 5 24 6 4 Subtotal $8 $6 $10 $10 $34 $6 $4 Adjusted SG&A $83 $81 $79 $92 $335 $80 $87 Net sales, products (incl. discontinued operations) |
 Page 32 Reconciliation of Non-GAAP Financial Information (cont’d) Adjusted EBITDA Free Cash Flow and Adjusted Free Cash Flow 2012 2013 2013 FY Guidance 2014 FY Guidance (Dollars in Millions) Full Year 1st Qtr 2nd Qtr Low-end High-end Low-end High-end Adjusted EBITDA $626 $170 $187 $660 $690 $600 $640 Interest expense, net 35 10 9 40 40 55 45 Provision for income taxes 121 (18) 39 90 55 165 125 Depreciation and amortization 258 67 65 265 265 265 265 Restructuring expense 79 20 3 100 75 50 25 Equity investment gain (63) - - - - - - Other income and expense 41 16 (1) 40 30 - - Other non-operating costs, net 27 - 3 10 10 - - Stock-based compensation expense 25 6 4 20 20 15 15 Discontinued operations net loss/(income) 3 - - - - - - Net Income (loss) attributable to Visteon $100 $69 $65 $95 $195 $50 $165 2012 2013 2013 FY Guidance (Dollars in Millions) 1st Qtr 2nd Qtr 3rd Qtr 4th Qtr Full Year 1st Qtr 2nd Qtr Low-end High-end Cash from (used by) operating activities $19 ($12) $156 $76 $239 $122 $36 $225 $300 Less: Capital expenditures 53 49 44 83 229 63 51 250 250 Free cash flow ($34) ($61) $112 ($7) $10 $59 ($15) ($25) $50 Reconciliations to Adjusted Free Cash Flow (ex. Restructuring and Transaction-Related Cash) Free cash flow ($34) ($61) $112 ($7) $10 $59 ($15) ($25) $50 Exclude: Restructuring cash payments 38 3 2 3 46 15 11 100 75 Exclude: Transaction-related cash 22 7 6 11 46 21 6 60 45 Adjusted free cash flow $26 ($51) $120 $7 $102 $95 $2 $135 $170 |
 Page 33 Reconciliations of Adjusted Net Income, Earnings per Share and Adjusted Earnings per Share 2012 2013 2013 FY Guidance (Dollars and Shares in Millions) 1st Qtr 2nd Qtr 3rd Qtr 4th Qtr Full Year 1st Qtr 2nd Qtr Low-end High-end Net income (loss) attributable to Visteon ($29) $75 $15 $39 $100 $69 $65 $95 $195 Average shares outstanding, diluted 51.9 53.7 53.8 53.0 53.3 51.9 50.5 50.7 50.7 Earnings per share ($0.56) $1.40 $0.28 $0.74 $1.88 $1.33 $1.29 $1.87 $3.85 Memo: Items Included in Net income (loss) attributable to Visteon Restructuring expense (41) (1) (2) (35) (79) (20) (3) (100) (75) Equity investment gain - 63 - - 63 - - - - Other income and expense (22) (10) 9 (18) (41) (16) 1 (40) (30) Other non-operating costs, net (5) (2) (5) (15) (27) - (4) (10) (10) Taxes related to equity investment gain - (6) - - (6) - - - - Lighting net income / (loss) 3 (1) (5) - (3) - - - - Total ($65) $43 ($3) ($68) ($93) ($36) ($6) ($150) ($115) Memo: Adjusted EPS Net income (loss) attributable to Visteon ($29) $75 $15 $39 $100 $69 $65 $95 $195 Items in net income (loss) attributable to Visteon (65) 43 (3) (68) (93) (36) (6) (150) (115) Adjusted net income (loss) $36 $32 $18 $107 $193 $105 $71 $245 $310 Average shares outstanding, diluted 51.9 53.7 53.8 53.0 53.3 51.9 50.5 50.7 50.7 Adjusted earnings per share $0.69 $0.60 $0.33 $2.02 $3.62 $2.02 $1.41 $4.83 $6.11 |
 Page 34 Reconciliation of Climate Financial Information Climate 2012 2013 (Dollars in Millions) 1st Qtr 2nd Qtr 3rd Qtr 4th Qtr Full Year 1st Qtr 2nd Qtr YTD Product Sales $1,023 $1,065 $1,024 $1,174 $4,286 $1,228 $1,247 $2,475 Gross Margin $89 $81 $89 $119 $378 $112 $121 $233 Employee Charges / Corp Severance - (1) - (8) (9) - - - Adjusted Gross Margin $89 $82 $89 $127 $387 $112 $121 $233 % of Sales 8.7% 7.7% 8.7% 10.8% 9.0% 9.1% 9.7% 9.4% SG&A Product Line Specific and Allocated SG&A (35) (37) (35) (38) (145) (36) (35) (71) Employee Charges / Corp Severance - - - - - - - - Adjusted SG&A ($35) ($37) ($35) ($38) ($145) ($36) ($35) ($71) Adjusted EBITDA Adjusted Gross Margin $89 $82 $89 $127 $387 $112 $121 $233 Adjusted SG&A (35) (37) (35) (38) (145) (36) (35) (71) Exclude D&A 45 49 46 46 186 49 50 99 Adjusted EBITDA (excl. Equity in Affil., NCI) $99 $94 $100 $135 $428 $125 $136 $261 % of Sales 9.7% 8.8% 9.8% 11.5% 10.0% 10.2% 10.9% 10.5% Equity in Affiliates 1 1 - 3 5 2 3 5 Noncontrolling Interests (16) (9) (18) (20) (63) (14) (20) (34) Adjusted EBITDA $84 $86 $82 $118 $370 $113 $119 $232 |
 Page 35 Reconciliation of Electronics Financial Information Electronics 2012 2013 (Dollars in Millions) 1st Qtr 2nd Qtr 3rd Qtr 4th Qtr Full Year 1st Qtr 2nd Qtr YTD Product Sales $329 $304 $304 $337 $1,274 $365 $354 $719 Gross Margin $29 $33 $23 $53 $138 $37 $41 $78 Employee Charges / Corp Severance - - - (2) (2) - - - Cadiz Non-Operating Costs (4) - - 3 (1) - - - Adjusted Gross Margin $33 $33 $23 $52 $141 $37 $41 $78 % of Sales 10.0% 10.9% 7.6% 15.4% 11.1% 10.1% 11.6% 10.8% SG&A Product Line Specific and Allocated SG&A (16) (15) (15) (17) (63) (18) (18) (36) Employee Charges / Corp Severance - - - - - - - - Adjusted SG&A ($16) ($15) ($15) ($17) ($63) ($18) ($18) ($36) Adjusted EBITDA Adjusted Gross Margin $33 $33 $23 $52 $141 $37 $41 $78 Adjusted SG&A (16) (15) (15) (17) (63) (18) (18) (36) Exclude D&A 8 8 8 7 31 7 7 14 Adjusted EBITDA (excl. Equity in Affil., NCI) $25 $26 $16 $42 $109 $26 $30 $56 % of Sales 7.6% 8.6% 5.3% 12.5% 8.6% 7.1% 8.5% 7.8% Equity in Affiliates 3 4 5 6 18 4 5 9 Noncontrolling Interests - - (1) - (1) - - - Adjusted EBITDA $28 $30 $20 $48 $126 $30 $35 $65 |
 Page 36 Reconciliation of Interiors Financial Information Interiors 2012 2013 (Dollars in Millions) 1st Qtr 2nd Qtr 3rd Qtr 4th Qtr Full Year 1st Qtr 2nd Qtr YTD Product Sales $393 $352 $307 $336 $1,388 $317 $334 $651 Gross Margin $16 $14 $17 $27 $74 $5 $23 $28 Employee Charges / Corp Severance - (1) - (3) (4) - - 0 Adjusted Gross Margin $16 $15 $17 $30 $78 $5 $23 $28 % of Sales 4.1% 4.3% 5.5% 8.9% 5.6% 1.6% 6.9% 4.3% SG&A Product Line Specific and Allocated SG&A (19) (18) (15) (17) (69) (17) (19) (36) Employee Charges / Corp Severance - - - - - - - - Adjusted SG&A ($19) ($18) ($15) ($17) ($69) ($17) ($19) ($36) D&A 8 7 8 8 31 8 7 15 Adjusted D&A $8 $7 $8 $8 $31 $8 $7 $15 Adjusted EBITDA Adjusted Gross Margin $16 $15 $17 $30 $78 $5 $23 $28 Adjusted SG&A (19) (18) (15) (17) (69) (17) (19) (36) Adjusted D&A 8 7 8 8 31 8 7 15 Adjusted EBITDA (excl. Equity in Affil., NCI) $5 $4 $10 $21 $40 ($4) $11 $7 % of Sales 1.3% 1.1% 3.3% 6.3% 2.9% (1.3%) 3.3% 1.1% Equity in Affiliates, excluding YFJC gain 38 35 34 34 141 38 37 75 Noncontrolling Interests (2) - - (1) (3) (1) (1) (2) Adjusted EBITDA $41 $39 $44 $54 $178 $33 $47 $80 |
 Page 37 Reconciliation of YFVE Adjusted EBITDA YFVE – Pro Forma Adjusted EBITDA Impact to Visteon Post Transaction Note: Estimates only, not purported to be U.S. GAAP. 2012 Actual 2013 Full-Year Estimate 2013 Actual (Dollars in Millions) Full Year Low-end High-end 1st Half Adjusted EBITDA $40 $40 $45 $21 Interest expense, net 2 2 2 1 Provision for income taxes 5 5 5 3 Depreciation and amortization 7 9 9 4 Net income $26 $24 $29 $13 |
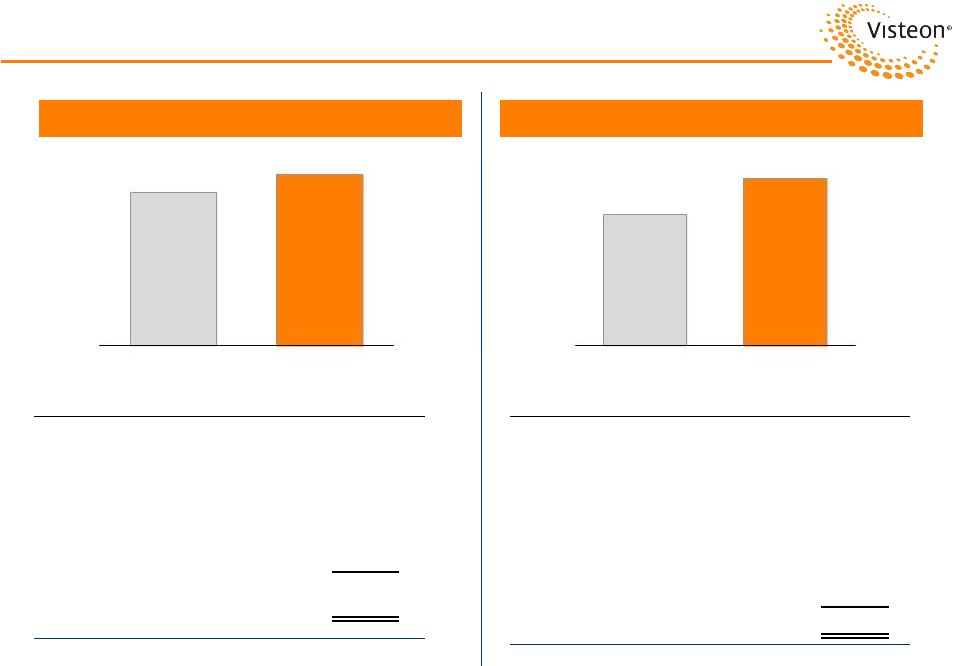
 Second-Quarter Q2 2013 2012 2013 B/(W) 2012 Sales $1,693 $1,892 Adjusted Gross Margin $130 $185 Adjusted SG&A $81 $87 Adjusted EBITDA $147 $187 Adjusted EPS $0.60 $1.41 Free Cash Flow ($61) ($15) Adjusted Free Cash Flow ($51) $2 Page 38 Second-Quarter 2013 Key Financials (Dollars in Millions) 7.7% 4.8% 8.7% 9.8% 4.6% 9.9% $199 $0.81 $46 $53 210 bps 20 bps 120 bps |
 Page 39 Sales and Adjusted EBITDA Y/Y Performance Q2 Volume / Mix $214 Currency 5 Other Changes (20) Total $199 Sales (Dollars in Millions) Adjusted EBITDA Y/Y Performance Q2 Volume / Mix $45 Currency 2 Product Development (2) Business Equation 2 Equity Income 5 Non-Controlling Interest (12) Total $40 8.7% 9.9% $1,693 $1,892 Q2 2012 Q2 2013 $147 $187 Q2 2012 Q2 2013 |
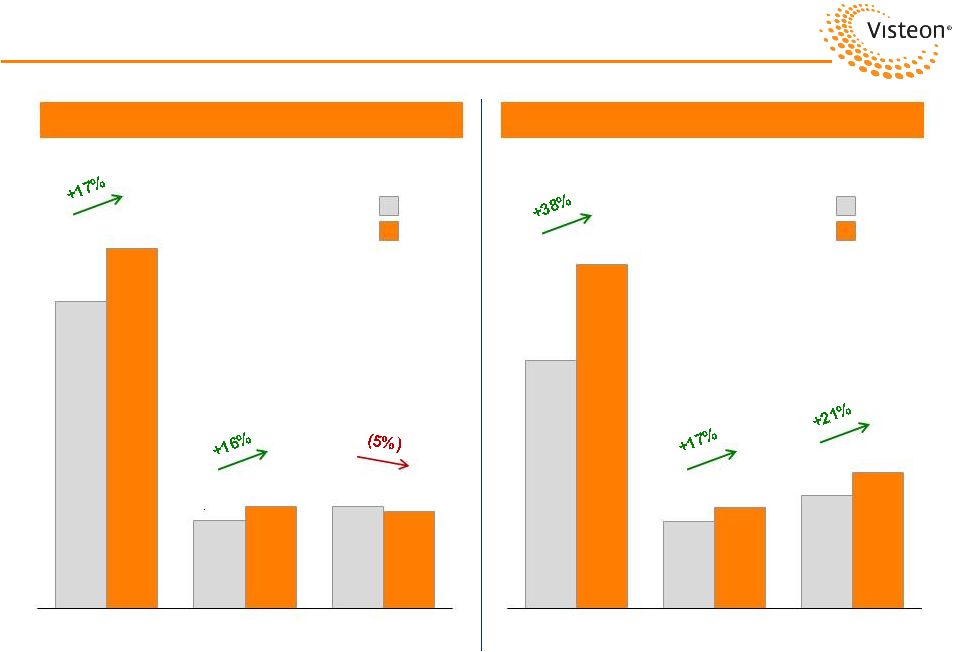 Page 40 Second-Quarter 2013 Segment Financials (Dollars in Millions) Q2 2012 Q2 2013 (Includes Equity in Affiliates and Non-Controlling Interests) Q2 2012 Q2 2013 Note: Excludes $8 million and $14 million of corporate cost expense in Q2 2012 and Q2 2013, respectively. $1,065 $304 $352 $1,247 $354 $334 Climate Electronics Interiors $86 $30 $39 $119 $35 $47 Climate Electronics Interiors Sales Adjusted EBITDA |
 Page 41 Cash Flow / Cash / Debt (Dollars in Millions) Adjusted Free Cash Flow Positive in Second Quarter 2013 (1) Excludes non-cash equity investment amortization (excluded from Adjusted EBITDA). Q1 2013 Q2 2013 YTD Adjusted EBITDA $170 $187 $357 Trade Working Capital 97 (44) 53 Equity Earnings, Net of Dividends (1) (41) (44) (85) Cash Taxes (29) (50) (79) Interest Payments (3) (18) (21) Restructuring / Transaction Payments (36) (17) (53) Non-Controlling Interests 15 21 36 Other Changes (51) 1 (50) Cash from Operations $122 $36 $158 Capital Expenditures (63) (51) (114) Free Cash Flow $59 ($15) $44 Memo: Adjusted FCF (ex. Restructuring / Transaction Payments) $95 $2 $97 6/30/13 Cash ex. HVCC $675 HVCC Cash 333 Total Cash $1,008 Debt ex. HVCC 474 HVCC Debt 325 Total Debt $799 Net Cash $209 Visteon Leverage LTM Adjusted EBITDA $693 Debt / Adj. EBITDA 1.2x Net Debt / Adj. EBITDA N/M Free Cash Flow Visteon Cash and Debt |
 Page 42 2013 Guidance Prior Revised Product Sales $7.3 B - $7.5 B $7.3 B - $7.5 B Adjusted EBITDA $620 M - $660 M $660 M - $690 M Free Cash Flow Free Cash Flow (1) ($75) M - $25 M ($25) M - $50 M Adjusted Free Cash Flow (ex. Restructuring and Transaction-Related) $100 M - $150 M $135 M - $170 M Adjusted EPS $4.04 - $5.52 $4.83 - $6.11 Other Selected Items: Prior Revised Depreciation and Amortization $270 M $265 M Interest Payments $50 M $45 M Cash Taxes Operating $120 M - $140 M $135 M - $160 M Climate Transaction $20 M - $40 M $15 M - $20 M Restructuring Payments $75 M - $125 M $75 M - $100 M Capital Spending $250 M $250 M (1) Free cash flow equal to cash from operating activities, less capital expenditures. Includes $75-$100 million of restructuring and $50-$60 million in taxes and fees, primarily related to Halla Visteon Climate Control transaction. |
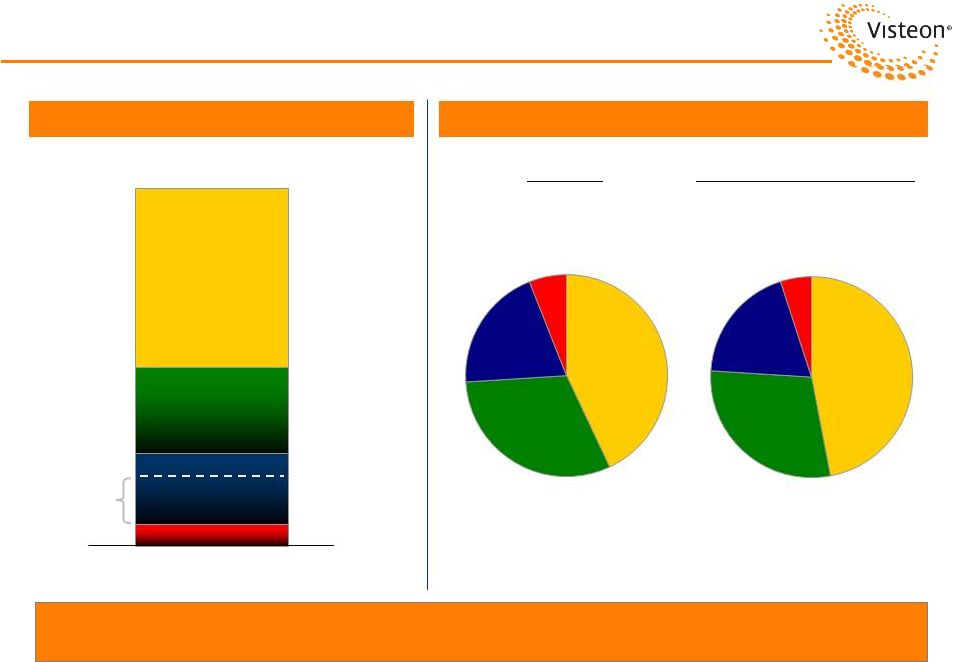 Visteon is Well Positioned with Global Vehicle Production Page 43 Visteon: Post YFV (Sales by Region) AP 43% EU 31% NA 20% SA 6% 21.3 Million Units Asia N. America S. America Source: IHS Automotive. 14% U.S. Current Post YFV Transaction 6% 20% 24% 50% Global Industry Production AP 47% EU 29% NA 19% SA SA 5% Q2 2013 Global Production Visteon Consolidated Sales by Region Europe |
 www.visteon.com |