Exhibit 99.1

Yanfeng Visteon
Electronics
Interiors
Our Family of Businesses
Delivering on Our Commitments
2013 Citi Global Industrials Conference – September 2013

?Strong 1st half 2013 performance
–Sales and Adjusted EBITDA up 10% and 23% Y/Y, respectively
?Over $1 billion of liquidity at June 30, 2013, despite $175 million share buyback and $50 million bond repurchase during last 12 months
?Increased 2013 financial guidance in August
Page 2
Sales Breakdown (1)
2013 Highlights
Asia 43%
Europe 31%
N. America 20%
S. America 6%
Other 36%
Hyundai/Kia 33%
Ford 31%
By Customer
By Region
(1) Represents 2nd quarter 2013 sales for consolidated business only. Excludes non-consolidated joint ventures.
Prior
Revised
Sales
$7.3 - $7.5 B
$7.3 - $7.5 B
Adjusted EBITDA
$620 - $660 M
$660 - $690 M
Adjusted FCF
$100 - $150 M
$135 - $170 M
Adjusted EPS
$4.04 - $5.52
$4.83 - $6.11
Financial Highlights
Global Automotive Supplier with Two Core High Growth, High Margin Businesses
Please see appendix for important disclosures regarding “Forward Looking Information“ and “Use of Non-GAAP Financial Information”

Page 3
Delivering Value
?Solid financial performance
–1st half 2013 Adjusted EBITDA of $357 million, up $67 million Y/Y
–Increased 2013 full-year financial guidance in August
?Significant progress on plan outlined at 2012 Citi Global Industrial Conference
–Visteon business drastically simplified and easier to understand
–Resolving legacy issues
?Announced sale of YFV
–Definitive agreement to sell YFV (ex. YFVE) signed in August
–Approximately $1.2 billion net cash proceeds ($1.1 billion after taxes)
?Focused on two world-class, market-leading businesses
–#2 in Climate, #3 in Driver Information and Controls (Electronics)
–Two high growth, high margin businesses with industry-leading technologies
Please see appendix for important disclosures regarding “Forward Looking Information“ and “Use of Non-GAAP Financial Information”
Focused on Continued Strategy of Optimizing Visteon’s Business Portfolio to Maximize Shareholder Value
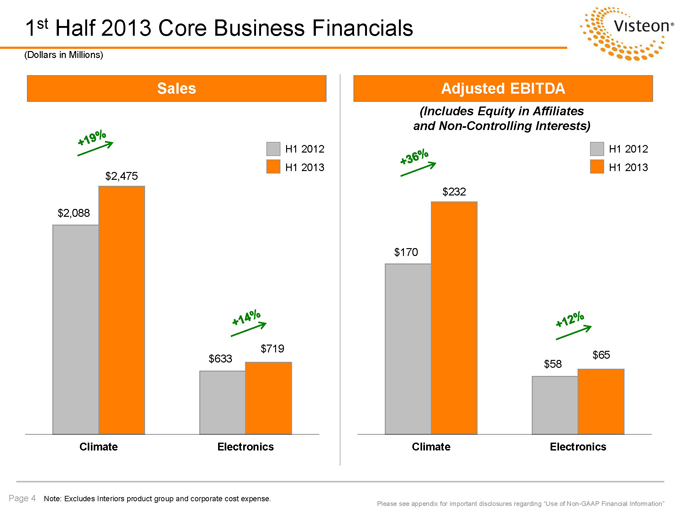
Page 4 $2,088
$633
$2,475
$719
Climate
Electronics
1st Half 2013 Core Business Financials
Sales
(Dollars in Millions) Adjusted EBITDA
$170
$58
$232
$65
Climate
Electronics
H1 2012
H1 2013
Please see appendix for important disclosures regarding “Use of Non-GAAP Financial Information” (Includes Equity in Affiliates and Non-Controlling Interests)
H1 2012
H1 2013
Note: Excludes Interiors product group and corporate cost expense.

Yanfeng Visteon
Electronics
Interiors
Our Family of Businesses
Progressing the Plan
2013 Citi Global Industrials Conference – September 2013
Page 6
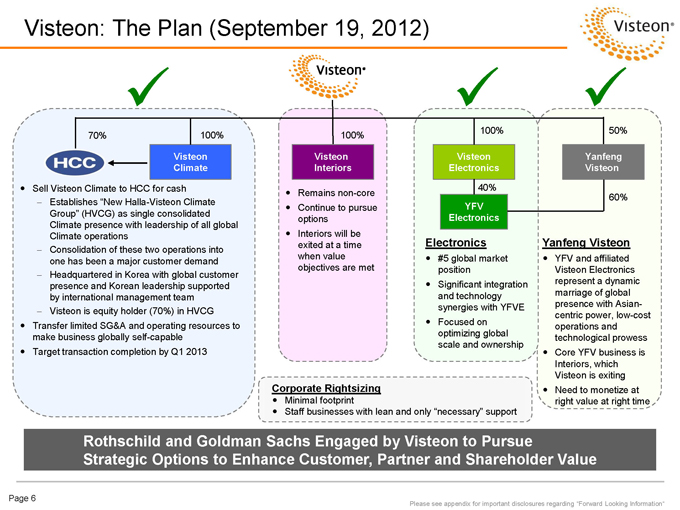
Visteon: The Plan (September 19, 2012)
Visteon
Climate
Yanfeng
Visteon
70%
100%
50%
100%
100%
Visteon
Interiors
Visteon
Electronics
?Sell Visteon Climate to HCC for cash
?Establishes “New Halla-Visteon Climate Group” (HVCG) as single consolidated Climate presence with leadership of all global Climate operations
?Consolidation of these two operations into one has been a major customer demand
?Headquartered in Korea with global customer presence and Korean leadership supported by international management team
?Visteon is equity holder (70%) in HVCG
?Transfer limited SG&A and operating resources to make business globally self-capable
?Target transaction completion by Q1 2013
?Remains non-core
?Continue to pursue options
?Interiors will be exited at a time when value objectives are met
Electronics
?#5 global market position
?Significant integration and technology synergies with YFVE
?Focused on optimizing global scale and ownership
YFV
Electronics
60%
40%
Yanfeng Visteon
?YFV and affiliated Visteon Electronics represent a dynamic marriage of global presence with Asian-centric power, low-cost operations and technological prowess
?Core YFV business is Interiors, which Visteon is exiting
?Need to monetize at right value at right time
Please see appendix for important disclosures regarding “Forward Looking Information“
Rothschild and Goldman Sachs Engaged by Visteon to Pursue Strategic Options to Enhance Customer, Partner and Shareholder Value
Corporate Rightsizing
?Minimal footprint
?Staff businesses with lean and only “necessary” support

Page 7
?Contribute Climate business to Halla, create HVCC – a global climate powerhouse
?Sell Interiors business
?Address Electronics’ strategy and global position
?Monetize YFV, over time…and at right value
?Rightsize corporate functions in response to actions above
Delivering on Our Commitments
Significant Progress on Plan Outlined at 2012 Citi Global Industrial Conference Success Milestones Presented September 19, 2012 Current Status September 2013
?Completed – Contributed Climate business to Halla in Q1 2013
Divestiture remains a priority
?Announced – Increasing YFVE ownership, allowing consolidation
?Announced – Definitive agreement to sell YFV (ex. YFVE) signed in Aug
In process: On track to achieve targeted fixed cost / SG&A reduction
Please see appendix for important disclosures regarding “Forward Looking Information“ and “Use of Non-GAAP Financial Information”
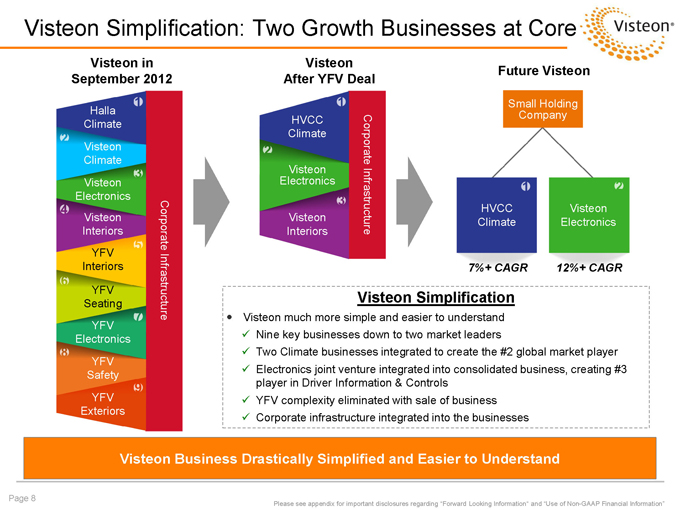
Visteon Simplification: Two Growth Businesses at Core Page 8 Visteon in September 2012 Visteon After YFV Deal Future Visteon Halla Climate Visteon Climate
Visteon Electronics Visteon Interiors
YFV Interiors YFV Seating YFV Electronics YFV Safety
YFV Exteriors
Corporate Infrastructure
HVCC Climate Visteon Electronics
Visteon Interiors
HVCC Climate Visteon Electronics
Small Holding Company
7%+ CAGR
12%+ CAGR
Corporate Infrastructure
Visteon Simplification
?Visteon much more simple and easier to understand
?Nine key businesses down to two market leaders
?Two Climate businesses integrated to create the #2 global market player
?Electronics joint venture integrated into consolidated business, creating #3 player in Driver Information & Controls
?YFV complexity eliminated with sale of business
?Corporate infrastructure integrated into the businesses
Visteon Business Drastically Simplified and Easier to Understand
Please see appendix for important disclosures regarding “Forward Looking Information“ and “Use of Non-GAAP Financial Information”
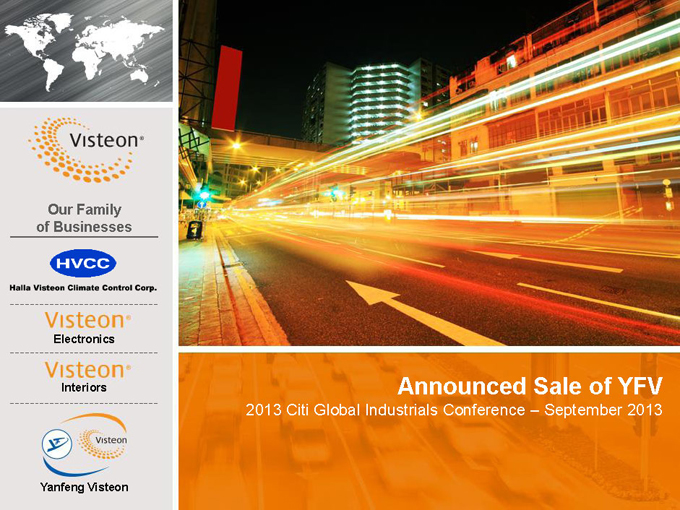
Yanfeng Visteon
Electronics
Interiors
Our Family of Businesses
Announced Sale of YFV
2013 Citi Global Industrials Conference – September 2013
Page 10
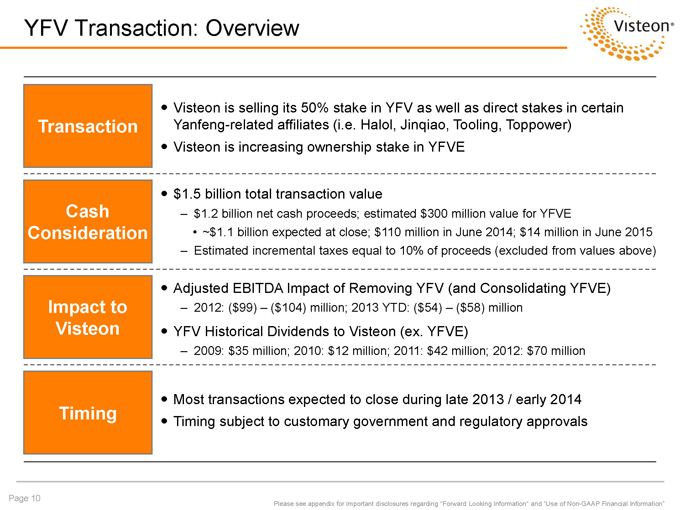
YFV Transaction: Overview
Transaction
?Visteon is selling its 50% stake in YFV as well as direct stakes in certain Yanfeng-related affiliates (i.e. Halol, Jinqiao, Tooling, Toppower)
?Visteon is increasing ownership stake in YFVE
?$1.5 billion total transaction value
–$1.2 billion net cash proceeds; estimated $300 million value for YFVE
~$1.1 billion expected at close; $110 million in June 2014; $14 million in June 2015
–Estimated incremental taxes equal to 10% of proceeds (excluded from values above)
Cash Consideration
?Most transactions expected to close during late 2013 / early 2014
?Timing subject to customary government and regulatory approvals
Timing
Please see appendix for important disclosures regarding “Forward Looking Information“ and “Use of Non-GAAP Financial Information”
Impact to Visteon
?Adjusted EBITDA Impact of Removing YFV (and Consolidating YFVE)
–2012: ($99) – ($104) million; 2013 YTD: ($54) – ($58) million
?YFV Historical Dividends to Visteon (ex. YFVE)
–2009: $35 million; 2010: $12 million; 2011: $42 million; 2012: $70 million
Yanfeng Visteon
Electronics
Interiors
Our Family of Businesses
Focused on Two Market Leaders
2013 Citi Global Industrials Conference – September 2013

Page 12
Focused on Two Market Leaders
?#2 in the world in high-growth climate market
?7%+ Revenue CAGR
?Powerful technology
?Strong balance sheet
?Generates cash
Please see appendix for important disclosures regarding “Forward Looking Information“
Electronics
70% 100%
?#3 in the world in driver information and controls
?12%+ Revenue CAGR
?Powerful technology
?Strong balance sheet
?Generates cash
Interiors
100%
?World-class IP technology
?Managing through Europe downturn
?Restructuring business for future growth while exploring divestment opportunities
Visteon Consolidating Around Two World-class Core Businesses
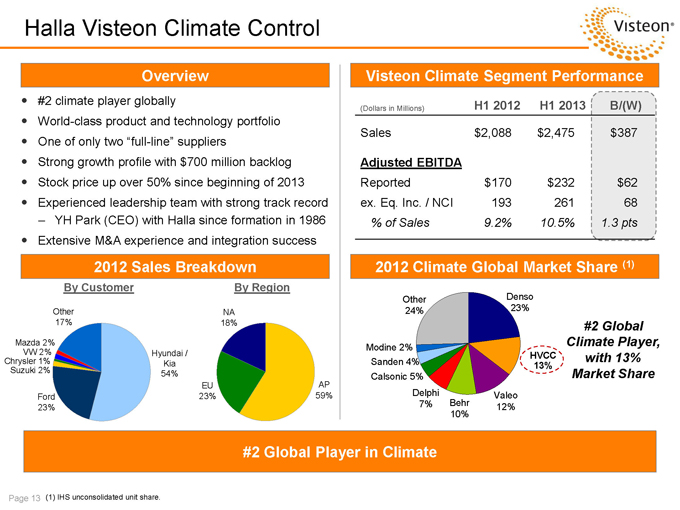
Halla Visteon Climate Control
Page 13
Overview
By Customer
By Region
2012 Sales Breakdown
2012 Climate Global Market Share (1)
(1) IHS unconsolidated unit share.
Visteon Climate Segment Performance
?#2 climate player globally
?World-class product and technology portfolio
?One of only two “full-line” suppliers
?Strong growth profile with $700 million backlog
?Stock price up over 50% since beginning of 2013
?Experienced leadership team with strong track record
–YH Park (CEO) with Halla since formation in 1986
?Extensive M&A experience and integration success
HVCC
13% Denso 23% Valeo 12% Delphi 7% Behr 10% Calsonic 5% Other 24% Modine 2% Sanden 4%
#2 Global Climate Player, with 13% Market Share AP59%EU23%NA18%Other17%Ford23%
Hyundai / Kia 54% Chrysler 1% Suzuki 2% VW 2% Mazda 2%
#2 Global Player in Climate
(Dollars in Millions) H1 2012 H1 2013 B/(W) Sales $2,088 $2,475 $387
Adjusted EBITDA Reported $170 $232 $62 ex. Eq. Inc. / NCI 193 261 68 % of Sales 9.2% 10.5% 1.3 pts
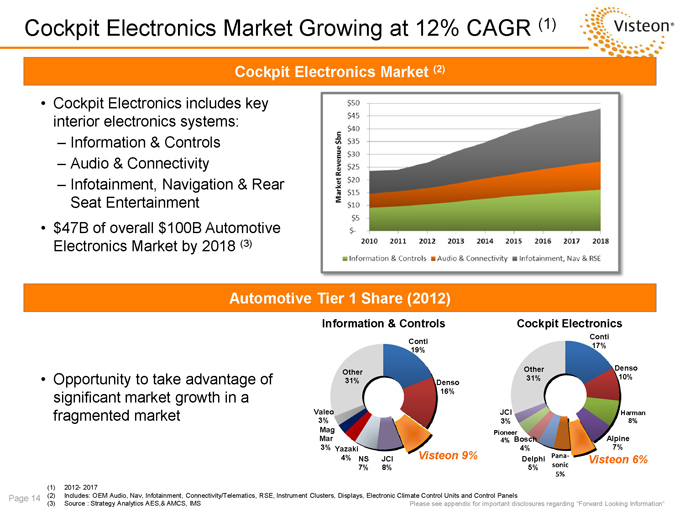
Cockpit Electronics Market Growing at 12% CAGR (1)
(1)2012- 2017
(2)Includes: OEM Audio, Nav, Infotainment, Connectivity/Telematics, RSE, Instrument Clusters, Displays, Electronic Climate Control Units and Control Panels
(3)Source : Strategy Analytics AES,& AMCS, IMS
Cockpit Electronics includes key interior electronics systems:
–Information & Controls
–Audio & Connectivity
–Infotainment, Navigation & Rear Seat Entertainment
$47B of overall $100B Automotive Electronics Market by 2018 (3)
Conti 17% Denso 10% Harman 8% Alpine 7%
Pana-sonic 5% Delphi 5% Bosch 4% Pioneer 4%
JCI 3% Other 31% Visteon 6% Conti 19% Denso 16% JCI 8% NS 7% Yazaki 4% Mag Mar 3% Valeo 3% Other 31% Visteon 9%
Information & Controls
Cockpit Electronics Page 14
Opportunity to take advantage of significant market growth in a fragmented market
Cockpit Electronics Market (2)
Automotive Tier 1 Share (2012)
Please see appendix for important disclosures regarding “Forward Looking Information“
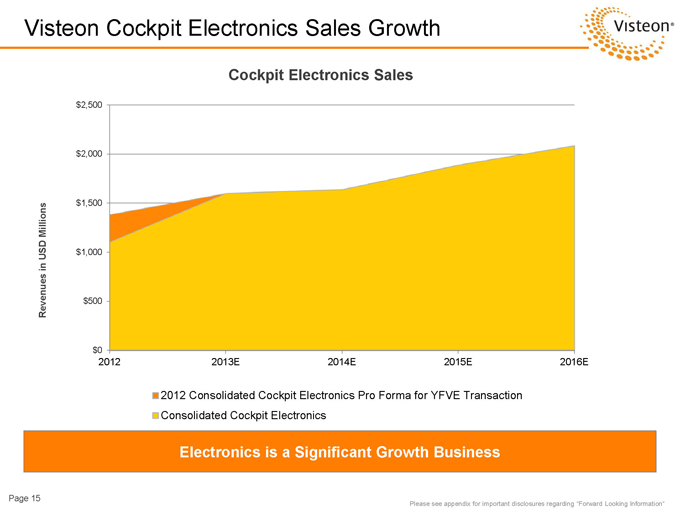
Visteon Cockpit Electronics Sales Growth
$0
$500
$1,000
$1,500
$2,000
$2,500
2012
2013E
2014E
2015E
2016E
2012 Consolidated Cockpit Electronics Pro Forma for YFVE Transaction
Consolidated Cockpit Electronics
Cockpit Electronics Sales
Revenues in USD Millions Page 15 Electronics is a Significant Growth Business Please see appendix for important disclosures regarding “Forward Looking Information“
Page 16
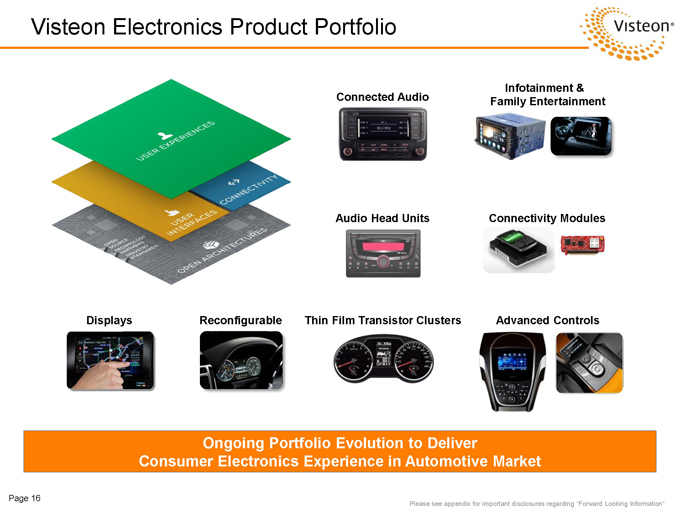
Visteon Electronics Product Portfolio
Connected Audio
Infotainment &
Family Entertainment Connectivity Modules
Audio Head Units
Reconfigurable
Displays
Advanced Controls
Thin Film Transistor Clusters
Ongoing Portfolio Evolution to Deliver Consumer Electronics Experience in Automotive Market
Please see appendix for important disclosures regarding “Forward Looking Information“
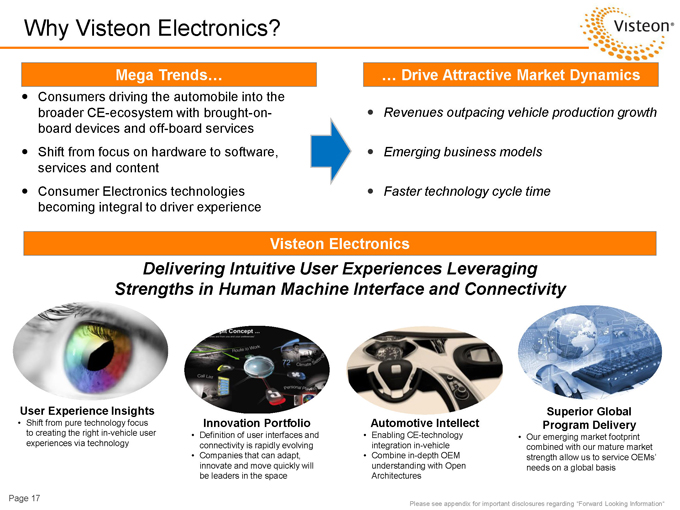
Why Visteon Electronics?
?Consumers driving the automobile into the broader CE-ecosystem with brought-on-board devices and off-board services
?Shift from focus on hardware to software, services and content
?Consumer Electronics technologies becoming integral to driver experience
Delivering Intuitive User Experiences Leveraging
Strengths in Human Machine Interface and Connectivity
Page 17
?Revenues outpacing vehicle production growth
?Emerging business models
?Faster technology cycle time
User Experience Insights
Shift from pure technology focus to creating the right in-vehicle user experiences via technology
Innovation Portfolio
Definition of user interfaces and connectivity is rapidly evolving
Companies that can adapt, innovate and move quickly will be leaders in the space
Automotive Intellect
Enabling CE-technology integration in-vehicle
Combine in-depth OEM understanding with Open Architectures
Superior Global Program Delivery
Our emerging market footprint combined with our mature market strength allow us to service OEMs’ needs on a global basis
Please see appendix for important disclosures regarding “Forward Looking Information“
Mega Trends…
… Drive Attractive Market Dynamics
Visteon Electronics
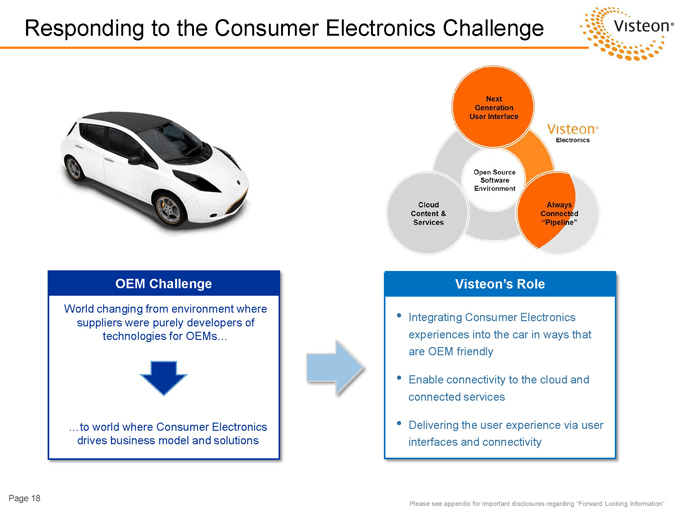
Responding to the Consumer Electronics Challenge Page 18
Integrating Consumer Electronics experiences into the car in ways that are OEM friendly
Enable connectivity to the cloud and connected services
Delivering the user experience via user interfaces and connectivity
Visteon’s Role World changing from environment where suppliers were purely developers of technologies for OEMs… …to world where Consumer Electronics drives business model and solutions OEM Challenge
Please see appendix for important disclosures regarding “Forward Looking Information“
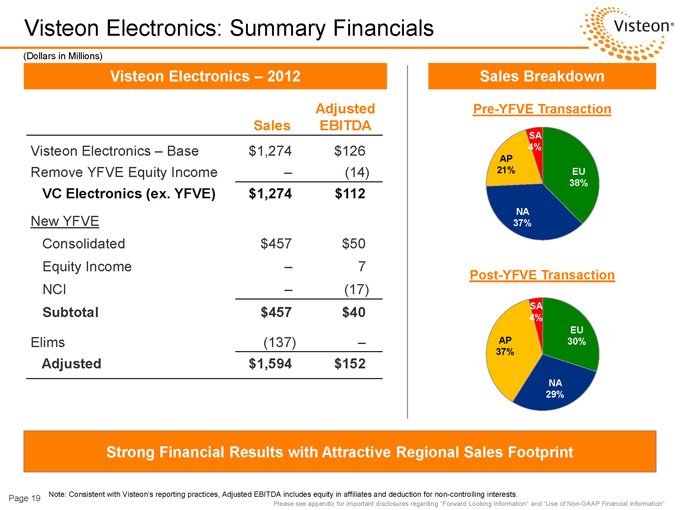
Visteon Electronics: Summary Financials Page 19
Strong Financial Results with Attractive Regional Sales Footprint
Sales Adjusted EBITDA Visteon Electronics – Base
$1,274 $126
Remove YFVE Equity Income
– (14)
VC Electronics (ex. YFVE)
$1,274 $112
New YFVE Consolidated
$457
$50
Equity Income – 7 NCI – (17)
Subtotal $457 $40 Elims
(137) – Adjusted
$1,594 $152
Visteon Electronics – 2012 (Dollars in Millions) Sales Breakdown EU 38% NA 37% AP 21% SA 4%
Pre-YFVE Transaction Post-YFVE Transaction Please see appendix for important disclosures regarding “Forward Looking Information“ and “Use of Non-GAAP Financial Information” Note: Consistent with Visteon’s reporting practices, Adjusted EBITDA includes equity in affiliates and deduction for non-controlling interests. EU 30% NA 29% AP 37% SA 4%

Yanfeng Visteon
Electronics Interiors
Our Family of Businesses
Strong Financial Outlook
2013 Citi Global Industrials Conference – September 2013
6/30/2013
6/30/2013 Post
YFV Transaction 2013 Original Guidance 2013 Revised Guidance 2014 Post YFV
Page 21
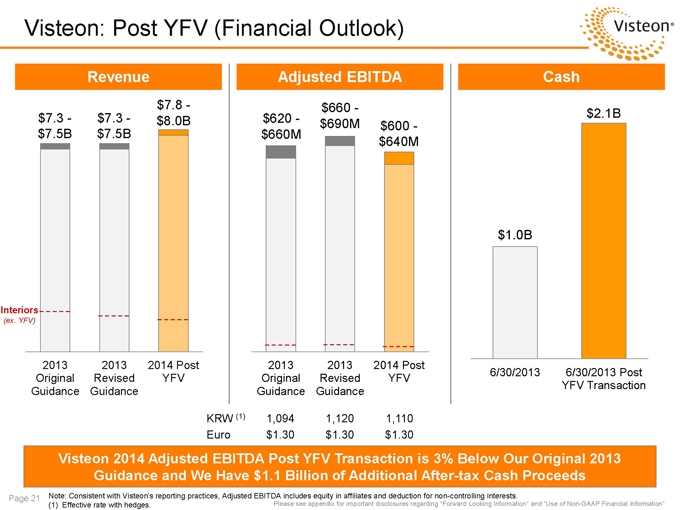
Visteon: Post YFV (Financial Outlook) Revenue
Adjusted EBITDA Cash
2013
Original Guidance 2013 Revised Guidance 2014 Post
YFV $7.3 -$7.5B $7.8 -$8.0B $660 -$690M $600 -$640M $1.0B $2.1B $7.3 -$7.5B $620 -$660M
KRW (1) 1,094 1,120 1,110 Euro $1.30 $1.30 $1.30 Interiors (ex. YFV)
Visteon 2014 Adjusted EBITDA Post YFV Transaction is 3% Below Our Original 2013 Guidance and We Have $1.1 Billion of Additional After-tax Cash Proceeds
Note: Consistent with Visteon’s reporting practices, Adjusted EBITDA includes equity in affiliates and deduction for non-controlling interests. (1) Effective rate with hedges.
Please see appendix for important disclosures regarding “Forward Looking Information“ and “Use of Non-GAAP Financial Information”
Page 22
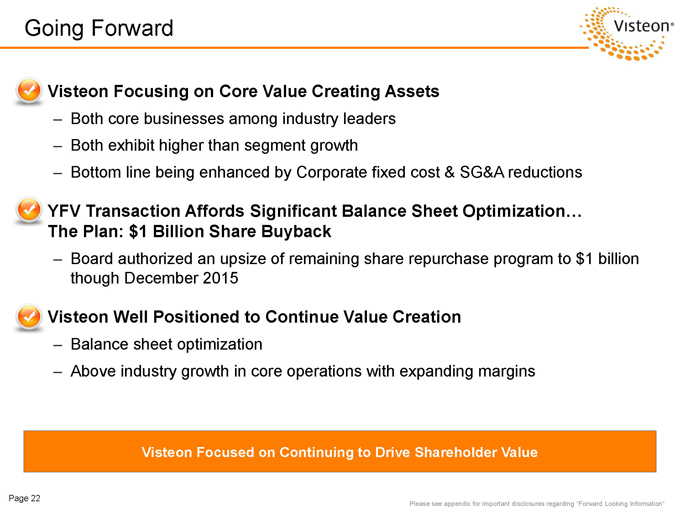
Going Forward
?Visteon Focusing on Core Value Creating Assets
–Both core businesses among industry leaders
–Both exhibit higher than segment growth
–Bottom line being enhanced by Corporate fixed cost & SG&A reductions
?YFV Transaction Affords Significant Balance Sheet Optimization… The Plan: $1 Billion Share Buyback
–Board authorized an upsize of remaining share repurchase program to $1 billion though December 2015
?Visteon Well Positioned to Continue Value Creation
–Balance sheet optimization
–Above industry growth in core operations with expanding margins
Visteon Focused on Continuing to Drive Shareholder Value
Please see appendix for important disclosures regarding “Forward Looking Information“

Yanfeng Visteon
Electronics
Interiors
Our Family of Businesses
Appendix
2013 Citi Global Industrials Conference – September 2013
Forward-Looking Information
This presentation contains “forward-looking statements” within the meaning of the Private Securities Litigation Reform Act of 1995. Forward-looking statements are not guarantees of future results and conditions but rather are subject to various factors, risks and uncertainties that could cause our actual results to differ materially from those expressed in these forward-looking statements, including, but not limited to,
Caution should be taken not to place undue reliance on our forward-looking statements, which represent our view only as of the date of this presentation, and which we assume no obligation to update. New business wins and re-wins do not represent firm orders or firm commitments from customers, but are based on various assumptions, including the timing and duration of product launches, vehicle productions levels, customer price reductions and currency exchange rates.
?conditions within the automotive industry, including (i) the automotive vehicle production volumes and schedules of our customers, and in particular Ford’s and Hyundai-Kia’s vehicle production volumes, (ii) the financial condition of our customers and the effects of any restructuring or reorganization plans that may be undertaken by our customers, including work stoppages at our customers, and (iii) possible disruptions in the supply of commodities to us or our customers due to financial distress, work stoppages, natural disasters or civil unrest;
?our ability to satisfy future capital and liquidity requirements; including our ability to access the credit and capital markets at the times and in the amounts needed and on terms acceptable to us; our ability to comply with financial and other covenants in our credit agreements; and the continuation of acceptable supplier payment terms;
?our ability to execute on our transformational plans and cost-reduction initiatives in the amounts and on the timing contemplated;
?our ability to satisfy pension and other post-employment benefit obligations;
?our ability to access funds generated by foreign subsidiaries and joint ventures on a timely and cost effective basis;
?general economic conditions, including changes in interest rates and fuel prices; the timing and expenses related to internal restructurings, employee reductions, acquisitions or dispositions and the effect of pension and other post-employment benefit obligations;
?increases in raw material and energy costs and our ability to offset or recover these costs, increases in our warranty, product liability and recall costs or the outcome of legal or regulatory proceedings to which we are or may become a party; and
?those factors identified in our filings with the SEC (including our Annual Report on Form 10-K for the fiscal year ended December 31, 2012).
Page 24
Because not all companies use identical calculations, Adjusted Gross Margin, Adjusted SG&A, Adjusted EBITDA, Adjusted Net Income, Adjusted EPS, Free Cash Flow and Adjusted Free Cash Flow used throughout this presentation may not be comparable to other similarly titled measures of other companies.
In order to provide the forward-looking non-GAAP financial measures for full-year 2013 and 2014, the Company is providing reconciliations to the most directly comparable GAAP financial measures on the subsequent slides. The provision of these comparable GAAP financial measures is not intended to indicate that the Company is explicitly or implicitly providing projections on those GAAP financial measures, and actual results for such measures are likely to vary from those presented. The reconciliations include all information reasonably available to the Company at the date of this presentation and the adjustments that management can reasonably predict.
Use of Non-GAAP Financial Information
Page 25
Page 26
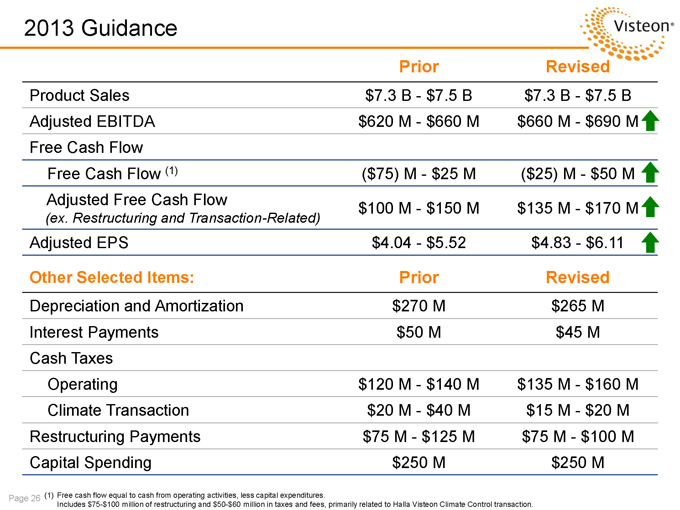
2013 Guidance
Prior Revised
Product Sales $7.3 B - $7.5 B $7.3 B - $7.5 B
Adjusted EBITDA $620 M - $660 M $660 M - $690 M
Free Cash Flow
Free Cash Flow (1) ($75) M - $25 M ($25) M - $50 M
Adjusted Free Cash Flow (ex. Restructuring and Transaction-Related) $100 M - $150 M $135 M - $170 M
Adjusted EPS $4.04 - $5.52 $4.83 - $6.11
Other Selected Items: Prior Revised
Depreciation and Amortization $270 M $265 M
Interest Payments $50 M $45 M
Cash Taxes
Operating $120 M - $140 M $135 M - $160 M
Climate Transaction $20 M - $40 M $15 M - $20 M
Restructuring Payments $75 M - $125 M $75 M - $100 M
Capital Spending $250 M $250 M
(1) Free cash flow equal to cash from operating activities, less capital expenditures. Includes $75-$100 million of restructuring and $50-$60 million in taxes and fees, primarily related to Halla Visteon Climate Control transaction.
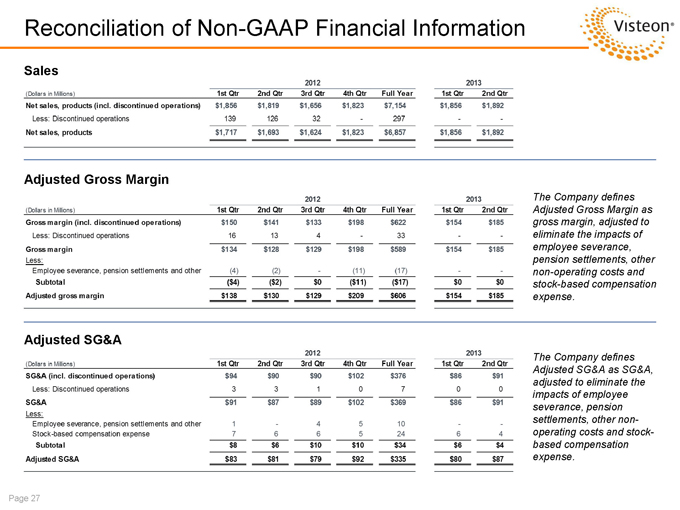
Sales
2012
2013
(Dollars in Millions)
1st Qtr 2nd Qtr 3rd Qtr 4th Qtr Full Year 1st Qtr 2nd Qtr
Net sales, products (incl. discontinued operations) $1,856 $1,819 $1,656 $1,823 $7,154 $1,856 $1,892
Less: Discontinued operations
139 126 32 - 297 - -
Net sales, products $1,717 $1,693 $1,624 $1,823
$6,857 $1,856 $1,892
Adjusted Gross Margin 2012
2013
The Company defines (Dollars in Millions)
1st Qtr 2nd Qtr 3rd Qtr 4th Qtr Full Year 1st Qtr 2nd Qtr Adjusted Gross Margin as Gross margin (incl. discontinued operations) $150 $141 $133 $198 $622 $154 $185 gross margin, adjusted to Less: Discontinued operations 16 13 4 - 33 - - eliminate the impacts of Gross margin $134 $128 $129 $198 $589 $154 $185 employee severance, Less: pension settlements, other Employee severance, pension settlements and other (4) (2) - (11) (17) - -non-operating costs and Subtotal ($4) ($2) $0 ($11) ($17) $0 $0 stock-based compensation Adjusted gross margin $138 $130 $129 $209 $606 $154 $185 expense. Adjusted SG&A 2012 2013 The Company defines (Dollars in Millions) 1st Qtr 2nd Qtr 3rd Qtr 4th Qtr Full Year 1st Qtr 2nd Qtr Adjusted SG&A as SG&A, adjusted to eliminate the impacts of employee severance, pension SG&A (incl. discontinued operations) $94 $90 $90 $102 $376 $86 $91
Less: Discontinued operations 3 3 1 0 7 0 0 SG&A Less: Employee severance, pension settlements and other Stock-based compensation expense $91 $87 $89 $102 $369 $86 $91 1 7 6 4 6 5 5 10 24 6 4 settlements, other non-operating costs and stock-Subtotal $8 $6 $10 $10 $34 $6 $4 based compensationAdjusted SG&A $83 $81 $79 $92 $335 $80 $87 expense.
Page 27
2013 Guidance visteon
Prior Revised
Product Sales $7.3 B - $7.5 B $7.3 B - $7.5 B
Adjusted EBITDA $620 M - $660 M $660 M - $690 M
Free Cash Flow
Free Cash Flow (1) ($75) M - $25 M ($25) M - $50 M _
justed Free Cash Row $100 M - $150 M $135 M - $170 M
(ex. Restructuring and Transaction-Related)
Adjusted EPS $4.04 - $5.52 $4.83 - $6.11 _
Other Selected Items: Prior Revised
Depreciation and Amortization $270 M $265 M
Interest Payments $50 M $45 M
Cash Taxes
Operating $120 M - $140 M $135 M - $160 M
Climate Transaction $20 M - $40 M $15 M - $20 M
Restructuring Payments $75 M - $125 M $75 M - $100 M
Capital Spending $250 M $250 M
Page 26 (1) Free cash flow equal to cash from operating activities, less capital expenditures.
Includes $75-$100 million of restructuring and $50-$60 million in taxes and fees, primarily related to Halla Visteon Climate Control transaction.
Page 28
Reconciliations of Adjusted Net Income, Earnings per Share and Adjusted Earnings per Share
visteon
Page 29
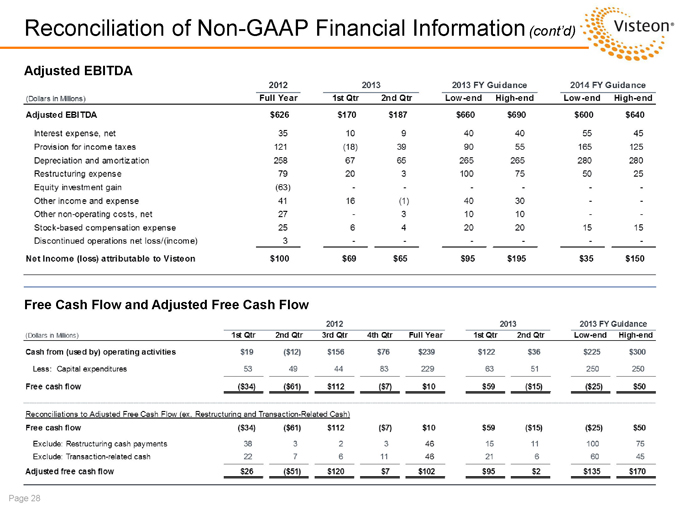
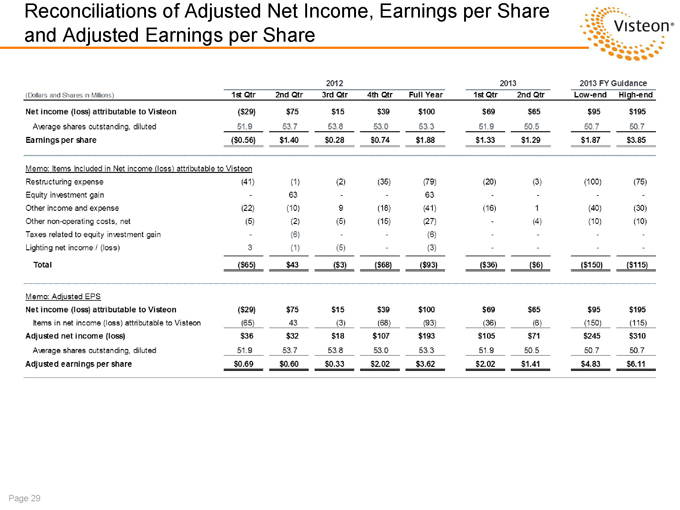
2012 2013 2013 FY Guidance
(Dollars and Shares in Millions) 1st Qtr 2nd Qtr 3rd Qtr 4th Qtr Full Year 1st Qtr 2nd Qtr Low-end High-end
Net income (loss) attributable to Visteon ($29) $75 $15 $39 $100 $69 $65 $95 $195
Average shares outstanding, diluted 51.9 53.7 53.8 53.0 53.3 51.9 50.5 50.7 50.7
Earnings per share ($0.56) $1.40 $0.28 $0.74 $1.88 $1.33 $1.29 $1.87 $3.85
Memo: Items Included in Net income (loss) attributable to Visteon
Restructuring expense (41) (1) (2) (35) (79) (20) (3) (100) (75)
Equity investment gain - 63 - - 63 - - - -
Other income and expense (22) (10) 9 (18) (41) (16) 1 (40) (30)
Other non-operating costs, net (Si (2) (5) (15) (27) - (4) (10) (10)
Taxes related to equity investment gain ¦ (6) ¦ - (6) - ¦ - ¦
Lighting net income / (loss) 3 (1) (5) - (3) - ¦ - ¦
Total ($65) $43 ($3) ($68) ($93) ($36) ($6) ($150) ($115)
Memo: Adjusted EPS
Net income (loss) attributable to Visteon ($29) $75 $15 $39 $100 $69 $65 $95 $195
Items in net income (loss) attributable to Visteon (65) 43 (3) (68) (93) (36) (6) (150) (115)
Adjusted net income (loss) $36 $32 $18 $107 $193 $105 $71 $245 $310
Average shares outstanding, diluted 51.9 53,7 53.8 53.0 53.3 51.9 50.5 50.7 50.7
Adjusted earnings per share $0.69 $0.60 $0.33 $2.02 $3.62 $2.02 $1.41 $4.83 $6.11
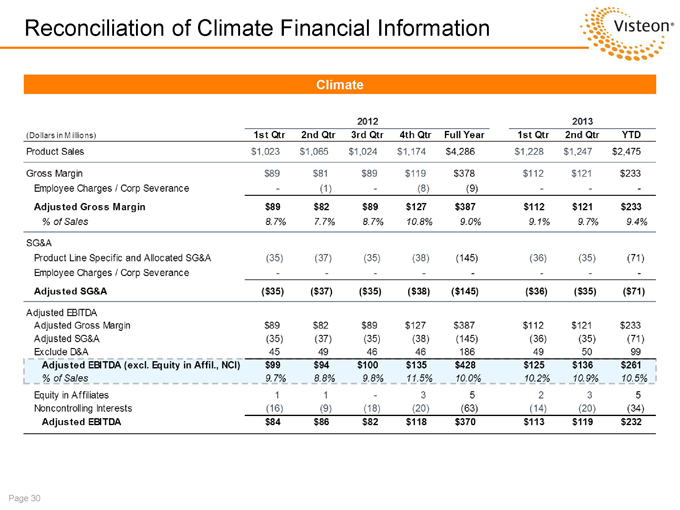
Reconciliation of Climate Financial Information visteon
2012 2013
(Dollars in Millions) 1st Qtr 2nd Qtr 3rd Qtr 4th Qtr Full Year 1st Qtr 2nd Qtr YTD
Product Sales $1,023 $1,065 $1,024 $1,174 $4,286 $1,228 $1,247 $2,475
Gross Margin $89 $81 $89 $119 $378 $112 $121 $233
Employee Charges / Corp Severance - (1) - (8) (9) - - -
Adjusted Gross Margin $89 $82 $89 $127 $387 $112 $121 $233
% of Sales 8.7% 7.7% 8.7% 10.8% 9.0% 9.1% 9.7% 9.4%
SG&A
Product Line Specific and Allocated SG&A (35) (37) (35) (38) (145) (36) (35) (71)
Employee Charges / Corp Severance - - - - - - - - - -
Adjusted SG&A ($35) ($37) ($35) ($38) ($145) ($36) ($35) ($71)
Adjusted EBITDA
Adjusted Gross Margin $89 $82 $89 $127 $387 $112 $121 $233
Adjusted SG&A (35) (37) (35) (38) (145) (36) (35) (71)
Exclude D&A 45 49 46 46 186 49 50 99
Adjusted EBITDA (excl. Equity in Affil., NCI) $99 $94 $100 $135 $428 $125 $136 $261
% of Sales 9.7% 8.8% 9.8% 11.5% 10.0% 10.2% 10.9% 10.5%
Equity in Affiliates 1 1 3 5 2 3 5
Noncontrolling Interests (16) (9) (18) (20) (63) (14) (20) (34)
Adjusted EBITDA $84 $86 $82 $118 $370 $113 $119 $232
Page 30
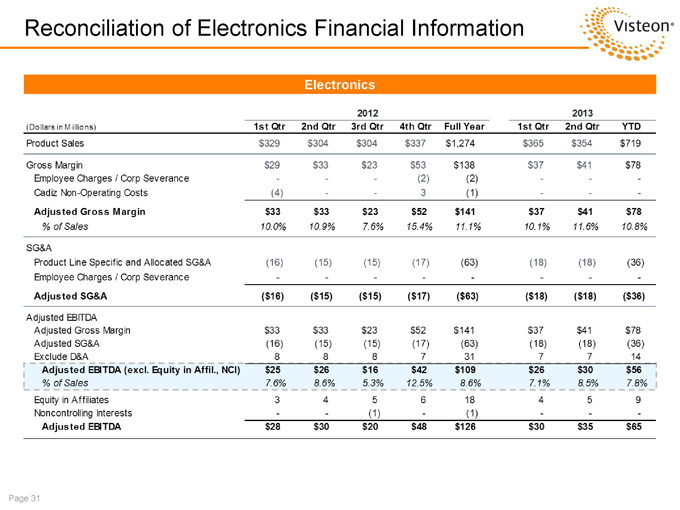
Reconciliation of Climate Financial Information visteon
Electronics
2012 2013
(Dollars in Millions) 1st Qtr 2nd Qtr 3rd Qtr 4th Qtr Full Year 1st Qtr 2nd Qtr YTD
Product Sales $329 $304 $304 $337 $1,274 $365 $354 $719
Gross Margin $29 $33 $23 $53 $138 $37 $41 $78
Employee Charges / Corp Severance (2) (2)
Cadiz Non-Operating Costs (4) - - 3 (1)
Adjusted Gross Margin $33 $33 $23 $52 $141 $37 $41 $78
% of Sales 10.0% 10.9% 7.6% 15.4% 11.1% 10.1% 11.6% 10.8%
SG&A
Product Line Specific and Allocated SG&A (16) (15) (15) (17) (63) (18) (18) (36)
Employee Charges / Corp Severance
Adjusted SG&A ($16) ($15) ($15) ($17) ($63) ($18) ($18) ($36)
Adjusted EBITDA
Adjusted Gross Margin $33 $33 $23 $52 $141 $37 $41 $78
Adjusted SG&A (16) (15) (15) (17) (63) (18) (18) (36)
Exclude D&A 8 8 8 7 31 7 7 14
Adjusted EBITDA (excl. Equity in Affil., NCI) $25 $26 $16 $42 $109 $26 $30 $56
% of Sales 7.6% 8.6% 5.3% 12.5% 8.6% 7.1% 8.5% 7.8%
Equity in Affiliates 3456 18 459
Noncontrolling Interests - - (1) - (1)
Adjusted EBITDA $28 $30 $20 $48 $121 $30 $35 $65
Page 31
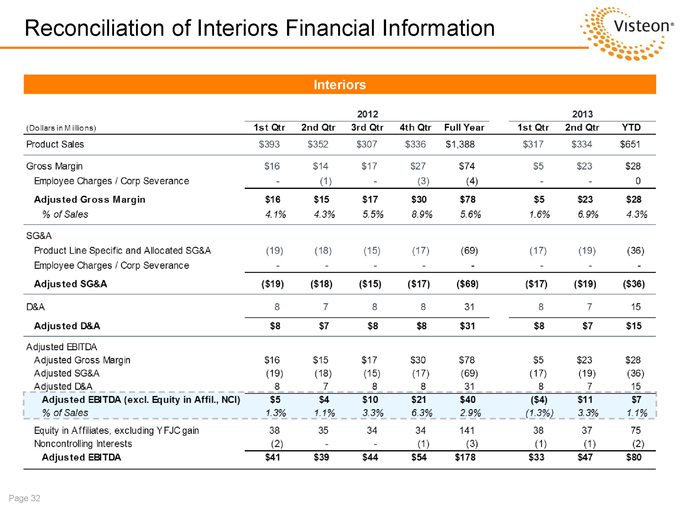
Reconciliation of Interiors Financial Information visteon
Interiors
2012 2013
(Dollars in Millions) 1st Qtr 2nd Qtr 3rd Qtr 4th Qtr Full Year 1st Qtr 2nd Qtr YTD
Product Sales $393 $352 $307 $336 $1,388 $317 $334 $651
Gross Margin $16 $14 $17 $27 $74 $5 $23 $28
Employee Charges / Corp Severance - (1) - (3) (4) - - 0
Adjusted Gross Margin $16 $15 $17 $30 $78 $5 $23 $28
% of Sales 4.1% 4.3% 5.5% 8.9% 5.6% 1.6% 6.9% 4.3%
SG&A
Product Line Specific and Allocated SG&A (19) (18) (15) (17) (69) (17) (19) (36)
Employee Charges / Corp Severance - - - -
Adjusted SG&A ($19) ($18) ($15) ($17) ($69) ($17) ($19) ($36)
D&A 8 7 8 8 31 8 7 15
Adjusted D&A $8 $7 $8 $8 $31 $8 $7 $15
Adjusted EBITDA
Adjusted Gross Margin $16 $15 $17 $30 $78 $5 $23 $28
Adjusted SG&A (19) (18) (15) (17) (69) (17) (19) (36)
Adjusted D&A 8 7 8 8 31 8 7 15
Adjusted EBITDA (excl. Equity in Affil., NCI) $5 $4 $10 $21 $40 ($4) $11 $7
% of Sales 1.3% 1.1% 3.3% 6.3% 2.9% (1.3%) 3.3% 1.1%
Equity in Affiliates, excluding Y FJC gain 38 35 34 34 141 38 37 75
Noncontrolling Interests (2) - - (1) (3) [V) (1) (2)
Adjusted EBITDA $41 $39 $44 $54 $178 $33 $47 $80
Page 32
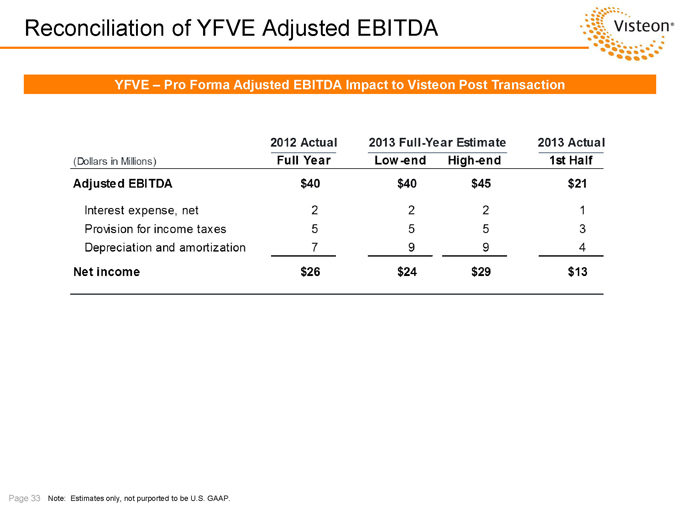
Reconciliation of YFVE Adjusted EBITDA visteon
YFVE - pro forma adjusted EBITDA Impact to Visteon Post Transaction
2012 Actual 2013 Full-Year Estimate 2013 Actual
(Dollars in Millions) Full Year Low-end High-end 1st Half
Adjusted EBITDA $40 $40 $45 $21
Interest expense, net 2 2 2 1
Provision for income taxes 5 5 5 3
Depreciation and amortization 7 9 9 4
Net income $26 $24 $29 $13
Page 33 Note Estimates only, not purported to Be U.S. GAAP.
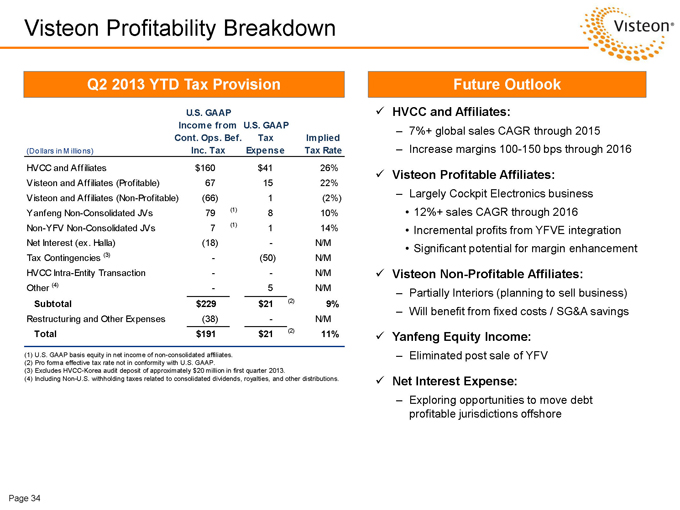
U.S. GAAPIncome fromU.S. GAAPCont. Ops. Bef.TaxImplied(Dollars in Millions)Inc. TaxExpenseTax RateHVCC and Affiliates$160$4126%Visteon and Affiliates (Profitable)671522%Visteon and Affiliates (Non-Profitable)(66)1(2%)Yanfeng Non-Consolidated JVs79(1)810%Non-YFV Non-Consolidated JVs7(1)114%Net Interest (ex. Halla)(18)-N/MTax Contingencies (3)-(50)N/MHVCC Intra-Entity Transaction--N/MOther (4)-5N/MSubtotal$229$21(2)9%Restructuring and Other Expenses(38)-N/MTotal$191$21(2)11%Page 34
Visteon Profitability Breakdown
üHVCC and Affiliates:
–7%+ global sales CAGR through 2015
–Increase margins 100-150 bps through 2016
üVisteon Profitable Affiliates:
–Largely Cockpit Electronics business
12%+ sales CAGR through 2016
Incremental profits from YFVE integration
Significant potential for margin enhancement
üVisteon Non-Profitable Affiliates:
–Partially Interiors (planning to sell business)
–Will benefit from fixed costs / SG&A savings
üYanfeng Equity Income:
–Eliminated post sale of YFV
üNet Interest Expense:
–Exploring opportunities to move debt profitable jurisdictions offshore
Q2 2013 YTD Tax Provision
(1) U.S. GAAP basis equity in net income of non-consolidated affiliates.
(2) Pro forma effective tax rate not in conformity with U.S. GAAP.
(3) Excludes HVCC-Korea audit deposit of approximately $20 million in first quarter 2013.
(4) Including Non-U.S. withholding taxes related to consolidated dividends, royalties, and other distributions.
Future Outlook
Page 34
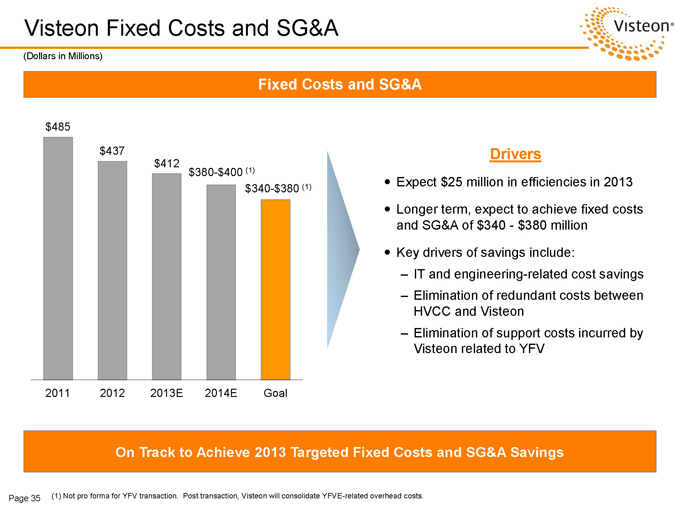
Page 35
Visteon Fixed Costs and SG&A Drivers
—Expect $25 million in efficiencies in 2013
—Longer term, expect to achieve fixed costs and SG&A of $340 - $380 million
—Key drivers of savings include:
–IT and engineering-related cost savings
–Elimination of redundant costs between HVCC and Visteon
–Elimination of support costs incurred by Visteon related to YFV
(Dollars in Millions) $485
$437
$412
2011
2012
2013E
2014E
Goal
$340-$380 (1)
$380-$400 (1)
Fixed Costs and SG&A
On Track to Achieve 2013 Targeted Fixed Costs and SG&A Savings
(1) Not pro forma for YFV transaction. Post transaction, Visteon will consolidate YFVE-related overhead costs.

VISTEON
Page 36 www.visteon.com