Exhibit 99
| May, 2004 |

| FORWARD-LOOKING STATEMENTS "Safe Harbor" Statement This presentation includes forward-looking statements within the meaning of Section 27A of the Securities Act of 1933, as amended, and Section 21E of the Securities Exchange Act of 1934, as amended. Those statements include statements regarding the intent, belief or current expectations of the Company and its management. Although NiSource Inc. believes that its expectations are based on reasonable assumptions, it can give no assurance that its goals will be achieved. Readers are cautioned that the forward-looking statements in this presentation are not guarantees of future performance and involve a number of risks and uncertainties, and that actual results could differ materially from those indicated by such forward-looking statements. Important factors that could cause actual results to differ materially from those indicated by such forward-looking statements include, but are not limited to, the following: weather, fluctuations in supply and demand for energy commodities, growth opportunities for NiSource's businesses, increased competition in deregulated energy markets, dealings with third parties over whom NiSource has no control, actual operating experience of acquired assets, the regulatory process, regulatory and legislative changes, changes in general economic, capital and commodity market conditions, and counter-party credit risk. May, 2004 |

| A SUPER REGIONAL INTEGRATED GAS COMPANY Virginia West Virginia Tennessee Gulf of Mexico Mississippi Louisiana Texas Kentucky Ohio Pennsylvania Maryland New Jersey New York Maine Indiana Mass ..N.H. Strategic Location 30% Population / 40% of U.S. Energy Consumption Third Largest Gas Distribution Company in the U.S. 3.3 Million Customers - 9 States Fourth Largest Gas Pipeline Company in the U.S. Over 16,000 Miles Interstate Pipelines One of the Largest Gas Storage Networks in the U.S. Over 646 Bcf (Market Area) Mid Size Regional Electric Business Over 440,000 Customers 3,392 MW Generating Capacity 100% of Operating Income from Regulated Operations Proposed Millennium Pipeline |

| Actions We Took Exited Remaining Non-Core Unregulated Businesses - $2.3 Billion Since 2000 Reduced Debt and Interest Expense Targeted Payout of 55% Secured New $1.25 Billion Credit Facility Challenges Grow Earnings Strengthen Balance Sheet Adequate Liquidity Credit Ratings NISOURCE'S CHALLENGE IN 2003 |

| BUILDING FROM A STRONGER BASE Stable Credit Ratings S&P BBB; Moody's Baa3, Fitch BBB Bank Lines Used for Working Capital Focus on Regulated Businesses - Operating as Single Distribution Business Focus on Growing Pipeline and Storage Business Regulated Revenue Expansion Non-Traditional Revenues |

| 2003 Operating Income BALANCED PORTFOLIO 100% Of Operating Income From Regulated Businesses Gas Distribution Gas Transmission Electric Operations 43 34 23 Gas Transmission 34%. Gas Distribution 43% Electric Operations 23% |

| 2000 2001 2002 2003 14674 12501 9307 8614 IMPROVING OUR PRODUCTIVITY Staffing at our Businesses |

| DEMONSTRATING CAPITAL DISCIPLINE 1995 1996 1997 1998 1999 0.46 0.53 0.59 0.49 0.62 1999 2000 2001* 2002* 2003* 2004E 613.5 554 531 527.5 569.9 519 Pre-merger Post-merger ($ in millions) Capital Expenditures* Capital Expenditures Post-Merger Do Not Include Capex for Discontinued Operations |

| 2004E Capital Expenditures $519 Million $113 Million Growth Capex 2004E 73% Gas Distribution 5% Gas Transmission 19% Electric Operations 3% Other WHILE PROVIDING FOR GROWTH FROM INTERNAL SOURCES Gas Distribution Gas Transmission Electric Operations Other 40 27 28 5 |
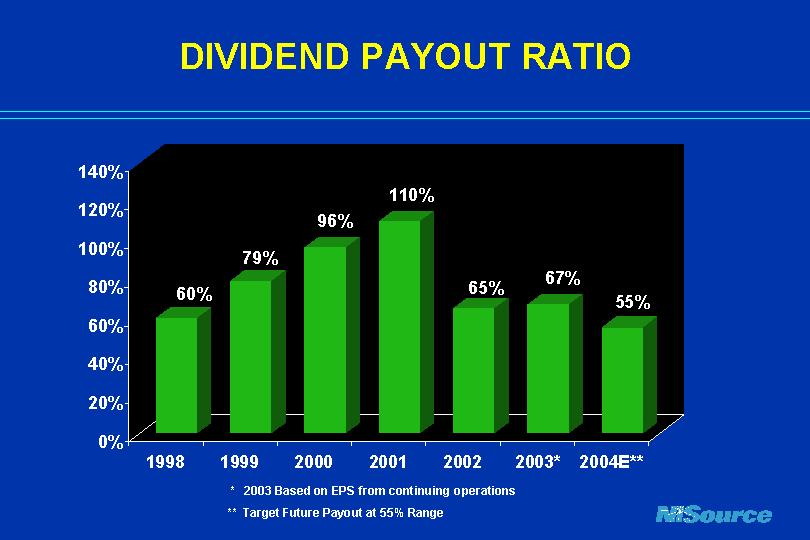
| DIVIDEND PAYOUT RATIO 1998 1999 2000 2001 2002 2003* 2004E** NISOURCE 0.6 0.791 0.964 1.1 0.65 0.67 0.55 * 2003 Based on EPS from continuing operations ** Target Future Payout at 55% Range |
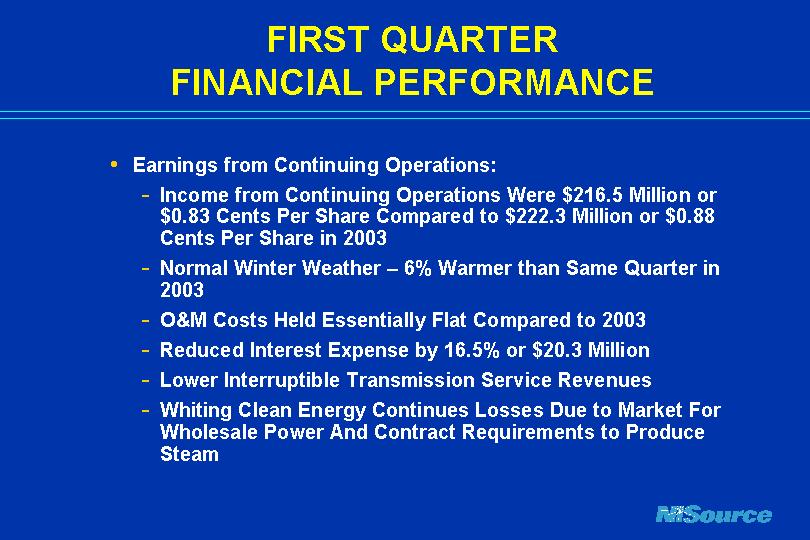
| Earnings from Continuing Operations: Income from Continuing Operations Were $216.5 Million or $0.83 Cents Per Share Compared to $222.3 Million or $0.88 Cents Per Share in 2003 Normal Winter Weather - 6% Warmer than Same Quarter in 2003 O&M Costs Held Essentially Flat Compared to 2003 Reduced Interest Expense by 16.5% or $20.3 Million Lower Interruptible Transmission Service Revenues Whiting Clean Energy Continues Losses Due to Market For Wholesale Power And Contract Requirements to Produce Steam FIRST QUARTER FINANCIAL PERFORMANCE |
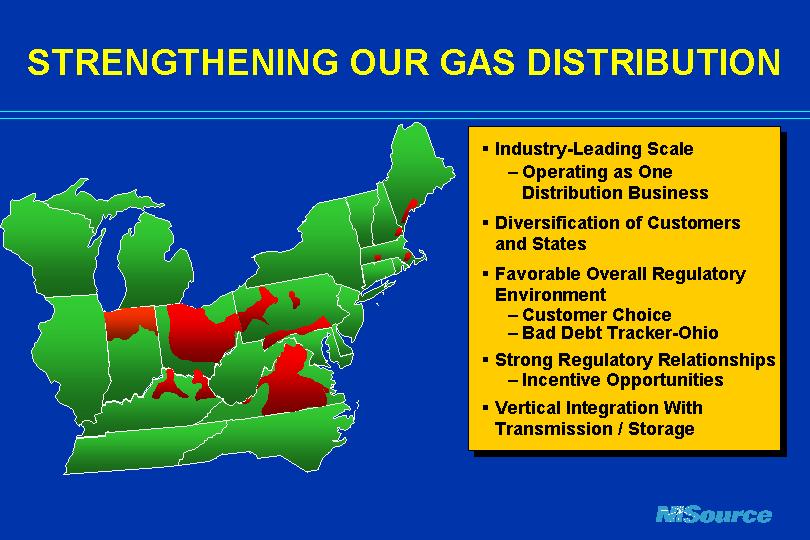
| STRENGTHENING OUR GAS DISTRIBUTION Industry-Leading Scale Operating as One Distribution Business Diversification of Customers and States Favorable Overall Regulatory Environment Customer Choice Bad Debt Tracker-Ohio Strong Regulatory Relationships Incentive Opportunities Vertical Integration With Transmission / Storage |
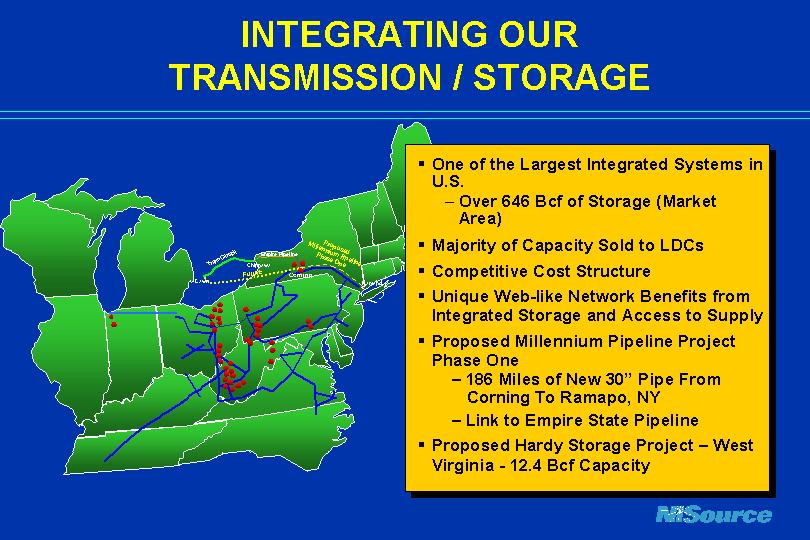
| INTEGRATING OUR TRANSMISSION / STORAGE Future Corning Chippawa Dawn Proposed Millennium Pipeline Phase One TransCanada Empire Pipeline Ramapo One of the Largest Integrated Systems in U.S. Over 646 Bcf of Storage (Market Area) Majority of Capacity Sold to LDCs Competitive Cost Structure Unique Web-like Network Benefits from Integrated Storage and Access to Supply Proposed Millennium Pipeline Project Phase One - 186 Miles of New 30" Pipe From Corning To Ramapo, NY - Link to Empire State Pipeline Proposed Hardy Storage Project - West Virginia - 12.4 Bcf Capacity |
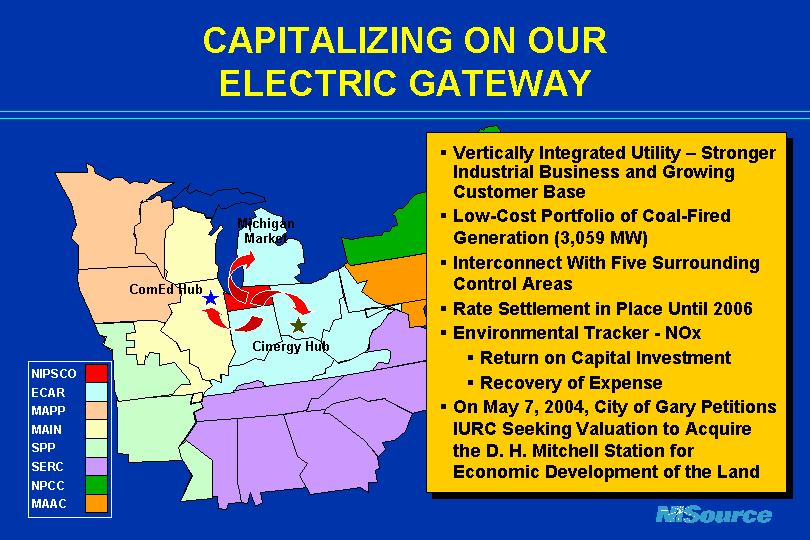
| CAPITALIZING ON OUR ELECTRIC GATEWAY Michigan Market ComEd Hub Cinergy Hub SERC NPCC ECAR MAAC MAIN MAPP SPP NIPSCO Vertically Integrated Utility - Stronger Industrial Business and Growing Customer Base Low-Cost Portfolio of Coal-Fired Generation (3,059 MW) Interconnect With Five Surrounding Control Areas Rate Settlement in Place Until 2006 Environmental Tracker - NOx Return on Capital Investment Recovery of Expense On May 7, 2004, City of Gary Petitions IURC Seeking Valuation to Acquire the D. H. Mitchell Station for Economic Development of the Land |

| POSITIONING NISOURCE FOR SOLID 2004 EARNINGS Net Income From Continuing Operations ($ in millions) EPS $1.89 $1.64 Assumes Normal Weather $0.93 $1.65 $1.70 E* |

| WITH AN STRONGER CAPITAL STRUCTURE |

| 2000 2001 2002 2003 2004 8585 8330 6988 6797 6285 AND A STRONGER BALANCE SHEET TOTAL DEBT IN MILLIONS FIRST QUARTER |

| Stable Base of Regulated Earnings 100% of Operating Income Generated by Low-risk Regulated Businesses Regulated Energy Delivery Service to Nearly 3.7 million Customers Across 9 States Continue Savings Initiatives Centralized Functions Standardizing Operations Improved Liquidity and Credit Profile Stable Investment Grade Credit Ratings Further Strengthen Balance Sheet Renegotiated $1.25 Billion Bank Credit Facility WITH SOLID FUNDAMENTALS |

| Centralize Regulatory Strategy - Focused On Growth Create Regulatory Opportunities within Each State Rate Trackers ... Environmental, Operational, Bad Debt, Bare Steel, Conservation, Pipeline Expansion Grow Non-Traditional Revenues - Retail Products/Services, Commercial & Industrial (C&I) Business Standardize All Operations - Reducing O&M Costs Operate as One Distribution Company - Across Nine States Standardize Engineering, Purchasing and Operating Procedures Move to Best-in-Class Customer Processes AND A MANAGEMENT TEAM FOCUSED ON THE FUTURE |
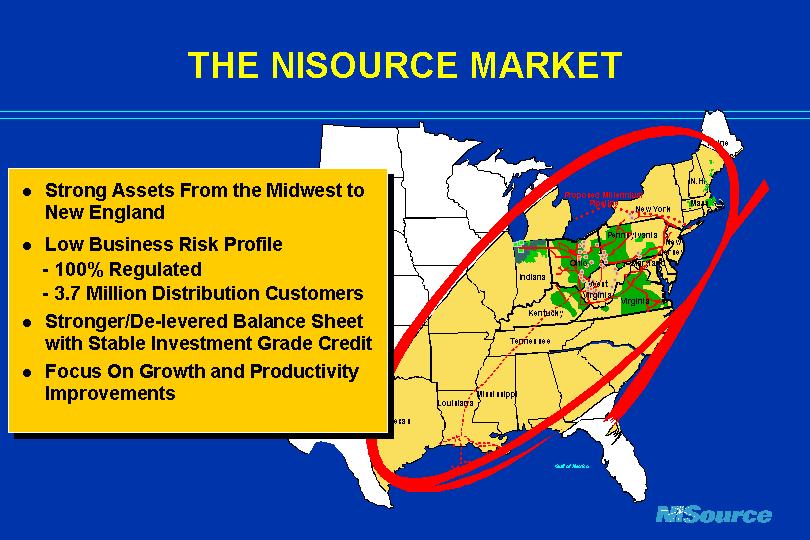
| THE NISOURCE MARKET Virginia West Virginia Tennessee Gulf of Mexico Mississippi Louisiana Texas Kentucky Ohio Pennsylvania Maryland New Jersey New York Maine Indiana Mass ..N.H. Strong Assets From the Midwest to New England Low Business Risk Profile - 100% Regulated - 3.7 Million Distribution Customers Stronger/De-levered Balance Sheet with Stable Investment Grade Credit Focus On Growth and Productivity Improvements Proposed Millennium Pipeline |