Exhibit 99.1
FOR IMMEDIATE RELEASE
January 31, 2006
| | | |
FOR ADDITIONAL INFORMATION | | |
Media | | Investors |
| Kris Falzone | | Dennis Senchak |
| Vice President, Corporate Communications | | Vice President, Investor Relations |
| (219) 647-5581 | | (219) 647-6085 |
klfalzone@nisource.com | | senchak@nisource.com |
| | | |
| Carol Churchill | | Randy Hulen |
| Director, Corporate Communications | | Director, Investor Relations |
| (888) 696-0481 | | (219) 647-5688 |
cchurchill@nisource.com | | rghulen@nisource.com |
| | | |
| | | Rae Kozlowski |
| | | Manager, Investor Relations |
| | | (219) 647-6083 |
| | | ekozlowski@nisource.com |
NiSource reports 2005 financial results and provides 2006 earnings guidance
MERRILLVILLE, Ind. —NiSource Inc. (NYSE: NI) today announced net operating earnings (non-GAAP) of $375.4 million, or $1.38 per share, for the 12 months ended Dec. 31, 2005, compared with $405.8 million, or $1.54 per share, for 2004 (all per-share amounts are basic).
The 2005 results exceeded the revised net operating earnings guidance of $1.32 to $1.37 per share, issued in November 2005. Net operating earnings are a non-GAAP financial measure that NiSource defines as income from continuing operations determined in accordance with Generally Accepted Accounting Principles (GAAP) adjusted for certain items.
The decrease in net operating earnings of $30.4 million for 2005 compared with 2004 was the result of higher depreciation expense, primarily from the 2004 expiration of the prior regulatory stipulation for Columbia Gas of Ohio (COH); decreased usage by natural gas utility customers, primarily due to higher gas prices; incremental costs associated with the Midwest Independent System Operator (MISO) in NiSource’s Indiana electric market; and lower net revenues in the gas transmission and storage business due primarily to the 2004 renegotiation of contracts with NiSource pipelines’ major customers, net of remarketing activities. These impacts were partially offset by strong cost management and improved results from Whiting Clean Energy.
-more-
NiSource reports 2005 financial results and provides 2006 earnings guidance
Page 2
NiSource President and Chief Executive Officer Robert C. Skaggs, Jr., noted that 2005 was expected to be a base year from which the company would grow off a focused, four-point business platform.
“Despite the challenges of record high natural gas prices, the impact of hurricanes and a dynamic energy market environment, the NiSource employee team put in place the four key elements of our platform for growth: expansion and commercial growth in the pipeline and storage business; regulatory and commercial initiatives; management of the balance sheet; and expense management,” Skaggs said.
“We made significant progress on pipeline and storage growth projects, with the Hardy Storage project in West Virginia receiving its Federal Energy Regulatory Commission (FERC) certificate to move forward, Millennium Pipeline signing Consolidated Edison and KeySpan as anchor customers, and Columbia Gas Transmission’s Eastern Market Expansion moving forward towards a 2009 in service date based on definitive agreements with four East Coast customers,” he noted. “In addition, our Bay State Gas Company subsidiary received approval of a rate increase in Massachusetts, resulting in $11.1 million in annual revenue increases.”
“We completed major refinancings that will yield approximately $43 million in annual interest expense savings beginning in 2006, as well as a new, five-year $1.25 billion revolving credit agreement that reduced short-term borrowing rates by 27.5 basis points,” Skaggs added.
“In addition, we began implementing sweeping process and cost management initiatives through transformation of NiSource’s back-office processes and systems in conjunction with the outsourcing contract with IBM, and we initiated a corporate streamlining effort that will include reducing office locations, realigning executive compensation and reducing executive positions.”
Based on this progress in 2005 and the successful launch of NiSource’s four-point business platform, Skaggs announced that NiSource expects 2006 net operating earnings in the range of $1.45 to $1.55 per share. Key assumptions underlying the earnings guidance will be discussed later in this release.
Net operating earnings (non-GAAP)
For the second consecutive quarter, NiSource is providing net operating earnings and operating earnings, which are both non-GAAP measures, because management believes these measures better represent the fundamental earnings strength of the company. Operating earnings are operating income determined in accordance with GAAP adjusted for certain items. NiSource uses net operating earnings and operating earnings internally for budgeting and reporting to the board of directors. Adjustments reflected in these measures are primarily weather, restructuring charges associated with the outsourcing contract with IBM, costs associated with the refinancing of debt, and impairment charges. See Schedule 1 and Schedule 2 of this news release for the reconciliations of net operating earnings and operating earnings, respectively, to GAAP.
Fourth-quarter net operating earnings (non-GAAP)
For the three months ended Dec. 31, 2005, NiSource reported net operating earnings (non-GAAP) of $123.2 million, or 45 cents per share, compared with $137.7 million, or 52 cents per share, for the comparable 2004 period.
-more-
NiSource reports 2005 financial results and provides 2006 earnings guidance
Page 3
The decrease in the three-month net operating earnings of $14.5 million versus 2004 was the result of lower customer usage of natural gas, incremental MISO costs, higher depreciation resulting primarily from the 2004 expiration of the prior COH regulatory stipulation, and lower net revenues in the gas transmission and storage business due primarily to the 2004 renegotiation of contracts with major pipeline customers, net of remarketing activities. The decrease was partially offset by improved results from Whiting Clean Energy.
Overview of 2005 Performance by Business Segment (non-GAAP)
Gas Distribution Operations
Operating earnings for NiSource’s gas distribution operations were down by $34.6 million from 2004, to $394.2 million for 2005. The decline was primarily due to higher depreciation of $30 million resulting from the 2004 expiration of the prior regulatory stipulation for Columbia Gas of Ohio and decreased customer usage, net of an increase in the number of customers.
Skaggs noted that in several fundamental respects, the segment registered solid performance.
“The gas distribution business continues to benefit from the regulatory initiatives we have undertaken over the last several years, such as trackers,” Skaggs said. Regulatory trackers, which allow for the recovery of certain costs, such as bad debt, increase net revenues in tandem with rising expenses.
“In addition to the positive effect of trackers, our distribution team did an outstanding job of limiting the impact of the higher depreciation and declining customer usage by holding the line on operation and maintenance costs,” Skaggs said. “In addition, our gas utilities added nearly 28,000 net new customers during 2005.”
“The biggest ongoing concern — as it is for most gas utilities — is gas usage reduction. Although the weather was colder than normal for the year and particularly during the fourth quarter, high gas prices caused customers to dial back their thermostats,” he said. “Excluding the impact of weather, residential volume declines decreased operating earnings by approximately $20 million for the year. This is a steeper decline than we have seen in the past.”
Gas Transmission and Storage Operations
The gas transmission and storage business reported operating earnings of $349.6 million, a $16.9 million decrease from 2004. The decline was primarily due to a $31.9 million decrease in net revenues caused by the 2004 renegotiation of contracts with major pipeline customers, net of remarketing activities.
“We expected a material decrease in revenues due to the recontracting, but notably, the pipeline team offset nearly half of the reduction in revenue by aggressively marketing available capacity and lowering operation and maintenance expenses by $15.6 million,” Skaggs said. “Our pipeline and storage business shows great potential for growth and expansion, with expanded commercial activities and new revenue-producing projects scheduled to come on-line as early as 2007.”
-more-
NiSource reports 2005 financial results and provides 2006 earnings guidance
Page 4
Electric Operations
NiSource’s electric business reported operating earnings of $292.1 million, a decrease of $8.3 million from 2004. The decrease was primarily due to MISO costs of $19.2 million and higher electric production expenses of $7.2 million, partially offset by increased net revenues. Excluding the impact of MISO costs and trackers that increase both net revenues and expenses, net revenues increased by approximately $18 million.
“Some costs associated with MISO have been unrecoverable under the current Northern Indiana Public Service Company (NIPSCO) electric rate review settlement agreement as approved by the Indiana regulators. However, when that rate moratorium ends on July 31, 2006, we have the right to begin deferring for future recovery those costs beginning Aug. 1,” Skaggs said.
“NIPSCO continues to provide solid top-line growth,” Skaggs added. “Net revenues for the electric segment increased primarily due to environmental trackers that help recover the costs of certain pollution control equipment, increased customer usage and the addition of 4,400 customers partially offset by MISO costs.”
“Unlike our gas distribution business, customer usage increased by approximately 4 percent for residential customers and 4 percent for commercial customers,” Skaggs said. “We saw some weakness in the industrial market, and our wholesale sales amounts also were down. However, margins for both of these markets remained relatively solid, so the impact on revenues was tempered.”
Other Operations
The other operations segment improved to an operating earnings loss of $13.2 million in 2005, from an operating earnings loss of $39.4 million a year earlier, due primarily to improved results from Whiting Clean Energy and increased net revenues from commercial and industrial gas marketing activities. During 2005, Whiting Clean Energy sold power into the Midwest wholesale energy market.
Income from Continuing Operations (GAAP)
NiSource reported income from continuing operations for the 12 months ended Dec. 31, 2005, of $283.6 million, or $1.05 per share, compared with income from continuing operations of $431.0 million, or $1.63 per share, for 2004.
Net income for 2005 was $306.5 million, or $1.13 per share, compared with net income of $436.3 million, or $1.65 per share, for 2004. Operating income was $952.8 million in 2005, compared with $1,077.5 million in 2004.
For the three months ended Dec. 31, 2005, NiSource reported income from continuing operations of $72.8 million, or 27 cents per share, compared with $157.0 million, or 59 cents per share, for the same period of 2004. Net income for the fourth quarter of 2005 was $68.0 million, or 25 cents per share, compared with $159.4 million, or 60 cents per share, for the same period a year ago. Fourth-quarter 2005 results include a pre-tax loss on early extinguishment of long-term debt of $108.6 million.
Earnings per share were diluted by 5 cents for the full year 2005 primarily due to the issuance during the fourth quarter of 2004 of 6.8 million shares of common stock upon the settlement of the forward stock purchase contracts comprising a component of NiSource’s Stock Appreciation Income Linked Securities (SAILSsm).
-more-
NiSource reports 2005 financial results and provides 2006 earnings guidance
Page 5
Outlook for 2006 (non-GAAP)
NiSource’s 2006 guidance of net operating earnings in the range of $1.45 to $1.55 per share is based on typical assumptions such as normal weather, customer growth offsetting usage declines, and customary increases in costs such as depreciation, taxes and employee and administrative expenses. Other factors built into NiSource’s business plan include: the successful completion of key regulatory and commercial initiatives; achieving expected savings from the outsourcing to IBM; deferral of MISO costs beginning Aug. 1; and modest deterioration of results from Whiting Clean Energy which benefited from a strong market during the 2005 period.
The chart accompanying this press release provides additional detail on the assumptions related to 2006 guidance.
NiSource’s 2006 guidance for income from continuing operations (GAAP) is in the range of $1.42 to $1.52 basic earnings per share. Transition costs associated with the outsourcing initiative with IBM represent the 3 cents per share difference between net operating earnings and income from continuing operations.
“We have a solid plan to manage through the challenges we expect in 2006 and remain focused on our platform for growth. We have some aggressive objectives on the revenue side, and we also have a strong track record of managing our expenses,” Skaggs said. “We look forward to keeping investors and all interested stakeholders updated on our progress.”
NiSource will host an analyst conference call at 10 a.m. EST on Tuesday, Jan. 31, 2006 to further discuss the company’s year-end 2005 results and 2006 business plan. All interested parties may hear the conference call live by logging on to the NiSource Web site atwww.nisource.com.
-more-
NiSource reports 2005 financial results and provides 2006 earnings guidance
Page 6
Twelve-Month Period 2005 Operating Earnings — Segment Results (non-GAAP)
Full year 2005 operating earnings (non-GAAP) were $1,003.5 million compared to $1,033.8 million for 2004. Refer to Schedule 2 for the items included in 2005 and 2004 GAAP operating income but excluded from operating earnings.
Operating earnings for NiSource’s business segments for the year ended Dec. 31, 2005, are discussed below.
Gas Distribution Operations’operating earnings were $394.2 million, a decrease of $34.6 million versus 2004. The decrease in operating earnings was primarily due to higher depreciation of $30.0 million that mainly resulted from the 2004 expiration of the prior COH regulatory stipulation and decreased customer usage, net of an increase in the number of customers. Volume declines of approximately 47 MMDth, excluding the impact of weather, and due in part from higher gas prices, decreased operating earnings by approximately $28 million. Offsetting the volume declines were the addition of almost 28,000 new customers during 2005, which added approximately $9 million of incremental net revenues, and increased net revenues from regulatory initiatives including the stipulation for COH of approximately $12 million.
Comparability of Gas Distribution Operations line item operating results was impacted by regulatory trackers that allow for the recovery in rates of certain costs such as bad debt expenses. These trackers increase both operating expenses and net revenues and have essentially no impact on total operating earnings results. Approximately $34.6 million of the increase in operation and maintenance expenses and other taxes was offset by the effect of the regulatory trackers with a corresponding increase to net revenues reflecting recovery of certain costs.
Gas Transmission and Storage Operationsreported operating earnings of $349.6 million, a $16.9 million decrease from last year. Net revenues decreased by $31.9 due primarily from pipeline re-contracting and the impact from regulatory trackers. Regulatory trackers allow for the recovery of certain operating expenses. Remarketing activities offset approximately 40 percent of the impact of the lost net revenues from the pipeline re-contracting. Operation and maintenance expenses were $15.6 million lower than the previous year. Lower pension costs and the impact of trackers contributed to this reduction.
Electric Operationsreported operating earnings of $292.1 million, a decrease of $8.3 million from the last year. The decrease was due to MISO costs of $19.2 million and higher electric production expenses of $7.2 million. MISO costs include both unrecoverable costs that reduce net revenues and unrecoverable administrative fees that increase operating expenses. These costs are unrecoverable as a condition of NIPSCO’s electric rate review settlement agreement, but, in accordance with the end of the rate moratorium, may be deferred for future recovery beginning Aug. 1, 2006. The higher electric generation expenses were primarily the result of increased volumes, unplanned outages and other maintenance activities. These variances were partially offset by favorable net revenue impacts from environmental trackers of $8.9 million and increased sales to residential and commercial customers due to both usage and customer growth. Approximately 4,400 residential and commercial customers were added during 2005, and customer usage increased approximately 4 percent excluding the impact of weather.
-more-
NiSource reports 2005 financial results and provides 2006 guidance
Page 7
Other Operationsreported an operating earnings loss of $13.2 million during 2005, versus an operating earnings loss of $39.4 million last year. The lower operating earnings loss was mainly due to decreased losses of approximately $15.9 million associated with Whiting Clean Energy and $7.4 million of increased net revenues from commercial and industrial gas marketing activities.
Corporatereported an operating earnings loss of $19.2 million compared to an operating earnings loss of $22.5 million during 2004. The decreased operating earnings loss this year resulted from lower employee and administrative expenses.
Other Items
Interest expense was $421.0 million for 2005 compared to $403.9 million for last year. This increase was due to the impact of higher short-term interest rates on variable rate debt and higher average long-term debt balances due to the prefunding of November 2005 debt maturities. Other, net increased $6.7 million primarily as the result of higher interest income.
Basic average shares of common stock outstanding at Dec. 31, 2005 were 271.3 million compared to 263.7 million at Dec. 31, 2004. The increase was primarily due to the issuance during the fourth quarter of 2004 of 6.8 million shares of common stock upon the settlement of the forward stock purchase contracts comprising a component of NiSource’s Stock Appreciation Income Linked Securities (SAILSsm). The increase in average shares outstanding caused a 4 cents dilution of net operating earnings-per-share during 2005.
Fourth Quarter 2005 Operating Earnings — Segment Results (non-GAAP)
NiSource’s consolidated fourth quarter 2005 operating earnings (non-GAAP) were $294.2 million compared to $314.5 million for the same period in 2004. Refer to Schedule 2 for the items included in 2005 and 2004 GAAP operating income but excluded from operating earnings.
Operating earnings for NiSource’s business segments for the quarter ended Dec. 31, 2005 are discussed below.
Gas Distribution Operationsreported operating earnings of $146.6 million versus operating earnings of $162.9 million in the fourth quarter of 2004. The decrease in operating earnings was due to continued declines in customer usage and higher depreciation of $6.7 million that mainly resulted from the 2004 expiration of the prior COH regulatory stipulation. The declines in customer usage (approximately 12 MMDth excluding the impact of weather) were partly due to higher gas prices.
Gas Transmission and Storage Operationsreported operating earnings of $97.3 million versus operating earnings of $106.1 million in the fourth quarter of 2004. The decrease mainly resulted from lower net revenues of $7.1 million due primarily to pipeline re-contracting, net of remarketing activities.
-more-
NiSource reports 2005 earnings and provides 2006 earnings guidance
Page 8
Electric Operationsreported operating earnings of $57.5 million, a decrease of $6.5 million from the comparable period last year. The decrease in operating earnings was primarily the result of unrecoverable MISO costs and operating expenses of $6.7 million, and unrecoverable costs associated with power purchases from the Whiting Clean Energy facility. These variances were partially offset by increased usage by residential and commercial customers and additional revenue from environmental trackers.
Other Operationsreported operating earnings of $0.7 million in 2005, versus an operating earnings loss of $9.1 million in the fourth quarter of 2004. The $9.8 million increase in operating earnings primarily resulted from decreased losses of $5.5 million associated with Whiting Clean Energy and $4.3 million of increased net revenues from commercial and industrial marketing customers.
Corporatereported an operating earnings loss of $7.9 million versus an operating earnings loss of $9.4 million in the comparable 2004 period. The decreased loss was primarily the result of lower operating expenses.
Other Items
Interest expense increased by $5.1 million due to the impact of higher short-term interest rates on variable rate debt and higher average long-term debt balances due to the prefunding of November 2005 debt maturities. Other, net increased $4.2 million primarily as the result of higher interest income.
About NiSource
NiSource Inc. (NYSE: NI), based in Merrillville, Ind., is a Fortune 500 company engaged in natural gas transmission, storage and distribution, as well as electric generation, transmission and distribution. NiSource operating companies deliver energy to 3.8 million customers located within the high-demand energy corridor stretching from the Gulf Coast through the Midwest to New England. Information about NiSource and its subsidiaries is available via the Internet atwww.nisource.com.
Forward-Looking Statements
This news release includes forward-looking statements within the meaning of Section 27A of the Securities Act of 1933, as amended, and Section 21E of the Securities Exchange Act of 1934, as amended. Those statements include statements regarding the intent, belief or current expectations of NiSource and its management. Although NiSource believes that its expectations are based on reasonable assumptions, it can give no assurance that its goals will be achieved. Readers are cautioned that the forward-looking statements in this presentation are not guarantees of future performance and involve a number of risks and uncertainties, and that actual results could differ materially from those indicated by such forward-looking statements. Important factors that could cause actual results to differ materially from those indicated by such forward-looking statements include, but are not limited to, the following: weather; fluctuations in supply and demand for energy commodities; growth opportunities for NiSource’s businesses; increased competition in deregulated energy markets; the success of regulatory and commercial initiatives; dealings with third parties over whom NiSource has no control; the effectiveness of NiSource’s outsourcing initiative; actual operating experience of NiSource assets; the regulatory process; regulatory and legislative changes; changes in general economic, capital and commodity market conditions; and counter-party credit risk.
###
-more-
Page 9 of 21
NiSource Inc.
Consolidated Net Operating Earnings (Non-GAAP)
| | | | | | | | | | | | | | | | | |
| | | Three Months | | | Twelve Months | |
| | | Ended December 31, | | | Ended December 31, | |
| (in millions,except per share amounts) | | 2005 | | | 2004 | | | 2005 | | | 2004 | |
| |
Net Revenues | | | | | | | | | | | | | | | | |
| Gas Distribution | | $ | 1,709.8 | | | $ | 1,188.9 | | | $ | 4,565.1 | | | $ | 3,792.4 | |
| Gas Transportation and Storage | | | 279.0 | | | | 273.3 | | | | 991.1 | | | | 1,014.5 | |
| Electric | | | 301.0 | | | | 280.2 | | | | 1,237.8 | | | | 1,136.4 | |
| Other | | | 381.7 | | | | 214.2 | | | | 1,050.1 | | | | 719.2 | |
| |
| Gross Revenues | | | 2,671.5 | | | | 1,956.6 | | | | 7,844.1 | | | | 6,662.5 | |
| Cost of Sales | | | 1,818.4 | | | | 1,110.7 | | | | 4,743.5 | | | | 3,609.7 | |
| |
| Total Net Revenues | | | 853.1 | | | | 845.9 | | | | 3,100.6 | | | | 3,052.8 | |
| |
Operating Expenses | | | | | | | | | | | | | | | | |
| Operation and maintenance | | | 335.1 | | | | 320.1 | | | | 1,242.5 | | | | 1,213.9 | |
| Depreciation and amortization | | | 137.6 | | | | 130.6 | | | | 545.2 | | | | 508.6 | |
| Other taxes | | | 86.2 | | | | 80.7 | | | | 309.4 | | | | 296.5 | |
| |
| Total Operating Expenses | | | 558.9 | | | | 531.4 | | | | 2,097.1 | | | | 2,019.0 | |
| |
Operating Earnings | | | 294.2 | | | | 314.5 | | | | 1,003.5 | | | | 1,033.8 | |
| |
Other Income (Deductions) | | | | | | | | | | | | | | | | |
| Interest expense, net | | | (108.2 | ) | | | (103.1 | ) | | | (421.0 | ) | | | (403.9 | ) |
| Dividend requirements on preferred stock of subsidiaries | | | (1.0 | ) | | | (1.1 | ) | | | (4.2 | ) | | | (4.4 | ) |
| Other, net | | | 7.6 | | | | 3.4 | | | | 14.0 | | | | 7.3 | |
| |
| Total Other Income (Deductions) | | | (101.6 | ) | | | (100.8 | ) | | | (411.2 | ) | | | (401.0 | ) |
| |
Operating Earnings From Continuing Operations Before Income Taxes | | | 192.6 | | | | 213.7 | | | | 592.3 | | | | 632.8 | |
Income Taxes | | | 69.4 | | | | 76.0 | | | | 216.9 | | | | 227.0 | |
| |
Net Operating Earnings from Continuing Operations | | | 123.2 | | | | 137.7 | | | | 375.4 | | | | 405.8 | |
| |
GAAP Adjustment | | | (50.4 | ) | | | 19.3 | | | | (91.8 | ) | | | 25.2 | |
| |
GAAP Income from Continuing Operations | | $ | 72.8 | | | $ | 157.0 | | | $ | 283.6 | | | $ | 431.0 | |
| |
| | | | | | | | | | | | | | | | | |
| |
Basic Net Operating Earnings Per Share | | | 0.45 | | | | 0.52 | | | | 1.38 | | | | 1.54 | |
| |
| | | | | | | | | | | | | | | | | |
| |
GAAP Basic Earnings Per Share from Continuing Operations | | | 0.27 | | | | 0.59 | | | | 1.05 | | | | 1.63 | |
| |
| | | | | | | | | | | | | | | | | |
Basic Average Common Shares Outstanding (millions) | | | 271.9 | | | | 267.2 | | | | 271.3 | | | | 263.7 | |
| |
Page 10 of 21
NiSource Inc.
Segment Operating Earnings (Non-GAAP)
| | | | | | | | | | | | | | | | | |
| | | Three Months | | | Twelve Months | |
| Gas Distribution Operations | | Ended December 31, | | | Ended December 31, | |
| (in millions) | | 2005 | | | 2004 | | | 2005 | | | 2004 | |
| |
Net Revenues | | | | | | | | | | | | | | | | |
| Sales Revenues | | $ | 1,749.9 | | | $ | 1,199.3 | | | $ | 4,641.1 | | | $ | 3,850.2 | |
| Less: Cost of gas sold | | | 1,448.6 | | | | 887.3 | | | | 3,612.3 | | | | 2,850.8 | |
| |
| Net Sales Revenues | | | 301.3 | | | | 312.0 | | | | 1,028.8 | | | | 999.4 | |
| Transportation Revenues | | | 135.2 | | | | 119.5 | | | | 445.6 | | | | 431.8 | |
| |
| Net Revenues | | | 436.5 | | | | 431.5 | | | | 1,474.4 | | | | 1,431.2 | |
| |
Operating Expenses | | | | | | | | | | | | | | | | |
| Operation and maintenance | | | 175.7 | | | | 168.2 | | | | 671.6 | | | | 639.4 | |
| Depreciation and amortization | | | 56.8 | | | | 50.1 | | | | 224.6 | | | | 194.6 | |
| Other taxes | | | 57.4 | | | | 50.3 | | | | 184.0 | | | | 168.4 | |
| |
| Total Operating Expenses | | | 289.9 | | | | 268.6 | | | | 1,080.2 | | | | 1,002.4 | |
| |
| Operating Earnings | | $ | 146.6 | | | $ | 162.9 | | | $ | 394.2 | | | $ | 428.8 | |
| |
| | | | | | | | | | | | | | | | | |
GAAP Adjustment | | | 10.6 | | | | 13.0 | | | | (26.0 | ) | | | 12.4 | |
| |
GAAP Operating Income | | $ | 157.2 | | | $ | 175.9 | | | $ | 368.2 | | | $ | 441.2 | |
| |
| | | | | | | | | | | | | | | | | |
| | | Three Months | | | Twelve Months | |
| Gas Transmission and Storage Operations | | Ended December 31, | | | Ended December 31, | |
| (in millions) | | 2005 | | | 2004 | | | 2005 | | | 2004 | |
| |
Net Revenues | | | | | | | | | | | | | | | | |
| Transportation revenues | | $ | 176.5 | | | $ | 188.9 | | | $ | 646.6 | | | $ | 668.0 | |
| Storage revenues | | | 44.3 | | | | 44.2 | | | | 177.9 | | | | 178.2 | |
| Other revenues | | | 1.3 | | | | (0.1 | ) | | | 1.9 | | | | 10.1 | |
| |
| Total Revenues | | | 222.1 | | | | 233.0 | | | | 826.4 | | | | 856.3 | |
| Less: Cost of gas sold | | | 6.3 | | | | 10.1 | | | | 24.6 | | | | 22.6 | |
| |
| Net Revenues | | | 215.8 | | | | 222.9 | | | | 801.8 | | | | 833.7 | |
| |
Operating Expenses | | | | | | | | | | | | | | | | |
| Operation and maintenance | | | 76.7 | | | | 75.5 | | | | 283.0 | | | | 298.6 | |
| Depreciation and amortization | | | 28.8 | | | | 28.3 | | | | 114.1 | | | | 114.2 | |
| Other taxes | | | 13.0 | | | | 13.0 | | | | 55.1 | | | | 54.4 | |
| |
| Total Operating Expenses | | | 118.5 | | | | 116.8 | | | | 452.2 | | | | 467.2 | |
| |
| Operating Earnings | | $ | 97.3 | | | $ | 106.1 | | | $ | 349.6 | | | $ | 366.5 | |
| |
| | | | | | | | | | | | | | | | | |
GAAP Adjustment | | | (1.4 | ) | | | 3.0 | | | | (5.2 | ) | | | (3.4 | ) |
| |
GAAP Operating Income | | $ | 95.9 | | | $ | 109.1 | | | $ | 344.4 | | | $ | 363.1 | |
| |
Page 11 of 21
NiSource Inc.
Segment Operating Earnings (Non-GAAP) (continued)
| | | | | | | | | | | | | | | | | |
| | | Three Months | | | Twelve Months | |
| Electric Operations | | Ended December 31, | | | Ended December 31, | |
| (in millions) | | 2005 | | | 2004 | | | 2005 | | | 2004 | |
| |
Net Revenues | | | | | | | | | | | | | | | | |
| Sales revenues | | $ | 308.5 | | | $ | 279.9 | | | $ | 1,236.8 | | | $ | 1,126.6 | |
| Less: Cost of sales | | | 121.2 | | | | 92.3 | | | | 451.5 | | | | 351.0 | |
| |
| Net Revenues | | | 187.3 | | | | 187.6 | | | | 785.3 | | | | 775.6 | |
| |
Operating Expenses | | | | | | | | | | | | | | | | |
| Operation and maintenance | | | 69.0 | | | | 64.7 | | | | 251.8 | | | | 237.8 | |
| Depreciation and amortization | | | 47.3 | | | | 45.5 | | | | 185.9 | | | | 178.1 | |
| Other taxes | | | 13.5 | | | | 13.4 | | | | 55.5 | | | | 59.3 | |
| |
| Total Operating Expenses | | | 129.8 | | | | 123.6 | | | | 493.2 | | | | 475.2 | |
| |
| Operating Earnings | | $ | 57.5 | | | $ | 64.0 | | | $ | 292.1 | | | $ | 300.4 | |
| |
| | | | | | | | | | | | | | | | | |
GAAP Adjustment | | | (1.0 | ) | | | 6.0 | | | | 1.2 | | | | 9.1 | |
| |
GAAP Operating Income | | $ | 56.5 | | | $ | 70.0 | | | $ | 293.3 | | | $ | 309.5 | |
| |
| | | | | | | | | | | | | | | | | |
| | | Three Months | | | Twelve Months | |
| Other Operations (includes assets held for sale) | | Ended December 31, | | | Ended December 31, | |
| (in millions) | | 2005 | | | 2004 | | | 2005 | | | 2004 | |
| |
Net Revenues | | | | | | | | | | | | | | | | |
| Products and services revenue | | $ | 369.3 | | | $ | 209.5 | | | $ | 1,005.7 | | | $ | 683.5 | |
| Less: Cost of products purchased | | | 354.8 | | | | 204.7 | | | | 962.3 | | | | 666.6 | |
| |
| Net Revenues | | | 14.5 | | | | 4.8 | | | | 43.4 | | | | 16.9 | |
| |
Operating Expenses | | | | | | | | | | | | | | | | |
| Operation and maintenance | | | 9.5 | | | | 8.2 | | | | 38.0 | | | | 38.7 | |
| Depreciation and amortization | | | 2.8 | | | | 4.1 | | | | 11.6 | | | | 12.1 | |
| Other taxes | | | 1.5 | | | | 1.6 | | | | 7.0 | | | | 5.5 | |
| |
| Total Operating Expenses | | | 13.8 | | | | 13.9 | | | | 56.6 | | | | 56.3 | |
| |
| Operating Earnings (Loss) | | $ | 0.7 | | | $ | (9.1 | ) | | $ | (13.2 | ) | | $ | (39.4 | ) |
| |
| | | | | | | | | | | | | | | | | |
GAAP Adjustment | | | 1.2 | | | | 4.4 | | | | 1.0 | | | | 8.5 | |
| |
GAAP Operating Income (Loss) | | $ | 1.9 | | | $ | (4.7 | ) | | $ | (12.2 | ) | | $ | (30.9 | ) |
| |
| | | | | | | | | | | | | | | | | |
| | | Three Months | | | Twelve Months | |
| Corporate | | Ended December 31, | | | Ended December 31, | |
| (in millions) | | 2005 | | | 2004 | | | 2005 | | | 2004 | |
| |
| | | | | | | | | | | | | | | | | |
Operating Earnings (Loss) | | $ | (7.9 | ) | | $ | (9.4 | ) | | $ | (19.2 | ) | | $ | (22.5 | ) |
| |
| | | | | | | | | | | | | | | | | |
GAAP Adjustment | | | (1.1 | ) | | | 3.5 | | | | (21.7 | ) | | | 17.1 | |
| |
GAAP Operating Income (Loss) | | $ | (9.0 | ) | | $ | (5.9 | ) | | $ | (40.9 | ) | | $ | (5.4 | ) |
| |
Page 12 of 21
NiSource Inc.
Segment Volumes and Statistical Data (Non-GAAP)
| | | | | | | | | | | | | | | | | |
| | | Three Months | | | Twelve Months | |
| Gas Distribution Operations | | Ended December 31, | | | Ended December 31, | |
| | | 2005 | | | 2004 | | | 2005 | | | 2004 | |
| |
Sales and Transportation (MMDth) | | | | | | | | | | | | | | | | |
| Residential sales | | | 73.0 | | | | 67.7 | | | | 224.6 | | | | 218.9 | |
| Commercial sales | | | 26.1 | | | | 25.9 | | | | 82.1 | | | | 85.3 | |
| Industrial sales | | | 6.2 | | | | 6.8 | | | | 21.5 | | | | 23.3 | |
| Transportation | | | 133.2 | | | | 138.9 | | | | 512.7 | | | | 534.5 | |
| Off System Sales | | | 5.0 | | | | 4.4 | | | | 22.6 | | | | 34.9 | |
| Other | | | 0.1 | | | | 0.4 | | | | 0.5 | | | | 0.9 | |
| |
| Total | | | 243.6 | | | | 244.1 | | | | 864.0 | | | | 897.8 | |
| |
| Weather Adjustment | | | (6.2 | ) | | | 5.5 | | | | (8.9 | ) | | | 4.2 | |
| |
| Sales & Transportation Volumes — Excluding Weather | | | 237.4 | | | | 249.6 | | | | 855.1 | | | | 902.0 | |
| |
| | | | | | | | | | | | | | | | | |
Heating Degree Days | | | 1,854 | | | | 1,696 | | | | 5,035 | | | | 4,887 | |
Normal Heating Degree Days | | | 1,771 | | | | 1,771 | | | | 4,939 | | | | 4,967 | |
% Colder (Warmer) than Normal | | | 5 | % | | | (4 | %) | | | 2 | % | | | (2 | %) |
| | | | | | | | | | | | | | | | | |
Customers | | | | | | | | | | | | | | | | |
| Residential | | | | | | | | | | | 2,464,350 | | | | 2,389,032 | |
| Commercial | | | | | | | | | | | 215,107 | | | | 215,633 | |
| Industrial | | | | | | | | | | | 5,255 | | | | 5,806 | |
| Transportation | | | | | | | | | | | 675,748 | | | | 722,379 | |
| Other | | | | | | | | | | | 59 | | | | 61 | |
| |
| Total | | | | | | | | | | | 3,360,519 | | | | 3,332,911 | |
| |
| | | | | | | | | | | | | | | | | |
| | | Three Months | | | Twelve Months | |
| Gas Transmission and Storage Operations | | Ended December 31, | | | Ended December 31, | |
| | | 2005 | | | 2004 | | | 2005 | | | 2004 | |
| |
Throughput (MMDth) | | | | | | | | | | | | | | | | |
| Columbia Transmission | | | | | | | | | | | | | | | | |
| Market Area | | | 275.7 | | | | 277.1 | | | | 983.9 | | | | 978.3 | |
| Columbia Gulf | | | | | | | | | | | | | | | | |
| Mainline | | | 119.5 | | | | 123.6 | | | | 521.6 | | | | 539.1 | |
| Short-haul | | | 17.6 | | | | 25.7 | | | | 86.3 | | | | 102.5 | |
| Columbia Pipeline Deep Water | | | 2.1 | | | | 3.9 | | | | 11.5 | | | | 16.7 | |
| Crossroads Gas Pipeline | | | 10.3 | | | | 10.8 | | | | 41.8 | | | | 40.5 | |
| Granite State Pipeline | | | 9.0 | | | | 9.6 | | | | 31.8 | | | | 32.7 | |
| Intrasegment eliminations | | | (114.2 | ) | | | (121.8 | ) | | | (504.8 | ) | | | (537.1 | ) |
| |
| Total | | | 320.0 | | | | 328.9 | | | | 1,172.1 | | | | 1,172.7 | |
| |
Page 13 of 21
NiSource Inc.
Segment Volumes and Statistical Data (continued)
(Non-GAAP)
| | | | | | | | | | | | | | | | | |
| | | Three Months | | | Twelve Months | |
| Electric Operations | | Ended December 31, | | | Ended December 31, | |
| | | 2005 | | | 2004 | | | 2005 | | | 2004 | |
| |
Sales (Gigawatt Hours) | | | | | | | | | | | | | | | | |
| Residential | | | 783.2 | | | | 731.9 | | | | 3,516.1 | | | | 3,104.3 | |
| Commercial | | | 928.3 | | | | 885.4 | | | | 3,893.0 | | | | 3,635.0 | |
| Industrial | | | 2,378.0 | | | | 2,348.7 | | | | 9,131.6 | | | | 9,309.4 | |
| Wholesale | | | 137.7 | | | | 112.6 | | | | 831.3 | | | | 1,176.2 | |
| Other | | | 32.2 | | | | 45.4 | | | | 115.0 | | | | 142.6 | |
| |
| Total | | | 4,259.4 | | | | 4,124.0 | | | | 17,487.0 | | | | 17,367.5 | |
| |
| Weather Adjustment | | | (8.4 | ) | | | 3.2 | | | | (160.8 | ) | | | 242.6 | |
| |
| Sales Volumes — Excluding Weather impacts | | | 4,251.0 | | | | 4,127.2 | | | | 17,326.2 | | | | 17,610.1 | |
| |
| | | | | | | | | | | | | | | | | |
Cooling Degree Days | | | — | | | | — | | | | 935 | | | | 582 | |
Normal Cooling Degree Days | | | — | | | | — | | | | 803 | | | | 803 | |
% Warmer (Colder) than Normal | | | | | | | | | | | 16 | % | | | (28 | %) |
| | | | | | | | | | | | | | | | | |
Electric Customers | | | | | | | | | | | | | | | | |
| Residential | | | | | | | | | | | 395,849 | | | | 392,342 | |
| Commercial | | | | | | | | | | | 51,261 | | | | 50,332 | |
| Industrial | | | | | | | | | | | 2,515 | | | | 2,528 | |
| Wholesale | | | | | | | | | | | 7 | | | | 22 | |
| Other | | | | | | | | | | | 765 | | | | 770 | |
| |
| Total | | | | | | | | | | | 450,397 | | | | 445,994 | |
| |
Page 14 of 21
NiSource Inc.
Schedule 1 — Reconciliation of Net Operating Earnings to GAAP
| | | | | | | | | | | | | | | | | |
| | | Three Months | | | Twelve Months | |
| | | Ended December 31, | | | Ended December 31, | |
| (in millions,except per share amounts) | | 2005 | | | 2004 | | | 2005 | | | 2004 | |
| |
Net Operating Earnings from Continuing Operations | | $ | 123.2 | | | $ | 137.7 | | | $ | 375.4 | | | $ | 405.8 | |
| |
Items excluded from operating earnings: | | | | | | | | | | | | | | | | |
Net Revenues: | | | | | | | | | | | | | | | | |
| Weather — compared to normal | | | 9.2 | | | | (12.1 | ) | | | 27.0 | | | | (23.9 | ) |
| Gas costs and other changes | | | 12.1 | | | | 20.7 | | | | 13.3 | | | | 15.9 | |
| Third party buyout of bankruptcy claim | | | — | | | | 1.9 | | | | 8.9 | | | | 1.9 | |
| Legal settlement | | | — | | | | — | | | | — | | | | 5.1 | |
| | | | | | | | | | | | | | | | | |
Operating Expenses: | | | | | | | | | | | | | | | | |
| Restructuring, transition and consulting charges (outsourcing initiative) | | | (12.6 | ) | | | — | | | | (82.8 | ) | | | — | |
| Insurance recoveries, legal and reserve changes | | | 1.4 | | | | 0.8 | | | | (3.0 | ) | | | 10.3 | |
| Asset impairment and loss on asset sales | | | — | | | | — | | | | (21.8 | ) | | | — | |
| Gain (loss) and sales of assets | | | (1.8 | ) | | | 4.0 | | | | (0.4 | ) | | | 3.1 | |
| Property and sales tax adjustments | | | — | | | | 14.6 | | | | 8.1 | | | | 31.3 | |
| | | | | | | | | | | | | | | | | |
Loss on early extinguishment of long-term debt | | | (108.6 | ) | | | — | | | | (108.6 | ) | | | (4.1 | ) |
| |
| Total items excluded from operating earnings | | | (100.3 | ) | | | 29.9 | | | | (159.3 | ) | | | 39.6 | |
| |
| Tax effect of above items and other income tax adjustments | | | 49.9 | | | | (10.6 | ) | | | 67.5 | | | | (14.4 | ) |
| |
| | | | | | | | | | | | | | | | | |
| |
Reported Income from Continuing Operations — GAAP | | $ | 72.8 | | | $ | 157.0 | | | $ | 283.6 | | | $ | 431.0 | |
| |
| | | | | | | | | | | | | | | | | |
| |
Basic Average Common Shares Outstanding (millions) | | | 271.9 | | | | 267.2 | | | | 271.3 | | | | 263.7 | |
| |
| | | | | | | | | | | | | | | | | |
Basic Net Operating Earnings Per Share ($) | | | 0.45 | | | | 0.52 | | | | 1.38 | | | | 1.54 | |
| |
| Items excluded from operating earnings (after-tax) | | | (0.18 | ) | | | 0.07 | | | | (0.33 | ) | | | 0.09 | |
| |
GAAP Basic Earnings Per Share from Continuing Operations | | | 0.27 | | | | 0.59 | | | | 1.05 | | | | 1.63 | |
| |
Page 15 of 21
NiSource Inc.
Schedule 2 — Quarterly Adjustments by Segment from Operating Earnings to GAAP
Quarter ended December 31, 2005 (in millions)
| | | | | | | | | | | | | | | | | | | | | | | | | |
| | | Gas | | | Transmission | | | | | | | | | | | | | |
| | | Distribution | | | and Storage | | | Electric | | | Other | | | Corporate | | | Total | |
| | | | | | |
| | | | | | | | | | | | | | | | | | | | | | | | | |
Operating Earnings (Loss) | | $ | 146.6 | | | $ | 97.3 | | | $ | 57.5 | | | $ | 0.7 | | | $ | (7.9 | ) | | $ | 294.2 | |
| | | | | | | | | | | | | | | | | | | | | | | | | |
Net Revenues: | | | | | | | | | | | | | | | | | | | | | | | | |
| Weather (compared to normal) | | | 8.5 | | | | — | | | | 0.7 | | | | — | | | | — | | | | 9.2 | |
| Gas costs and other changes | | | 12.1 | | | | — | | | | — | | | | — | | | | — | | | | 12.1 | |
| | | |
Total Impact — Net Revenues | | | 20.6 | | | | — | | | | 0.7 | | | | — | | | | — | | | | 21.3 | |
| | | | | | | | | | | | | | | | | | | | | | | | | |
Operating Expenses | | | | | | | | | | | | | | | | | | | | | | | | |
Operation and Maintenance Expenses: | | | | | | | | | | | | | | | | | | | | | | | | |
| Restructuring, transition and consulting charges (outsourcing initiative) | | | (8.0 | ) | | | (1.6 | ) | | | (1.7 | ) | | | (0.2 | ) | | | (1.1 | ) | | | (12.6 | ) |
| Insurance recoveries, legal and reserve changes | | | — | | | | — | | | | — | | | | 1.4 | | | | — | | | | 1.4 | |
| | | |
Total Impact — O & M Expenses | | | (8.0 | ) | | | (1.6 | ) | | | (1.7 | ) | | | 1.2 | | | | (1.1 | ) | | | (11.2 | ) |
| | | | | | | | | | | | | | | | | | | | | | | | | |
(Loss) Gain on Sale of Assets | | | (2.0 | ) | | | 0.2 | | | | — | | | | — | | | | — | | | | (1.8 | ) |
| | | | | | | | | | | | | | | | | | | | | | | | | |
Total Impact — Operating Expenses | | | (10.0 | ) | | | (1.4 | ) | | | (1.7 | ) | | | 1.2 | | | | (1.1 | ) | | | (13.0 | ) |
| | | |
| | | | | | | | | | | | | | | | | | | | | | | | | |
| | | |
Total Impact — Operating Income (Loss) | | $ | 10.6 | | | $ | (1.4 | ) | | $ | (1.0 | ) | | $ | 1.2 | | | $ | (1.1 | ) | | $ | 8.3 | |
| | | |
| | | | | | | | | | | | | | | | | | | | | | | | | |
Operating Income (Loss) — GAAP | | $ | 157.2 | | | $ | 95.9 | | | $ | 56.5 | | | $ | 1.9 | | | $ | (9.0 | ) | | $ | 302.5 | |
Quarter ended December 31, 2004 (in millions)
| | | | | | | | | | | | | | | | | | | | | | | | | |
| | | | | | | Transmission | | | | | | | | | | | | | |
| | | Gas Distribution | | | and Storage | | | Electric | | | Other | | | Corporate | | | Total | |
| | | | | | |
| | | | | | | | | | | | | | | | | | | | | | | | | |
Operating Earnings (Loss) | | $ | 162.9 | | | $ | 106.1 | | | $ | 64.0 | | | $ | (9.1 | ) | | $ | (9.4 | ) | | $ | 314.5 | |
| | | | | | | | | | | | | | | | | | | | | | | | | |
Net Revenues: | | | | | | | | | | | | | | | | | | | | | | | | |
| Weather (compared to normal) | | | (11.8 | ) | | | — | | | | (0.3 | ) | | | — | | | | — | | | | (12.1 | ) |
| Gas costs and other changes | | | 20.7 | | | | — | | | | — | | | | — | | | | — | | | | 20.7 | |
| Third party buyout of bankruptcy claim | | | — | | | | 1.9 | | | | — | | | | — | | | | — | | | | 1.9 | |
| | | |
Total Impact — Net Revenues | | | 8.9 | | | | 1.9 | | | | (0.3 | ) | | | — | | | | — | | | | 10.5 | |
| | | | | | | | | | | | | | | | | | | | | | | | | |
Operating Expenses | | | | | | | | | | | | | | | | | | | | | | | | |
Operation and Maintenance Expenses: | | | | | | | | | | | | | | | | | | | | | | | | |
| Insurance recoveries, legal and other reserves | | | (0.4 | ) | | | — | | | | (2.3 | ) | | | — | | | | 3.5 | | | | 0.8 | |
| | | |
Total Impact — O & M Expenses | | | (0.4 | ) | | | — | | | | (2.3 | ) | | | — | | | | 3.5 | | | | 0.8 | |
| | | | | | | | | | | | | | | | | | | | | | | | | |
(Loss) Gain on Sale of Assets | | | — | | | | (1.0 | ) | | | 1.6 | | | | 3.4 | | | | — | | | | 4.0 | |
| | | |
| | | | | | | | | | | | | | | | | | | | | | | | | |
Property and Sales Tax Adjustments | | | 4.5 | | | | 2.1 | | | | 7.0 | | | | 1.0 | | | | — | | | | 14.6 | |
| | | |
| | | | | | | | | | | | | | | | | | | | | | | | | |
Total Impact — Operating Expenses | | | 4.1 | | | | 1.1 | | | | 6.3 | | | | 4.4 | | | | 3.5 | | | | 19.4 | |
| | | |
| | | | | | | | | | | | | | | | | | | | | | | | | |
| | | |
Total Impact — Operating Income | | $ | 13.0 | | | $ | 3.0 | | | $ | 6.0 | | | $ | 4.4 | | | $ | 3.5 | | | $ | 29.9 | |
| | | |
| | | | | | | | | | | | | | | | | | | | | | | | | |
Operating Income (Loss) — GAAP | | $ | 175.9 | | | $ | 109.1 | | | $ | 70.0 | | | $ | (4.7 | ) | | $ | (5.9 | ) | | $ | 344.4 | |
Page 16 of 21
NiSource Inc.
Schedule 2 — Annual Adjustments by Segment from Operating Earnings to GAAP
Year ended December 31, 2005 (in millions)
| | | | | | | | | | | | | | | | | | | | | | | | | |
| | | Gas | | | Transmission | | | | | | | | | | | | | |
| | | Distribution | | | and Storage | | | Electric | | | Other | | | Corporate | | | Total | |
| | | | | | |
Operating Earnings (Loss) | | $ | 394.2 | | | $ | 349.6 | | | $ | 292.1 | | | $ | (13.2 | ) | | $ | (19.2 | ) | | $ | 1,003.5 | |
| | | | | | | | | | | | | | | | | | | | | | | | | |
Net Revenues: | | | | | | | | | | | | | | | | | | | | | | | | |
| Weather (compared to normal) | | | 15.9 | | | | — | | | | 11.1 | | | | — | | | | — | | | | 27.0 | |
| Gas costs and other changes | | | 14.6 | | | | — | | | | (1.3 | ) | | | — | | | | — | | | | 13.3 | |
| Third party buyout of bankruptcy claim | | | — | | | | 8.9 | | | | — | | | | — | | | | — | | | | 8.9 | |
| | | |
Total Impact — Net Revenues | | | 30.5 | | | | 8.9 | | | | 9.8 | | | | — | | | | — | | | | 49.2 | |
| | | | | | | | | | | | | | | | | | | | | | | | | |
Operating Expenses | | | | | | | | | | | | | | | | | | | | | | | | |
Operation and Maintenance Expenses: | | | | | | | | | | | | | | | | | | | | | | | | |
| Restructuring, transition and consulting charges (outsourcing initiative) | | | (49.4 | ) | | | (12.8 | ) | | | (8.4 | ) | | | (1.4 | ) | | | (10.8 | ) | | | (82.8 | ) |
| Insurance recoveries, legal and reserve changes | | | (0.4 | ) | | | (1.5 | ) | | | (2.9 | ) | | | 1.8 | | | | — | | | | (3.0 | ) |
| | | |
Total Impact — O & M Expenses | | | (49.8 | ) | | | (14.3 | ) | | | (11.3 | ) | | | 0.4 | | | | (10.8 | ) | | | (85.8 | ) |
| | | | | | | | | | | | | | | | | | | | | | | | | |
Asset Impairment and Gain (Loss) on Sale of Assets | | | (12.5 | ) | | | 0.2 | | | | 0.4 | | | | 0.6 | | | | (10.9 | ) | | | (22.2 | ) |
| | | |
| | | | | | | | | | | | | | | | | | | | | | | | | |
Property and Sales Tax Adjustments | | | 5.8 | | | | — | | | | 2.3 | | | | — | | | | — | | | | 8.1 | |
| | | |
| | | | | | | | | | | | | | | | | | | | | | | | | |
Total Impact — Operating Expenses | | | (56.5 | ) | | | (14.1 | ) | | | (8.6 | ) | | | 1.0 | | | | (21.7 | ) | | | (99.9 | ) |
| | | |
| | | | | | | | | | | | | | | | | | | | | | | | | |
| | | |
Total Impact — Operating Income (Loss) | | $ | (26.0 | ) | | $ | (5.2 | ) | | $ | 1.2 | | | $ | 1.0 | | | $ | (21.7 | ) | | $ | (50.7 | ) |
| | | |
| | | | | | | | | | | | | | | | | | | | | | | | | |
Operating Income (Loss) — GAAP | | $ | 368.2 | | | $ | 344.4 | | | $ | 293.3 | | | $ | (12.2 | ) | | $ | (40.9 | ) | | $ | 952.8 | |
Year ended December 31, 2004 (in millions)
| | | | | | | | | | | | | | | | | | | | | | | | | |
| | | Gas | | | Transmission | | | | | | | | | | | | | |
| | | Distribution | | | and Storage | | | Electric | | | Other | | | Corporate | | | Total | |
| | | | | | |
Operating Earnings (Loss) | | $ | 428.8 | | | $ | 366.5 | | | $ | 300.4 | | | $ | (39.4 | ) | | $ | (22.5 | ) | | $ | 1,033.8 | |
| | | | | | | | | | | | | | | | | | | | | | | | | |
Net Revenues: | | | | | | | | | | | | | | | | | | | | | | | | |
| Weather (compared to normal) | | | (8.2 | ) | | | — | | | | (15.7 | ) | | | — | | | | — | | | | (23.9 | ) |
| Gas costs and other changes | | | 17.6 | | | | (3.0 | ) | | | 0.3 | | | | 1.0 | | | | — | | | | 15.9 | |
| Third party buyout of bankruptcy claim | | | — | | | | 1.9 | | | | — | | | | — | | | | — | | | | 1.9 | |
| Legal settlement | | | — | | | | — | | | | — | | | | 5.1 | | | | — | | | | 5.1 | |
| | | |
Total Impact — Net Revenues | | | 9.4 | | | | (1.1 | ) | | | (15.4 | ) | | | 6.1 | | | | — | | | | (1.0 | ) |
| | | | | | | | | | | | | | | | | | | | | | | | | |
Operating Expenses | | | | | | | | | | | | | | | | | | | | | | | | |
Operation and Maintenance Expenses: | | | | | | | | | | | | | | | | | | | | | | | | |
| Insurance recoveries, legal and other reserves | | | (0.1 | ) | | | (3.2 | ) | | | (2.2 | ) | | | (1.3 | ) | | | 17.1 | | | | 10.3 | |
| | | |
Total Impact — O & M Expenses | | | (0.1 | ) | | | (3.2 | ) | | | (2.2 | ) | | | (1.3 | ) | | | 17.1 | | | | 10.3 | |
| | | | | | | | | | | | | | | | | | | | | | | | | |
Asset Impairment and Gain (Loss) on Sale of Assets | | | — | | | | (1.2 | ) | | | 1.6 | | | | 2.7 | | | | — | | | | 3.1 | |
| | | |
| | | | | | | | | | | | | | | | | | | | | | | | | |
Property and Sales Tax Adjustments | | | 3.1 | | | | 2.1 | | | | 25.1 | | | | 1.0 | | | | — | | | | 31.3 | |
| | | |
| | | | | | | | | | | | | | | | | | | | | | | | | |
Total Impact — Operating Expenses | | | 3.0 | | | | (2.3 | ) | | | 24.5 | | | | 2.4 | | | | 17.1 | | | | 44.7 | |
| | | |
| | | | | | | | | | | | | | | | | | | | | | | | | |
| | | |
Total Impact — Operating Income (Loss) | | $ | 12.4 | | | $ | (3.4 | ) | | $ | 9.1 | | | $ | 8.5 | | | $ | 17.1 | | | $ | 43.7 | |
| | | |
| | | | | | | | | | | | | | | | | | | | | | | | | |
Operating Income (Loss) — GAAP | | $ | 441.2 | | | $ | 363.1 | | | $ | 309.5 | | | $ | (30.9 | ) | | $ | (5.4 | ) | | $ | 1,077.5 | |
Page 17 of 21
NiSource Inc.
Income Statement (GAAP)
(unaudited)
| | | | | | | | | | | | | | | | | |
| | | Three Months | | | Twelve Months | |
| | | Ended December 31, | | | Ended December 31, | |
| (in millions,except per share amounts) | | 2005 | | | 2004 | | | 2005 | | | 2004 | |
| |
Net Revenues | | | | | | | | | | | | | | | | |
| Gas Distribution | | $ | 1,730.4 | | | $ | 1,197.8 | | | $ | 4,595.6 | | | $ | 3,801.8 | |
| Gas Transportation and Storage | | | 279.0 | | | | 275.2 | | | | 1,000.0 | | | | 1,013.4 | |
| Electric | | | 301.7 | | | | 279.9 | | | | 1,247.6 | | | | 1,121.0 | |
| Other | | | 381.7 | | | | 214.2 | | | | 1,050.1 | | | | 725.3 | |
| |
| Gross Revenues | | | 2,692.8 | | | | 1,967.1 | | | | 7,893.3 | | | | 6,661.5 | |
| Cost of Sales | | | 1,818.4 | | | | 1,110.7 | | | | 4,743.5 | | | | 3,609.7 | |
| |
| Total Net Revenues | | | 874.4 | | | | 856.4 | | | | 3,149.8 | | | | 3,051.8 | |
| |
Operating Expenses | | | | | | | | | | | | | | | | |
| Operation and maintenance | | | 346.3 | | | | 319.3 | | | | 1,328.3 | | | | 1,203.6 | |
| Depreciation and amortization | | | 137.6 | | | | 130.6 | | | | 545.2 | | | | 508.6 | |
| Impairment and loss (gain) on sale of assets | | | 1.8 | | | | (4.0 | ) | | | 22.2 | | | | (3.1 | ) |
| Other taxes | | | 86.2 | | | | 66.1 | | | | 301.3 | | | | 265.2 | |
| |
| Total Operating Expenses | | | 571.9 | | | | 512.0 | | | | 2,197.0 | | | | 1,974.3 | |
| |
Operating Income | | | 302.5 | | | | 344.4 | | | | 952.8 | | | | 1,077.5 | |
| |
Other Income (Deductions) | | | | | | | | | | | | | | | | |
| Interest expense, net | | | (108.2 | ) | | | (103.1 | ) | | | (421.0 | ) | | | (403.9 | ) |
| Dividend requirements on preferred stock of subsidiaries | | | (1.0 | ) | | | (1.1 | ) | | | (4.2 | ) | | | (4.4 | ) |
| Other, net | | | 7.6 | | | | 3.4 | | | | 14.0 | | | | 7.3 | |
| Gain (loss) on extinguishment of long-term debt | | | (108.6 | ) | | | — | | | | (108.6 | ) | | | (4.1 | ) |
| |
| Total Other Income (Deductions) | | | (210.2 | ) | | | (100.8 | ) | | | (519.8 | ) | | | (405.1 | ) |
| |
Income From Continuing Operations Before Income Taxes | | | 92.3 | | | | 243.6 | | | | 433.0 | | | | 672.4 | |
Income Taxes | | | 19.5 | | | | 86.6 | | | | 149.4 | | | | 241.4 | |
| |
Income from Continuing Operations | | | 72.8 | | | | 157.0 | | | | 283.6 | | | | 431.0 | |
| |
| Income (Loss) from Discontinued Operations — net of taxes | | | (0.2 | ) | | | 0.8 | | | | (20.3 | ) | | | 5.3 | |
| Gain (Loss) on Disposition of Discontinued Operations — net of taxes | | | (4.3 | ) | | | 1.6 | | | | 43.5 | | | | — | |
| Change in Accounting — net of taxes | | | (0.3 | ) | | | — | | | | (0.3 | ) | | | — | |
| |
Net Income | | $ | 68.0 | | | $ | 159.4 | | | $ | 306.5 | | | $ | 436.3 | |
| |
| | | | | | | | | | | | | | | | | |
Basic Earnings (Loss) Per Share ($) | | | | | | | | | | | | | | | | |
| Continuing operations | | | 0.27 | | | | 0.59 | | | | 1.05 | | | | 1.63 | |
| Discontinued operations | | | (0.02 | ) | | | 0.01 | | | | 0.08 | | | | 0.02 | |
| |
Basic Earnings Per Share | | | 0.25 | | | | 0.60 | | | | 1.13 | | | | 1.65 | |
| |
| | | | | | | | | | | | | | | | | |
Diluted Earnings (Loss) Per Share ($) | | | | | | | | | | | | | | | | |
| Continuing operations | | | 0.27 | | | | 0.58 | | | | 1.04 | | | | 1.62 | |
| Discontinued operations | | | (0.02 | ) | | | 0.01 | | | | 0.08 | | | | 0.02 | |
| |
Diluted Earnings Per Share | | | 0.25 | | | | 0.59 | | | | 1.12 | | | | 1.64 | |
| |
| | | | | | | | | | | | | | | | | |
| |
Dividends Declared Per Common Share | | | 0.23 | | | | 0.23 | | | | 0.92 | | | | 0.92 | |
| |
| | | | | | | | | | | | | | | | | |
Basic Average Common Shares Outstanding (millions) | | | 271.9 | | | | 267.2 | | | | 271.3 | | | | 263.7 | |
Diluted Average Common Shares (millions) | | | 273.5 | | | | 269.0 | | | | 273.0 | | | | 265.5 | |
| |
Page 18 of 21
NiSource Inc.
Consolidated Balance Sheets
(unaudited)
| | | | | | | | | |
| | | December 31, | | | December 31, | |
| (in millions) | | 2005 | | | 2004 | |
| |
| | | | | | | | | |
ASSETS | | | | | | | | |
Property, Plant and Equipment | | | | | | | | |
| Utility Plant | | $ | 16,684.4 | | | $ | 16,194.1 | |
| Accumulated depreciation and amortization | | | (7,556.8 | ) | | | (7,247.7 | ) |
| |
| Net utility plant | | | 9,127.6 | | | | 8,946.4 | |
| |
| Other property, at cost, less accumulated depreciation | | | 426.7 | | | | 427.5 | |
| |
| Net Property, Plant and Equipment | | | 9,554.3 | | | | 9,373.9 | |
| |
| | | | | | | | | |
Investments and Other Assets | | | | | | | | |
| Assets of discontinued operations and assets held for sale | | | 34.6 | | | | 38.6 | |
| Unconsolidated affiliates | | | 75.0 | | | | 64.2 | |
| Other investments | | | 114.2 | | | | 113.0 | |
| |
| Total Investments | | | 223.8 | | | | 215.8 | |
| |
| | | | | | | | | |
Current Assets | | | | | | | | |
| Cash and cash equivalents | | | 69.4 | | | | 29.5 | |
| Restricted cash | | | 33.9 | | | | 56.3 | |
| Accounts receivable (less reserve of $67.9 and $55.6, respectively) | | | 1,254.6 | | | | 889.1 | |
| Gas inventory | | | 526.9 | | | | 452.9 | |
| Underrecovered gas and fuel costs | | | 421.8 | | | | 293.8 | |
| Materials and supplies, at average cost | | | 72.0 | | | | 70.6 | |
| Electric production fuel, at average cost | | | 24.9 | | | | 29.2 | |
| Price risk management assets | | | 183.1 | | | | 61.1 | |
| Exchange gas receivable | | | 169.8 | | | | 169.6 | |
| Regulatory assets | | | 195.0 | | | | 136.2 | |
| Prepayments and other | | | 109.3 | | | | 96.1 | |
| |
| Total Current Assets | | | 3,060.7 | | | | 2,284.4 | |
| |
| | | | | | | | | |
Other Assets | | | | | | | | |
| Price risk management assets | | | 192.9 | | | | 148.3 | |
| Regulatory assets | | | 586.3 | | | | 568.4 | |
| Goodwill | | | 3,677.3 | | | | 3,687.2 | |
| Intangible assets | | | 495.8 | | | | 520.3 | |
| Deferred charges and other | | | 167.4 | | | | 189.5 | |
| |
| Total Other Assets | | | 5,119.7 | | | | 5,113.7 | |
| |
Total Assets | | $ | 17,958.5 | | | $ | 16,987.8 | |
| |
Page 19 of 21
NiSource Inc.
Consolidated Balance Sheets (continued)
(unaudited)
| | | | | | | | | |
| | | December 31, | | | December 31, | |
| (in millions, except share amounts) | | 2005 | | | 2004 | |
| |
| | | | | | | | | |
CAPITALIZATION AND LIABILITIES | | | | | | | | |
Capitalization | | | | | | | | |
| Common stock equity | | | | | | | | |
| Common stock — $0.01 par value, 400,000,000 shares authorized; 272,622,905 and 270,625,370 shares issued and outstanding, respectively | | $ | 2.7 | | | $ | 2.7 | |
| Additional paid-in-capital | | | 3,969.4 | | | | 3,924.0 | |
| Retained earnings | | | 981.6 | | | | 925.4 | |
| Accumulated other comprehensive income (loss) and other common stock equity | | | (20.7 | ) | | | (65.0 | ) |
| |
| Total common stock equity | | | 4,933.0 | | | | 4,787.1 | |
| Preferred stocks—Series without mandatory redemption provisions | | | 81.1 | | | | 81.1 | |
| Long-term debt, excluding amounts due within one year | | | 5,271.2 | | | | 4,835.9 | |
| |
| Total Capitalization | | | 10,285.3 | | | | 9,704.1 | |
| |
| | | | | | | | | |
Current Liabilities | | | | | | | | |
| Current portion of long-term debt | | | 440.7 | | | | 1,299.9 | |
| Short-term borrowings | | | 898.0 | | | | 307.6 | |
| Accounts payable | | | 866.7 | | | | 648.4 | |
| Dividends declared on common and preferred stocks | | | 1.1 | | | | 1.1 | |
| Customer deposits | | | 101.9 | | | | 92.2 | |
| Taxes accrued | | | 217.5 | | | | 160.9 | |
| Interest accrued | | | 86.2 | | | | 84.1 | |
| Overrecovered gas and fuel costs | | | 25.8 | | | | 15.5 | |
| Price risk management liabilities | | | 72.3 | | | | 46.9 | |
| Exchange gas payable | | | 425.2 | | | | 325.1 | |
| Current deferred revenue | | | 51.3 | | | | 31.5 | |
| Regulatory liabilities | | | 46.3 | | | | 30.2 | |
| Accrued liability for postretirement and pension benefits | | | 55.0 | | | | 54.6 | |
| Other accruals | | | 555.2 | | | | 481.4 | |
| |
| Total Current Liabilities | | | 3,843.2 | | | | 3,579.4 | |
| |
| | | | | | | | | |
Other Liabilities and Deferred Credits | | | | | | | | |
| Price risk management liabilities | | | 22.2 | | | | 5.5 | |
| Deferred income taxes | | | 1,591.9 | | | | 1,665.9 | |
| Deferred investment tax credits | | | 69.9 | | | | 78.4 | |
| Deferred credits | | | 81.1 | | | | 74.0 | |
| Noncurrent deferred revenue | | | 60.4 | | | | 86.9 | |
| Accrued liability for postretirement and pension benefits | | | 511.0 | | | | 440.7 | |
| Preferred stock liabilities with mandatory redemption provisions | | | — | | | | 0.6 | |
| Regulatory liabilities and other removal costs | | | 1,196.2 | | | | 1,168.6 | |
| Asset retirement obligations | | | 119.8 | | | | 9.3 | |
| Other noncurrent liabilities | | | 177.5 | | | | 174.4 | |
| |
| Total Other | | | 3,830.0 | | | | 3,704.3 | |
| |
Commitments and Contingencies | | | — | | | | — | |
| |
Total Capitalization and Liabilities | | $ | 17,958.5 | | | $ | 16,987.8 | |
| |
Page 20 of 21
NiSource Inc.
Other Information
(unaudited)
| | | | | | | | | |
| | | December 31, | | | December 31, | |
| (in millions, except share amounts) | | 2005 | | | 2004 | |
| |
| | | | | | | | | |
Total Common Stock Equity | | $ | 4,933.0 | | | $ | 4,787.1 | |
| | | | | | | | | |
| Shares Outstanding (thousands) | | | 272,623 | | | | 270,625 | |
| | | | | | | | | |
| Book Value of Common Shares | | $ | 18.09 | | | $ | 17.69 | |
| |
Page 21 of 21
NiSource Inc.
Consolidated Statements of Cash Flows (unaudited)
| | | | | | | | | |
| Twelve Months Ended December 31,(in millions) | | 2005 | | | 2004 | |
| |
Operating Activities | | | | | | | | |
| Net income | | $ | 306.5 | | | $ | 436.3 | |
| Adjustments to reconcile net income to net cash from continuing operations: | | | | | | | | |
| Loss on early extinguishment of debt | | | 108.6 | | | | 4.1 | |
| Depreciation and amortization | | | 545.2 | | | | 508.6 | |
| Net changes in price risk management activities | | | (43.3 | ) | | | 16.3 | |
| Deferred income taxes and investment tax credits | | | (16.7 | ) | | | 97.5 | |
| Deferred revenue | | | (6.6 | ) | | | (22.3 | ) |
| Stock compensation expense | | | 6.8 | | | | 8.0 | |
| Loss (gain) on sale of assets | | | 0.4 | | | | (3.1 | ) |
| Loss on impairment of assets | | | 21.8 | | | | — | |
| Income from unconsolidated affiliates | | | (4.7 | ) | | | (0.9 | ) |
| Loss (gain) from sale of discontinued operations | | | (43.5 | ) | | | — | |
| Loss (income) from discontinued operations | | | 20.3 | | | | (5.3 | ) |
| Amortization of discount/premium on debt | | | 17.5 | | | | 21.6 | |
| Other adjustments | | | (3.2 | ) | | | (2.3 | ) |
| Changes in assets and liabilities: | | | | | | | | |
| Accounts receivable | | | (358.9 | ) | | | (92.0 | ) |
| Inventories | | | (71.1 | ) | | | (23.1 | ) |
| Accounts payable | | | 205.7 | | | | 153.3 | |
| Customer deposits | | | 9.7 | | | | 6.7 | |
| Taxes accrued | | | 18.9 | | | | (57.8 | ) |
| Interest accrued | | | 6.3 | | | | 1.7 | |
| (Under) Overrecovered gas and fuel costs | | | (117.6 | ) | | | (104.3 | ) |
| Exchange gas receivable/payable | | | 88.0 | | | | 93.3 | |
| Other accruals | | | 21.7 | | | | 11.4 | |
| Prepayment and other current assets | | | (13.2 | ) | | | 4.2 | |
| Regulatory assets/liabilities | | | (43.5 | ) | | | 18.6 | |
| Postretirement and postemployment benefits | | | 50.1 | | | | 35.4 | |
| Deferred credits | | | 6.7 | | | | (14.3 | ) |
| Deferred charges and other noncurrent assets | | | (2.8 | ) | | | (36.3 | ) |
| Other noncurrent liabilities | | | 20.6 | | | | (1.5 | ) |
| |
| Net Cash Flows from Continuing Operations | | | 729.7 | | | | 1,053.8 | |
| Net Cash Flows from (used for) Discontinued Operations | | | (17.4 | ) | | | 2.1 | |
| |
| Net Cash Flows from Operating Activities | | | 712.3 | | | | 1,055.9 | |
| |
Investing Activities | | | | | | | | |
| Capital expenditures | | | (590.4 | ) | | | (517.0 | ) |
| Proceeds from disposition of assets | | | 7.5 | | | | 7.1 | |
| Other investing activities | | | 10.9 | | | | (42.7 | ) |
| |
| Net Investing Activities used for Continuing Operations | | | (572.0 | ) | | | (552.6 | ) |
| Net Investing Activities used for Discontinued Operations | | | (0.1 | ) | | | — | |
| |
| Net Cash Flows used for Investing Activities | | | (572.1 | ) | | | (552.6 | ) |
| |
Financing Activities | | | | | | | | |
| Issuance of long-term debt | | | 1,907.9 | | | | 450.0 | |
| Retirement of long-term debt | | | (2,372.5 | ) | | | (486.6 | ) |
| Premium on debt retirement | | | (14.2 | ) | | | — | |
| Change in short-term debt | | | 590.4 | | | | (377.9 | ) |
| Issuance of common stock | | | 40.0 | | | | 160.8 | |
| Acquisition of treasury stock | | | (1.6 | ) | | | (4.1 | ) |
| Dividends paid — common shares | | | (250.3 | ) | | | (243.1 | ) |
| |
| Net Financing Activities used for Continuing Operations | | | (100.3 | ) | | | (500.9 | ) |
| Net Financing Activities used for Discontinued Operations | | | — | | | | — | |
| |
| Net Cash Flows used for Financing Activities | | | (100.3 | ) | | | (500.9 | ) |
| |
| Increase in cash and cash equivalents | | | 39.9 | | | | 2.4 | |
| Cash and cash equivalents at beginning of year | | | 29.5 | | | | 27.1 | |
| |
Cash and cash equivalents at end of period | | $ | 69.4 | | | $ | 29.5 | |
| |
| | | | | | | | | |
Supplemental Disclosures of Cash Flow Information | | | | | | | | |
| Cash paid for interest | | $ | 404.5 | | | $ | 383.0 | |
| Interest capitalized | | | 3.2 | | | | 2.3 | |
| Cash paid for income taxes | | | 101.4 | | | | 184.6 | |
| |
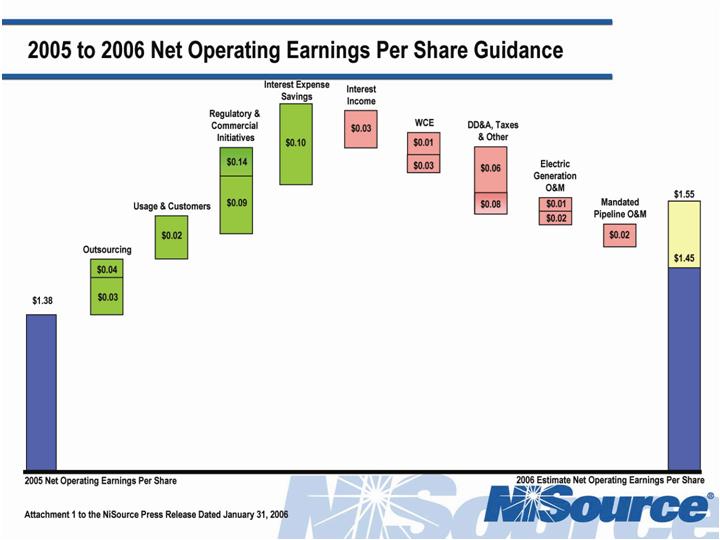
| 2005 to 2006 Operating Earnings Per Share Guidance 2006 Estimate Net Operating Earnings Per Share 2005 Net Operating Earnings Per Share $1.45 $1.55 $0.06 $0.08 DD&A, Taxes, and Other $0.02 Mandated Pipeline O&M $0.01 Generation O&M $0.02 $0.01 $0.03 WCE $1.38 $0.03 Usage & Customers Regulatory & Pipeline Initiatives $0.10 Interest Expense Savings $0.04 Outsourcing $0.03 $0.03 $0.02 $0.14 $0.09 Interest Income Attachment 1 to the NiSource Press Release Dated January 31, 2006 |