UNITED STATES
SECURITIES AND EXCHANGE COMMISSION
Washington, D.C. 20549
FORM 10-Q
X QUARTERLY REPORT PURSUANT TO SECTION 13 OR 15(d) OF THE SECURITIES EXCHANGE ACT OF 1934
For the quarterly period ended September 30, 2010
___ TRANSITION REPORT PURSUANT TO SECTION 13 OR 15(d) OF THE SECURITIES EXCHANGE ACT OF 1934
For the transition period from ____ to ____
WORLDWIDE ENERGY AND MANUFACTURING USA, INC.
(Exact name of registrant as specified in its charter)
| Colorado | 0-31761 | 77-0423745 |
| (State or other jurisdiction of incorporation or organization) | (Commission File Number) | (I.R.S. Employer Identification No.) |
| | | |
408 N. Canal Street South San Francisco, CA 94080 |
| (Address of principal executive offices) |
Registrant’s telephone number, including area code: (650) 794-9888
Indicate by check mark whether the registrant (1) has filed all reports required to be filed by Section 13 or 15(d) of the Securities Exchange Act of 1934 during the preceding 12 months (or for such shorter period that the registrant was required to file such reports), and (2) has been subject to such filing requirements for the past 90 days. Yes /X/ No / /
Indicate by check mark whether the registrant has submitted electronically and posted on its corporate Web site, if any, every Interactive Data File required to be submitted and posted pursuant to Rule 405 of regulation S-T (§232.405 of this chapter) during the preceding 12 months (or for such shorter period that the registrant was required to submit and post such files). Yes [ ] No [ ]
Indicate by check mark whether the registrant is a large accelerated filer, an accelerated filer, a non-accelerated filer, or a smaller reporting company. See the definitions of "large accelerated filer," "accelerated filer" and "smaller reporting company" in Rule 12b-2 of the Exchange Act.
Large accelerated filer [ ] Accelerated filer [ ]
Non-accelerated filer [ ] Smaller reporting company [X]
Indicate by check mark whether the registrant is a shell company (as defined in Rule 12b-2 of the Exchange Act). Yes [ ] No [X]
APPLICABLE ONLY TO ISSUERS INVOLVED IN BANKRUPTCY PROCEEDINGS
DURING THE PRECEDING FIVE YEARS
Indicate by check mark whether the registrant filed all documents and reports required to be filed by Section 12, 13 or 15(d) of the Exchange Act after the distribution of securities under a plan confirmed by a court. Yes / / No / /
APPLICABLE ONLY TO CORPORATE ISSUERS
Indicate the number of shares outstanding of each of the issuer's classes of stock, as of the latest practicable date.
| Class of Securities | Shares Outstanding at November 22, 2010 |
| Common Stock, no par value | 5,657,215 |
INDEX
| | PAGE |
| | |
| ITEM 1. FINANCIAL STATEMENTS | 4 |
| | |
| CONDENSED CONSOLIDATED BALANCE SHEETS | 5 |
| | |
| UNAUDITED CONDENSED CONSOLIDATED STATEMENTS OF INCOME | 6 |
| | |
| UNAUDITED CONDENSED CONSOLIDATED STATEMENTS OF COMPREHENSIVE INCOME | 7 |
| | |
| UNAUDITED CONDENSED CONSOLIDATED STATEMENTS OF CASH FLOWS | 8 |
| | |
| NOTES TO THE UNAUDITED CONDENSED CONSOLIDATED FINANCIAL STATEMENTS | 9 |
| | |
| ITEM 2. MANAGEMENT’S DISCUSSION AND ANALYSIS OF FINANCIAL CONDITION AND RESULTS OF OPERATIONS | 28 |
| | |
| ITEM 3. QUANTITATIVE AND QUALITATIVE DISCLOSURES ABOUT MARKET RISK | 39 |
| | |
| ITEM 4. CONTROLS AND PROCEDURES | 39 |
| | |
| PART II. OTHER INFORMATION | 42 |
| | |
| SIGNATURES | 43 |
| | |
| | |
| | |
PART 1 - FINANCIAL INFORMATION
ITEM 1. FINANCIAL STATEMENTS
| (a) | The unaudited condensed consolidated financial statements of registrant for the three and nine months ended September 30, 2010 and 2009 follow. The condensed consolidated financial statements reflect all adjustments which are, in the opinion of management, necessary for a fair presentation of the results for the interim periods presented. All such adjustments are of a normal and recurring nature. |
WORLDWIDE ENERGY AND MANUFACTURING USA, INC. AND SUBSIDIARIES
CONDENSED CONSOLIDATED BALANCE SHEETS
| | | September 30, 2010 | | | December 31, 2009 | |
| ASSETS | | (Unaudited) | | | | |
| | | | | | | |
| Current assets: | | | | | | |
| Cash and cash equivalents | | $ | 8,472,495 | | | $ | 9,180,974 | |
| Restricted cash | | | - | | | | 2,456,040 | |
| Accounts receivable, net of allowances of $257,000 and $312,000, at September 30, 2010 and December 31, 2009, respectively | | | 25,490,801 | | | | 11,858,568 | |
Notes receivable, net of allowances of $38,180 and $0, at September 30, 2010 and December 31, 2009, respectively | | | - | | | | 40,680 | |
| Inventories | | | 6,254,681 | | | | 4,567,343 | |
| VAT tax receivable | | | 26,128 | | | | 570,615 | |
| Advances to suppliers | | | 2,370,052 | | | | 488,395 | |
| Deposit for building | | | 583,030 | | | | - | |
| Deferred tax asset | | | 100,000 | | | | 100,000 | |
| Note receivable from officer | | | - | | | | 50,000 | |
| Prepaid and other current assets | | | 2,258,811 | | | | 363,309 | |
| Total current assets | | | 45,555,998 | | | | 29,675,924 | |
| | | | | | | | | |
| Property and equipment, net | | | 5,231,985 | | | | 2,968,958 | |
| Intangible assets | | | 1,101,000 | | | | 1,101,000 | |
| Goodwill | | | 285,714 | | | | 285,714 | |
| Long term receivable – related party | | | 610,530 | | | | 618,527 | |
| Total assets | | $ | 52,785,227 | | | $ | 34,650,123 | |
| LIABILITIES AND EQUITY | | | | | | | | |
| Current liabilities: | | | | | | | | |
| Accounts payable | | $ | 18,658,219 | | | $ | 13,981,881 | |
| Accrued expenses | | | 2,711,934 | | | | 1,895,127 | |
| Notes payable | | | 422,917 | | | | 2,679,167 | |
| Warrant derivative liability | | | 3,476,057 | | | | 1,626,586 | |
| Tax payable | | | 753,645 | | | | 768,289 | |
| Due to related parties | | | 1,487,523 | | | | 1,841,803 | |
| Customer deposits | | | 5,926,004 | | | | 1,254,558 | |
| Total liabilities | | | 33,436,299 | | | | 24,047,411 | |
| | | | | | | | | |
| | | | | | | | | |
| Commitments and contingencies (Note 3) | | | | | | | | |
| | | | | | | | | |
| Stockholders’ equity | | | | | | | | |
| Common stock (No Par Value; 100,000,000 shares authorized; 5,657,215 and 3,671,611 shares issued and outstanding at September 30, 2010 and December 31, 2009, respectively; including 1,620,954 shares held in escrow subject to contingent future events as of September 30, 2010) | | | 6,447,155 | | | | 2,920,372 | |
| Retained earnings | | | 10,533,569 | | | | 6,104,586 | |
| Accumulated other comprehensive income | | | 876,411 | | | | 551,943 | |
| Total equity attributable to Worldwide | | | 17,857,135 | | | | 9,576,901 | |
| Non-controlling interest | | | 1,491,793 | | | | 1,025,811 | |
| Total stockholders’ equity | | | 19,348,928 | | | | 10,602,712 | |
| Total liabilities and stockholders’ equity | | $ | 52,785,227 | | | $ | 34,650,123 | |
See accompanying notes to unaudited condensed consolidated financial statements
WORLDWIDE ENERGY AND MANUFACTURING USA, INC. AND SUBSIDIARIES
UNAUDITED CONDENSED CONSOLIDATED STATEMENTS OF INCOME
| | | For the Nine Months Ended | | | For the Three Months Ended | |
| | | September 30, | | | September 30, | |
| | | 2010 | | | 2009 | | | 2010 | | | 2009 | |
| Revenue | | | | | | | | | | | | |
| Sales | | $ | 114,731,029 | | | $ | 39,217,288 | | | $ | 44,553,126 | | | $ | 18,618,508 | |
| Cost of goods sold | | | 104,104,050 | | | | 33,196,407 | | | | 40,566,868 | | | | 15,937,769 | |
| Gross profit | | | 10,626,979 | | | | 6,020,881 | | | | 3,986,258 | | | | 2,680,739 | |
| | | | | | | | | | | | | | | | | |
| Operating Expenses | | | | | | | | | | | | | | | | |
| Selling, general and administrative expenses | | | 7,332,412 | | | | 3,141,878 | | | | 3,456,595 | | | | 1,182,661 | |
| Management and professional fees paid to stockholders | | | 270,000 | | | | 260,000 | | | | 90,000 | | | | 80,000 | |
| Depreciation | | | 266,229 | | | | 246,366 | | | | 26,552 | | | | 83,485 | |
| Loss (gain) on disposal of fixed assets | | | 137,913 | | | | - | | | | (5,564 | ) | | | - | |
| Total operating expenses | | | 8,006,554 | | | | 3,648,244 | | | | 3,567,583 | | | | 1,346,146 | |
| Net operating income | | | 2,620,435 | | | | 2,372,637 | | | | 418,675 | | | | 1,334,593 | |
| | | | | | | | | | | | | | | | | |
| Other Income (expenses) | | | | | | | | | | | | | | | | |
| Interest income | | | 18,471 | | | | 14,164 | | | | 4,586 | | | | 3,007 | |
| Interest expense | | | (51,965 | ) | | | (40,923 | ) | | | (10,648 | ) | | | (20,114 | ) |
| Other income | | | 2,805,693 | | | | 32,208 | | | | 11,769 | | | | 1,111,596 | |
| Exchange gain | | | 142,895 | | | | 103,421 | | | | 973,439 | | | | 97,996 | |
| Total other income | | | 2,915,094 | | | | 108,870 | | | | 979,146 | | | | 1,192,485 | |
| | | | | | | | | | | | | | | | | |
| Income before income taxes | | | 5,535,519 | | | | 2,481,507 | | | | 1,397,821 | | | | 2,527,078 | |
| Income taxes | | | (743,620 | ) | | | (670,121 | ) | | | (200,116 | ) | | | (427,497 | ) |
| Net income | | | 4,791,899 | | | | 1,811,386 | | | | 1,197,705 | | | | 2,099,581 | |
| Less: net income attributable to non-controlling interest | | | (362,916 | ) | | | (220,629 | ) | | | (7,775 | ) | | | (98,019 | ) |
| Net income attributable to Worldwide | | $ | 4,428,983 | | | $ | 1,590,757 | | | $ | 1,189,930 | | | $ | 2,001,562 | |
| | | | | | | | | | | | | | | | | |
| Earnings per share attributable to Worldwide stockholders: | | | | | | | | | | | | | | | | |
| Basic and diluted earnings per share | | $ | 0.81 | | | $ | 0.44 | | | $ | 0.21 | | | $ | 0.55 | |
| Basic and diluted weighted average shares outstanding | | | 5,449,380 | | | | 3,578,014 | | | | 5,653,641 | | | | 3,621,611 | |
| | | | | | | | | | | | | | | | | |
See accompanying notes to unaudited condensed consolidated financial statements
| | WORLDWIDE ENERGY AND MANUFACTURING USA, INC. AND SUBSIDIARIES |
UNAUDITED CONDENSED CONSOLIDATED STATEMENTS OF COMPREHENSIVE INCOME
| | | Worldwide Shareholders | | | Non-controlling Interest | | | Total | |
| | | Nine months ended September 30, | |
| | | 2010 | | | 2009 | | | 2010 | | | 2009 | | | 2010 | | | 2009 | |
| | | | | | | | | | | | | | | | | | | |
| Net income | | $ | 4,428,983 | | | $ | 1,590,757 | | | $ | 362,916 | | | $ | 220,629 | | | $ | 4,791,899 | | | $ | 1,811,386 | |
| | | | | | | | | | | | | | | | | | | | | | | | | |
| Foreign currency translation, net of tax | | | 324,468 | | | | 191,079 | | | | - | | | | - | | | | 324,468 | | | | 191,079 | |
| Comprehensive income attributable to non-controlling interest | | | - | | | | - | | | | 103,066 | | | | (13,047 | ) | | | 103,066 | | | | (13,047 | ) |
| Total comprehensive income | | $ | 4,753,451 | | | $ | 1,781,836 | | | $ | 465,982 | | | $ | 207,582 | | | $ | 5,219,433 | | | $ | 1,989,418 | |
| | | Worldwide Shareholders | | | Non-controlling Interest | | | Total | |
| | | Three months ended September 30, | |
| | | 2010 | | | 2009 | | | 2010 | | | 2009 | | | 2010 | | | 2009 | |
| | | | | | | | | | | | | | | | | | | |
| Net income | | $ | 1,189,930 | | | $ | 2,001,562 | | | $ | 7,775 | | | $ | 98,019 | | | $ | 1,197,705 | | | $ | 2,099,581 | |
| | | | | | | | | | | | | | | | | | | | | | | | | |
| Foreign currency translation, net of tax | | | 217,594 | | | | 83,423 | | | | - | | | | - | | | | 217,594 | | | | 83,423 | |
| Comprehensive income attributable to non-controlling interest | | | - | | | | - | | | | 98,236 | | | | 524 | | | | 98,236 | | | | 524 | |
| Total comprehensive income | | $ | 1,407,524 | | | $ | 2,084,985 | | | $ | 106,011 | | | $ | 98,543 | | | $ | 1,513,535 | | | $ | 2,183,528 | |
See accompanying notes to unaudited condensed consolidated financial statements
WORLDWIDE ENERGY AND MANUFACTURING USA, INC. AND SUBSIDIARIES
UNAUDITED CONDENSED CONSOLIDATED STATEMENTS OF CASH FLOWS
| | | For the Nine Months Ended | |
| | | September 30, | |
| | | 2010 | | | 2009 | |
| Cash flows from operating activities: | | | | | | |
| Net income | | $ | 4,791,899 | | | $ | 1,811,386 | |
| Adjustments to reconcile net income to net cash provided by (used in) operating activities: | | | | | | | | |
| Depreciation | | | 266,229 | | | | 246,564 | |
| Allowance for bad debts – accounts receivable | | | (28,838 | ) | | | 234,796 | |
| Allowance for bad debts – note receivable | | | 38,180 | | | | - | |
| Stock based compensation expense | | | 62,242 | | | | 162,020 | |
| Change in warrant derivative liability | | | (2,802,400 | ) | | | (25,809 | ) |
| Provision for losses on inventories | | | 84,993 | | | | - | |
| Provision for warranty | | | 26,211 | | | | - | |
| Loss on disposal of fixed assets | | | 137,913 | | | | - | |
| Changes in operating assets and liabilities: | | | | | | | | |
| Accounts receivable | | | (13,480,730 | ) | | | (10,250,963 | ) |
| Notes receivable | | | 2,500 | | | | (84,468 | ) |
| Inventories | | | (1,688,145 | ) | | | (1,167,944 | ) |
| VAT tax receivable | | | 544,940 | | | | (185,921 | ) |
| Advances to suppliers | | | (1,839,034 | ) | | | (438,754 | ) |
| Deposit for building | | | (572,911 | ) | | | - | |
| Loan receivable - affiliate | | | - | | | | 6,497 | |
| Prepaid and other current assets | | | (1,867,942 | ) | | | (198,622 | ) |
| Accounts payable | | | 4,577,630 | | | | 11,155,323 | |
| Accrued expense and acquisition cost payable | | | 771,537 | | | | (330,339 | ) |
| Tax payable | | | (14,187 | ) | | | 128,152 | |
| Customer deposits | | | 4,640,554 | | | | (789,339 | ) |
| Net cash provided by (used in) operating activities | | | (6,349,359 | ) | | | 272,579 | |
| | | | | | | | | |
| Cash flows from investing activities: | | | | | | | | |
| Capital expenditures | | | (2,597,363 | ) | | | (744,218 | ) |
| Proceeds from disposal of fixed assets | | | 27,998 | | | | - | |
| Restricted cash | | | 2,456,040 | | | | (1,417,356 | ) |
| Net cash used in investing activities | | | (113,325 | ) | | | (2,161,574 | ) |
| | | | | | | | | |
| Cash flows from financing activities: | | | | | | | | |
| Net proceeds from issuance of common stock and warrants | | | 8,136,583 | | | | - | |
| Repayment of loans payable to shareholders | | | - | | | | (60,024 | ) |
| Proceeds of borrowing from related parties | | | 50,000 | | | | 107,521 | |
| Repayment of loans payable to shareholders | | | (400,000 | ) | | | - | |
| Net proceeds (payments) from lines of credit | | | (2,000,000 | ) | | | 2,000,000 | |
| Repayment of bank loans | | | (256,250 | ) | | | (173,790 | ) |
| Net cash flows provided by financing activities: | | | 5,530,333 | | | | 1,873,707 | |
| | | | | | | | | |
| Effect of exchange rate changes on cash and cash equivalents | | | 223,872 | | | | (9,550 | ) |
| Net increase (decrease) in cash and cash equivalents | | | (708,479 | ) | | | (24,838 | ) |
| Cash and cash equivalents- beginning of period | | | 9,180,974 | | | | 5,092,476 | |
| Cash and cash equivalents- end of period | | $ | 8,472,495 | | | $ | 5,067,638 | |
| | | | | | | | | |
| Supplemental disclosure of non cash activities: | | | | | | | | |
| Cash paid during the period for: | | | | | | | | |
| Interest | | $ | 61,188 | | | $ | 40,923 | |
| Income tax | | $ | 660,781 | | | $ | 390,217 | |
Non-cash investing and financing activities:
During the period ended September 30, 2010, the Company accounted for $6,095,998 of warrants issued in its 2010 Financing as a warrant derivative liability.
During the period ended September 30, 2010, the Company reclassified $1,444,127 from warrant derivative liability to equity related to the warrants issued in its 2008 Financing.
See accompanying notes to unaudited condensed consolidated financial statements
WORLDWIDE ENERGY AND MANUFACTURING USA, INC. AND SUBSIDIARIES
NOTES TO THE UNAUDITED CONDENSED CONSOLIDATED FINANCIAL STATEMENTS
1. MANAGEMENT'S REPRESENTATION OF INTERIM FINANCIAL INFORMATION
The accompanying unaudited condensed consolidated financial statements have been prepared by Worldwide Energy and Manufacturing USA, Inc. and subsidiaries without audit pursuant to the rules and regulations of the Securities and Exchange Commission. Certain information and disclosures normally included in financial statements prepared in accordance with generally accepted accounting principles have been condensed or omitted as allowed by such rules and regulations, and management believes that the disclosures are adequate to make the information presented not misleading. These condensed consolidated financial statements include all of the adjustments, which in the opinion of management are necessary to a fair presentation of financial position and results of operations. All such adjustments are of a normal and re curring nature. Interim results are not necessarily indicative of results for a full year. These condensed consolidated financial statements should be read in conjunction with the audited financial statements at December 31, 2009 as filed in the Company Form 10-K filed with the Commission on April 15, 2010.
2. SIGNIFICANT ACCOUNTING POLICIES
This summary of significant accounting policies of the Company is presented to assist in understanding the Company’s financial statements. The financial statements and notes are representations of the Company’s management, which is responsible for their integrity and objectivity. These accounting policies conform to generally accepted accounting principles in the United States and have been consistently applied in the preparation of the condensed consolidated financial statements and the December 31, 2009 financials included in the 10-K filed on April 15, 2010.
In June 2009 the FASB established the Accounting Standards Codification ("Codification" or "ASC") as the source of authoritative accounting principles recognized by the FASB to be applied by nongovernmental entities in the preparation of financial statements in accordance with generally accepted accounting principles in the United States ("GAAP"). Rules and interpretive releases of the Securities and Exchange Commission ("SEC") issued under authority of federal securities laws are also sources of GAAP for SEC registrants. Existing GAAP was not intended to be changed as a result of the Codification, and accordingly the change did not impact our financial statements. The ASC does change the way the guidance is organized and presented. All accounting references have been updated and therefore, all FASB references have been repl aced with ASC references.
The Company operates in two segments in accordance with accounting guidance FASB ASC Topic 280, “Segment Reporting”. Our Chief Executive Officer has been identified as the chief operating decision maker as defined by FASB ASC Topic 280.
Description of Business
Worldwide Energy and Manufacturing USA, Inc. (“Worldwide” or “the Company”) is an international manufacturing and engineering firm, concentrating on photovoltaic (“PV”) solar modules and contract manufacturing services, using multiple factories in China. Worldwide services customers primarily in Europe and North America for our solar modules and North American and Chinese companies for their outsource of smaller scale production orders. From our inception in 1993 until 2005, we were strictly an intermediary or “middle man,” working with our customers and our subcontractors to assure that our customers received high quality components on a timely basis that fulfilled their specific needs. While we still subcontract a significant portion of our business, since 2005, we have begun the transi tion to becoming a direct contract manufacturer, operating two of our own factories to support contract manufacturing and one factory to support our solar division.
In February of 2008, Worldwide established a solar division that focuses on PV module technology under the brand name of “Amerisolar.” On February 25, 2008, the Company changed its name from Worldwide Manufacturing USA, Inc. to Worldwide Energy and Manufacturing USA, Inc. in order to reflect its expansion into the solar energy industry. The Company issued 300,000 restricted shares for the Amerisolar brand name.
WORLDWIDE ENERGY AND MANUFACTURING USA, INC. AND SUBSIDIARIES
NOTES TO THE UNAUDITED CONDENSED CONSOLIDATED FINANCIAL STATEMENTS
Worldwide leased a 129,167 square foot facility in Ningbo, China. The lease term was from July 18, 2008 to July 17, 2013. This facility housed the production operations and R&D center for the Company’s solar division. Operations at this facility began during the first quarter of 2009. In May 2010, the Company vacated this facility and moved the operations to its new Company owned Nantong facility. The Company paid two month’s rent as a penalty to be released from the lease, which was booked to Other Expense in the Condensed Consolidated Statement of Income, and wrote off $137,265 of leasehold improvements and equipment to Loss on disposal of fixed assets in the Condensed Consolidated Statement of Income. The Company did not incur any other material costs of abandonment of the Ningbo faci lity.
On October 14, 2008, Worldwide completed the acquisition of 55% of Shanghai De Hong Electric and Electronic Company Limited (the name was later changed to “Intech-tron”), through acquiring 55% of the outstanding capital stock of Intech-tron, a China LLC. Intech-tron is the holding company for the operating subsidiary Shanghai Detron Electric and Electronics Co., Ltd., LLC (“Detron”). The Company purchased Intech-tron based on the fair value of its assets at the time of purchase.
The terms of the purchase agreement stated that Worldwide would pay a cash consideration of $1,022,700 for 55% interest in Intech-tron. Shanghai Intech Electro-Mechanical Products Co., Ltd., LLC, (“Intech”) paid the first installment of $714,286 on behalf of Worldwide in September 2008. During the three months ended March 31, 2009, Worldwide paid $308,414 for the second installment and the total consideration of the purchase price of $1,022,700 was paid in full.
The Company funded the acquisition with some of the proceeds from its sale of 1,055,103 shares of its common stock, or $4,747,970, which took place in June and July 2008. Worldwide received 55% control of the operating subsidiary, Detron through its 55% ownership of Intech-tron. Detron is a power supply factory in Shanghai, China with design and R&D capabilities. This was accounted for as a purchase of Detron, where Worldwide has operating control. The Company began to consolidate Detron into the Company’s consolidated financial statements beginning on October 1, 2008.
On August 15, 2008, Worldwide formed a new Company called Worldwide Energy and Manufacturing (Ningbo) Co., Ltd (“Ningbo Solar”), which is our solar energy research, development and manufacturing subsidiary. The Company also acts as an agent to import or export the products and services overseas. Ningbo Solar began operations during the first quarter of 2009.
In May 2010, Worldwide Energy and Manufacturing (Nantong) Co., Ltd (“Nantong”) formed its wholly owned subsidiary, Worldwide Energy and Manufacturing (Shanghai) Co., Ltd, (“Shanghai Solar”) to provide design, installation, and consulting for Solar Power Systems. This subsidiary has been created to provide more value add to our customers by providing the System Integration services (the next downstream link in the Solar Value Chain) to complement our PV Solar Module offerings. This service will provide system design work by incorporating and specifying the Balance-of-System (BOS) components with our Amerisolar modules. We have started this endeavor to take advantage of the rapidly growing solar market in China. Operations at this subsidiary are not expected to be materi al in 2010.
On November 14, 2005, Worldwide established a die-casting and machining presence through leasing an existing facility from a former supplier, and initially investing $500,000 to upgrade the equipment and manufacturing buildings. In this transaction, we acquired assets, the expertise of the employees, the managers of the factories, and a portion of the existing customers of those factories. In the third quarter of 2005, we also established an electronics manufacturing factory.
As of September 30, 2010 we own and operate three factories that we now use for the manufacturing of certain product lines that we historically had to subcontract, and we are using the services of approximately 40 subcontractors to manufacture those components for which we do not have our own manufacturing capabilities.
WORLDWIDE ENERGY AND MANUFACTURING USA, INC. AND SUBSIDIARIES
NOTES TO THE UNAUDITED CONDENSED CONSOLIDATED FINANCIAL STATEMENTS
Principles of Consolidation
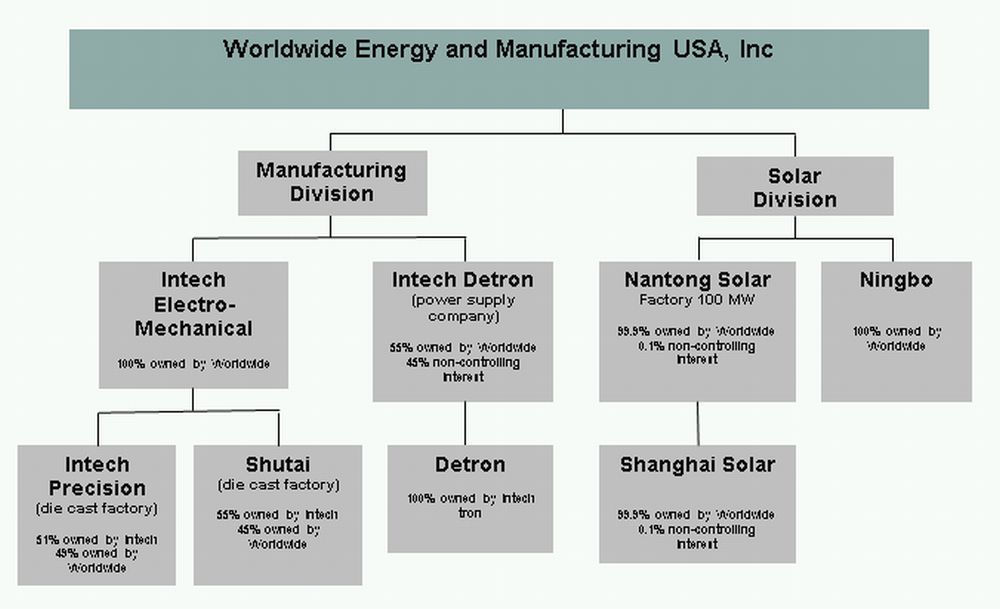
The accompanying consolidated financial statements include Worldwide Energy and Manufacturing USA, Inc., a Colorado corporation and a public company, and seven subsidiary companies, Intech, Shanghai Intech Precision Machinery Co., Ltd, LLC (“Die Cast”), Detron, Ningbo Solar, Nantong Solar Factory (“Nantong”), Shanghai Solar, and Intech-tron.
Effective January 1, 2009, the Consolidation Topic, ASC 810-10-45-16, revised the accounting treatment for non-controlling minority interests of partially-owned subsidiaries. Non-controlling minority interests represent the portion of earnings that is not within the parent Company’s control. These amounts are now required to be reported as equity instead of as a liability on the balance sheet. These amounts are $1,491,793 and $1,025,811 as of September 30, 2010 and December 31, 2009, respectively. Additionally, this statement requires net income from non-controlling minority interests to be shown separately on the consolidated statements of income. These amounts are income of $7,775 and $98,019 for the three month periods ending September 30, 2010 and 2009, respectively, and income of $ 362,916 and $220,629 for the nine months ended September 30, 2010 and 2009, respectively, and shown separately in the unaudited consolidated statement of operations. All significant intercompany balances and transactions have been eliminated in consolidation.
The Company also consolidates any variable interest entities (VIEs), of which it is the primary beneficiary, as defined. The Company does not have any VIEs that need to be consolidated at this time. When the Company does not have a controlling interest in an entity, but exerts a significant influence over the entity, the Company would apply the equity method of accounting.
Comprehensive Income
The Company reports comprehensive income in accordance with FASB ASC Topic 220 “Comprehensive Income," which established standards for reporting and displaying comprehensive income and its components in a financial statement that is displayed with the same prominence as other financial statements.
Total comprehensive income is defined as all changes in stockholders' equity during a period, other than those resulting from investments by and distributions to stockholders (i.e., issuance of equity securities and dividends). Generally, for the Company, total comprehensive income (loss) equals net income (loss) plus or minus adjustments for currency translation. Total comprehensive income (loss) represents the activity for a period net of related tax and was income of $1,513,535 and $2,183,528 for the three months ended September 30, 2010 and 2009, respectively, and was income of $5,219,433 and $1,989,418 for the nine months ended September 30, 2010 and 2009, respectively.
While total comprehensive income is the activity in a period and is largely driven by net earnings in that period, accumulated other comprehensive income or loss (“AOCI”) represents the cumulative balance of other comprehensive income as of the balance sheet date. For the Company, AOCI is primarily the cumulative balance related to the currency adjustments and increased overall equity by $876,411 and $551,943 as of September 30, 2010 and December 31, 2009, respectively.
Accounts Receivable
Trade accounts receivables are recorded at the invoiced amount and do not bear interest. Amounts collected on trade accounts receivables are included in net cash provided by operations activities in the consolidated cash flow statements. The Company maintains an allowance for doubtful accounts for estimated losses inherent in its accounts receivable portfolio. In establishing the required allowance, management considers a number of factors, including historical losses, current receivables aging reports, the counter party’s current ability to pay its obligation to the Company, and existing industry and People’s Republic of China (“PRC”) economic data. The Company reviews its allowances every month. Past due invoices over 90 days that exceed a specific amount are reviewed individually for collectability . Based on this review, the Company determines the best estimate of the amount of probable credit losses in the Company’s existing accounts receivable and adjusts the allowance. During the three and nine month periods ended September 30, 2010 and 2009, no amounts were charged off against the allowance. The Company does not have any off Balance Sheet exposure related to its customers.
WORLDWIDE ENERGY AND MANUFACTURING USA, INC. AND SUBSIDIARIES
NOTES TO THE UNAUDITED CONDENSED CONSOLIDATED FINANCIAL STATEMENTS
The Company receives letters of credit from its customers as payment for product shipped. When the product ships, the Company presents the letter of credit to the bank for payment. In addition, in some cases, upon receiving the letter of credit, the Company will then issue a letter of credit for payment to its supplier.
Property and equipment
Property, plant and equipment are stated at cost. Depreciation is computed over the estimated useful lives of the related asset type using the straight-line method for financial statement purposes. Maintenance and repairs are expensed as incurred and the costs of additions and betterments that increase the useful lives of the assets are capitalized. When property or equipment is disposed, the cost and related accumulated depreciation and amortization are removed from the accounts and any gain or loss is included as a component of operating expenses.
The estimated service lives of property and equipment are as follows:
| | | |
| Buildings and leasehold improvements | | 7 to 40 years |
| Land rights | | 44 to 50 years |
| Machinery and equipment | | 5 years |
| Transportation vehicles | | 5 years |
| Furniture and fixtures | | 7 years |
| Computers and computer software | | 3 years |
Construction in-progress
Plant and production lines currently under development at the Nantong China facility are accounted for as construction-in-progress. Construction-in-progress is recorded at acquisition cost, including development expenditures, professional fees and the interest expenses capitalized during the course of construction for the purpose of financing the project. Upon readiness for use of the project, the cost of construction-in-progress is transferred to property and equipment, at which time depreciation will commence. The Company had no capitalized interest and to date has funded this construction through operations without the use of outside debt financing. As of September 30, 2010, the Company has incurred a total of $1,850,575 of construction in progress. The Nantong facility was completed in the third quarter of 201 0 and these amounts were reclassed to buildings in July 2010. Construction in progress was funded with some of the proceeds from the Company’s equity raises in June and July 2008 and January and February 2010.
Long-Lived Assets
The Company’s long-lived assets and other assets are reviewed for impairment in accordance with the guidance of the FASB Topic ASC 360-10, “Property, Plant, and Equipment”, and FASB Topic ASC 205 “Presentation of Financial Statements”. The Company tests for impairment losses on long-lived assets used in operations whenever events or changes in circumstances indicate that the carrying amount of the asset may not be recoverable. Recoverability of an asset to be held and used is measured by a comparison of the carrying amount of an asset to the future undiscounted cash flows expected to be generated by the asset. If such asset is considered to be impaired, the impairment to be recognize d is measured by the amount by which the carrying amount of the asset exceeds its fair value. Impairment evaluations involve management’s estimates on asset useful lives and future cash flows. Actual useful lives and cash flows could be different from those estimated by management which could have a material effect on our reporting results and financial position. Fair value is determined through various valuation techniques including discounted cash flow models, quoted market values and third-party independent appraisals, as considered necessary. Through September 30, 2010, the Company had not experienced impairment losses on its long-lived assets. However, there can be no assurances that demand for the Company’s products or services will continue, which could result in an impairment of Long-Lived assets in the future.
WORLDWIDE ENERGY AND MANUFACTURING USA, INC. AND SUBSIDIARIES
NOTES TO THE UNAUDITED CONDENSED CONSOLIDATED FINANCIAL STATEMENTS
Inventories
Inventories consist of raw material, work in progress and finished goods of manufactured products.
Inventories are stated at lower of cost or market and consist of materials, labor and overhead. The Company determines the cost of inventory by the first-in, first-out method. The value of inventory is determined using the weighted average cost method and includes any related production overhead costs incurred in bringing the inventory to their present location and condition. Overhead costs included in finished goods include, direct labor cost and other costs directly applicable to the manufacturing process. The Company evaluates inventories for excess, slow moving, and obsolete inventories as well as inventory whose volume is in excess of its net realizable value. This evaluation includes analyses of sales levels by product and projections of future demand. In order to state the inventory at lower of cost or market, the Company maintains reserves against its inventory. If future demand or market conditions are less favorable than the Company’s projections, a write-down of inventory may be required, and would be reflected in cost of goods sold in the period the revision is made. Inventory amounts are reported net of such allowances. Management has recorded a $92,000 inventory allowance as of September 30, 2010.
Revenue Recognition
The Company recognizes revenues in accordance with the guidelines of the Securities and Exchange Commission (“SEC”) Staff Accounting Bulletin (“SAB”) No. 104 “Revenue Recognition”. The Company recognizes revenue from product sales when the orders are completed and shipped, provided that collection of the resulting receivable is reasonably assured, risk of loss is transferred, and price is fixed and determinable. Amounts billed to customers are recorded as sales while the shipping costs are included in cost of sales. Returns of defective custom parts may only be exchanged for replacement parts within 30 days of the invoice date. Returns of defective parts may be exchanged for replacement parts or for a refund. Revenue from non-refundable customer tooling deposits is recognized when the materials are shipped or when the deposit is forfeited, whichever is earlier. Recently, industry conditions and market forces have necessitated the Company to extend their payment terms in the marketplace; however, this change in terms does not prohibit the Company from recognizing revenue in accordance with SAB No. 104.
Cash and Cash Equivalents
For purposes of the statements of cash flows, the Company considers all highly liquid debt instruments purchased with a maturity of three months or less to be cash equivalents. Cash equivalents with a maturity of three months or less was $746,480 as of September 30, 2010 and are included in Cash and cash equivalents. A substantial amount of the Company’s cash is held in bank accounts in the People’s Republic of China (“PRC”) and is not protected by the Federal Deposit Insurance Corporation (FDIC) insurance or any other similar insurance. Cash held in China amounted to $6,873,816 at September 30, 2010. Accounts held at U.S. financial institutions are insured by the FDIC up to $250,000. As of September 30, 2010, the Company’s cash balance held at U.S banks was $1,598,679 whic h was $1,348,679 in excess of the insured amounts. Given the current economic environment and the financial conditions of the banking industry there is a risk that deposits may not be readily available or covered by such insurance. The Company has had no loss on excess cash in domestic or foreign banks in past years.
Accounting for Derivatives
The Company evaluates stock options, stock warrants or other contracts to determine if those contracts or embedded components of those contracts qualify as derivatives to be separately accounted for under the relevant sections of Accounting Standards Codification (“ASC”), Topic 815-40, “Derivative Instruments and Hedging: Contracts in Entity’s Own Equity” (“ASC Topic 815-40”). The result of this accounting treatment could be that the fair value of a financial instrument is classified as a derivative instrument and is marked-to-market at each balance sheet date and recorded as a liability. In the event that the fair value is recorded as a liability, the change in fair value is recorded in the statement of operations a s other income or other expense. Upon conversion or exercise of a derivative instrument, the instrument is marked to fair value at the conversion date and then that fair value is reclassified to equity. Financial instruments that are initially classified as equity that become subject to reclassification under ASC Topic 815-40 are reclassified to a liability account at the fair value of the instrument on the reclassification date.
WORLDWIDE ENERGY AND MANUFACTURING USA, INC. AND SUBSIDIARIES
NOTES TO THE UNAUDITED CONDENSED CONSOLIDATED FINANCIAL STATEMENTS
Estimates
The preparation of these condensed consolidated financial statements in accordance with accounting principles generally accepted in the United States of America requires management to make estimates and assumptions that affect the reported amounts of assets and liabilities and disclosures of contingent assets and liabilities at the dates of the condensed consolidated financial statements and the reported amounts of net sales and expenses during the reported periods. Actual results may differ from those estimates and such differences may be material to the financial statements. The more significant estimates and assumptions by management include among others: useful lives and residual values of fixed assets, valuation of inventories, accounts receivable and notes receivable, stock based compensation, valuatio ns of warrant derivative liability, and goodwill and intangible assets impairment tests, warranties, and deferred taxes. The current economic environment has increased the degree of uncertainty inherent in these estimates and assumptions.
Product Warranties
We provide a limited warranty to the original purchasers of our PV solar modules not sourced from subcontractors for five years against defects in materials and workmanship under normal use and service conditions following the date of sale, and we provide a warranty that the modules will produce at least 90% of their power output rating during the first 10 years following the date of sale and at least 80% of their power output rating during the following 15 years. In resolving claims under both the defects and power output warranties, we have the option of either repairing or replacing the covered module or, under the power output warranty, providing additional modules to remedy the power shortfall. Our warranties are transferable when product remains installed in the original location. When we recogniz e revenue for module sales, we accrue a liability for the estimated future costs of meeting our warranty obligations for those modules. We make and revise this estimate based on the number of solar modules under warranty at customer locations, our historical experience with warranty claims, our in-house testing of our solar modules and our estimated per-module replacement cost. As of September 30, 2010, our accrued warranty liability was approximately $61,000. We have incurred and recorded approximately $26,000 of warranty expense in Selling, general and administrative expenses during the nine months ended September 30, 2010 based on approximately $3,740,000 of revenues during the nine months ended September 30, 2010 of our PV solar modules not sourced from subcontractors. For PV solar modules sourced from subcontractors, the subcontractor provides for the product warranty.
Foreign Currency Transactions and Translation
The Company’s primary country of operations is The People’s Republic of China (“PRC”). The financial position and results of operations of the Company’s China operations are determined using the local currency Renminbi (“RMB”) as the functional currency. However, the China operation’s sell solar products in Euros. The results of transactions in foreign currency are remeasured into the functional currency at the average rate of exchange during the reporting period. Aggregate net foreign currency remeasurements included in the Condensed Consolidated Statement of Income were gains of $973,439 and $97,996, for the three months ended September 30, 2010 and 2009, respectively, and gains of $142,895 and $103,421 for the nine months ended September 30, 2010 and 20 09, respectively primarily due to the decline of the value of the Euro to the RMB.
Assets and liabilities denominated in foreign currencies as the functional currency at the balance sheet date are translated into the Company’s reporting currency of United States dollars (“USD”) at the exchange rates prevailing at the balance sheet date. The registered equity capital denominated in the functional currency is translated into the reporting currency of USD at the historical rate of exchange at the time of capital contribution. All translation adjustments resulting from the translation of the financial statements into the reporting currency at USD are dealt with as a separate component within stockholders’ equity. Translation adjustments net of tax totaled $217,594 and $83,423, for the three months ended September 30, 2010 and 2009, respectively, and $324,468 and $191,079 for the nine mo nths ended September 30, 2010 and 2009, respectively.
WORLDWIDE ENERGY AND MANUFACTURING USA, INC. AND SUBSIDIARIES
NOTES TO THE UNAUDITED CONDENSED CONSOLIDATED FINANCIAL STATEMENTS
Fair Value of Financial Instruments
The Company applies the provisions of accounting guidance, FASB Topic ASC 820 that requires all entities to disclose the fair value of financial instruments, both assets and liabilities recognized and not recognized on the balance sheet, for which it is practicable to estimate fair value, and defines fair value of a financial instrument as the amount at which the instrument could be exchanged in a current transaction between willing parties. As of September 30, 2010, the fair value of cash and cash equivalents, restricted cash, accounts receivable, notes receivables, accounts payable, line of credit and other payables approximated carrying value due to the short maturity of the instruments, quoted market prices or interest rates which fluctuate with market rates except for related party debt or receivables for which it is no t practicable to estimate fair value.
Fair Value Measurements
Effective January 1, 2009, the FASB ASC Topic 825, Financial Instruments, requires disclosures about fair value of financial instruments.
The FASB ASC Topic 820, Fair Value Measurements and Disclosures, clarifies the definition of fair value for financial reporting, establishes a framework for measuring fair value and requires additional disclosures about the use of fair value measurements.
Various inputs are considered when determining the fair value of the Company’s investments, warrant derivative liability, and long-term debt. The inputs or methodologies used for valuing securities are not necessarily an indication of the risk associated with investing in these securities. These inputs are summarized in the three broad levels listed below.
| · | Level 1 – observable market inputs that are unadjusted quoted prices for identical assets or liabilities in active markets. |
| · | Level 2 – other significant observable inputs (including quoted prices for similar securities, interest rates, credit risk, etc.). |
| · | Level 3 – significant unobservable inputs (including the Company’s own assumptions in determining the fair value of investments). |
The Company’s adoption of FASB ASC Topic 825 did not have a material impact on the Company’s condensed consolidated financial statements.
The carrying value of financial assets and liabilities recorded at fair value is measured on a recurring or nonrecurring basis. Financial assets and liabilities measured on a non-recurring basis are those that are adjusted to fair value when a significant event occurs. The Company had no financial assets or liabilities carried and measured on a nonrecurring basis during the reporting periods. Financial assets and liabilities measured on a recurring basis are those that are adjusted to fair value each time a financial statement is prepared. The Company had a warrant derivative liability carried at fair value on a recurring basis at September 30, 2010 related to the warrants issued in its 2010 Financing. In addition, the Company had a warrant derivative liability carried at fair value on a recurring basis at Decembe r 31, 2009 related to the warrants issued in its 2008 Financing. Effective April 15, 2010 with the filing of the Company’s Annual Report on Form 10-K, the Company has met all contingencies and related 2008 milestone requirements, as defined, and as a result, the Company reclassified the warrants associated with the 2008 Financing to equity on April 16, 2010.
WORLDWIDE ENERGY AND MANUFACTURING USA, INC. AND SUBSIDIARIES
NOTES TO THE UNAUDITED CONDENSED CONSOLIDATED FINANCIAL STATEMENTS
The following are the major categories of assets and liabilities measured at fair value on a recurring basis as of the period ended September 30, 2010, using quoted prices in active markets for identical assets (Level 1); significant other observable inputs (Level 2); and significant unobservable inputs (Level 3).
Description | | Level 1: Quoted Prices in Active Markets for Identical Assets | | | Level 2: Significant Other Observable Inputs | | | Level 3: Significant Unobservable Inputs | | | Total at September 30, 2010 | |
| | | | | | | | | | | | | |
| Warrant Derivative Liability - 2010 | | $ | - | | | $ | 3,476,057 | | | $ | - | | | $ | 3,476,057 | |
| Total | | $ | - | | | $ | 3,476,057 | | | $ | - | | | $ | 3,476,057 | |
| | | | | | | | | | | | | | | | | |
The availability of inputs observable in the market varies from instrument to instrument and depends on a variety of factors including the type of instrument, whether the instrument is actively traded, and other characteristics particular to the transaction. For many financial instruments, pricing inputs are readily observable in the market, the valuation methodology used is widely accepted by market participants, and the valuation does not require significant management discretion. For other financial instruments, pricing inputs are less observable in the market and may require management judgment.
Concentrations, Risks, and Uncertainties
All of the Company’s manufacturing is located in the PRC. There can be no assurance that the Company will be able to successfully continue to manufacture its products and failure to do so would have a material adverse effect on the Company’s financial position, results of operations and cash flows. Also, the success of the Company’s operations is subject to numerous contingencies, some of which are beyond management’s control. These contingencies include general economic conditions, price of raw material, competition, governmental and political conditions, and changes in regulations. Because the Company is dependent on foreign trade in the PRC, the Company is subject to various additional political, economic and other uncertainties. Among other risks, the Company’s operations will be subject to risk of restrictions on transfer of funds, domestic and international customs, changing taxation policies, foreign exchange restrictions, and political and governmental regulations.
The Company operates in China, which may give rise to significant foreign currency risks from fluctuations and the degree of volatility of foreign exchange rates between U.S. dollars and the Chinese currency RMB. In addition, the China operation’s sell solar products in Euros. The results of operations denominated in foreign currency are translated at the average rate of exchange during the reporting period.
At September 30, 2010, three customers individually accounted for more than 10% of the Company’s accounts receivable with a total amount of $15,437,167, representing 60.0% of total accounts receivable in aggregate. Due to market conditions and competitive pressures, a significant amount of our accounts receivable includes sales with extended payment terms.
For the nine months ended September 30, 2010, two customers individually accounted for more than 10% of our nine months sales with a total amount of $69,585,797 or 60.7% of sales. For the nine months ended September 30, 2009, two customers individually accounted for greater than 10% of our nine months sales with a total sales value of $22,808,569, or 58.2%.
For the three months ended September 30, 2010, three customers individually accounted for more than 10% of our quarterly sales with a sales amount of $27,740,280 or 62.3% of sales. For the three months ended September 30, 2009, one customer accounted for greater than 10% of quarterly sales with a total sales value in the quarter of $10,859,160, or 58.3%.
WORLDWIDE ENERGY AND MANUFACTURING USA, INC. AND SUBSIDIARIES
NOTES TO THE UNAUDITED CONDENSED CONSOLIDATED FINANCIAL STATEMENTS
For the nine months ended September 30, 2010, one supplier accounted for more than 10% of our Cost of Goods Sold. Purchases from these suppliers totaled $34,841,627 or 33.4% of the Cost of Goods Sold. For the nine months ended September 30, 2009, one supplier accounted for greater than 10% of our Cost of Goods Sold in the period at $19,561,203 or 58.9% of the Cost of Goods sold.
For the three months ended September 30, 2010, four suppliers individually accounted for more than 10% of our Cost of Goods Sold. Purchases from these suppliers totaled $19,701,523 or 48.2% of the Cost of Goods Sold. For the three months ended September 30, 2009, one supplier accounted for greater than 10% of our Cost of Goods Sold in the period at $10,958,136 or 68.7% of the Cost of Goods sold.
Payments of dividends may be subject to some restrictions due to the fact that the operating activities are conducted in subsidiaries residing in the Peoples Republic of China.
As part of the production process in the contract manufacturing operations, the Company may be required by its suppliers to advance funds under short-term agreements for tooling and other pre-production costs. The advances are generally unsecured and may carry interest at the prevailing market rate for short-term instruments. Such tooling is in most cases, either owned by the supplier or our customers and is generally of value primarily for the specific needs of the Company’s customers. At September 30, 2010, the Company has made advances to its suppliers of $2,370,052 for materials and inventory. These advances will be recognized in operations as the Company receives the material and inventory from the supplier. The Company in turn requires its customers to provide a non-refundab le down payment to offset such startup costs. These deposits will be recognized in operations as the Company delivers goods to its customers. As of September 30, 2010, the Company has customer deposits of $5,926,004. In the event that a supplier is unable to fulfill its production agreements with the Company, management believes that other suppliers can be found for the Company’s products. However, a change in suppliers would cause a delay in the production process, and could result in loss of tooling deposits and other supplier advances, which could negatively affect the Company’s operating results.
The Company sells its goods and services internationally, with the majority of its revenue currently being derived from customers in the North America, China, and Europe. As such, the Company is susceptible to credit risk on accounts and notes receivable from customers. Generally, the Company does not obtain security from its customers in support of accounts receivable.
Stock Based Compensation
For purposes of determining the variables used in the calculation of stock compensation expense under the provisions of FASB ASC Topic 505, “Equity” and FASB ASC Topic 718, “Compensation — Stock Compensation,” we perform an analysis of current market data and historical Company data to calculate an estimate of implied volatility, the expected term of the option and the expected forfeiture rate. With the exception of the expected forfeiture rate, which is not an input, we use these estimates as variables in th e Black-Scholes option pricing model. Depending upon the number of stock options granted, any fluctuations in these calculations could have a material effect on the results presented in our condensed consolidated statement of operations. In addition, any differences between estimated forfeitures and actual forfeitures could also have a material impact on our financial statements.
Stock-based compensation costs that have been included in operating expenses amounted to $16,250 and $46,800 for the three months ended September 30, 2010 and 2009, respectively, and $62,242 and $162,020 for the nine months ended September 30, 2010 and 2009, respectively. The remaining stock-based compensation to be amortized to compensation expense in 2010 is approximately $38,750.
WORLDWIDE ENERGY AND MANUFACTURING USA, INC. AND SUBSIDIARIES
NOTES TO THE UNAUDITED CONDENSED CONSOLIDATED FINANCIAL STATEMENTS
Recently Enacted Accounting Standards
The FASB issued Accounting Standards Update (ASU) No. 2010-11, Derivatives and Hedging (Topic 815): Scope Exception Related to Embedded Credit Derivatives. The FASB believes this ASU clarifies the type of embedded credit derivative that is exempt from embedded derivative bifurcation requirements. Specifically, only one form of embedded credit derivative qualifies for the exemption - one that is related only to the subordination of one financial instrument to another. As a result, entities that have contracts containing an embedded credit derivative feature in a form other than such subordination may need to separately account for the embedded credit derivative feature. The amendments in the ASU are effective for each reporting entity at the beginning of its first fisca l quarter beginning after June 15, 2010. Early adoption is permitted at the beginning of each entity’s first fiscal quarter beginning after March 5, 2010. The Company has determined the impact of this guidance is not material to its financial statements.
3. COMMITMENTS AND CONTINGENCIES
The Company has various purchase commitments for materials, supplies and services incident to the ordinary conduct of business, generally for quantities required for the Company’s business and at prevailing market prices. No material annual loss is expected from these commitments.
The Company has a contingency associated with its capital raises in 2010 which requires certain milestones to be met. The contingency states: Additionally, as further consideration for the transaction, we, along with the investors, entered into a make good escrow agreement with certain insiders (“CI”) who along with the Company placed an aggregate of 1,970,956 shares of the Company’s common stock into escrow, to be distributed if certain financial milestones of the Company are not met. Pursuant to the terms of the make good escrow agreement, if the Adjusted EBIDTA reported in the Company’s 2010 Annual Report is less than $4,000,000, then the investors shall be entitled to receive on a “pro rata” basis, determined by dividing each investor’s investment amount by the aggrega te of all investment amounts delivered to us by the investors, for no consideration other than their part of their respective investment amount at closing, some or all of the escrow shares determined according to the following formula:
For the purposes of the foregoing formula:
A = 2010 Adjusted EBITDA
B = 2010 EBITDA Milestone
C = Total number of shares issued to the selling stockholders
D = 4.50
E = Total Investment Amount
In addition, the agreement states: Notwithstanding the foregoing, in the event that the Company reports an Adjusted EBITDA of $2,000,000 or less for the year ended December 31, 2010 or the Company fails to file its 2010 Form 10-K with the Commission on or before the last date that such form is required to be filed (after any permitted extensions under the Exchange Act), the “2010 EBITDA Milestone Price” shall equal $2.25 resulting in a potential maximum number of additional shares issued to the investors of 1,970,956.
WORLDWIDE ENERGY AND MANUFACTURING USA, INC. AND SUBSIDIARIES
NOTES TO THE UNAUDITED CONDENSED CONSOLIDATED FINANCIAL STATEMENTS
Should a contingency arise, the contingency would be first satisfied by the CI shares and should the CI shares not be sufficient, then shares would be issued from the Company’s treasury. The CI shares are considered to be primary consideration in satisfying any potential contingency and are included in outstanding shares and the calculation of earnings per share.
As of September 30, 2010, although the annualized Adjusted EBITDA milestone calculation indicates that the Company may potentially not meet the milestone, the Company believes that it will still meet the milestone requirements.
Certain conditions may exist as of the date the financial statements are issued. These conditions may result in a future loss to the Company but which will only be resolved when one or more future events occur or fail to occur. The Company’s management and legal counsel assess such contingent liabilities, and such assessment inherently involves an exercise of judgment. In assessing loss contingencies related to legal proceedings that are pending against the Company or unasserted claims that may result in such proceedings, the Company’s legal counsel evaluates the perceived merits of any legal proceedings or unasserted claims as well as the perceived merits of the amount of relief sought or expected to be sought.
If the assessment of a contingency indicates that it is probable that a material loss has been incurred and the amount of the liability can be estimated, then the estimated liability would be accrued in the Company’s financial statements. If the assessment indicates that a potential material loss contingency is not probable but is reasonably possible, or is probable but cannot be estimated, then the nature of the contingent liability, together with an estimate of the range of possible loss if determinable and material would be disclosed. Loss contingencies considered to be remote by management are generally not disclosed unless they involve guarantees, in which case the guarantee would be disclosed.
On May 5, 2010, a former employee filed a complaint with the United States Department of Labor, Occupational Safety & Health Administration (“OSHA”) alleging unlawful whistleblower retaliation in violation of the Sarbanes-Oxley Act. This complaint is completely without merit – the Company denies all allegations made in the Complaint. The Company filed a response with OSHA on October 15, 2010 wherein it requested immediate dismissal of the complaint. The Company has yet to receive a response from OSHA.
This same employee also filed a claim for unemployment insurance benefits with the California Employment Development Department (“EDD”). On August 11, 2010, an Administrative Law Judge found that the former employee was eligible for unemployment benefits. The California Unemployment Insurance Appeals Board recently affirmed this decision.
The Company entered into an agreement on February 3, 2008 with the minority shareholder of Intech-tron whereby if the Compnay was to invest an additional amount of approximately $820,000 into Intech-tron, the minority shareholder will automatically convert to equity approximately $670,000 of a payable owed to him in order to maintain the current ownership structure of 55% owned by the Company and 45% minority owned. In addition, the minority shareholder would forgive approximately $300,000 of the related payable owed to him with approximately $302,000 remaining as a related party payable. As of September 30, 2010, the total amount due to the minority owner was $1,271,993 which is recorded in Due to related parties on the Condensed Consolidated Balance Sheet (see Note 13).
The Company has entered into a commitment agreement with a supplier on August 24, 2010 to purchase approximately $18,000,000 of its solar modules for the four month period September 2010 through December 2010. As of the date of this report, we have purchased approximately $12,600,000. Should the Company not meet this commitment, we believe that the supplier will allow any shortfall to carryover into January 2011 with no penalty to the Company.
4. ACCOUNTS RECEIVABLE
Accounts receivable by major categories are summarized as follows:
| | | September 30, 2010 | | | | December 31, 2009 | |
| | | | | | | | |
| Accounts Receivable | | $ | 25,559,545 | | | | $ | 11,749,935 | |
| Accounts Receivable – other | | | 188,113 | | (1) | | | 421,002 | |
| | | | 25,747,658 | | | | | 12,170,937 | |
| Less: allowances for doubtful accounts | | | (256,857 | ) | | | | (312,369 | ) |
| Total | | $ | 25,490,801 | | | | $ | 11,858,568 | |
WORLDWIDE ENERGY AND MANUFACTURING USA, INC. AND SUBSIDIARIES
NOTES TO THE UNAUDITED CONDENSED CONSOLIDATED FINANCIAL STATEMENTS
Under the terms of a revolving line of credit agreement with Bank of the West indicated in Note 10, the revolving line of credit is secured by all business assets of the Company and guaranteed by certain of its officers.
(1) The Company receives letters of credit from its customers as payment for product shipped. When the product ships, the Company presents the letter of credit to the bank for payment.
Inventories by major categories are summarized as follows:
| | | September 30, 2010 | | | December 31, 2009 | |
| | | | | | | |
| Raw materials | | $ | 2,118,791 | | | $ | 1,466,835 | |
| Work in progress | | | 470,677 | | | | 285,449 | |
| Finished goods | | | 3,757,098 | | | | 2,885,059 | |
| | | | 6,346,566 | | | | 4,637,343 | |
| Less: allowances for slowing moving items | | | (91,885 | ) | | | (70,000 | ) |
| Total | | $ | 6,254,681 | | | $ | 4,567,343 | |
6. INCOME TAX
Our statutory United States federal income tax is 34% and our California state income tax rate is 9.3%. Our statutory tax rate in China is 25%. The provision for income taxes consists of the following:
| | | For The Nine Months Ended | | | For The Three Months Ended | |
| | | September 30, | | | September 30, | |
| | | 2010 | | | 2009 | | | 2010 | | | 2009 | |
| Current income tax expense (benefit) in China | | $ | 268,377 | | | $ | 134,835 | | | $ | (18,884 | ) | | $ | 65,380 | |
| U.S Federal Tax | | | 431,243 | | | | 463,023 | | | | 175,000 | | | | 304,633 | |
| State and local income taxes currently paid or payable U.S | | | 44,000 | | | | 72,263 | | | | 44,000 | | | | 57,484 | |
| | | | | | | | | | | | | | | | | |
| Income tax expense | | $ | 743,620 | | | $ | 670,121 | | | $ | 200,116 | | | $ | 427,497 | |
The Company has $48,673 of property and equipment located in the United States at September 30, 2010. At December 31, 2009, $14,993 of property plant and equipment was located in the United States. Property and equipment for September 30, 2010 was $5,183,312 in the PRC. At December 31, 2009, $2,953,965 of the Company’s property and equipment was located in the PRC. The Company’s property and equipment consisted of the following at September 30, 2010 and December 31, 2009:
| | | September 30, 2010 | | | December 31, 2009 | |
| | | | | | | |
| Vehicles | | $ | 547,468 | | | $ | 534,594 | |
| Furniture and fixtures | | | 263,111 | | | | 254,961 | |
| Equipment | | | 2,590,208 | | | | 535,784 | |
| Software | | | 105,255 | | | | 24,923 | |
| Land rights | | | 987,935 | | | | 249,919 | |
| Buildings | | | 1,903,220 | | | | - | |
| Leasehold improvements | | | 64,264 | | | | 466,561 | |
| | | | 6,461,821 | | | | 2,066,742 | |
| Less: accumulated depreciation | | | (1,232,822 | ) | | | (1,120,544 | ) |
| | | | 5,228,999 | | | | 946,198 | |
| Construction in progress | | | 2,986 | | | | 2,022,760 | |
| | | | | | | | | |
| Total | | $ | 5,231,985 | | | $ | 2,968,958 | |
WORLDWIDE ENERGY AND MANUFACTURING USA, INC. AND SUBSIDIARIES
NOTES TO THE UNAUDITED CONDENSED CONSOLIDATED FINANCIAL STATEMENTS
8. NOTES RECEIVABLE
On June 24, 2008, the Company paid $40,680 for an investment in Tomii International (“Tomii”) representing approximately 21.5% equity interest in Tomii. Tomii is a privately held company that is a development stage entity with no significant operations. Subsequent to December 31, 2009, Tomii has changed its business model to focus on products that are not compatible with the Company’s business model. As such, Tomii has agreed to repay the Company’s investment over a two year period at $500 per month for 12 months from April 2010 through March 2011 and $2,890 per month for the remaining 12 months from April 2011 to March 2012. As of the date of this filing, Tomii has made five payments totaling $2,500 under this note receivable.
As a result of Tomii’s noncompliance with the terms of the note, as of June 30, 2010, the Company has recorded an allowance for the remaining balance of $38,180.
9. RESTRICTED CASH
As of March 31, 2010, the Company has deposited approximately $10 million (approximately $4.5 million in fiscal year 2009 and $5.5 million in the three months ended March 31, 2010) into an escrow account in the Bank of China for the purpose of registered capital and working capital. The Company created the restricted cash account to ensure that, at a minimum, it had the funds to purchase the land rights, complete its Nantong facility, and purchase the plant and equipment necessary to operate the Nantong facility. Any remaining funds were to be used for working capital. The $10 million was funded with some of the proceeds from the Company’s equity raises in June and July 2008 and January and February 2010 as the use of proceeds in these equity raises allowed for working capital to fund the sales growth of the Company’s Solar division, capital expenditures to support sales growth, and capital to be used for possible acquisitions. The Company had no restrictions from the Chinese government on the uses of the restricted cash. With the deposit of these funds, the Company has fulfilled the requirement of the Chinese government that we have sufficient registered capital to complete the project. The funds have been transferred to a cash account accessible by the division specifically for facility start-up project costs and working capital. Total expenditures related to the project as of September 30, 2010 was $2,838,510 and has been used for $987,935 of land rights and $1,850,575 of construction expenses. As of September 30, 2010, $7,159,020 has been used for working capital purposes. The Nantong facility was completed in the third quarter of 2010 and therefore, the Company no longer has a requirement for restricted cash.
10. NOTES PAYABLE
As of September 30, 2010, the Company has the following notes payable:
| Banker | | Amount of available credit | | Loan period | | Interest rate | | Secured by | | September 30, 2010 | | | |
| | | | | | | | | | | | | | |
Bank of the West (line of credit) | | $ | 2,000,000 | | 11/30/2010 maturity | | | 4.5 | % | All Corporate assets | | $ | - | | (1) | |
| | | | | | | | | | | | | | | | | |
Bank of the West (term loans) | | $ | 1,025,000 | | 5/20/2008 - 5/20/2011 | | | 4.0 | % | All Corporate assets | | $ | 131,250 | | | |
| | | | | | 5/20/2008 - 6/01/2012 | | | 4.0 | % | All Corporate assets | | $ | 291,667 | | | |
| Total loans | | | | | | | | | | | | $ | 422,917 | | | |
| (1) | The Company repaid this loan on August 27, 2010 in the amount of $1,250,000. |
WORLDWIDE ENERGY AND MANUFACTURING USA, INC. AND SUBSIDIARIES
NOTES TO THE UNAUDITED CONDENSED CONSOLIDATED FINANCIAL STATEMENTS
Under the terms of the revolving line of credit agreement with Bank of the West, dated May 20, 2008, the Company could borrow up to $2,000,000 at a rate of prime plus 0.50%, with a minimum interest rate of 4.5%. This rate is subject to change based on the prime rate which was 3.25% as of September 30, 2010. The revolving line of credit is secured by the assets of the Company. Interest only payments on any outstanding balance is paid monthly. Any outstanding balance is due on maturity at November 30, 2010.
The Company can also borrow up $1,025,000 within two term loans. The maturity date of these two loans is May 20, 2011 and June 1, 2012, respectively. The balance outstanding under both loans as of September 30, 2010 is $131,250 and $291,667, respectively. The Company has classified the loans as a current liability due to its past history of non-compliance with its covenants and we are renegotiating the terms of the loans. There is no assurance that the bank will extend the loans and could call the terms loans as a result of any non-compliance with the loan covenants.
11. STOCK TRANSACTIONS
On August 18, 2010, the Company issued 6,692 restricted shares of its common stock valued at $17,500 (based on a discounted fair market value on the date of grant) to a consultant for consulting services. The issuance was an isolated transaction not involving a public offering pursuant to Section 4(2) of the Securities Act of 1933.
On July 8, 2010, the Company issued 900 restricted shares of its common stock valued at $2,457 (based on a discounted fair market value on the date of grant) to a consultant for consulting services. The issuance was an isolated transaction not involving a public offering pursuant to Section 4(2) of the Securities Act of 1933.
On June 3, 2010, the Company issued a total of 7,056 restricted shares of its common stock valued at $20,992 (based on a discounted fair market value on the date of grant) to its independent Board of Directors. The issuance was an isolated transaction not involving a public offering pursuant to Section 4(2) of the Securities Act of 1933.
On January 26, 2010, we entered in a securities purchase agreement with certain accredited investors pursuant to which we issued and sold 1,777,777 of our common stock and warrants to purchase an aggregate of 1,777,777 shares of our common stock for $7,292,790, net of offering costs of $707,210.
On February 9, 2010, we entered into an amendment agreement with approximately 74% of such accredited investors to amend the transaction documents to increase the maximum amount of securities sold to $9,000,000. On February 9, 2010, we entered into a second securities purchase agreement with certain accredited investors pursuant to which we issued and sold 193,179 shares of our common stock and warrants for $843,793, net of offering costs of $25,514.
The warrants are exercisable for a term of five years at an exercise price of $5.65 per share. The warrants also contain anti-dilution provisions, including but not limited to, if the Company issues shares of its common stock at less than the then existing conversion price, the conversion price of the warrants will automatically be reduced to such lower price and the number of shares to be issued upon exercise will be proportionately increased. The warrants contain limitations on exercise, including the limitation that the holders may not convert their Series A Warrants to the extent that upon exercise the holder, together with its affiliates, would own in excess of 4.9% of the Company’s outstanding shares of common stock.
In addition, Ladenburg Thalmann & Co., LLC acted as the lead placement agent on the private placement and received warrants to purchase 102,324 shares of the Company’s common stock (warrants to purchase 6,333 shares of common stock were issued to other placement agents at an exercise price of $6.75) (based on 150% of the per share equivalent of $4.50 in the transaction). The warrants vest immediately and have a five year term.
WORLDWIDE ENERGY AND MANUFACTURING USA, INC. AND SUBSIDIARIES
NOTES TO THE UNAUDITED CONDENSED CONSOLIDATED FINANCIAL STATEMENTS
12. WARRANTS
Accounting for the Warrants
In connection with the Company’s 2008 equity financing completed on June 23, 2008 and July 24, 2008 (“2008 Financing”), the Company issued 1,111,109 restricted common shares along with warrants to purchase an additional 1,111,109 shares with 722,221 warrants having an exercise price of $7.00 and 388,888 of those warrants having an excise price of $9.00. In addition, in connection with the Company’s 2010 equity financing (completed on January 26, 2010 and February 9, 2010 (“2010 Financing”), the Company issued 1,970,956 restricted common shares along with warrants to purchase an additional 2,079,613 shares with 1,970,956 warrants having an exercise price of $5.65 and 108,657 of those warrants having an excise price of $6.75. The Company analyzed the warrants issued in these two t ransactions (“Warrants”) in accordance with ASC Topic 815 (a codification of EITF 00-19, “Accounting for Derivative Financial Instruments Indexed to, and Potentially Settled in, a Company’s Own Stock”) to determine whether the Warrants meet the definition of a derivative under ASC Topic 815 and, if so, whether the Warrants meet the scope exception of ASC Topic 815, which is that contracts issued or held by the reporting entity that are both (1) indexed to its own stock and (2) classified in stockholders’ equity shall not be considered to be derivative instruments for purposes of ASC Topic 815. The provisions of ASC Topic 815 subtopic 40 “Determining Whether an Instrument (or Embedded Feature) Is Indexed to an Entity’s Own Stock” (“ASC Topic 815 subtopic 40”) apply to any freestanding financial instruments or embedded features that have the characteristics of a derivative, as defined by ASC Topic 815 and to any freestanding financial instruments that are potentially settled in an entity’s own common stock. The Company concluded that the warrants issued in the 2008 Financing should be treated as a derivative liability as the 2008 Financing includes certain milestone provisions which the Company must be in compliance with for each of the years ended December 31, 2009 and 2008. Effective April 15, 2010 with the filing of the Company’s Annual Report on Form 10-K, the Company has met all contingencies and related 2008 milestone requirements, as defined, and as a result, the Company reclassified $1,444,127 of warrants associated with the 2008 Financing from liabilities to equity and a gain of $182,459 on April 16, 2010. With respect to the 2010 Financing, the Company concluded that the warrants issued should be treated as a derivative liability as a result of the 2008 Financing which includes provisions that could provide for the possible issuance of additional shares which are indeterminate. Additionally, the 2010 Financing contains a Registration Payment Arrangement which requires the Company to timely file its required public filings for 12 months in accordance with SEC Rule 144. As a result, the warrant derivatives should be measured at fair value and re-measured at fair value at each reporting date with changes in fair value recorded in earnings under other income/expense in the Condensed Consolidated Statement of Operations. The warrants associated with the 2010 Financing will continue to be accounted as a derivative liability. Should the Company timely file its required public filings for 12 months, then the Company expects to reclassify the warrant derivatives associated with the 2010 Financing to equity in 2011.
During the three month periods ending September 30, 2010 and 2009, the Company recorded a gain on warrant re-valuation of $103,491 and $1,098,205, respectively, and a gain of $2,802,400 and $25,809, for the nine months ended September 30, 2010 and 2009, respectively.
Fair Value of the Warrants
Fair value is generally based on independent sources such as quoted market prices or dealer price quotations. To the extent certain financial instruments trade infrequently or are non-marketable securities, they may not have readily determinable fair values. The Company estimated the fair value of the Warrants using a Black Scholes option pricing model and available information that management deems most relevant. Among the factors considered in determining the fair value of financial instruments: The stock price is the closing price of the Company’s stock on the valuation date; the risk free interest rate is based on the U.S. Government Securities average rate for 1 and 2 year maturities on the date of issuance; the volatility is a statistical measure (standard deviation) of the tendency of the Company’s stock price to cha nge over time; the exercise price is the price at which the warrant can be purchased by exercising prior to its expiration; the dividend yield is not applicable due to the Company not intending to declare dividends; the contractual life is based on the average exercise period of the warrant; and the fair market value is value of the warrants based on the Black Scholes model on the valuation date.
WORLDWIDE ENERGY AND MANUFACTURING USA, INC. AND SUBSIDIARIES
NOTES TO THE UNAUDITED CONDENSED CONSOLIDATED FINANCIAL STATEMENTS
The following table provides the valuation inputs used to value the Warrants issued in connection with the 2010 Financing.
| 2010 Financing Warrants - Valuation Inputs |
| Attribute | September 30, 2010 | January 2010 |
| Stock Price | | $ | 3.89 | | | $ | 5.65 | |
| Risk Free Interest Rate | | | 1.03 – 1.12 | % | | | 1.03 – 1.12 | % |
| Volatility | | | 90.5 | % | | | 90.5 | % |
| Exercise Price | | $ | 5.65 – 6.75 | | | $ | 5.65 – 6.75 | |
| Dividend Yield | | | 0 | % | | | 0 | % |
| Contractual Life (Years) | | | 2.5 | | | | 2.5 | |
| Fair Market Value | | $ | 3,476,057 | | | $ | 6,095,998 | |
13. RELATED PARTY TRANSACTIONS
(1) Long term receivable – related party
| | | September 30, | | | December 31, | |
| | | 2010 | | | 2009 | |
| | | | | | | |
| Mr. Ding Honglin – Mr. Ding is the General Manager of Shanghai Intech Precision (“Precision”) Machinery Co. Ltd – Loan to accommodate partnership separation | | $ | 242,233 | | | $ | 237,305 | |
| Precision sold goods to a company controlled by Mr. Ding Honglin | | | 368,297 | (a) | | | 381,222 | |
| | | $ | 610,530 | | | $ | 618,527 | |
The amounts due from related party are unsecured, interest free and have no fixed repayment dates.
(a) The Company is in the process of structuring this long term receivable into a note receivable. Until such time, the Company will account for this as a long term receivable-related party.
(2) Note receivable from officer
| | | September 30, | | | December 31, | |
| | | 2010 | | | 2009 | |
| | | | | | | |
| Mr. Jimmy Wang and Mrs. Mindy Wang, principal stockholders, executive officers and members of the Board of Directors of the Company. | | $ | - | | | $ | 50,000 | |
The amounts due from a related party are unsecured, interest free and have no fixed repayment dates. As of January 5, 2010, all amounts were repaid.
WORLDWIDE ENERGY AND MANUFACTURING USA, INC. AND SUBSIDIARIES
NOTES TO THE UNAUDITED CONDENSED CONSOLIDATED FINANCIAL STATEMENTS
(3) Due to a related party
| | | September 30, | | | December 31, | |
| | | 2010 | | | 2009 | |
| | | | | | | |
| Shanghai Jinde Electro-Mechanical Co. Ltd, the minority shareholder of Intech-tron for distributions not paid at acquisition | | $ | 1,271,993 | (b) | | $ | 1,246,114 | |
| Precision purchased inventory from a two companies controlled by Mr. Ding Honglin’s father | | | 215,530 | | | | 195,689 | |
| Advances from related party | | $ | - | | | $ | 400,000 | (a) |
| | | $ | 1,487,523 | | | $ | 1,841,803 | |
The amounts due to a related party are unsecured, interest free and have no fixed repayment dates.
(a) On September 28, 2009, the Company borrowed $400,000 from an employee, who is related to an officer of the Company, for working capital purposes. The note provides for the Company to make a lump sum payment on September 27, 2010, including interest at an annual rate of 4.25%. The borrowing plus interest of $6,328 was repaid on February 9, 2010.
(b)The Company entered into an agreement on February 3, 2008 with the minority shareholder of Intech-tron whereby if the Company was to invest an additional amount of approximately $820,000 into Intech-tron, the minority shareholder will automatically convert to equity approximately $670,000 of a payable owed to him in order to maintain the current ownership structure of 55% owned by the Company and 45% minority owned. In addition, the minority shareholder would forgive approximately $300,000 of the related payable owed to him with approximately $302,000 remaining as a related party payable. As of September 30, 2010, the total amount due to the minority owner was $1,271,993 which is recorded in Due to related parties on the Condensed Consolidated Balance Sheet.
The Company paid wages to certain stockholders, who are also members of the Board of Directors. The Company has recorded these as Management and Professional Fees Paid to Stockholders in Operating Expenses on the Condensed Consolidated Statement of Income of $90,000 and $80,000, for the three months ended September 30, 2010 and 2009, respectively, and $270,000 and $260,000, for the nine months ended September 30, 2010 and 2009, respectively.
14. EMPLOYEE BENEFITS
The Company pays a performance bonus to the management of the Solar division equal to 49% of the profitability of the Solar division. The Company included this bonus in accrued expenses and has recorded bonus expense in selling, general and administrative expenses of $752,691 and $0, for the three months ended September 30, 2010 and 2009, respectively, and $781,209 and $0, for the nine months ended September 30, 2010 and 2009, respectively.
From time to time, the Company has issued common stock to employees and the Board of Directors (see Note 11) as compensation for services and granted options to several employees in 2010. The Company has recorded these as stock based compensation expenses in selling, general and administrative expenses of $15,000 and $46,800, for the three months ended September 30, 2010 and 2009, respectively, and $35,992 and $162,020, for the nine months ended September 30, 2010 and 2009, respectively.
WORLDWIDE ENERGY AND MANUFACTURING USA, INC. AND SUBSIDIARIES
NOTES TO THE UNAUDITED CONDENSED CONSOLIDATED FINANCIAL STATEMENTS
15. EARNINGS PER SHARE
FASB ASC Topic 260, Earnings Per Share, requires a reconciliation of the numerator and denominator of the basic and diluted earnings per share (EPS) computations.
For the three month and nine month periods ended September 30, 2010 and the same periods in 2009, the following were included as potential dilutive shares. Employee stock options of 96,217 with an exercise price of $6.00. Class A warrants to purchase 722,221 common shares at an exercise price of $7.00 and Class B warrants to purchase 388,888 shares at an exercise price of $9.00 of common stock. Due to the exercise price being in excess of the average closing price of the Company’s common stock for the three and nine month period ending September 30, 2010, using the treasury stock method, all potential dilutive shares were deemed to be anti-dilutive.
The following table sets forth the computation of basic and diluted net income per share:
| | | For The Nine Months Ended | | | For The Three Months Ended | |
| | | September 30, | | | September 30, | |
| | | 2010 | | | 2009 | | | 2010 | | | 2009 | |
| | | (unaudited) | | | (unaudited) | | | (unaudited) | | | (unaudited) | |
| | | | | | | | | | | | | |
| Net income attributable to the WEMU stockholders | | $ | 4,428,983 | | | $ | 1,590,757 | | | $ | 1,189,930 | | | $ | 2,001,562 | |
| | | | | | | | | | | | | | | | | |
| Weighted average outstanding shares of common stock | | | 5,449,380 | | | | 3,578,014 | | | | 5,653,641 | | | | 3,621,611 | |
| Dilutive effect of options and warrants | | | - | | | | - | | | | - | | | | - | |
| Diluted weighted average common stock and common stock equivalents | | | 5,449,380 | | | | 3,578,014 | | | | 5,653,641 | | | | 3,621,611 | |
| | | | | | | | | | | | | | | | | |
| Earnings per share: | | | | | | | | | | | | | | | | |
| Basic | | $ | 0.81 | | | $ | 0.44 | | | $ | 0.21 | | | $ | 0.55 | |
| Diluted | | $ | 0.81 | | | $ | 0.44 | | | $ | 0.21 | | | $ | 0.55 | |
16. SEGMENT INFORMATION
The Company’s operations are classified into two principal reportable segments that provide different products or services. These two segments are Solar and Contract Manufacturing. Our Solar division procures and manufactures solar modules for sale within the solar industry. Our Solar division represents 88.5% of our business. The Contract Manufacturing division purchases and sells a wide variety of manufactured goods from China procured by its subsidiaries or contractors in China to a wide range of customers from different industries. Although both segments are involved in manufacturing they serve different customers and are managed separately requiring specialized expertise. We determine our operating segments in accordance with FASB ASC Topic 280, “S egment Reporting.”
Segmental Data – Three months ended September 30, 2010 and 2009
Reportable Segments (amounts in thousands)
| | | September 30, 2010 | | | September 30, 2009 | |
| | | Solar | | | Contract Mfg | | | Total | | | Solar | | | Contract Mfg | | | Total | |
| Revenue | | | 40,017 | | | | 4,536 | | | | 44,553 | | | | 15,533 | | | | 3,086 | | | | 18,619 | |
| Cost of goods | | | (37,278 | ) | | | (3,289 | ) | | | (40,567 | ) | | | (13,734 | ) | | | (2,204 | ) | | | (15,938 | ) |
| Gross profit | | | 2,739 | | | | 1,247 | | | | 3,986 | | | | 1,799 | | | | 882 | | | | 2,681 | |
| | | | | | | | | | | | | | | | | | | | | | | | | |
| Operating profit | | | 85 | | | | 334 | | | | 419 | | | | 1,225 | | | | 110 | | | | 1,335 | |
| | | | | | | | | | | | | | | | | | | | | | | | | |
| Net income | | | 1,102 | | | | 96 | | | | 1,198 | | | | 1,926 | | | | 174 | | | | 2,100 | |
| | | | | | | | | | | | | | | | | | | | | | | | | |
| Segment accounts receivable | | | 18,234 | | | | 7,257 | | | | 25,491 | | | | | | | | | | | | | |
| | | | | | | | | | | | | | | | | | | | | | | | | |
| Segment assets | | | 36,702 | | | | 16,083 | | | | 52,785 | | | | | | | | | | | | | |
| | | | | | | | | | | | | | | | | | | | | | | | | |
| Expenditures for long-lived assets | | | 2,246 | | | | 351 | | | | 2,597 | | | | | | | | | | | | | |
WORLDWIDE ENERGY AND MANUFACTURING USA, INC. AND SUBSIDIARIES
NOTES TO THE UNAUDITED CONDENSED CONSOLIDATED FINANCIAL STATEMENTS
Segmental Data – Nine months ended September 30, 2010 and 2009
Reportable Segments (amounts in thousands)
| | | September 30, 2010 | | | September 30, 2009 | |
| | | Solar | | | Contract Mfg | | | Total | | | Solar | | | Contract Mfg | | | Total | |
| Revenue | | | 101,573 | | | | 13,158 | | | | 114,731 | | | | 29,921 | | | | 9,296 | | | | 39,217 | |
| Cost of goods | | | (94,492 | ) | | | (9,612 | ) | | | (104,104 | ) | | | (26,330 | ) | | | (6,866 | ) | | | (33,196 | ) |
| Gross profit | | | 7,081 | | | | 3,546 | | | | 10,627 | | | | 3,591 | | | | 2,430 | | | | 6,021 | |
| | | | | | | | | | | | | | | | | | | | | | | | | |
| Operating profit | | | 1,602 | | | | 1,018 | | | | 2,620 | | | | 2,122 | | | | 251 | | | | 2,373 | |
| | | | | | | | | | | | | | | | | | | | | | | | | |
| Net income | | | 2,363 | | | | 2,429 | | | | 4,792 | | | | 1,701 | | | | 110 | | | | 1,811 | |
| | | | | | | | | | | | | | | | | | | | | | | | | |
In our solar division, Germany represented approximately 28.7%, Italy represented approximately 59.4%, the United Kingdom represented approximately 2.5% and North America represented approximately 2.7% of our sales in the three months ended September 30, 2010. For the three months ended September 30, 2009, Germany represented 76.6% of our business, Italy representing 10.0%, and North America representing 0.3% of our total solar sales. Germany represented approximately 57.0%, Italy represented approximately 31.9%, the United Kingdom represented approximately 3.9% and North America represented approximately 3.5% of our sales in the nine months ended September 30, 2010. For the nine months ended September 30, 2009, Germany represented 66.4% of our business, Italy representing 12.1% and North America rep resenting 0.2% of our total solar sales.
For our contract manufacturing business, North America represents approximately 30.8% and China represents 69.2% of sales for the three months ended September 30, 2010. For the three months ended September 30, 2009, North America represented 33.0% and China 67.0% of that division’s sales. North America represents approximately 32.0% and China represents 68.0% of sales for the nine months ended September 30, 2010. For the nine months ended September 30, 2009, North America represented 41.6% and China 58.4% of that division’s sales.
In our solar division, Germany represented approximately 31.2%, Switzerland represented approximately 16.9%, and Italy represented approximately 41.9% of solar accounts receivable as of September 30, 2010. As of September 30, 2009, Germany represented approximately 80.3% and Italy represented approximately 13.5% of the solar accounts receivable.
For our contract manufacturing business, China represents approximately 86.3%, North America represents approximately 13.7% of contract manufacturing accounts receivable as of September 30, 2010. As of September 30, 2009, China represents approximately 80.6% and North America represents 19.4% of the contract manufacturing accounts receivable.
17. SUBSEQUENT EVENTS
On October 10, 2010, the Company entered into an agreement with a third party for Investor Relations services. The agreement term is three months and shall pay $7,500 per month in cash and $7,500 per month in the Company’s restricted common stock.
ITEM 2. MANAGEMENT’S DISCUSSION AND ANALYSIS OF FINANCIAL CONDITION AND RESULTS OF OPERATIONS
DISCLAIMER REGARDING FORWARD LOOKING STATEMENTS
Certain statements in this Form 10-Q, which are not statements of historical fact, are what are known as "forward-looking statements," which are basically statements about the future. For that reason, these statements involve risk and uncertainty since no one can accurately predict the future. Words such as "plans," "intends," "hopes," "seeks," "anticipates," "expects," and the like, often identify such forward looking statements, but are not the only indication that a statement is a forward-looking statement. Such forward-looking statements include statements concerning our plans and objectives with respect to our present and future operations, and statements which express or imply that such present and future operations will or may produce revenues, income or profits. These and other factors may cause our actual results to differ mat erially from any forward-looking statement. We caution you not to place undue reliance on these forward-looking statements. Although we base these forward-looking statements on our expectations, assumptions, and projections about future events, actual events and results may differ materially, and our expectations, assumptions, and projections may prove to be inaccurate. The forward-looking statements speak only as of the date hereof, and we expressly disclaim any obligation to publicly release the results of any revisions to these forward-looking statements to reflect events or circumstances after the date of this filing.
Overview
Worldwide Energy and Manufacturing USA, Inc. (“Worldwide” or “the Company”) is an international manufacturing and engineering firm, concentrating on PV solar modules and contract manufacturing services, using multiple factories in China. We service customers globally for our solar modules and in the United States and China for the components and products from our Contract Manufacturing division. From our inception in 1993 until 2005, we were strictly an intermediary or “middle man,” working with our customers and our subcontractors to assure that our customers received high quality components on a timely basis that fulfilled their specific needs. While we still subcontract a significant portion of our business, since 2005, we have begun the transition to becoming a di rect contract manufacturer, operating several of our own factories. Recently, we announced the opening of two additional factories, allowing us to become a direct manufacturer for solar modules and for power supply units as described below:
In February of 2008, we established a solar division that focuses on photovoltaic module technology under the brand name of “AmeriSolar.” On February 4, 2008, we changed our name from Worldwide Manufacturing USA, Inc. to Worldwide Energy and Manufacturing USA, Inc. in order to reflect our expansion into the solar energy industry. We issued 300,000 restricted shares for the AmeriSolar brand name. We then leased a 129,167 square foot facility in Ningbo, China. The lease term is from July 18, 2008 to July 17, 2013. In May 2010, the Company vacated this facility and moved the operations to its new Nantong facility. This facility houses the production operations and R&D center for our solar division. This factory has the capability of producing 100MW in solar modules per year. By opening this factory we hope to increase gross and net margins in our solar division. Furthermore, it will help us through the R&D department to continue to improve, develop and enhance our solar modules. We will continue to explore opportunities as well as expand our solar sales and distribution globally. We currently sell our solar modules in Europe and North America. Our research shows that there is an abundance of solar rebate programs paid by Federal, State, and Local governments for both the commercial and residential markets globally. We feel we are well positioned to sell our modules to large institutions in the U.S. This division generated $40,017,187 and $15,532,187 in sales for three months ended September 30, 2010 and 2009, respectively, and $101,573,045 and $29,921,185 for the nine months ended September 30, 2010 and 2009, respectively.
On October 14, 2008, we completed the acquisition of 55% of Shanghai De Hong Electric and Electronic Co., Ltd., (the name was later changed to “Intech-tron”) through acquiring 55% of the outstanding capital stock of Intech-tron, a China LLC. We funded the acquisition with the sale of 1,055,103 shares of our common stock, or $4,747,970 on June 23, 2008 and an additional sale of 56,007 shares of common stock, $252,027 on July 24, 2008. Intech-tron is the holding company for the operating subsidiary Shanghai Detron Electric and Electronics Co., Ltd., LLC (“Detron”). We hold 55% control of the operating subsidiary, Detron. Detron is a power supply factory in Shanghai, China with design and R & D capabilities. Under the terms of the purchase agreement dated F ebruary 3, 2008, we paid cash consideration of $1,022,700 for a 55% interest in Intech-tron. Shanghai Intech Electro-Mechanical Products Co., Ltd., LLC, (“Intech”) paid the first installment of $714,286 on behalf of us in September, 2008. On March 31, 2009, we paid $308,414 for the second installment, such that the total consideration of the investment is $1,022,700.
Detron’s revenues were a $2,122,413 and $1,640,097 for the three months ended September 30, 2010 and 2009, respectively, and $6,111,817 and $4,084,718 for the nine months ended September 30, 2010 and 2009, respectively.
On August 15, 2008, we formed a new company called Worldwide Energy and Manufacturing (Ningbo) Co., Ltd., LLC (“Ningbo Solar”), which is the solar energy research and development manufacturer. We established a factory to manufacture PV solar modules and provide these to customers for various solar projects. We also act as agent to import or export the products and services overseas.
In May 2010, the Company vacated its Ningbo facility and moved the operations to its new Nantong (“Nantong”) facility. The Company paid two month’s rent as a penalty to be released from the lease, which was booked to Other Expense in the Statement of Income, and wrote off $137,265 of leasehold improvements and equipment to Loss on disposal of fixed assets in the Statement of Income. The Company did not incur any other material costs of abandonment of the Ningbo facility.
In May 2010, Nantong formed its wholly owned subsidiary, Worldwide Energy and Manufacturing (Shanghai) Co., Ltd., (“Shanghai Solar”) to provide design, installation, and consulting for Solar Power Systems. This subsidiary has been created to provide more value add to our customers by providing the System Integration services (the next downstream link in the Solar Value Chain) to complement our PV Solar Module offerings. This service will provide system design work by incorporating and specifying the Balance-of-System (BOS) components with our Amerisolar modules. We have started this endeavor to take advantage of the rapidly growing solar market in China. Operations at this subsidiary are not expected to be significant in 2010.
Despite these additions and enlarging our capability as a direct manufacturer for several products lines we are still constrained in our growth for a number of reasons. Many Fortune 500 and other large companies either cannot, or choose not, to work with contract manufacturers preferring to go directly to the source that can manufacture the product and thereby avoid the additional expense of the middleman. This is particularly true for very large orders, where the added cost of the middleman can have a material impact on the customers’ bottom line. As a result, our revenues have for the most part, but not entirely, been limited to smaller scale production orders primarily (but not entirely) placed by companies that are not among the largest companies in the United States or elsewhere.
With the continuing transition into direct manufacturing and the renewable energy field, we expect to continue to increase sales outside the United States, and in particular, increase the number of customers in China, other Asian markets and Europe. Our costs to establish and improve these factories will increase along with sales and profits.
Through the development of our product mix, which consists of solar modules, casting, machining and stamping, electronics and fiber optics products lines, our business has become more diverse. In the past, foundry and machining and stamping accounted for more than 90% of our business but this percentage has decreased. Since forming our own factories our new Solar division now represents approximately 89.8% and 78.6% of our sales volume for the three months ending September 30, 2010 and 2009, respectively, and 88.5% and 72.8% for the nine months ended September 30, 2010 and 2009, respectively. With greater market penetration, and the market expanding, the solar content of our overall business is expected to increase.
Generally, our operating results have been, and will continue to be, affected by a number of factors, including the following:
| | • | our customers may cancel or delay orders or change production quantities; |
| | | |
| | • | overall market conditions in the solar industry; |
| | | |
| | • | integration of acquired businesses and facilities; and |
| | | |
| | • | managing growth and changes in our operations. |
| | | |
We also are subject to other risks, including risks associated with operating in foreign countries, changes in our tax rates, and fluctuations in currency exchange rates.
We recognize revenues in accordance with the guidelines of the Securities and Exchange Commission (“SEC”) Staff Accounting Bulletin (“SAB”) No. 104 “Revenue Recognition”. We recognize revenue from product sales when the orders are completed and shipped, provided that collection of the resulting receivable is reasonably assured, risk of loss is transferred, and price is fixed and determinable. Amounts billed to customers are recorded as sales while the shipping costs are included in cost of sales. Returns on defective custom parts may only be exchanged for replacement parts within 30 days of the invoice date. Returns on defective parts, which can be resold, may be exchanged for replacement parts or for a refund. Revenue from non-refundable customer tooling deposits is recognized when the materials are shipped or when the deposit is forfeited, whichever is earlier. Recently, industry conditions and market forces have necessitated the Company to extend their payment terms in the marketplace; however, this change in terms does not prohibit the Company from recognizing revenue in accordance with SAB No. 104.
Operations at the Company’s new Shanghai Solar subsidiary are not expected to be material in 2010 and therefore, we have not determined the revenue recognition policies which will apply to this operation.
Our Operations
All manufacturing activities are carried out through our subsidiaries located in Shanghai and Nantong, People’s Republic of China (“China”) which include:
| 1. | Shanghai Intech Electro-Mechanical Products Co. Ltd., LLC, wholly owned subsidiary of Worldwide Energy and Manufacturing USA, Inc., with a period for business operation of 15 years from August 6, 1997 to August 5, 2012. |
| 2. | Shanghai Intech-Tron Electric and Electronics Co., Ltd., LLC, 55% owned by Worldwide Energy and Manufacturing USA, Inc., with a period for business operation of approximately 29.5 years from April 26, 1999 to October 8, 2028. |
| 3. | Shanghai Detron Electric & Electronics Co., Ltd., 100% owned by Shanghai Intech-Tron Electronic and Electronics Co., with a period for business operation of 17.5 years from October 22, 1996 to July 3, 2014. |
| 4. | Shanghai Intech Precision Machinery Co., Ltd., LLC, 51% owned by Shanghai Intech Electro Mechanical Products Co. and 49% owned by Worldwide Energy and Manufacturing USA, Inc., with a period for business operation of 30 years from November 14, 2005 to November 13, 2035. |
| 5. | Shanghai Shutai Precision Casting Company, Limited, LLC, 55% owned by Shanghai Intech Electro-Mechanical Products Co. and 45% owned by Worldwide Energy and Manufacturing USA, Inc., with a period for business operation of 30 years from February 2, 2007 to February 1, 2037. |
| 6. | Worldwide Energy and Manufacturing (Ningbo) Co., Ltd., LLC, 100% owned by Worldwide Energy and Manufacturing USA, Inc., with a period for business operation of 20 years from August 15, 2008 to August 14, 2028. |
| 7. | Worldwide Energy and Manufacturing (Nantong) Co., Ltd., LLC, 99.9% owned by Worldwide Energy and Manufacturing USA, Inc., with a period for business operation of 50 years from February 27, 2009 to February 26, 2059,and, |
| 8. | Worldwide Energy and Manufacturing (Shanghai) Co., Ltd., LLC, 99.9% owned by Worldwide Energy and Manufacturing USA, Inc. with a period for business operation of 30 years from June 4, 2010 to June 3, 2040. |
In addition to these production facilities, we maintain our corporate headquarters in a leased facility in South San Francisco, CA. In this location, we also warehouse Contract Manufacturing and Solar division inventory to support our customers in North America on short flow deliveries.
Through these acquisitions and the establishment of our solar division, our corporate structure is depicted as follows:
Results of Operations
Three Months Ended September 30, 2010 Compared to Three Months Ended September 30, 2009
Revenues – Revenues increased by $25,934,618 or 139.3% to $44,553,126 for the three months ended September 30, 2010 from $18,618,508 for the three months ended September 30, 2009. The revenues from solar module sales were $40,017,477 for the three months ended September 30, 2010 compared to $15,532,187 in the same period of 2009. This represents an increase of $24,485,290 in revenue for our Solar Division or approximately 157.6%. The revenues for Contract Manufacturing for the three months ended September 30, 2010 were $4,535,649 compared to $3,086,321 in the same period of 2009, an increase of $1,449,328 or 47.0%. This increase in solar sales is due to the continued market penetration of our AmeriSolar brand of PV solar modules, particularly in Europe, as the overall demand in the solar industry has increased considerably over 2009 levels. Market level pricing of solar modules continue to show greater stability in 2010 than what was experienced in 2009. The increase in sales for our Contract Manufacturing division is due to increased shipments from both our Electronics facility and from our Die Cast factory. Our Electronics facility gained a new customer in the LED market space and our Die Cast factory has added a new customer servicing the telecommunications industry by utilizing additional capacity with a recent purchase of equipment. The Company continues to focus on the sales and marketing of its solar modules and have established sales representatives in: China, United States, Australia, the Middle East, regions of Africa, and several European countries. Solar module revenues comprise approximately 89.8% of the Company's gross sales for the three months e nding September 30, 2010 compared to 78.6% in the same period of 2009.
Cost of Sales - Cost of goods sold increased by $24,629,099 or 154.5% to $40,566,868 for the three months ended September 30, 2010 from $15,937,769 for the three months ended September 30, 2009. The increase was primarily due to the increased sales of the solar division. The cost of goods for solar modules for the three months ending September 30, 2010 was $37,278,423 compared to $13,734,458 for the same period in 2009. The increase of $23,543,965 or 171.4% reflects the increase in solar module sales. The costs of goods sold for Contract Manufacturing was $3,288,445 for the three months ending September 30, 2010 compared to cost of goods sold of $2,203,311 for th e same period in 2009, an increase of $1,085,134 or 49.3%, due to increased sales volume from this division.
Gross Profit - Gross profit increased by $1,305,519, or 48.7% to $3,986,258 for the three months ending September 30, 2010 from $2,680,739 for the three months ending September 30, 2009. The gross profit from solar module sales was $2,739,054 for the three months ended September 30, 2010 compared to $1,797,729 in the same period of 2009. This represents an increase of $941,325 in gross profit for the division or approximately 52.4% and is due to the increased volume of PV modules shipped. As stated before, the PV solar module market experiences market dynamics and significant price pressures throughout the whole supply chain, affecting us on both the sales and cost side of the solar division. The gross profit for cont ract manufacturing for the three months ended September 30, 2010 was $1,247,204 compared to $883,010 in the same period of 2009, an increase of $364,194 or 41.2% and is due to higher sales volume for the division, driven by increased volume from our Die Casting and Electronics production facilities.
Gross Margin - The gross margin was 8.9% for the three months ending September 30, 2010 compared to 14.4% in the same period in 2009. The gross margin for our solar division for the three months ending September 30, 2010 was approximately 6.8% compared to 11.6% for the same period in 2009. This decrease is driven by the lower sales price per unit that is dictated by the market and which has outpaced the reductions that we have been able to negotiate with our suppliers. The gross margin for contract manufacturing for the three months ending September 30, 2010 was 27.5% compared to 28.6% for the same period in 2009. This decrease is primarily due to sales mix in our Electronics business to product lines that have a lowe r gross margin than the prior year.
Operating Expenses – Selling, general and administration expenses for the three months ended September 30, 2010, totaled $3,456,595 compared to $1,182,661 in the same period in 2009, an increase of $2,273,934 or approximately 192.3%. Sales, general and administration expenses were $2,436,164 for the three months ending September 30, 2010 compared to $514,516 in the same period in 2009 an increase of $1,921,648 or 373.5% for our Solar Module division, reflective of the increased sales expenses for sales associate salaries and commissions on increased sales volume and the expenses associated with adding administrative infrastructure for our current and anticipated sales growth. Sales, general and administration expenses for the three m onths ended September 30, 2010 for our contract manufacturing division was $1,020,431 compared to $668,145 in the same period of 2009. The increase of $352,286 or 52.7% is primarily due to the increased sales level.
For the three months ending September 30, 2010 there was stock based compensation of $16,250 compared to $46,800 for stock based compensation in the same period of 2009. Further the Company had depreciation expense of $26,552 in the three months ending September 30, 2010 compared to $83,485 in the same period of 2009, due to the disposal of depreciable assets owned by the Company.
Income Before Income Taxes - Income before tax for the three months ending September 30, 2010 was $1,397,821 compared to $2,527,078 for the year ended September 30, 2009. The decrease of $1,129,257 or approximately 44.7% is primarily due to the change in the warrant derivative liability of $994,714 and the lower gross margin driven by our material cost increases, offset primarily by the increase in the foreign exchange gain of $875,443.
We do not anticipate significant increases in sales, general and administration expenses other than those directly attributed to increases in sales such as marketing and sales commissions and our compliance costs as we implement the requirements of Sarbanes Oxley.
Nine Months Ended September 30, 2010 Compared to Nine Months Ended September 30, 2009
Revenues – Revenues increased by $75,513,741 or 192.6% to $114,731,029 for the nine months ended September 30, 2010 from $39,217,288 for the nine months ended September 30, 2009. The revenues from solar module sales were $101,573,045 for the nine months ended September 30, 2010 compared to $29,921,185 in the same period of 2009. This represents an increase of $71,651,860 in revenue for our Solar Division or approximately 239.5%. The revenues for Contract Manufacturing for the nine months ended September 30, 2010 were $13,157,984 compared to $9,296,103 in the same period of 2009, an increase of $3,861,881 or 41.5%. This increase in solar sales is due to the continued market penetration of our Amerisolar brand of PV solar modules, particularly in Europe, as the overall demand has increased considerably over 2009 levels. Market level pricing of solar modules continue to show greater stability in 2010 than what was experienced in 2009. The increase in sales for our Contract Manufacturing division is due to increased shipments from both our Electronics facility and Die Cast factory. Our Electronics facility gained a new customer in the LED market space contributing revenue of approximately $900,000 in the nine months ending September 30, 2010 and our Die Cast factory has added a new customer servicing the telecommunications industry by utilizing additional capacity with a recent purchase of equipment contributing revenue of approximately $485,000 in the nine months ending September 30, 2010. The Company continues to focus on the sales and marketing of its solar modules and have established sales representatives in: China, United States, Australia, the Middle East, regions of A frica, and several European countries. Solar module revenues comprise approximately 88.5% of the Company's gross sales for the nine months ending September 30, 2010 compared to 72.8% in the same period of 2009.
Cost of Sales - Cost of goods sold increased by $70,907,643 or 213.6% to $104,104,050 for the nine months ended September 30, 2010 from $33,196,407 for the nine months ended September 30, 2009. The increase was primarily due to the increased sales of the solar division. The cost of goods for solar modules for the nine months ending September 30, 2010 was $94,492,118 compared to $26,330,403 for the same period in 2009. The increase of $68,161,715 reflects the increase in solar module sales. The costs of goods sold for Contract Manufacturing was $9,611,932 for the nine months ending September 30, 2010 compared to cost of goods sold of $6,866,004 for the same period in 2009, an increase of $2,745,928 or 40.0%, due to increased sales volume from this division.
Gross Profit - Gross profit increased by $4,606,098, or 76.5% to $10,626,979 for the nine months ending September 30, 2010 from $6,020,881 for the nine months ending September 30, 2009. The gross profit from solar module sales was $7,080,927 for the nine months ended September 30, 2010 compared to $3,590,782 in the same period of 2009. This represents an increase of $3,490,145 in gross profit for the division or approximately 97.2% and is due to the increased number of units shipped. As stated before, the PV solar module market experiences market dynamics and significant price pressures throughout the whole supply chain, affecting us on both the sales and cost side of the solar division. The gross profit for contract manufacturing for the nine months ended September 30, 2010 was $3,546,052 compared to $2,430,099 in the same period of 2009, an increase of $1,115,953 or 45.9% and is due to higher sales volume for the division, driven by increased volume from our Die Casting and Electronics production facilities.
Gross Margin - The gross margin was 9.3% for the nine months ending September 30, 2010 compared to 15.4% in the same period in 2009. The gross margin for our solar division for the nine months ending September 30, 2010 was approximately 7.0% compared to 12.0% for the same period in 2009. This decrease is driven by the lower sales price per unit that is dictated by the market and which has outpaced the reductions that we have been able to negotiate with our suppliers. The gross margin for contract manufacturing for the nine months ending September 30, 2010 was 26.9% compared to 26.1% for the same period in 2009. This increase is primarily due to sales mix in our electronics business to product lines that have a higher gross margin, particularly in the third quarter ended September 30, 2010.
Operating Expenses – Selling, general and administration expenses for the nine months ended September 30, 2010, totaled $7,332,412 compared to $3,141,878 in the same period in 2009, an increase of $4,190,534 or approximately 133.4%. Sales, general and administration expenses were $4,747,083 for the nine months ending September 30, 2010 compared to $1,757,844 in the same period in 2009 an increase of $2,989,239 or 170.1% for our Solar Module division, reflective of the increased sales expenses for sales associate salaries and commissions on increased sales volume and the expenses associated with adding administrative infrastructure for our current and anticipated sales growth. Sales, general and administration expenses for the nine mo nths ended September 30, 2010 for our contract manufacturing division was $2,585,329 compared to $1,384,034 in the same period of 2009. The increase of $1,201,295 or 86.8% is primarily due to increased costs associated with increased sales.
For the nine months ending September 30, 2010 there was stock based compensation of $62,242 compared to $162,020 for stock based compensation in the same period of 2009. Further the Company had depreciation expense of $266,229 in the nine months ending September 30, 2010 compared to $246,366 in the same period of 2009, due to the greater amount of depreciable assets owned by the Company.
Income Before Income Taxes - Income before tax for the nine months ending September 30, 2010 was $5,535,519 compared to $2,481,507 for the nine months ended September 30, 2009. The increase of $3,054,012 or approximately 123.1% is primarily due to the change in the warrant derivative liability of $2,802,400 and the higher gross profit driven by our material cost reductions.
We do not anticipate significant increases in sales, general and administration expenses other than those directly attributed to increases in sales such as marketing and sales commissions and our compliance costs as we implement the requirements of Sarbanes Oxley.
We pay a performance bonus to the management of the Solar division equal to 49% of the profitability of the Solar division. We include this bonus in accrued expenses and have recorded bonus expense in selling, general and administrative expenses of $752,691 and $0, for the three months ended September 30, 2010 and 2009, respectively, and $781,209 and $0, for the nine months ended September 30, 2010 and 2009, respectively.
Foreign Currency Transactions and Translation
The Company’s primary country of operations is The People’s Republic of China (“PRC”). The financial position and results of operations of the Company’s China operations are determined using the local currency Renminbi (“RMB”) as the functional currency. However, the China operations sells solar products in Euros. The results of operations denominated in foreign currency are remeasured at the average rate of exchange during the reporting period. Aggregate net foreign currency transactions included in the income statement were gains of $973,439 and $97,996, for the three months ended September 30, 2010 and 2009, respectively, and gains of $142,895 and a gain of $103,421 for the nine months ended September 30, 2010 and 2009, respectively primarily due to the decli ne of the value of the Euro to the RMB. The average rates of exchange from Euros to RMB were 8.7475 to 1 and 9.77709 to 1 for the three months ended September 30, 2010 and 2009 or a 10% change, respectively, and 8.97722 to 1 and 9.35258 to 1 for the nine months ended September 30, 2010 and 2009 or a 4% change, respectively. As of September 30, 2010, should the exchange rate of Euros to RMB flucuate by 1%, the Company would expect the impact on its financial statements to be approximately a $70,000 exchange gain or loss for each 1% change in the exchange rate.
Assets and liabilities denominated in foreign currencies at the balance sheet date are translated at the exchange rates prevailing at the balance sheet date. The registered equity capital denominated in the functional currency is translated at the historical rate of exchange at the time of capital contribution. All translation adjustments resulting from the translation of the financial statements into the reporting currency (“US Dollars”) are dealt with as a separate component within stockholders’ equity. Translation adjustments net of tax totaled $217,594 and $83,423, for the three months ended September 30, 2010 and 2009, respectively, and $324,468 and $191,079 for the nine months ended September 30, 2010 and 2009, respectively.
Liquidity and Capital Resources
General – Overall, we had a decrease in cash flows of $708,479 in the nine months ending September 30, 2010 resulting from cash used in operating activities of $6,349,359 and cash used in investing activities of $113,325, offset partially by $5,530,333 of cash provided by investing activities.
The following is a summary of our cash flows provided by (used in) operating, investing, and financing activities during the periods indicated:
| | | Nine months ended September 30, | |
| | | 2010 | | | 2009 | |
| | | | | | | |
| Cash at beginning of period | | $ | 9,180,974 | | | $ | 5,092,476 | |
| Net cash provided by (used in) operating activities | | | (6,349,359 | ) | | | 272,579 | |
| Net cash used in investing activities | | | (113,325 | ) | | | (2,161,574 | ) |
| Net cash provided by financing activities | | | 5,530,333 | | | | 1,873,707 | |
| Effect of exchange rate changes on cash | | | 223,872 | | | | (9,550 | ) |
| Cash at end of period | | $ | 8,472,495 | | | $ | 5,067,638 | |
Under the terms of the revolving line of credit agreement with Bank of the West, dated May 20, 2008, we can borrow up to $2,000,000 at a rate of prime plus 0.50%, with a minimum interest rate of 4.5%. This rate is subject to change based on the prime rate which was 3.25% as of September 30, 2010. The revolving line of credit is secured by our assets. Interest only payments on any outstanding balance is paid monthly. We have no outstanding balance as of September 30, 2010. Any outstanding balance is due on maturity at November 30, 2010.
We can also borrow up $1,025,000 within two term loans. The maturity date of these two loans is May 20, 2011 and June 1, 2012, respectively. The balance outstanding under both loans as of September 30, 2010 is $131,250 and $291,667, respectively. We are currently in compliance with its bank covenants at September 30, 2010. However, we have classified the loans as a current liability due to its past history of non-compliance with its covenants and we are renegotiating the terms of the loans. There is no assurance that the bank will extend the loans and could call the terms loans as a result of non-compliance with the loan covenants.
Cash Flows from Operating Activities – For the nine months ending September 30 2010, net cash used in operations was $6,349,359 compared to net cash provided by operations of $272,579 for the nine months ending September 30, 2009. The increase in net cash used in operations was primarily due to the changes in operating assets and liabilities of $8,629,868 primarily due to increases of $13,480,730 in accounts receivable, $1,867,942 in prepaid and other current assets $1,688,145 in inventories, and $1,839,034 in advances to suppliers, and the change in the warrant derivative liability of $2,802,400, offset primarily by the decreases in the VAT tax receivable of $544,940, $4,577,630 in accounts payable, accrued expenses of $771,537, and net income of $4,791,899 for the nine months ended September 30, 2010.
Cash Flows from Investing Activities – Net cash used in investing was $113,325 in the nine months ending September 30, 2010, compared to net cash used in investing of $2,161,574 in the same period of 2009. The decrease net cash used by investing activities was due to capital expenditures of $2,597,363, and decreases in deposits to restricted accounts of $2,456,040.
Cash Flows from Financing Activities – Net cash flows provided by financing activities in the nine months ending September 30, 2010 was $5,530,333 compared to $1,873,707 in 2009. The increase in net cash provided by financing activities was primarily due to proceeds from issuance of common stock and warrants, net of offering costs, of $8,136,583, and proceeds of loan to related party of $50,000, offset primarily by repayment of loan payable to shareholder of $400,000, and repayments of bank loans of $2,356,250.
As we continue to grow our Solar division, we must follow industry trends in regards to extended payment terms to our customers. Typically these market conditions affect the whole supply chain and as extended terms are offered to consumers, favorable terms can be negotiated with the supplier base. Our current cash position allows flexibility to accommodate these market conditions.
Financing – We believe our current working capital position, together with our expected future cash flows from operations will be adequate to fund our operations in the ordinary course of business, anticipated capital expenditures, debt payment requirements and other contractual obligations for at least the next twelve months. However, this belief is based upon many assumptions and is subject to numerous risks, and there can be no assurance that we will not require additional funding in the future.
We expect to have a total of approximately $3,000,000 of capital expenditures for the remainder of 2010 and 2011, primarily $550,000 to acquire additional land rights to expand our new Nantong facility, $1,400,000 to expand and equip our Nantong factory, and $1,000,000 for continued expansion of our business.
We have no present agreements or commitments with respect to any material acquisitions of other businesses, products, product rights or technologies or any other material capital expenditures. However, we will continue to evaluate acquisitions of and/or investments in products, technologies, capital equipment or improvements or companies that complement our business and may make such acquisitions and/or investments in the future. Accordingly, we may need to obtain additional sources of capital in the future to finance any such acquisitions and/or investments. We may not be able to obtain such financing on commercially reasonable terms, if at all. Due to the ongoing global economic crisis, we believe it may be difficult to obtain additional financing if needed. Even if we are able t o obtain additional financing, it may contain undue restrictions on our operations, in the case of debt financing, or cause substantial dilution for our stockholders, in the case of equity financing.
Note Payable – On September 28, 2009, the Company borrowed $400,000 from an employee of the Company for working capital purposes. The note provided for the Company to make a lump sum payment on September 27, 2010, including interest at an annual rate of 4.25%. The borrowing plus interest was repaid on February 9, 2010.
Equity Financing – On January 26, 2010, we entered in a securities purchase agreement with certain accredited investors pursuant to which we issued and sold 1,777,777 of our common stock and warrants to purchase an aggregate of 1,777,777 shares of our common stock for $7,292,790, net of offering costs of $707,210.
On February 9, 2010, we entered into an amendment agreement with approximately 74% of such accredited investors to amend the transaction documents to increase the maximum amount of securities sold to $9,000,000. On February 9, 2010, we entered into a second securities purchase agreement with certain accredited investors pursuant to which we issued and sold 193,179 shares of our common stock for $843,793, net of offering costs of $25,514.
The warrants are exercisable for a term of five years at an exercise price of $5.65 per share. The warrants also contain anti-dilution provisions, including but not limited to, if we issue shares of our common stock at less than the then existing conversion price, the conversion price of the warrants will automatically be reduced to such lower price and the number of shares to be issued upon exercise will be proportionately increased. The warrants contain limitations on exercise, including the limitation that the holders may not convert their warrants to the extent that upon exercise the holder, together with our affiliates, would own in excess of 4.9% of the Company’s outstanding shares of common stock.
In addition, Ladenburg Thalmann & Co., LLC acted as the lead placement agent on the private placement and received warrants to purchase 102,324 shares of the Company’s common stock (warrants to purchase 6,333 shares of common stock were issued to other placement agents at an exercise price of $6.75) (based on 150% of the per share equivalent of $4.50 in the transaction). The warrants vest immediately and have a five year term.
Additionally, as further consideration for the transaction, we, along with the investors, entered into a make good escrow agreement with certain of our insiders who along with the Company placed an aggregate of 1,970,956 shares, that are already issued and outstanding, of our common stock into escrow, to be distributed if certain financial milestones of the Company are not met. Pursuant to the terms of the make good escrow agreement, if the Adjusted EBIDTA reported in our 2010 Annual Report is less than $4,000,000, then the investors shall be entitled to receive on a “pro rata” basis, determined by dividing each investor’s investment amount by the aggregate of all investment amounts delivered to us by the investors, for no consideration other than their part of their respective investment amount at closing, some or all of the escrow shares determined according to the following formula:
For the purposes of the foregoing formula:
A = 2010 Adjusted EBITDA
B = 2010 EBITDA Milestone
C = Total number of shares issued to the selling stockholders
D = 4.50
E = Total Investment Amount
In addition, the agreement states: Notwithstanding the foregoing, in the event that the Company reports an Adjusted EBITDA of $2,000,000 or less for the year ended December 31, 2010 or the Company fails to file its 2010 10-K with the Commission on or before the last date that such form is required to be filed (after any permitted extensions under the Exchange Act), the “2010 EBITDA Milestone Price” shall equal $2.25 resulting in a potential maximum number of additional shares issued to the investors of 1,970,956.
As of September 30, 2010, although the annualized Adjusted EBITDA milestone calculation indicates that the Company may potentially not meet the milestone, the Company believes that it will still meet the milestone requirements.
PLAN OF OPERATION
We will continue to focus on the expansion of our Solar division by the continued development of our newly established solar factory in Nantong, China as well as the continued quality enhancements of our solar module brand, "AmeriSolar". Additionally, we intend to develop the U.S. solar module market and plan to expand our operation in this market. We believe that the renewable energy industry offers us our greatest growth and profit potential in both the present and foreseeable future. We presently have enough liquidity to meet our expansion plans. However, depending on growth, the Company may need additional funding in the future.
In May 2010, Nantong formed Shanghai Solar to provide design, installation, and consulting for Solar Power Systems. This subsidiary has been created to provide more value add to our customers by providing the System Integration services (the next downstream link in the Solar Value Chain) to complement our PV Solar Module offerings. This service will provide system design work by incorporating and specifying the Balance-of-System (BOS) components with our Amerisolar modules. We have started this endeavor to take advantage of the rapidly growing solar market in China. Operations at this subsidiary are not expected to be material in 2010 and therefore, we have not determined the revenue recognition policies which will apply to this operation.
Off-Balance Sheet Arrangements
We do not have any off-balance sheet arrangements that are currently material or reasonably likely to be material to our financial position or results of operations.
Commitments and Contingencies
The 1st “Rights for Construction” for our Nantong facility was issued on December 19, 2008 to Worldwide Energy and Manufacturing USA by the Department of Interior of Jiangsu Province, China.
There was an official agreement between the Department of Civil Engineering (in building and constructions) for the city of Nantong and Worldwide Manufacturing Solar Division located in Nantong dated May 27, 2009 in detailing of the construction for the PV solar module manufacturing facility. Agreement details include:
| 1) | Land usages and rights |
| 2) | Fees and application process |
| 4) | All and other related subjects |
An amendment subsequently followed in further requirements and commitments of both parties were executed on May 29, 2009.
The amount of the agreement is approximately $1.8 million which has been expended through September 30, 2010. The project was completed in the third quarter of 2010.
The Company entered into an agreement on February 3, 2008 with the minority shareholder of Intech-tron whereby if the Compnay was to invest an additional amount of approximately $820,000 into Intech-tron, the minority shareholder will automatically convert to equity approximately $670,000 of a payable owed to him in order to maintain the current ownership structure of 55% owned by the Company and 45% minority owned. In addition, the minority shareholder would forgive approximately $300,000 of the related payable owed to him with approximately $302,000 remaining as a related party payable. As of September 30, 2010, the total amount due to the minority owner was $1,271,993 which is recorded in Due to related parties on the Condensed Consolidated Balance Sheet.
The Company has entered into a commitment agreement with a supplier on August 24, 2010 to purchase approximately $18,000,000 of its solar modules for the four month period September 2010 through December 2010. As of the date of this report, we have purchased approximately $12,600,000. Should the Company not meet this commitment, we believe that the supplier will allow any shortfall to carryover into January 2011 with no penalty to the Company.
Critical Accounting Policies and Estimates
This discussion and analysis of financial condition and results of operations is based on our consolidated financial statements, which have been prepared in accordance with U.S. generally accepted accounting principles. The preparation of these financial statements requires us to make estimates and judgments that affect the reported amounts of assets, liabilities, revenues and expenses and related disclosures. On an on-going basis, we evaluate our estimates, including those related to property, plant and equipment, inventories, revenue recognition, inventories, accounts receivable, derivative warrant liability, warranty reserve, goodwill and intangibles, stock based compensation, and foreign currency transactions and translation. We base our estimates on historical experience and on various other market-specific assumptions that are be lieved to be reasonable under the circumstances, the results of which form the basis for making judgments about the carrying values of assets and liabilities that are not readily apparent from other sources. Actual results, however, may differ significantly from these estimates.
We believe the following critical accounting policies reflect the more significant judgments and estimates used in the preparation of our consolidated financial statements:
Revenue Recognition and Accounts Receivable
The Company follows the provisions of SAB 104, “Revenue Recognition in Financial Statements”, for revenue recognition. Under SAB 104, four conditions must be met before revenue can be recognized: (i) there is persuasive evidence that an arrangement exists, (ii) delivery has occurred or service has been rendered, (iii) the price is fixed or determinable, and (iv) collection is reasonably assured. The Company provides for an allowance for doubtful account based history and experience considering economic and industry trends. The Company does not have any off-Balance Sheet exposure related to its customers.
In May 2010, Nantong formed Shanghai Solar to provide design, installation, and consulting for Solar Power Systems. This subsidiary has been created to provide more value add to our customers by providing the System Integration services (the next downstream link in the Solar Value Chain) to complement our PV Solar Module offerings. This service will provide system design work by incorporating and specifying the Balance-of-System (BOS) components with our Amerisolar modules. We have started this endeavor to take advantage of the rapidly growing solar market in China. Operations at this subsidiary are not expected to be material in 2010 and therefore, we are in the process of analyzing and determining the revenue recognition policies which will apply to this operation. As of Septembe r 30, 2010 there are no significant transactions.
Warrant Derivative Liability
The Company issued warrants in connection with the sale of common stock in 2008 and 2010. The Company analyzed the accounting treatment and classification of the warrants and summarized the effects and conclusions. The Company accounts for the warrants pursuant to FASB ASC Topic 815.
Impairment analysis for long-lived assets and intangible assets
The Company’s long-lived assets and other assets (consisting of property and equipment and purchased intangible assets) are reviewed for impairment in accordance with the guidance of the FASB Topic ASC 360, “Property, Plant, and Equipment”, and FASB ASC Topic 205 “Presentation of Financial Statements”. The Company tests for impairment losses on long-lived assets used in operations whenever events or changes in circumstances indicate that the carrying amount of the asset may not be recoverable. Recoverability of an asset to be held and used is measured by a comparison of the carrying amount of an asset to the future undiscounted cash flows expected to be generated by the as set. If such asset is considered to be impaired, the impairment to be recognized is measured by the amount by which the carrying amount of the asset exceeds its fair value. Impairment evaluations involve management’s estimates on asset useful lives and future cash flows. Actual useful lives and cash flows could be different from those estimated by management which could have a material effect on our reporting results and financial positions. Fair value is determined through various valuation techniques including discounted cash flow models, quoted market values and third-party independent appraisals, as considered necessary. Through September 30, 2010, the Company had not experienced impairment losses on its long-lived assets.
Inventories
Inventories consist of finished goods of manufactured products. Inventory is based on customer orders and the duration of those orders. Cost is stated at the lower of cost or market on a first-in, first-out (FIFO) basis. The Company has recorded an allowance for slow-moving or obsolete inventory of $92,000 at September 30, 2010.
Management has discussed the development and selection of these critical accounting policies with the Board of Directors and the Board has reviewed the disclosures presented above relating to them.
ITEM 3. QUANTITATIVE AND QUALITATIVE DISCLOSURES ABOUT MARKET RISK
We are a smaller reporting Company as defined by Rule 12b-2 of the Securities Exchange Act of 1934 and are not required to provide the information under this item.
ITEM 4. CONTROLS AND PROCEDURES
Evaluation of Disclosure Controls and Procedures
We conducted an evaluation, with the participation of our Chief Executive Officer and Chief Financial Officer, of the effectiveness of the design and operation of our disclosure controls and procedures, as defined in Rules 13a-15(e) and 15d-15(e) under the Securities Exchange Act of 1934, as amended, or the Exchange Act, as of September 30, 2010 to ensure that information required to be disclosed by us in the reports filed or submitted by us under the Exchange Act is recorded, processed, summarized and reported, within the time periods specified in the Securities Exchange Commission's rules and forms, including to ensure that information required to be disclosed by us in the reports filed or submitted by us under the Exchange Act is accumulated and communicated to our management, including our principal executive and principal financia l officers, or persons performing similar functions, as appropriate to allow timely decisions regarding required disclosure. Based on that evaluation, our Chief Executive Officer and Chief Financial Officer have concluded that as of September 30, 2010, our disclosure controls and procedures were not effective at the reasonable assurance level due to the material weaknesses described below.
In light of the material weaknesses described below, we performed additional analysis and other post-closing procedures to ensure our financial statements were prepared in accordance with generally accepted accounting principles. Accordingly, we believe that the financial statements included in this report fairly present, in all material respects, our financial condition, results of operations and cash flows for the periods presented.
A material weakness is a control deficiency (within the meaning of the Public Company Accounting Oversight Board (PCAOB) Auditing Standard No. 5) or combination of control deficiencies, such that there is a reasonable possibility that a material misstatement of the annual or interim financial statements will not be prevented or detected.
Management had previously identified two material weaknesses which caused management to conclude that, as of September 30, 2010, our disclosure controls and procedures were not effective at the reasonable assurance level. Management is still in the process of remediating these material weaknesses. The material weaknesses were previously described as follows:
| | · Accounting and Finance Personnel Weaknesses — The Company lacks appropriate resources within the accounting function. Our accounting staff is comprised of a few people and the department lacks the required skill set, competence, infrastructure and expertise to meet the higher demands of being a public company. This lack of resources has led to a lack of segregation of duties and insufficient attention to the internal control process over financial reporting. |
| | |
| | · Reliance on Third-Party Professionals: We retained an individual to provide support and accounting advice to the Company for the year ended December 31, 2008. We may not have adequately assessed this individual’s qualifications to ascertain his level of experience to render the services for which we retained the individual. Moreover, we did not adequately monitor the individual’s work and placed undue reliance on its expertise without confirming the accuracy of the finished product. |
Remediation Plan for Material Weakness in Control and Procedures
A plan was introduced to implement a number of remediation measures to address the material weaknesses described above. Many of these measures are entity-level in nature and we believe that the organizational and process changes we have and intend to adopt will improve our internal controls and governance environment. Management recognizes that many of these enhancements require continual monitoring and evaluation for effectiveness which we are in the process of doing and committed to continuing. The development of these actions is an iterative process and will evolve as the Company continues to evaluate and improve our internal controls over financial reporting.
Action items described within our Remediation Plan for Material Weaknesses in Control and Procedures from the Quarterly Report on Form 10-Q for the fiscal quarter ended June 30, 2010 included the following item that is still considered to be open:
| ● | We are in the process of documenting our processes and procedures in accordance with the requirements of Section 404 (a) of Sarbanes-Oxley. Upon completion, we will implement the necessary changes. |
We have also implemented the following policies:
| | 1. | | Whistleblower - established to provide any and all employees a confidential method to report any incidents which they believe may be illegal or improper financial, auditing or accounting conduct, any violation of the Company’s Code of Conduct or other unethical behavior. |
| | | | |
| | 2. | | Bribery/Foreign Corrupt Practices Act - The FCPA prohibits any payment or offer of a payment to a foreign official for the purpose of influencing that official to assist in obtaining or retaining business. It also covers offering, promising, or authorizing payment to a foreign official. The term “foreign official” is broadly defined to include foreign political parties or candidates for political office, executive, legislative and judicial officials, and officials of state-owned or controlled companies. The FCPA applies to WEMU and all of its subsidiaries and its officers, employees, independent sales representatives, and agents not only in the United States, and the People’s Republic of China, but around the world. |
| | | | |
| | 3. | | Insider Trading - If a director, officer, employee or consultant has material non-public information relating to the Company, it is our policy that neither that person nor any related person may buy or sell securities of the Company or engage in any other action to take advantage of, or pass on to others, that information. This policy also applies to information relating to any other company, including our customers or suppliers, obtained in the course of employment. |
| | | | |
Between January and September 30, 2010, and over the balance of the 2010 year, we have and will continue to undertake an entity-level review of and test our control procedures and analyze the application of our controls and our control environment generally. In addition, we have hired additional accounting personnel in China with knowledge of US-GAAP and proper accounting rules. The new accounting personnel have been trained in internal controls requirements and testing. Internal and external accounting personnel report directly to the audit committee on testing results, progress, and remediation activities. The audit committee, in conjunction with the Board of Directors and management, will continue to set a tone for effective entity-wide corporate governance; inspire rigorous, uniform appli cation of our internal controls and provide ongoing oversight of the preparation and review of our financial statements. We believe that the audit committee and our new financial professionals will substantially decrease the possibility of the occurrence of errors in our financial statements.
These remediation efforts are designed to address the material weakness identified above and to improve and strengthen our overall control environment. We believe these actions will minimize the material weaknesses from reoccurring. Our management, including our principal executive officer and principal financial officer, does not expect that disclosure controls or internal controls over financial reporting will prevent all errors, even as the aforementioned remediation measures are implemented and further improved to address all deficiencies. The design of any system of controls is based in part upon certain assumptions about the likelihood of future events, and there can be no assurance that any design will succeed in achieving its stated goals under all potential future conditions.
The implementation of our remediation plan will require substantial expenditures, could take a significant period of time to complete, and could distract our officers and employees from the operation of our business. However, our management believes that these remediation efforts will be complete by the end of the 2010 fiscal year.
Our management has evaluated the effectiveness of the design and operation of our disclosure controls and procedures as of the date of this report, under the supervision and with the participation of our chief executive officer (also our principal executive officer) and chief financial officer (also our principal financial and accounting officer), in order to conclude if our disclosure controls and procedures are effective. Based on the information set forth above, our management has determined that, as of the date of this report, we do not have effective disclosure controls and procedure.
Changes in Internal Control over Financial Reporting
There has been no change in our internal control over financial reporting, as defined in Rules 13a-15(f) of the Exchange Act, during our most recent fiscal quarter that has materially affected, or is reasonably likely to materially affect, our internal control over financial reporting. However, we have initiated or intend to initiate a number of remediation measures to address the control deficiencies and material weaknesses identified above. The remediation measures include the following policies we have implemented:
| | 1. | | Whistleblower - established to provide any and all employees a confidential method to report any incidents which they believe may be illegal or improper financial, auditing or accounting conduct, any violation of the Company’s Code of Conduct or other unethical behavior. |
| | | | |
| | 2. | | Bribery/Foreign Corrupt Practices Act - The FCPA prohibits any payment or offer of a payment to a foreign official for the purpose of influencing that official to assist in obtaining or retaining business. It also covers offering, promising, or authorizing payment to a foreign official. The term “foreign official” is broadly defined to include foreign political parties or candidates for political office, executive, legislative and judicial officials, and officials of state-owned or controlled companies. The FCPA applies to WEMU and all of its subsidiaries and its officers, employees, independent sales representatives, and agents not only in the United States, and the People’s Republic of China, but around the world. |
| | | | |
| | 3. | | Insider Trading - If a director, officer, employee or consultant has material non-public information relating to the Company, it is our policy that neither that person nor any related person may buy or sell securities of the Company or engage in any other action to take advantage of, or pass on to others, that information. This policy also applies to information relating to any other company, including our customers or suppliers, obtained in the course of employment. |
| | | | |
PART II. OTHER INFORMATION
| Item 1. | Legal Proceedings. |
| | |
| | On May 5, 2010, a former employee filed a complaint with the United States Department of Labor, Occupational Safety & Health Administration (“OSHA”) alleging unlawful whistleblower retaliation in violation of the Sarbanes-Oxley Act. This complaint is completely without merit – the Company denies all allegations made in the Complaint. The Company filed a response with OSHA on October 15, 2010 wherein it requested immediate dismissal of the complaint. The Company has yet to receive a response from OSHA. This same employee also filed a claim for unemployment insurance benefits with the California Employment Development Department (“EDD”). On August 11, 2010, an Administrative Law Judge found that the former employee was eligible for unemployment benefits. The California Unemployment Insurance Appeals Board recently affirmed this decision. |
| | |
| Item 1A. | Risk Factors (There have been no changes to our Risk Factors included in our Annual Report on Form 10-K filed with the Securities and Exchange Commission on April 15, 2010). |
| | |
| Item 2. | Unregistered Sales of Equity Securities and Use of Proceeds |
| | |
| | On August 18, 2010, the Company issued 6,692 restricted shares of its common stock valued at $17,500 (based on a discounted fair market value on the date of grant) to a consultant for consulting services. The issuance was an isolated transaction not involving a public offering pursuant to Section 4(2) of the Securities Act of 1933. |
| | |
| | On July 8, 2010, the Company issued 900 restricted shares of its common stock valued at $2,457 (based on a discounted fair market value on the date of grant) to a consultant for consulting services. The issuance was an isolated transaction not involving a public offering pursuant to Section 4(2) of the Securities Act of 1933. |
| | |
| Item 3. | Defaults upon Senior Securities |
| | |
| | None. |
| | |
| Item 4. | Removed and Reserved |
| | |
| Item 5. | Other Information |
| | |
| | None. |
| | |
| Item 6. | Exhibits |
| 31.1 | Certification pursuant to Rule 13a-14(a) or 15d-14(a) under the Securities Exchange Act of 1934, as amended. * |
| 31.2 | Certification pursuant to Rule 13a-14(a) or 15d-14(a) under the Securities Exchange Act of 1934, as amended. * |
| 32.1 | Certification pursuant to 18 U.S.C. Section 1350, as adopted pursuant to Section 906 of the Sarbanes-Oxley Act of 2002. * |
| 32.2 | Certification pursuant to 18 U.S.C. Section 1350, as adopted pursuant to Section 906 of the Sarbanes-Oxley Act of 2002. * |
* filed herewith
SIGNATURES
Pursuant to the requirements of the Securities Exchange Act of 1934, the registrant has duly caused this report to be signed on its behalf by the undersigned thereunto duly authorized.
| | WORLDWIDE ENERGY AND MANUFACTURING USA, INC. | |
| | | | |
| | By: | /S/ JIMMY WANG | |
| | | Jimmy Wang, CEO and Director (Principal Executive Officer) | |
| | | Date: November 22, 2010 | |
| | | | |
| | | | |
| | | | |
| | By: | /S/ GERALD DECICCIO | |
| | | Gerald DeCiccio, Chief Financial Officer (Principal Financial and Accounting Officer) |
| | | Date: November 22, 2010 | |
| | | | |
43