Exhibit 99.1

Sierra Wireless, Inc.
Financial Highlights
(Expressed in thousands of United States dollars, except as otherwise stated)
(Prepared in accordance with United States generally accepted accounting principles (“U.S. GAAP”)
Consolidated Statements of Operations Data(1)
Years ended December 31, |
| 2012 |
| 2011 |
| 2010 |
| |||
|
|
|
|
|
|
|
| |||
GAAP results |
|
|
|
|
|
|
| |||
Revenue |
| $ | 397,321 |
| $ | 333,175 |
| $ | 358,005 |
|
Gross margin percentage |
| 31.5 | % | 30.5 | % | 33.9 | % | |||
Total expenses |
| 147,480 |
| 155,993 |
| 164,123 |
| |||
Loss from operations |
| (22,206 | ) | (54,253 | ) | (42,717 | ) | |||
Net loss from continuing operations |
| (4,202 | ) | (50,710 | ) | (34,973 | ) | |||
Net earnings from discontinued operations |
| 31,401 |
| 21,338 |
| 20,174 |
| |||
Net earnings (loss) attributable to the Company |
| 27,199 |
| (29,315 | ) | (14,541 | ) | |||
Basic and diluted net earnings (loss) per share (in dollars) |
| $ | 0.88 |
| $ | (0.94 | ) | $ | (0.47 | ) |
|
|
|
|
|
|
|
| |||
Non-GAAP results(2) |
|
|
|
|
|
|
| |||
Revenue |
| $ | 397,321 |
| $ | 333,175 |
| $ | 358,005 |
|
Gross margin percentage |
| 31.6 | % | 30.7 | % | 34.0 | % | |||
Total expenses |
| 124,680 |
| 124,515 |
| 132,801 |
| |||
Earnings (loss) from operations |
| 898 |
| (22,390 | ) | (10,904 | ) | |||
Net loss from continuing operations |
| (444 | ) | (18,656 | ) | (1,129 | ) | |||
Net earnings from discontinued operations |
| 33,796 |
| 22,289 |
| 21,125 |
| |||
Net earnings attributable to the Company |
| 33,352 |
| 3,633 |
| 19,996 |
| |||
Basic and diluted net earnings per share (in dollars) |
| $ | 1.08 |
| $ | 0.12 |
| $ | 0.64 |
|
|
|
|
|
|
|
|
| |||
Revenue by product |
|
|
|
|
|
|
| |||
AirPrime Embedded Wireless Modules for M2M and PC OEM |
| $ | 340,457 |
| $ | 282,213 |
| $ | 298,384 |
|
AirLink Intelligent Gateways |
| 46,699 |
| 39,013 |
| 48,626 |
| |||
AirVantage M2M Cloud Platform and Other |
| 10,165 |
| 11,949 |
| 10,995 |
| |||
|
| $ | 397,321 |
| $ | 333,175 |
| $ | 358,005 |
|
|
|
|
|
|
|
|
| |||
Revenue by geographical region |
|
|
|
|
|
|
| |||
Americas |
| 26 | % | 25 | % | 23 | % | |||
Europe, Middle East and Africa |
| 20 | % | 27 | % | 22 | % | |||
Asia-Pacific |
| 54 | % | 48 | % | 55 | % | |||
|
| 100 | % | 100 | % | 100 | % | |||
Consolidated Balance Sheet Data(1)
December 31, |
| 2012 |
| 2011 |
| 2010 |
| |||
|
|
|
|
|
|
|
| |||
Cash and cash equivalents, including short-term investments |
| $ | 63,646 |
| $ | 110,722 |
| $ | 111,848 |
|
Long-term liabilities |
| 26,826 |
| 25,379 |
| 26,130 |
| |||
Shareholders’ equity |
| 298,056 |
| 271,904 |
| 302,048 |
| |||
Number of common shares outstanding |
| 30,592,423 |
| 31,306,692 |
| 31,222,786 |
| |||
(1) On January 28, 2013, we announced a definitive agreement for the sale of substantially all of the assets and operations related to our AirCard business. The transaction is expected to close in late March or early April 2013, subject to customary closing conditions. In accordance with U.S. GAAP, assets and liabilities associated with the sale have been recorded as “held for sale” in our consolidated balance sheet as at December 31, 2012 and the results of operations of the AirCard business as discontinued operations in our consolidated statements of operations for each of the years in the three-year period ended December 31, 2012.
(2) Our non-GAAP results exclude the impact of stock-based compensation expense, acquisition amortization, impairment, acquisition and disposition costs, integration costs, restructuring costs, foreign exchange gains or losses on foreign currency contracts and translation of balance sheet accounts, and certain tax adjustments. Non-GAAP financial measures do not have any standardized meaning prescribed by U.S. GAAP and therefore may not be comparable to similar measures presented by other companies. For further information, refer to “Non-GAAP Financial Measures” on page 29 of the Management’s Discussion and Analysis in this Annual Report.
Report to Shareholders
On January 28th, we announced a definitive agreement for the sale of substantially all of the assets and operations related to our AirCard® mobile broadband device business to Netgear, Inc. This divestiture, expected to close in early April, is a major milestone in our transformation to become the pure play, global leader in wireless M2M and connected device solutions.
Over the past few years, our growth and investment strategy has been focused on the long-term Machine-to-Machine (“M2M”) opportunity. We believe in the vision of a connected world where, in the fullness of time, every device that can deliver value from being connected, will be connected — from cars, computers and energy meters to coffee machines, nearly everything will be connected and together will form the ‘Internet of Things’.
Our strategy is to be the key enabler in this market, and we believe our strong focus on the opportunity is paying off. We are the global market share leader in embedded wireless modules for M2M applications and we have successfully expanded our position in the M2M value chain. In addition to embedded wireless modules, we offer intelligent M2M gateways, as well as secure M2M cloud services that allow us to capture more value from each connected device.
The AirCard divestiture enables Sierra Wireless to accelerate our strategy to drive profitable growth and value creation in M2M. It increases our focus, unlocks significant value from an underappreciated asset, and provides the capital required to invest in strategic acquisitions.
For 2012, I am pleased to report that the go-forward, M2M-focused business of Sierra Wireless performed strongly. Revenue and profitability from continuing operations (excluding the AirCard business) improved significantly compared to 2011. Revenue grew to $397.3 million, up 19% from $333.2 million in 2011, continuing a solid trend that has seen our continuing operations grow at an annual rate of 27% since 2008. Non-GAAP earnings from operations were positive at $0.9 million for the full year, and improved every quarter to reach $3.7 million in Q4 2012.
During the year, we also made significant progress on strategic initiatives. The acquisition of the M2M business of Sagemcom in August significantly bolstered our leading market share position and added products to our portfolio, while opening up new distribution channels and markets. New design wins in key target segments, such as automotive, energy, networking and point-of-sale, combined with broad-based demand, indicate solid potential for on-going revenue growth. The launch of new products — including the next generation AirVantage™ M2M Cloud, new 4G LTE AirPrime™ embedded wireless modules, and the AirLink™ GX440 4G LTE rugged gateway certified on both Verizon and AT&T — continues to put us at the forefront of industry innovation, a position that drives strong competitive advantages.
Looking forward, I am excited about the future of Sierra Wireless.
We see a number of market forces converging to drive growth in demand. The price of connectivity is declining and the speed of wireless networks is approaching, and in some cases even outpacing, fixed connections. Furthermore, organizations are becoming more aware of the benefits of connecting devices to their corporate enterprise, and large ecosystem enablers, such as mobile network operators, are increasingly focused on the M2M growth opportunity. We believe these market forces and trends are driving awareness and stimulating demand for M2M solutions.
Sierra Wireless is exceptionally well positioned to capture the M2M growth opportunity. We are the clear global leader in wireless solutions for M2M. We have an extensive blue-chip customer base, spread across many industry segments and even more applications. We are the leading innovator with a broad, cutting-edge product portfolio and unique device-to-cloud offerings. Our continuing business has significant scale, shipping at a pace of over 11 million units per year and generating more than $400 million in annualized revenue. We have global capability, with sales and support around the world and R&D facilities on three continents. We have a great team and significant investment capacity.
In short, all the elements are in place to drive profitable growth and to build on our industry leadership in M2M and connected device solutions, creating value for all stakeholders in 2013 and beyond. I thank you for your continued confidence and look forward to reporting to you on our achievements in the coming year.

Jason W. Cohenour
President and Chief Executive Officer
Cautionary Note Regarding Forward-Looking Statements
Certain statements in this letter constitute forward-looking statements or forward-looking information and, in this regard, you should read carefully the “Cautionary Note Regarding Forward-Looking Statements” in the attached Management’s Discussion & Analysis.
MANAGEMENT’S DISCUSSION AND ANALYSIS
Table of Contents
MANAGEMENT’S DISCUSSION AND ANALYSIS | 4 |
CAUTIONARY NOTE REGARDING FORWARD LOOKING STATEMENTS | 5 |
OVERVIEW | 6 |
Business Overview | 6 |
Strategy | 7 |
Annual Overview - Financial Highlights | 8 |
Outlook | 13 |
Disposition of AirCard Business | 14 |
CONSOLIDATED ANNUAL RESULTS OF OPERATIONS | 16 |
Year ended December 31, 2012 Compared to Year Ended December 31, 2011 | 16 |
Year ended December 31, 2011 Compared to Year Ended December 31, 2010 | 19 |
SEGMENTED INFORMATION | 22 |
FOURTH QUARTER OVERVIEW | 23 |
SUMMARY OF QUARTERLY RESULTS OF OPERATIONS | 24 |
LIQUIDITY AND CAPITAL RESOURCES | 26 |
NON-GAAP FINANCIAL MEASURES | 29 |
OFF-BALANCE SHEET ARRANGEMENTS | 31 |
TRANSACTIONS BETWEEN RELATED PARTIES | 31 |
CRITICAL ACCOUNTING POLICIES AND ESTIMATES | 32 |
OUTSTANDING SHARE DATA | 38 |
IMPACT OF ACCOUNTING PRONOUNCEMENTS AFFECTING FUTURE PERIODS | 38 |
DISCLOSURE CONTROLS | 38 |
INTERNAL CONTROL OVER FINANCIAL REPORTING | 39 |
LEGAL PROCEEDINGS | 40 |
RISKS AND UNCERTAINTIES | 43 |
MANAGEMENT’S DISCUSSION AND ANALYSIS OF
FINANCIAL CONDITION AND RESULTS OF OPERATIONS
The following Management’s Discussion and Analysis of Financial Condition and Results of Operations (“MD&A”) provides information for the year ended December 31, 2012, and up to and including March 7, 2013. This MD&A should be read together with our audited consolidated financial statements and the accompanying notes for the year ended December 31, 2012 (“the consolidated financial statements”). The consolidated financial statements have been prepared in accordance with generally accepted accounting principles in the United States (“U.S. GAAP”). Except where otherwise specifically indicated, all amounts in this MD&A are expressed in United States dollars.
We have prepared this MD&A with reference to National Instrument 51-102 “Continuous Disclosure Obligations” of the Canadian Securities Administrators. Under the U.S./Canada Multijurisdictional Disclosure System, we are permitted to prepare this MD&A in accordance with the disclosure requirements of Canada, which requirements are different than those of the United States.
Certain statements in this MD&A constitute forward-looking statements or forward-looking information within the meaning of applicable securities laws. You should carefully read the cautionary note in this MD&A regarding forward-looking statements and should not place undue reliance on any such forward-looking statements. See “Cautionary Note Regarding Forward-Looking Statements”.
Throughout this document, references are made to certain non-GAAP financial measures that are not measures of performance under U.S. GAAP. Management believes that these non-GAAP financial measures provide useful information to investors regarding the Company’s financial condition and results of operations as they provide additional measures of its performance. These non-GAAP financial measures do not have any standardized meaning prescribed by U.S. GAAP and are therefore unlikely to be comparable to similar measures presented by other issuers. These non-GAAP financial measures are defined and reconciled to their nearest GAAP measure in “Non-GAAP Financial Measures”.
Additional information about the Company, including our most recent consolidated financial statements and our Annual Information Form, is available on our website at www.sierrawireless.com, or on SEDAR at www.sedar.com and on EDGAR at www.sec.gov.
Cautionary Note Regarding Forward-looking Statements
Certain statements and information in this MD&A are not based on historical facts and constitute forward-looking statements or forward-looking information within the meaning of the U.S. Private Securities Litigation Reform Act of 1995 and Canadian securities laws (“forward-looking statements”), including our business outlook for the short and longer term and our strategy, plans and future operating performance. Forward-looking statements are provided to help you understand our views of our short and longer term prospects. We caution you that forward-looking statements may not be appropriate for other purposes. We will not update or revise our forward-looking statements unless we are required to do so by securities laws. Forward-looking statements:
· Typically include words and phrases about the future such as “outlook”, “may”, “estimates”, “intends”, “believes”, “plans”, “anticipates” and “expects”;
· Are not promises or guarantees of future performance. They represent our current views and may change significantly;
· Are based on a number of material assumptions, including those listed below, which could prove to be significantly incorrect:
· Our ability to develop, manufacture and sell new products and services that meet the needs of our customers and gain commercial acceptance;
· Our ability to continue to sell our products and services in the expected quantities at the expected prices and expected times;
· Expected cost of goods sold;
· Expected component supply constraints;
· Our ability to “win” new business;
· Expected deployment of next generation networks by wireless network operators;
· Our operations are not adversely disrupted by component shortages or other development, operating or regulatory risks; and
· Expected tax rates and foreign exchange rates.
· Are subject to substantial known and unknown material risks and uncertainties. Many factors could cause our actual results, achievements and developments in our business to differ significantly from those expressed or implied by our forward-looking statements, including, without limitation, the following factors which are discussed in greater detail under “Risks and Uncertainties” and in our other regulatory filings with the U.S. Securities and Exchange Commission (the “SEC”) in the United States and the provincial securities commissions in Canada.
· We may experience higher than anticipated costs; disruption of, and demands on, our ongoing business; diversion of management’s time and attention; adverse effects on existing business relationships with suppliers and customers and employee issues in connection with the divestiture of the AirCard assets and operations;
· Actual sales volumes or prices for our products and services may be lower than we expect for any reason including, without limitation, continuing uncertain economic conditions, price and product competition, different product mix, the loss of any of our significant customers, or competition from new or established wireless communication companies;
· The cost of products sold may be higher than planned or necessary component supplies may not be available, are delayed or are not available on commercially reasonable terms;
· We may be unable to enforce our intellectual property rights or may be subject to litigation that has an adverse outcome;
· The development and timing of the introduction of our new products may be later than we expect or may be indefinitely delayed; and
· Transition periods associated with the migration to new technologies may be longer than we expect.
Investors are cautioned not to place undue reliance on these forward-looking statements. No forward-looking statement is a guarantee of future results.
OVERVIEW
On January 28, 2013, we announced a definitive agreement for the sale of substantially all of the assets and operations related to our AirCard business. The transaction is expected to close in early April 2013, subject to customary closing conditions.
In accordance with U.S. GAAP, assets and liabilities associated with the sale have been recorded as “held for sale” in our consolidated balance sheet as at December 31, 2012 and the results of operations of the AirCard business as discontinued operations in our consolidated statements of operations for the three years ended December 31, 2012. The selected financial information has been retrospectively adjusted to reflect the presentation of the AirCard business as discontinued operations (refer to the section on “Disposition of AirCard business”).
Business Overview
Sierra Wireless Inc. (“Sierra Wireless” or the “Company”) is a global leader in wireless technology and solutions for the machine-to-machine (“M2M”) and connected device markets. We offer a comprehensive portfolio of value added wireless devices and related software products that dramatically simplify the integration of wireless communications and enable customers to more easily build, deploy and operate their M2M applications.
Our continuing business includes our AirPrime™ Embedded Wireless Modules, AirLink™ Intelligent Gateways, and AirVantage™ M2M Cloud products. Effective August 1, 2012, our continuing business also includes the M2M business that we acquired from Sagemcom (refer to the section on “Acquisition of M2M business of Sagemcom”). Sagemcom products are part of the AirPrime portfolio.
· AirPrime Embedded Wireless Modules - AirPrime Embedded Wireless Modules are used to wirelessly enable products and solutions made by our OEM customers. Our M2M OEM customers cover a broad range of industries, including automotive, networking equipment, energy, security, sales and payment, industrial control and monitoring, fleet management, field service, healthcare, and consumer electronics. Our PC OEM customers integrate AirPrime modules into notebooks, tablets, and other mobile computing devices, to provide mobile broadband connectivity. The AirPrime product portfolio spans 2G, 3G and 4G LTE technologies and includes robust remote device management capability, as well as supports on-board embedded applications with the OpenATÒ Application Framework.
· AirLink Intelligent Gateways - AirLink Intelligent Gateways are rugged, industrial-grade wireless terminals for M2M and mobile applications. They are designed for use in mission critical deployments, where reliability and security are essential, and are sold to public safety, transportation, field service, energy, industrial, and financial organizations around the world. The AirLink product portfolio includes 2G, 3G and 4G LTE terminals, supported by cloud-based remote device management tools. AirLink gateways can be easily configured for almost any type of application, and also support on-board embedded applications with the ALEOS Application Framework.
· AirVantage M2M Cloud - The AirVantage M2M Cloud provides a secure, scalable, device-to-cloud infrastructure for M2M applications. The AirVantage Enterprise Platform can be used to collect, transmit, and store machine data, and process and schedule events, from any number of devices, across any network operator around the world. M2M solution developers can use the latest cloud API standards to quickly integrate that machine data with their own enterprise applications and back-end systems. The AirVantage Management Service can be used to centrally deploy and monitor M2M devices, including configuring device settings, delivering firmware and embedded application updates, and administering airtime subscriptions across global networks making managing a million wireless devices as easy as managing ten.
Strategy
According to Machina Research, an independent research firm, the number of connected devices in operation was 1.4 billion in 2011. This number is expected to grow significantly in the coming years to over 12 billion by 2020. Adoption of M2M and connected device solutions is driven by a number of enablers, such as lower wireless connectivity costs, higher wireless connection speeds, new devices and tools to simplify development of M2M applications, and increased focus and investment from network operators, infrastructure vendors and other wireless ecosystem players. Key benefits for customers deploying M2M solutions, such as the ability to generate new revenue streams, improve cost efficiencies through remote access to data, gather important customer and market intelligence, as well as regulatory and security requirements, are also driving demand for M2M connectivity.
Management believes these factors create a substantial growth opportunity for the Company. We are the global market share leader in M2M embedded devices today, with 34% of the global M2M embedded wireless module market (source: ABI Research, 2011). Going forward, we plan to build on this leadership position and expand our business across the value chain in M2M and connected device solutions. We intend to:
· Complete our transformation into a pure play leader in M2M and connected device solutions;
· Maintain our leadership position as we continue to innovate — making it easier, faster, and cheaper for our customers to build, deploy and manage their M2M solutions;
· Drive organic revenue growth and improve profitability by leveraging our cost structure;
· Build on organic investments in the development of value-added services and solutions to provide more value to customers and improve margins; and
· Accelerate revenue and profitability growth through an active acquisition strategy focused on M2M opportunities.
Annual Overview — Financial highlights
Revenue and profitability in 2012 improved significantly compared to 2011. This was primarily driven by significant growth in M2M sales, including contribution from the M2M business of Sagemcom acquired on August 1, 2012, and strong growth in sales to PC OEMs. This revenue growth, combined with improved gross margins due to product cost reductions and favourable shifts in product mix, drove the significant improvement in profitability year-over-year.
Financial highlights for year ended December 31, 2012:
Continuing operations
· Revenue of $397.3 million, up 19.3%, compared to $333.2 million in 2011
· Gross margin improved to 31.5% in 2012, compared to 30.5% in 2011
· Non-GAAP operating earnings were $0.9 million, up from a loss of $22.4 million in 2011
Continuing and discontinued operations
· Revenue was $644.2 million, 11.4% year-over-year growth
· Non-GAAP operating earnings were $36.3 million, up significantly from $2.9 million in 2011
· Net earnings of $27.2 million and diluted earnings per share of $0.88, improved significantly from net loss of $29.3 million and loss per share of $0.94 in 2011. Net earnings, including discontinued operations, in 2012 included a favorable income tax adjustment associated with the pending sale of the AirCard business. Net loss in 2011 included an asset impairment charge of $11.2 million related to a write-down of an intangible asset.
· Non-GAAP net earnings of $33.4 million, or $1.08 per diluted share, in 2012, up from $3.6 million, or $0.12 per diluted share, in 2011
· Cash flow from operations of $40.5 million in 2012, up from $23.7 million in 2011

Selected Annual Financial information:
(in thousands of U.S. dollars, except where otherwise stated) |
| 2012 |
| 2011 (2) |
| 2010 (2) |
| |||
|
|
|
|
|
|
|
| |||
Statement of Operations data: |
|
|
|
|
|
|
| |||
Revenue (GAAP and Non-GAAP) |
| $ | 397,321 |
| $ | 333,175 |
| $ | 358,005 |
|
|
|
|
|
|
|
|
| |||
Gross Margin |
|
|
|
|
|
|
| |||
- GAAP |
| $ | 125,274 |
| $ | 101,740 |
| $ | 121,406 |
|
- Non-GAAP (1) |
| 125,578 |
| 102,125 |
| 121,897 |
| |||
|
|
|
|
|
|
|
| |||
Gross Margin % |
|
|
|
|
|
|
| |||
- GAAP |
| 31.5 | % | 30.5 | % | 33.9 | % | |||
- Non-GAAP (1) |
| 31.6 | % | 30.7 | % | 34.0 | % | |||
|
|
|
|
|
|
|
| |||
Earnings (loss) from operations |
|
|
|
|
|
|
| |||
- GAAP |
| $ | (22,206 | ) | $ | (54,253 | ) | $ | (42,717 | ) |
- Non-GAAP (1) |
| 898 |
| (22,390 | ) | (10,904 | ) | |||
|
|
|
|
|
|
|
| |||
Net earnings (loss) from continuing operations |
|
|
|
|
|
|
| |||
- GAAP |
| $ | (4,202 | ) | $ | (50,710 | ) | $ | (34,973 | ) |
- Non-GAAP (1) |
| (444 | ) | (18,681 | ) | (1,206 | ) | |||
|
|
|
|
|
|
|
| |||
Net earnings from discontinued operations |
|
|
|
|
|
|
| |||
- GAAP |
| $ | 31,401 |
| $ | 21,338 |
| $ | 20,174 |
|
- Non-GAAP (1) |
| 33,796 |
| 22,289 |
| 21,125 |
| |||
|
|
|
|
|
|
|
| |||
Net earnings (loss) attributable to the Company |
|
|
|
|
|
|
| |||
- GAAP |
| $ | 27,199 |
| $ | (29,315 | ) | $ | (14,541 | ) |
- Non-GAAP (1) |
| 33,352 |
| 3,633 |
| 19,996 |
| |||
|
|
|
|
|
|
|
| |||
Share and per share data: |
|
|
|
|
|
|
| |||
Basic and diluted earnings (loss) per share (in dollars) - GAAP |
|
|
|
|
|
|
| |||
- GAAP |
| $ | 0.88 |
| $ | (0.94 | ) | $ | (0.47 | ) |
- Non-GAAP (1) |
| $ | 1.08 |
| $ | 0.12 |
| $ | 0.64 |
|
|
|
|
|
|
|
|
| |||
Common shares (in thousands) |
|
|
|
|
|
|
| |||
At period-end |
| 30,592 |
| 31,307 |
| 31,223 |
| |||
Weighed average - basic and diluted |
| 30,788 |
| 31,275 |
| 31,083 |
| |||
|
|
|
|
|
|
|
| |||
Balance sheet data: |
|
|
|
|
|
|
| |||
Cash and cash equivalents and short-term investments |
| $ | 63,646 |
| $ | 110,722 |
| $ | 111,848 |
|
Total assets |
| 464,763 |
| 422,887 |
| 469,568 |
| |||
Total long-term liabilities |
| 26,826 |
| 25,379 |
| 26,130 |
| |||
(1) Non-GAAP results exclude the impact of stock-based compensation expense, acquisition amortization, impairment, acquisition and disposition costs, integration costs, restructuring costs, foreign exchange gains or losses on foreign currency contracts and translation of balance sheet accounts, and certain tax adjustments. Refer to the section on “Non-GAAP financial measures” for additional details.
(2) Selected financial information for fiscal years 2011 and 2010 have been retrospectively adjusted to reflect the presentation of the AirCard business as discontinued operations.
See discussion under “Consolidated Annual Results of Operations” for factors that have caused period to period variations.
Acquisition of M2M business of Sagemcom
On August 1, 2012, we completed the acquisition of the M2M business of Sagemcom. The acquisition included the purchase of substantially all of the assets of the M2M business of Sagemcom for €44.9 million ($55.2 million) in cash consideration plus assumed liabilities of €3.9 million ($4.8 million).
Sagemcom is a France-based technology company active in broadband, telecom, energy, and document management. Its M2M business included 2G and 3G wireless modules, as well as industry-leading rugged terminals for railway applications. This acquisition extends our global leadership position in the growing M2M market as it provides us with a significantly enhanced market position in key segments, including payment, transportation and railways, as well as new geographical expansion into Brazil.
The acquired business’ results of operations and estimated fair value of assets acquired and liabilities assumed have been included in our consolidated financial statements from the date of acquisition, August 1, 2012. The M2M business of Sagemcom contributed $20.1 million to our consolidated revenues during 2012.
Closure of Newark, California facility
Our Newark, California facility was closed, effective December 31, 2012, to drive greater efficiency and leverage. Our AirLink marketing, research and development, and customer support activities were transferred primarily to our Richmond, British Columbia facilities and our manufacturing facilities were transferred to our manufacturing partners in Suzhou, China. We recorded $2.0 million in total severance and other costs associated with this initiative during 2012.
Other key business highlights for the year ended December 31, 2012 include:
AirPrime Embedded Wireless Modules
· We announced that PSA Peugeot Citroen, in collaboration with Bouygues Telecom, selected the Company to provide an innovative 3G USB key that powers the new Peugeot Connect Apps system. Designed specifically for automotive use, this key incorporates 3G wireless connectivity, global positioning, and advanced processing capabilities in a compact, plug-and-play form factor. When the 3G key is plugged into the vehicle, it provides the driver with real-time information on traffic conditions, weather, and navigation, as well as information about services nearby.
· We announced the availability of the industry leading Open AT Application Framework, which is used in millions of our 2G products, on select 3G AirPrime embedded wireless modules, including the SL808x. This allows customers to build M2M application software once and deploy it in nearly any market worldwide on 2G or 3G networks — significantly lowering overall system cost and accelerating time to market.
· We announced the launch of the AirPrime Q2698 embedded wireless module, an important addition to the AirPrime Q Series. The AirPrime Q2698 provides our AirPrime Q Series customers
with a seamless migration path from 2G to 3G, using the same hardware platform and embedded applications they had developed for earlier products. In addition, the AirPrime Q2698 is compatible with networks worldwide, making it ideal for global deployments.
· We introduced the AirPrime SL9090, a new, multimode product in the AirPrime SL Series of compact, industrial-grade embedded wireless modules. The multimode module gives device manufacturers the ability to operate on networks that use either HSPA+ or EV-DO cellular standards with a single product design. It is designed for use in fixed or mobile M2M deployments in the industrial, field service, energy, networking and transportation sectors. It has design and operational characteristics that make it particularly well-suited for use in harsh environments. In December, the AirPrime SL9090 was named among the Best of 2012 by Electronics Design Magazine.
· We introduced our second generation of 4G LTE AirPrime embedded wireless modules for notebooks, ultraportable notebooks, and tablets. The six new additions to the AirPrime MC Series and EM Series support 4G LTE networks worldwide and are compatible with the Windows® 8 operating system. All of the new MC and EM Series modules are optimized for low power consumption, to enable longer battery life in their host devices. The AirPrime EM7355, AirPrime EM7305, and AirPrime EM7330 are the first AirPrime modules built to the new PCI Express M.2 module standard, making them even thinner and smaller than the AirPrime EM7700 module introduced earlier in the year. Each module offers multi-operator LTE support with sets of frequency bands for specific regions — one for North America, one for EMEA and Australia, and one for Japan.
· We unveiled the world’s thinnest 4G LTE embedded wireless module. The AirPrime EM7700 is only 2.5 millimeters thick and is designed for use in ultraportable notebooks, tablets, and other devices where thickness is a critical design constraint. We are working with leading OEMs to integrate the AirPrime EM7700 into a variety of connected devices.
· Panasonic Corporation selected our AirPrime MC series embedded wireless modules to provide 4G LTE mobile-broadband connectivity for its new rugged Toughpad A1 tablet in North America.
· Beeldhorloge (Timer B.V.), based in the Netherlands, selected our AirPrime embedded wireless module to provide wireless connectivity for its Pictowatch, which is designed to assist individuals with cognitive disorders in managing daily routines.
AirLink Intelligent Gateways
· We announced that our AirLink GX440 4G LTE rugged wireless gateway received certification on both the Verizon 4G LTE and AT&T 4G LTE networks. The AirLink GX440 delivers the durability and high bandwidth required by applications such as high-quality wireless video surveillance, multi-data stream connections to branch locations, and mobile office applications for public safety and field service activities.
· We released the ALEOS Application Framework, which enables our customers to create customized embedded applications that run on AirLink intelligent gateways. Available first in our AirLink GX400 and AirLink GX440 gateways, the ability to run applications directly on the AirLink devices provides important cost and operational advantages for our customers.
AirVantage M2M Cloud Platform
· We launched the next-generation of our AirVantage M2M Cloud, a faster, more cost-effective way to build, deploy, and manage large M2M applications. The AirVantage M2M Cloud provides secure two-way communication between connected devices and the enterprise, enabling innovation in products, services, and revenue streams. In conjunction with this new release of AirVantage, we joined the Amazon Web Services Partner Network as an APN Technology Partner. This collaboration with Amazon will make it easy for customers to use the AirVantage APIs to build M2M applications that run seamlessly on the Amazon Web Services cloud infrastructure. The joint solution eliminates the need for any on-premise IT infrastructure and further accelerates time-to-market and improving scalability.
· We announced that Nestle Nespresso SA, the pioneer and market leader in high-quality portioned premium coffee, selected Sierra Wireless to provide a comprehensive M2M cloud platform and hardware solution for remote connectivity and monitoring within its range of professional coffee machines.
· We have successfully integrated AirVantage subscription management with eight additional network operators during the year, enabling multi-operator provisioning on a global basis. Through a common interface, our customers can securely access each operator’s activation infrastructure to perform activation/deactivation, billing plan management and subscription life cycle management for their M2M solution.
Outlook
In the first quarter of 2013, we expect revenue to be down sequentially following the exceptionally strong fourth quarter of 2012. We expect gross margin to be similar or slightly lower than fourth quarter 2012 levels, and operating expenses to increase as a result of higher new product certification costs combined with the negative impact of a strengthening Euro. Looking forward to the second quarter of 2013, we expect a return to solid sequential and year-over-year revenue growth and modest profitability. As a result of the expected sale of the AirCard business, Sierra Wireless will have a cost structure to support higher revenue levels. Management believes operating expenses should change relatively little as our revenue grows, resulting in improved profitability.
Macroeconomic pressure in Europe continues to dampen near-term growth in our M2M business. However, we continue to believe that the market for wireless M2M and connected devices solutions has strong growth prospects. We anticipate strong growth in the number and type of devices being wirelessly connected, driven by a number of enablers, such as lower wireless connectivity costs, higher wireless connection speeds, new devices and tools to simplify development of M2M applications, and increased focus and investment from network operators, infrastructure vendors and other wireless ecosystem players. More importantly, we see strong customer demand in many of our target verticals driven by increasing recognition of the value created by deploying M2M solutions, such as new revenue streams, improve cost efficiencies, and better customer insight.
Key factors that we expect will affect our results in the near term are the strong competitive position of our products in the market; the timely ramp up of sales of our new products recently launched or currently under development; the level of success our OEM customers achieve with sales of embedded solutions to end users; our ability to secure future design wins with both existing and new customers; wireless technology transitions and the timing of deployment of mobile broadband networks by wireless operators; the availability of components from key suppliers; general economic conditions in the markets
we serve; and seasonality in demand. We expect that product and price competition from other wireless device manufacturers will continue to play a role in the M2M embedded wireless module market. As a result of these factors, we may experience volatility in our results on a quarter to quarter basis. Gross margin percentage may fluctuate from quarter to quarter depending on product and customer mix, competitive selling prices and product costs.
Disposition of AirCard Business
On January 28, 2013, we announced a definitive agreement for the sale of substantially all of the assets and operations related to our AirCard business to Netgear, Inc. (“Netgear”) for $138 million in cash plus assumed liabilities. Netgear is a leading global provider of networking products for the home, businesses and operators. We expect to realize net cash proceeds of approximately $100 million from the divesture after related taxes, expenses and retention for the purposes of indemnification. The transaction is expected to close in early April 2013, subject to customary closing conditions. Approximately 160 employees, primarily in sales, marketing and research and development, will be transferred to Netgear, as well as certain facilities in Carlsbad, California and Richmond, British Columbia.
In accordance with U.S. GAAP, assets and liabilities associated with the sale have been recorded as “held for sale” in our consolidated balance sheet as at December 31, 2012 and the results of operations of the AirCard business as discontinued operations in our consolidated statements of operations for the three years ended December 31, 2012. The historical consolidated statements of operations and related selected financial information have been retrospectively adjusted to distinguish between continuing operations and discontinued operations.
Summarized results from discontinued operations for the years ended December 31 were as follows:
|
| 2012 |
| 2011 |
| 2010 |
| |||
Revenue |
| $ | 246,845 |
| $ | 245,010 |
| $ | 292,336 |
|
Cost of goods sold |
| 177,147 |
| 183,300 |
| 223,377 |
| |||
Gross margin |
| $ | 69,698 |
| $ | 61,710 |
| $ | 68,959 |
|
Gross margin % |
| 28.2 | % | 25.2 | % | 23.6 | % | |||
Expenses |
| 36,653 |
| 37,368 |
| 36,608 |
| |||
Earnings from operations |
| 33,045 |
| 24,342 |
| 32,351 |
| |||
Net earnings from discontinued operations |
| $ | 31,401 |
| $ | 21,338 |
| $ | 20,174 |
|
During the year ended December 31, 2012, Sprint and AT&T each accounted for more than 10% of our aggregated revenue, from continuing and discontinued operations, and on a combined basis, accounted for 25% of the aggregated revenue. During the year ended December 31, 2011, Sprint, AT&T and Telstra each accounted for more than 10% of our aggregated revenue, from continuing and discontinued operations, and on a combined basis, accounted for 36% of the aggregated revenue.
Key business highlights for discontinued operations for the year ended December 31, 2012 include:
AirCard® Mobile Broadband Devices
· We introduced our newest family of AirCard mobile hotspots for 4G LTE networks in early 2012. The new AirCard 760S, AirCard 762S, and AirCard 763S offer several feature enhancements to earlier generations, including an improved user interface, longer battery life, and expanded frequency band support across the product family, providing compatibility with most common frequency band combinations around the world. These hotspots are now available from Telstra in Australia, NetIndex in Japan, Rogers and Bell in Canada, as well as DNA in Finland.
· We launched the Sierra Wireless 4G LTE Tri-Fi Hotspot launched on the Sprint network. The 4G LTE Tri-Fi is the first and only mobile hotspot to support 4G LTE, 4G WiMAX, and 3G EVDO.
CONSOLIDATED ANNUAL RESULTS OF OPERATIONS
|
| 2012 |
| 2011 (1) |
| 2010 (1) |
| ||||||
(in thousands of U.S. dollars, except where otherwise stated) |
| $ |
| % of |
| $ |
| % of |
| $ |
| % of |
|
|
|
|
|
|
|
|
|
|
|
|
|
|
|
Revenue |
| 397,321 |
| 100.0 | % | 333,175 |
| 100.0 | % | 358,005 |
| 100.0 | % |
Cost of goods sold |
| 272,047 |
| 68.5 | % | 231,435 |
| 69.5 | % | 236,599 |
| 66.1 | % |
Gross margin |
| 125,274 |
| 31.5 | % | 101,740 |
| 30.5 | % | 121,406 |
| 33.9 | % |
|
|
|
|
|
|
|
|
|
|
|
|
|
|
Expenses |
|
|
|
|
|
|
|
|
|
|
|
|
|
Sales and marketing |
| 37,067 |
| 9.3 | % | 37,188 |
| 11.2 | % | 42,472 |
| 11.9 | % |
Research and development |
| 61,785 |
| 15.6 | % | 60,903 |
| 18.3 | % | 60,890 |
| 17.0 | % |
Administration |
| 32,777 |
| 8.2 | % | 33,716 |
| 10.1 | % | 36,021 |
| 10.1 | % |
Acquisition |
| 3,182 |
| 0.8 | % | — |
| 0.0 | % | — |
| 0.0 | % |
Restructuring |
| 2,251 |
| 0.6 | % | 837 |
| 0.2 | % | 7,640 |
| 2.1 | % |
Integration |
| — |
| 0.0 | % | 1,426 |
| 0.4 | % | 5,110 |
| 1.4 | % |
Impairment of intangible asset |
| — |
| 0.0 | % | 11,214 |
| 3.4 | % | — |
| — |
|
Amortization |
| 10,418 |
| 2.6 | % | 10,709 |
| 3.2 | % | 11,990 |
| 3.3 | % |
|
| 147,480 |
| 37.1 | % | 155,993 |
| 46.8 | % | 164,123 |
| 45.8 | % |
Loss from operations |
| (22,206 | ) | -5.6 | % | (54,253 | ) | -16.3 | % | (42,717 | ) | -11.9 | % |
Foreign exchange gain (loss) |
| 3,326 |
|
|
| (460 | ) |
|
| (7,000 | ) |
|
|
Other income (expense) |
| (196 | ) |
|
| 35 |
|
|
| (241 | ) |
|
|
Loss before income taxes |
| (19,076 | ) |
|
| (54,678 | ) |
|
| (49,958 | ) |
|
|
Income tax recovery |
| (14,874 | ) |
|
| (3,968 | ) |
|
| (14,985 | ) |
|
|
Net loss from continuing operations |
| (4,202 | ) |
|
| (50,710 | ) |
|
| (34,973 | ) |
|
|
|
|
|
|
|
|
|
|
|
|
|
|
|
|
Net earnings from discontinued operations |
| 31,401 |
|
|
| 21,338 |
|
|
| 20,174 |
|
|
|
Net earnings (loss) |
| 27,199 |
|
|
| (29,372 | ) |
|
| (14,799 | ) |
|
|
Less: non-controlling interest |
| — |
|
|
| (57 | ) |
|
| (258 | ) |
|
|
Net earnings (loss) attributable to the Company |
| 27,199 |
|
|
| (29,315 | ) |
|
| (14,541 | ) |
|
|
Net earnings (loss) per share attributable to the Company |
|
|
|
|
|
|
|
|
|
|
|
|
|
Basic and diluted (in dollars) |
| 0.88 |
|
|
| (0.94 | ) |
|
| (0.47 | ) |
|
|
(1) Financial information for fiscal years 2011 and 2010 has been retrospectively adjusted to reflect the presentation of the AirCard business as discontinued operations.
Year Ended December 31, 2012 Compared to Year Ended December 31, 2011
Revenue
Revenue for the year ended December 31, 2012 was $397.3 million, compared to $333.2 million for the year ended December 31, 2011. The 19.3 percent year-over-year revenue increase was driven by significant growth in M2M sales, including a $20.1 million contribution from the recently acquired M2M business of Sagemcom, along with strong growth in sales to PC OEMs.
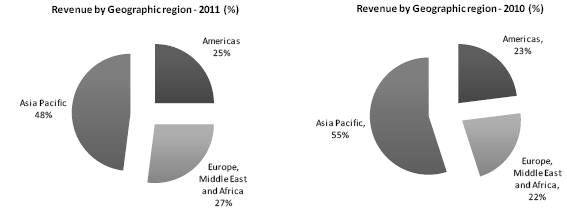
Our M2M business has a considerable revenue base in Europe and while we have experienced weakness in our European sales, revenues from other regions, particularly Asia and the Americas, have been rising.
Our geographic revenue mix for the years ended December 31, 2012 and 2011 was as follows:

Gross margin
Gross margin was 31.5% of revenue for the year ended December 31, 2012, compared to gross margin of 30.5% of revenue in 2011. The increase in gross margin was primarily related to product cost reductions, favorable product mix, and higher than average gross margin contribution from the M2M business of Sagemcom. Gross margin included $0.3 million of stock-based compensation expense in 2012 compared to $0.4 million in 2011.
Sales and marketing
Sales and marketing expenses decreased $0.1 million, or 0.3%, to $37.1 million in 2012, compared to 2011. Sales and marketing expenses included $1.2 million of stock-based compensation expense in 2012 compared to $1.1 million in 2011.
Research and development
Research and development (“R&D”) expenses increased by $0.9 million, or 1.4%, to $61.8 million in 2012, compared to 2011. The increase in R&D expenses was primarily related to the additional R&D expenses we incurred as a result of the Sagemcom acquisition, partially offset by the positive impact of foreign exchange rates.
R&D expenses in 2012 included stock-based compensation expense of $1.3 million and acquisition amortization of $5.6 million. R&D expenses in 2011 included stock-based compensation expense of $1.1 million and acquisition amortization of $6.9 million.
Administration
Administration expense decreased by $0.9 million, or 2.8%, in 2012, compared to 2011. Administration expenses included stock-based compensation expense of $3.0 million and $2.9 million in 2012 and 2011, respectively.
Acquisition
Acquisition costs related to the acquisition of the M2M business of Sagemcom were $3.2 million during 2012. Acquisition costs in 2011 were $nil.
Restructuring
Restructuring costs were $2.3 million in 2012 compared to $0.8 million in 2011. Restructuring costs in 2012 related primarily to the closure of our Newark, California facility. Restructuring costs in 2011 represented the additional costs incurred for reductions related to the new organizational structure announced in September 2010.
Integration costs
Integration costs were $nil during 2012, compared to $1.4 million in 2011. Integration costs in 2011 were primarily related to office space optimization in France.
Impairment of intangible asset
Impairment of intangible asset was $nil during 2012 compared to $11.2 million in 2011. The impairment charge in 2011 primarily related to a software development program we acquired through the acquisition of Wavecom, S.A. (“Wavecom”) which we abandoned in 2011.
Amortization
Amortization expense decreased by $0.3 million, or 2.7%, in 2012 compared to 2011. Amortization expense in 2012 included $6.3 million of acquisition amortization compared to $6.0 million in 2011.
Foreign exchange gain (loss)
Foreign exchange gain was $3.3 million in 2012 compared to foreign exchange loss of $0.5 million in 2011. Foreign exchange gain in 2012 included a net foreign exchange gain of $2.7 million on revaluation of an intercompany loan to a self-sustaining subsidiary and a loss of $1.8 million related to the settlement of foreign currency forward exchange contracts that we had entered into in connection with the acquisition of the M2M business of Sagemcom.
Foreign exchange rate changes also impacted our Euro and Canadian dollar denominated revenue and operating expenses. We estimate that changes in exchange rates between 2011 and 2012 negatively impacted our 2012 revenues by approximately $2.4 million. We estimate that the favorable impact on operating expenses during 2012 was approximately $3.6 million.
Income tax recovery
Income tax recovery increased by $10.9 million in 2012 compared to 2011, primarily driven by the recognition of certain tax assets that will be realizable as a result of the sale of the AirCard business.
Net loss from continuing operations
Net loss from continuing operations improved by $46.5 million to a net loss of $4.2 million in 2012, compared to 2011. This improvement reflects the positive impact of higher revenue and gross margin, combined with lower operating expenditures, as well as the impact of favorable foreign exchange and tax recoveries in 2012.
Net loss from continuing operations in 2012 included stock-based compensation expense of $5.8 million and acquisition amortization of $11.9 million. Net loss from continuing operations in 2011 included stock-based compensation expense of $5.5 million, acquisition amortization of $12.9 million, and an after-tax impairment charge of $11.2 million.
Net earnings (loss) attributable to the Company
Net earnings attributable to the Company increased by $56.5 million to net earnings of $27.2 million in 2012, compared to 2011. This increase reflects the increase in net earnings from continuing operations, combined with a $10.1 million increase in net earnings from discontinued operations.
Weighted average number of shares
The weighted average basic and diluted number of shares outstanding was 30.8 million for the year ended December 31, 2012, compared to 31.3 million for the year ended December 31, 2011.
The number of shares outstanding was 30.6 million at December 31, 2012, compared to 31.3 million at December 31, 2011. The reduction in number of shares outstanding was primarily due to purchases of 800,000 of the Company’s common shares on the Toronto Stock Exchange (“TSX”) and NASDAQ under our normal course issuer bid approved December 13, 2011.
Year Ended December 31, 2011 Compared to Year Ended December 31, 2010
Revenue
Revenue in 2011 decreased by $24.8 million, or 6.9% as a result of a significant reduction in embedded wireless module sales to Barnes & Noble for their e-book reader ($0.7 million in 2011 compared to $64.2 million in 2010). This was partially offset by continued growth in sales to PC OEMs and our core M2M business, excluding Barnes & Noble.
Our geographic revenue mix for the years ended December 31, 2011 and 2010 was as follows:
Gross margin
Gross margin was 30.5% of revenue for the year ended December 31, 2011, compared to 33.9% of revenue in 2010. The decrease in gross margin percentage was primarily related to product mix within our M2M business. Gross margin included $0.4 million of stock-based compensation expense in 2011, compared to $0.5 million in 2010.
Sales and marketing
Sales and marketing expenses decreased by $5.3 million, or 12.4%, and were 11.2% of revenue in 2011 compared to 11.9% in 2010. The decrease in sales and marketing expenses was due primarily to cost reduction initiatives, including the final stages of integration of Sierra Wireless and Wavecom. Sales and marketing expenses included $1.1 million of stock-based compensation expense in 2011, compared to $1.2 million in 2010.
Research and development
R&D expenses in 2011 were comparable to 2010 at $60.9 million. R&D expenses for 2011 included stock-based compensation expense of $1.1 million and acquisition amortization of $6.9 million, compared to stock-based compensation expense of $0.9 million and acquisition amortization of $6.3 million in 2010.
Administration
Administration expenses decreased by $2.3 million, or 6.4%, in 2011, compared to 2010. The decrease was primarily due to cost reduction initiatives that were implemented in 2011. Administration expenses included $2.9 million of stock-based compensation expense in each of 2011 and 2010.
Restructuring
Restructuring costs decreased by $6.8 million, or 89.0%, to $0.8 million during 2011, compared to 2010. Restructuring costs in 2011 primarily represented the additional costs incurred for reductions in our workforce resulting from the implementation of the new organizational structure announced in September 2010. Restructuring costs in 2010 were related to reductions in our workforce resulting from the September 2010 organizational structure change.
Integration costs
Integration costs decreased by $3.7 million, or 72.1%, in 2011 compared to 2010. Integration costs in 2011 were primarily related to office space optimization in France. Integration costs in 2010 included costs for the integration of our Enterprise Resource Planning (“ERP”) system and employees retained for integration activities.
Impairment of intangible asset
We recorded an $11.2 million impairment charge in 2011, primarily related to a software development program we acquired through the acquisition of Wavecom which we abandoned in 2011. The program was not part of the Company’s strategic plan and its termination had no impact on our future operations. There was no impairment charge recorded in 2010.
Amortization
Amortization expense decreased by $1.3 million or 10.7%, in 2011 compared to 2010. Amortization expense in 2011 included $6.0 million of acquisition amortization compared to $7.3 million in 2010.
Foreign exchange gain (loss)
Foreign exchange loss decreased by $6.5 million in 2011 to $0.5 million. Foreign exchange loss for 2011 included a net foreign exchange loss of $0.1 million on intercompany balances. Foreign exchange loss for 2010 included a loss of $4.7 million on an intercompany balance that the parent company had with its self-sustaining foreign operations that arose as a result of the Wavecom acquisition.
Foreign exchange rate changes also impacted our Euro and Canadian dollar denominated operating expenses. We estimate that changes in exchange rates between 2010 and 2011 positively impacted our revenues by approximately $0.6 million and negatively impacted operating expenses by approximately $1.0 million in 2011.
Income tax recovery
Income tax recovery decreased by $11.0 million, or 73.5%, in 2011, compared to 2010, primarily driven by changes in the effective tax rate as a result of a shift in earnings among our numerous tax jurisdictions.
Net loss from continuing operations
Net loss from continuing operations increased by $15.7 million in 2011, compared to 2010. This was primarily due to a higher after-tax loss from operations of $50.7 million in 2011, compared to $35.0 million in 2010.
Net loss from continuing operations for the year ended December 31, 2011 included stock-based compensation of $5.5 million, acquisition amortization of $12.9 million, and an after-tax impairment charge of $11.2 million. Net loss for the year ended December 31, 2010 included stock-based compensation of $6.0 million, acquisition amortization of $13.6 million, and no after-tax impairment charge.
Net earnings (loss) attributable to the Company
Net loss attributable to the Company increased by $14.8 million in 2011, compared to 2010. This was primarily due to $15.7 million higher net loss from continuing operations, partially offset by higher net earnings from discontinued operations.
Weighted average number of shares
The weighted average basic and diluted number of shares outstanding was 31.3 million for the year ended December 31, 2011, compared to 31.1 million for the year ended December 31, 2010. The number of shares outstanding was 31.3 million at December 31, 2011, compared to 31.2 million at December 31, 2010.
SEGMENTED INFORMATION
Revenue and gross margin by segment for the years ending December 31 were as follows:
(in thousands of U.S. dollars) |
| 2012 |
| 2011 |
| 2010 |
| |||
M2M |
|
|
|
|
|
|
| |||
Revenue (1) |
| $ | 335,990 |
| $ | 293,219 |
| $ | 332,445 |
|
Cost of goods sold |
| 224,229 |
| 198,271 |
| N/A |
| |||
Gross margin |
| $ | 111,761 |
| $ | 94,948 |
| $ | N/A |
|
Gross margin % |
| 33.3 | % | 32.4 | % | N/A |
| |||
|
|
|
|
|
|
|
| |||
Mobile Computing (2) |
|
|
|
|
|
|
| |||
Revenue |
| $ | 61,331 |
| $ | 39,956 |
| $ | 25,560 |
|
Cost of goods sold |
| 47,818 |
| 33,164 |
| N/A |
| |||
Gross margin |
| $ | 13,513 |
| $ | 6,792 |
| $ | N/A |
|
Gross margin % |
| 22.0 | % | 17.0 | % | N/A |
| |||
(1) Barnes and Noble contributed $nil in M2M revenue in 2012 compared to $0.7 million in 2011 and $64.2 million in 2010. Includes revenue generated from the acqusition of the M2M business of Sagemcom from the date of acquisition on August 1, 2012 to December 31, 2012 of $20.1 million.
(2) Excludes revenue, cost of goods sold, and gross margin related to the discontinued operations of the AirCard business.
Product line revenue by segment for the years ending December 31 was as follows:
(in thousands of U.S. dollars) |
| 2012 |
| 2011 |
| 2010 |
| |||
M2M |
|
|
|
|
|
|
| |||
Air Prime Embedded Wireless Modules for M2M (1) |
| $ | 279,324 |
| $ | 242,791 |
| $ | 274,964 |
|
AirLink Intelligent Gateways |
| 46,699 |
| 39,013 |
| 48,626 |
| |||
AirVantage M2M Cloud Platform and Other |
| 9,967 |
| 11,415 |
| 8,855 |
| |||
|
| $ | 335,990 |
| $ | 293,219 |
| $ | 332,445 |
|
Mobile Computing (2) |
|
|
|
|
|
|
| |||
AirPrime Embedded Wireless Modules for PC OEM and Other |
| $ | 61,331 |
| $ | 39,956 |
| $ | 25,560 |
|
(1) Barnes and Noble contributed $nil in M2M revenue in 2012 compared to $0.7 million in 2011 and $64.2 million in 2010. Includes revenue generated from the acqusition of the M2M business of Sagemcom from the date of acquisition on August 1, 2012 to December 31, 2012 of $20.1 million.
(2) Excludes revenue related to the discontinued operations of the AirCard business.
Our M2M revenue increased $42.8 million, or 14.6%, to $336.0 million in 2012 compared to 2011. Revenue from AirPrime Embedded Wireless Modules for M2M increased $36.5 million, or 15.0%, in 2012 compared to 2011. This increase was due to $20.1 million in revenue generated from the M2M business of Sagemcom acquired on August 1, 2012 along with solid organic growth in the Americas and Asia, partially offset by continued weakness in European markets. Revenue from AirLink Intelligent Gateways increased $7.7 million, or 19.7%, in 2012 compared to 2011. The increase was primarily driven by sales related to the launch of new 4G gateways during the year.
Our Mobile Computing revenue, consisting primarily of sales of AirPrime Embedded Wireless Modules for PC OEM increased by $21.4 million, or 53.5%, to $61.3 million in 2012 compared to 2011. The increase was largely driven by strong demand for both existing 3G modules, as well as new 4G LTE modules launched during the year.
FOURTH QUARTER OVERVIEW
Fourth quarter 2012 was exceptionally strong. Revenues increased from quarter three as a result of a full quarter of contribution from the recently acquired M2M business of Sagemcom. Gross margin percentage was slightly higher, reflecting favorable product mix and contribution from the M2M business of Sagemcom and operating expenses were at comparable levels to third quarter levels. Operating expenses in the fourth quarter of 2012 included a full quarter of expenses related to the M2M business of Sagemcom and a benefit from one time project funding from a partner.
Financial highlights for the fourth quarter of 2012:
· Revenue of $109.4 million, 32.8 percent year-over-year growth, and non-GAAP operating earnings from continuing operations of $3.7 million
· Gross margin was 33.1%, up from 31.0% in the third quarter of 2012
· Non-GAAP earnings from operations were $3.7 million compared to $0.3 million in the third quarter of 2012
· Net earnings from continuing operations of $15.5 million and diluted earnings per share of $0.50 compared to net loss from continuing operations of $3.6 million and diluted loss per share of $0.12 in the third quarter of 2012. A favorable income tax recovery contributed to the sequentially stronger net earnings from continuing operations
· Non-GAAP net earnings from continuing operations were $4.5 million, or $0.15 per diluted share, in the fourth quarter of 2012 compared to Non-GAAP net earnings from continuing operations of $1.3 million, or $0.04 per diluted share, in the third quarter of 2012.
CONSOLIDATED FOURTH QUARTER RESULTS OF OPERATIONS
|
| Three months ended December 31, |
| ||||||
|
| 2012 |
| 2011 (1) |
| ||||
|
|
|
| % of |
|
|
| % of |
|
(in thousands of U.S. dollars, except where otherwise stated) |
| $ |
| Revenue |
| $ |
| Revenue |
|
|
|
|
|
|
|
|
|
|
|
Revenue |
| 109,405 |
| 100.0 | % | 82,391 |
| 100.0 | % |
Cost of goods sold |
| 73,172 |
| 66.9 | % | 57,206 |
| 69.4 | % |
Gross margin |
| 36,233 |
| 33.1 | % | 25,185 |
| 30.6 | % |
|
|
|
|
|
|
|
|
|
|
Expenses |
|
|
|
|
|
|
|
|
|
Sales and marketing |
| 10,176 |
| 9.3 | % | 8,886 |
| 10.8 | % |
Research and development |
| 16,294 |
| 14.9 | % | 14,801 |
| 18.0 | % |
Administration |
| 7,743 |
| 7.1 | % | 7,694 |
| 9.3 | % |
Acquisition |
| 387 |
| 0.4 | % | — |
| 0.0 | % |
Restructuring |
| 42 |
| 0.0 | % | (19 | ) | 0.0 | % |
Integration |
| — |
| 0.0 | % | — |
| 0.0 | % |
Impairment of intangible asset |
| — |
| 0.0 | % | 11,214 |
| 13.6 | % |
Amortization |
| 3,107 |
| 2.8 | % | 2,620 |
| 3.2 | % |
|
| 37,749 |
| 34.5 | % | 45,196 |
| 54.9 | % |
Loss from operations |
| (1,516 | ) | -1.4 | % | (20,011 | ) | -24.3 | % |
Foreign exchange gain (loss) |
| 1,608 |
|
|
| (507 | ) |
|
|
Other income |
| 35 |
|
|
| 20 |
|
|
|
Earnings (loss) before income taxes |
| 127 |
|
|
| (20,498 | ) |
|
|
Income tax recovery |
| (15,396 | ) |
|
| (68 | ) |
|
|
Net earnings (loss) from continuing operations |
| 15,523 |
|
|
| (20,430 | ) |
|
|
Net earnings from discontinued operations |
| 4,083 |
|
|
| 6,668 |
|
|
|
Net earnings (loss) attributable to the Company |
| 19,606 |
|
|
| (13,762 | ) |
|
|
Net earnings (loss) per share attributable to the Company - Basic and diluted (in dollars) |
|
|
|
|
|
|
|
|
|
Continuing operations |
| 0.50 |
|
|
| (0.65 | ) |
|
|
Discontinued operations |
| 0.14 |
|
|
| 0.21 |
|
|
|
|
| 0.64 |
|
|
| (0.44 | ) |
|
|
(1) Financial information for fiscal year 2011 has been retrospectively adjusted to reflect the presentation of the AirCard business as discontinued operations.
SUMMARY OF QUARTERLY RESULTS OF OPERATIONS
The following tables highlight selected financial information for each of the eight most recent quarters that, in management’s opinion, have been prepared on a basis consistent with the audited consolidated financial statements for the year ended December 31, 2012. The selected financial information presented below reflects all adjustments, consisting primarily of normal recurring adjustments, which are, in the opinion of management, necessary for a fair presentation of results for the interim periods. These results
are not necessarily indicative of results for any future period. You should not rely on these results to predict future performance.
|
| 2012 (1) |
| 2011 (1) |
| ||||||||||||||||||||
(in thousands of U.S. dollars, except where otherwise stated) |
| Q4 |
| Q3 |
| Q2 |
| Q1 |
| Q4 |
| Q3 |
| Q2 |
| Q1 |
| ||||||||
|
|
|
|
|
|
|
|
|
|
|
|
|
|
|
|
|
| ||||||||
Revenue |
| $ | 109,405 |
| $ | 100,183 |
| $ | 95,398 |
| $ | 92,335 |
| $ | 82,391 |
| $ | 85,363 |
| $ | 85,863 |
| $ | 79,558 |
|
Cost of goods sold |
| 73,172 |
| 69,097 |
| 65,317 |
| 64,461 |
| 57,206 |
| 57,855 |
| 60,713 |
| 55,661 |
| ||||||||
Gross margin |
| 36,233 |
| 31,086 |
| 30,081 |
| 27,874 |
| 25,185 |
| 27,508 |
| 25,150 |
| 23,897 |
| ||||||||
Gross margin % |
| 33.1 | % | 31.0 | % | 31.5 | % | 30.2 | % | 30.6 | % | 32.2 | % | 29.3 | % | 30.0 | % | ||||||||
|
|
|
|
|
|
|
|
|
|
|
|
|
|
|
|
|
| ||||||||
Expenses |
|
|
|
|
|
|
|
|
|
|
|
|
|
|
|
|
| ||||||||
Sales and marketing |
| 10,176 |
| 8,572 |
| 8,998 |
| 9,321 |
| 8,886 |
| 9,082 |
| 9,318 |
| 9,902 |
| ||||||||
Research and development |
| 16,294 |
| 15,886 |
| 14,674 |
| 14,931 |
| 14,801 |
| 15,528 |
| 14,873 |
| 15,701 |
| ||||||||
Administration |
| 7,743 |
| 8,013 |
| 8,562 |
| 8,459 |
| 7,694 |
| 8,346 |
| 8,635 |
| 9,041 |
| ||||||||
Restructuring costs |
| 42 |
| 498 |
| 1,531 |
| 180 |
| (19 | ) | 881 |
| (350 | ) | 325 |
| ||||||||
Integration costs |
| — |
| — |
| — |
| — |
| — |
| 121 |
| 765 |
| 540 |
| ||||||||
Acquisition costs |
| 387 |
| 2,196 |
| 599 |
| — |
| — |
| — |
| — |
| — |
| ||||||||
Impairment of intangible asset |
| — |
| — |
| — |
| — |
| 11,214 |
| — |
| — |
| — |
| ||||||||
Amortization |
| 3,107 |
| 2,649 |
| 2,275 |
| 2,387 |
| 2,620 |
| 2,447 |
| 2,794 |
| 2,848 |
| ||||||||
|
| 37,749 |
| 37,814 |
| 36,639 |
| 35,278 |
| 45,196 |
| 36,405 |
| 36,035 |
| 38,357 |
| ||||||||
Operating income (loss) from continuing operations |
| (1,516 | ) | (6,728 | ) | (6,558 | ) | (7,404 | ) | (20,011 | ) | (8,897 | ) | (10,885 | ) | (14,460 | ) | ||||||||
|
|
|
|
|
|
|
|
|
|
|
|
|
|
|
|
|
| ||||||||
Foreign exchange gain (loss) |
| 1,608 |
| 1,176 |
| 336 |
| 206 |
| (507 | ) | (154 | ) | (221 | ) | 422 |
| ||||||||
Other income (expense) |
| 35 |
| (70 | ) | 10 |
| (171 | ) | 20 |
| 68 |
| (13 | ) | (40 | ) | ||||||||
Earnings (loss) from continuing operations before income tax |
| 127 |
| (5,622 | ) | (6,212 | ) | (7,369 | ) | (20,498 | ) | (8,983 | ) | (11,119 | ) | (14,078 | ) | ||||||||
Income tax expense (recovery) |
| (15,396 | ) | (2,010 | ) | 2,656 |
| (124 | ) | (68 | ) | (1,632 | ) | (327 | ) | (1,941 | ) | ||||||||
Net earnings (loss) from continuing operations |
| 15,523 |
| (3,612 | ) | (8,868 | ) | (7,245 | ) | (20,430 | ) | (7,351 | ) | (10,792 | ) | (12,137 | ) | ||||||||
Net earnings (loss) from discontinued operations |
| 4,083 |
| 7,279 |
| 12,449 |
| 7,590 |
| 6,668 |
| 6,353 |
| 4,013 |
| 4,304 |
| ||||||||
Net earnings (loss) |
| 19,606 |
| 3,667 |
| 3,581 |
| 345 |
| (13,762 | ) | (998 | ) | (6,779 | ) | (7,833 | ) | ||||||||
Non-controlling interest |
| — |
| — |
| — |
| — |
| — |
| — |
| (13 | ) | (44 | ) | ||||||||
Net earnings (loss) attributable to the Company |
| $ | 19,606 |
| $ | 3,667 |
| $ | 3,581 |
| $ | 345 |
| $ | (13,762 | ) | $ | (998 | ) | $ | (6,766 | ) | $ | (7,789 | ) |
|
|
|
|
|
|
|
|
|
|
|
|
|
|
|
|
|
| ||||||||
Earnings (loss) per share - GAAP in dollars |
|
|
|
|
|
|
|
|
|
|
|
|
|
|
|
|
| ||||||||
Basic |
| $ | 0.64 |
| $ | 0.12 |
| $ | 0.12 |
| $ | 0.01 |
| $ | (0.44 | ) | $ | (0.03 | ) | $ | (0.22 | ) | $ | (0.25 | ) |
Diluted |
| $ | 0.64 |
| $ | 0.12 |
| $ | 0.12 |
| $ | 0.01 |
| $ | (0.44 | ) | $ | (0.03 | ) | $ | (0.22 | ) | $ | (0.25 | ) |
|
|
|
|
|
|
|
|
|
|
|
|
|
|
|
|
|
| ||||||||
Weighted average number of shares (in thousands) |
|
|
|
|
|
|
|
|
|
|
|
|
|
|
|
|
| ||||||||
Basic |
| 30,591 |
| 30,573 |
| 30,817 |
| 31,175 |
| 31,298 |
| 31,297 |
| 31,267 |
| 31,237 |
| ||||||||
Diluted |
| 30,774 |
| 30,573 |
| 30,817 |
| 31,175 |
| 31,298 |
| 31,297 |
| 31,267 |
| 31,237 |
| ||||||||
(1) Quarterly information has been retrospectively adjusted to reflect the presentation of the AirCard business as discontinued operations.
Our quarterly results may fluctuate from quarter to quarter, driven by variation in sales volume, product mix and the combination of variable and fixed operating expenses. The impact of significant items incurred during the first three interim periods of year ended December 31, 2012 are discussed in more detail and disclosed in our quarterly reports and management’s discussion and analysis. Factors affecting our quarterly results in 2012 were as follows:
In the first quarter of 2012, net earnings attributable to the company increased $14.1 million, or $0.45 per common share, from the fourth quarter of 2011. The increase was primarily due to growth in our AirPrime embedded wireless module business, for both M2M and PC OEM applications, combined with the absence of $11.2 million impairment charge related to intangible assets which occurred in the fourth quarter of 2012.
In the second quarter of 2012, net earnings attributable to the company increased by $3.2 million, or $0.11 per common share, from the first quarter of 2012. This increase was driven by higher revenues in the second quarter largely due to strong sales growth in both M2M and PC OEM segments of our AirPrime embedded wireless module business, combined with higher gross margin resulting from lower product costs.
In the third quarter of 2012, net earnings attributable to the company of $3.7 million, or $0.12 per common share, were comparable to the second quarter of 2012. Strong growth in AirPrime embedded wireless module sales to M2M customers was offset by modestly higher operating expenses incurred as a result of the acquisition of the M2M business of Sagemcom.
In the fourth quarter of 2012, net earnings attributable to the company increased $15.9 million, or $0.52 per common share, from the third quarter of 2012. The increase was primarily related to unusually high revenues from AirPrime embedded wireless module sales to M2M customers combined with steady growth in AirLink intelligent gateways. The fourth quarter also included an income tax recovery related to the recognition of certain assets that will be realizable upon the sale of the AirCard business.
LIQUIDITY AND CAPITAL RESOURCES
Selected Financial Information
(in thousands of U.S. dollars) |
| 2012 |
| 2011 |
| 2010 |
| |||
|
|
|
|
|
|
|
| |||
Cash flows provided before changes in non-cash working capital: |
| $ | 49,070 |
| $ | 17,814 |
| $ | 22,970 |
|
|
|
|
|
|
|
|
| |||
Changes in non-cash working capital |
|
|
|
|
|
|
| |||
Accounts receivable |
| (616 | ) | 9,067 |
| (35,671 | ) | |||
Inventories |
| (4,019 | ) | 5,664 |
| (11,399 | ) | |||
Prepaid expense and other |
| (14,543 | ) | 4,248 |
| 7,104 |
| |||
Accounts payable and accrued liabilities |
| 10,997 |
| (13,783 | ) | 12,116 |
| |||
Deferred revenue and credits |
| (422 | ) | 733 |
| 480 |
| |||
|
| (8,603 | ) | 5,929 |
| (27,370 | ) | |||
Cash flows provided by (used in): |
|
|
|
|
|
|
| |||
Operating activities |
| 40,467 |
| 23,743 |
| (4,400 | ) | |||
|
|
|
|
|
|
|
| |||
Investing activities |
| (64,184 | ) | (2,706 | ) | (17,521 | ) | |||
Acquisition of M2M business of Sagemcom |
| (55,218 | ) | — |
| — |
| |||
Capital expenditures and increase in intangible assets |
| (18,452 | ) | (18,008 | ) | (16,556 | ) | |||
Net change in short-term investments |
| 9,347 |
| 17,058 |
| 489 |
| |||
Purchase of Wavecom S.A. shares |
| — |
| (1,787 | ) | (1,553 | ) | |||
|
|
|
|
|
|
|
| |||
Financing activities |
| (9,365 | ) | (4,858 | ) | (1,541 | ) | |||
Repurchase of common shares for cancellation |
| (6,312 | ) | — |
| — |
| |||
Purchase of treasury shares for RSU distribution |
| (2,489 | ) | (4,472 | ) | — |
| |||
Operating Activities
Cash provided by operating activities increased $16.7 million to $40.5 million during the year ended December 31, 2012, compared to the same period of 2011. The increase in cash was primarily due to higher operating earnings in the year ended December 31, 2012 compared to the same period of 2011. This was partially offset by higher working capital requirements in 2012.
Investing Activities
Cash used for investing activities increased $61.5 million to $64.2 million during the year ended December 31, 2012, compared to the same period of 2011. The increase in investing activities was largely related to the acquisition of the M2M business of Sagemcom and net change in short-term investments.
Cash used for the purchase of capital equipment was primarily for production and tooling equipment, research and development equipment, computer equipment and software, while cash used for intangible assets was driven primarily by patent registration costs and software licenses.
Financing Activities
Cash used for financing activities increased $4.5 million to $9.4 million during the year ended December 31, 2012, compared to 2011. The increase was primarily related to the use of cash during 2012 to purchase 800,000 of our common shares on the TSX and NASDAQ in connection with our normal course issuer bid approved on December 13, 2011 and 336,638 of our common shares to satisfy obligations under our restricted share unit plan, in the amounts of $6.3 million and $2.5 million, respectively.
Cash Requirements
Our near-term cash requirements are primarily related to funding our operations, capital expenditures, intellectual property (“IP”) licenses, and other obligations discussed below. On August 1, 2012, we completed the acquisition of the M2M business of Sagemcom, a transaction that was funded by $55.2 million in cash. We continue to believe our cash and cash equivalents balance of $63.6 million at December 31, 2012 and cash generated from continuing operations will be sufficient to fund our expected working capital requirements for at least the next twelve months based on current business plans. Our capital expenditures during the first quarter of 2013 are expected to be primarily for research and development equipment, tooling, leasehold improvements, software licenses and patents. However, we cannot be certain that our actual cash requirements will not be greater than we currently expect. Following closing of the sale of the AirCard business in early April 2013, we expect to continue to purchase back our common shares under our Normal Course Issuer Bid.
The following table presents the aggregate amount of future cash outflows for contractual obligations as of December 31, 2012.
Payments due by period |
| 2013 |
| 2014 |
| 2015 |
| 2016 |
| 2017 |
| Thereafter |
| ||||||
Operating lease obligations |
| $ | 4,429 |
| $ | 4,092 |
| $ | 3,630 |
| $ | 3,597 |
| $ | 3,487 |
| $ | 10,876 |
|
Capital lease obligations |
| 305 |
| 231 |
| 153 |
| 30 |
| — |
| — |
| ||||||
Purchase obligations (1) |
| 54,850 |
| — |
| — |
| — |
| — |
| — |
| ||||||
Other long-term liabilities (2) |
| — |
| 24,887 |
| — |
| — |
| — |
| 1,225 |
| ||||||
Total |
| $ | 59,584 |
| 29,210 |
| $ | 3,783 |
| $ | 3,627 |
| $ | 3,487 |
| $ | 12,101 |
| |
(1) Purchase obligations represent obligations with certain contract manufacturers to buy minimum amount of designated products between January, 2013 and March, 2013. In certain of these arrangements, we may be required to acquire and pay for such products up to the prescribed minimum or forecasted purchases.
(2) Other long-term liabilities include the long-term portions of accrued royalties.
Capital Resources
|
| 2012 |
| 2011 |
| ||||||||||||||||||||
(In thousands of dollars) |
| Dec 31 |
| Sept 30 |
| June 30 |
| Mar 31 |
| Dec 31 |
| Sept 30 |
| June 30 |
| Mar 31 |
| ||||||||
Cash and cash equivalents |
| $ | 63,646 |
| $ | 59,528 |
| $ | 123,159 |
| $ | 106,773 |
| $ | 101,375 |
| $ | 100,662 |
| $ | 101,685 |
| $ | 86,197 |
|
|
|
|
|
|
|
|
|
|
|
|
|
|
|
|
|
|
| ||||||||
Short-term investments |
| — |
| — |
| 2,153 |
| — |
| 9,347 |
| — |
| 17,470 |
| 24,559 |
| ||||||||
|
| 63,646 |
| 59,528 |
| 125,312 |
| 106,773 |
| 110,722 |
| 100,662 |
| 119,155 |
| 110,756 |
| ||||||||
Unused credit facilities |
| 50,000 |
| 10,000 |
| 10,000 |
| 10,000 |
| 10,000 |
| 10,000 |
| 10,000 |
| 10,000 |
| ||||||||
Total |
| $ | 113,646 |
| $ | 69,528 |
| $ | 135,312 |
| $ | 116,773 |
| $ | 120,722 |
| $ | 110,662 |
| $ | 129,155 |
| $ | 120,756 |
|
Credit Facilities
On October 31, 2012 we cancelled our then existing revolving facility (“Old Revolving Facility”) of $10 million which was to expire on January 28, 2013, and replaced it with a new revolving facility with the Toronto Dominion Bank and the Canadian Imperial Bank of Commerce in the amount of $50 million which will expire on October 31, 2013. The revolving facility is for working capital requirements and is secured by a pledge against all of our assets, including assets related to discontinued operations, and is subject to borrowing base limitations. The new revolving facility contains covenants and security substantially similar to the Old Revolving Facility. There were no borrowings under the revolving facility as at December 31, 2012. We are presently reviewing the impact of the proposed sale of the assets and operations of our AirCard business on the availability of the entire $50 million of the facility.
Letters of Credit
We have entered into a standby letter of credit facility agreement under which we have issued three performance bonds to third party customers in accordance with specified terms and conditions. At December 31, 2012, we had two Euro denominated performance bonds amounting to €50,000 expiring in June 2014 and a performance bond of $176,000 expiring in May 2013 (December 2011 - $176,000). We also have a letter of credit in the amount of $1.3 million expiring in May 2013 issued to a third party vendor with specified terms and conditions. These instruments approximate their fair market value.
Normal Course Issuer Bids
During the year ended December 31, 2012, we purchased 800,000 common shares in the open market for cancellation at an average price of $7.89 per share pursuant to a normal course issuer bid approved December 13, 2011. These purchases were completed in the first half of 2012.
On February 6, 2013, we received approval from the TSX of our Notice of Intention to make a Normal Course Issuer Bid (the “2013 Bid”). Pursuant to the 2013 Bid, we can purchase for cancellation up to 1,529,687 of our common shares, or approximately 5% of the common shares outstanding as of the date of the announcement. The 2013 Bid commenced on February 14, 2013 and will terminate on the earlier of: (i) February 13, 2014, (ii) the date the Company completes its purchases pursuant to the Notice of Intention filed with the TSX, or (iii) the date of notice by the Company of termination of the 2013 Bid. As of March 7, 2013, we had purchased 124,300 common shares at an average price of $11.08 per share.
NON-GAAP FINANCIAL MEASURES
Our consolidated financial statements are prepared in accordance with U.S. GAAP on a basis consistent for all periods presented. In addition to results reported in accordance with U.S. GAAP, we use non-GAAP financial measures as supplemental indicators of our operating performance. The term “non-GAAP financial measure” is used to refer to a numerical measure of a company’s historical or future financial performance, financial position or cash flows that: (i) excludes amounts, or is subject to adjustments that have the effect of excluding amounts, that are included in the most directly comparable measure calculated and presented in accordance with U.S. GAAP in a company’s statement of earnings, balance sheet or statement of cash flows; or (ii) includes amounts, or is subject to adjustments that have the effect of including amounts, that are excluded from the most directly comparable measure so calculated and presented.
Our non-GAAP financial measures include non-GAAP revenue, non-GAAP gross margin, non-GAAP earnings (loss) from operations, EBITDA (earnings before interest, taxes, depreciation and amortization and before impairment charges), non-GAAP net earnings (loss) and non-GAAP diluted earnings (loss) per share, respectively. We disclose non-GAAP amounts as we believe that these measures provide useful information on actual operating results and assist in comparisons from one period to another. Readers are cautioned that non-GAAP financial measures do not have any standardized meaning prescribed by U.S. GAAP and therefore may not be comparable to similar measures presented by other companies. Non-GAAP results exclude the impact of stock-based compensation expense, amortization related to acquisitions, acquisition and disposition costs, restructuring costs, integration costs, impairment, foreign exchange gains or losses on foreign currency contracts and translation of balance sheet accounts and certain tax adjustments.
EBITDA as defined equates earnings (loss) from operations plus stock-based compensation, acquisition, restructuring, integration, transaction costs, amortization and impairment. EBITDA can also be calculated as non-GAAP earnings (loss) from operations plus amortization excluding acquisition related amortization.
The following table provides a reconciliation of the non-GAAP financial measures to our U.S. GAAP results for years ended December 31:
(in thousands of U.S. dollars, except where otherwise stated) |
| 2012 (1) |
| 2011 (1) |
| 2010 (1) |
| |||
|
|
|
|
|
|
|
| |||
Revenue - GAAP and Non-GAAP |
| $ | 397,321 |
| $ | 333,175 |
| $ | 358,005 |
|
|
|
|
|
|
|
|
| |||
Gross margin - GAAP |
| $ | 125,274 |
| $ | 101,740 |
| $ | 121,406 |
|
Stock-based compensation |
| 304 |
| 385 |
| 491 |
| |||
Gross margin - Non-GAAP |
| $ | 125,578 |
| $ | 102,125 |
| $ | 121,897 |
|
|
|
|
|
|
|
|
| |||
Loss from operations - GAAP |
| $ | (22,206 | ) | $ | (54,253 | ) | $ | (42,717 | ) |
Stock-based compensation |
| 5,781 |
| 5,498 |
| 6,005 |
| |||
Acquisition |
| 3,182 |
| — |
| — |
| |||
Restructuring |
| 2,251 |
| 837 |
| 7,100 |
| |||
Integration |
| — |
| 1,426 |
| 5,110 |
| |||
Impairment of intangible asset |
| — |
| 11,214 |
| — |
| |||
Acquisition related amortization |
| 11,890 |
| 12,888 |
| 13,598 |
| |||
Earnings (loss) from operations - Non-GAAP |
| $ | 898 |
| $ | (22,390 | ) | $ | (10,904 | ) |
|
|
|
|
|
|
|
| |||
Net loss from continuing operations attributable to the Company - GAAP |
| $ | (4,202 | ) | $ | (50,653 | ) | $ | (34,715 | ) |
Stock-based compensation, restructuring and other, integration, and acquisition related amortization, net of tax |
| 22,241 |
| 31,762 |
| 30,178 |
| |||
Unrealized foreign exchange loss (gain) |
| (3,139 | ) | 267 |
| 7,000 |
| |||
Income tax adjustments |
| (15,344 | ) | — |
| (3,410 | ) | |||
Non-controlling interest |
| — |
| (32 | ) | (182 | ) | |||
Net loss from continuing operations attributable to the Company - Non-GAAP |
| $ | (444 | ) | $ | (18,656 | ) | $ | (1,129 | ) |
|
|
|
|
|
|
|
| |||
Net earnings from discontinued operations - GAAP |
| $ | 31,401 |
| $ | 21,338 |
| $ | 20,174 |
|
Stock-based compensation and disposition costs |
| 2,395 |
| 951 |
| 951 |
| |||
Net earnings from discontinued operations - Non-GAAP |
| $ | 33,796 |
| $ | 22,289 |
| $ | 21,125 |
|
|
|
|
|
|
|
|
| |||
Net earnings (loss) - GAAP |
| $ | 27,199 |
| $ | (29,315 | ) | $ | (14,541 | ) |
Net earnings (loss) - Non-GAAP |
| 33,352 |
| 3,633 |
| 19,996 |
| |||
|
|
|
|
|
|
|
| |||
Diluted earnings (loss) from continuing operations per share |
|
|
|
|
|
|
| |||
GAAP - (in dollars) |
| $ | (0.14 | ) | $ | (1.62 | ) | $ | (1.12 | ) |
Non-GAAP - (in dollars) |
| $ | (0.01 | ) | $ | (0.60 | ) | $ | (0.04 | ) |
|
|
|
|
|
|
|
| |||
Net earnings (loss) per share attributable to the Company - diluted |
|
|
|
|
|
|
| |||
GAAP - (in dollars) |
| $ | 0.88 |
| $ | (0.94 | ) | $ | (0.47 | ) |
Non-GAAP - (in dollars) |
| $ | 1.08 |
| $ | 0.12 |
| $ | 0.64 |
|
(1) Financial information has been retrospectively adjusted to reflect the presentation of the AirCard business as discontinued operations.
The following table provides a quarterly reconciliation of the non-GAAP financial measures to our U.S. GAAP results:
|
| 2012 (1) |
| 2011 (1) |
| ||||||||||||||||||||
(in thousands of U.S. dollars, except where otherwise stated) |
| Q4 |
| Q3 |
| Q2 |
| Q1 |
| Q4 |
| Q3 |
| Q2 |
| Q1 |
| ||||||||
|
|
|
|
|
|
|
|
|
|
|
|
|
|
|
|
|
| ||||||||
Revenue - GAAP and Non-GAAP |
| $ | 109,405 |
| $ | 100,183 |
| $ | 95,398 |
| $ | 92,335 |
| $ | 82,391 |
| $ | 85,363 |
| $ | 85,863 |
| $ | 79,558 |
|
|
|
|
|
|
|
|
|
|
|
|
|
|
|
|
|
|
| ||||||||
Gross margin - GAAP |
| $ | 36,233 |
| $ | 31,086 |
| $ | 30,081 |
| $ | 27,874 |
| $ | 25,185 |
| $ | 27,508 |
| $ | 25,150 |
| $ | 23,897 |
|
Stock-based compensation |
| 61 |
| 82 |
| 78 |
| 83 |
| 86 |
| 89 |
| 97 |
| 113 |
| ||||||||
Gross margin - Non-GAAP |
| $ | 36,294 |
| $ | 31,168 |
| $ | 30,159 |
| $ | 27,957 |
| $ | 25,271 |
| $ | 27,597 |
| $ | 25,247 |
| $ | 24,010 |
|
|
|
|
|
|
|
|
|
|
|
|
|
|
|
|
|
|
| ||||||||
Loss from operations - GAAP |
| $ | (1,516 | ) | $ | (6,728 | ) | $ | (6,558 | ) | $ | (7,404 | ) | $ | (20,011 | ) | $ | (8,897 | ) | $ | (10,885 | ) | $ | (14,460 | ) |
Stock-based compensation |
| 1,470 |
| 1,462 |
| 1,403 |
| 1,446 |
| 1,308 |
| 1,355 |
| 1,458 |
| 1,377 |
| ||||||||
Acquisition |
| 387 |
| 2,196 |
| 599 |
| — |
| — |
| — |
| — |
| — |
| ||||||||
Restructuring |
| 42 |
| 498 |
| 1,531 |
| 180 |
| (19 | ) | 881 |
| (350 | ) | 325 |
| ||||||||
Integration |
| — |
| — |
| — |
| — |
| — |
| 121 |
| 765 |
| 540 |
| ||||||||
Impairment of intangible asset |
| — |
| — |
| — |
| — |
| 11,214 |
| — |
| — |
| — |
| ||||||||
Acquisition related amortization |
| 3,338 |
| 2,906 |
| 2,665 |
| 2,981 |
| 3,090 |
| 3,198 |
| 3,312 |
| 3,288 |
| ||||||||
Earnings (loss) from operations - Non-GAAP |
| $ | 3,721 |
| $ | 334 |
| $ | (360 | ) | $ | (2,797 | ) | $ | (4,418 | ) | $ | (3,342 | ) | $ | (5,700 | ) | $ | (8,930 | ) |
|
|
|
|
|
|
|
|
|
|
|
|
|
|
|
|
|
| ||||||||
Net earnings (loss) from continuing operations - GAAP |
| $ | 15,523 |
| $ | (3,612 | ) | $ | (8,868 | ) | $ | (7,245 | ) | $ | (20,430 | ) | $ | (7,351 | ) | $ | (10,779 | ) | $ | (12,093 | ) |
Stock-based compensation, restructuring and other, integration, and acquisition related amortization, net of tax |
| 5,162 |
| 6,885 |
| 5,658 |
| 4,536 |
| 15,690 |
| 5,338 |
| 5,263 |
| 5,471 |
| ||||||||
Unrealized foreign exchange loss (gain) |
| (1,655 | ) | (1,218 | ) | (165 | ) | (101 | ) | 330 |
| 34 |
| 238 |
| (335 | ) | ||||||||
Income tax adjustments |
| (14,540 | ) | (804 | ) | — |
| — |
| — |
| — |
| — |
| — |
| ||||||||
Non-controlling interest |
| — |
| — |
| — |
| — |
| — |
| — |
| — |
| (32 | ) | ||||||||
Net earnings (loss) from continuing operations - Non-GAAP |
| $ | 4,490 |
| $ | 1,251 |
| $ | (3,375 | ) | $ | (2,810 | ) | $ | (4,410 | ) | $ | (1,979 | ) | $ | (5,278 | ) | $ | (6,989 | ) |
|
|
|
|
|
|
|
|
|
|
|
|
|
|
|
|
|
| ||||||||
Net earnings from discontinued operations - GAAP |
| $ | 4,083 |
| $ | 7,279 |
| $ | 12,449 |
| $ | 7,590 |
| $ | 6,668 |
| $ | 6,353 |
| $ | 4,013 |
| $ | 4,304 |
|
Stock-based compensation and disposition costs |
| 1,696 |
| 233 |
| 233 |
| 233 |
| 225 |
| 232 |
| 240 |
| 254 |
| ||||||||
Net earnings from discontinued operations - Non-GAAP |
| $ | 5,779 |
| $ | 7,512 |
| $ | 12,682 |
| $ | 7,823 |
| $ | 6,893 |
| $ | 6,585 |
| $ | 4,253 |
| $ | 4,558 |
|
|
|
|
|
|
|
|
|
|
|
|
|
|
|
|
|
|
| ||||||||
Net earnings (loss) - GAAP |
| $ | 19,606 |
| $ | 3,667 |
| $ | 3,581 |
| $ | 345 |
| $ | (13,762 | ) | $ | (998 | ) | $ | (6,766 | ) | $ | (7,789 | ) |
Net earnings (loss) - Non-GAAP |
| 10,269 |
| 8,763 |
| 9,307 |
| 5,013 |
| 2,483 |
| 4,606 |
| (1,025 | ) | (2,431 | ) | ||||||||
|
|
|
|
|
|
|
|
|
|
|
|
|
|
|
|
|
| ||||||||
Diluted earnings (loss) from continuing operations per share |
|
|
|
|
|
|
|
|
|
|
|
|
|
|
|
|
| ||||||||
GAAP - (in dollars) |
| $ | 0.50 |
| $ | (0.12 | ) | $ | (0.29 | ) | $ | (0.23 | ) | $ | (0.65 | ) | $ | (0.23 | ) | $ | (0.34 | ) | $ | (0.39 | ) |
Non-GAAP - (in dollars) |
| $ | 0.15 |
| $ | 0.04 |
| $ | (0.11 | ) | $ | (0.09 | ) | $ | (0.14 | ) | $ | (0.06 | ) | $ | (0.17 | ) | $ | (0.22 | ) |
|
|
|
|
|
|
|
|
|
|
|
|
|
|
|
|
|
| ||||||||
Net earnings (loss) per share attributable to the Company - diluted |
|
|
|
|
|
|
|
|
|
|
|
|
|
|
|
|
| ||||||||
GAAP - (in dollars) |
| $ | 0.64 |
| $ | 0.12 |
| $ | 0.12 |
| $ | 0.01 |
| $ | (0.44 | ) | $ | (0.03 | ) | $ | (0.22 | ) | $ | (0.25 | ) |
Non-GAAP - (in dollars) |
| $ | 0.33 |
| $ | 0.28 |
| $ | 0.30 |
| $ | 0.16 |
| $ | 0.08 |
| $ | 0.15 |
| $ | (0.03 | ) | $ | (0.08 | ) |
(1) Financial information has been retrospectively adjusted to reflect the presentation of the AirCard business as discontinued operations.
OFF-BALANCE SHEET ARRANGEMENTS
We did not have any off-balance sheet arrangements during the years ended December 31, 2012 and 2011.
TRANSACTIONS BETWEEN RELATED PARTIES
We did not undertake any transactions with related parties during the year ended December 31, 2012 and 2011.
CRITICAL ACCOUNTING POLICIES AND ESTIMATES
We prepare our consolidated financial statements in accordance with U.S. GAAP and we make certain estimates and assumptions that affect the reported amounts of assets, liabilities, revenue, expenses and the related disclosure of contingent liabilities. Note 2, Summary of significant accounting policies, in the December 31, 2012 consolidated financial statements includes a summary of the significant accounting policies used in the preparation of our consolidated financial statements. While all of the significant accounting policies are important to the annual consolidated financial statements, some of these policies may be viewed as involving a high degree of judgment.
On an ongoing basis, we evaluate our estimates and judgments, including those related to business combinations, revenue recognition, adequacy of allowance for doubtful accounts, adequacy of inventory reserve, valuation of goodwill and intangible assets, income taxes, useful lives of assets, adequacy of warranty reserve, royalty obligations, contingencies, stock-based compensation, and fair value measurement. We base our estimates on historical experience, anticipated results and trends and on various other assumptions that we believe are reasonable under the circumstances. By their nature, estimates are subject to an inherent degree of uncertainty. Actual results could differ from our estimates.
The following critical accounting policies require management’s most difficult, subjective and complex judgments, and are subject to measurement uncertainty.
Business combinations
We account for our business combinations using the acquisition method. Under this method, estimates we make to determine the fair values of acquired assets and liabilities assumed include judgements in our determinations of acquired intangible assets and assessment of the fair value of existing property and equipment. Assumed liabilities can include litigation and other contingency reserves existing at the time of the acquisition. Goodwill is recognized as of the acquisition date as the excess of the purchase price over the estimated fair values of net identifiable assets acquired and liabilities assumed at their acquisition date. Acquisition related expenses are separately recognized from business combination and are expensed as incurred.
When establishing fair values, we make significant estimates and assumptions, especially with respect to intangible assets. Intangible assets acquired and recorded by us may include patents, client relationships, backlog and in-process research and development. Estimates include but are not limited to the forecasting of future cash flows and discount rates. From time to time, we may engage third-party firms to assist us in determining the fair value of assets and liabilities assumed. Our estimates of fair values are based upon assumptions believed to be reasonable, but which are inherently uncertain and unpredictable. As a result, actual results may differ from estimates impacting our earnings.
Revenue recognition
We recognize revenue from sales of products and services upon the later of transfer of title or upon shipment of the product to the customer or rendering of the service, so long as persuasive evidence of an arrangement exists, delivery has occurred, price is fixed or determinable, and collection is reasonably assured. Customers include resellers, original equipment manufacturers, and mobile network operators. We record deferred revenue when we receive cash in advance of the revenue recognition criteria being met. A significant portion of our revenue is generated from sales to resellers. We recognize revenue on the portion of sales to certain resellers that are subject to contract provisions allowing various rights of return and stock rotation, upon the earlier of when the rights have expired or the products have been reported as sold by the resellers. Revenues from contracts with multiple-element arrangements, such as those including technical support services, are recognized as each element is earned based on the relative fair value of each element and only when there are no undelivered elements that are essential to the functionality of the delivered elements. Revenue from licensed software is recognized at the inception of the license term. Revenue from software maintenance, unspecified upgrades and technical support contracts is recognized over the period such items are delivered or services are provided. Technical support contracts extending beyond the current period are recorded as deferred revenue.
Funding from certain research and development agreements is recognized as revenue when certain criteria stipulated under the terms of those funding agreements have been met and when there is reasonable assurance the funding will be received. Certain research and development funding will be repayable only on the occurrence of specified future events. We recognize the liability to repay research and development funding in the period in which conditions arise that would cause research and development funding to be repayable. Government research and development arrangements are recognized as a reduction of the related expense when the criteria stipulated under the terms of the agreements have been met and when there is reasonable assurance the funding will be received.
Allowance for doubtful accounts
We maintain an allowance for doubtful accounts for estimated losses that may arise if any of our customers are unable to make required payments. We consider the following factors when determining whether collection is reasonably assured: customer credit-worthiness, past transaction history with the customer, insured amounts, if any, current economic industry trends and changes in customer payment terms. If we have no previous experience with the customer, we typically obtain reports from credit organizations to ensure that the customer has a history of paying its creditors. We may also request financial information, including financial statements, to ensure that the customer has the means of making payment. If these factors indicate collection is not reasonably assured, revenue is deferred until collection becomes reasonably assured, which is generally upon receipt of cash. If the financial condition of any of our customers deteriorates, we may increase our allowance.
As at December 31, 2012, Accounts receivable comprised 23.4% of total assets. Included in this balance was a provision of $2.4 million for doubtful accounts, or 2.2% of accounts receivable (as at December 31, 2011 - $3.6 million for doubtful accounts, or 3.4% of accounts receivable). We believe our allowance for doubtful accounts as at December 31, 2012 is adequate to provide for probable losses existing in accounts receivable.
Inventory
We value our inventory at the lower of cost, determined on a first-in-first-out basis, and estimated net realizable value. We assess the need for an inventory write-down and/or an accrual for estimated losses on inventory purchase commitments based on our assessment of estimated market value using assumptions about future demand and market conditions. Our reserve requirements generally increase as our projected demand requirements decrease, due to market conditions, technological and product life cycle changes and longer than previously expected usage periods. If market conditions are worse than our projections, we may further write-down the value of our inventory or increase the accrual for estimated losses on inventory purchase commitments.
Goodwill and intangible assets
Goodwill and intangible assets are assessed for impairment on an annual basis and between annual tests whenever circumstances indicate that the carrying value of the goodwill and intangible assets might be impaired. Circumstances may include an adverse change in business climate or a more likely than not expectation that a reporting unit will be sold or disposed. On at least a quarterly basis, we assess whether such circumstances exist.
An evaluation of recoverability of goodwill requires judgment, including the identification of reporting units, assigning assets and liabilities to reporting units, assigning goodwill to reporting units, and determining the estimated fair value of each reporting unit. Significant judgments that are required on our part to estimate the fair value of reporting units include estimating future cash flows, determining appropriate discount rates, consideration of appropriate control premium, market conditions, and other assumptions. Changes in these estimates and assumptions could materially affect the determination of fair value for each reporting unit and may result in impairment charges in future periods.
Effective January 1, 2011, we have two reportable segments as a result of implementing a new organizational structure. We determined that we had three reporting units and tested for goodwill impairment as at December 31, 2012. As the fair value in each reporting unit exceeded the respective carrying amounts, the second step of the impairment test that measures the amount of an impairment loss by comparing the implied fair market value of the reporting unit with the carrying amount of the goodwill of the reporting unit was not required. No impairment of goodwill was recorded during the years ended December 31, 2012 and 2011.
At December 31, 2012, our goodwill balance was $123.9 million comprised of $98.0 million related to continuing operations and $25.9 million related to discontinued operations. We determined that there was no impairment as the fair values of each of our three reporting units exceeded their respective carrying values. Our analysis took into consideration an income valuation approach using the expected discounted cash flows for each reporting unit. The principal factors used in the discounted cash flow analysis were the projected results of operations, the discount rate based on our estimated weighted average cost of capital, and terminal value assumptions for each reporting unit. The discounted cash flow model used was based on our business plan, as approved by our Board of Directors. For years subsequent to those contained in our business plan, we analyzed third party forecasts and other macro-economic indicators that impact our reporting units to provide a reasonable estimate of revenue growth in future
periods. Our gross margins and operating expense estimates were consistent with those generated in recent historical periods. We also developed assumptions for the amount of working capital and capital expenditures needed to support each reporting unit.
In addition to the income valuation approach noted above, we also considered the current market capitalization of the Company which was approximately $242.9 million at December 31, 2012. Although the Company’s book value of $298.1 million exceeds the market capitalization, we have reconciled our determination of fair value with the market capitalization amount for the purposes of the goodwill impairment test.
During the fourth quarter of 2011, we recorded an impairment charge of $11.2 million related to intangible assets primarily related to a software development program that was acquired during the Wavecom acquisition in 2009. We determined that this software development program no longer met the long-term objectives of the Company and the program was abandoned. The program had no impact on our operations in prior periods nor do we expect it to have an impact on our future operations.
Income taxes
We recognize and measure each tax position related to income tax positions taken or expected to be taken in a tax return. We have reviewed our tax positions to determine which should be recognized and measured according to the more likely than not threshold requirement. The tax benefits recognized in the financial statements are measured based on the largest benefit that has a greater than fifty percent likelihood of being realized upon ultimate resolution. If the realization of a tax position is not considered more likely than not, we provide for a valuation allowance. The ultimate realization of our deferred tax assets is dependent upon the generation of future taxable income during the periods in which temporary differences become deductible. We consider projected future taxable income from continuing operations, tax planning strategies, and transactions, including the pending disposition of the AirCard business, in making our assessment. If our assessment of our ability to realize our deferred tax assets changes, we may make an adjustment to our deferred tax assets that would be charged to income (loss).
We do not provide for taxes on foreign earnings as it is our intention to indefinitely reinvest undistributed earnings of our foreign subsidiaries. It is not practical to estimate the income tax liability that might be incurred if there is a change in management’s intention in the event that a remittance of such earnings occurs in the future.
The ultimate amount of future income taxes and income tax provision could be materially different from those recorded, as it is influenced by our future operating results and our tax interpretations.
Amortization
Amortization of property and equipment and intangible assets incorporates estimates of useful lives and residual values. These estimates may change as more experience is obtained or as general market conditions change impacting the operation of plant and equipment.
Warranty costs
We accrue product warranty costs in accrued liabilities to provide for the repair or replacement of defective products. Our accrual is based on an assessment of historical experience and management’s estimates. If there is a change in the quality of our products, we adjust our accrual accordingly.
Royalty obligations
Under certain license agreements we are committed to royalty payments based on the sales of products using certain technologies. We recognize royalty obligations as determinable in accordance with agreement terms. Where agreements are not finalized, we have recognized our current best estimate of the obligation in accrued liabilities and other long-term liabilities. When the agreements are finalized, the estimates are revised accordingly.
Contingencies
We are from time to time involved in litigation, certain other claims and arbitration matters arising in the ordinary course of our business. We accrue for a liability when it is both probable that a liability has been incurred and the amount of the loss can be reasonably estimated. Significant judgment is required in both the determination of probability and the determination as to whether a loss is reasonably estimable. These accruals are reviewed at least quarterly and adjusted to reflect the impacts of negotiations, settlements, rulings, advice of legal counsel and technical experts and other information and events pertaining to a particular matter. To the extent there is a reasonable possibility (within the meaning of ASC 450, Contingencies) that the losses could exceed the amounts already accrued for those cases for which an estimate can be made, management believes that the amount of any such additional loss would not be material to our results of operations or financial condition.
In some instances, we are unable to reasonably estimate any potential loss or range of loss. The nature and progression of litigation can make it difficult to predict the impact a particular lawsuit will have on the company. There are many reasons why we cannot make these assessments, including, among others, one or more of the following: in the early stage of a proceeding, the claimant is not required to specifically identify the patent that has allegedly been infringed; damages sought that are unspecified, unsupportable, unexplained or uncertain; discovery not having been started or being incomplete; the complexity of the facts that are in dispute (e.g., once a patent is identified, the analysis of the patent and a comparison to the activities of the Company is a labour-intensive and highly technical process); the difficulty of assessing novel claims; the parties not having engaged in any meaningful settlement discussions; the possibility that other parties may share in any ultimate liability; and the often slow pace of patent litigation.
We are required to apply judgment with respect to any potential loss or range of loss in connection with litigation. While we believe we have meritorious defenses to the claims asserted against us in our currently outstanding litigation, and intend to defend ourselves vigorously in all cases, in light of the inherent uncertainties in litigation there can be no assurance that the ultimate resolution of these matters will not significantly exceed the reserves currently accrued by us for those cases for which an estimate can be made. Losses in connection with any litigation for which we are not presently able to reasonable
estimate any potential loss or range of loss could be material to our results of operations and financial condition.
Stock-based compensation
We recognize stock-based compensation expense for all stock-based compensation awards based on the fair value at grant date. We recognize stock-based compensation expense for those shares expected to vest on a straight-line basis over the requisite service period of the award.
Determining the appropriate fair value model and calculating the fair value of share-based payment awards requires subjective assumptions. The assumptions used in calculating the fair value of share-based payment awards represent management’s best estimates, but these estimates involve inherent uncertainties and the application of management’s judgment. As a result, if factors change and we use different assumptions, our stock-based compensation expense could be materially different in the future.
Fair value measurement
We measure our short-term investments at fair value, defined as the price that would be received from selling an asset or that would be paid to transfer a liability in an orderly transaction between market participants at the measurement date. When determining fair value measurements, we consider the principal or most advantageous market in which it would transact and consider assumptions that market participants would use when pricing the asset or liability, such as inherent risk, transfer restrictions and risk of non-performance.
An established fair value hierarchy requires the company to maximize the use of observable inputs and minimize the use of unobservable inputs when measuring fair value. A financial instrument’s categorization within the fair value hierarchy is based upon the lowest level of input that is both available and significant to the fair value measurement. Three levels of inputs may be used to measure fair value:
Level 1 - Quoted prices in active markets for identical assets or liabilities.
Level 2 - Observable inputs other than quoted prices in active markets for identical assets and liabilities, such as quoted prices for identical or similar assets or liabilities in markets that are not active, or other inputs that are observable or can be corroborated by observable market data for substantially the full term of the assets or liabilities.
Level 3 - Inputs that are generally unobservable and are supported by little or no market activity and that are significant to the fair value determination of the assets or liabilities.
The determination of fair value requires judgments, assumptions and estimates and may change over time.
OUTSTANDING SHARE DATA
As of the date of this MD&A, the Company had 30,788,272 common shares issued and outstanding, stock options exercisable into 2,287,456 common shares and 345,769 restricted treasury share units outstanding.
IMPACT OF ACCOUNTING PRONOUNCEMENTS AFFECTING FUTURE PERIODS
In July 2012, the FASB issued ASU 2012-02, Testing Indefinite-Lived Intangible Assets for Impairment (the revised standard). The revised standard is intended to reduce the cost and complexity of testing indefinite-lived intangible assets other than goodwill for impairment by providing entities with an option to perform a “qualitative” assessment to determine whether further impairment testing is necessary. The revised standard is effective for annual and interim impairment tests performed for fiscal years beginning after September 15, 2012 and early adoption of this guidance is permitted.
DISCLOSURE CONTROLS
Our management is responsible for establishing and maintaining adequate disclosure controls and procedures for the Company. Our disclosure controls and procedures are designed to ensure that information required to be disclosed in our reports filed with securities regulatory authorities is recorded, processed, summarized and reported within time periods specified in applicable securities regulations, and is accumulated and communicated to our management, including our Chief Executive Officer and our Chief Financial Officer, as appropriate, to allow timely decisions regarding required disclosure.
We conducted an evaluation of the effectiveness of our disclosure controls and procedures. An evaluation was carried out under the supervision of, and with the participation of, our management, including our Chief Executive Officer and our Chief Financial Officer, as of December 31, 2012. Based on that evaluation, our Chief Executive Officer and our Chief Financial Officer have concluded that our disclosure controls and procedures were effective as of December 31, 2012 to ensure that information required to be disclosed by us in the reports we file or submit under applicable securities laws and regulations is recorded, processed, summarized, and reported within the time periods specified thereby.
We do not expect that our disclosure controls and procedures will prevent all errors and all fraud. Control procedures, no matter how well conceived and operated, can provide only reasonable, not absolute, assurance that the objectives of the control procedures are met. Because of the inherent limitations in all control procedures, no evaluation of controls can provide absolute assurance that all control issues and instances of fraud, if any, within our company have been detected. These inherent limitations include the realities that judgments in decision-making can be faulty, and that breakdowns can occur because of simple error or mistake. Additionally, controls can be circumvented by the individual acts of some persons, by collusion of two or more people, or by management override of the control. We considered these limitations during the development of our disclosure controls and procedures and will periodically re-evaluate them to ensure they provide reasonable assurance that such controls and procedures are effective.
INTERNAL CONTROL OVER FINANCIAL REPORTING
Management’s Annual Report on Internal Control over Financial Reporting
Our management is responsible for establishing and maintaining adequate internal control over financial reporting, as such term is defined in Rules 13a-15(f) and 15d-15(f) under the U.S. Securities Exchange Act of 1934 and has designed such internal control over financial reporting to provide reasonable assurance regarding the reliability of financial reporting and the preparation of financial statements for external purposes in accordance with United States generally accepted accounting principles (“U.S. GAAP”).
Our internal control over financial reporting includes those policies and procedures that: (1) pertain to the maintenance of records that, in reasonable detail, accurately and fairly reflect the transactions and dispositions of our assets; (2) provide reasonable assurance that transactions are recorded as necessary to permit preparation of financial statements in accordance with U.S. GAAP, and that our receipts and expenditures are being made only in accordance with authorizations of our management and directors; and (3) provide reasonable assurance regarding prevention or timely detection of unauthorized acquisition, use or disposition of our assets that could have a material effect on the financial statements.
Because of its inherent limitations, internal control over financial reporting may not prevent or detect misstatements on a timely basis. Also, projections of any evaluation of effectiveness of internal control over financial reporting to future periods are subject to the risk that controls may become inadequate because of changes in conditions, or that the degree of compliance with the policies or procedures may deteriorate.
Under the supervision and with the participation of our Chief Executive Officer and our Chief Financial Officer, management conducted an evaluation of the effectiveness of our internal control over financial reporting, as of December 31, 2012, based on the framework set forth in Internal Control-Integrated Framework issued by the Committee of Sponsoring Organizations of the Treadway Commission (COSO). Based on its evaluation under this framework, management concluded that our internal control over financial reporting was effective as of that date.
KPMG LLP (“KPMG”), an independent registered public accounting firm, who audited and reported on our consolidated financial statements as at and for the year ended December 31, 2012, has issued an attestation report on our internal control over financial reporting as of December 31, 2012. The attestation report is included in our consolidated financial statements.
There were no changes in our internal control over financial reporting during the year ended December 31, 2012 that materially affected, or are reasonably likely to materially affect, our internal control over financial reporting. The design of any system of controls and procedures is based in part upon certain assumptions about the likelihood of certain events. There can be no assurance that any design will succeed in achieving its stated goals under all potential future conditions, regardless of how remote.
LEGAL PROCEEDINGS
In December 2012, Concinnitas LLC filed a patent litigation lawsuit in the United States District Court for the Eastern District of Texas asserting patent infringement by us. The lawsuit makes allegations concerning one of our AirCard products. We have not yet been served with the complaint.
In July 2012, Technology Properties Ltd LLC, Phoenix Digital Solutions LLC and Patriot Scientific Corporation filed a complaint with the United States International Trade Commission (“ITC”) and a patent litigation lawsuit in the United States District Court for the Northern District of California asserting patent infringement by a number of parties, including us. The ITC instituted its investigation in August 2012 under the caption “In the Matter of Certain Wireless consumer Electronics Devices and Components Thereof”. In November 2012, a mutually agreeable confidential settlement agreement was entered into by the parties with respect to these matters which will not have a material adverse effect on our operating results. In December 2012, the District Court lawsuit was dismissed with prejudice and in Q1 2013, a Joint Motion terminating the ITC investigation with respect to Sierra Wireless was granted.
In April 2012, a patent holding company, Cell and Network Selection, LLC, filed a patent litigation lawsuit in the United States District Court for the District of Texas asserting patent infringement by us and our customer. The lawsuit makes certain allegations concerning the LTE mobile hotspots and USB modems sold by us and deployed with AT&T. The lawsuit is in the scheduling stage and trial has been scheduled for March 2015. A motion to transfer the lawsuit to the Southern District of California is currently before the Court.
In January 2012, a patent holding company, M2M Solutions LLC, filed a patent litigation lawsuit in the United States District Court for the District of Delaware asserting patent infringement by us and our competitors. The lawsuit makes certain allegations concerning the AirPrime embedded wireless module products, related AirLink products and related services sold by us for use in M2M communication applications. The lawsuit is in the interrogatories and response to interrogatories stage.
In September 2011, a patent holding company, Wi-Lan, Inc., filed a patent litigation lawsuit in the United States District Court for the Eastern District of Texas asserting patent infringement by a number of parties, including us. The lawsuit makes certain allegations concerning the wireless communication products sold by us. In September 2012, the lawsuit was consolidated with another lawsuit commenced by Wi-Lan in the Eastern District of Texas concerning the same patents and trial has been scheduled for September 2013. The lawsuit is currently in the discovery stage. In December 2012, Wi-Lan filed additional patent litigation lawsuits in the United States District Court for each of the Eastern District of Texas and the Southern District of Florida asserting patent infringement by us of additional patents not included in the first Wi-Lan suit. These two additional lawsuits are in the initial pleadings stage.
In May 2010 and in February 2011, a patent holding company, Golden Bridge Technology Inc. (“GBT”), filed patent litigation lawsuits in the United States District Court for the District of Delaware asserting patent infringement of the same two patents by a number of parties, including us and certain of our customers. In both cases, the litigation makes certain allegations concerning the wireless modems sold by
us and our competitors. Both lawsuits have been stayed against all defendants except Apple, pending the outcome of the trial against Apple in Delaware which is anticipated to occur in or around April 2013. In May 2012, GBT filed a patent litigation lawsuit in the United States District Court for the Central District of California asserting patent infringement by us of a different patent from the other two lawsuits, but concerning essentially the same products. In September 2012, this lawsuit was dismissed in the Central District of California and re-filed in the District of Delaware. This lawsuit has been stayed against us pending the outcome of a trial against Apple with respect to the same patent, which is to take place in the Central District of California.
In July 2009, a patent holding company, SPH America, LLC, filed a patent litigation lawsuit in the United States District Court for the Eastern District of Virginia asserting patent infringement by a number of device manufacturers, including us, and computer manufacturers, including certain of our customers. The litigation, which has been transferred to the United States District Court for the Southern District of California, makes certain allegations concerning the wireless modules sold to the computer manufacturers by us or our competitors. The claim construction hearing occurred in April 2012 and the trial has been scheduled for June 2013. In January 2013, a mutually agreeable confidential settlement was entered into by the parties which will not have a material adverse effect on our operating results. The lawsuit was subsequently dismissed with prejudice against us.
Although there can be no assurance that an unfavorable outcome would not have a material adverse effect on our operating results, liquidity or financial position, we believe the claims made in the foregoing legal proceedings are without merit and intend to defend ourselves and our products vigorously in all cases.
IP Indemnification Claims
We have been notified by one or more of our customers in each of the following matters that we may have an obligation to indemnify them in respect of the products we supply to them:
In January 2013, a patent holding company, Steelhead Licensing LLC, filed a patent litigation lawsuit in the United States District Court for the District of Delaware against one of our customers asserting patent infringement in relation to our customer’s products and services, including the mobile hotspot devices sold to them by us. The lawsuit is in the initial pleadings stage.
In February 2012, a patent holding company, Intellectual Ventures, filed a patent litigation lawsuit in the United States District Court for the District of Delaware against one of our customers asserting patent infringement in relation to several of our customer’s products and services, including the mobile hotspots sold to them by us. The lawsuit is in the initial pleadings stage.
In September 2011, a patent holding company, Mayfair Wireless, LLC, filed a patent litigation lawsuit in the United States District Court for the District of Delaware against two of our customers asserting patent infringement in relation to the wireless hotspots sold to them by us. A motion to dismiss the lawsuit has been briefed and is pending judgment of the Court.
In August 2011, a patent holding company, Brandywine Communications Technologies, LLC, filed a patent litigation lawsuit in the United States District Court for the Middle District of Florida against one of our customers asserting patent infringement in relation to the wireless modems sold to them by us. In December 2012, we advised our customer that we had been granted a license with respect to the patents-in-suit, which license covers any of our products sold by our customers (including this customer). We believe this outcome will not have a material adverse effect on our operating results.
In July 2011, a patent holding company, GPNE Corp., filed a patent litigation lawsuit in the United States District Court for the District of Hawaii asserting patent infringement against one of our customers for selling e-readers and computerized tablet and communication devices with the ability to function with GPRS, including the Nook e-reader which incorporates wireless modules sold to them by us. In May 2012, an Order of the Magistrate Judge to sever the actions and, in the case of certain defendants including our customer, transfer the actions to the United States District Court for the Northern District of California was granted and has been affirmed by the District Court. In November 2012, a mutually agreeable settlement agreement was entered into between our customer and GPNE, and the lawsuit was subsequently dismissed with prejudice. We believe this outcome will not have a material adverse effect on our operating results.
In June 2011, Barnes and Noble, Inc. filed a declaratory judgment action in the United States District Court for the Northern District of California against LSI Corporation (and later added Agere Systems, Inc.) (collectively, “LSI”), seeking a declaration that certain patents were not infringed by their products, including the 3G Nook e-reader which incorporates wireless modules sold to them by us. LSI counterclaimed for patent infringement. There are currently 6 patents-in-suit, two of which relate to the 3G products which incorporate our modules. The lawsuit is currently in the scheduling phase.
A patent holding company, Eon Corp. IP Holdings, LLC, filed a patent litigation lawsuit against one of our customers in October 2010 in the United States District Court for the Eastern District of Texas, which was subsequently transferred to the United States District Court for the Northern District of California. Eon filed a patent litigation lawsuit against another of our customers in January 2012 in the United States District Court for the District of Puerto Rico. In both cases, assertions of patent infringement are being made in relation to the wireless modems sold to our customers by us. Both lawsuits are in the scheduling phase.
In March 2009, MSTG Inc., a patent holding company, filed a patent litigation lawsuit in the United States District Court for the Northern District of Illinois asserting patent infringement by a number of telecommunication carrier companies, including one of our customers, which the customer claims relates to the wireless data cards and modems sold to them by us. In December 2012, the lawsuit was dismissed with prejudice. We believe this outcome will not have a material adverse effect on our operating results.
Although there can be no assurance that an unfavorable outcome would not have a material adverse effect on our operating results, liquidity or financial position, we believe the claims made in the foregoing legal proceedings are without merit and intend to defend ourselves and our products vigorously in all cases.
We are engaged in certain other claims, legal actions and arbitration matters, all in the ordinary course of business, and believe that the ultimate outcome of these claims, legal actions and arbitration matters will not have a material adverse effect on our operating results, liquidity or financial position.
RISKS AND UNCERTAINTIES
Our business is subject to significant risks and uncertainties and past performance is no guarantee of future performance. The risks and uncertainties described below are those which we currently believe to be material, and do not represent all of the risks that we face. Additional risks and uncertainties, not presently known to us, may become material in the future or those risks that we currently believe to be immaterial may become material in the future. If any of the following risks actually occur, alone or in combination, our business, financial condition and results of operations, as well as the market price of our common shares, could be materially adversely affected.
Our financial results are subject to fluctuations that could have a material adverse effect on our business and that could affect the market price of our common shares.
Our revenue, gross margin, operating earnings and net earnings may vary from quarter to quarter and could be significantly impacted by a number of factors, including:
· Price and product competition which may result in lower selling prices for some of our products or lost market share;
· Price and demand pressure on our products from our customers as they experience pressure in their businesses;
· Demand fluctuation based on the success of our customers in selling their products and solutions which incorporate our wireless products and software;
· Concentration in our customer base;
· Development and timing of the introduction of our new products including the timing of sales orders, OEM and distributor customer sell through and design win cycles in our embedded wireless module business;
· Transition periods associated with the migration to new technologies;
· Potential commoditization and saturation in certain markets;
· Our ability to accurately forecast demand in order to properly align the purchase of components and the appropriate level of manufacturing capability;
· Product mix of our sales. Our products have different gross margins — for example the embedded wireless module product line has lower gross margins than the higher margin rugged mobile product line;
· Possible delays or shortages in component supplies;
· Possible delays in the manufacture or shipment of current or new products;
· Possible product quality or factory yield issues that may increase our cost of goods sold;
· Seasonality in demand;
· Amount of inventory held by our channel partners;
· Possible fluctuations in certain foreign currencies relative to the U.S. dollar affect foreign denominated revenue, cost of goods sold and operating expenses;
· Achievement of milestones related to our professional services contracts; and
· Operating expenses that are generally fixed in the short-term and therefore difficult to rapidly adjust to different levels of business.
Any of the factors listed above could cause significant variations in our revenues, gross margin and earnings in any given quarter. Therefore, our quarterly results are not necessarily indicative of our overall business, results of operations, and financial condition.
Quarterly variations in operating results or any of the other factors listed above, changes in financial estimates by securities analysts, or other events or factors may result in wide fluctuations in the market price of our common shares. In addition, the global financial markets have experienced significant price and volume fluctuations that have particularly affected the market prices of equity securities of many technology companies and that often have been unrelated to the operating performance of these companies or have resulted from the failure of the operating results of such companies to meet market expectations in a particular quarter. Broad market fluctuations or any failure of the Company’s operating results in a particular quarter to meet market expectations may adversely affect the market price of our common shares.
The Company may experience adverse effects relating to the divestiture of the assets and operations of the AirCard business.
Divestiture execution is a difficult and complex undertaking that requires different skills than those required for day-to-day operations. We may not achieve the benefits expected from the divestiture and we may experience adverse effects relating to the divestiture of the assets and operations of the AirCard business, including but not limited to:
· The carve-out of the AirCard business from the ongoing business may be disruptive to our ongoing business and place additional demands on our ongoing business.
· We may not be able to restructure our existing business operations and/or grow the ongoing business without encountering difficulties and delays.
· Our relationships with existing customers and suppliers may be adversely affected.
· The divested business will require certain transition services from us and we may not be able to perform those services in a timely and efficient manner and/or exit in prompt manner.
· Unanticipated costs.
· We may not be able to maintain the Company’s financial and strategic focus on the ongoing business.
· Diversion of management attention from the ongoing business.
· Loss of key employees.
· We may be subjected to unforeseen liabilities which could have a material adverse effect on the Company.
Difficulties associated with divestiture could have a material adverse effect on the Company’s business, operating results, financial condition and the price of the Company’s common shares.
Competition from new or established wireless communication companies or from those with greater resources may prevent us from increasing or maintaining our market share and could result in price reductions and/or loss of business with resulting reduced revenues and gross margins.
The wireless communications industry is highly competitive and we have experienced and expect to continue to experience intense competition. More established and larger companies with strong brands and greater financial, technical and marketing resources, or companies with different business models sell products that compete with ours and we expect this competition to intensify. Business combinations or strategic alliances by our competitors or the network carriers could weaken our competitive position. We may also introduce new products that will put us in direct competition with major new competitors. Existing or future competitors may be able to respond more quickly to technological developments and changes and introduce new products before we do or may independently develop and patent technologies and products that are superior to ours or achieve greater acceptance due to factors such as more favourable pricing, more desired or better quality features or more efficient sales channels. If we are unable to compete effectively with our competitors’ pricing strategies, technological advances and other initiatives, we may lose customer orders and market share and we may need to reduce the price of our products, resulting in reduced revenue and reduced gross margins.
The loss of any of our significant customers could adversely affect our revenue and profitability, and therefore shareholder value.
We sell our products through, OEMs, distributors, resellers and network operators, and we are occasionally party to sales agreements with customers comprising a significant portion of our revenue. Most of these customers also sell products of our competitors. Accordingly, our business and future success depends on our ability to maintain and build on existing relationships and develop new relationships with OEMs, distributors, resellers and network operators. If certain of our significant customers, for any reason, discontinues their relationship with us or reduces or postpones current or expected purchase orders for products, or suffers from business failure, our revenues and profitability could decline, perhaps materially. In the year ended December 31, 2012, two customers individually accounted for more than 10% of our aggregated revenue, from continuing and discontinued operations, and on a combined basis, represented approximately 25% of our aggregated revenue. In the year ended December 31, 2011, three customers each accounted for more than 10% of our aggregated revenue from continuing and discontinued operations, and on a combined basis, represented approximately 36% of our aggregated revenue.
In addition, our current customers purchase our products under purchase orders. Our customers have no contractual obligation to continue to purchase our products following our fulfillment of current purchase orders and if they do not continue to make purchases, our revenue and our profitability could decline, perhaps materially.
We may infringe on the intellectual property rights of others.
Our business success depends on us not infringing on the intellectual property rights owned by others. The industry in which we operate has many participants that own, or claim to own, proprietary intellectual property. In the past we have received, and in the future we may continue to receive assertions or claims from third parties alleging that our products violate or infringe their intellectual property rights. We may be subject to these claims directly or through indemnities against these claims which we have provided to
certain customers and other third parties. Our component suppliers and technology licensors do not typically indemnify us against these claims and therefore we do not have recourse against them in the event a claim is asserted against us or a customer we have indemnified. Activity in this area by third parties, particularly those with tenuous claims, is increasing, resulting in us taking a more aggressive defensive approach, which may result in increased litigation. In the last few years, patent claims have been brought against us by third parties whose primary (or sole) business purpose is to acquire patents and other intellectual property rights, and not to manufacture and sell products and services. These entities aggressively pursue patent litigation, resulting in increased litigation costs for us. We expect that this recent development will continue for the foreseeable future. Infringement on intellectual property can be difficult to verify and litigation may be necessary to establish whether or not we have infringed the intellectual property rights of others. In many cases, these third parties are companies with substantially greater resources than us, and they may be able to, and may choose to, pursue complex litigation to a greater degree than we could. Regardless of whether these infringement claims have merit or not, we may be subject to the following:
· We may be liable for potentially substantial damages, liabilities and litigation costs, including attorneys’ fees;
· We may be prohibited from further use of intellectual property as a result of an injunction and may be required to cease selling our products that are subject to the claim;
· We may have to license third party intellectual property, incurring royalty fees that may or may not be on commercially reasonable terms. In addition, there is no assurance that we will be able to successfully negotiate and obtain such a license from the third party;
· We may have to develop a non-infringing alternative, which could be costly and delay or result in the loss of sales. In addition, there is no assurance that we will be able to develop such a non-infringing alternative;
· Management attention and resources may be diverted;
· Our relationships with customers may be adversely affected; and
· We may be required to indemnify our customers for certain costs and damages they incur in such a claim.
In addition to being liable for substantial damages in the event of an unfavourable outcome in such a claim and our inability to either obtain a license from the third party on commercial terms or develop a non-infringing alternative, our business, operating results and financial condition may be materially adversely affected and we may have to cease the sale of certain products and restructure our business.
Under purchase orders and contracts for the sale of our products we may provide indemnification to our customers for potential intellectual property infringement claims for which we may have no corresponding recourse against our third party suppliers. This potential liability, if realized, could materially adversely affect our business, operating results and financial condition.
We may be unable to continue to license necessary third party technology on commercially reasonable terms, if at all.
We license technology, intellectual property and software from third parties for use in our products and from time to time may be required to license additional intellectual property. In some cases, these licenses provide us with certain pass-through rights for the use of other third party intellectual property. There is no assurance that we will be able to maintain our third party licenses or obtain new licenses when required and this inability could materially adversely affect our business and operating results and the quality and functionality of our products.
We depend on a limited number of third parties to purchase certain components and manufacture our products. If they do not manufacture our products properly or cannot meet our needs in a timely manner, we may be unable to fulfill our product delivery obligations and our costs may increase, and our revenue and margins could decrease.
We outsource the purchase of certain components and the manufacturing of our products to a limited number of third parties and depend heavily on the ability of these manufacturers to meet our needs in a timely and satisfactory manner at a reasonable cost. We primarily rely on one contract manufacturer, who may terminate the manufacturing contract with us at the end of any contract year. Our reliance on third party manufacturers subjects us to a number of risks, including the following:
· The absence of guaranteed or adequate manufacturing capacity;
· Reduced control over delivery schedules, production levels, manufacturing yields, costs and product quality;
· Potential business interruption due to unexpected events such as natural disasters, labor unrest or geopolitical events;
· Potential violations of laws and regulations by our manufacturers that may subject us to additional costs for duties, monetary penalties, seizure and loss of our products or loss of our import privileges, and damage our reputation;
· The inability of our contract manufacturers to secure adequate volumes of components in a timely manner at a reasonable cost; and
· Unexpected increases in manufacturing costs.
If we are unable to successfully manage any of these risks or to locate alternative or additional manufacturers or suppliers in a timely and cost-effective manner, we may not be able to deliver products in a timely manner. In addition, our results of operations could be harmed by increased costs, reduced revenues and reduced margins.
Under our manufacturing agreements, in many cases we are required to place binding purchase orders with our manufacturers well in advance of our receipt of binding purchase orders from our customers. In this situation, we consider our customers’ good faith, non-binding forecasts of demand for our products. As a result, if the number of actual products ordered by our customers is materially different from the number of products we have instructed our manufacturer to build (and purchase components in respect of), then, if too many components have been purchased by our manufacturer, we may be required to purchase such excess component inventory, or, if an insufficient number of components have been
purchased by our manufacturer, we may not be in a position to meet all of our customers’ requirements. If we are unable to successfully manage our inventory levels and respond to our customers’ purchase orders based on their forecasted quantities, our business, operating results and financial condition could be adversely affected.
We depend on single source suppliers for some components used in our products and if these suppliers are unable to meet our demand the availability of our products may be materially adversely affected.
Our products are comprised of components some of which are procured from single source suppliers, including where we have licensed certain software embedded in a component. From time to time, certain components used in our products have been, and may continue to be in short supply worldwide and shortages in allocation of components may result in a delay in filling orders from our customers, which may adversely affect our business. In addition, our single source suppliers may experience damage or interruption in their operations, become insolvent or bankrupt, or experience claims of infringement, all of which could delay or stop their shipment of components to us, which may adversely affect our business, operating results and financial condition. Alternate sources of components may not be available. If there is a shortage of any such components and we cannot obtain an appropriate substitute, we may not be able to deliver sufficient quantities of our products, we may lose business or customers and our operating results and financial condition may be materially adversely affected.
We may have difficulty responding to changing technology, industry standards and customer requirements, and therefore be unable to develop new products in a timely manner which meets the needs of our customers.
The wireless communications industry is subject to rapid technological change. Our business and future success will depend, in part, on our ability to accurately predict and anticipate evolving wireless technology standards and develop products that keep pace with the continuing changes in technology, evolving industry standards and changing customer and end-user preferences and requirements. Our products embody complex technology that may not meet those standards, preferences and requirements. Our ability to design, develop and commercially launch new products depends on a number of factors, including, but not limited to the following:
· Our ability to attract and retain skilled technical employees;
· The availability of critical components from third parties;
· Our ability to successfully complete the development of products in a timely manner;
· The ability of third parties to complete and deliver on outsourced product development engagements; and
· Our ability to design and manufacture products at an acceptable cost and quality.
A failure by us, or our suppliers in any of these areas, or a failure of new products to obtain commercial acceptance, could mean we receive less revenue than we anticipate and we may be unable to recover our research and development expenses.
We develop products to meet our customers’ requirements. OEM customers award design wins for the integration of wide area embedded wireless modules on a platform by platform basis. Current design wins do not guarantee future design wins. If we are unable or choose not to meet our customers’ future needs, we may not win their future business and our revenue and profitability may decrease.
In addition, wireless communications service providers require that wireless data systems deployed on their networks comply with their own standards, which may differ from the standards of other providers. We may be unable to successfully address these developments on a timely basis or at all. Our failure to respond quickly and cost-effectively to new developments through the development of new products or enhancements to existing products could cause us to be unable to recover significant research and development expenses and reduce our revenues.
Continued difficult or uncertain global economic conditions could adversely affect our revenue and profitability.
A significant portion of our business is in the United States, Europe and the Asia-Pacific region and we are particularly exposed to the downturns and current uncertainties that impact the wireless communications industry in those economies. The ongoing global market turmoil could lead to an increased level of commercial and consumer delinquencies, lack of consumer confidence, increased market volatility and widespread reduction of business activity generally. To the extent that we experience further global economic deterioration, or deterioration in one of our large markets in the United States, Europe or the Asia-Pacific region, the resulting economic pressure on our customers may cause them to end their relationship with us, reduce or postpone current or expected purchase orders for our products, or suffer from business failure, resulting in a decline in our revenues and profitability that could be material.
It is difficult to estimate or project the level of economic activity, including economic growth, in the markets we serve. As our budgeting and forecasting is based on the demand for our products and services, these economic uncertainties result in it being difficult for us to estimate future revenue and expenses.
Fluctuations in exchange rates between the U.S. dollar and other currencies, including the Canadian dollar, and the Euro may affect our operating results.
We are exposed to currency fluctuations and exchange rate risk on all operations conducted in currencies other than the United States dollar. We cannot accurately predict the future effects of foreign currency fluctuations on our financial condition or results of operations.
The majority of our revenues are denominated in U.S. dollars while a significant amount of our research and development, marketing and administration costs are denominated in currencies other than the U.S. dollar; primarily the Canadian dollar and the Euro. To the extent that exchange rates between the U.S. dollar and the Canadian dollar and Euro fluctuate, we will experience an impact on our earnings.
As our business expands internationally, we will be exposed to additional risks relating to international operations.
We intend to continue to grow our international business operations. Our international operations expose us to additional risks unique to such international markets, including the following:
· Increased credit management risks and greater difficulties in collecting accounts receivable;
· Unexpected changes in regulatory requirements, wireless communications standards, exchange rates, trading policies, tariffs and other barriers;
· Uncertainties of international laws and enforcement relating to the protection of intellectual property;
· Economic or political instability;
· Potential adverse tax consequences;
· Difficulty in managing a worldwide workforce in compliance with business practices and local laws, that vary from country to country; and
· Consumer protection laws that impose additional requirements on us or restrict our ability to provide limited warranty protection.
We may be unable to attract or retain key personnel which may harm our ability to compete effectively.
Our success depends in large part on the abilities and experience of our executive officers and other key employees. Competition for highly skilled management, technical, research and development and other key employees is intense in the wireless communications industry. We may not be able to retain our current executive officers or key employees and may not be able to hire and transition in a timely manner experienced and highly qualified additional executive officers and key employees as needed to achieve our business objectives. We do not have fixed-term employment agreements with our key personnel. The loss of executive officers and key employees could disrupt our operations and our ability to compete effectively could be adversely affected.
Furthermore, loss of key employees or deterioration in overall employee morale and engagement as a result of organizational change could have an adverse impact on our growth, business and profitability.
We rely on certain internal processes, infrastructure and information technology systems to efficiently operate and report on our business.
The inability to continue to enhance or prevent a failure of these internal processes, infrastructure or information technology systems could negatively impact our ability to operate or accurately report on our business.
Acquisitions and divestitures of business or technologies may result in disruptions to our business or may not achieve the anticipated benefits.
The growth of our Company through the successful acquisition and integration of complementary businesses is an important component of our business strategy. We continue to seek opportunities to acquire or invest in businesses, products and technologies that expand, complement or otherwise relate
to our business. For example, on August 1, 2012, we completed our acquisition of Sagemcom’s M2M business. Any acquisitions, investments or business combinations by us may be accompanied by risks commonly encountered including:
· Exposure to unknown liabilities or risks of the acquired companies, including unknown litigation related to acts or omissions of an acquired company and/or its directors and officers prior to the acquisition, deficiencies in disclosure controls and procedures of our acquired company and deficiencies in internal controls over financial reporting of our acquired Company;
· Higher than anticipated acquisition and integration costs and expenses;
· The difficulty and expense of integrating the operations and personnel of the acquired companies;
· Possible use of cash to support the operations of an acquired business;
· Possible increase in foreign exchange translation risk depending on the currency denomination of the revenue and expenses of the acquired business;
· Disruption of, and demands on, our ongoing business as a result of integration activities including diversion of management’s time and attention from the ongoing business;
· Failure to maximize our financial and strategic position by the successful incorporation of acquired technology;
· The inability to implement uniform standards, disclosure controls and procedures, internal controls over financial reporting and other procedures and policies in a timely manner;
· The potential loss of key employees and customers;
· A possible decrease in our share price, if, as a result of the growth of the Company, we decide to raise additional capital through an offering of common shares, preference shares or debt; and
· Possible dilution to our shareholders if the purchase price is paid in common shares or securities convertible into common shares.
In addition, geographic distances may make integration of businesses more difficult. We may not be successful in overcoming these risks or any other problems encountered in connection with any acquisitions. If realized, these risks could reduce shareholder value.
As business circumstances dictate, the Company may also decide to divest assets, technologies or businesses, for example, the pending sale of our AirCard business. In doing so, the Company may not be successful in identifying or managing the risks commonly encountered, including: higher than anticipated costs; disruption of, and demands on, our ongoing business; diversion of management’s time and attention; adverse effects on existing business relationships with suppliers and customers and employee issues. We may not be successful in overcoming these risks or any other problems encountered in connection with a divestiture of assets, technologies or businesses which, if realized, could reduce shareholder value.
In addition, we may be unsuccessful at bringing to conclusion, proposed transactions. Negotiations and closing activities of transactions are complex functions subject to numerous unforeseen events that may impede the speed at which a transaction is closed or even prevent a transaction from closing. Failure to conclude transactions in an efficient manner may prevent us from advancing other opportunities or introduce unanticipated transition costs.
Misappropriation of our intellectual property could place us at a competitive disadvantage.
Our intellectual property is important to our success. We rely on a combination of patent protection, copyrights, trademarks, trade secrets, licenses, non-disclosure agreements and other contractual agreements to protect our intellectual property. Third parties may attempt to copy aspects of our products and technology or obtain information we regard as proprietary without our authorization. If we
are unable to protect our intellectual property against unauthorized use by others it could have an adverse effect on our competitive position.
Our strategies to deter misappropriation could be inadequate due to the following risks:
· Non-recognition of the proprietary nature or inadequate protection of our methodologies in the United States, Canada, France or other foreign countries;
· Undetected misappropriation of our intellectual property;
· The substantial legal and other costs of protecting and enforcing our rights in our intellectual property; and
· Development of similar technologies by our competitors.
In addition, we could be required to spend significant funds and management resources could be diverted in order to defend our rights, which could disrupt our operations.
We have been subject to, and may in the future be subject to, certain class action lawsuits, which if decided against us, could require us to pay substantial judgments, settlements or other penalties.
In addition to being subject to litigation in the ordinary course of business, in the future, we may be subject to class actions and other securities litigation and investigations. We expect that this type of litigation will be time consuming, expensive and distracting from the conduct of our daily business. It is possible that we will be required to pay substantial judgments, settlements or other penalties and incur expenses that could have a material adverse effect on our operating results, liquidity or financial position. Expenses incurred in connection with these lawsuits, which include substantial fees of lawyers and other professional advisors and our obligations to indemnify officers and directors who may be parties to such actions, could materially adversely affect our operating results, liquidity or financial position. Although we have certain insurance policies in place to transfer risk, we do not know with certainty if any of this type of litigation and resulting expenses will be fully or even partially covered by insurance. In addition, these lawsuits may cause our insurance premiums to increase in future periods.
We depend on wireless network carriers to promote and offer acceptable wireless data and voice communications services for our products to operate.
Our products can only be used over wireless data and voice networks operated by third parties. Our business and future growth depends, in part, on the successful deployment by network carriers of next generation wireless data and voice networks and the network carriers’ ability to grow their subscriber base. If these network carriers delay the deployment or expansion of next generation networks, fail to offer effective and reliable service, or fail to price and market their services effectively, sales of our products will decline and our revenues will decrease.
Government regulation could result in increased costs and inability to sell our products.
Our products are subject to certain mandatory regulatory approvals in the United States, Canada, the European Union, the Asia-Pacific region and other regions in which we operate. For example, in the United States, the Federal Communications Commission regulates many aspects of communications devices. In Canada, similar regulations are administered by the Ministry of Industry, through Industry Canada.
European Union directives provide comparable regulatory guidance in Europe. Although we have obtained all the necessary Federal Communications Commission, Industry Canada and other required approvals for the products we currently sell, we may not obtain approvals for future products on a timely basis, or at all. In addition, regulatory requirements may change or we may not be able to obtain regulatory approvals from countries in which we may desire to sell products in the future.
Failures of our products or services due to quality issues, design flaws, errors or other defects that result in product liability claims and product recalls could lead to unanticipated costs or otherwise harm our business.
Our products comprise hardware and software that is technologically complex. In order to compete in the technologically advanced and rapidly changing wireless communication market, we must develop and introduce our products quickly. Despite the sophisticated testing and certification processes for our products, it is possible that our products may contain undetected errors or defects, especially when introduced or when new versions are released. As a result, our products may be rejected by our customers leading to loss of business, loss of revenue, additional development and customer service costs, unanticipated warranty claims, payment of monetary damages under contractual provisions and damage to our reputation.
MANAGEMENT’S STATEMENT OF RESPONSIBILITIES
The accompanying consolidated financial statements have been prepared by management and approved by the Board of Directors of Sierra Wireless, Inc. The consolidated financial statements were prepared in accordance with accounting principles generally accepted in the United States and, where appropriate, reflect management’s best estimates and judgments. Where alternative accounting methods exist, management has chosen those methods deemed most appropriate in the circumstances. Management is responsible for the accuracy, integrity and objectivity of the consolidated financial statements within reasonable limits of materiality. Financial information provided elsewhere in the Annual Report is consistent with that in the consolidated financial statements.
To assist management in the discharge of these responsibilities, the Company maintains a system of internal controls over financial reporting as described in Management’s Annual Report on Internal Control Over Financial Reporting on page 39 of Management’s Discussion and Analysis.
The Company’s Audit Committee is appointed by the Board of Directors annually and is comprised exclusively of outside, independent directors. The Audit Committee meets with management as well as with the independent auditors to satisfy itself that management is properly discharging its financial reporting responsibilities and to review the consolidated financial statements and the independent auditors’ report. The Audit Committee reports its findings to the Board of Directors for consideration in approving the consolidated financial statements for presentation to the shareholders. The Audit Committee considers, for review by the Board of Directors and approval by the shareholders, the engagement or reappointment of the independent auditors. KPMG LLP has direct access to the Audit Committee of the Board of Directors.
The consolidated financial statements have been independently audited by KPMG LLP, Chartered Accountants, on behalf of the shareholders, in accordance with the standards of the Public Company Accounting Oversight Board (United States) with respect to the consolidated financial statements for the year ended December 31, 2012. Their report outlines the nature of their audit and expresses their opinion on the consolidated financial statements of the Company.
|
|
|
|
|
|
|
| ||
Jason W. Cohenour |
| David G. McLennan | ||
President and |
| Chief Financial Officer | ||
Chief Executive Officer |
|
| ||


Vancouver, Canada
March 7, 2013
REPORT OF INDEPENDENT REGISTERED PUBLIC ACCOUNTING FIRM
To the Shareholders and Board of Directors of Sierra Wireless, Inc.
We have audited the accompanying consolidated balance sheets of Sierra Wireless, Inc. as of December 31, 2012 and 2011 and the related consolidated statements of operations, comprehensive earnings (loss), equity and cash flows for each of the years in the three-year period ended December 31, 2012. These consolidated financial statements are the responsibility of Sierra Wireless, Inc.’s management. Our responsibility is to express an opinion on these consolidated financial statements based on our audits.
We conducted our audits in accordance with the standards of the Public Company Accounting Oversight Board (United States). Those standards require that we plan and perform the audit to obtain reasonable assurance about whether the financial statements are free of material misstatement. An audit includes examining, on a test basis, evidence supporting the amounts and disclosures in the financial statements. An audit also includes assessing the accounting principles used and significant estimates made by management, as well as evaluating the overall financial statement presentation. We believe that our audits provide a reasonable basis for our opinion.
In our opinion, the consolidated financial statements referred to above present fairly, in all material respects, the consolidated financial position of Sierra Wireless, Inc. as of December 31, 2012 and 2011 and its consolidated results of operations and its consolidated cash flows for each of the years in the three-year period ended December 31, 2012 in conformity with U.S. generally accepted accounting principles.
We also have audited, in accordance with the standards of the Public Company Accounting Oversight Board (United States), Sierra Wireless, Inc.’s internal control over financial reporting as of December 31, 2012, based on the criteria established in Internal Control — Integrated Framework issued by the Committee of Sponsoring Organizations of the Treadway Commission (COSO), and our report dated March 7, 2013 expressed an unqualified opinion on the effectiveness of the Company’s internal control over financial reporting.

Chartered Accountants
Vancouver, Canada
March 7, 2013
REPORT OF INDEPENDENT REGISTERED PUBLIC ACCOUNTING FIRM
To the Shareholders and Board of Directors of Sierra Wireless, Inc.
We have audited Sierra Wireless, Inc.’s internal control over financial reporting as of December 31, 2012, based on the criteria established in Internal Control—Integrated Framework issued by the Committee of Sponsoring Organizations of the Treadway Commission (COSO). Sierra Wireless, Inc.’s management is responsible for maintaining effective internal control over financial reporting and for its assessment of the effectiveness of internal control over financial reporting included in the accompanying Management’s Annual Report on Internal Control Over Financial Reporting. Our responsibility is to express an opinion on Sierra Wireless, Inc.’s internal control over financial reporting based on our audit.
We conducted our audit in accordance with the standards of the Public Company Accounting Oversight Board (United States). Those standards require that we plan and perform the audit to obtain reasonable assurance about whether effective internal control over financial reporting was maintained in all material respects. Our audit included obtaining an understanding of internal control over financial reporting, assessing the risk that a material weakness exists, and testing and evaluating the design and operating effectiveness of internal control based on the assessed risk. Our audit also included performing such other procedures as we considered necessary in the circumstances. We believe that our audit provides a reasonable basis for our opinion.
A company’s internal control over financial reporting is a process designed to provide reasonable assurance regarding the reliability of financial reporting and the preparation of financial statements for external purposes in accordance with generally accepted accounting principles. A company’s internal control over financial reporting includes those policies and procedures that (1) pertain to the maintenance of records that, in reasonable detail, accurately and fairly reflect the transactions and dispositions of the assets of the company; (2) provide reasonable assurance that transactions are recorded as necessary to permit preparation of financial statements in accordance with generally accepted accounting principles, and that receipts and expenditures of the company are being made only in accordance with authorizations of management and directors of the company; and (3) provide reasonable assurance regarding prevention or timely detection of unauthorized acquisition, use, or disposition of the company’s assets that could have a material effect on the financial statements.
Because of its inherent limitations, internal control over financial reporting may not prevent or detect misstatements. Also, projections of any evaluation of effectiveness to future periods are subject to the risk that controls may become inadequate because of changes in conditions, or that the degree of compliance with the policies or procedures may deteriorate.
In our opinion, Sierra Wireless, Inc. maintained, in all material respects, effective internal control over financial reporting as of December 31, 2012, based on the criteria established in Internal Control—Integrated Framework issued by the Committee of Sponsoring Organizations of the Treadway Commission (COSO).
We also have audited, in accordance with the standards of the Public Company Accounting Oversight Board (United States), the consolidated balance sheets of Sierra Wireless, Inc. as of December 31, 2012 and 2011, and the related consolidated statements of operations, comprehensive earnings (loss), equity and cash flows for each of the years in the three-year period ended December 31, 2012, and our report dated March 7, 2013 expressed an unqualified opinion on those consolidated financial statements.
Chartered Accountants
Vancouver, Canada
March 7, 2013
SIERRA WIRELESS, INC.
CONSOLIDATED BALANCE SHEETS
(in thousands of U.S. dollars)
|
| As at December 31, |
| ||||
|
| 2012 |
| 2011 |
| ||
Assets |
|
|
|
|
| ||
Current assets |
|
|
|
|
| ||
Cash and cash equivalents |
| $ | 63,646 |
| $ | 101,375 |
|
Short-term investments (note 7) |
| — |
| 9,347 |
| ||
Accounts receivable (note 8) |
| 108,624 |
| 107,367 |
| ||
Inventories (note 9) |
| 12,675 |
| 16,168 |
| ||
Deferred income taxes (note 16) |
| 22,199 |
| 6,540 |
| ||
Prepaids and other (note 10) |
| 24,252 |
| 20,674 |
| ||
Assets held for sale (note 6) |
| 54,340 |
| — |
| ||
|
| 285,736 |
| 261,471 |
| ||
Property and equipment (note 11) |
| 20,039 |
| 22,087 |
| ||
Intangible assets (note 12) |
| 56,357 |
| 42,557 |
| ||
Goodwill (note 13) |
| 97,961 |
| 89,961 |
| ||
Deferred income taxes (note 16) |
| 3,880 |
| 6,205 |
| ||
Other assets |
| 790 |
| 606 |
| ||
|
| $ | 464,763 |
| $ | 422,887 |
|
Liabilities |
|
|
|
|
| ||
Current liabilities |
|
|
|
|
| ||
Accounts payable and accrued liabilities (note 14) |
| $ | 128,216 |
| $ | 123,547 |
|
Deferred income taxes (note 16) |
| — |
| 336 |
| ||
Deferred revenue and credits |
| 1,312 |
| 1,721 |
| ||
Liabilities held for sale (note 6) |
| 10,353 |
| — |
| ||
|
| 139,881 |
| 125,604 |
| ||
Long-term obligations (note 15) |
| 26,526 |
| 25,143 |
| ||
Deferred income taxes (note 16) |
| 300 |
| 236 |
| ||
|
| 166,707 |
| 150,983 |
| ||
Equity |
|
|
|
|
| ||
Shareholders’ equity |
|
|
|
|
| ||
Common stock: no par value; unlimited shares authorized; issued and outstanding: 30,592,423 shares (December 31, 2011 — 31,306,692 shares) |
| 322,770 |
| 328,440 |
| ||
Preferred stock: no par value; unlimited shares authorized; issued and outstanding: nil shares |
| — |
| — |
| ||
Treasury stock: at cost; 716,313 shares (December 31, 2011 — 877,559 shares) |
| (5,172 | ) | (6,141 | ) | ||
Additional paid-in capital |
| 23,203 |
| 20,087 |
| ||
Deficit |
| (35,283 | ) | (62,482 | ) | ||
Accumulated other comprehensive loss (note 17) |
| (7,462 | ) | (8,000 | ) | ||
|
| 298,056 |
| 271,904 |
| ||
|
| $ | 464,763 |
| $ | 422,887 |
|
|
|
|
|
|
|
|
|
Subsequent events (note 6 and note 23) |
|
|
|
|
|
|
|
Commitments and contingencies (note 28) |
|
|
|
|
|
|
|
The accompanying notes are an integral part of the consolidated financial statements.
On behalf of the Board:
Jason W. Cohenour |
Robin A. Abrams |
Director | Director |


SIERRA WIRELESS, INC.
CONSOLIDATED STATEMENTS OF OPERATIONS
(in thousands of U.S. dollars, except where otherwise stated)
|
| Years ended December 31, |
| |||||||
|
| 2012 |
| 2011 |
| 2010 |
| |||
Revenue |
| $ | 397,321 |
| $ | 333,175 |
| $ | 358,005 |
|
Cost of goods sold |
| 272,047 |
| 231,435 |
| 236,599 |
| |||
Gross margin |
| 125,274 |
| 101,740 |
| 121,406 |
| |||
Expenses |
|
|
|
|
|
|
| |||
Sales and marketing |
| 37,067 |
| 37,188 |
| 42,472 |
| |||
Research and development (note 18) |
| 61,785 |
| 60,903 |
| 60,890 |
| |||
Administration |
| 32,777 |
| 33,716 |
| 36,021 |
| |||
Acquisition costs (note 5) |
| 3,182 |
| — |
| — |
| |||
Restructuring (note 19) |
| 2,251 |
| 837 |
| 7,640 |
| |||
Integration (note 20) |
| — |
| 1,426 |
| 5,110 |
| |||
Impairment of intangible asset (note 12) |
| — |
| 11,214 |
| — |
| |||
Amortization |
| 10,418 |
| 10,709 |
| 11,990 |
| |||
|
| 147,480 |
| 155,993 |
| 164,123 |
| |||
Loss from operations |
| (22,206 | ) | (54,253 | ) | (42,717 | ) | |||
Foreign exchange gain (loss) |
| 3,326 |
| (460 | ) | (7,000 | ) | |||
Other income (expense) (note 21) |
| (196 | ) | 35 |
| (241 | ) | |||
Loss before income taxes |
| (19,076 | ) | (54,678 | ) | (49,958 | ) | |||
Income tax recovery (note 16) |
| (14,874 | ) | (3,968 | ) | (14,985 | ) | |||
Net loss from continuing operations |
| (4,202 | ) | (50,710 | ) | (34,973 | ) | |||
Net earnings from discontinued operations (note 6) |
| 31,401 |
| 21,338 |
| 20,174 |
| |||
Net earnings (loss) |
| 27,199 |
| (29,372 | ) | (14,799 | ) | |||
Net loss attributable to non-controlling interest (note 25) |
| — |
| (57 | ) | (258 | ) | |||
Net earnings (loss) attributable to the Company |
| $ | 27,199 |
| $ | (29,315 | ) | $ | (14,541 | ) |
Basic and diluted net earnings (loss) per share attributable to the Company’s common shareholders (in dollars) (note 22) |
|
|
|
|
|
|
| |||
Continuing operations |
| $ | (0.14 | ) | $ | (1.62 | ) | $ | (1.12 | ) |
Discontinued operations |
| 1.02 |
| 0.68 |
| 0.65 |
| |||
|
| $ | 0.88 |
| $ | (0.94 | ) | $ | (0.47 | ) |
|
|
|
|
|
|
|
| |||
Weighted average number of shares outstanding (in thousands) (note 22) |
|
|
|
|
|
|
| |||
Basic |
| 30,788 |
| 31,275 |
| 31,083 |
| |||
Diluted |
| 30,788 |
| 31,275 |
| 31,083 |
| |||
The accompanying notes are an integral part of the consolidated financial statements.
SIERRA WIRELESS, INC.
CONSOLIDATED STATEMENTS OF COMPREHENSIVE EARNINGS (LOSS)
(in thousands of U.S. dollars)
|
| Years ended December 31, |
| |||||||
|
| 2012 |
| 2011 |
| 2010 |
| |||
Net earnings (loss) |
| $ | 27,199 |
| $ | (29,372 | ) | $ | (14,799 | ) |
Other comprehensive income (loss), net of taxes: |
|
|
|
|
|
|
| |||
Release of foreign currency translation relating to acquisition of non- controlling interest, net of taxes of $nil |
| — |
| 42 |
| 32 |
| |||
Foreign currency translation adjustments, net of taxes of $nil |
| 538 |
| (2,571 | ) | (5,466 | ) | |||
Total comprehensive earnings (loss) |
| 27,737 |
| (31,901 | ) | (20,233 | ) | |||
Comprehensive loss attributable to non-controlling interest: |
|
|
|
|
|
|
| |||
Net loss |
| — |
| (57 | ) | (258 | ) | |||
Foreign currency translation adjustments, net of taxes of $nil |
| — |
| (49 | ) | 228 |
| |||
Comprehensive earnings (loss) attributable to the Company |
| $ | 27,737 |
| $ | (31,795 | ) | $ | (20,203 | ) |
The accompanying notes are an integral part of the consolidated financial statements.
SIERRA WIRELESS, INC.
CONSOLIDATED STATEMENTS OF EQUITY
(in thousands of U.S. dollars)
|
| Equity attributable to the Company |
|
|
|
|
| |||||||||||||||||||
|
| Common Stock |
| Treasury Shares |
| Additional |
|
|
| Accumulated |
| Non- |
|
|
| |||||||||||
|
| # of shares |
| $ |
| # of shares |
| $ |
| capital |
| Deficit |
| income (loss) |
| (deficit) |
| Total |
| |||||||
Balance as at December 31, 2009 |
| 31,048,907 |
| $ | 326,043 |
| 1,086,652 |
| $ | (6,442 | ) | $ | 13,133 |
| $ | (18,626 | ) | $ | (37 | ) | $ | 2,525 |
| $ | 316,596 |
|
|
|
|
|
|
|
|
|
|
|
|
|
|
|
|
|
|
|
|
| |||||||
Purchase of Wavecom S.A. shares |
| — |
| — |
| — |
| — |
| (229 | ) | — |
| 32 |
| (1,356 | ) | (1,553 | ) | |||||||
Stock option tax benefit for U.S. employees |
| — |
| — |
| — |
| — |
| 151 |
| — |
| — |
| — |
| 151 |
| |||||||
Stock option exercises (note 24) |
| 173,879 |
| 1,625 |
| — |
| — |
| (551 | ) | — |
| — |
| — |
| 1,074 |
| |||||||
Stock-based compensation (note 24) |
| — |
| — |
| — |
| — |
| 6,956 |
| — |
| — |
| — |
| 6,956 |
| |||||||
Distribution of vested RSUs |
| — |
| — |
| (443,610 | ) | 2,534 |
| (2,534 | ) | — |
| — |
| — |
| — |
| |||||||
Net loss |
| — |
| — |
| — |
| — |
| — |
| (14,541 | ) | — |
| (258 | ) | (14,799 | ) | |||||||
Foreign currency translation adjustments, net of tax |
| — |
| — |
| — |
| — |
| — |
| — |
| (5,466 | ) | 228 |
| (5,238 | ) | |||||||
Balance as at December 31, 2010 |
| 31,222,786 |
| $ | 327,668 |
| 643,042 |
| $ | (3,908 | ) | $ | 16,926 |
| $ | (33,167 | ) | $ | (5,471 | ) | $ | 1,139 |
| $ | 303,187 |
|
|
|
|
|
|
|
|
|
|
|
|
|
|
|
|
|
|
|
|
| |||||||
Purchase of Wavecom S.A. shares |
| — |
| — |
| — |
| — |
| (796 | ) | — |
| 42 |
| (1,033 | ) | (1,787 | ) | |||||||
Stock option exercises (note 24) |
| 83,906 |
| 772 |
| — |
| — |
| (253 | ) | — |
| — |
| — |
| 519 |
| |||||||
Stock-based compensation (note 24) |
| — |
| — |
| — |
| — |
| 6,449 |
| — |
| — |
| — |
| 6,449 |
| |||||||
Purchase of treasury shares for RSU distribution |
| — |
| — |
| 613,638 |
| (4,472 | ) | — |
| — |
| — |
| — |
| (4,472 | ) | |||||||
Distribution of vested RSUs |
| — |
| — |
| (379,121 | ) | 2,239 |
| (2,239 | ) | — |
| — |
| — |
| — |
| |||||||
Net loss |
| — |
| — |
| — |
| — |
| — |
| (29,315 | ) | — |
| (57 | ) | (29,372 | ) | |||||||
Foreign currency translation adjustments, net of tax |
| — |
| — |
| — |
| — |
| — |
| — |
| (2,571 | ) | (49 | ) | (2,620 | ) | |||||||
Balance as at December 31, 2011 |
| 31,306,692 |
| $ | 328,440 |
| 877,559 |
| $ | (6,141 | ) | $ | 20,087 |
| $ | (62,482 | ) | $ | (8,000 | ) | $ | — |
| $ | 271,904 |
|
Common share cancellation (note 23) |
| (800,000 | ) | (6,312 | ) | — |
| — |
| — |
| — |
| — |
| — |
| (6,312 | ) | |||||||
Stock option tax benefit for U.S. employees |
| — |
| — |
| — |
| — |
| 71 |
| — |
| — |
| — |
| 71 |
| |||||||
Stock option exercises (note 24) |
| 85,051 |
| 637 |
| — |
| — |
| (201 | ) | — |
| — |
| — |
| 436 |
| |||||||
Stock-based compensation (note 24) |
| — |
| — |
| — |
| — |
| 6,713 |
| — |
| — |
| — |
| 6,713 |
| |||||||
Purchase of treasury shares for RSU distribution |
| — |
| — |
| 336,638 |
| (2,489 | ) | — |
| — |
| — |
| — |
| (2,489 | ) | |||||||
Distribution of vested RSUs |
| 680 |
| 5 |
| (497,884 | ) | 3,458 |
| (3,467 | ) | — |
| — |
| — |
| (4 | ) | |||||||
Net earnings |
| — |
| — |
| — |
| — |
| — |
| 27,199 |
| — |
| — |
| 27,199 |
| |||||||
Foreign currency translation adjustments, net of tax |
| — |
| — |
| — |
| — |
| — |
| — |
| 538 |
| — |
| 538 |
| |||||||
Balance as at December 31, 2012 |
| 30,592,423 |
| $ | 322,770 |
| 716,313 |
| $ | (5,172 | ) | $ | 23,203 |
| $ | (35,283 | ) | $ | (7,462 | ) | $ | — |
| $ | 298,056 |
|
The accompanying notes are an integral part of the consolidated financial statements.
SIERRA WIRELESS, INC.
CONSOLIDATED STATEMENTS OF CASH FLOWS
(in thousands of U.S. dollars)
|
| Years ended December 31, |
| |||||||
|
| 2012 |
| 2011 |
| 2010 |
| |||
Cash flows provided (used) by: |
|
|
|
|
|
|
| |||
Operating activities |
|
|
|
|
|
|
| |||
Net earnings (loss) |
| $ | 27,199 |
| $ | (29,372 | ) | $ | (14,799 | ) |
Items not requiring (providing) cash |
|
|
|
|
|
|
| |||
Amortization |
| 28,590 |
| 32,386 |
| 34,990 |
| |||
Stock-based compensation (note 24(a)) |
| 6,713 |
| 6,449 |
| 6,956 |
| |||
Non-cash restructuring and other |
| — |
| — |
| (859 | ) | |||
Tax benefit on stock option deduction |
| 71 |
| — |
| 151 |
| |||
Deferred income taxes |
| (13,606 | ) | (2,903 | ) | (3,374 | ) | |||
Loss (gain) on disposal of property, equipment, and intangibles |
| 107 |
| 40 |
| (95 | ) | |||
Impairment of intangible assets |
| — |
| 11,214 |
| — |
| |||
Taxes paid related to net settlement of equity awards |
| (4 | ) | — |
| — |
| |||
Changes in non-cash working capital |
|
|
|
|
|
|
| |||
Accounts receivable |
| (616 | ) | 9,067 |
| (35,671 | ) | |||
Inventories |
| (4,019 | ) | 5,664 |
| (11,399 | ) | |||
Prepaid expenses and other |
| (14,543 | ) | 4,248 |
| 7,104 |
| |||
Accounts payable and accrued liabilities |
| 10,997 |
| (13,783 | ) | 12,116 |
| |||
Deferred revenue and credits |
| (422 | ) | 733 |
| 480 |
| |||
Cash flows provided (used) by operating activities |
| 40,467 |
| 23,743 |
| (4,400 | ) | |||
Investing activities |
|
|
|
|
|
|
| |||
Acquisition of M2M business of Sagemcom (note 5) |
| (55,218 | ) | — |
| — |
| |||
Purchase of Wavecom S.A. shares |
| — |
| (1,787 | ) | (1,553 | ) | |||
Additions to property and equipment |
| (15,845 | ) | (14,268 | ) | (12,580 | ) | |||
Proceeds from sale of property, equipment, and intangibles |
| 139 |
| 31 |
| 99 |
| |||
Increase in intangible assets |
| (2,607 | ) | (3,740 | ) | (3,976 | ) | |||
Net change in short-term investments |
| 9,347 |
| 17,058 |
| 489 |
| |||
Cash flows used by investing activities |
| (64,184 | ) | (2,706 | ) | (17,521 | ) | |||
Financing activities |
|
|
|
|
|
|
| |||
Issuance of common shares, net of share issue costs |
| 436 |
| 519 |
| 1,074 |
| |||
Repurchase of common shares for cancellation |
| (6,312 | ) | — |
| — |
| |||
Purchase of treasury shares for RSU distribution |
| (2,489 | ) | (4,472 | ) | — |
| |||
Decrease in other long-term obligations |
| (1,000 | ) | (905 | ) | (2,615 | ) | |||
Cash flows used by financing activities |
| (9,365 | ) | (4,858 | ) | (1,541 | ) | |||
Effect of foreign exchange rate changes on cash and cash equivalents |
| (4,647 | ) | (247 | ) | 1,414 |
| |||
Cash and cash equivalents, increase (decrease) in the year |
| (37,729 | ) | 15,932 |
| (22,048 | ) | |||
Cash and cash equivalents, beginning of year |
| 101,375 |
| 85,443 |
| 107,491 |
| |||
Cash and cash equivalents, end of year |
| $ | 63,646 |
| $ | 101,375 |
| $ | 85,443 |
|
Supplemental disclosures: |
|
|
|
|
|
|
| |||
Net income taxes paid (received) |
| $ | 2,022 |
| $ | (1,926 | ) | $ | 1,112 |
|
Net interest paid |
| 88 |
| 32 |
| 173 |
| |||
Non-cash purchase of property and equipment (funded by obligation under capital lease) |
| 335 |
| 148 |
| 227 |
| |||
The accompanying notes are an integral part of the consolidated financial statements.
SIERRA WIRELESS, INC.
TABLE OF CONTENTS
NOTES TO THE CONSOLIDATED FINANCIAL STATEMENTS
|
|
|
| Page |
Note 1 |
| Nature of Operations |
| 63 |
Note 2 |
| Summary of Significant Accounting Policies |
| 64 |
Note 3 |
| Recently Implemented Accounting Standards |
| 70 |
Note 4 |
| Changes in Future Accounting Standards |
| 70 |
Note 5 |
| Acquisition of M2M Business of Sagemcom |
| 70 |
Note 6 |
| Disposition of AirCard Business |
| 72 |
Note 7 |
| Short-term Investments |
| 73 |
Note 8 |
| Accounts Receivable |
| 73 |
Note 9 |
| Inventories |
| 74 |
Note 10 |
| Prepaids and Other |
| 74 |
Note 11 |
| Property and Equipment |
| 75 |
Note 12 |
| Intangible Assets |
| 76 |
Note 13 |
| Goodwill |
| 77 |
Note 14 |
| Accounts Payable and Accrued Liabilities |
| 77 |
Note 15 |
| Long-term Obligations |
| 77 |
Note 16 |
| Income Taxes |
| 78 |
Note 17 |
| Accumulated Other Comprehensive Loss |
| 81 |
Note 18 |
| Research and Development |
| 81 |
Note 19 |
| Restructuring |
| 82 |
Note 20 |
| Integration |
| 83 |
Note 21 |
| Other Income (Expense) |
| 83 |
Note 22 |
| Earnings (Loss) Per Share |
| 84 |
Note 23 |
| Share Capital |
| 84 |
Note 24 |
| Stock-based Compensation Plans |
| 84 |
Note 25 |
| Non-controlling Interest |
| 88 |
Note 26 |
| Fair Value Measurement |
| 88 |
Note 27 |
| Financial Instruments |
| 89 |
Note 28 |
| Commitments and Contingencies |
| 90 |
Note 29 |
| Segmented Information |
| 95 |
SIERRA WIRELESS, INC.
(in thousands of U.S. dollars, except where otherwise noted)
Notes to the Consolidated Financial Statements
1. NATURE OF OPERATIONS
Sierra Wireless, Inc., together with its subsidiaries (collectively, the “company, we, our”) was incorporated under the Canada Business Corporations Act on May 31, 1993. We are a global leader in the development of wireless technologies and solutions. We focus on wireless devices and applications, offering a comprehensive portfolio of products and services that reduce complexity for our customers. With sales, engineering, and research and development teams located in offices around the world, we provide leading edge wireless solutions for the machine-to-machine (“M2M”) and mobile computing markets. We develop and market a range of products that include wireless modems for mobile computers, embedded modules and software for original equipment manufacturers (“OEMs”), intelligent wireless gateway solutions for industrial, commercial and public safety applications, and an innovative platform for delivering device management and end-to-end application services. We also offer professional services to OEM customers during their product development and launch process, leveraging our expertise in wireless design, software, integration and certification to provide built-in wireless connectivity for mobile computing devices and M2M solutions. Our products, services and solutions connect people, their mobile computers and machines to wireless voice and data networks around the world.
We implemented a new organizational structure during the fourth quarter of 2010 and we have two reportable segments effective January 1, 2011.
Mobile Computing | — | includes AirCard mobile broadband devices and AirPrime wireless embedded modules for PC OEM customers |
|
|
|
Machine-to- Machine | — | includes AirPrime embedded wireless modules (excluding embedded module sales to PC OEMs), AirLink Intelligent Gateways, and AirVantage M2M Cloud. Effective August 1, 2012, also includes rugged terminals for railway applications (note 5) |
The primary markets for our products are North America, Europe and Asia Pacific.
On January 28, 2013, we announced a definitive agreement for the sale of substantially all of the assets and operations related to our AirCard business. The transaction is expected to close in early April 2013, subject to customary closing conditions. In accordance with United States (“U.S.”) generally accepted accounting principles (“U.S. GAAP”), assets and liabilities associated with the sale have been recorded as “held for sale” in our consolidated balance sheet as at December 31, 2012 and the results of operations of the AirCard business as discontinued operations in our consolidated statements of operations for each of the years in the three-year period ended December 31, 2012 (note 6).
SIERRA WIRELESS, INC.
(in thousands of U.S. dollars, except where otherwise noted)
Notes to the Consolidated Financial Statements
2. SUMMARY OF SIGNIFICANT ACCOUNTING POLICIES
Our consolidated financial statements are prepared in accordance with U.S. GAAP.
(a) Basis of consolidation
Our consolidated financial statements include the accounts of the company and its wholly-owned subsidiaries from their respective dates of acquisition of control. All inter-company transactions and balances have been eliminated on consolidation. The ownership of the other non-controlling interest holders of consolidated subsidiaries is reflected as non-controlling interest and is not significant.
(b) Use of estimates
The consolidated financial statements have been prepared in conformity with U.S. GAAP, which requires management to make estimates and assumptions that affect the reported amounts of assets and liabilities, the disclosure of contingent assets and liabilities at the date of the financial statements, and the reported amounts of revenues and expenses during the year. On an ongoing basis, management reviews its estimates, including those related to inventory obsolescence, estimated useful lives of assets, valuation of intangible assets, goodwill, royalty and warranty accruals, lease provisions, other liabilities, stock-based compensation, bad debt and doubtful accounts, income taxes, restructuring costs, and commitment and contingencies, based on currently available information. Actual amounts could differ from estimates.
(c) Translation of foreign currencies
Our functional or primary operating currency is the U.S. dollar.
Revenue and expense items denominated in foreign currencies are translated at exchange rates prevailing during the period. Monetary assets and liabilities denominated in foreign currencies are translated at the period-end exchange rates. Non-monetary assets and liabilities are translated at exchange rates in effect when the assets are acquired or the obligations are incurred. Foreign exchange gains and losses are reflected in net earnings (loss) for the period.
We have foreign subsidiaries that are considered to be self-contained and integrated within their foreign jurisdiction, and accordingly, use the Euro dollar as their functional currency. The assets and liabilities of the foreign subsidiaries, including goodwill and fair value adjustments arising on acquisition, are translated at exchange rates at the balance sheet dates, equity is translated at historical rates, and revenue and expenses are translated at exchange rates prevailing during the period. The foreign exchange gains and losses arising from the translation are reported as a component of other comprehensive income (loss), as presented in note 17, Accumulated Other Comprehensive loss.
(d) Cash and cash equivalents
Cash and cash equivalents include cash and short-term deposits with original maturities of less than three months. Short-term deposits are valued at amortized cost. The carrying amounts approximate fair value due to the short-term maturities of these instruments.
(e) Short-term investments
Short-term investments, categorized as available-for-sale, are carried at fair value. Unrealized holding gains (losses) related to available-for-sale investments, after deducting amounts allocable to income
SIERRA WIRELESS, INC.
(in thousands of U.S. dollars, except where otherwise noted)
Notes to the Consolidated Financial Statements
taxes, are recorded as a component of accumulated other comprehensive income (loss). These gains (losses) are removed from comprehensive income (loss) when the investments mature or are sold on an item-by-item basis.
We regularly evaluate the realizable value of short-term investments, and if circumstances indicate that a decline in value is other-than-temporary, we recognize an impairment charge. To determine whether to recognize an impairment charge, we consider various factors, such as the significance of the decline in value, the length of time the investment has been below market value, changes that would impact the financial condition of the investee, and the likelihood that the investment will recover its value before it matures or is disposed of.
(f) Allowance for doubtful accounts receivable
We maintain an allowance for our accounts receivable for estimated losses that may result from our customers’ inability to pay. We determine the amount of the allowance by analyzing known uncollectible accounts, aged receivables, economic conditions, historical losses, insured amounts, if any, and changes in customer payment cycles and credit-worthiness. Amounts later determined and specifically identified to be uncollectible are charged against this allowance.
If the financial condition of any of our customers deteriorates resulting in an impairment of their ability to make payments, we may increase our allowance.
(g) Inventories
Inventories consist of electronic components and finished goods and are valued at the lower of cost or estimable realizable value, determined on a first-in-first-out basis. Cost is defined as all costs that relate to bringing the inventory to its present condition and location under normal operating conditions.
We review the components of our inventory and our inventory purchase commitments on a regular basis for excess and obsolete inventory based on estimated future usage and sales. Write-downs in inventory value or losses on inventory purchase commitments depend on various items, including factors related to customer demand, economic and competitive conditions, technological advances and new product introductions that vary from current expectations. We believe that the estimates used in calculating the inventory provision are reasonable and properly reflect the risk of excess and obsolete inventory. If customer demands for our inventory are substantially less than our estimates, additional inventory write-downs may be required.
(h) Property and equipment
Property and equipment are stated at cost, less accumulated depreciation and amortization. We amortize our property and equipment on a straight-line basis over the following estimated economic lives:
Furniture and fixtures |
| 3-5 years |
Research and development equipment |
| 3-10 years |
Production equipment |
| 3-5 years |
Tooling |
| 1.5-3 years |
Computer equipment |
| 1-5 years |
Software |
| 1-5 years |
Office equipment |
| 3-5 years |
SIERRA WIRELESS, INC.
(in thousands of U.S. dollars, except where otherwise noted)
Notes to the Consolidated Financial Statements
Research and development equipment related amortization is included in research and development expense. Tooling and production equipment related amortization is included in cost of goods sold. All other amortization is included in amortization expense.
Leasehold improvements and leased vehicles are amortized on a straight-line basis over the lesser of their expected average service life or term of the initial lease.
When we sell property and equipment, we net the historical cost less accumulated depreciation and amortization against the sale proceeds and include the difference in Other income (expense).
(i) Intangible assets
The estimated useful life of intangible assets with definite life is the period over which the assets are expected to contribute to our future cash flows. When determining the useful life, we consider the expected use of the asset, useful life of a related intangible asset, any legal, regulatory or contractual provisions that limit the useful life, any legal, regulatory, or contractual renewal or extension provisions without substantial costs or modifications to the existing terms and conditions, the effects of obsolescence, demand, competition and other economic factors, and the expected level of maintenance expenditures relative to the cost of the asset required to obtain future cash flows from the asset.
We amortize our intangible assets on a straight-line basis over the following specific periods:
Patents and trademarks | — | 3-5 years |
License fees | — | over the shorter of the term of the license or an estimate of their useful life, ranging from three to ten years |
Intellectual property, customer relationships and databases | — | 3-13 years |
In-process research and development | — | over the estimated life |
Non-compete covenants | — | over the term of the agreement |
Amortization related to intangible assets is included in research and development expense.
In-process research and development (“IPRD”) are intangible assets acquired as part of business combinations. IPRD are intangible assets with indefinite life prior to their completion. They are not amortized and are subject to impairment test on an annual basis.
(j) Goodwill
Goodwill represents the excess of the purchase price of an acquired enterprise over the fair value assigned to assets acquired and liabilities assumed in a business combination. Prior to January 1, 2011, goodwill was allocated as of the date of the business combination to the reporting units that are expected to benefit from the synergies of the business combination. We implemented a new organization structure during the fourth quarter of 2010 and effective January 1, 2011, we have three reporting units for the purpose of goodwill determination. Goodwill has been allocated to the reporting units affected using a relative fair value allocation approach as at January 1, 2011.
Goodwill has an indefinite life, is not amortized, and is subject to a two-step impairment test on an annual basis. The first step compares the fair value of the reporting unit to its carrying amount, which includes the goodwill. When the fair value of a reporting unit exceeds its carrying amount, goodwill of the reporting unit is considered not to be impaired and the second step of the impairment test is
SIERRA WIRELESS, INC.
(in thousands of U.S. dollars, except where otherwise noted)
Notes to the Consolidated Financial Statements
unnecessary. If the carrying amount exceeds the implied fair value of the goodwill, the second step measures the amount of the impairment loss. If the carrying amount exceeds the fair value of the goodwill, an impairment loss is recognized equal to that excess.
(k) Impairment of long-lived assets
Long-lived assets, including property and equipment, and intangible assets other than goodwill, are assessed for potential impairment when there is evidence that events or changes in circumstances indicate that the carrying amount of an asset may not be recovered. An impairment loss is recognized when the carrying amount of the long-lived asset is not recoverable and exceeds its fair value. The carrying amount of a long-lived asset is not recoverable if it exceeds the sum of the undiscounted cash flows expected to result from the use and eventual disposition of the asset. Any required impairment loss is measured as the amount by which the carrying amount of a long-lived asset exceeds its fair value and is recorded as a reduction in the carrying value of the related asset and a charge to operating results. Intangible assets with indefinite lives are tested annually for impairment and in interim periods if certain events occur indicating that the carrying value of the intangible assets may be impaired.
(l) Research and Development costs
Research and development costs are expensed as they are incurred. Certain software development costs for costs associated with the development of computer software to be sold, leased or marketed are capitalized once technological feasibility is reached.
We follow the cost reduction method of accounting for government research and development funding, whereby the benefit of the funding is recognized as a reduction in the cost of the related expenditure when certain criteria stipulated under the terms of those funding agreements have been met, and there is reasonable assurance the research and development funding will be received. Certain research and development funding is repayable on the occurrence of specified future events. We recognize the liability to repay research and development funding in the period in which conditions arise that will cause research and development funding to be repayable.
(m) Warranty costs
Warranty costs are accrued upon the recognition of related revenue, based on our best estimates, with reference to past and expected future experience. Warranty obligations are included in accounts payable and accrued liabilities in our consolidated balance sheet.
(n) Royalty costs
We have intellectual property license agreements which generally require us to make royalty payments based on a percentage of the revenue generated by sales of products incorporating the licensed technology. We recognize royalty obligations in accordance with the terms of the respective royalty agreements. Royalty costs are recorded as a component of cost of revenues in the period when incurred.
(o) Market development costs
Market development costs are charged to sales and marketing expense to the extent that the benefit is separable from the revenue transaction and the fair value of that benefit is determinable. To the extent
SIERRA WIRELESS, INC.
(in thousands of U.S. dollars, except where otherwise noted)
Notes to the Consolidated Financial Statements
that such allowances either do not provide a separable benefit, or the fair value of the benefit cannot be reliably estimated, such amounts are recorded as a reduction of revenue.
(p) Revenue recognition
Revenue from sales of products and services is recognized upon the later of transfer of title or upon shipment of the product to the customer or rendering of the service, so long as persuasive evidence of an arrangement exists, delivery has occurred, price is fixed or determinable, and collection is reasonably assured.
Cash received in advance of the revenue recognition criteria being met is recorded as deferred revenue.
Revenues from contracts with multiple-element arrangements are recognized as each element is earned based on the relative fair value of each element and only when there are no undelivered elements that are essential to the functionality of the delivered elements.
Revenue from licensed software is recognized at the inception of the license term. Revenue from software maintenance, unspecified upgrades and technical support contracts is recognized over the period such items are delivered or services are provided. Technical support contracts extending beyond the current period are recorded as deferred revenue.
Funding from certain research and development agreements is recognized as revenue when certain criteria stipulated under the terms of those funding agreements have been met, and when there is reasonable assurance the funding will be received. Certain research and development funding will be repayable on the occurrence of specified future events. We recognize the liability to repay research and development funding in the period in which conditions arise that would cause research and development funding to be repayable.
(q) Stock-based compensation and other stock-based payments
Stock options and restricted share units granted to the company’s key officers, directors and employees are accounted for using the fair value-based method. Under this method, compensation cost for stock options is measured at fair value at the date of grant using the Black-Scholes valuation model, and is expensed over the award’s vesting period using the straight-line method. Any consideration paid by plan participants on the exercise of stock options or the purchase of shares is credited to Common stock together with any related stock-based compensation expense. Compensation cost for restricted share units is measured at fair value at the date of grant which is the market price of the underlying security, and is expensed over the award’s vesting period using the straight-line method. Stock-based compensation is described further in note 24.
(r) Income taxes
Income taxes are accounted for using the asset and liability method. Future income tax assets and liabilities are based on temporary differences (differences between the accounting basis and the tax basis of the assets and liabilities) and non-capital loss carry-forwards and are measured using the enacted tax rates and laws expected to apply when these differences reverse. Future tax benefits, including non-capital loss carry-forwards, are recognized to the extent that realization of such benefits is considered more likely than not. The effect on future tax assets and liabilities of a change in tax rates is recognized in earnings in the period that enactment occurs.
SIERRA WIRELESS, INC.
(in thousands of U.S. dollars, except where otherwise noted)
Notes to the Consolidated Financial Statements
We include interest and penalties related to income taxes, including unrecognized tax benefits, in income tax expense (recovery).
Liabilities for uncertain tax positions are recorded based on a two-step process. The first step is to evaluate the tax position for recognition by determining if the weight of available evidence indicates that it is more likely than not that the position will be sustained on audit, including resolution of related appeals or litigation processes, if any. The second step is to measure the tax benefit as the largest amount that is more than 50% likely of being realized upon settlement. We regularly assess the potential outcomes of examinations by tax authorities in determining the adequacy of our provision for income taxes. We continually assess the likelihood and amount of potential adjustments and adjust the income tax provision, income taxes payable and deferred taxes in the period in which the facts that give rise to a revision become known.
We recognize the windfall tax benefits associated with the exercise of stock options by U.S. employees to additional paid-in capital (“APIC”) when realized. This tax benefit is not recognized until the deduction reduces U.S. taxes payable and all U.S. loss carryforwards have been utilized.
(s) Derivatives
Derivatives, such as foreign currency forward and option contracts, are occasionally used to hedge the foreign exchange risk on cash flows from commitments denominated in a foreign currency. Derivatives that are not designated as hedging instruments are measured at fair value at each balance sheet date and any resulting gains and losses from changes in the fair value are recorded in other income (expense). Gains and losses from the effective portion of foreign currency forward and option contracts that are designated as cash flow hedges are recorded in other comprehensive income (loss). As at December 31, 2012 and 2011, we had no material derivative contracts in place.
(t) Earnings (loss) per common share
Basic earnings (loss) per share is computed by dividing net earnings (loss) attributable to the company for the period by the weighted average number of company common shares outstanding during the reporting period. Diluted earnings (loss) per share is computed using the treasury stock method. When the effect of options and other securities convertible into common shares is anti-dilutive, including when the company has incurred a loss for the period, basic and diluted loss per share are the same.
Under the treasury stock method, the number of dilutive shares, if any, is determined by dividing the average market price of shares for the period into the net proceeds of in-the-money options.
(u) Comprehensive income (loss)
Comprehensive income (loss) includes net earnings (loss) as well as changes in equity from other non-owner sources. The other changes in equity included in comprehensive income (loss) are comprised of foreign currency cumulative translation adjustments and unrealized gains or losses on available-for-sale investments. The reclassification adjustment for other-than-temporary losses on marketable securities included in net earnings (loss) results from the recognition of the unrealized losses in the statements of operations when they are no longer viewed as temporary. Comprehensive income (loss) is presented in the consolidated statements of shareholders’ equity.
SIERRA WIRELESS, INC.
(in thousands of U.S. dollars, except where otherwise noted)
Notes to the Consolidated Financial Statements
(v) Investment tax credits
Investment tax credits are accounted for using the flow-through method whereby such credits are accounted for as a reduction of income tax expense in the period in which the credit arises.
(w) Comparative figures
Certain figures presented in the consolidated financial statements have been reclassified to conform to the presentation adopted for the current year.
3. RECENTLY IMPLEMENTED ACCOUNTING STANDARDS
In June 2011, the FASB issued ASU 2011-05, Comprehensive Income — Presentation. This guidance increases the prominence of other comprehensive income by requiring comprehensive income to be reported in either a single statement or two consecutive statements. This eliminates the option to report other comprehensive income and its components in the statement of changes in stockholders’ equity. The amendments do not change what items are reported in other comprehensive income. This ASU is effective on a retrospective basis for public entities for fiscal years, and interim periods within those years, beginning after December 15, 2011. This guidance did not have a material impact on our consolidated financial statements.
4. CHANGES IN FUTURE ACCOUNTING STANDARDS
In July 2012, the FASB issued ASU 2012-02, Testing Indefinite-Lived Intangible Assets for Impairment (the revised standard). The revised standard is intended to reduce the cost and complexity of testing indefinite-lived intangible assets other than goodwill for impairment by providing entities with an option to perform a “qualitative” assessment to determine whether further impairment testing is necessary. The revised standard is effective for annual and interim impairment tests performed for fiscal years beginning after September 15, 2012 and early adoption of this guidance is permitted.
5. ACQUISITION OF M2M BUSINESS OF SAGEMCOM
On August 1, 2012, we completed the acquisition of the M2M business of Sagemcom. Sagemcom, based in France, is a leading technology company active in broadband, telecom, energy, and document management. Its M2M business includes 2G and 3G wireless modules, as well as industry-leading rugged terminals for railway applications. The acquisition extends our leadership position in the growing M2M market and offers a significantly enhanced market position for us in key segments, including payment, transportation, and railways, as well as new geographical expansion into Brazil.
The acquisition included substantially all of the assets of the M2M business of Sagemcom for cash consideration of €44.9 million ($55.2 million) plus assumed liabilities of €3.9 million ($4.8 million).
Sagemcom’s results of operations and estimated fair value of assets acquired and liabilities assumed are included in our consolidated financial statements from the date of acquisition.
We accounted for the transaction using the acquisition method and accordingly, the consideration has been allocated to the tangible and intangible assets acquired and liabilities assumed on the basis of their respective
SIERRA WIRELESS, INC.
(in thousands of U.S. dollars, except where otherwise noted)
Notes to the Consolidated Financial Statements
estimated fair values, as at August 1, 2012. The excess of the purchase price over the preliminary value assigned to the net assets acquired was recorded as goodwill.
The following table summarizes the amounts of the assets acquired and liabilities assumed recognized at the acquisition date:
|
| € |
| $ |
|
Assets acquired |
|
|
|
|
|
Inventory |
| 786 |
| 967 |
|
Machinery and equipment |
| 1,454 |
| 1,788 |
|
Identifiable intangible assets |
| 21,272 |
| 26,160 |
|
Goodwill |
| 25,295 |
| 31,107 |
|
|
| 48,807 |
| 60,022 |
|
Liabilities assumed |
|
|
|
|
|
Accrued liabilities |
| 2,439 |
| 2,999 |
|
Long-term obligations |
| 1,468 |
| 1,805 |
|
Fair value of net assets acquired |
| 44,900 |
| 55,218 |
|
The goodwill of €25.3 million ($31.1 million) resulting from the acquisition consists largely of the expectation that the acquisition will extend our leadership position in the growing M2M market and offer us a significantly enhanced market position. Goodwill was assigned to the M2M segment and it is not deductible for tax purposes.
The following table provides the components of the identifiable intangible assets acquired that are subject to amortization:
|
| Estimated |
| € |
| $ |
|
Patents |
| 8 |
| 5,259 |
| 6,468 |
|
Customer relationships |
| 8-13 |
| 13,887 |
| 17,078 |
|
Backlog |
| 1-2 |
| 1,382 |
| 1,699 |
|
In-process research and development |
| 5 |
| 744 |
| 915 |
|
|
|
|
| 21,272 |
| 26,160 |
|
The amounts of revenue and net earnings of Sagemcom’s M2M business included in our consolidated statements of operations from the acquisition date, through the period ended December 31, 2012, was as follows:
|
| August 1, 2012 to |
| |
Revenue |
| $ | 20,133 |
|
Net earnings |
| 1,358 |
| |
SIERRA WIRELESS, INC.
(in thousands of U.S. dollars, except where otherwise noted)
Notes to the Consolidated Financial Statements
The following table presents the unaudited pro forma results for the years ended 2012 and 2011. The pro forma financial information combines the results of operations of Sierra Wireless, Inc. and the M2M business of Sagemcom as though the businesses had been combined as of the beginning of fiscal 2011. The pro forma financial information is presented for informational purposes only and is not indicative of the results of operations that would have been achieved if the acquisition had taken place at the beginning of fiscal 2011. The pro forma financial information presented includes amortization charges for acquired tangible and intangible assets, and related tax effects, based on the values assigned in purchase price allocation.
|
| 2012 |
| 2011 |
| ||
Pro Forma information |
|
|
|
|
| ||
Revenue |
| $ | 423,653 |
| $ | 385,049 |
|
Loss from operations |
| (21,462 | ) | (48,406 | ) | ||
Net loss |
| (3,458 | ) | (44,806 | ) | ||
|
|
|
|
|
| ||
Basic loss per share (in dollars) |
| $ | (0.11 | ) | $ | (1.43 | ) |
Diluted loss per share (in dollars) |
| $ | (0.11 | ) | $ | (1.43 | ) |
6. DISPOSITION OF AIRCARD BUSINESS
On January 28, 2013, we announced a definitive asset sale agreement for the sale of our AirCard business to Netgear, Inc. (“Netgear”) for $138 million in cash plus assumed liabilities. We expect to realize net cash proceeds of approximately $100 million from the divesture, after related taxes, expenses and retention for the purposes of indemnification. Approximately 160 employees, primarily in sales, marketing and research and development, will be transferred to Netgear, as well as certain facilities in Carlsbad, California and Richmond, British Columbia. The transaction is expected to close in early April 2013, subject to customary closing conditions.
Assets and liabilities held for sale as at December 31, 2012 were as follows:
|
| 2012 |
| |
Inventories |
| $ | 8,731 |
|
Prepaids |
| 10,847 |
| |
Property and equipment |
| 7,489 |
| |
Intangible assets |
| 1,317 |
| |
Goodwill |
| 25,956 |
| |
Assets held for sale |
| $ | 54,340 |
|
|
|
|
| |
Inventory commitment reserve |
| $ | 2,282 |
|
Product warranties |
| 1,589 |
| |
Marketing development funds |
| 5,742 |
| |
Other |
| 740 |
| |
Liabilities held for sale |
| $ | 10,353 |
|
SIERRA WIRELESS, INC.
(in thousands of U.S. dollars, except where otherwise noted)
Notes to the Consolidated Financial Statements
The results related to the AirCard business have been presented as discontinued operations in the statement of earnings for the three years ended December 31, 2012 and were as follows:
|
| 2012 |
| 2011 |
| 2010 |
| |||
Revenue |
| $ | 246,845 |
| $ | 245,010 |
| $ | 292,336 |
|
Cost of goods sold |
| 177,147 |
| 183,300 |
| 223,377 |
| |||
Gross margin |
| $ | 69,698 |
| $ | 61,710 |
| $ | 68,959 |
|
Gross margin % |
| 28.2 | % | 25.2 | % | 23.6 | % | |||
Expenses |
| 36,653 |
| 37,369 |
| 36,608 |
| |||
Earnings from operations |
| 33,045 |
| 24,341 |
| 32,351 |
| |||
Net earnings from discontinued operations |
| $ | 31,401 |
| $ | 21,338 |
| $ | 20,174 |
|
We had two significant customers related to discontinued operations during the year ended December 31, 2012 that each accounted for more than 10% of our aggregated revenue from continuing and discontinued operations, comprising sales of $88,689 and $73,091 (year ended December 31, 2011 - three significant customers comprising sales of $77,216, $68,361 and $66,001; year ended December 31, 2010 - two significant customers comprising sales of $105,469 and $65,691).
7. SHORT-TERM INVESTMENTS
Short-term investments, all of which are classified as available-for-sale, are comprised of government treasury bills and securities. As at December 31, 2012, we had no outstanding short-term investments.
8. ACCOUNTS RECEIVABLE
The components of accounts receivable at December 31 were as follows:
|
| 2012 |
| 2011 |
| ||
Trade receivables |
| $ | 96,779 |
| $ | 101,130 |
|
Less: allowance for doubtful accounts |
| (2,435 | ) | (3,642 | ) | ||
|
| 94,344 |
| 97,488 |
| ||
Sales taxes receivable |
| 2,594 |
| 1,825 |
| ||
Other receivables |
| 11,686 |
| 8,054 |
| ||
|
| $ | 108,624 |
| $ | 107,367 |
|
SIERRA WIRELESS, INC.
(in thousands of U.S. dollars, except where otherwise noted)
Notes to the Consolidated Financial Statements
The movement in the allowance for doubtful accounts during the years ended December 31 were as follows:
|
| 2012 |
| 2011 |
| ||
Balance, beginning of year |
| $ | 3,642 |
| $ | 4,606 |
|
Bad debt expense |
| 386 |
| (83 | ) | ||
Write-offs and settlements |
| (1,608 | ) | (827 | ) | ||
Foreign exchange |
| 15 |
| (54 | ) | ||
|
| $ | 2,435 |
| $ | 3,642 |
|
9. INVENTORIES
The components of inventories at December 31 were as follows:
|
| 2012 |
| 2011 |
| ||
|
|
|
|
|
| ||
Electronic components |
| $ | 7,206 |
| $ | 4,826 |
|
Finished goods |
| 5,469 |
| 11,342 |
| ||
|
| $ | 12,675 |
| $ | 16,168 |
|
10. PREPAIDS AND OTHER
The components of prepaids and other at December 31 were as follows:
|
| 2012 |
| 2011 |
| ||
|
|
|
|
|
| ||
Inventory advances |
| $ | 17,613 |
| $ | 16,486 |
|
Insurance and licenses |
| 2,374 |
| 2,024 |
| ||
Other |
| 4,265 |
| 2,164 |
| ||
|
| $ | 24,252 |
| $ | 20,674 |
|
SIERRA WIRELESS, INC.
(in thousands of U.S. dollars, except where otherwise noted)
Notes to the Consolidated Financial Statements
11. PROPERTY AND EQUIPMENT
The components of property and equipment at December 31 were as follows:
|
| 2012 |
| |||||||
|
| Cost |
| Accumulated |
| Net book |
| |||
|
|
|
|
|
|
|
| |||
Furniture and fixtures |
| $ | 4,557 |
| $ | 3,755 |
| $ | 802 |
|
Research and development equipment |
| 21,875 |
| 16,504 |
| 5,371 |
| |||
Tooling |
| 25,000 |
| 17,577 |
| 7,423 |
| |||
Computer equipment |
| 7,614 |
| 6,048 |
| 1,566 |
| |||
Software |
| 9,358 |
| 7,863 |
| 1,495 |
| |||
Leasehold improvements |
| 4,973 |
| 3,070 |
| 1,903 |
| |||
Leased vehicles |
| 1,206 |
| 587 |
| 619 |
| |||
Office equipment |
| 3,144 |
| 2,284 |
| 860 |
| |||
|
| $ | 77,727 |
| $ | 57,688 |
| $ | 20,039 |
|
|
| 2011 |
| |||||||
|
| Cost |
| Accumulated |
| Net book |
| |||
|
|
|
|
|
|
|
| |||
Furniture and fixtures |
| $ | 4,799 |
| $ | 3,856 |
| $ | 943 |
|
Research and development equipment |
| 37,106 |
| 29,204 |
| 7,902 |
| |||
Tooling |
| 44,149 |
| 37,298 |
| 6,851 |
| |||
Computer equipment |
| 8,390 |
| 6,764 |
| 1,626 |
| |||
Software |
| 9,352 |
| 7,338 |
| 2,014 |
| |||
Leasehold improvements |
| 5,141 |
| 3,955 |
| 1,186 |
| |||
Leased vehicles |
| 1,126 |
| 546 |
| 580 |
| |||
Office equipment |
| 3,076 |
| 2,091 |
| 985 |
| |||
|
| $ | 113,139 |
| $ | 91,052 |
| $ | 22,087 |
|
Amortization expense relating to property and equipment, including those related to discontinued operations, was $12,583, $14,528, and $17,638 for the years ended December 31, 2012, 2011, and 2010, respectively.
SIERRA WIRELESS, INC.
(in thousands of U.S. dollars, except where otherwise noted)
Notes to the Consolidated Financial Statements
12. INTANGIBLE ASSETS
The components of intangible assets at December 31 were as follows:
|
| 2012 |
| |||||||
|
| Cost |
| Accumulated |
| Net book |
| |||
|
|
|
|
|
|
|
| |||
Patents and trademarks |
| $ | 15,466 |
| $ | 5,317 |
| $ | 10,149 |
|
Licenses |
| 61,660 |
| 42,134 |
| 19,526 |
| |||
Intellectual property |
| 7,006 |
| 6,995 |
| 11 |
| |||
Customer relationships |
| 45,065 |
| 23,474 |
| 21,591 |
| |||
Backlog |
| 1,823 |
| 538 |
| 1,285 |
| |||
Non-compete |
| 2,827 |
| 2,827 |
| — |
| |||
In-process research and development |
| 6,524 |
| 2,729 |
| 3,795 |
| |||
|
| $ | 140,371 |
| $ | 84,014 |
| $ | 56,357 |
|
|
| 2011 |
| |||||||
|
| Cost |
| Accumulated |
| Net book |
| |||
|
|
|
|
|
|
|
| |||
Patents and trademarks |
| $ | 10,822 |
| $ | 5,368 |
| $ | 5,454 |
|
Licenses |
| 58,842 |
| 33,325 |
| 25,517 |
| |||
Intellectual property |
| 6,856 |
| 6,614 |
| 242 |
| |||
Customer relationships |
| 26,565 |
| 18,499 |
| 8,066 |
| |||
Non-compete |
| 2,764 |
| 2,764 |
| — |
| |||
In-process research and development |
| 5,419 |
| 2,141 |
| 3,278 |
| |||
|
| $ | 111,268 |
| $ | 68,711 |
| $ | 42,557 |
|
Estimated annual amortization expense for the future 5 years ended December 31 were as follows:
2013 |
| $ | 16,348 |
|
2014 |
|
| 10,700 |
|
2015 |
|
| 5,355 |
|
2016 |
|
| 4,048 |
|
2017 |
|
| 3,758 |
|
During the fourth quarter of 2011, we recorded an impairment charge of $11,214, primarily related to a software development program we decided not to complete. This asset was acquired through the acquisition of Wavecom. We did not record an impairment charge for the years ended December 31, 2012 and 2010.
Amortization expense relating to intangible assets, including those related to discontinued operations, was $16,007, $17,858, and $17,352 for the years ended December 31, 2012, 2011, and 2010, respectively.
At December 31, 2012, a net carrying amount of $1,260 included in intangible assets was not subject to amortization.
SIERRA WIRELESS, INC.
(in thousands of U.S. dollars, except where otherwise noted)
Notes to the Consolidated Financial Statements
13. GOODWILL
We assessed the realizability of goodwill during the fourth quarter of 2012 and determined that the fair value of each reporting unit exceeded its carrying value. Therefore, the second step of the impairment test that measures the amount of an impairment loss by comparing the implied fair market value with the carrying amount of goodwill for each reporting unit was not required. There was no impairment of goodwill during the years ended December 31, 2012, 2011 and 2010.
The changes in the carrying amount of goodwill for the years ended December 31 were as follows:
|
| 2012 |
| 2011 |
| ||
Balance at beginning of year |
| $ | 89,961 |
| $ | 90,953 |
|
Goodwill acquired during year (note 5) |
| 31,107 |
| — |
| ||
Goodwill allocated to discontinued operations (note 6) |
| (25,956 | ) | — |
| ||
Foreign currency translation adjustments |
| 2,849 |
| (992 | ) | ||
|
| $ | 97,961 |
| $ | 89,961 |
|
14. ACCOUNTS PAYABLE AND ACCRUED LIABILITIES
The components of accounts payable and accrued liabilities at December 31 were as follows:
|
| 2012 |
| 2011 |
| ||
Trade payables |
| $ | 64,351 |
| $ | 62,260 |
|
Inventory commitment reserve |
| 1,465 |
| 3,443 |
| ||
Accrued royalties |
| 22,450 |
| 15,053 |
| ||
Accrued payroll and related liabilities |
| 11,461 |
| 9,770 |
| ||
Taxes payable (including sales taxes) |
| 9,181 |
| 9,849 |
| ||
Product warranties |
| 4,169 |
| 4,537 |
| ||
Marketing development funds |
| 38 |
| 5,323 |
| ||
Other |
| 15,101 |
| 13,312 |
| ||
|
| $ | 128,216 |
| $ | 123,547 |
|
15. LONG-TERM OBLIGATIONS
The components of long-term obligations at December 31 were as follows:
|
| 2012 |
| 2011 |
| ||
Accrued royalties |
| $ | 23,566 |
| $ | 18,442 |
|
Marketing development funds |
| — |
| 4,668 |
| ||
Other |
| 2,960 |
| 2,033 |
| ||
|
| $ | 26,526 |
| $ | 25,143 |
|
SIERRA WIRELESS, INC.
(in thousands of U.S. dollars, except where otherwise noted)
Notes to the Consolidated Financial Statements
16. INCOME TAXES
The components of earnings (loss) before income taxes consist of the following:
|
| 2012 |
| 2011 |
| 2010 |
| |||
Continuing operations: |
|
|
|
|
|
|
| |||
Canadian |
| $ | 24,802 |
| $ | (22,099 | ) | $ | (10,799 | ) |
Foreign |
| (43,878 | ) | (32,579 | ) | (39,159 | ) | |||
|
| (19,076 | ) | (54,678 | ) | (49,958 | ) | |||
Discontinued operations: |
|
|
|
|
|
|
| |||
Canadian |
| 15,617 |
| 5,898 |
| 6,456 |
| |||
Foreign |
| 17,428 |
| 18,443 |
| 25,895 |
| |||
|
| 33,045 |
| 24,341 |
| 32,351 |
| |||
Earnings (loss) before income taxes |
| $ | 13,969 |
| $ | (30,337 | ) | $ | (17,607 | ) |
The income tax expense (recovery) consists of:
|
| 2012 |
| 2011 |
| 2010 |
| |||
Canadian: |
|
|
|
|
|
|
| |||
Current |
| $ | (106 | ) | $ | 123 |
| $ | — |
|
Deferred |
| (14,268 | ) | 1,981 |
| (71 | ) | |||
|
| (14,374 | ) | 2,104 |
| (71 | ) | |||
Foreign: |
|
|
|
|
|
|
| |||
Current |
| 219 |
| 1,815 |
| 379 |
| |||
Deferred |
| 925 |
| (4,884 | ) | (3,116 | ) | |||
|
| 1,144 |
| (3,069 | ) | (2,737 | ) | |||
Total: |
|
|
|
|
|
|
| |||
Current |
| 113 |
| 1,938 |
| 379 |
| |||
Deferred |
| (13,343 | ) | (2,903 | ) | (3,187 | ) | |||
|
| $ | (13,230 | ) | $ | (965 | ) | $ | (2,808 | ) |
Classification: |
|
|
|
|
|
|
| |||
Income tax (recovery) — continuing operations |
| (14,874 | ) | (3,968 | ) | (14,985 | ) | |||
Income tax expense — discontinued operations |
| 1,644 |
| 3,003 |
| 12,177 |
| |||
|
| $ | (13,230 | ) | $ | (965 | ) | $ | (2,808 | ) |
SIERRA WIRELESS, INC.
(in thousands of U.S. dollars, except where otherwise noted)
Notes to the Consolidated Financial Statements
The reconciliation of income taxes calculated at the statutory rate to the actual income tax provision for the years ended December 31 was as follows:
|
| 2012 |
| 2011 |
| 2010 |
| |||
Income tax expense (recovery) at Canadian statutory income tax rates |
| $ | 3,499 |
| $ | (8,023 | ) | $ | (6,288 | ) |
Increase (decrease) in income taxes for: |
|
|
|
|
|
|
| |||
Permanent and other differences |
| (5,279 | ) | 6,335 |
| 3,178 |
| |||
Change in statutory/foreign tax rates |
| (2,762 | ) | (1,973 | ) | (1,470 | ) | |||
Change in valuation allowance |
| (10,358 | ) | 1,805 |
| (9,223 | ) | |||
Stock-based compensation expense |
| 1,603 |
| 891 |
| 1,125 |
| |||
Adjustment to prior years |
| 67 |
| — |
| 6,347 |
| |||
Foreign exchange gain adjustment |
| — |
| — |
| 3,523 |
| |||
Income tax expense (recovery) |
| $ | (13,230 | ) | $ | (965 | ) | $ | (2,808 | ) |
Future tax assets and liabilities
The tax effects of temporary differences that give rise to significant future tax assets and future tax liabilities were as follows at December 31:
|
| 2012 |
| 2011 |
| ||
Future income tax assets |
|
|
|
|
| ||
Property and equipment |
| $ | 4,165 |
| $ | 3,032 |
|
Non capital loss carry-forwards |
| 70,824 |
| 64,980 |
| ||
Capital loss carry-forwards |
| 2,655 |
| 2,607 |
| ||
Scientific research and development expenses and credits |
| 36,961 |
| 38,640 |
| ||
Reserves and other |
| 8,974 |
| 11,075 |
| ||
|
| 123,579 |
| 120,334 |
| ||
Future income tax liabilities |
|
|
|
|
| ||
Acquired intangibles |
| 2,920 |
| 9,893 |
| ||
|
| 120,659 |
| 110,441 |
| ||
Valuation allowance |
| 94,880 |
| 98,268 |
| ||
|
| $ | 25,779 |
| $ | 12,173 |
|
|
| 2012 |
| 2011 |
| ||
Classification: |
|
|
|
|
| ||
Assets |
|
|
|
|
| ||
Current |
| $ | 22,199 |
| $ | 6,540 |
|
Non-current |
| 3,880 |
| 6,205 |
| ||
Liabilities |
|
|
|
|
| ||
Current |
| — |
| (336 | ) | ||
Non-current |
| (300 | ) | (236 | ) | ||
|
| $ | 25,779 |
| $ | 12,173 |
|
SIERRA WIRELESS, INC.
(in thousands of U.S. dollars, except where otherwise noted)
Notes to the Consolidated Financial Statements
At December 31, 2012, we have provided for a valuation allowance on our future tax assets of $94,880 (2011 - $98,268).
At December 31, 2012, we have Canadian allowable capital loss carry-forwards of $11,323 that are available, indefinitely, to be deducted against future Canadian taxable capital gains. In addition, we have $20,207 in scientific research and development expenditures available to be deducted against future Canadian taxable income that may be carried forward indefinitely and investment tax credits of $22,656 and $10,385 available to offset future Canadian federal and provincial income taxes payable, respectively. The investment tax credits expire between 2013 and 2032. At December 31, 2012, our U.S. subsidiary has $2,015 and $6,396 of federal and California research & development tax credits carried forward which expire between 2029 and 2031. The amounts are prior to the estimated utilization from the sale of AirCard business described below.
At December 31, 2012, net operating loss carry-forwards for our foreign subsidiaries were $18,479 for U.S. income tax purposes that expire between 2020 and 2032, $139 for Hong Kong income tax purposes, $44 for Brazil income tax purposes, $233 for Korea income tax purposes, $345 for Luxembourg income tax purposes, $73 for German income tax purposes, and $180,576 for French income tax purposes. Our foreign subsidiaries may be limited in their ability to use foreign net operating losses in any single year depending on their ability to generate significant taxable income. In addition, the utilization of these net operating losses is also subject to ownership change limitations provided by U.S. federal and specific state income tax legislation. The amount of French net operating losses deducted each year is limited to €1,000 plus 50% of French taxable income in excess of €1,000. Our French net operating losses carry-forward is subject to the “continuity of business” requirement. Our French subsidiaries also have research tax credit carried forward of $7,298 as at December 31, 2012. The French research tax credit may be used to offset against corporate income tax and if any credit is not fully utilized within a three year period following the year the research tax credit is earned, it may be refunded by the French tax authorities. Tax loss and research tax credit carry-forwards are denominated in the currency of the countries in which the respective subsidiaries are located and operate. Fluctuations in currency exchange rates could reduce the U.S. dollar equivalent value of these tax loss and research tax credit carry forwards in future years.
In assessing the realizability of our future tax assets, management considers whether it is more likely than not that some portion or all of the future tax assets will not be realized. The ultimate realization of future tax assets is dependent upon the generation of future taxable income during periods in which temporary differences become deductible. Management considers projected future taxable income and tax planning strategies in making our assessment.
On closing of the sale of the AirCard assets to Netgear (note 6), we expect to utilize approximately $17,600 of Canadian scientific research and development expenditures, approximately $4,000 of Canadian allowable capital loss, approximately $4,800 of Canadian Federal and Provincial investment tax credits, approximately $8,000 of U.S. net operating loss, and approximately $2,000 of U.S. Federal and California research & development tax credit. The estimated utilization is subject to change due to a number of variables, including the determination of final closing costs and purchase price adjustments.
No provision for taxes have been provided on foreign earnings, as it is the company’s intention to indefinitely reinvest undistributed earnings of its foreign subsidiaries. It is not practical to estimate the income tax liability that might be incurred if there is a change in management’s intention in the event that a remittance of such earnings occurs in the future.
SIERRA WIRELESS, INC.
(in thousands of U.S. dollars, except where otherwise noted)
Notes to the Consolidated Financial Statements
Accounting for uncertainty in income taxes
At December 31, 2012, we had gross unrecognized tax benefits of $8,227 (2011 — $9,464). Of this total, $5,349 (2011 - $6,815) represents the amount of unrecognized tax benefits that, if recognized, would favorably impact our effective tax rate.
Below is a reconciliation of the total amounts of unrecognized tax benefits for the years ended December 31:
|
| 2012 |
| 2011 |
| ||
Unrecognized tax benefits, beginning of year |
| $ | 9,464 |
| $ | 8,754 |
|
Increases (decreases) — tax positions taken in prior periods |
| 55 |
| 1,508 |
| ||
Increases — tax positions taken in current period |
| (238 | ) | — |
| ||
Settlements and lapse of statute of limitations |
| (1,054 | ) | (798 | ) | ||
Unrecognized tax benefits, end of year |
| $ | 8,227 |
| $ | 9,464 |
|
We recognize interest expense and penalties related to unrecognized tax benefits within the provision for income tax expense on the consolidated statement of operations. At December 31, 2012, we had accrued $1,488 (2011 - $1,642) for interest and penalties.
In the normal course of business, we are subject to audit by the Canadian federal and provincial taxing authorities, by the U.S. federal and various state taxing authorities and by the taxing authorities in various foreign jurisdictions. Tax years ranging from 2004 to 2012 remain subject to examination in Canada, the United States, the United Kingdom, France, Germany, Australia, China, Hong Kong, Brazil, South Africa, Japan, Korea, and Luxembourg.
17. ACCUMULATED OTHER COMPREHENSIVE LOSS
The components of accumulated other comprehensive loss at December 31, net of taxes, were as follows:
|
| 2012 |
| 2011 |
| ||
Release of foreign currency translation relating to acquisition of non-controlling interest |
| $ | 178 |
| $ | 178 |
|
Translation adjustment related to change in functional currency |
| (728 | ) | (728 | ) | ||
Foreign currency translation adjustments |
| (6,912 | ) | (7,450 | ) | ||
|
| $ | (7,462 | ) | $ | (8,000 | ) |
18. RESEARCH AND DEVELOPMENT
The components of research and development costs consist of the following:
|
| 2012 |
| 2011 |
| 2010 |
| |||
Gross research and development |
| $ | 64,346 |
| $ | 63,424 |
| $ | 63,020 |
|
Government tax credits |
| (2,561 | ) | (2,521 | ) | (2,130 | ) | |||
|
| $ | 61,785 |
| $ | 60,903 |
| $ | 60,890 |
|
SIERRA WIRELESS, INC.
(in thousands of U.S. dollars, except where otherwise noted)
Notes to the Consolidated Financial Statements
19. RESTRUCTURING
The following table provides the activity in the restructuring liability:
|
| 2012 |
| |||||||
|
| Workforce |
| Facilities |
| Total |
| |||
Balance, beginning of year |
| $ | 625 |
| $ | 562 |
| $ | 1,187 |
|
Expensed in year |
| 2,167 |
| 84 |
| 2,251 |
| |||
Disbursements |
| (2,340 | ) | (464 | ) | (2,804 | ) | |||
Adjustments |
| (21 | ) | — |
| (21 | ) | |||
Foreign exchange |
| 41 |
| — |
| 41 |
| |||
Balance, end of year |
| $ | 472 |
| $ | 182 |
| $ | 654 |
|
|
|
|
|
|
|
|
| |||
Classification: |
|
|
|
|
|
|
| |||
Accounts payable and accrued liabilities |
| $ | 472 |
| $ | 149 |
| $ | 621 |
|
Other long term obligations |
| — |
| 33 |
| 33 |
| |||
|
| $ | 472 |
| $ | 182 |
| $ | 654 |
|
By restructuring initiative: |
|
|
|
|
|
|
| |||
April 2012 |
| $ | 433 |
| $ | — |
| $ | 433 |
|
May 2009 |
| — |
| 182 |
| 182 |
| |||
Wavecom S.A. and prior |
| 39 |
| — |
| 39 |
| |||
|
| $ | 472 |
| $ | 182 |
| $ | 654 |
|
|
| 2011 |
| |||||||
|
| Workforce |
| Facilities |
| Total |
| |||
Balance, beginning of period |
| $ | 1,975 |
| $ | 1,771 |
| $ | 3,746 |
|
Expensed in year |
| 1,201 |
| (364 | ) | 837 |
| |||
Disbursements |
| (2,321 | ) | (861 | ) | (3,182 | ) | |||
Adjustments |
| (224 | ) | 11 |
| (213 | ) | |||
Foreign exchange |
| (6 | ) | 5 |
| (1 | ) | |||
Balance, end of period |
| $ | 625 |
| $ | 562 |
| $ | 1,187 |
|
|
|
|
|
|
|
|
| |||
Classification: |
|
|
|
|
|
|
| |||
Accounts payable and accrued liabilities |
| $ | 625 |
| $ | 396 |
| $ | 1,021 |
|
Other long term obligations |
| — |
| 166 |
| 166 |
| |||
|
| $ | 625 |
| $ | 562 |
| $ | 1,187 |
|
By restructuring initiative: |
|
|
|
|
|
|
| |||
September 2010 |
| $ | 377 |
| $ | — |
| $ | 377 |
|
May 2009 |
| — |
| 562 |
| 562 |
| |||
Wavecom S.A. and prior |
| 248 |
| — |
| 248 |
| |||
|
| $ | 625 |
| $ | 562 |
| $ | 1,187 |
|
SIERRA WIRELESS, INC.
(in thousands of U.S. dollars, except where otherwise noted)
Notes to the Consolidated Financial Statements
April 2012
In April 2012, we announced the closure of our Newark, California facility, effective December 31, 2012, to drive greater efficiency and leverage. Subsequently, our AirLink marketing, research and development, and customer support activities primarily transferred to the Richmond, British Columbia, facilities, and manufacturing operations transferred to our manufacturing partner in Suzhou, China. The Newark facility was closed on December 31, 2012 and, for the year ended December 31, 2012, we recorded $1,980 in restructuring costs related to this initiative. The outstanding restructuring obligation is expected to be fully paid by July 31, 2013.
September 2010
In September 2010, we implemented a new business unit structure that resulted in a reduction of our workforce by 60 employees. These reductions were substantially completed during the fourth quarter of 2010. For the year ended December 31, 2010, we recorded restructuring costs of $4,420 primarily related to severance and benefits associated with the terminated employees. The restructuring obligation was fully paid by December 31, 2012.
May 2009
In May 2009, we implemented cost reduction initiatives related to the integration of Wavecom S.A. with Sierra Wireless which included combining the research and development and product operations of both organizations. The remaining facilities related restructuring obligation of $182 (December 31, 2011 - $562) is expected to be substantially paid by the second quarter of 2014.
20. INTEGRATION
During the year ended December 31, 2012, we incurred integration costs of $nil. During the year ended December 31, 2011 and 2010, we incurred integration costs of $1,426 and $5,110, respectively, related to the acquisition of Wavecom S.A., primarily for costs related to the office space optimization in France, implementation of an integrated Customer Relationship Management system, and the integration of our Enterprise Resource Planning system.
21. OTHER INCOME (EXPENSE)
The components of other income (expense) for the years ended December 31 were as follows:
|
| 2012 |
| 2011 |
| 2010 |
| |||
Gain (loss) on disposal of property, equipment, and intangibles |
| $ | (107 | ) | $ | (40 | ) | $ | 95 |
|
Interest income |
| 108 |
| 199 |
| 202 |
| |||
Interest expense |
| (197 | ) | (124 | ) | (538 | ) | |||
|
| $ | (196 | ) | $ | 35 |
| $ | (241 | ) |
SIERRA WIRELESS, INC.
(in thousands of U.S. dollars, except where otherwise noted)
Notes to the Consolidated Financial Statements
22. EARNINGS (LOSS) PER SHARE
The following table provides the reconciliation between basic and diluted earnings (loss) per share:
|
| 2012 |
| 2011 |
| 2010 |
| |||
Net earnings (loss) attributable to the company |
| $ | 27,199 |
| $ | (29,315 | ) | $ | (14,541 | ) |
Weighted average shares used in computation of: |
|
|
|
|
|
|
| |||
Basic |
| 30,788 |
| 31,275 |
| 31,083 |
| |||
Assumed conversion |
| — |
| — |
| — |
| |||
Diluted |
| 30,788 |
| 31,275 |
| 31,083 |
| |||
Earnings (loss) per share attributable to the company’s common shareholders (in dollars): |
|
|
|
|
|
|
| |||
Basic |
| $ | 0.88 |
| $ | (0.94 | ) | $ | (0.47 | ) |
Diluted |
| $ | 0.88 |
| $ | (0.94 | ) | $ | (0.47 | ) |
23. SHARE CAPITAL
During the year ended December 31, 2012, we purchased 800,000 common shares in the open market at an average price of $7.89 pursuant to a normal course issuer bid that was approved on December 13, 2011 by the Toronto Stock Exchange. The normal course issuer bid commenced on December 19, 2011 and terminated on December 18, 2012.
On February 6, 2013, we received regulatory approval allowing us to purchase for cancellation up to 1,529,687 of our common shares by a normal course issuer bid (“the Bid”) on the Toronto Stock Exchange and NASDAQ Global Market. The Bid commenced on February 14, 2013 and will terminate on the earlier of February 13, 2014, the date we complete our purchases, or the date of notice by us of termination. As of March 7, 2013, we had purchased 124,300 common shares in the open market at an average price of $11.08 per share.
24. STOCK-BASED COMPENSATION PLANS
(a) Stock-based compensation expense:
|
| 2012 |
| 2011 |
| 2010 |
| |||
Cost of goods sold |
| $ | 304 |
| $ | 385 |
| $ | 492 |
|
Sales and marketing |
| 1,149 |
| 1,075 |
| 1,199 |
| |||
Research and development |
| 1,341 |
| 1,110 |
| 861 |
| |||
Administration |
| 2,987 |
| 2,928 |
| 2,913 |
| |||
Restructuring |
| — |
| — |
| 540 |
| |||
Continuing operations |
| 5,781 |
| 5,498 |
| 6,005 |
| |||
Discontinued operations |
| 932 |
| 951 |
| 951 |
| |||
|
| $ | 6,713 |
| $ | 6,449 |
| $ | 6,956 |
|
Stock option plan |
| $ | 2,121 |
| $ | 2,844 |
| $ | 3,359 |
|
Restricted stock plan |
| 4,592 |
| 3,605 |
| 3,597 |
| |||
|
| $ | 6,713 |
| $ | 6,449 |
| $ | 6,956 |
|
SIERRA WIRELESS, INC.
(in thousands of U.S. dollars, except where otherwise noted)
Notes to the Consolidated Financial Statements
(b) Stock option plan
Under the terms of our employee Stock Option Plan (the “Plan”), our Board of Directors may grant options to employees, officers and directors. The maximum number of shares available for issue under the Plan is the lesser of 10% of the number of issued and outstanding common shares from time to time or 7,000,000 common shares. Based on the number of shares outstanding as at December 31, 2012, stock options exercisable into 703,365 common shares are available for future allocation under the Plan.
The Plan provides that the exercise price of an option will be determined on the date of grant and will not be less than the closing market price of our stock at that date. Options generally vest over four years, with the first 25% vesting at the first anniversary date of the grant and the balance vesting in equal amounts at the end of each month thereafter. We determine the expiry date of each option at the time it is granted, which cannot be more than five years after the date of the grant.
The fair value of share options was estimated on the date of grant using the Black-Scholes option-pricing model with the following assumptions:
|
| 2012 |
| 2011 |
| 2010 |
| |||
Risk-free interest rate |
| 0.85 | % | 2.07 | % | 1.90 | % | |||
Annual dividends per share |
| Nil |
| Nil |
| Nil |
| |||
Expected stock price volatility |
| 57 | % | 60 | % | 60 | % | |||
Expected option life (in years) |
| 4.0 |
| 4.0 |
| 4.0 |
| |||
Estimated forfeiture rate |
| 3.5 | % | 3.5 | % | 3.5 | % | |||
Average fair value of options granted (in dollars) |
| $ | 3.42 |
| $ | 5.11 |
| $ | 4.21 |
|
There is no dividend yield because we do not pay, and do not plan to pay, cash dividends on our common shares. The expected stock price volatility is based on the historical volatility of our average monthly stock closing prices over a period equal to the expected life of each option grant. The risk-free interest rate is based on yields from risk-free instruments with a term equal to the expected term of the options being valued. The expected life of options represents the period of time that the options are expected to be outstanding based on historical data of option holder exercise and termination behavior. We estimate forfeitures at the time of grant and, if necessary, revise that estimate if actual forfeitures differ and adjust stock-based compensation expense accordingly.
SIERRA WIRELESS, INC.
(in thousands of U.S. dollars, except where otherwise noted)
Notes to the Consolidated Financial Statements
The following table presents stock option activity for the years ended December 31:
|
| Number of |
| Weighted Average |
| Weighted |
| Aggregate |
| ||
|
| Shares |
| Cdn.$ |
| U.S.$ |
| In Years |
| U.S.$ |
|
Outstanding, December 31, 2009 |
| 2,158,088 |
| 13.51 |
| 12.83 |
| 2.5 |
| 3,246 |
|
Granted |
| 698,972 |
| 9.12 |
| 8.76 |
|
|
|
|
|
Exercised |
| (173,879 | ) | 6.38 |
| 6.18 |
|
|
| 792 |
|
Forfeited |
| (423,453 | ) | 12.36 |
| 11.84 |
|
|
|
|
|
Outstanding, December 31, 2010 |
| 2,259,728 |
| 12.51 |
| 12.54 |
| 2.4 |
| 7,878 |
|
Granted |
| 658,452 |
| 10.88 |
| 10.89 |
|
|
|
|
|
Exercised |
| (83,906 | ) | 6.06 |
| 6.19 |
|
|
| 417 |
|
Forfeited |
| (536,399 | ) | 13.91 |
| 13.97 |
|
|
|
|
|
Outstanding, December 31, 2011 |
| 2,297,875 |
| 12.11 |
| 11.86 |
| 2.5 |
| 705 |
|
Granted |
| 636,963 |
| 7.85 |
| 7.82 |
|
|
|
|
|
Exercised |
| (85,051 | ) | 5.16 |
| 5.12 |
|
|
| 297 |
|
Forfeited |
| (493,910 | ) | 17.58 |
| 17.42 |
|
|
|
|
|
Outstanding, December 31, 2012 |
| 2,355,877 |
| 9.89 |
| 9.96 |
| 2.5 |
| 735 |
|
The intrinsic value of outstanding and exercisable stock options is calculated as the quoted market price of the stock at the balance sheet date, or date of exercise, less the exercise price of the option. The aggregate intrinsic value of stock options exercised in the year ended December 31, 2012 was $297 (year ended December 31, 2011 - $417; year ended December 31, 2010 - $792).
The following table summarizes the stock options outstanding and exercisable at December 31, 2012:
|
| Options Outstanding |
| Options Exercisable |
| ||||||||||
Range of |
| Number |
| Weighted |
| Weighted |
| Number |
| Weighted |
| ||||
Exercise Prices |
| Options |
| (years) |
| Cdn.$ |
| U.S.$ |
| Exercisable |
| Cdn.$ |
| U.S.$ |
|
$3.98 – $7.93 U.S. |
| 601,145 |
| 3.1 |
| 6.68 |
| 6.73 |
| 185,921 |
| 4.57 |
| 4.61 |
|
$7.94 – $9.16 U.S. |
| 568,076 |
| 3.0 |
| 8.27 |
| 8.34 |
| 232,003 |
| 8.52 |
| 8.59 |
|
$9.17 – $11.10 U.S. |
| 486,416 |
| 2.8 |
| 10.20 |
| 10.27 |
| 267,013 |
| 10.02 |
| 10.10 |
|
$11.11 – $19.40 U.S. |
| 700,240 |
| 1.4 |
| 13.74 |
| 13.85 |
| 536,011 |
| 14.56 |
| 14.67 |
|
|
| 2,355,877 |
| 2.5 |
| 9.89 |
| 9.96 |
| 1,220,948 |
| 10.90 |
| 10.98 |
|
The options outstanding at December 31, 2012 expire between February 5, 2013 and August 16, 2017.
As at December 31, 2012, the unrecognized stock-based compensation cost related to the non-vested stock options was $3,836 (2011 — $3,969; 2010 - $3,782), which is expected to be recognized over a weighted average period of 2.4 years (2011 — 2.6 years; 2010 — 2.2 years).
(c) Restricted share plans
We have two market based restricted share unit plans: one for U.S. employees and the other for all non-U.S. employees, and a treasury based restricted share unit plan (collectively, the “RSPs”). The RSPs
SIERRA WIRELESS, INC.
(in thousands of U.S. dollars, except where otherwise noted)
Notes to the Consolidated Financial Statements
further our growth and profitability objectives by providing long-term incentives to certain executives and other key employees and also encourage our objective of employee share ownership through the granting of restricted share units (“RSUs”). There is no exercise price or monetary payment required from the employees upon the grant of an RSU or upon the subsequent delivery of common shares of Sierra Wireless, Inc. (or, in certain jurisdictions, cash in lieu at the option of the company) to settle vested RSUs. The form and timing of settlement is subject to local laws. With respect to the treasury based RSP, the maximum number of common shares which the company may issue from treasury is 1,000,000 common shares. With respect to the two market based RSPs, independent trustees purchase Sierra Wireless common shares over the facilities of the TSX and Nasdaq, which are used to settle vested RSUs. The existing trust funds are variable interest entities and are included in these consolidated financial statements as treasury shares held for RSU distribution.
Generally, RSUs vest over three years, in equal one-third amounts on each anniversary date of the date of the grant. RSU grants to employees who are resident in France for french tax purposes will not vest before the second anniversary from the date of grant, and any shares issued are subject to an additional two year tax hold period. There were 1,217,347 unvested RSUs and 7,648 vested RSUs outstanding as at December 31, 2012.
The aggregate intrinsic value of RSUs that vested and settled in the year ended December 31, 2012 was $3,835 (year ended December 31, 2011 — $4,170; year ended December 31, 2010 — $4,159).
The following table summarizes the RSU activity for the years ended December 31:
|
| Number of |
| Weighted Average |
| Weighted |
| Aggregate |
| ||
|
| RSUs |
| Cdn.$ |
| U.S.$ |
| In years |
| U.S.$ |
|
Outstanding, December 31, 2009 |
| 975,884 |
| 6.88 |
| 6.53 |
| 1.9 |
| 10,349 |
|
Granted |
| 328,496 |
| 9.10 |
| 8.75 |
|
|
|
|
|
Vested |
| (443,610 | ) | 8.21 |
| 7.82 |
|
|
| 4,159 |
|
Forfeited |
| (32,779 | ) | 6.56 |
| 6.29 |
|
|
|
|
|
Outstanding, December 31, 2010 |
| 827,991 |
| 6.81 |
| 6.83 |
| 1.3 |
| 12,346 |
|
Granted |
| 486,343 |
| 10.83 |
| 10.84 |
|
|
|
|
|
Vested |
| (379,121 | ) | 11.10 |
| 11.11 |
|
|
| 4,170 |
|
Forfeited |
| (31,184 | ) | 8.54 |
| 8.43 |
|
|
|
|
|
Outstanding, December 31, 2011 |
| 904,029 |
| 8.94 |
| 8.43 |
| 1.3 |
| 6,346 |
|
Granted |
| 856,784 |
| 7.89 |
| 7.89 |
|
|
|
|
|
Vested |
| (499,038 | ) | 7.67 |
| 7.67 |
|
|
| 3,835 |
|
Forfeited |
| (36,780 | ) | 9.09 |
| 9.00 |
|
|
|
|
|
Outstanding, December 31, 2012 |
| 1,224,995 |
| 8.71 |
| 8.68 |
| 1.9 |
| 9,746 |
|
|
|
|
|
|
|
|
|
|
|
|
|
Outstanding – vested and not settled |
| 7,648 |
|
|
|
|
|
|
|
|
|
Outstanding – unvested |
| 1,217,347 |
|
|
|
|
|
|
|
|
|
Outstanding, December 31, 2012 |
| 1,224,995 |
|
|
|
|
|
|
|
|
|
As at December 31, 2012, the total remaining unrecognized compensation cost associated with the RSUs totalled $5,950 (2011 — $4,176; 2010 — $2,972), which is expected to be recognized over a weighted average period of 1.6 years (2011 — 1.9 years; 2010 — 1.6 years).
SIERRA WIRELESS, INC.
(in thousands of U.S. dollars, except where otherwise noted)
Notes to the Consolidated Financial Statements
25. NON-CONTROLLING INTEREST
The non-controlling interest represents shares held by former Wavecom employees under their long-term incentive plan. The shares had vested, but were subject to a hold period for tax purposes. We had entered into a put/call agreement with these employees to purchase back the shares at €8.50 per share upon expiry of the tax hold period. Until that time, the shares were considered non-controlling interest. On June 8, 2011, the tax hold period expired on these vested shares. During the year ended December 31, 2012, we acquired 4,250 shares, respectively, at €8.50 per share. The obligation for the remaining 500 shares at €8.50 per share has been recorded as at December 31, 2012 and is classified under accrued liabilities.
The following table summarizes the effects of changes in our ownership interest of Wavecom on our equity:
|
| 2012 |
| 2011 |
| 2010 |
| |||
Net earnings (loss) attributable to the Company |
| $ | 27,199 |
| $ | (29,315 | ) | $ | (14,541 | ) |
Transfer (to) from non-controlling interest: |
|
|
|
|
|
|
| |||
Increase on issuance of free shares |
| — |
| (796 | ) | (229 | ) | |||
|
| $ | 27,199 |
| $ | (30,111 | ) | $ | (14,770 | ) |
26. FAIR VALUE MEASUREMENT
(a) Fair value presentation
An established fair value hierarchy requires the Company to maximize the use of observable inputs and minimize the use of unobservable inputs when measuring fair value. A financial instrument’s categorization within the fair value hierarchy is based upon the lowest level of input that is available and significant to the fair value measurement. There are three levels of inputs that may be used to measure fair value:
Level 1 - Quoted prices in active markets for identical assets or liabilities.
Level 2 - Observable inputs other than quoted prices in active markets for identical assets and liabilities, such as quoted prices for identical or similar assets or liabilities in markets that are not active, or other inputs that are observable or can be corroborated by observable market data for substantially the full term of the assets or liabilities.
Level 3 - Inputs that are generally unobservable and are supported by little or no market activity and that are significant to the fair value determination of the assets or liabilities.
The carrying value of cash and cash equivalents, accounts receivable, accounts payable, accrued liabilities and current portions of long-term liabilities, approximate their fair value due to the immediate or short-term maturity of these financial instruments. Short-term investments are recorded at fair value and their carrying value as at December 31, 2012 was $nil (December 31, 2011 — $9,347). Our short-term investments are classified within Level 1 of the valuation hierarchy. Based on borrowing rates currently available to us for loans with similar terms, the carrying values of our obligations under capital leases, long-term obligations and other long-term liabilities approximate their fair values.
SIERRA WIRELESS, INC.
(in thousands of U.S. dollars, except where otherwise noted)
Notes to the Consolidated Financial Statements
On July 23, 2012, foreign currency forward exchange contracts for a notional US$56.3 million to acquire €45.0 million in connection with the acquisition of the M2M business of Sagemcom settled. For twelve months ended December 31, 2012, we realized a loss of $1,761, which is classified in Foreign exchange gain (loss) on these forward contracts.
(b) Credit Facilities
On October 31, 2012 we cancelled our then existing revolving facility (“Old Revolving Facility”) of $10 million which was to expire on January 28, 2013, and replaced it with a new revolving facility with the Toronto Dominion Bank and the Canadian Imperial Bank of Commerce in the amount of $50 million which expires October 31, 2013. The revolving facility is for our working capital requirements and is secured by a pledge against all of our assets, including assets related to discontinued operations, and is subject to borrowing base limitations. The new revolving facility contains covenants and security substantially similar to the Old Revolving Facility. There were no borrowings under the revolving facility as at December 31, 2012. We are presently reviewing the impact of the proposed sale of the assets and operations of our AirCard business on the availability of the entire $50 million of the facility.
(c) Letters of credit
We have entered into a standby letter of credit facility agreement under which we have issued three performance bonds to third party customers in accordance with specified terms and conditions. At December 31, 2012, we had two Euro denominated performance bonds amounting to €50 expiring in June 2014 and a performance bond of $176 expiring in May 2013 (December 2011 - $176). We also have a letter of credit in the amount of $1,300 expiring in May 2013 issued to a third party vendor with specified terms and conditions. These instruments approximate their fair market value.
27. FINANCIAL INSTRUMENTS
Financial Risk Management
Financial instruments consist primarily of cash and cash equivalents, accounts receivable, accounts payable and accrued liabilities. Our financial instruments also occasionally include derivatives which we use to reduce our exposure to currency fluctuations associated with revenue and expenses.
We have exposure to the following business risks:
We maintain substantially all of our cash and cash equivalents with major financial institutions or invest in government instruments. Our deposits with banks may exceed the amount of insurance provided on such deposits.
We outsource manufacturing of our products to third parties and, accordingly, we are dependent upon the development and deployment by third parties of their manufacturing abilities. The inability of any supplier or manufacturer to fulfill our supply requirements could impact future results. We have supply commitments to our contract manufacturers based on our estimates of customer and market demand. Where actual results vary from our estimates, whether due to execution on our part or market conditions, we are at risk.
Financial instruments that potentially subject us to concentrations of credit risk are primarily accounts receivable. We perform on-going credit evaluations of our customer’s financial condition and require letters of credit or other guarantees whenever deemed appropriate.
SIERRA WIRELESS, INC.
(in thousands of U.S. dollars, except where otherwise noted)
Notes to the Consolidated Financial Statements
Although substantially all of our revenues are in U.S. dollars, we incur operating costs and have obligations related to our facilities restructuring that are denominated in other currencies. Fluctuations in the exchange rates between these currencies could have a material impact on our business, financial condition and results of operations.
We are generating and incurring an increasing portion of our revenue and expenses, respectively, outside of North America including Europe, the Middle East and Asia. To manage our foreign currency risks, we may enter into foreign currency forward and options contracts should we consider it to be advisable to reduce our exposure to future foreign exchange fluctuations. As at December 31, 2012 and 2011, we had no such contracts in place.
We are subject to risks typical of an international business including, but not limited to, differing economic conditions, changes in political climate, differing tax structures other regulations and restrictions and foreign exchange rate volatility. Accordingly, our future results could be materially affected by changes in these or other factors.
28. COMMITMENTS AND CONTINGENCIES
(a) Operating leases
We have entered into operating leases for property and equipment. The minimum future payments under various operating leases for our continuing operations in each of the years ended December 31 is as follows:
2013 |
| $ | 4,429 |
|
2014 |
| 4,092 |
| |
2015 |
| 3,630 |
| |
2016 |
| 3,597 |
| |
2017 |
| 3,487 |
| |
Subsequent years |
| 10,876 |
| |
|
| $ | 30,111 |
|
(b) Contingent liability on sale of products
(i) Under license agreements, we are committed to make royalty payments based on the sales of products using certain technologies. We recognize royalty obligations as determinable in accordance with agreement terms. Where agreements are not finalized, we have recognized our current best estimate of the obligation. When the agreements are finalized, the estimate will be revised accordingly.
(ii) We are a party to a variety of agreements in the ordinary course of business under which we may be obligated to indemnify a third party with respect to certain matters. Typically, these obligations arise as a result of contracts for sale of our products to customers where we provide indemnification against losses arising from matters such as potential intellectual property infringements and product liabilities. The impact on our future financial results is not subject to reasonable estimation because considerable uncertainty exists as to whether claims will be made and the final outcome of potential claims. To date,
SIERRA WIRELESS, INC.
(in thousands of U.S. dollars, except where otherwise noted)
Notes to the Consolidated Financial Statements
we have not incurred material costs related to these types of indemnifications.
(iii) In March 2004, we entered into an agreement with the Government of Canada’s Technology Partnerships Canada (“TPC”) program, under which we were eligible to receive conditionally repayable research and development funding up to Cdn. $9,540 to support the development of a range of third generation wireless technologies. Under the terms of the agreement, all or part of the contribution was repayable upon the occurrence of certain prescribed events of default. In March 2009, we signed an amended agreement under which we will repay a total of $2,155 (Cdn. $2,500), with payments due on March 1 for each of the next five years beginning March 1, 2009, in full and final satisfaction of all amounts owing, or to be owed, to TPC under this agreement. During the year ended December 31, 2012, we repaid $505 (Cdn. $500) (2011 — $500 or Cdn. $500; 2010 — $476 or Cdn. $500).
(iv) We accrue product warranty costs, when we sell the related products, to provide for the repair or replacement of defective products. Our accrual is based on an assessment of historical experience and on management’s estimates. An analysis of changes in the liability for product warranties follows:
|
| 2012 |
| 2011 |
| ||
Balance, beginning of year |
| $ | 4,537 |
| $ | 4,059 |
|
Provisions |
| 9,399 |
| 7,254 |
| ||
Expenditures |
| (8,178 | ) | (6,776 | ) | ||
Liability held for sale |
| (1,589 | ) | — |
| ||
Balance, end of year |
| $ | 4,169 |
| $ | 4,537 |
|
(c) Other commitments
We have entered into purchase commitments totaling approximately $54,850 net of related electronic components inventory of $7,697 (December 31, 2011 — $85,071, net of electronic components inventory of $4,239), with certain contract manufacturers under which we have committed to buy a minimum amount of designated products between January 2013 and March 2013. In certain of these agreements, we may be required to acquire and pay for such products up to the prescribed minimum or forecasted purchases.
(d) Legal proceedings
We are from time to time involved in litigation, certain other claims and arbitration matters arising in the ordinary course of our business. We accrue for a liability when it is both probable that a liability has been incurred and the amount of the loss can be reasonably estimated. Significant judgment is required in both the determination of probability and the determination as to whether a loss is reasonably estimable. These accruals are reviewed at least quarterly and adjusted to reflect the impacts of negotiations, settlements, rulings, advice of legal counsel and technical experts and other information and events pertaining to a particular matter. To the extent there is a reasonable possibility (within the meaning of ASC 450, Contingencies) that the losses could exceed the amounts already accrued for those cases for which an estimate can be made, management believes that the amount of any such additional loss would not be material to our results of operations or financial condition.
SIERRA WIRELESS, INC.
(in thousands of U.S. dollars, except where otherwise noted)
Notes to the Consolidated Financial Statements
In some instances, we are unable to reasonably estimate any potential loss or range of loss. The nature and progression of litigation can make it difficult to predict the impact a particular lawsuit will have on the company. There are many reasons why we cannot make these assessments, including, among others, one or more of the following: in the early stage of a proceeding, the claimant is not required to specifically identify the patent that has allegedly been infringed; damages sought that are unspecified, unsupportable, unexplained or uncertain; discovery not having been started or being incomplete; the complexity of the facts that are in dispute (e.g., once a patent is identified, the analysis of the patent and a comparison to the activities of the company is a labor-intensive and highly technical process); the difficulty of assessing novel claims; the parties not having engaged in any meaningful settlement discussions; the possibility that other parties may share in any ultimate liability; and the often slow pace of patent litigation.
We are required to apply judgment with respect to any potential loss or range of loss in connection with litigation. While we believe we have meritorious defenses to the claims asserted against us in our currently outstanding litigations, and intend to defend ourselves vigorously in all cases, in light of the inherent uncertainties in litigation there can be no assurance that the ultimate resolution of these matters will not significantly exceed the reserves currently accrued by us for those cases for which an estimate can be made. Losses in connection with any litigation for which we are not presently able to reasonable estimate any potential loss or range of loss could be material to our results of operations and financial condition.
In December 2012, Concinnitas LLC filed a patent litigation lawsuit in the United States District Court for the Eastern District of Texas asserting patent infringement by us. The lawsuit makes allegations concerning one of our AirCard products. We have not yet been served with the complaint.
In July 2012, Technology Properties Ltd LLC, Phoenix Digital Solutions LLC and Patriot Scientific Corporation filed a complaint with the United States International Trade Commission (“ITC”) and a patent litigation lawsuit in the United States District Court for the Northern District of California asserting patent infringement by a number of parties, including us. The ITC instituted its investigation in August 2012 under the caption “In the Matter of Certain Wireless consumer Electronics Devices and Components Thereof”. In November 2012, a mutually agreeable confidential settlement agreement was entered into by the parties with respect to these matters which will not have a material adverse effect on our operating results. In December 2012, the District Court lawsuit was dismissed with prejudice and in Q1, 2013, a Joint Motion terminating the ITC investigation with respect to Sierra Wireless was granted.
In April 2012, a patent holding company, Cell and Network Selection, LLC, filed a patent litigation lawsuit in the United States District Court for the District of Texas asserting patent infringement by us and our customer. The lawsuit makes certain allegations concerning the LTE mobile hotspots and USB modems sold by us and deployed with AT&T. The lawsuit is in the scheduling stage and trial has been scheduled for March 2015. A motion to transfer the lawsuit to the Southern District of California is currently before the Court.
In January 2012, a patent holding company, M2M Solutions LLC, filed a patent litigation lawsuit in the United States District Court for the District of Delaware asserting patent infringement by us and our competitors. The lawsuit makes certain allegations concerning the AirPrime embedded wireless module products, related AirLink products and related services sold by us for use in M2M communication applications. The lawsuit is in the interrogatories and response to interrogatories stage.
SIERRA WIRELESS, INC.
(in thousands of U.S. dollars, except where otherwise noted)
Notes to the Consolidated Financial Statements
In September 2011, a patent holding company, Wi-Lan, Inc., filed a patent litigation lawsuit in the United States District Court for the Eastern District of Texas asserting patent infringement by a number of parties, including us. The lawsuit makes certain allegations concerning the wireless communication products sold by us. In September 2012, the lawsuit was consolidated with another lawsuit commenced by Wi-Lan in the Eastern District of Texas concerning the same patents and trial has been scheduled for September 2013. The lawsuit is currently in the discovery stage. In December 2012, Wi-Lan filed additional patent litigation lawsuits in the United States District Court for each of the Eastern District of Texas and the Southern District of Florida asserting patent infringement by us of additional patents not included in the first Wi-Lan suit. These two additional lawsuits are in the initial pleadings stage.
In May 2010 and in February 2011, a patent holding company, Golden Bridge Technology Inc. (“GBT”), filed patent litigation lawsuits in the United States District Court for the District of Delaware asserting patent infringement of the same two patents by a number of parties, including us and certain of our customers. In both cases, the litigation makes certain allegations concerning the wireless modems sold by us and our competitors. Both lawsuits have been stayed against all defendants except Apple, pending the outcome of the trial against Apple in Delaware which is anticipated to occur in or around April 2013. In May 2012, GBT filed a patent litigation lawsuit in the United States District Court for the Central District of California asserting patent infringement by us of a different patent from the other two lawsuits, but concerning essentially the same products. In September 2012, this lawsuit was dismissed in the Central District of California and re-filed in the District of Delaware. This lawsuit has been stayed against us pending the outcome of a trial against Apple with respect to the same patent, which is to take place in the Central District of California.
In July 2009, a patent holding company, SPH America, LLC, filed a patent litigation lawsuit in the United States District Court for the Eastern District of Virginia asserting patent infringement by a number of device manufacturers, including us, and computer manufacturers, including certain of our customers. The litigation, which has been transferred to the United States District Court for the Southern District of California, makes certain allegations concerning the wireless modules sold to the computer manufacturers by us or our competitors. The claim construction hearing occurred in April 2012 and the trial has been scheduled for June 2013. In January 2013, a mutually agreeable confidential settlement was entered into by the parties which will not have a material adverse effect on our operating results. The lawsuit was subsequently dismissed with prejudice against us.
Although there can be no assurance that an unfavorable outcome would not have a material adverse effect on our operating results, liquidity or financial position, we believe the claims made in the foregoing legal proceedings are without merit and intend to defend ourselves and our products vigorously in all cases.
IP Indemnification Claims
We have been notified by one or more of our customers in each of the following matters that we have an obligation to indemnify them in respect of the products we supply to them:
In January 2013, a patent holding company, Steelhead Licensing LLC, filed a patent litigation lawsuit in the United States District Court for the District of Delaware against one of our customers asserting patent
SIERRA WIRELESS, INC.
(in thousands of U.S. dollars, except where otherwise noted)
Notes to the Consolidated Financial Statements
infringement in relation to our customer’s products and services, including the mobile hotspot devices sold to them by us. The lawsuit is in the initial pleadings stage.
In February 2012, a patent holding company, Intellectual Ventures, filed a patent litigation lawsuit in the United States District Court for the District of Delaware against one of our customers asserting patent infringement in relation to several of our customer’s products and services, including the mobile hotspots sold to them by us. The lawsuit is in the initial pleadings stage.
In September 2011, a patent holding company, Mayfair Wireless, LLC, filed a patent litigation lawsuit in the United States District Court for the District of Delaware against two of our customers asserting patent infringement in relation to the wireless hotspots sold to them by us. A motion to dismiss the lawsuit has been briefed and is pending judgment of the Court.
In August 2011, a patent holding company, Brandywine Communications Technologies, LLC, filed a patent litigation lawsuit in the United States District Court for the Middle District of Florida against one of our customers asserting patent infringement in relation to the wireless modems sold to them by us. In December 2012, we advised our customer that we had been granted a license with respect to the patents-in-suit, which license covers any of our products sold by our customers (including this customer). We believe this outcome will not have a material adverse effect on our operating results.
In July 2011, a patent holding company, GPNE Corp., filed a patent litigation lawsuit in the United States District Court for the District of Hawaii asserting patent infringement against one of our customers for selling e-readers and computerized tablet and communication devices with the ability to function with GPRS, including the Nook e-reader which incorporates wireless modules sold to them by us. In May 2012, an Order of the Magistrate Judge to sever the actions and, in the case of certain defendants including our customer, transfer the actions to the United States District Court for the Northern District of California was granted and has been affirmed by the District Court. In November 2012, a mutually agreeable settlement agreement was entered into between our customer and GPNE, and the lawsuit was subsequently dismissed with prejudice. We believe this outcome will not have a material adverse effect on our operating results.
In June 2011, Barnes and Noble, Inc. filed a declaratory judgment action in the United States District Court for the Northern District of California against LSI Corporation (and later added Agere Systems, Inc.) (collectively, “LSI”), seeking a declaration that certain patents were not infringed by their products, including the 3G Nook e-reader which incorporates wireless modules sold to them by us. LSI counterclaimed for patent infringement. There are currently 6 patents-in-suit, two of which relate to the 3G products which incorporate our modules. The lawsuit is currently in the scheduling phase.
A patent holding company, Eon Corp. IP Holdings, LLC, filed a patent litigation lawsuit against one of our customers in October 2010 in the United States District Court for the Eastern District of Texas, which was subsequently transferred to the United States District Court for the Northern District of California. Eon filed a patent litigation lawsuit against another of our customers in January 2012 in the United States District Court for the District of Puerto Rico. In both cases, assertions of patent infringement are being made in relation to the wireless modems sold to our customers by us. Both lawsuits are in the scheduling phase.
SIERRA WIRELESS, INC.
(in thousands of U.S. dollars, except where otherwise noted)
Notes to the Consolidated Financial Statements
In March 2009, MSTG Inc., a patent holding company, filed a patent litigation lawsuit in the United States District Court for the Northern District of Illinois asserting patent infringement by a number of telecommunication carrier companies, including one of our customers, which the customer claims relates to the wireless data cards and modems sold to them by us. In December 2012, the lawsuit was dismissed with prejudice. We believe this outcome will not have a material adverse effect on our operating results.
Although there can be no assurance that an unfavorable outcome would not have a material adverse effect on our operating results, liquidity or financial position, we believe the claims made in the foregoing legal proceedings are without merit and intend to defend ourselves and our products vigorously in all cases.
We are engaged in certain other claims, legal actions and arbitration matters, all in the ordinary course of business, and believe that the ultimate outcome of these claims, legal actions and arbitration matters will not have a material adverse effect on our operating results, liquidity or financial position.
29. SEGMENTED INFORMATION
We implemented a new organizational structure during the fourth quarter of 2010 and we have two reportable segments effective January 1, 2011.
· Machine-to-Machine
· Mobile Computing
Our segments have changed from those reported at December 31, 2010 when we reported in one segment. We have not restated our comparative information as discrete financial information for the two segments is not available for periods prior to January 1, 2011.
The amounts presented below for the Mobile Computing segment have been adjusted retrospectively to exclude amounts attributable to the AirCard business. The results related to the AirCard business are presented as discontinued operations (note 6).
As we do not evaluate the performance of our operating segment based on segment assets, management does not classify asset information on a segmented basis. Despite the absence of discrete financial information we do measure our revenue based on other forms of categorization such as by the products we produce and the geographic distribution in which our products are sold.
SIERRA WIRELESS, INC.
(in thousands of U.S. dollars, except where otherwise noted)
Notes to the Consolidated Financial Statements
REVENUE BY SEGMENT
|
| Year ended December 31, 2012 |
| |||||||
|
| Machine- |
| Mobile |
| Total |
| |||
|
|
|
|
|
|
|
| |||
Revenue |
| $ | 335,990 |
| $ | 61,331 |
| $ | 397,321 |
|
Cost of goods sold |
| 224,229 |
| 47,818 |
| 272,047 |
| |||
Gross margin |
| $ | 111,761 |
| $ | 13,513 |
| $ | 125,274 |
|
Gross margin % |
| 33.3 | % | 22.0 | % | 31.5 | % | |||
Expenses |
|
|
|
|
| 147,480 |
| |||
Loss from operations |
|
|
|
|
| $ | (22,206 | ) | ||
Total assets |
|
|
|
|
| $ | 464,763 |
| ||
|
| Year ended December 31, 2011 |
| |||||||
|
| Machine- |
| Mobile |
| Total |
| |||
|
|
|
|
|
|
|
| |||
Revenue |
| $ | 293,219 |
| $ | 39,956 |
| $ | 333,175 |
|
Cost of goods sold |
| 198,271 |
| 33,164 |
| 231,435 |
| |||
Gross margin |
| $ | 94,948 |
| $ | 6,792 |
| $ | 101,740 |
|
Gross margin % |
| 32.4 | % | 17.0 | % | 30.5 | % | |||
Expenses |
|
|
|
|
| 155,993 |
| |||
Loss from operations |
|
|
|
|
| $ | (54,253 | ) | ||
Total assets |
|
|
|
|
| $ | 422,887 |
| ||
|
| Year ended December 31, 2010 |
| |||||||
|
| Machine- |
| Mobile |
| Total |
| |||
|
|
|
|
|
|
|
| |||
Revenue |
| $ | 332,445 |
| $ | 25,560 |
| $ | 358,005 |
|
Cost of goods sold |
| n/a |
| n/a |
| 236,599 |
| |||
Gross margin |
| n/a |
| n/a |
| $ | 121,406 |
| ||
Gross margin % |
| n/a |
| n/a |
| 33.9 | % | |||
Expenses |
|
|
|
|
| 164,123 |
| |||
Loss from operations |
|
|
|
|
| $ | (42,717 | ) | ||
Total assets |
|
|
|
|
| $ | 469,568 |
| ||
SIERRA WIRELESS, INC.
(in thousands of U.S. dollars, except where otherwise noted)
Notes to the Consolidated Financial Statements
Revenue and gross margin from discontinued operations was previously a component of the Mobile Computing segment and totaled $246,845 and $69,698, respectively in the year ended December 31, 2012 (year ended December 31, 2011 - $245,010 revenue; $61,710 gross margin). Refer to note 6 for further details.
REVENUE BY GEOGRAPHICAL REGION
|
| 2012 |
| 2011 |
| 2010 |
| |||
Americas |
| $ | 101,240 |
| $ | 83,890 |
| $ | 82,478 |
|
Europe, Middle East and Africa |
| 79,904 |
| 90,724 |
| 79,045 |
| |||
Asia-Pacific |
| 216,177 |
| 158,561 |
| 196,482 |
| |||
|
| $ | 397,321 |
| $ | 333,175 |
| $ | 358,005 |
|
REVENUE BY PRODUCT
|
| 2012 |
| 2011 |
| 2010 |
| |||
Machine-to-Machine |
|
|
|
|
|
|
| |||
AirPrime Embedded Wireless Modules for M2M |
| $ | 279,324 |
| $ | 242,791 |
| $ | 274,964 |
|
AirLink Intelligent Gateways and Routers |
| 46,699 |
| 39,013 |
| 48,626 |
| |||
AirVantage M2M Cloud Platform and Other |
| 9,967 |
| 11,415 |
| 8,855 |
| |||
|
| 335,990 |
| 293,219 |
| 332,445 |
| |||
Mobile Computing |
|
|
|
|
|
|
| |||
AirPrime Embedded Wireless Modules for PC OEM |
| 61,133 |
| 39,422 |
| 23,420 |
| |||
Other |
| 198 |
| 534 |
| 2,140 |
| |||
|
| 61,331 |
| 39,956 |
| 25,560 |
| |||
|
| $ | 397,321 |
| $ | 333,175 |
| $ | 358,005 |
|
PROPERTY AND EQUIPMENT BY GEOGRAPHICAL REGION
|
| 2012 |
| 2011 |
| 2010 |
| |||
Americas |
| $ | 8,169 |
| $ | 14,108 |
| $ | 14,609 |
|
Europe, Middle East and Africa |
| 8,580 |
| 5,197 |
| 4,831 |
| |||
Asia-Pacific |
| 3,290 |
| 2,782 |
| 3,195 |
| |||
|
| $ | 20,039 |
| $ | 22,087 |
| $ | 22,635 |
|
Executive Officers
Jason W. Cohenour
President and Chief Executive Officer
David G. McLennan
Chief Financial Officer and Secretary
Philippe Guillemette
Chief Technology Officer
Bill G. Dodson
Senior Vice President, Operations
Dan Schieler
Senior Vice President and General Manager, Mobile Computing Business Unit
Didier Dutronc
Senior Vice President and General Manager, M2M Embedded Solutions Business Unit & Regional General Manager, Europe
Emmanuel Walckenaer
Senior Vice President and General Manager, Solutions and Services Business Unit
James B. Kirkpatrick
Senior Vice President, Engineering, Mobile Computing Business Unit
Pierre Teyssier
Senior Vice President, Engineering, M2M Embedded Solutions Business Unit & Regional General Manager, Asia Pacific
Jason L. Krause
Senior Vice President, Corporate Development and Marketing
Directors
Gregory D. Aasen (3)
Corporate Director
Robin A. Abrams (1)
Corporate Director
Paul G. Cataford (1), (2)
Corporate Director
Charles E. Levine (1), (2), (3)
Chairman of the Board
Kent Thexton (3)
Corporate Director
Jason W. Cohenour
President and Chief Executive Officer
Sierra Wireless, Inc.
(1) Audit Committee
(2) Governance and Nominating Committee
(3) Human Resources Committee
General Counsel Blake, Cassels & Graydon LLP Vancouver, BC
US Counsel Skadden, Arps, Slate, Meagher & Flom LLP Toronto, Ontario
Intellectual Property Lawyers Nixon Peabody LLP Palo Alto, California
Auditors KPMG LLP Vancouver, BC |
| Transfer Agent Computershare Investor Services Inc. Vancouver, BC
Share Information The common shares of Sierra Wireless, Inc. are listed for trading under the symbol SW on The Toronto Stock Exchange and under SWIR on The Nasdaq Global Market.
Annual General Meeting The Annual General Meeting for the shareholders of Sierra Wireless, Inc. will be held on Thursday, May 16, 2013 at 3:00 p.m. (Pacific) at the Company’s head office in Richmond, British Columbia. |
|
|
| ||||
Head Office | ||||
Sierra Wireless, Inc. | ||||
13811 Wireless Way | ||||
Richmond | ||||
British Columbia | ||||
Canada V6V 3A4 | ||||
| ||||
Telephone :: 604 231 1100 | ||||
| ||||
Facsimile :: 604 231 1109 | ||||
| ||||
Website :: www.sierrawireless.com |