EXHIBIT 1.3
SIERRA WIRELESS, INC.
MANAGEMENT’S DISCUSSION AND ANALYSIS
For the Fiscal Year Ended December 31, 2013
DATED February 27, 2014
MANAGEMENT’S DISCUSSION AND ANALYSIS
Table of Contents
|
| |
| MANAGEMENT’S DISCUSSION AND ANALYSIS | |
| CAUTIONARY NOTE REGARDING FORWARD LOOKING STATEMENTS | |
| OVERVIEW | |
| Business Overview | |
| Strategy | |
| Annual Overview - Financial Highlights | |
| Outlook | |
| Disposition of AirCard Business | |
| CONSOLIDATED ANNUAL RESULTS OF OPERATIONS | |
| Year ended December 31, 2013 compared to Year Ended December 31, 2012 | |
| Year ended December 31, 2012 compared to Year Ended December 31, 2011 | |
| SEGMENTED INFORMATION | |
| FOURTH QUARTER OVERVIEW | |
| SUMMARY OF QUARTERLY RESULTS OF OPERATIONS | |
| LIQUIDITY AND CAPITAL RESOURCES | |
| NON-GAAP FINANCIAL MEASURES | |
| OFF-BALANCE SHEET ARRANGEMENTS | |
| TRANSACTIONS BETWEEN RELATED PARTIES | |
| CRITICAL ACCOUNTING POLICIES AND ESTIMATES | |
| OUTSTANDING SHARE DATA | |
| IMPACT OF ACCOUNTING PRONOUNCEMENTS AFFECTING FUTURE PERIODS | |
| DISCLOSURE CONTROLS | |
| INTERNAL CONTROL OVER FINANCIAL REPORTING | |
| LEGAL PROCEEDINGS | |
| RISKS AND UNCERTAINTIES | |
MANAGEMENT’S DISCUSSION AND ANALYSIS OF
FINANCIAL CONDITION AND RESULTS OF OPERATIONS
The following Management’s Discussion and Analysis of Financial Condition and Results of Operations (“MD&A”) provides information for the year ended December 31, 2013, and up to and including February 27, 2014. This MD&A should be read together with our audited consolidated financial statements and the accompanying notes for the year ended December 31, 2013 (“the consolidated financial statements”). The consolidated financial statements have been prepared in accordance with generally accepted accounting principles in the United States (“U.S. GAAP”). Except where otherwise specifically indicated, all amounts in this MD&A are expressed in United States dollars.
We have prepared this MD&A with reference to National Instrument 51-102 “Continuous Disclosure Obligations” of the Canadian Securities Administrators. Under the U.S./Canada Multijurisdictional Disclosure System, we are permitted to prepare this MD&A in accordance with the disclosure requirements of Canada, which requirements are different than those of the United States.
Certain statements in this MD&A constitute forward-looking statements or forward-looking information within the meaning of applicable securities laws. You should carefully read the cautionary note in this MD&A regarding forward-looking statements and should not place undue reliance on any such forward-looking statements. See “Cautionary Note Regarding Forward-Looking Statements”.
Throughout this document, references are made to certain non-GAAP financial measures that are not measures of performance under U.S. GAAP. Management believes that these non-GAAP financial measures provide useful information to investors regarding the Company’s financial condition and results of operations as they provide additional measures of its performance. These non-GAAP financial measures do not have any standardized meaning prescribed by U.S. GAAP and are therefore unlikely to be comparable to similar measures presented by other issuers. These non-GAAP financial measures are defined and reconciled to their nearest GAAP measure in “Non-GAAP Financial Measures”.
Additional information about the Company, including our most recent consolidated financial statements and our Annual Information Form, is available on SEDAR at www.sedar.com and on EDGAR at www.sec.gov.
Cautionary Note Regarding Forward-looking Statements
Certain statements and information in this MD&A are not based on historical facts and constitute forward-looking statements or forward-looking information within the meaning of the U.S. Private Securities Litigation Reform Act of 1995 and Canadian securities laws (“forward-looking statements”), including our business outlook for the short and longer term and our strategy, plans and future operating performance. Forward-looking statements are provided to help you understand our views of our short and longer term prospects. We caution you that forward-looking statements may not be appropriate for other purposes. We will not update or revise our forward-looking statements unless we are required to do so by securities laws. Forward-looking statements:
| |
| • | Typically include words and phrases about the future such as “outlook”, “may”, “estimates”, “intends”, “believes”, “plans”, “anticipates” and “expects”; |
| |
| • | Are not promises or guarantees of future performance. They represent our current views and may change significantly; |
| |
| • | Are based on a number of material assumptions, including those listed below, which could prove to be significantly incorrect: |
| |
| ▪ | Our ability to develop, manufacture and sell new products and services that meet the needs of our customers and gain commercial acceptance; |
| |
| ▪ | Our ability to continue to sell our products and services in the expected quantities at the expected prices and expected times; |
| |
| ▪ | Expected cost of goods sold; |
| |
| ▪ | Expected component supply constraints; |
| |
| ▪ | Our ability to “win” new business; |
| |
| ▪ | Expected deployment of next generation networks by wireless network operators; |
| |
| ▪ | Our operations are not adversely disrupted by component shortages or other development, operating or regulatory risks; and |
| |
| ▪ | Expected tax rates and foreign exchange rates. |
| |
| • | Are subject to substantial known and unknown material risks and uncertainties. Many factors could cause our actual results, achievements and developments in our business to differ significantly from those expressed or implied by our forward-looking statements, including, without limitation, the following factors which are discussed in greater detail under “Risks and Uncertainties” and in our other regulatory filings with the U.S. Securities and Exchange Commission (the “SEC”) in the United States and the provincial securities commissions in Canada: |
| |
| ▪ | Actual sales volumes or prices for our products and services may be lower than we expect for any reason including, without limitation, continuing uncertain economic conditions, price and product competition, different product mix, the loss of any of our significant customers, or competition from new or established wireless communication companies; |
| |
| ▪ | The cost of products sold may be higher than planned or necessary component supplies may not be available, are delayed or are not available on commercially reasonable terms; |
| |
| ▪ | We may be unable to enforce our intellectual property rights or may be subject to litigation that has an adverse outcome; |
| |
| ▪ | The development and timing of the introduction of our new products may be later than we expect or may be indefinitely delayed; |
| |
| ▪ | Transition periods associated with the migration to new technologies may be longer than we expect; |
| |
| ▪ | Unanticipated costs associated with litigation or settlements associated with intellectual property matters; and |
| |
▪ | Higher than anticipated costs; disruption of, and demands on, our ongoing business; and diversion of management’s time and attention in connection with acquisitions or divestitures. |
Investors are cautioned not to place undue reliance on these forward-looking statements. No forward-looking statement is a guarantee of future results.
OVERVIEW
Business Overview
Sierra Wireless Inc. (“Sierra Wireless” or the “Company”) is the global leader in machine-to-machine (“M2M”) devices and cloud services, delivering intelligent wireless solutions that simplify the connected world. We offer the industry's most comprehensive portfolio of 2G, 3G, and 4G LTE embedded modules and gateways, seamlessly integrated with our secure M2M cloud services. Customers worldwide, including OEMs, enterprises and mobile network operators, trust our innovative solutions to get their connected products and services to market faster.
During 2013 we significantly advanced our strategy to become a leading M2M pure play. On April 2, 2013, we completed the sale of substantially all of the assets and operations related to our AirCard business for $136.6 million in cash plus assumed liabilities (refer to the section on “Disposition of AirCard business” for additional details). During the year we also accelerated our revenue and profitability growth through an active acquisition strategy focused on M2M opportunities. In October 2013, we completed the acquisition of the M2M modules and modem assets of AnyDATA Corporation ("AnyDATA") for $5.2 million. The M2M business of AnyDATA includes 3G and 4G wireless modules and modems which are sold mainly in Korea. This acquisition extends our global leadership position in the growing M2M market and provides us with a leading position in Korea.
On January 26, 2014 we entered into a definitive agreement to acquire all the shares of In Motion Technology Inc. ("In Motion") for $21 million. The acquisition is expected to close in early March 2014 and is subject to certain post-closing adjustments. In Motion is a leader in mobile enterprise solutions, providing rugged in-vehicle mobile routers that are integrated with an advanced mobile-optimized security system and a powerful management and application platform. In Motion's solutions are used by public safety, transit and utility fleets across the United States and Canada. This acquisition further strengthens our leadership position in M2M and will broaden our product portfolio focused on enterprises.
As a result of the sale of the AirCard business, as well as our recent acquisition of the AnyDATA M2M business and our contemplated acquisition of In Motion, our segments have changed from those reported at December 31, 2012. We are now reporting two segments, OEM Solutions and Enterprise Solutions, and all prior periods have been retrospectively adjusted to reflect the two segments.
Our OEM Solutions segment includes embedded wireless modules and tools for OEM customers to integrate wireless connectivity into products and solutions across a broad range of industries, including automotive, networking, energy, security, sales and payment, industrial control and monitoring, fleet management, field service, healthcare, and consumer electronics, including leading PC and tablet manufacturers. Within our OEM Solutions segment, the AirPrime® Embedded Wireless Modules product portfolio spans 2G, 3G, and 4G technologies and includes robust remote device management capability, as well as support for on-board embedded applications using the OpenAT® Application Framework.
Our Enterprise Solutions segment includes intelligent gateways, modems and tools for enterprise customers including a cloud-based platform for building, deploying and managing M2M applications. These products enable Enterprise customers to get their M2M applications up and running quickly. Following closing, the acquired In Motion business will be integrated and reported within our Enterprise Solutions segment.
Within our Enterprise Solutions segment, the AirLink product portfolio includes 2G, 3G and 4G LTE gateways. AirLink® devices are rugged, intelligent wireless gateways that provide plug and play mission-critical connectivity. They are designed for use where reliability and security are essential, and are sold to public safety, transportation, field service, energy, industrial, retail and financial enterprises around the world. AirLink gateways can be easily configured for the customer's application, and also support on-board embedded applications using the ALEOS Application Framework.
Our Enterprise Solutions segment also includes the AirVantage M2M Cloud which provides a secure, scalable infrastructure for M2M applications. The AirVantage Enterprise Platform can be used to collect and store machine data, and process and schedule events from any number of devices, across any network operator around the world. M2M solution developers can use the latest cloud application programming interface (API) standards to quickly integrate machine data with their own enterprise applications and back-end systems. The AirVantage Management Service can be used to centrally deploy and monitor M2M devices, including configuring device settings, delivering firmware and embedded application updates, and administering airtime subscriptions across global networks.
Strategy
The cellular M2M embedded module and gateway markets are expected to grow significantly over the next several years. Adoption of M2M solutions is driven by a number of enablers, such as lower wireless connectivity costs, higher wireless connection speeds, new devices and tools to simplify application development and increased focus and investment from many large ecosystem players. Key benefits for customers deploying M2M solutions, such as the ability to generate new revenue streams, improve cost efficiencies, gather important customer and market intelligence, as well as regulatory and security requirements, are also driving demand for M2M connectivity.
Management believes these factors create a substantial growth opportunity for the Company. We are the global leader in M2M embedded cellular devices today, with 34% market share (source: ABI Research, 2012). Going forward, we plan to build on this leadership position and expand our business across the M2M value chain. We intend to:
| |
• | Leverage our M2M leadership position to drive profitable organic growth; |
| |
• | Leverage our innovative device to cloud product offering to capture more of the M2M value chain; |
| |
• | Innovate and execute in order to expand into more M2M segments and geographical markets; and |
| |
• | Accelerate revenue and profitability growth through focused acquisitions. |
Annual Overview — Financial highlights
Our 2013 revenue increased 11.2% to $441.9 million compared to 2012. This increase was largely driven by continued growth in both the Enterprise Solutions and OEM Solutions segments, including a full year contribution from the acquisition of the M2M business of Sagemcom which was completed in August 2012. Gross margin percentage improved year-over-year due to favorable product mix and product cost reductions. Revenue growth and stronger gross margin led to adjusted EBITDA growth of 47.9% to $18.7 million compared to 2012.
Financial highlights for year ended December 31, 2013:
GAAP
| |
| • | Record revenue of $441.9 million from our continuing business, up 11.2%, compared to $397.3 million in 2012. |
| |
| • | Gross margin improved to 33.0%, compared to 31.5% in 2012. |
| |
| • | Operating loss from continuing operations was $17.7 million, compared to an operating loss of $22.2 million in 2012. |
| |
| • | Net earnings including discontinued operations were $55.0 million and diluted earnings per share of $1.79, up 102.4%, compared to $27.2 million and diluted earnings per share of $0.88 in 2012. |
Non-GAAP
| |
| • | Gross margin was 33.1%, compared to 31.6% in 2012. |
| |
| • | Operating earnings were $5.0 million, up significantly from $0.9 million in 2012. |
| |
| • | Adjusted EBITDA was $18.7 million, compared to $12.6 million in 2012. |
| |
| • | Net earnings from continuing operations of $6.9 million and diluted earnings per share of $0.23, improved significantly from a net loss from continuing operations of $0.4 million and loss per share of $0.01 in 2012. |
Selected Annual Financial information:
|
| | | | | | | | | | | | | |
| (in thousands of U.S. dollars, except where otherwise stated) | | | | | | | |
| | | 2013 | | 2012 | | 2011 | |
| Statement of Operations data: | | |
| | |
| | |
| |
| Revenue | | $ | 441,860 |
| | $ | 397,321 |
| | $ | 333,175 |
| |
| | | | | | | | |
| Gross Margin | | |
| | |
| | |
| |
| - GAAP | | $ | 145,641 |
| | $ | 125,274 |
| | $ | 101,740 |
| |
- Non-GAAP (1) | | 146,047 |
| | 125,578 |
| | 102,125 |
| |
| | | | | | | | |
| Gross Margin % | | |
| | |
| | |
| |
| - GAAP | | 33.0 | % | | 31.5 | % | | 30.5 | % | |
- Non-GAAP (1) | | 33.1 | % | | 31.6 | % | | 30.7 | % | |
| | | | | | | | |
| Earnings (loss) from operations | | |
| | |
| | |
| |
| - GAAP | | $ | (17,664 | ) | | $ | (22,206 | ) | | $ | (54,253 | ) | |
- Non-GAAP (1) | | 5,053 |
| | 898 |
| | (22,390 | ) | |
| | | | | | | | |
| Net earnings (loss) from continuing operations | | |
| | |
| | |
| |
| - GAAP | | $ | (15,550 | ) | | $ | (4,202 | ) | | $ | (50,710 | ) | |
- Non-GAAP (1) | | 6,942 |
| | (444 | ) | | (18,681 | ) | |
| | | | | | | | |
| Net earnings from discontinued operations | | |
| | |
| | |
| |
| - GAAP | | $ | 70,588 |
| | $ | 31,401 |
| | $ | 21,338 |
| |
- Non-GAAP (1) | | 4,420 |
| | 33,796 |
| | 22,289 |
| |
| | | | | | | | |
| Net earnings (loss) attributable to the Company | | |
| | |
| | |
| |
| - GAAP | | $ | 55,038 |
| | $ | 27,199 |
| | $ | (29,315 | ) | |
- Non-GAAP (1) | | 11,362 |
| | 33,352 |
| | 3,633 |
| |
| | | | | | | | |
| Adjusted EBITDA | | $ | 18,702 |
| | $ | 12,645 |
| | (9,629 | ) | |
| | | | | | | | |
| Revenue by Segment: | | | | | | | |
| OEM Solutions | | $ | 382,016 |
| | $ | 346,543 |
| | $ | 290,463 |
| |
| Enterprise Solutions | | 59,844 |
| | 50,778 |
| | 42,712 |
| |
| | | $ | 441,860 |
| | $ | 397,321 |
| | $ | 333,175 |
| |
| | | | | | | | |
| Share and per share data: | | |
| | |
| | |
| |
| Basic and diluted earnings (loss) from continuing operations per share (in dollars) | | | | | | | |
| - GAAP | | $ | (0.50 | ) | | $ | (0.14 | ) | | $ | (1.62 | ) | |
- Non-GAAP (1) | | $ | 0.23 |
| | $ | (0.01 | ) | | $ | (0.60 | ) | |
| | | | | | | | |
| Basic and diluted earnings (loss) per share (in dollars) | | |
| | |
| | |
| |
| - GAAP | | $ | 1.79 |
| | $ | 0.88 |
| | $ | (0.94 | ) | |
- Non-GAAP (1) | | $ | 0.37 |
| | $ | 1.08 |
| | $ | 0.12 |
| |
| | | | | | | | |
| Common shares (in thousands) | | |
| | |
| | |
| |
| At period-end | | 31,098 |
| | 30,592 |
| | 31,307 |
| |
| Weighed average - basic and diluted | | 30,771 |
| | 30,788 |
| | 31,275 |
| |
| | | | | | | | |
| Balance sheet data: | | |
| | |
| | |
| |
| Cash and cash equivalents and short-term investments | | $ | 179,886 |
| | $ | 63,646 |
| | $ | 110,722 |
| |
| Total assets | | 512,000 |
| | 464,763 |
| | 422,887 |
| |
| Total long-term liabilities | | 21,677 |
| | 26,826 |
| | 25,379 |
| |
| | | | | | | | |
(1) Non-GAAP results exclude the impact of stock-based compensation expense, acquisition amortization, impairment, gain on sale of AirCard business, acquisition and disposition costs, integration costs, restructuring costs, foreign exchange gains or losses on foreign currency contracts and translation of balance sheet accounts, and certain tax adjustments. Refer to the section on “Non-GAAP financial measures” for additional details.
See discussion under “Consolidated Annual Results of Operations” for factors that have caused period to period variations.
Other key business highlights for the year ended December 31, 2013 include:
OEM Solutions
| |
| ◦ | We introduced the next generation of AirPrime modules, first in the world to combine a powerful multicore processor, built-in connectivity to secure cloud services, and an open application framework to offer an entire M2M ecosystem on a module. This M2M ecosystem on a module is a major step forward in simplifying the integration of embedded wireless communications, enabling developers to spend more time developing their core application and business model, and less time on the challenges of integrating wireless communications. |
| |
| ◦ | We introduced the AirPrime AR7550 embedded wireless module, the first in the AirPrime AR7 series of automotive-grade modules for LTE networks. The module features a next generation multicore architecture which provides a dedicated application processor, an open-source application framework, and secure cloud services to simplify wireless integration and help reduce development cost. The AirPrime AR7550 is specifically developed for the Verizon Wireless 4G LTE network. |
| |
| ◦ | We announced that the AirPrime MC7355 embedded wireless module is the first 4G LTE module to be certified on the Sprint network. Demonstrating technical leadership in the LTE space, the AirPrime MC7355 joins a wide range of Sierra Wireless modules available for Sprint. For OEM customers, Sierra Wireless is uniquely positioned to manage and facilitate Sprint certification through its CTA authorized laboratory, thereby eliminating the need for a third-party lab and significantly reducing time to market. |
| |
| ◦ | We announced that our AirPrime EM7305 embedded wireless module had been selected and integrated into the Toshiba Protégé Z10t - a high performance, Windows 8, Ultrabook that is equipped with a detachable screen. The Toshiba Protégé Z10t with the AirPrime EM7305 module launched in June on the Telstra network in Australia. |
| |
| ◦ | We announced the launch of the AirPrime® HL Series of embedded wireless modules for M2M applications. The new AirPrime HL devices are the smallest embedded wireless modules to be completely scalable across 2G, 3G and 4G technologies. The HL series also offers flexible mounting options and over-the-air firmware upgradability using our AirVantage Cloud. |
| |
| ◦ | More recently, we announced the launch of our AirPrime EM7340 and EM7345 embedded wireless modules for 4G LTE networks. These devices are based on Intel chipsets and designed for integration into notebook computers and tablets, with a standardized M.2 form factor ideal for small, thin devices. |
| |
| ◦ | Also recently, we introduced the Legato™ platform, an open source embedded platform built on Linux and designed to simplify the development of M2M applications from the device to the cloud. Legato includes Wind River Linux, a commercial-grade Linux distribution with a rich set of capabilities based on the latest open source technologies, along with a fully integrated application framework and feature-rich tools. It makes M2M application development quicker, easier, and more flexible by providing a tested and validated solution on an established, well-supported open source foundation with built-in connectivity, security, and management. Legato provides embedded M2M developers with a head start, significantly reducing the time and cost to build their solutions. It provides existing customizable components needed for M2M solutions across a wide range of target markets, including connected cars, smart meters, and industrial automation. Legato will be pre-integrated in all new smart modules from Sierra Wireless, starting with the AirPrime WP and AirPrime AR Series shipping later this year. |
Enterprise Solutions
| |
| ◦ | We launched a compact 3G intelligent gateway, the AirLink LS300, an all-in-one successor to the market-leading AirLink Raven line of rugged gateways. The AirLink LS300 is quick to deploy, simple to manage, and stands up for years in the harshest environments. It provides all the benefits customers have come to rely on in the AirLink product line, including best-in-class network connectivity, rugged military-spec design and ALEOS™ embedded intelligence. |
| |
| ◦ | We announced the launch of the Sierra Wireless Solution Partner Program and the Sierra Wireless M2M Solution Exchange. The Sierra Wireless Solution Partner Program offers a streamlined, functional way for solution partners to work with Sierra Wireless to promote their solutions powered by Sierra Wireless technology to the market. |
| |
| ◦ | More recently, we announced the launch of the AirLink ES440 4G LTE gateway and terminal server, providing mission-critical 4G LTE connectivity when primary wireline internet connections are unavailable, making it ideal for the distributed enterprise market. |
| |
| ◦ | We also signed a formal teaming agreement to work collaboratively with Tech Mahindra Ltd. to develop and deploy end-to-end M2M solutions for customers worldwide. The collaboration leverages our device-to-cloud offerings and Tech Mahindra's system integration and application development expertise to offer cost-effective, turnkey solutions tailored for prospective M2M customers in markets such as energy, transportation, industrial, and healthcare. |
Outlook
In the first quarter of 2014, we expect solid year-over-year revenue and earnings growth. We expect gross margin to decrease slightly from fourth quarter 2013 due to a shift in product mix and we expect operating expenses to increase as a result of higher new product certification costs, investment in sales and marketing capabilities, and a full quarter of expenses related to the AnyDATA acquired business.
We believe that the market for wireless M2M solutions has strong long-term growth prospects. We anticipate strong growth in the number and type of devices being wirelessly connected, driven by a number of enablers, such as lower wireless connectivity costs, faster wireless connection speeds, new devices and tools to simplify the development of M2M applications, and increased focus and investment from large ecosystem players. More importantly, we see strong customer demand emerging in many of our target verticals driven by increasing recognition of the value created by deploying M2M solutions, such as new revenue streams and cost efficiencies.
Key factors that we expect will affect our results in the near term are:
| |
| • | the strength of our competitive position in the market; |
| |
| • | the timely ramp up of sales of our new products recently launched or currently under development; |
| |
| • | the level of success our OEM customers achieve with sales of connected solutions to end users; |
| |
| • | our ability to secure future design wins with both existing and new customers; |
| |
| • | wireless technology transitions and the timing of deployment of new, higher speed networks by wireless operators; |
| |
| • | the availability of components from key suppliers; |
| |
| • | general economic conditions in the markets we serve; and |
We expect that product and price competition from other wireless device manufacturers will continue to play a role in the M2M market. As a result of these factors, we may experience volatility in our results on a quarter-to-quarter basis. Gross margin percentage may fluctuate from quarter-to-quarter depending on product and customer mix, competitive selling prices and product costs.
Disposition of AirCard Business
On April 2, 2013, we completed the sale of substantially all of the assets and operations related to our AirCard business to Netgear, Inc. (“Netgear”). Proceeds on disposition, after final inventory adjustments, were $136.6 million plus assumed liabilities and comprised of cash proceeds of $122.8 million, funds held in escrow of $13.8 million and assumed liabilities. After transaction costs of $2.8 million, we recorded an after tax gain on disposal of $70.2 million. We expect to realize net cash proceeds of approximately $114 million from the divestiture after giving consideration to related taxes, transaction costs and escrow retention for the purposes of indemnification. Approximately 160 employees, primarily in sales, marketing and research and development, were transferred to Netgear, as well as certain facilities in Carlsbad, California and Richmond, British Columbia. We intend to use a substantial portion of the net proceeds from the transaction to accelerate our M2M leadership position through acquisitions in the M2M market as evidenced by our recent acquisition of the AnyDATA M2M assets and the pending acquisition of In Motion.
In accordance with U.S. GAAP, the results of operations and the gain on sale of the AirCard business have been presented as discontinued operations in our consolidated statements of operations for the three years ended December 31, 2013. The historical consolidated statements of operations and related selected financial information have been retrospectively adjusted to distinguish between continuing operations and discontinued operations.
Summarized results from discontinued operations for the years ended December 31 were as follows:
|
| | | | | | | | | | | | | |
| (in thousands of U.S. dollars) | | | | | | | |
| | | 2013 | | 2012 | | 2011 | |
| Revenue | | $ | 46,701 |
| | $ | 246,845 |
| | $ | 245,010 |
| |
| Cost of goods sold | | 32,978 |
| | 177,147 |
| | 183,300 |
| |
| Gross margin | | 13,723 |
| | 69,698 |
| | 61,710 |
| |
| Expenses | | 12,918 |
| | 36,653 |
| | 37,369 |
| |
| Earnings from operations | | 805 |
| | 33,045 |
| | 24,341 |
| |
| Income tax expense | | 399 |
| | 1,644 |
| | 3,003 |
| |
| Earnings from operations, net of taxes | | 406 |
| | 31,401 |
| | 21,338 |
| |
| Gain on sale of AirCard business, net of taxes | | 70,182 |
| | — |
| | — |
| |
| Net earnings from discontinued operations | | $ | 70,588 |
| | $ | 31,401 |
| | $ | 21,338 |
| |
| | | | | | | | |
During the year ended December 31, 2013, no customer accounted for more than 10% of our aggregated revenue, from continuing and discontinued operations. During the year ended December 31, 2012, Sprint and AT&T each accounted for more than 10% of our aggregated revenue, from continuing and discontinued operations, and on a combined basis, accounted for 25% of the aggregated revenue.
CONSOLIDATED ANNUAL RESULTS OF OPERATIONS
|
| | | | | | | | | | | | | | | | | | | |
| (in thousands of U.S. dollars, except where otherwise stated) | |
| | | 2013 | | 2012 | | 2011 | |
| | | $ | | % of Revenue | | $ | | % of Revenue | | $ | | % of Revenue | |
| Revenue | | 441,860 |
| | 100.0 | % | | 397,321 |
| | 100.0 | % | | 333,175 |
| | 100.0 | % | |
| Cost of goods sold | | 296,219 |
| | 67.0 | % | | 272,047 |
| | 68.5 | % | | 231,435 |
| | 69.5 | % | |
| Gross margin | | 145,641 |
| | 33.0 | % | | 125,274 |
| | 31.5 | % | | 101,740 |
| | 30.5 | % | |
| Expenses | | |
| | |
| | |
| | |
| | |
| | |
| |
| Sales and marketing | | 42,182 |
| | 9.6 | % | | 37,067 |
| | 9.3 | % | | 37,188 |
| | 11.2 | % | |
| Research and development | | 73,112 |
| | 16.5 | % | | 61,785 |
| | 15.6 | % | | 60,903 |
| | 18.3 | % | |
| Administration | | 35,164 |
| | 8.0 | % | | 32,777 |
| | 8.2 | % | | 33,716 |
| | 10.1 | % | |
| Restructuring | | 171 |
| | — | % | | 2,251 |
| | 0.6 | % | | 837 |
| | 0.2 | % | |
| Integration | | 27 |
| | — | % | | — |
| | — | % | | 1,426 |
| | 0.4 | % | |
| Acquisition | | 508 |
| | 0.1 | % | | 3,182 |
| | 0.8 | % | | — |
| | — | % | |
| Impairment of intangible assets | | — |
| | — | % | | — |
| | — | % | | 11,214 |
| | 3.4 | % | |
| Amortization | | 12,141 |
| | 2.8 | % | | 10,418 |
| | 2.6 | % | | 10,709 |
| | 3.2 | % | |
| | | 163,305 |
| | 37.0 | % | | 147,480 |
| | 37.1 | % | | 155,993 |
| | 46.8 | % | |
| Loss from operations | | (17,664 | ) | | (4.0 | )% | | (22,206 | ) | | (5.6 | )% | | (54,253 | ) | | (16.3 | )% | |
| Foreign exchange gain (loss) | | 3,823 |
| | | | 3,326 |
| | | | (460 | ) | | |
| |
| Other income (expense) | | (98 | ) | | | | (196 | ) | | | | 35 |
| | |
| |
| Loss before income taxes | | (13,939 | ) | | | | (19,076 | ) | | | | (54,678 | ) | | |
| |
| Income tax expense (recovery) | | 1,611 |
| | | | (14,874 | ) | | | | (3,968 | ) | | |
| |
| Net loss from continuing operations | | (15,550 | ) | | | | (4,202 | ) | | | | (50,710 | ) | | |
| |
| Net earnings from discontinued operations | | 70,588 |
| | | | 31,401 |
| | | | 21,338 |
| | |
| |
| Net earnings (loss) | | 55,038 |
| | | | 27,199 |
| | | | (29,372 | ) | | |
| |
| Less: non-controlling interest | | — |
| | | | — |
| | | | (57 | ) | | |
| |
| Net earnings (loss) attributable to the Company | | 55,038 |
| | | | 27,199 |
| | | | (29,315 | ) | | |
| |
| | | | | | | | | | | | | | |
| Net earnings (loss) per share attributable to the Company - Basic and diluted (in dollars) | | | | | | | | | | | | |
| |
| Continuing operations | | (0.50 | ) | | | | (0.14 | ) | | | | (1.62 | ) | | | |
| Discontinued operations | | 2.29 |
| | | | 1.02 |
| | | | 0.68 |
| | | |
| | | 1.79 |
| | | | 0.88 |
| | | | (0.94 | ) | | | |
| | | | | | | | | | | | | | |
Year Ended December 31, 2013 Compared to Year Ended December 31, 2012
Revenue
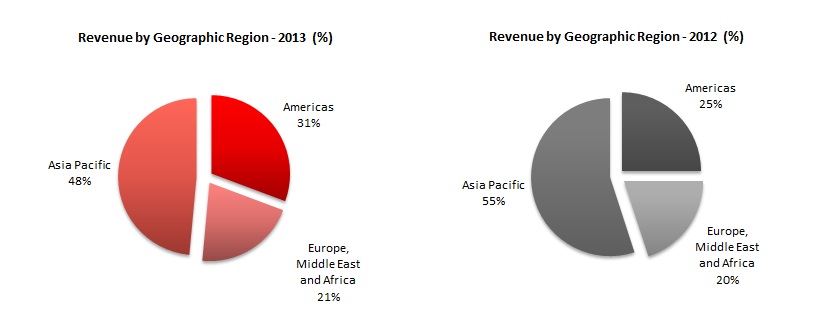
Revenue for the year ended December 31, 2013 increased by $44.6 million or 11.2% to $441.9 million, compared to the prior year. The year-over-year revenue increase was driven by continued growth in both our Enterprise Solutions and OEM Solutions segments, including a full year contribution from the M2M business of Sagemcom acquired in August 2012.
Our geographic revenue mix for the years ended December 31, 2013 and 2012 was as follows:
Gross margin
Gross margin was 33.0% of revenue for the year ended December 31, 2013, compared to gross margin of 31.5% of revenue in 2012. The increase in gross margin was primarily related to favorable product mix and product cost reductions. Gross margin included $0.4 million of stock-based compensation expense in 2013, compared to $0.3 million in 2012.
Sales and marketing
Sales and marketing expenses increased $5.1 million, or 13.8%, to $42.2 million in 2013, compared to 2012. The increase in sales and marketing expenses was primarily due to additional costs following the acquisition of the M2M business of Sagemcom ("Sagemcom") in August 2012, as well as investment in additional resources to support our go to market strategy. Sales and marketing expenses included $1.9 million of stock-based compensation expense in 2013, compared to $1.2 million in 2012.
Research and development
Research and development (“R&D”) expenses increased by $11.3 million, or 18.3%, to $73.1 million in 2013, compared to 2012. The increase in R&D expenses was primarily related to the additional R&D expenses we incurred following the Sagemcom acquisition, as well as higher certification costs on new products launched during the year and other net product development costs.
R&D expenses in 2013 included stock-based compensation expense of $1.4 million and acquisition amortization of $5.5 million. R&D expenses in 2012 included stock-based compensation expense of $1.3 million and acquisition amortization of $5.6 million.
Administration
Administration expenses increased by $2.4 million, or 7.3%, to $35.2 million in 2013, compared to 2012 due to higher professional fees, bad debt expense and other personnel related costs. Administration expenses included stock-based compensation expense of $4.3 million and $3.0 million in 2013 and 2012, respectively.
Acquisition
Acquisition costs of $0.5 million in 2013 related to the acquisition of the M2M business of AnyDATA and In Motion. Acquisition costs of $3.2 million in 2012 related to the Sagemcom acquisition.
Restructuring
Restructuring costs were $0.2 million in 2013, compared to $2.3 million in 2012. Restructuring costs in 2013 and 2012 related primarily to the closure of our Newark, California facility, effective December 31, 2012.
Amortization
Amortization expense increased by $1.7 million, or 16.5%, to $12.1 million in 2013, primarily due to the Sagemcom acquisition. Amortization expense in 2013 included $8.2 million of acquisition amortization compared to $6.3 million in 2012.
Foreign exchange gain (loss)
Foreign exchange gain was $3.8 million in 2013 compared to a gain of $3.3 million in 2012. Foreign exchange gain in 2013 and 2012 included a net foreign exchange gain of $2.7 million on revaluation of an intercompany loan to a self-sustaining subsidiary. Foreign exchange gain in 2012 was partially offset by a loss of $1.8 million related to the settlement of foreign currency forward exchange contracts that we entered in connection with the acquisition of the M2M business of Sagemcom in 2012.
Foreign exchange rate changes also impacted our Euro and Canadian dollar denominated revenue and operating expenses. We estimate that net changes in exchange rates between 2013 and 2012 positively impacted our 2013 revenues by approximately $1.0 million. We estimate that the negative impact on operating expenses during 2013 was approximately $0.5 million.
Income tax expense (recovery)
Income tax expense increased by $16.5 million to $1.6 million, compared to 2012. This was driven by recognition of certain tax assets in 2012 that were realizable upon the sale of the AirCard business, resulting in a substantial income tax recovery in 2012.
Net loss from continuing operations
Net loss from continuing operations increased by $11.3 million to a net loss of $15.6 million, compared to 2012. Improved operating earnings, driven by higher revenues and gross margin were more than offset by the absence of significant tax recoveries in 2013 compared to 2012, associated with the sale of the AirCard business.
Net loss from continuing operations in 2013 included stock-based compensation expense of $8.0 million and acquisition amortization of $13.7 million. Net loss from continuing operations in 2012 included stock-based compensation expense of $5.8 million and acquisition amortization of $11.9 million.
Net earnings (loss) attributable to the Company
Net earnings attributable to the Company increased by $27.8 million to $55.0 million, compared to 2012. The after-tax gain of $70.2 million on the sale of our AirCard business was partially offset by higher net loss from continuing operations.
Weighted average number of shares
The weighted average basic and diluted number of shares outstanding was 30.8 million for the years ended December 31, 2013 and 2012.
The number of shares outstanding was 31.1 million at December 31, 2013, compared to 30.6 million at December 31, 2012. The increase in number of shares outstanding was primarily due to issuance of common shares as a result of stock option exercises partially offset by purchases of 510,439 of the Company’s common shares on the Toronto Stock Exchange (“TSX”) and NASDAQ under our normal course issuer bid approved February 6, 2013.
Year Ended December 31, 2012 Compared to Year Ended December 31, 2011
Revenue
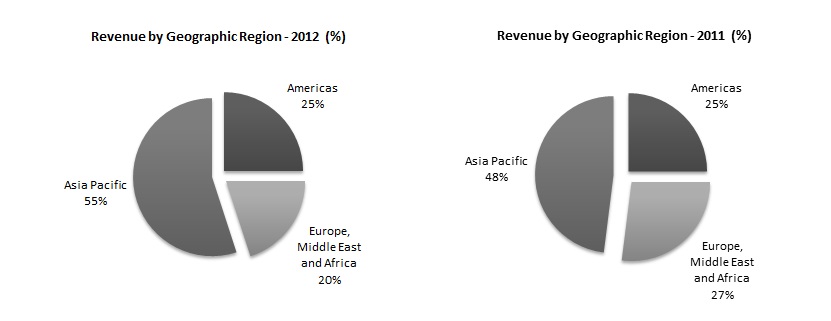
In 2012, revenue increased by $64.1 million, or 19.3% to $397.3 million, compared to 2011, driven primarily by significant growth in our OEM Solutions segment, including a contribution from the acquired M2M business of Sagemcom.
Our geographic revenue mix for the years ended December 31, 2012 and 2011 was as follows:
Gross margin
Gross margin was 31.5% of revenue for the year ended December 31, 2012, compared to 30.5% of revenue in 2011. The increase in gross margin was primarily related to product cost reductions and favorable product mix. Gross margin included $0.3 million of stock-based compensation expense in 2012, compared to $0.4 million in 2011.
Sales and marketing
Sales and marketing expenses decreased by $0.1 million, or 0.3%, to $37.1 million in 2012, compared to 2011. Sales and marketing expenses included $1.2 million of stock-based compensation expense in 2012, compared to $1.1 million in 2011.
Research and development
R&D expenses increased by $0.9 million, or 1.4%, to $61.8 million in 2012, compared to 2011. The increase in R&D expenses was primarily related to the additional R&D expenses we incurred as a result of the Sagemcom acquisition, partially offset by the positive impact of foreign exchange rates.
R&D expenses for 2012 included stock-based compensation expense of $1.3 million and acquisition amortization of $5.6 million. R&D expenses in 2011 included stock-based compensation expense of $1.1 million and acquisition amortization of $6.9 million.
Administration
Administration expenses decreased by $0.9 million, or 2.8%, to $32.8 million in 2012, compared to 2011. Administration expenses included stock-based compensation expense of $3.0 million and $2.9 million in 2012 and 2011, respectively.
Acquisition
Acquisition costs were $3.2 million during 2012 and $nil in 2011. Acquisition costs in 2012 were related to the acquisition of the M2M business of Sagemcom.
Restructuring
Restructuring costs were $2.3 million in 2012 compared to $0.8 million in 2011. Restructuring costs in 2012 related primarily to the closure of our Newark, California facility. Restructuring costs in 2011 represented costs incurred for reductions related to the new organizational structure announced in September 2010.
Integration costs
Integration costs were $nil during 2012, compared to $1.4 million in 2011. Integration costs in 2011 were primarily related to office space optimization in France.
Impairment of intangible asset
Impairment of intangible asset was $nil during 2012 compared to $11.2 million in 2011. The impairment charge in 2011 primarily related to a software development program we acquired through the acquisition of Wavecom, SA ("Wavecom"), which we abandoned in 2011.
Amortization
Amortization expense decreased by $0.3 million, or 2.7%, to $10.4 million in 2012 compared to 2011. Amortization expense in 2012 included $6.3 million of acquisition amortization compared to $6.0 million in 2011.
Foreign exchange gain (loss)
Foreign exchange gain was $3.3 million in 2012 compared to foreign exchange loss of $0.5 million in 2011. Foreign exchange gain in 2012 included a net foreign exchange gain of $2.7 million on revaluation of an intercompany loan to a self-sustaining subsidiary and a loss of $1.8 million related to the settlement of foreign currency forward exchange contracts that we had entered into in connection with the acquisition of the M2M business of Sagemcom.
Foreign exchange rate changes also impacted our Euro and Canadian dollar denominated revenue and operating expenses. We estimate that changes in exchange rates between 2011 and 2012 negatively impacted our 2012 revenues by approximately $2.4 million. We estimate that the favorable impact on operating expenses during 2012 was approximately $3.6 million.
Income tax recovery
Income tax recovery increased by $10.9 million in 2012 to $14.9 million compared to 2011, primarily driven by the recognition of certain tax assets that will be realizable as a result of the sale of the AirCard business.
Net loss from continuing operations
In 2012, net loss from continuing operations was $4.2 million, an improvement of $46.5 million, compared to 2011. This improvement reflects the positive impact of higher revenue and gross margin, combined with lower operating expenditures, as well as the impact of favorable foreign exchange and tax recoveries in 2012.
Net loss from continuing operations in 2012 included stock-based compensation expense of $5.8 million and acquisition amortization of $11.9 million. Net loss from continuing operations in 2011 included stock-based compensation expense of $5.5 million, acquisition amortization of $12.9 million, and an after-tax impairment charge of $11.2 million.
Net earnings (loss) attributable to the Company
Net earnings attributable to the Company increased by $56.5 million to net earnings of $27.2 million in 2012, compared to 2011. This increase reflects the increase in net earnings from continuing operations, combined with a $10.1 million increase in net earnings from discontinued operations.
Weighted average number of shares
The weighted average basic and diluted number of shares outstanding was 30.8 million for the year ended December 31, 2012, compared to 31.3 million for the year ended December 31, 2011.
The number of shares outstanding was 30.6 million at December 31, 2012, compared to 31.3 million at December 31, 2011. The reduction in number of shares outstanding was primarily due to purchases of 800,000 of the Company's common shares on the TSX and NASDAQ under our normal course issuer bid approved December 13, 2011.
SEGMENTED INFORMATION
Revenue and gross margin by segment for the years ending December 31 were as follows:
|
| | | | | | | | | | | | | |
| (in thousands of U.S. dollars) | | | | | | | |
| | | 2013 | | 2012 | | 2011 | |
| OEM Solutions | | |
| | |
| | |
| |
| Revenue | | $ | 382,016 |
| | $ | 346,543 |
| | $ | 290,463 |
| |
| Cost of goods sold | | 266,867 |
| | 246,284 |
| | 210,138 |
| |
| Gross margin | | $ | 115,149 |
| | $ | 100,259 |
| | $ | 80,325 |
| |
| Gross margin % | | 30.1 | % | | 28.9 | % | | 27.7 | % | |
| | | | | | | | |
| Enterprise Solutions | | |
| | |
| | |
| |
| Revenue | | $ | 59,844 |
| | $ | 50,778 |
| | $ | 42,712 |
| |
| Cost of goods sold | | 29,352 |
| | 25,763 |
| | 21,297 |
| |
| Gross margin | | $ | 30,492 |
| | $ | 25,015 |
| | $ | 21,415 |
| |
| Gross margin % | | 51.0 | % | | 49.3 | % | | 50.1 | % | |
| | | | | | | | |
Our OEM Solutions revenue increased by $35.5 million, or 10.2%, to $382.0 million in 2013 compared to 2012. This increase was primarily due to a full year contribution from the M2M business of Sagemcom acquired on August 1, 2012, along with strong organic sales in certain market segments. Gross margin percentage improved in 2013 as a result of product cost reductions and the addition of higher margin GSMR products acquired from Sagemcom, partially offset by greater mix of other lower margin embedded modules.
Our Enterprise Solutions revenue increased by $9.1 million, or 17.9%, to $59.9 million in 2013 compared to 2012. The increase was largely driven by strong sales growth of our new 4G products. Gross margin percentage improved in 2013, driven primarily by strong growth in new higher margin 3G and 4G products, as well as product cost reductions.
FOURTH QUARTER OVERVIEW
In the fourth quarter of 2013 our revenue increased sequentially primarily driven by higher sales to certain market segments. Gross margin percentage was slightly lower than the third quarter of 2013 due to changes in product mix and stronger revenue contribution from higher volume customers. Operating expenses increased modestly compared to the third quarter of 2013, reflecting the addition of AnyDATA and targeted investments in sales and marketing, as well as R&D.
Financial highlights for the fourth quarter of 2013:
GAAP:
| |
| • | Record revenue of $118.6 million from our continuing business, up 5.7%, compared to $112.3 million in the third quarter of 2013. |
| |
| • | Gross margin of 32.4%, compared to 33.3% in the third quarter of 2013. |
| |
| • | Operating loss from continuing operations of $3.5 million, in line with the third quarter of 2013. |
| |
| • | Net loss from continuing operations of $1.9 million or $0.06 per diluted share, compared to net earnings from continuing operations of $1.1 million or $0.03 per diluted share in the third quarter of 2013. |
NON-GAAP:
| |
| • | Gross margin of 32.5%, compared to 33.4% in the third quarter of 2013. |
| |
| • | Operating earnings from continuing operations of $2.6 million, compared to $2.4 million in the third quarter of 2013. |
| |
| • | Adjusted EBITDA of $6.2 million, compared to $5.9 million in the third quarter of 2013. |
| |
| • | Net earnings from continuing operations of $3.1 million or $0.10 per diluted share, in line with the third quarter of 2013. |
CONSOLIDATED FOURTH QUARTER RESULTS OF OPERATIONS
|
| | | | | | | | | | | | | |
| (in thousands of U.S. dollars, except where otherwise stated) | | | | | | | |
| | | Three months ended December 31, | |
| | | 2013 | | 2012 | |
| | | | | % of | | | | % of | |
| | | $ | | Revenue | | $ | | Revenue | |
| Revenue | | 118,608 |
| | 100.0 | % | | 109,405 |
| | 100.0 | % | |
| Cost of goods sold | | 80,165 |
| | 67.6 | % | | 73,172 |
| | 66.9 | % | |
| Gross margin | | 38,443 |
| | 32.4 | % | | 36,233 |
| | 33.1 | % | |
| Expenses | | |
| | |
| | |
| | |
| |
| Sales and marketing | | 10,693 |
| | 9.0 | % | | 10,176 |
| | 9.3 | % | |
| Research and development | | 19,074 |
| | 16.1 | % | | 16,294 |
| | 14.9 | % | |
| Administration | | 8,841 |
| | 7.5 | % | | 7,743 |
| | 7.1 | % | |
| Restructuring | | 14 |
| | — | % | | 42 |
| | — | % | |
| Integration | | — |
| | — | % | | — |
| | — | % | |
| Acquisition | | 369 |
| | 0.3 | % | | 387 |
| | 0.4 | % | |
| Amortization | | 2,999 |
| | 2.5 | % | | 3,107 |
| | 2.8 | % | |
| | | 41,990 |
| | 35.4 | % | | 37,749 |
| | 34.5 | % | |
| Loss from operations | | (3,547 | ) | | (3.0 | )% | | (1,516 | ) | | (1.4 | )% | |
| Foreign exchange gain | | 1,921 |
| | | | 1,608 |
| | |
| |
| Other income | | 26 |
| | | | 35 |
| | |
| |
| Earnings (loss) before income taxes | | (1,600 | ) | | | | 127 |
| | |
| |
| Income tax expense (recovery) | | 345 |
| | | | (15,396 | ) | | |
| |
| Net earnings (loss) from continuing operations | | (1,945 | ) | | | | 15,523 |
| | |
| |
| Net earnings from discontinued operations | | 1,078 |
| | | | 4,083 |
| | |
| |
| Net earnings (loss) | | (867 | ) | | | | 19,606 |
| | |
| |
| Net earnings (loss) per share - Basic and diluted (in dollars) | | | | |
| | | | |
| |
| Continuing operations | | (0.06 | ) | | | | 0.50 |
| | | |
| Discontinued operations | | 0.03 |
| | |
| | 0.14 |
| | |
| |
| | | (0.03 | ) | | |
| | 0.64 |
| | |
| |
| | | | | | | | | | |
SUMMARY OF QUARTERLY RESULTS OF OPERATIONS
The following tables highlight selected financial information for each of the eight most recent quarters that, in management’s opinion, have been prepared on a basis consistent with the audited consolidated financial statements for the year ended December 31, 2013. The selected financial information presented below reflects all adjustments, consisting primarily of normal recurring adjustments, which are, in the opinion of management, necessary for a fair presentation of results for the interim periods. These results are not necessarily indicative of results for any future period. You should not rely on these results to predict future performance.
|
| | | | | | | | | | | | | | | | | | | | | | | | | | | | | | | | |
| (in thousands of U.S. dollars, except where otherwise stated) |
| | | 2013 | | 2012 |
| | | Q4 | | Q3 | | Q2 | | Q1 | | Q4 | | Q3 | | Q2 | | Q1 |
| Revenue | | $ | 118,608 |
| | $ | 112,262 |
| | $ | 109,589 |
| | $ | 101,401 |
| | $ | 109,405 |
| | $ | 100,183 |
| | $ | 95,398 |
| | $ | 92,335 |
|
| Cost of goods sold | | 80,165 |
| | 74,916 |
| | 73,115 |
| | 68,023 |
| | 73,172 |
| | 69,097 |
| | 65,317 |
| | 64,461 |
|
| Gross margin | | 38,443 |
| | 37,346 |
| | 36,474 |
| | 33,378 |
| | 36,233 |
| | 31,086 |
| | 30,081 |
| | 27,874 |
|
| Gross margin % | | 32.4 | % | | 33.3 | % | | 33.3 | % | | 32.9 | % | | 33.1 | % | | 31.0 | % | | 31.5 | % | | 30.2 | % |
| Expenses | | |
| | |
| | |
| | |
| | |
| | |
| | |
| | |
|
| Sales and marketing | | 10,693 |
| | 10,452 |
| | 10,681 |
| | 10,356 |
| | 10,176 |
| | 8,572 |
| | 8,998 |
| | 9,321 |
|
| Research and development | | 19,074 |
| | 17,806 |
| | 17,869 |
| | 18,363 |
| | 16,294 |
| | 15,886 |
| | 14,674 |
| | 14,931 |
|
| Administration | | 8,841 |
| | 9,297 |
| | 8,903 |
| | 8,123 |
| | 7,743 |
| | 8,013 |
| | 8,562 |
| | 8,459 |
|
| Restructuring costs | | 14 |
| | 14 |
| | 26 |
| | 117 |
| | 42 |
| | 498 |
| | 1,531 |
| | 180 |
|
| Integration costs | | — |
| | — |
| | — |
| | 27 |
| | — |
| | — |
| | — |
| | — |
|
| Acquisition costs | | 369 |
| | 139 |
| | — |
| | — |
| | 387 |
| | 2,196 |
| | 599 |
| | — |
|
| Amortization | | 2,999 |
| | 2,939 |
| | 2,927 |
| | 3,276 |
| | 3,107 |
| | 2,649 |
| | 2,275 |
| | 2,387 |
|
| | | 41,990 |
| | 40,647 |
| | 40,406 |
| | 40,262 |
| | 37,749 |
| | 37,814 |
| | 36,639 |
| | 35,278 |
|
| Operating income (loss) from continuing operations | | (3,547 | ) | | (3,301 | ) | | (3,932 | ) | | (6,884 | ) | | (1,516 | ) | | (6,728 | ) | | (6,558 | ) | | (7,404 | ) |
| Foreign exchange gain (loss) | | 1,921 |
| | 2,563 |
| | 1,709 |
| | (2,370 | ) | | 1,608 |
| | 1,176 |
| | 336 |
| | 206 |
|
| Other income (expense) | | 26 |
| | (26 | ) | | 34 |
| | (132 | ) | | 35 |
| | (70 | ) | | 10 |
| | (171 | ) |
| Earnings (loss) from continuing operations before income tax | | (1,600 | ) | | (764 | ) | | (2,189 | ) | | (9,386 | ) | | 127 |
| | (5,622 | ) | | (6,212 | ) | | (7,369 | ) |
| Income tax expense (recovery) | | 345 |
| | (1,839 | ) | | 4,553 |
| | (1,448 | ) | | (15,396 | ) | | (2,010 | ) | | 2,656 |
| | (124 | ) |
| Net earnings (loss) from continuing operations | | (1,945 | ) | | 1,075 |
| | (6,742 | ) | | (7,938 | ) | | 15,523 |
| | (3,612 | ) | | (8,868 | ) | | (7,245 | ) |
| Net earnings (loss) from discontinued operations | | 1,078 |
| | (505 | ) | | 68,152 |
| | 1,863 |
| | 4,083 |
| | 7,279 |
| | 12,449 |
| | 7,590 |
|
| Net earnings (loss) attributable to the Company | | $ | (867 | ) | | $ | 570 |
| | $ | 61,410 |
| | $ | (6,075 | ) | | $ | 19,606 |
| | $ | 3,667 |
| | $ | 3,581 |
| | $ | 345 |
|
| Earnings (loss) per share - GAAP in dollars | | |
| | |
| | |
| | |
| | |
| | |
| | |
| | |
|
| Basic | | $ | (0.03 | ) | | $ | 0.02 |
| | $ | 2.00 |
| | $ | (0.20 | ) | | $ | 0.64 |
| | $ | 0.12 |
| | $ | 0.12 |
| | $ | 0.01 |
|
| Diluted | | $ | (0.03 | ) | | $ | 0.02 |
| | $ | 2.00 |
| | $ | (0.20 | ) | | $ | 0.64 |
| | $ | 0.12 |
| | $ | 0.12 |
| | $ | 0.01 |
|
| Weighted average number of shares (in thousands) | | |
| | |
| | |
| | |
| | |
| | |
| | |
| | |
|
| Basic | | 30,804 |
| | 30,688 |
| | 30,768 |
| | 30,695 |
| | 30,591 |
| | 30,573 |
| | 30,817 |
| | 31,175 |
|
| Diluted | | 30,804 |
| | 31,176 |
| | 30,768 |
| | 30,695 |
| | 30,774 |
| | 30,573 |
| | 30,817 |
| | 31,175 |
|
| | | | | | | | | | | | | | | | | |
Our quarterly results may fluctuate from quarter-to-quarter, driven by variation in sales volume, product mix and the combination of variable and fixed operating expenses. The impact of significant items incurred during the first three interim periods of year ended December 31, 2013 are discussed in more detail and disclosed in our quarterly reports and management’s discussion and analysis. Factors affecting our quarterly results in 2013 were as follows:
In the first quarter of 2013, net earnings from continuing operations decreased $23.5 million, or $0.76 per common share to a loss of $7.9 million, compared to the fourth quarter of 2012. The decrease was largely related to lower sequential revenue following an exceptionally strong fourth quarter of 2012, higher operating expenses as a result of higher new product certification costs and the absence of a large tax recovery related to the
disposition of the AirCard business that was recorded in the fourth quarter of 2012. Net earnings from discontinued operations were $2.2 million lower than the prior quarter.
In the second quarter of 2013, net earnings from continuing operations improved by $1.2 million, or $0.04 per common share to a loss of $6.7 million, compared to the first quarter of 2013 driven by sequential revenue growth and gross margin improvement. Net earnings from discontinued operations were $66.3 million higher than the prior quarter due to the after-tax gain recorded on the sale of the AirCard business.
In the third quarter of 2013, net earnings from continuing operations improved by $7.8 million, or $0.25 per common share to $1.1 million, compared to the second quarter of 2013, driven by a combination of higher revenue and a year-to-date income tax recovery. A portion of the recovery, amounting to $0.5 million, related to the first half of the year. Net earnings from discontinued operations decreased by $68.7 million from the prior quarter, reflecting the absence of the after-tax gain on the sale of the AirCard business recorded in the second quarter of 2013.
In the fourth quarter of 2013, net earnings from continuing operations decreased by $3.0 million, or $0.10 per common share to a loss of $1.9 million, compared to the third quarter of 2013, primarily due to the absence of the year-to-date income tax recovery recorded in the prior quarter and a lower foreign exchange gain. The impact of higher revenues in the fourth quarter was offset by slightly lower percentage gross margin and modestly higher operating expenses.
LIQUIDITY AND CAPITAL RESOURCES
Selected Financial Information:
|
| | | | | | | | | | | | |
| (in thousands of U.S. dollars) | | | | | | |
| | | 2013 | | 2012 | | 2011 |
| Cash flows provided before changes in non-cash working capital: | | $ | 14,307 |
| | $ | 46,656 |
| | $ | 17,814 |
|
| Changes in non-cash working capital | | |
| | |
| | |
|
| Accounts receivable | | 10,897 |
| | (616 | ) | | 9,067 |
|
| Inventories | | 11,908 |
| | (4,019 | ) | | 5,664 |
|
| Prepaid expense and other | | (7,254 | ) | | (14,543 | ) | | 4,248 |
|
| Accounts payable and accrued liabilities | | (13,139 | ) | | 10,997 |
| | (13,783 | ) |
| Deferred revenue and credits | | 1,147 |
| | (422 | ) | | 733 |
|
| | | 3,559 |
| | (8,603 | ) | | 5,929 |
|
| Cash flows provided by (used in): | | |
| | |
| | |
|
| Operating activities | | $ | 17,866 |
| | $ | 38,053 |
| | $ | 23,743 |
|
| | | | | | | |
| Investing activities | | $ | 98,754 |
| | $ | (64,184 | ) | | $ | (2,706 | ) |
| Net proceeds from sale of AirCard business | | 119,958 |
| | — |
| | — |
|
| Acquisition of M2M business of AnyDATA | | (5,196 | ) | | — |
| | — |
|
| Acquisition of M2M business of Sagemcom | | — |
| | (55,218 | ) | | — |
|
| Capital expenditures and increase in intangible assets | | (13,570 | ) | | (18,452 | ) | | (18,008 | ) |
| Net change in short-term investments | | (2,470 | ) | | 9,347 |
| | 17,058 |
|
| Purchase of Wavecom S.A. shares | | — |
| | — |
| | (1,787 | ) |
| | | | | | | |
| Financing activities | | $ | (1,975 | ) | | $ | (9,365 | ) | | $ | (4,858 | ) |
| Issue of common shares | | 8,106 |
| | 436 |
| | 519 |
|
| Repurchase of common shares for cancellation | | (5,772 | ) | | (6,312 | ) | | — |
|
| Purchase of treasury shares for RSU distribution | | (3,433 | ) | | (2,489 | ) | | (4,472 | ) |
| | | | | | | |
Operating Activities
Cash provided by operating activities decreased $20.2 million to $17.9 million during the year ended December 31, 2013, compared to the same period of 2012. The decrease in cash provided was due to lower earnings from our discontinued operations partially offset by lower working capital requirements.
Investing Activities
Cash provided by investing activities increased $162.9 million to $98.8 million during the year ended December 31, 2013, compared to the same period of 2012. The increase in cash provided by investing activities was mainly due to the sale of the AirCard business partially offset by the purchase of the M2M modules and modem business of AnyDATA, the impact of the acquisition of the M2M business of Sagemcom in the prior year, and net change in short-term investments.
Cash used for the purchase of capital equipment was primarily for production and tooling equipment, research and development equipment, and computer equipment and software, while cash used for intangible assets was driven primarily by patent registration costs and software licensing costs.
Financing Activities
Cash used for financing activities decreased $7.4 million to $2.0 million during the year ended December 31, 2013, compared to 2012. The decrease was primarily due to proceeds received on the issuance of common shares resulting from a higher number of stock option exercises.
In the year ended December 31, 2013, we purchased 510,439 common shares under our normal course issuer bid and purchased 270,265 of our common shares to satisfy obligations under our restricted share unit plan, in the amounts of $5.8 million and $3.4 million, respectively. In 2012, we purchased 800,000 common shares under our normal course issuer bid and purchased 336,638 of our common shares to satisfy obligations under our restricted share unit plan, in the amounts of $6.3 million and $2.5 million, respectively.
Cash Requirements
Our near-term cash requirements are primarily related to funding our operations, capital expenditures, intellectual property (“IP”) licenses, and other obligations discussed below. On October 16, 2013, we completed the acquisition of the M2M modules and modem business of AnyDATA, a transaction that was funded by $5.2 million in cash. We expect to utilize approximately $21 million plus ordinary course working capital, for the acquisition of In Motion. We continue to believe our cash, cash equivalents and short term investments balance of $179.9 million at December 31, 2013 and cash generated from continuing operations will be sufficient to fund our expected working capital requirements for at least the next twelve months based on current business plans. Our capital expenditures during the first quarter of 2014 are expected to be primarily for research and development equipment, tooling, leasehold improvements, software licenses and patents. However, we cannot be certain that our actual cash requirements will not be greater than we currently expect.
The following table presents the aggregate amount of future cash outflows for contractual obligations as of December 31, 2013.
|
| | | | | | | | | | | | | | | | | | | | | | | | |
| Payments due by period (In thousands of dollars) | | 2014 | | 2015 | | 2016 | | 2017 | | 2018 | | Thereafter |
| Operating lease obligations | | $ | 5,032 |
| | $ | 4,164 |
| | $ | 3,970 |
| | $ | 3,782 |
| | $ | 3,672 |
| | $ | 7,298 |
|
| Capital lease obligations | | 381 |
| | 240 |
| | 83 |
| | 12 |
| | — |
| | — |
|
Purchase obligations (1) | | 77,708 |
| | — |
| | — |
| | — |
| | — |
| | — |
|
Other long-term liabilities (2) | | — |
| | 19,073 |
| | — |
| | — |
| | — |
| | 1,896 |
|
| Total | | $ | 83,121 |
| | 23,477 |
| | $ | 4,053 |
| | $ | 3,794 |
| | $ | 3,672 |
| | $ | 9,194 |
|
| | | | | | | | | | | | | |
(1) Purchase obligations represent obligations with certain contract manufacturers to buy minimum amount of designated products between January 2014 and March 2014. In certain of these arrangements, we may be required to acquire and pay for such products up to the prescribed minimum or forecasted purchases.
(2) Other long-term liabilities include the long-term portions of accrued royalties.
Capital Resources
|
| | | | | | | | | | | | | | | | | | | | | | | | | | | | | | | | |
| (In thousands of dollars) | | 2013 | | 2012 |
| | | Dec 31 | | Sept 30 | | June 30 | | Mar 31 | | Dec 31 | | Sept 30 | | June 30 | | Mar 31 |
| Cash and cash equivalents | | $ | 177,416 |
| | $ | 183,220 |
| | $ | 166,573 |
| | $ | 55,923 |
| | $ | 63,646 |
| | $ | 59,528 |
| | $ | 123,159 |
| | $ | 106,773 |
|
| Short-term investments | | 2,470 |
| | 5,221 |
| | 10,000 |
| | — |
| | — |
| | — |
| | 2,153 |
| | — |
|
| | | 179,886 |
| | 188,441 |
| | 176,573 |
| | 55,923 |
| | 63,646 |
| | 59,528 |
| | 125,312 |
| | 106,773 |
|
| Unused credit facilities | | 10,000 |
| | 10,000 |
| | 10,000 |
| | 50,000 |
| | 50,000 |
| | 10,000 |
| | 10,000 |
| | 10,000 |
|
| Total | | $ | 189,886 |
| | $ | 198,441 |
| | $ | 186,573 |
| | $ | 105,923 |
| | $ | 113,646 |
| | $ | 69,528 |
| | $ | 135,312 |
| | $ | 116,773 |
|
| | | | | | | | | | | | | | | | | |
Credit Facilities
On October 31, 2013, we renewed our $10 million revolving term credit facility ("Revolving Facility") for a two year term expiring on October 31, 2015. The Revolving Facility with Toronto Dominion Bank and the Canadian Imperial Bank of Commerce is for working capital requirements, is secured by a pledge against all of our assets and is subject to borrowing base limitations. Other terms of the Revolving Facility remain substantially unchanged. As at December 31, 2013, there were no borrowings under the Revolving Facility.
Letters of Credit
We have entered into a standby letter of credit facility agreement under which we have issued two performance bonds to third party customers in accordance with specified terms and conditions. At December 31, 2013, we had two Euro denominated performance bonds amounting to €50 thousand expiring in June 2014 (December 2012 - €50 thousand). The carrying value of these instruments approximates their fair market value.
Normal Course Issuer Bid
On February 6, 2013, we received approval from the TSX of our Notice of Intention to make a Normal Course Issuer Bid (the “2013 Bid”). Pursuant to the 2013 Bid, we can purchase for cancellation up to 1,529,687 of our common shares, or approximately 5% of the common shares outstanding as of the date of the announcement. The 2013 Bid commenced on February 14, 2013 and terminated on February 13, 2014. During 2013, we purchased and canceled 510,439 common shares for an average price of $11.31 per share.
NON-GAAP FINANCIAL MEASURES
Our consolidated financial statements are prepared in accordance with U.S. GAAP on a basis consistent for all periods presented. In addition to results reported in accordance with U.S. GAAP, we use non-GAAP financial measures as supplemental indicators of our operating performance. The term “non-GAAP financial measure” is used to refer to a numerical measure of a company’s historical or future financial performance, financial position or cash flows that: (i) excludes amounts, or is subject to adjustments that have the effect of excluding amounts, that are included in the most directly comparable measure calculated and presented in accordance with U.S. GAAP in a company’s statement of earnings, balance sheet or statement of cash flows; or (ii) includes amounts, or is subject to adjustments that have the effect of including amounts, that are excluded from the most directly comparable measure so calculated and presented.
Our non-GAAP financial measures include non-GAAP gross margin, non-GAAP earnings (loss) from operations, Adjusted EBITDA (earnings before interest, taxes, depreciation and amortization) and non-GAAP diluted earnings (loss) per share, respectively. We disclose non-GAAP amounts as we believe that these measures provide useful information on actual operating results and assist in comparisons from one period to another. Readers are cautioned that non-GAAP financial measures do not have any standardized meaning prescribed by U.S. GAAP and therefore may not be comparable to similar measures presented by other companies. Non-GAAP results exclude the impact of stock-based compensation expense, amortization related to acquisitions, acquisition and disposition costs, restructuring costs, integration costs, impairment, foreign exchange gains or losses on foreign currency contracts and translation of balance sheet accounts and certain tax adjustments.
Adjusted EBITDA as defined equates earnings (loss) from operations plus stock-based compensation, acquisition, restructuring, integration, transaction costs, amortization and impairment. Adjusted EBITDA can also be calculated as non-GAAP earnings (loss) from operations plus amortization excluding acquisition related amortization.
The following table provides a reconciliation of the non-GAAP financial measures to our U.S. GAAP results for years ended December 31:
|
| | | | | | | | | | | | |
| (in thousands of U.S. dollars, except where otherwise stated) | | | | | | |
| | | 2013 | | 2012 | | 2011 |
| | | | | | | |
| Gross margin - GAAP | | $ | 145,641 |
| | $ | 125,274 |
| | $ | 101,740 |
|
| Stock-based compensation | | 406 |
| | 304 |
| | 385 |
|
| Gross margin - Non-GAAP | | $ | 146,047 |
| | $ | 125,578 |
| | $ | 102,125 |
|
| | | | | | | |
| Loss from operations - GAAP | | $ | (17,664 | ) | | $ | (22,206 | ) | | $ | (54,253 | ) |
| Stock-based compensation | | 7,990 |
| | 5,781 |
| | 5,498 |
|
| Acquisition | | 508 |
| | 3,182 |
| | — |
|
| Restructuring | | 171 |
| | 2,251 |
| | 837 |
|
| Integration | | 27 |
| | — |
| | 1,426 |
|
| Impairment of intangible asset | | 280 |
| | — |
| | 11,214 |
|
| Acquisition related amortization | | 13,741 |
| | 11,890 |
| | 12,888 |
|
| Earnings (loss) from operations - Non-GAAP | | $ | 5,053 |
| | $ | 898 |
| | $ | (22,390 | ) |
| Amortization (excluding acquisition related amortization) | | 13,649 |
| | 11,747 |
| | 12,761 |
|
| Adjusted EBITDA | | $ | 18,702 |
| | $ | 12,645 |
| | $ | (9,629 | ) |
| | | | | | | |
| Net loss from continuing operations attributable to the Company - GAAP | | $ | (15,550 | ) | | $ | (4,202 | ) | | $ | (50,653 | ) |
| Stock-based compensation, restructuring and other, integration, and acquisition related amortization, net of tax | | 22,620 |
| | 22,241 |
| | 31,762 |
|
| Unrealized foreign exchange loss (gain) | | (3,912 | ) | | (3,139 | ) | | 267 |
|
| Income tax adjustments | | 3,784 |
| | (15,344 | ) | | — |
|
| Non-controlling interest | | — |
| | — |
| | (32 | ) |
| Net earnings (loss) from continuing operations attributable to the Company - Non-GAAP | | $ | 6,942 |
| | $ | (444 | ) | | $ | (18,656 | ) |
| | | | | | | |
| Net earnings from discontinued operations - GAAP | | $ | 70,588 |
| | $ | 31,401 |
| | $ | 21,338 |
|
| Stock-based compensation and disposition costs | | 4,014 |
| | 2,395 |
| | 951 |
|
| Gain on sale of AirCard business | | (70,182 | ) | | — |
| | — |
|
| Net earnings from discontinued operations - Non-GAAP | | $ | 4,420 |
| | $ | 33,796 |
| | $ | 22,289 |
|
| | | | | | | |
| Net earnings (loss) - GAAP | | $ | 55,038 |
| | $ | 27,199 |
| | $ | (29,315 | ) |
| Net earnings (loss) - Non-GAAP | | 11,362 |
| | 33,352 |
| | 3,633 |
|
| | | | | | | |
| Diluted earnings (loss) from continuing operations per share | | |
| | |
| | |
|
| GAAP - (in dollars) | | $ | (0.50 | ) | | $ | (0.14 | ) | | $ | (1.62 | ) |
| Non-GAAP - (in dollars) | | $ | 0.23 |
| | $ | (0.01 | ) | | $ | (0.60 | ) |
| | | | | | | |
| Net earnings (loss) per share attributable to the Company - diluted | | |
| | |
| | |
|
| GAAP - (in dollars) | | $ | 1.79 |
| | $ | 0.88 |
| | $ | (0.94 | ) |
| Non-GAAP - (in dollars) | | $ | 0.37 |
| | $ | 1.08 |
| | $ | 0.12 |
|
| | | | | | | |
The following table provides a quarterly reconciliation of the non-GAAP financial measures to our U.S. GAAP results:
|
| | | | | | | | | | | | | | | | | | | | | | | | | | | | | | | | |
| (in thousands of U.S. dollars, except where otherwise stated) |
| | | 2013 | | 2012 |
| | | Q4 | | Q3 | | Q2 | | Q1 | | Q4 | | Q3 | | Q2 | | Q1 |
| | | | | | | | | | | | | | | | | |
| Gross margin - GAAP | | $ | 38,443 |
| | $ | 37,346 |
| | $ | 36,474 |
| | $ | 33,378 |
| | $ | 36,233 |
| | $ | 31,086 |
| | $ | 30,081 |
| | $ | 27,874 |
|
| Stock-based compensation | | 119 |
| | 117 |
| | 95 |
| | 75 |
| | 61 |
| | 82 |
| | 78 |
| | 83 |
|
| Gross margin - Non-GAAP | | $ | 38,562 |
| | $ | 37,463 |
| | $ | 36,569 |
| | $ | 33,453 |
| | $ | 36,294 |
| | $ | 31,168 |
| | $ | 30,159 |
| | $ | 27,957 |
|
| | | | | | | | | | | | | | | | | |
| Loss from operations - GAAP | | $ | (3,547 | ) | | $ | (3,301 | ) | | $ | (3,932 | ) | | $ | (6,884 | ) | | $ | (1,516 | ) | | $ | (6,728 | ) | | $ | (6,558 | ) | | $ | (7,404 | ) |
| Stock-based compensation | | 2,177 |
| | 2,145 |
| | 2,013 |
| | 1,655 |
| | 1,470 |
| | 1,462 |
| | 1,403 |
| | 1,446 |
|
| Acquisition | | 369 |
| | 139 |
| | — |
| | — |
| | 387 |
| | 2,196 |
| | 599 |
| | — |
|
| Restructuring | | 14 |
| | 14 |
| | 26 |
| | 117 |
| | 42 |
| | 498 |
| | 1,531 |
| | 180 |
|
| Integration | | — |
| | — |
| | — |
| | 27 |
| | — |
| | — |
| | — |
| | — |
|
| Impairment of intangible asset | | — |
| | — |
| | — |
| | 280 |
| | — |
| | — |
| | — |
| | — |
|
| Acquisition related amortization | | 3,580 |
| | 3,405 |
| | 3,363 |
| | 3,393 |
| | 3,338 |
| | 2,906 |
| | 2,665 |
| | 2,981 |
|
| Earnings (loss) from operations - Non-GAAP | | $ | 2,593 |
| | $ | 2,402 |
| | $ | 1,470 |
| | $ | (1,412 | ) | | $ | 3,721 |
| | $ | 334 |
| | $ | (360 | ) | | $ | (2,797 | ) |
| Amortization (excluding acquisition related amortization) | | 3,566 |
| | 3,468 |
| | 3,403 |
| | 3,212 |
| | 3,293 |
| | $ | 2,904 |
| | $ | 2,717 |
| | $ | 2,833 |
|
| Adjusted EBITDA | | $ | 6,159 |
| | $ | 5,870 |
| | $ | 4,873 |
| | $ | 1,800 |
| | $ | 7,014 |
| | $ | 3,238 |
| | $ | 2,357 |
| | $ | 36 |
|
| | | | | | | | | | | | | | | | | |
| Net earnings (loss) from continuing operations - GAAP | | $ | (1,945 | ) | | $ | 1,075 |
| | $ | (6,742 | ) | | $ | (7,938 | ) | | $ | 15,523 |
| | $ | (3,612 | ) | | $ | (8,868 | ) | | $ | (7,245 | ) |
| Stock-based compensation, restructuring and other, integration, and acquisition related amortization, net of tax | | 6,112 |
| | 5,760 |
| | 5,393 |
| | 5,355 |
| | 5,162 |
| | 6,885 |
| | 5,658 |
| | 4,536 |
|
| Unrealized foreign exchange loss (gain) | | (1,970 | ) | | (2,457 | ) | | (1,359 | ) | | 1,874 |
| | (1,655 | ) | | (1,218 | ) | | (165 | ) | | (101 | ) |
| Income tax adjustments | | 925 |
| | (895 | ) | | 3,754 |
| | — |
| | (14,540 | ) | | (804 | ) | | — |
| | — |
|
| Net earnings (loss) from continuing operations - Non-GAAP | | $ | 3,122 |
| | $ | 3,483 |
| | $ | 1,046 |
| | $ | (709 | ) | | $ | 4,490 |
| | $ | 1,251 |
| | $ | (3,375 | ) | | $ | (2,810 | ) |
| | | | | | | | | | | | | | | | | |
| Net earnings from discontinued operations - GAAP | | $ | 1,078 |
| | $ | (505 | ) | | $ | 68,152 |
| | $ | 1,863 |
| | $ | 4,083 |
| | $ | 7,279 |
| | $ | 12,449 |
| | $ | 7,590 |
|
| Stock-based compensation and disposition costs | | 3 |
| | 1,402 |
| | 876 |
| | 1,733 |
| | 1,696 |
| | 233 |
| | 233 |
| | 233 |
|
| Gain on sale of AirCard business | | (1,056 | ) | | (49 | ) | | (69,077 | ) | | — |
| | — |
| | — |
| | — |
| | — |
|
| Net earnings from discontinued operations - Non-GAAP | | $ | 25 |
| | $ | 848 |
| | $ | (49 | ) | | $ | 3,596 |
| | $ | 5,779 |
| | $ | 7,512 |
| | $ | 12,682 |
| | $ | 7,823 |
|
| | | | | | | | | | | | | | | | | |
| Net earnings (loss) - GAAP | | $ | (867 | ) | | $ | 570 |
| | $ | 61,410 |
| | $ | (6,075 | ) | | $ | 19,606 |
| | $ | 3,667 |
| | $ | 3,581 |
| | $ | 345 |
|
| Net earnings (loss) - Non-GAAP | | 3,147 |
| | 4,331 |
| | 997 |
| | 2,887 |
| | 10,269 |
| | 8,763 |
| | 9,307 |
| | 5,013 |
|
| | | | | | | | | | | | | | | | | |
| Diluted earnings (loss) from continuing operations per share | | |
| | |
| | |
| | |
| | |
| | |
| | |
| | |
|
| GAAP - (in dollars) | | $ | (0.06 | ) | | $ | 0.03 |
| | $ | (0.22 | ) | | $ | (0.26 | ) | | $ | 0.50 |
| | $ | (0.12 | ) | | $ | (0.29 | ) | | $ | (0.23 | ) |
| Non-GAAP - (in dollars) | | $ | 0.10 |
| | $ | 0.11 |
| | $ | 0.03 |
| | $ | (0.02 | ) | | $ | 0.15 |
| | $ | 0.04 |
| | $ | (0.11 | ) | | $ | (0.09 | ) |
| | | | | | | | | | | | | | | | | |
| Net earnings (loss) per share attributable to the Company - diluted | | |
| | |
| | |
| | |
| | |
| | |
| | |
| | |
|
| GAAP - (in dollars) | | $ | (0.03 | ) | | $ | 0.02 |
| | $ | 2.00 |
| | $ | (0.20 | ) | | 0.64 |
| | $ | 0.12 |
| | $ | 0.12 |
| | $ | 0.01 |
|
| Non-GAAP - (in dollars) | | $ | 0.10 |
| | $ | 0.14 |
| | $ | 0.03 |
| | $ | 0.09 |
| | 0.33 |
| | $ | 0.29 |
| | $ | 0.30 |
| | $ | 0.16 |
|
| | | | | | | | | | | | | | | | | |
OFF-BALANCE SHEET ARRANGEMENTS
We did not have any off-balance sheet arrangements during the years ended December 31, 2013 and 2012.
TRANSACTIONS BETWEEN RELATED PARTIES
We did not undertake any transactions with related parties during the year ended December 31, 2013 and 2012.
CRITICAL ACCOUNTING POLICIES AND ESTIMATES
We prepare our consolidated financial statements in accordance with U.S. GAAP and we make certain estimates and assumptions that affect the reported amounts of assets, liabilities, revenue, expenses and the related disclosure of contingent liabilities. Note 2, Summary of significant accounting policies, in the December 31, 2013 consolidated financial statements includes a summary of the significant accounting policies used in the preparation of our consolidated financial statements. While all of the significant accounting policies are important to the annual consolidated financial statements, some of these policies may be viewed as involving a high degree of judgment.
On an ongoing basis, we evaluate our estimates and judgments, including those related to business combinations, revenue recognition, adequacy of allowance for doubtful accounts, adequacy of inventory reserve, valuation of goodwill and intangible assets, income taxes, useful lives of assets, adequacy of warranty reserve, royalty obligations, contingencies, stock-based compensation, and fair value measurement. We base our estimates on historical experience, anticipated results and trends and on various other assumptions that we believe are reasonable under the circumstances. By their nature, estimates are subject to an inherent degree of uncertainty. Actual results could differ from our estimates.
The following critical accounting policies require management’s most difficult, subjective and complex judgments, and are subject to measurement uncertainty.
Business combinations
We account for our business combinations using the acquisition method. Under this method, estimates we make to determine the fair values of acquired assets and liabilities assumed include judgments in our determinations of acquired intangible assets and assessment of the fair value of existing property and equipment. Assumed liabilities can include litigation and other contingency reserves existing at the time of the acquisition. Goodwill is recognized as of the acquisition date as the excess of the purchase price over the estimated fair values of net identifiable assets acquired and liabilities assumed at their acquisition date. Acquisition related expenses are separately recognized from business combination and are expensed as incurred.
When establishing fair values, we make significant estimates and assumptions, especially with respect to intangible assets. Intangible assets acquired and recorded by us may include patents, intellectual property, customer relationships, backlog and in-process research and development. Estimates include but are not limited to the forecasting of future cash flows and discount rates. From time to time, we may engage third-party firms to assist us in determining the fair value of assets and liabilities assumed. Our estimates of fair values are based upon assumptions believed to be reasonable, but which are inherently uncertain and unpredictable. As a result, actual results may differ from estimates impacting our earnings.
Revenue recognition
We recognize revenue from sales of products and services upon the later of transfer of title or upon shipment of the product to the customer or rendering of the service, so long as persuasive evidence of an arrangement exists, delivery has occurred, price is fixed or determinable, and collection is reasonably assured. Customers include resellers, original equipment manufacturers and mobile network operators. We record deferred revenue when we
receive cash in advance of the revenue recognition criteria being met. A significant portion of our revenue is generated from sales to resellers. We recognize revenue on the portion of sales to certain resellers that are subject to contract provisions allowing various rights of return and stock rotation, upon the earlier of when the rights have expired or the products have been reported as sold by the resellers. Revenues from contracts with multiple-element arrangements, such as those including technical support services, are recognized as each element is earned based on the relative fair value of each element and only when there are no undelivered elements that are essential to the functionality of the delivered elements. Revenue from licensed software is recognized at the inception of the license term. Revenue from software maintenance, unspecified upgrades and technical support contracts is recognized over the period such items are delivered or services are provided. Technical support contracts extending beyond the current period are recorded as deferred revenue.
Funding from certain research and development agreements is recognized as revenue when certain criteria stipulated under the terms of those funding agreements have been met and when there is reasonable assurance the funding will be received. Certain research and development funding will be repayable only on the occurrence of specified future events. We recognize the liability to repay research and development funding in the period in which conditions arise that would cause research and development funding to be repayable. Government research and development arrangements are recognized as a reduction of the related expense when the criteria stipulated under the terms of the agreements have been met and when there is reasonable assurance the funding will be received.
Allowance for doubtful accounts
We maintain an allowance for doubtful accounts for estimated losses that may arise if any of our customers are unable to make required payments. We consider the following factors when determining whether collection is reasonably assured: customer credit-worthiness, past transaction history with the customer, insured amounts, if any, current economic industry trends and changes in customer payment terms. If we have no previous experience with the customer, we typically obtain reports from credit organizations to ensure that the customer has a history of paying its creditors. We may also request financial information, including financial statements, to ensure that the customer has the means of making payment. If these factors indicate collection is not reasonably assured, revenue is deferred until collection becomes reasonably assured, which is generally upon receipt of cash. If the financial condition of any of our customers deteriorates, we may increase our allowance.
As at December 31, 2013, Accounts receivable comprised 22.0% of total assets. Included in this balance was a provision of $2.3 million for doubtful accounts, or 2.0% of accounts receivable (as at December 31, 2012 - $2.4 million for doubtful accounts, or 2.2% of accounts receivable). We believe our allowance for doubtful accounts as at December 31, 2013 is adequate to provide for probable losses existing in accounts receivable.
Inventory
We value our inventory at the lower of cost, determined on a first-in-first-out basis, and estimated net realizable value. We assess the need for an inventory write-down and/or an accrual for estimated losses on inventory purchase commitments based on our assessment of estimated market value using assumptions about future demand and market conditions. Our reserve requirements generally increase as our projected demand requirements decrease, due to market conditions, technological and product life cycle changes and longer than previously expected usage periods. If market conditions are worse than our projections, we may further write-down the value of our inventory or increase the accrual for estimated losses on inventory purchase commitments.
Goodwill and intangible assets
Goodwill and intangible assets are assessed for impairment on an annual basis and between annual tests whenever circumstances indicate that the carrying value of the goodwill and intangible assets might be impaired. Circumstances may include an adverse change in business climate or a more likely than not expectation that a reporting unit will be sold or disposed. On at least a quarterly basis, we assess whether such circumstances exist.
An evaluation of recoverability of goodwill requires judgment, including the identification of reporting units, assigning assets and liabilities to reporting units, assigning goodwill to reporting units, and determining the estimated fair value of each reporting unit. Significant judgments that are required on our part to estimate the fair value of reporting units include estimating future cash flows, determining appropriate discount rates, consideration of appropriate control premium, market conditions, and other assumptions. Changes in these estimates and assumptions could materially affect the determination of fair value for each reporting unit and may result in impairment charges in future periods.
We implemented a new organization structure during the fourth quarter of 2010 and effective January 1, 2011 we had three reporting units for the purposes of goodwill determination, until we disposed of our AirCard business reporting unit in the second quarter of 2013. Effective December 31, 2013, we have two reporting units for the purpose of goodwill determination. As the fair value in each reporting unit exceeded the respective carrying amounts, the second step of the impairment test that measures the amount of an impairment loss by comparing the implied fair market value of the reporting unit with the carrying amount of the goodwill of the reporting unit was not required. No impairment of goodwill was recorded during the years ended December 31, 2013 and 2012.
At December 31, 2013, our goodwill balance was $102.7 million. We determined that there was no impairment as the fair values of each of our two reporting units exceeded their respective carrying values. Our analysis took into consideration an income valuation approach using the expected discounted cash flows for each reporting unit. The principal factors used in the discounted cash flow analysis were the projected results of operations, the discount rate based on our estimated weighted average cost of capital, and terminal value assumptions for each reporting unit. The discounted cash flow model used was based on our business plan, as approved by our Board of Directors. For years subsequent to those contained in our business plan, we analyzed third party forecasts and other macro-economic indicators that impact our reporting units to provide a reasonable estimate of revenue growth in future periods. Our gross margins and operating expense estimates were consistent with those generated in recent historical periods. We also developed assumptions for the amount of working capital and capital expenditures needed to support each reporting unit.
In addition to the income valuation approach noted above, we also considered the current market capitalization of the Company which was approximately $751.6 million at December 31, 2013 and exceeds the Company’s book value of $363.0 million.
Income taxes
We recognize and measure each tax position related to income tax positions taken or expected to be taken in a tax return. We have reviewed our tax positions to determine which should be recognized and measured according to the more likely than not threshold requirement. The tax benefits recognized in the financial statements are measured based on the largest benefit that has a greater than fifty percent likelihood of being realized upon ultimate resolution. If the realization of a tax position is not considered more likely than not, we provide for a valuation allowance. The ultimate realization of our deferred tax assets is dependent upon the generation of future taxable income during the periods in which temporary differences become deductible. We consider projected future taxable income from continuing operations, tax planning strategies, and transactions, including the pending disposition of the AirCard business, in making our assessment. If our assessment of our ability to realize our deferred tax assets changes, we may make an adjustment to our deferred tax assets that would be charged to income (loss).
We do not provide for taxes on foreign earnings as it is our intention to indefinitely reinvest undistributed earnings of our foreign subsidiaries. It is not practical to estimate the income tax liability that might be incurred if there is a change in management’s intention in the event that a remittance of such earnings occurs in the future.
The ultimate amount of future income taxes and income tax provision could be materially different from those recorded, as it is influenced by our future operating results and our tax interpretations.
Amortization
Amortization of property and equipment and intangible assets incorporates estimates of useful lives and residual values. These estimates may change as more experience is obtained or as general market conditions change impacting the operation of plant and equipment and intangible assets.
Warranty costs
We accrue product warranty costs in accrued liabilities to provide for the repair or replacement of defective products. Our accrual is based on an assessment of historical experience and management’s estimates. If there is a change in the quality of our products, we adjust our accrual accordingly.
Royalty obligations
Under certain license agreements we are committed to royalty payments based on the sales of products using certain technologies. We recognize royalty obligations as determinable in accordance with agreement terms. Where agreements are not finalized, we have recognized our current best estimate of the obligation in accrued liabilities and other long-term liabilities. When the agreements are finalized, the estimates are revised accordingly.
Contingencies
We are from time to time involved in litigation, certain other claims and arbitration matters arising in the ordinary course of our business. We accrue for a liability when it is both probable that a liability has been incurred and the amount of the loss can be reasonably estimated. Significant judgment is required in both the determination of probability and the determination as to whether a loss is reasonably estimable. These accruals are reviewed at least quarterly and adjusted to reflect the impacts of negotiations, settlements, rulings, advice of legal counsel and technical experts and other information and events pertaining to a particular matter. To the extent there is a reasonable possibility (within the meaning of ASC 450, Contingencies) that the losses could exceed the amounts already accrued for those cases for which an estimate can be made, management believes that the amount of any such additional loss would not be material to our results of operations or financial condition.
In some instances, we are unable to reasonably estimate any potential loss or range of loss. The nature and progression of litigation can make it difficult to predict the impact a particular lawsuit will have on the company. There are many reasons why we cannot make these assessments, including, among others, one or more of the following: in the early stage of a proceeding, the claimant is not required to specifically identify the patent that has allegedly been infringed; damages sought that are unspecified, unsupportable, unexplained or uncertain; discovery not having been started or being incomplete; the complexity of the facts that are in dispute (e.g., once a patent is identified, the analysis of the patent and a comparison to the activities of the Company is a labour-intensive and highly technical process); the difficulty of assessing novel claims; the parties not having engaged in any meaningful settlement discussions; the possibility that other parties may share in any ultimate liability; and the often slow pace of patent litigation.
We are required to apply judgment with respect to any potential loss or range of loss in connection with litigation. While we believe we have meritorious defenses to the claims asserted against us in our currently outstanding litigation, and intend to defend ourselves vigorously in all cases, in light of the inherent uncertainties in litigation there can be no assurance that the ultimate resolution of these matters will not significantly exceed the reserves currently accrued by us for those cases for which an estimate can be made. Losses in connection with any litigation for which we are not presently able to reasonable estimate any potential loss or range of loss could be material to our results of operations and financial condition.
Stock-based compensation
We recognize stock-based compensation expense for all stock-based compensation awards based on the fair value at grant date. We recognize stock-based compensation expense for those shares expected to vest on a straight-line basis over the requisite service period of the award.
Determining the appropriate fair value model and calculating the fair value of share-based payment awards requires subjective assumptions. The assumptions used in calculating the fair value of share-based payment awards represent management’s best estimates, but these estimates involve inherent uncertainties and the application of management’s judgment. As a result, if factors change and we use different assumptions, our stock-based compensation expense could be materially different in the future.
Fair value measurement
We measure our short-term investments at fair value, defined as the price that would be received from selling an asset or that would be paid to transfer a liability in an orderly transaction between market participants at the measurement date. When determining fair value measurements, we consider the principal or most advantageous market in which it would transact and consider assumptions that market participants would use when pricing the asset or liability, such as inherent risk, transfer restrictions and risk of non-performance.
An established fair value hierarchy requires the company to maximize the use of observable inputs and minimize the use of unobservable inputs when measuring fair value. A financial instrument’s categorization within the fair value hierarchy is based upon the lowest level of input that is both available and significant to the fair value measurement. Three levels of inputs may be used to measure fair value:
Level 1 - Quoted prices in active markets for identical assets or liabilities.
Level 2 - Observable inputs other than quoted prices in active markets for identical assets and liabilities, such as quoted prices for identical or similar assets or liabilities in markets that are not active, or other
inputs that are observable or can be corroborated by observable market data for substantially the full term of the assets or liabilities.
Level 3 - Inputs that are generally unobservable and are supported by little or no market activity and that are significant to the fair value determination of the assets or liabilities.
The determination of fair value requires judgments, assumptions and estimates and may change over time.
OUTSTANDING SHARE DATA
As of the date of this MD&A, the Company had 31,358,264 common shares issued and outstanding, stock options exercisable into 1,582,138 common shares and 595,825 restricted treasury share units outstanding.
IMPACT OF ACCOUNTING PRONOUNCEMENTS AFFECTING FUTURE PERIODS
In July 2013, the FASB issued ASU 2013-11, Income Taxes (ASC 740) Presentation of an Unrecognized Tax Benefit When a Net Operating Loss Carry forward, a Similar Tax Loss, or a Tax Credit Carry forward Exists (Update). The update is intended to eliminate the diversity in practice of the presentation of an unrecognized tax benefit when a net operating loss carryforward, a similar tax loss, or a tax credit carryforward exists. The update is effective for annual and interim financial statements for fiscal years beginning after December 15, 2013. The amendments should be applied prospectively to all unrecognized tax benefits that exist at the effective date. Retrospective application is permitted.
DISCLOSURE CONTROLS
Our management is responsible for establishing and maintaining adequate disclosure controls and procedures for the Company. Our disclosure controls and procedures are designed to ensure that information required to be disclosed in our reports filed with securities regulatory authorities is recorded, processed, summarized and reported within time periods specified in applicable securities regulations, and is accumulated and communicated to our management, including our Chief Executive Officer and our Chief Financial Officer, as appropriate, to allow timely decisions regarding required disclosure.
We conducted an evaluation of the effectiveness of our disclosure controls and procedures, which was carried out under the supervision of, and with the participation of, our management, including our Chief Executive Officer and our Chief Financial Officer, as of December 31, 2013. Based on that evaluation, our Chief Executive Officer and our Chief Financial Officer have concluded that our disclosure controls and procedures were effective as of December 31, 2013 to ensure that information required to be disclosed by us in the reports we file or submit under applicable securities laws and regulations is recorded, processed, summarized, and reported within the time periods specified thereby.
We do not expect that our disclosure controls and procedures will prevent all errors and all fraud. Control procedures, no matter how well conceived and operated, can provide only reasonable, not absolute, assurance that the objectives of the control procedures are met. Because of the inherent limitations in all control procedures, no evaluation of controls can provide absolute assurance that all control issues and instances of fraud, if any, within our company have been detected. These inherent limitations include the realities that judgments in decision-making can be faulty, and that breakdowns can occur because of simple error or mistake. Additionally, controls can be circumvented by the individual acts of some persons, by collusion of two or more people, or by management override of the control. We considered these limitations during the development of our disclosure controls and procedures and will periodically re-evaluate them to ensure they provide reasonable assurance that such controls and procedures are effective.
INTERNAL CONTROL OVER FINANCIAL REPORTING
Management’s Annual Report on Internal Control over Financial Reporting
Our management is responsible for establishing and maintaining adequate internal control over financial reporting, as such term is defined in Rules 13a-15(f) and 15d-15(f) under the U.S. Securities Exchange Act of 1934 and has designed such internal control over financial reporting to provide reasonable assurance regarding the reliability of financial reporting and the preparation of financial statements for external purposes in accordance with U.S. GAAP.
Our internal control over financial reporting includes those policies and procedures that: (1) pertain to the maintenance of records that, in reasonable detail, accurately and fairly reflect the transactions and dispositions of our assets; (2) provide reasonable assurance that transactions are recorded as necessary to permit preparation of financial statements in accordance with U.S. GAAP, and that our receipts and expenditures are being made only in accordance with authorizations of our management and directors; and (3) provide reasonable assurance regarding prevention or timely detection of unauthorized acquisition, use or disposition of our assets that could have a material effect on the financial statements.
Because of its inherent limitations, internal control over financial reporting may not prevent or detect misstatements on a timely basis. Also, projections of any evaluation of effectiveness of internal control over financial reporting to future periods are subject to the risk that controls may become inadequate because of changes in conditions, or that the degree of compliance with the policies or procedures may deteriorate.
Under the supervision and with the participation of our Chief Executive Officer and our Chief Financial Officer, management conducted an evaluation of the effectiveness of our internal control over financial reporting, as of
December 31, 2013, based on the framework set forth in Internal Control-Integrated Framework (1992) issued by the Committee of Sponsoring Organizations of the Treadway Commission ("COSO"). Based on its evaluation under this framework, management concluded that our internal control over financial reporting was effective as of that date.
KPMG LLP (“KPMG”), an independent registered public accounting firm, who audited and reported on our consolidated financial statements as at and for the year ended December 31, 2013, has issued an attestation report on our internal control over financial reporting as of December 31, 2013. The attestation report is included in our consolidated financial statements.
There were no changes in our internal control over financial reporting during the year ended December 31, 2013 that materially affected, or are reasonably likely to materially affect, our internal control over financial reporting. The design of any system of controls and procedures is based in part upon certain assumptions about the likelihood of certain events. There can be no assurance that any design will succeed in achieving its stated goals under all potential future conditions, regardless of how remote.
LEGAL PROCEEDINGS
In November 2013, we filed a complaint against Nokia Corporation in the EU Commission for breach of Article 102 of the European Union Treaty. The complaint alleges that Nokia Corporation abuses a dominant position, discriminates, applies unfair royalties and wrongfully refuses to grant a license to Sierra Wireless in the context of Nokia's essential patents licensing program. We also believe that Nokia Corporation violates section 5 of the FTC Act (United States) and have sent a notice to the Federal Trade Commission ("FTC") setting out these violations. The EU Commission and FTC are each currently reviewing the materials we have submitted to them. On January 6 2014, we received notice from the International Chamber of Commerce of arbitration proceedings launched by Nokia Corporation against Sierra Wireless, for alleged unpaid royalties of approximately $29 million. We believe Nokia's arbitration claims are without legal merit, and we will defend ourselves vigorously. Nonetheless, an unfavorable outcome could have a material adverse effect on our operating results, liquidity or financial position.
In December 2012, Concinnitas LLC filed a patent infringement lawsuit in the United States District Court for the Eastern District of Texas asserting patent infringement by us. The lawsuit makes allegations concerning AirCard products. In September 2013, a mutually agreeable confidential settlement was entered into by the parties which will not have a material adverse effect on our operating results. The lawsuit was subsequently dismissed with prejudice.
In April 2012, a patent holding company, Cell and Network Selection, LLC (“CNS”), filed a patent infringement lawsuit in the United States District Court for the District of Texas asserting patent infringement by us and our customer. In May 2013, this lawsuit was dismissed upon motion of CNS and a new lawsuit was filed by CNS in the same court. The lawsuit makes certain allegations concerning the LTE products sold by us, including the mobile hotspots and USB modems sold by us to AT&T prior to the transfer of the AirCard business to Netgear. In September 2013, a mutually agreeable confidential settlement was entered into by the parties which will not have a material adverse effect on our operating results. The lawsuit was subsequently dismissed with prejudice.
In January 2012, a patent holding company, M2M Solutions LLC ("M2M"), filed a patent infringement lawsuit in the United States District Court for the District of Delaware asserting patent infringement by us and our competitors. The lawsuit makes certain allegations concerning the AirPrime embedded wireless module products, related AirLink products and related services sold by us for use in M2M communication applications. The lawsuit is in the discovery stage. The claim construction order has determined one of the two patents-in-suit to be indefinite and therefore invalid. Trial is anticipated to occur in September 2014. In February 2014, we filed a declaratory judgment action in the same court seeking a declaration of non-infringement with respect to a recently issued patent held by M2M, which patent is a continuation of the patents-in-suit in the original lawsuit filed against us by M2M.
In September 2011, a patent holding company, Wi-Lan, Inc. ("Wi-Lan"), filed a patent infringement lawsuit in the United States District Court for the Eastern District of Texas asserting patent infringement by a number of parties, including us. The lawsuit makes certain allegations concerning the wireless communication products sold by us. In September 2012, the lawsuit was consolidated with another lawsuit commenced by Wi-Lan in the Eastern District of Texas concerning the same patents. In December 2012, Wi-Lan filed additional patent litigation lawsuits in the United States District Court for each of the Eastern District of Texas and the Southern District of Florida asserting patent infringement by us of additional patents not included in the first Wi-Lan suit. The lawsuit in the Southern District of Florida was transferred to the Southern District of California. The second lawsuit in the Eastern District of Texas had not yet been scheduled for trial; however certain claims in the patent-in-suit (US Patent No. 6,381,211) were recently found to be invalid, as well as not infringed, by a jury in a similar case in this district involving Wi-Lan as plaintiff and Ericsson Inc., Alcatel-Lucent USA Inc., HTC Corporation and Sony Mobile Communications as defendants. In October 2013, a mutually agreeable confidential settlement was entered into by the parties to resolve all pending lawsuits, which will not have a material adverse effect on our operating results.
In May 2010 and in February 2011, a patent holding company, Golden Bridge Technology Inc. (“GBT”), filed patent infringement lawsuits in the United States District Court for the District of Delaware asserting patent infringement of the same two patents by a number of parties, including us and certain of our customers. In both cases, the litigation makes certain allegations concerning the wireless modems sold by us and our competitors. Both lawsuits have been stayed against all defendants except Apple Inc. ("Apple"), pending the outcome of the first case against Apple in Delaware. In April 2013, the Court of Delaware issued its claim construction order, as well as an order granting Apple's motion for summary judgment on non-infringement and denying Apple's motion for summary judgment on invalidity. These orders have been appealed by GBT to the United States Court of Appeals for the Federal Circuit. In May 2012, GBT filed a patent infringement lawsuit in the United States District Court for the Central District of California asserting patent infringement by us of a different patent from the other two lawsuits, but concerning essentially the same products. In September 2012, this lawsuit was dismissed in the Central District of California and re-filed in the District of Delaware. This Delaware lawsuit has been stayed against us pending the outcome of the case against Apple with respect to the same patent, which is set for trial in the Central District of California in May 2014. A claim construction order was issued in this case in June 2013.
In July 2009, a patent holding company, SPH America, LLC, filed a patent infringement lawsuit in the United States District Court for the Eastern District of Virginia asserting patent infringement by a number of device manufacturers, including us, and computer manufacturers, including certain of our customers. In January 2013, a mutually agreeable confidential settlement was entered into by the parties which will not have a material adverse effect on our operating results. The lawsuit was subsequently dismissed with prejudice.
Although there can be no assurance that an unfavorable outcome would not have a material adverse effect on our operating results, liquidity or financial position, we believe the claims made in the foregoing legal proceedings are without merit and intend to defend ourselves and our products vigorously in all cases.
IP Indemnification Claims
We have been notified by one or more of our customers in each of the following matters that we may have an obligation to indemnify them in respect of the products we supply to them:
In May 2013, a patent holding company, Adaptix, Inc., filed a patent infringement lawsuit in the United States District Court for the Eastern District of Texas against one of our customers asserting patent infringement in relation to our customer’s products, which may include certain LTE products which utilize modules sold to them by us. The lawsuit is in the early stages.
In January 2013, a patent holding company, Steelhead Licensing LLC, filed a patent infringement lawsuit in the United States District Court for the District of Delaware against one of our customers asserting patent infringement in relation to our customer's products and services, including the mobile hotspot devices sold to them by us prior to the transfer of the AirCard business to Netgear. In March 2013, we advised our customer that we had been
granted a license with respect to the patents-in-suit, which license covers any of our products sold by our customers (including this customer). We believe this outcome will not have a material adverse effect on our operating results.
In February 2012, a patent holding company, Intellectual Ventures (comprised of Intellectual Ventures I LLC and Intellectual Ventures II LLC), filed a patent infringement lawsuit in the United States District Court for the District of Delaware against two of our customers asserting patent infringement in relation to several of our customer's products and services, including the mobile hotspots sold to them by us prior to the transfer of the AirCard business to Netgear. The lawsuit was split into several separate lawsuits and amended complaints were filed in October 2013. The lawsuits are in the early stages, and we are negotiating a stipulation of intervention in two cases with the plaintiff.
In September 2011, a patent holding company, Mayfair Wireless, LLC, filed a patent infringement lawsuit in the United States District Court for the District of Delaware against two of our customers asserting patent infringement in relation to the wireless hotspots sold to them by us prior to the transfer of the AirCard business to Netgear. In October 2013, the plaintiff objected to the Magistrate’s report and recommendation that the Court grant the defense motion to dismiss for lack of subject matter jurisdiction; therefore, the matter is currently being reviewed by the District Court Judge.
In June 2011, Barnes and Noble, Inc. filed a declaratory judgment action in the United States District Court for the Northern District of California against LSI Corporation (and later added Agere Systems, Inc.), (collectively, “LSI”), seeking a declaration that certain patents were not infringed by their products, including the 3G Nook e-reader which incorporates wireless modules sold to them by us. LSI counterclaimed for patent infringement. There are currently 9 patents-in-suit, two of which relate to the 3G products which incorporate our modules. The lawsuit is currently in the discovery phase and the claim construction hearing is anticipated to occur in March 2014.
A patent holding company, Eon Corp. IP Holdings, LLC ("Eon"), filed a patent infringement lawsuit against one of our customers in October 2010 in the United States District Court for the Eastern District of Texas, which was subsequently transferred to the United States District Court for the Northern District of California. A claim construction order was issued in July 2013, and this case is scheduled for trial in October 2014. Eon filed a patent litigation lawsuit against another of our customers in January 2012 in the United States District Court for the District of Puerto Rico, which has been transferred in part to the District of Delaware with respect to claims related to one of the three patents-in-suit. A claim construction hearing was held in the Puerto Rico case in November 2013 and in the Delaware case in January 2014. In all the above Eon cases, assertions of patent infringement are being made in relation to the wireless modems sold to our customers by us prior to the transfer of the AirCard business to Netgear.
Although there can be no assurance that an unfavorable outcome would not have a material adverse effect on our operating results, liquidity or financial position, we believe the claims made in the foregoing legal proceedings are without merit and intend to defend ourselves and our products vigorously in all cases.
We are engaged in certain other claims, legal actions and arbitration matters, all in the ordinary course of business, and believe that the ultimate outcome of these claims, legal actions and arbitration matters will not have a material adverse effect on our operating results, liquidity or financial position.
RISKS AND UNCERTAINTIES
Our business is subject to significant risks and uncertainties and past performance is no guarantee of future performance. The risks and uncertainties described below are those which we currently believe to be material, and do not represent all of the risks that we face. Additional risks and uncertainties, not presently known to us, may become material in the future or those risks that we currently believe to be immaterial may become material in the future. If any of the following risks actually occur, alone or in combination, our business, financial condition and results of operations, as well as the market price of our common shares, could be materially adversely affected.
Our financial results are subject to fluctuations that could have a material adverse effect on our business and that could affect the market price of our common shares.
Our revenue, gross margin, operating earnings and net earnings may vary from quarter-to-quarter and could be significantly impacted by a number of factors, including but not limited to the following:
| |
| • | Price and product competition which may result in lower selling prices for some of our products or lost market share; |
| |
| • | Price and demand pressure on our products from our customers as they experience pressure in their businesses; |
| |
| • | Demand fluctuation based on the success of our customers in selling their products and solutions which incorporate our wireless products and software; |
| |
| • | Development and timing of the introduction of our new products including the timing of sales orders, OEM and distributor customer sell through and design win cycles in our embedded wireless module business; |
| |
| • | Transition periods associated with the migration to new technologies; |
| |
| • | Potential commoditization and saturation in certain markets; |
| |
| • | Our ability to accurately forecast demand in order to properly align the purchase of components and the appropriate level of manufacturing capability; |
| |
| • | Product mix of our sales. Our products have different gross margins — for example the embedded wireless module product line has lower gross margins than the higher margin rugged mobile product line; |
| |
| • | Possible delays or shortages in component supplies; |
| |
| • | Possible delays in the manufacture or shipment of current or new products; |
| |
| • | Possible product quality or factory yield issues that may increase our cost of goods sold; |
| |
| • | Concentration in our customer base; |
| |
| • | Amount of inventory held by our channel partners; |
| |
| • | Possible fluctuations in certain foreign currencies relative to the U.S. dollar that may affect foreign denominated revenue, cost of goods sold and operating expenses; |
| |
| • | Achievement of milestones related to our professional services contracts; and |
| |
| • | Operating expenses that are generally fixed in the short-term and therefore difficult to rapidly adjust to different levels of business. |
Any of the factors listed above could cause significant variations in our revenues, gross margin and earnings in any given quarter. Therefore, our quarterly results are not necessarily indicative of our overall business, results of operations, and financial condition.
Quarterly variations in operating results or any of the other factors listed above, changes in financial estimates by securities analysts, or other events or factors may result in wide fluctuations in the market price of our common shares. Broad market fluctuations or any failure of the Company’s operating results in a particular quarter to meet market expectations may adversely affect the market price of our common shares.
Competition from new or established wireless communication companies or from those with greater resources may prevent us from increasing or maintaining our market share and could result in price reductions and/or loss of business with resulting reduced revenues and gross margins.
The wireless communications industry is highly competitive and we have experienced and expect to continue to experience intense competition. More established and larger companies with strong brands and greater financial, technical and marketing resources, or companies with different business models sell products that compete with ours and we expect this competition to intensify. Business combinations or strategic alliances by our competitors could weaken our competitive position. We may also introduce new products that will put us in direct competition with major new competitors. Existing or future competitors may be able to respond more quickly to technological developments and changes and introduce new products before we do or may independently develop and patent
technologies and products that are superior to ours or achieve greater acceptance due to factors such as more favorable pricing, more desired or better quality features or more efficient sales channels. If we are unable to compete effectively with our competitors' pricing strategies, technological advances and other initiatives, we may lose customer orders and market share and we may need to reduce the price of our products, resulting in reduced revenue and reduced gross margins.
The loss of any of our significant customers could adversely affect our revenue and profitability, and therefore shareholder value.
We sell our products to OEMs, enterprises, distributors, resellers and network operators, and we are occasionally party to sales agreements with customers comprising a significant portion of our revenue. Accordingly, our business and future success depends on our ability to maintain and build on existing relationships and develop new relationships with OEMs, enterprises, distributors, resellers and network operators. If certain of our significant customers, for any reason, discontinues their relationship with us or reduces or postpones current or expected purchase orders for products, or suffers from business failure, our revenues and profitability could decline, perhaps materially. In the year ended December 31, 2013, no customer individually accounted for more than 10% of our aggregated revenue, from continuing and discontinued operations. In the year ended December 31, 2012, two customers accounted for more than 10% of our aggregated revenue from continuing and discontinued operations, and on a combined basis, represented 25% of our aggregated revenue from continuing and discontinued operations.
In addition, our current customers purchase our products under purchase orders. Our customers have no contractual obligation to continue to purchase our products following our fulfillment of current purchase orders and if they do not continue to make purchases, our revenue and our profitability could decline, perhaps materially.
We may be found to infringe on the intellectual property rights of others.
Our industry has many participants that own, or claim to own, proprietary intellectual property. In the past we have received, and in the future we may continue to receive, assertions or claims from third parties alleging that our products violate or infringe their intellectual property rights. We may be subject to these claims directly or through indemnities against these claims which we have provided to certain customers and other third parties. Our component suppliers and technology licensors do not typically indemnify us against these claims and therefore we do not have recourse against them in the event a claim is asserted against us or a customer we have indemnified. This potential liability, if realized, could materially adversely affect our business operating results and financial condition.
Activity in this area by third parties, particularly those with tenuous claims, is increasing, resulting in us taking a more aggressive defensive approach, which may result in increased litigation. In the last few years, patent claims have been brought against us by third parties whose primary (or sole) business purpose is to acquire patents and other intellectual property rights, and not to manufacture and sell products and services. These entities aggressively pursue patent litigation, resulting in increased litigation costs for us. We expect that this recent development will continue for the foreseeable future. Infringement on intellectual property can be difficult to verify and litigation may be necessary to establish whether or not we have infringed the intellectual property rights of others. In many cases, these third parties are companies with substantially greater resources than us, and they may be able to, and may choose to, pursue complex litigation to a greater degree than we could. Regardless of whether these infringement claims have merit or not, we may be subject to the following:
| |
• | We may be found to be liable for potentially substantial damages, liabilities and litigation costs, including attorneys' fees; |
| |
• | We may be prohibited from further use of intellectual property as a result of an injunction and may be required to cease selling our products that are subject to the claim; |
| |
• | We may have to license third party intellectual property, incurring royalty fees that may or may not be on commercially reasonable terms. In addition, there is no assurance that we will be able to successfully negotiate and obtain such a license from the third party; |
| |
• | We may have to develop a non-infringing alternative, which could be costly and delay or result in the loss of sales. In addition, there is no assurance that we will be able to develop such a non-infringing alternative; |
| |
• | Management attention and resources may be diverted; |
| |
• | Our relationships with customers may be adversely affected; and |
| |
• | We may be required to indemnify our customers for certain costs and damages they incur in such a claim. |
In addition to potentially being found to be liable for substantial damages in the event of an unfavorable outcome in such a claim and our inability to either obtain a license from the third party on commercial terms or develop a non-infringing alternative, our business, operating results and financial condition may be materially adversely affected and we may have to cease the sale of certain products and restructure our business.
We may be unable to continue to license necessary third party technology on commercially reasonable terms, if at all.
We license technology, intellectual property and software from third parties for use in our products and from time to time may be required to license additional intellectual property. In some cases, these licenses provide us with certain pass-through rights for the use of other third party intellectual property. There is no assurance that we will be able to maintain our third party licenses or obtain new licenses when required and this inability could materially adversely affect our business and operating results and the quality and functionality of our products.
We depend on single source suppliers for some components used in our products and if these suppliers are unable to meet our demand the availability of our products may be materially adversely affected.
Our products are comprised of components some of which are procured from single source suppliers, including where we have licensed certain software embedded in a component. From time to time, certain components used in our products have been, and may continue to be in short supply worldwide and shortages in allocation of components may result in a delay in filling orders from our customers, which may adversely affect our business. In addition, our single source suppliers may experience damage or interruption in their operations due to unforeseen events, become insolvent or bankrupt, or experience claims of infringement, all of which could delay or stop their shipment of components to us, which may adversely affect our business, operating results and financial condition. If there is a shortage of any such components and we cannot obtain an appropriate substitute from an alternate supplier of components, we may not be able to deliver sufficient quantities of our products, we may lose business or customers and our operating results and financial condition may be materially adversely affected.
We may have difficulty responding to changing technology, industry standards and customer requirements, and therefore be unable to develop new products in a timely manner which meet the needs of our customers.
The wireless communications industry is subject to rapid technological change. Our business and future success will depend, in part, on our ability to accurately predict and anticipate evolving wireless technology standards and develop products that keep pace with the continuing changes in technology, evolving industry standards and changing customer and end-user preferences and requirements. Our products embody complex technology that may not meet those standards, preferences and requirements. Our ability to design, develop and commercially launch new products depends on a number of factors, including but not limited to the following:
| |
• | Our ability to attract and retain skilled technical employees; |
| |
• | The availability of critical components from third parties; |
| |
• | Our ability to successfully complete the development of products in a timely manner; |
| |
• | The ability of third parties to complete and deliver on outsourced product development engagements; and |
| |
• | Our ability to design and manufacture products at an acceptable cost and quality. |
A failure by us, or our suppliers in any of these areas, or a failure of new products to obtain commercial acceptance, could mean we receive less revenue than we anticipate and we may be unable to recover our research and development expenses.
We develop products to meet our customers' requirements. OEM customers award design wins for the integration of wide area embedded wireless modules on a platform by platform basis. Current design wins do not guarantee future design wins. If we are unable or choose not to meet our customers' future needs, we may not win their future business and our revenue and profitability may decrease.
In addition, wireless communications service providers require that wireless data systems deployed on their networks comply with their own standards, which may differ from the standards of other providers. We may be unable to successfully address these developments on a timely basis or at all. Our failure to respond quickly and cost-effectively to new developments through the development of new products or enhancements to existing products could cause us to be unable to recover significant research and development expenses and reduce our revenues.
We depend on a limited number of third parties to manufacture our products. If they do not manufacture our products properly or cannot meet our needs in a timely manner, we may be unable to fulfill our product delivery obligations and our costs may increase, and our revenue and margins could decrease.
We outsource the manufacturing of our products to several contract manufacturers and depend on these manufacturers to meet our needs in a timely and satisfactory manner at a reasonable cost. Our reliance on third party manufacturers subjects us to a number of risks, including but not limited to the following:
| |
• | Potential business interruption due to unexpected events such as natural disasters, labor unrest or geopolitical events; |
| |
• | The absence of guaranteed or adequate manufacturing capacity: |
| |
• | Potential violations of laws and regulations by our manufacturers that may subject us to additional costs for duties, monetary penalties, seizure and loss of our products or loss of our import privileges, and damage to our reputation; |
| |
• | Reduced control over delivery schedules, production levels, manufacturing yields, costs and product quality; |
| |
• | The inability of our contract manufacturers to secure adequate volumes of components in a timely manner at a reasonable cost; and |
| |
• | Unexpected increases in manufacturing costs. |
If we are unable to successfully manage any of these risks or to locate alternative or additional manufacturers or suppliers in a timely and cost-effective manner, we may not be able to deliver products in a timely manner. In addition, our results of operations could be harmed by increased costs, reduced revenues and reduced margins.
Under our manufacturing agreements, in many cases we are required to place binding purchase orders with our manufacturers well in advance of our receipt of binding purchase orders from our customers. In this situation, we consider our customers' good faith, non-binding forecasts of demand for our products. As a result, if the number of actual products ordered by our customers is materially different from the number of products we have instructed our manufacturer to build (and to purchase components in respect of), then, if too many components have been purchased by our manufacturer, we may be required to purchase such excess component inventory, or, if an insufficient number of components have been purchased by our manufacturer, we may not be in a position to meet all of our customers' requirements. If we are unable to successfully manage our inventory levels and respond to our customers' purchase orders based on their forecasted quantities, our business, operating results and financial condition could be adversely affected.
Failures of our products or services due to quality issues, design flaws, errors or other defects that result in product liability claims and product recalls could lead to unanticipated costs or otherwise harm our business.
Our products comprise hardware and software that is technologically complex. In order to compete in the technologically advanced and rapidly changing wireless communication market, we must develop and introduce our products quickly. Despite the sophisticated testing and certification processes for our products, it is possible that our products may contain undetected errors or defects, especially when introduced or when new versions are released. As a result, our products may be rejected by our customers leading to loss of business, loss of revenue, additional development and customer service costs, unanticipated warranty claims, payment of monetary damages under contractual provisions and damage to our reputation.
The Company may experience adverse effects relating to the divestiture of the assets and operations of the AirCard business.
Difficulties associated with the divestiture of the assets and operations of the AirCard business could have a material adverse effect on the Company's business, operating results, financial condition and the price of the Company's common shares.
Divestiture execution is a difficult and complex undertaking that requires different skills than those required for day-to-day operations. As a result, we may experience adverse effects relating to the divestiture of the assets and operations of the AirCard business, including but not limited to:
| |
• | The carve-out of the AirCard business from the ongoing business may be disruptive to our ongoing business, place additional demands on our ongoing business and divert management attention from the ongoing business thereby diminishing the ability to maintain focus on the Company's key strategic and financial goals; |
| |
• | The inability to restructure our existing business operations and/or grow the ongoing business without encountering difficulties and delays; |
| |
• | The inability to perform those transition services required by the divested business in a timely and efficient manner and/or exit in prompt manner; |
| |
• | Unanticipated costs and unforeseen liabilities; and |
Continued difficult or uncertain global economic conditions could adversely affect our revenue and profitability.
A significant portion of our business is in the United States, Europe and the Asia-Pacific region and we are particularly exposed to the downturns and current uncertainties that impact the wireless communications industry in those economies. Economic uncertainty may cause an increased level of commercial and consumer delinquencies, lack of consumer confidence resulting in delayed purchases or reduced volumes by our customers, increased market volatility and widespread reduction of business activity generally. To the extent that we experience further economic uncertainty, or deterioration in one of our large markets in the United States, Europe or the Asia-Pacific region, the resulting economic pressure on our customers may cause them to end their relationship with us, reduce or postpone current or expected orders for our products or services, or suffer from business failure, resulting in a material adverse impact to our revenues, profitability, cash flow and bad debt expense.
It is difficult to estimate or project the level of economic activity, including economic growth, in the markets we serve. As our budgeting and forecasting is based on the demand for our products and services, these economic uncertainties result in it being difficult for us to estimate future revenue and expenses.
Fluctuations in exchange rates between the U.S. dollar and other currencies, including the Canadian dollar, and the Euro may affect our operating results.
We are exposed to currency fluctuations and exchange rate risk on all operations conducted in currencies other
than the United States dollar. We cannot accurately predict the future effects of foreign currency fluctuations on our financial condition or results of operations.
The majority of our revenues are denominated in U.S. dollars while a significant amount of our research and development, marketing and administration costs are denominated in currencies other than the U.S. dollar; primarily the Canadian dollar and the Euro. To the extent that exchange rates between the U.S. dollar and the Canadian dollar and Euro fluctuate, we will experience an impact on our earnings.
As our business expands internationally, we will be exposed to additional risks relating to international operations.
We intend to continue to grow our international business operations. Our international operations expose us to additional risks unique to such international markets, including but not limited to the following:
| |
• | Increased credit management risks and greater difficulties in collecting accounts receivable; |
| |
• | Unexpected changes in regulatory requirements, wireless communications standards, exchange rates, trading policies, tariffs and other barriers; |
| |
• | Uncertainties of international laws and enforcement relating to the protection of intellectual property; |
| |
• | Economic or political instability; |
| |
• | Potential adverse tax consequences; |
| |
• | Difficulty in managing a worldwide workforce in compliance with business practices and local laws, that vary from country to country; and |
| |
• | Consumer protection laws that impose additional requirements on us or restrict our ability to provide limited warranty protection. |
We may be unable to attract or retain key personnel which may harm our ability to compete effectively.
Our success depends in large part on the abilities and experience of our executive officers and other key employees. Competition for highly skilled management, technical, research and development and other key employees is intense in the wireless communications industry. We may not be able to retain our current executive officers or key employees and may not be able to hire and transition in a timely manner experienced and highly qualified additional executive officers and key employees as needed to achieve our business objectives. We do not have fixed-term employment agreements with our key personnel. The loss of executive officers and key employees could disrupt our operations and our ability to compete effectively could be adversely affected.
Furthermore, loss of key employees or deterioration in overall employee morale and engagement as a result of organizational change could have an adverse impact on our growth, business and profitability.
We rely on certain internal processes, infrastructure and information technology systems to efficiently operate and report on our business.
The inability to continue to enhance or prevent a failure of certain internal processes, infrastructure or information technology systems could negatively impact our ability to operate or accurately report on our business.
Acquisitions and divestitures of businesses or technologies may result in disruptions to our business or may not achieve the anticipated benefits.
The growth of our Company through the successful acquisition and integration of complementary businesses is an important component of our business strategy. We continue to seek opportunities to acquire or invest in businesses, products and technologies that expand, complement or otherwise relate to our business. For example, on August 1, 2012, we acquired Sagemcom's M2M business, on October 16, 2013 we completed the acquisition of AnyDATA's M2M modules and modem business and on January 26, 2014 we entered into a definitive agreement to acquire In Motion. Any acquisitions, investments or business combinations by us may be accompanied by risks commonly encountered including but not limited to the following:
| |
• | Exposure to unknown liabilities or risks of the acquired companies, including unknown litigation related to acts or omissions of an acquired company and/or its directors and officers prior to the acquisition, deficiencies in disclosure controls and procedures of our acquired company and deficiencies in internal controls over financial reporting of our acquired Company; |
| |
• | Higher than anticipated acquisition and integration costs and expenses; |
| |
• | The difficulty and expense of integrating the operations and personnel of the acquired companies; |
| |
• | Possible use of cash to support the operations of an acquired business; |
| |
• | Possible increase in foreign exchange translation risk depending on the currency denomination of the revenue and expenses of the acquired business; |
| |
• | Disruption of, and demands on, our ongoing business as a result of integration activities including diversion of management's time and attention from the ongoing business; |
| |
• | Failure to maximize our financial and strategic position by the successful incorporation of acquired technology; |
| |
• | The inability to implement uniform standards, disclosure controls and procedures, internal controls over financial reporting and other procedures and policies in a timely manner; |
| |
• | The potential loss of key employees and customers; |
| |
• | A possible decrease in our share price, if, as a result of the growth of the Company, we decide to raise additional capital through an offering of common shares, preference shares or debt; and |
| |
• | Possible dilution to our shareholders if the purchase price is paid in common shares or securities convertible into common shares. |
In addition, geographic distances may make integration of businesses more difficult. We may not be successful in overcoming these risks or any other problems encountered in connection with any acquisitions. If realized, these risks could reduce shareholder value.
As business circumstances dictate, the Company may also decide to divest assets, technologies or businesses. For example, on April 2, 2013 we completed the sale of our AirCard business. In doing so, the Company may not be successful in identifying or managing the risks commonly encountered, including: higher than anticipated costs; disruption of, and demands on, our ongoing business; diversion of management's time and attention; adverse effects on existing business relationships with suppliers and customers and employee issues. We may not be successful in overcoming these risks or any other problems encountered in connection with a divestiture of assets, technologies or businesses which, if realized, could reduce shareholder value.
In addition, we may be unsuccessful at bringing to conclusion proposed transactions. Negotiations and closing activities of transactions are complex functions subject to numerous unforeseen events that may impede the speed at which a transaction is closed or even prevent a transaction from closing. Failure to conclude transactions in an efficient manner may prevent us from advancing other opportunities or introduce unanticipated transition costs.
Misappropriation of our intellectual property could place us at a competitive disadvantage.
Our intellectual property is important to our success. We rely on a combination of patent protection, copyrights, trademarks, trade secrets, licenses, non-disclosure agreements and other contractual agreements to protect our intellectual property. Third parties may attempt to copy aspects of our products and technology or obtain information we regard as proprietary without our authorization. If we are unable to protect our intellectual property against unauthorized use by others it could have an adverse effect on our competitive position.
Our strategies to deter misappropriation could be inadequate due to the following risks:
| |
• | Non-recognition of the proprietary nature or inadequate protection of our methodologies in the United States, Canada, France or other foreign countries; |
| |
• | Undetected misappropriation of our intellectual property; |
| |
• | The substantial legal and other costs of protecting and enforcing our rights in our intellectual property; and |
| |
• | Development of similar technologies by our competitors. |
In addition, we could be required to spend significant funds and management resources could be diverted in order to defend our rights, which could disrupt our operations.
We have been subject to, and may in the future be subject to, certain class action lawsuits, which if decided against us, could require us to pay substantial judgments, settlements or other penalties.
In addition to being subject to litigation in the ordinary course of business, in the future, we may be subject to class actions and other securities litigation and investigations. We expect that this type of litigation will be time consuming, expensive and distracting from the conduct of our daily business. It is possible that we will be required to pay substantial judgments, settlements or other penalties and incur expenses that could have a material adverse effect on our operating results, liquidity or financial position. Expenses incurred in connection with these lawsuits, which include substantial fees of lawyers and other professional advisors and our obligations to indemnify officers and directors who may be parties to such actions, could materially adversely affect our operating results, liquidity or financial position. Although we have certain insurance policies in place to transfer risk, we do not know with certainty if any of this type of litigation and resulting expenses will be fully or even partially covered by insurance. In addition, these lawsuits may cause our insurance premiums to increase in future periods.
We depend on wireless network carriers to promote and offer acceptable wireless data and voice communications services for our products to operate.
Our products can only be used over wireless data and voice networks operated by third parties. Our business and future growth depends, in part, on the successful deployment by network carriers of next generation wireless data and voice networks and the network carriers' ability to grow their subscriber base. If these network carriers delay the deployment or expansion of next generation networks, fail to offer effective and reliable service, or fail to price and market their services effectively, sales of our products will decline and our revenues will decrease.
Government regulations could result in increased costs and inability to sell our products.
Our products are subject to certain mandatory regulatory approvals in the United States, Canada, the European Union, the Asia-Pacific region and other regions in which we operate. For example, in the United States, the Federal Communications Commission regulates many aspects of communications devices. In Canada, similar regulations are administered by the Ministry of Industry, through Industry Canada. European Union directives provide comparable regulatory guidance in Europe. Although we have obtained all the necessary Federal Communications Commission, Industry Canada and other required approvals for the products we currently sell, we may not receive approvals for future products on a timely basis, or at all. In addition, regulatory requirements may change or we may not be able to receive regulatory approvals from countries in which we may desire to sell products in the future.
We may also incur additional expenses or experience difficulties selling our products associated with complying with the SEC rules and reporting requirements related to conflict minerals. In August 2012, the SEC adopted new disclosure requirements implementing Section 1502 of the Dodd-Frank Wall Street Reform and Consumer Protection Act of 2010 for manufacturers of products containing certain minerals that may originate from the Democratic Republic of Congo and adjoining countries. As a result, the Company is required to conduct certain country of origin and due diligence procedures in order to meet the reporting requirements for 2013 and future years. The impact of the regulations may limit the sourcing and availability, or may increase the costs, of some of the metals used in the manufacture of the Company's products. Also, since the Company's supply chain is complex, the Company may be unable to sufficiently verify the origins for all metals used in the Company's products through its supplier due diligence procedures.