Exhibit 1.3
SIERRA WIRELESS, INC.
MANAGEMENT’S DISCUSSION AND ANALYSIS
For the Fiscal Year Ended December 31, 2020
DATED March 17, 2021
MANAGEMENT’S DISCUSSION AND ANALYSIS
Table of Contents
| | | | | |
| MANAGEMENT’S DISCUSSION AND ANALYSIS | |
| CAUTIONARY NOTE REGARDING FORWARD-LOOKING STATEMENTS | |
| OVERVIEW | |
| Business Overview | |
| Our Mission, Vision and Values | |
| Our Strategy | |
| Annual Overview | |
| CONSOLIDATED ANNUAL RESULTS OF OPERATIONS | |
| DISCUSSION OF CONSOLIDATED ANNUAL RESULTS OF OPERATIONS | |
| Fiscal Year 2020 Compared to Fiscal Year 2019 | |
| Fiscal Year 2019 Compared to Fiscal Year 2018 | |
| SUMMARY OF QUARTERLY CONSOLIDATED RESULTS OF OPERATIONS | |
| DISCUSSION OF QUARTERLY CONSOLIDATED RESULTS OF OPERATIONS | |
| LIQUIDITY AND CAPITAL RESOURCES | |
| NON-GAAP FINANCIAL MEASURES | |
| OFF-BALANCE SHEET ARRANGEMENTS | |
| TRANSACTIONS BETWEEN RELATED PARTIES | |
| CRITICAL ACCOUNTING POLICIES AND ESTIMATES | |
| OUTSTANDING SHARE DATA | |
| IMPACT OF ACCOUNTING PRONOUNCEMENTS AFFECTING CURRENT PERIOD | |
| IMPACT OF ACCOUNTING PRONOUNCEMENTS AFFECTING FUTURE PERIODS | |
| DISCLOSURE CONTROLS AND PROCEDURES | |
| INTERNAL CONTROL OVER FINANCIAL REPORTING | |
| FINANCIAL RISK MANAGEMENT | |
MANAGEMENT’S DISCUSSION AND ANALYSIS OF
FINANCIAL CONDITION AND RESULTS OF OPERATIONS
The following Management’s Discussion and Analysis of Financial Condition and Results of Operations (“MD&A”) provides information for the years ended December 31, 2020, 2019 and 2018 and up to and including March 17, 2021. This MD&A should be read together with our audited consolidated financial statements and the accompanying notes for the year ended December 31, 2020 (“the consolidated financial statements”). The consolidated financial statements have been prepared in accordance with generally accepted accounting principles in the United States (“U.S. GAAP” or "GAAP"). Except where otherwise specifically indicated, all amounts in this MD&A are expressed in United States dollars.
We have prepared this MD&A with reference to National Instrument 51-102 “Continuous Disclosure Obligations” of the Canadian Securities Administrators. Under the U.S./Canada Multijurisdictional Disclosure System, we are permitted to prepare this MD&A in accordance with the disclosure requirements of Canada, which requirements are different than those of the United States.
Certain statements in this MD&A constitute forward-looking statements or forward-looking information within the meaning of applicable securities laws. You should carefully read “Cautionary Note Regarding Forward-Looking Statements” in this MD&A and should not place undue reliance on any such forward-looking statements.
Throughout this document, references are made to certain non-GAAP financial measures that are not measures of performance under U.S. GAAP. Management believes that these non-GAAP financial measures provide useful information to investors regarding our results of operations as they provide additional measures of our performance and assist in comparisons from one period to another. These non-GAAP financial measures do not have any standardized meaning prescribed by U.S. GAAP and are therefore unlikely to be comparable to similar measures presented by other issuers. These non-GAAP financial measures are defined and reconciled to their nearest GAAP measure in “Non-GAAP Financial Measures”.
In this MD&A, unless the context otherwise requires, references to "the Company", "Sierra Wireless", "we", "us" and "our" refer to Sierra Wireless, Inc. and its subsidiaries.
Additional information about our company, including our most recent consolidated financial statements and our Annual Information Form, is available on SEDAR at www.sedar.com and on EDGAR at www.sec.gov.
Cautionary Note Regarding Forward-looking Statements
This MD&A contains certain statements and information that are not based on historical facts and constitute forward-looking statements or forward-looking information within the meaning of the U.S. Private Securities Litigation Reform Act of 1995 and Canadian securities laws (collectively, “forward-looking statements”) and may include statements and information relating to our mission, vision and values; our strategy; the impact of COVID-19 on customer demand, our supply chain, manufacturing capacity, our ability to meet customer demand and our financial results; expectations regarding post-COVID-19 recovery; expectations regarding the Company's cost savings initiatives; anticipated benefits of our recent divestiture of the automotive product line (the "Sale Transaction") and the Company's exit from automotive applications; timing expectations regarding expected earnings of the M2M Group (as defined below) and ability to expand our market presence in Australia and Southern Asia; statements regarding our strategy, plans, goals, objectives, expectations and future operating performance; the Company's liquidity and capital resources; the Company's financial and operating objectives and strategies to achieve them; general economic conditions; estimates of our expenses, future revenues, financial results and capital requirements; our expectations regarding the legal proceedings we are involved in; statements with respect to the Company's estimated working capital; expectations with respect to the adoption of Internet of Things ("IoT") solutions; expectations regarding trends and growth in the IoT market and wireless module market; expectations regarding product and price competition from other wireless device manufacturers and solution providers; our ability to implement effective control procedures; and expectations regarding the launch of fifth generation cellular embedded modules and gateways. Forward-looking statements are provided to help you understand our views of our short and long term plans, expectations and prospects. We caution you that forward-looking statements may not be appropriate for other purposes.
Any statements that express or involve discussions with respect to predictions, expectations, beliefs, plans, projections, objectives, assumptions or future events or performance (often, but not always, identified by words or phrases such as "outlook", “expects”, “is expected”, “anticipates”, “believes”, “plans”, “projects”, “estimates”, “assumes”, “intends”, “strategy”, “goals”, “objectives”, “potential”, “possible”, or variations thereof, or stating that certain actions, events, conditions or results “may”, “could”, “would”, “should”, “might” or “will” be taken, occur or be achieved, or the negative of any of these terms and similar expressions) are not statements of historical fact and may be forward-looking statements. Forward-looking statements are not promises or guarantees of future performance. They represent our current views and may change significantly. Forward-looking statements are based on a number of material assumptions, including, but not limited to, those listed below, which could prove to be significantly incorrect:
•the scope and duration of the COVID-19 pandemic and its impact on our business;
•our ability to return to normal operations after the COVID-19 pandemic has subsided;
•expected component supply constraints and manufacturing capacity;
•customer demand and our ability to continue to sell our products and services in the expected quantities at the expected prices and expected times;
•our ability to effect and to realize the anticipated benefits of our business transformation initiatives, and the timing thereof;
•our ability to develop, manufacture and sell new products and services that meet the needs of our customers and gain commercial acceptance;
•expected macro-economic business conditions;
•expected cost of sales;
•our ability to win new business;
•our ability to integrate acquired businesses and realize expected benefits;
•our ability to renew or obtain credit facilities when required;
•expected deployment of next generation networks by wireless network operators;
•our operations not being adversely disrupted by other developments, operating, cyber security, litigation, or regulatory risks; and
•expected tax and foreign exchange rates.
Forward-looking statements are subject to a variety of known and unknown risks, uncertainties and other factors that could cause actual events or results to differ significantly from those expressed or implied in our forward-looking statements, including, without limitation:
•prolonged negative impact from COVID-19;
•our access to capital, if required;
•competition from new or established competitors or from those with greater resources;
•our reliance on single source suppliers for certain components used in our products;
•our dependence on a limited number of third party manufacturers;
•natural catastrophes or public health epidemics that could impact customer demand, result in production disruption and impact our ability to meet customer demand or capacity to continue critical operations;
•risks that the Sale Transaction may fail to realize the expected benefits;
•the loss of, or significant demand fluctuations from, any of our significant customers;
•our financial results being subject to fluctuations;
•our business transformation initiatives may result in disruptions to our business and may not achieve the anticipated benefits;
•our ability to respond to changing technology, industry standards and customer requirements;
•failures of our products or services due to design flaws and errors, component quality issues, manufacturing defects, network service interruptions, cyber-security vulnerabilities or other quality issues;
•deterioration in macro-economic conditions could adversely affect our operating results and financial conditions;
•our ability to hire and transition in a timely manner experienced and qualified additional executive officers and key employees as needed to achieve our business objectives, including a replacement for our departing Chief Executive Officer;
•cyber-attacks or other breaches of our information technology security;
•risks related to the transmission, use and disclosure of user data and personal information;
•disruption of, and demands on, our ongoing business and diversion of management's time and attention in connection with acquisitions or divestitures;
•risks that the acquisition of the M2M Group and M2M New Zealand or our investments and partnerships may fail to realize the expected benefits;
•risks related to infringement on intellectual property rights of others;
•our ability to obtain necessary rights to use software or components supplied by third parties;
•our ability to enforce our intellectual property rights;
•unanticipated costs associated with litigation or settlements;
•our dependence on mobile network operators to promote and offer acceptable wireless data services;
•risks related to contractual disputes with counterparties;
•risks related to governmental regulation;
•risks inherent in foreign jurisdictions; and
•risks related to tariffs or other trade restrictions.
This list is not exhaustive of the factors that may affect any of our forward-looking statements. Forward-looking statements are statements about the future and are inherently uncertain, and our actual achievements or other future events or conditions may differ materially from those reflected in the forward-looking statements due to a variety of risks, uncertainties and other factors, including, without limitation, those referred to our 2020 Annual Information Form under "Risk Factors" and those referred to in our other regulatory filings with the U.S. Securities and Exchange Commission (the "SEC") in the United States and the provincial securities commissions in Canada.
Our forward-looking statements are based on the beliefs, expectations and opinions of management on the date the statements are made, and we do not assume any obligation to update forward-looking statements if circumstances or management’s beliefs, expectations or opinions should change, except as required by applicable law. For the reasons set forth above, investors should not place undue reliance on forward-looking statements.
OVERVIEW
Business Overview
Sierra Wireless provides leading solutions for the Internet of Things (“IoT”) comprised of our recurring connectivity services, cloud platform, gateways and embedded cellular modules. Enterprises, industrial companies, public safety agencies and Original Equipment Manufacturers ("OEMs") worldwide rely on our expertise to digitize their assets by connecting their equipment and products from the edge of the cellular network to the cloud. Our Device-to-Cloud solutions reduce the complexity of IoT and allow our customers to scale their deployments quickly and securely. We continue to seek opportunities to partner, acquire or invest in businesses, products and technologies that will help us drive our growth strategy forward and expand our leading position in the IoT market.
Divestiture of Automotive Embedded Module Product Line
On July 23, 2020, we entered into a definitive agreement with Rolling Wireless (H.K.) Limited ("Rolling Wireless"), a consortium led by Fibocom Wireless Inc. of Shenzhen to divest our Shenzhen, China-based automotive embedded module product line ("Automotive Business"). On November 18, 2020, we completed the Sale Transaction for total gross proceeds of $165.0 million in cash, subject to working capital adjustments, including $10.0 million of proceeds held in escrow that we recorded in restricted cash and was released on January 8, 2021.
The Company exited the automotive business but will continue to invest in other products in its Embedded Broadband segment, specifically high-speed cellular modules typically used in Enterprise applications. Approximately 150 employees become employees of Rolling Wireless, of which approximately 120 employees are located in Mainland China and 30 are located in Europe or the Asia-Pacific region.
The Sale Transaction is expected to enable us to strengthen our focus on device-to-cloud IoT solutions, driving high-value recurring revenue and allowing us to invest further in fifth generation ("5G") embedded modules and routers. The Sale Transaction has strengthened our balance sheet by providing additional liquidity.
In accordance with U.S. GAAP, assets and liabilities associated with the Automotive Business have been recorded as 'held for sale' in our consolidated balance sheets as at December 31, 2019 and the results of operations of the Automotive Business as discontinued operations in our consolidated statements of operations and comprehensive loss for the years ended December 31, 2020 and 2019. All results of operations of the Automotive Business are classified as discontinued operations in all periods presented in this MD&A.
COVID-19 Impact
COVID-19 continues to significantly impact economies around the world, creating significant uncertainty regarding the nearer term outlook for the markets where we provide our products and services. Our products serve companies across a broad range of industries. Some of our customers are seeing demand delays while others are seeing significant improvements in their businesses. We have been partnering with our customers to address many of these changes and to manage their planned shipments and production allocations. Central to improving our ability to meet our customer expectations has been an adjustment to order lead-times for industrial customers and distributors.
After experiencing the most significant impact of COVID-19 in the second quarter of 2020 with the temporary shutdown of automotive manufacturers, demand for our automotive cellular modules recovered materially following the reopening of production facilities in the third quarter of 2020. Although we saw increased demand for certain wireless broadband connected devices as we helped businesses and workers stayed connected and productive during the pandemic, other areas of our business were impacted by COVID-19. Our financial results in the third and fourth quarter were affected by supply shortages impacting our ability to obtain inventory, manufacture and deliver products and services to our customers. We continue to see global supply chain tightness
from key suppliers that are constraining our ability to fully deliver and meet demand. We do not expect this global supply chain tightness to alleviate in the near term.
We have taken actions with respect to how we operate our business to ensure we comply with government restrictions and guidelines as well as best practices to protect the health and well-being of our employees. Internally, since mid-March and subject to certain exceptions relating to employees that require specialized equipment for the development and testing of products, our employees have been working from home. We have been able to operate our business effectively without major interruptions. We have also taken measures to reduce our operating expenditures through initiatives such as deferring salary increases and curtailing discretionary spending.
The COVID-19 pandemic continues to rapidly evolve, and we will continue to monitor the effects of COVID-19 on our business in all regions that we serve. The extent to which COVID-19 may impact our business will depend on future developments, which are highly uncertain and cannot be predicted with confidence, such as the geographic spread of the disease, the duration of the outbreak, business closures or business disruptions, public health restrictions on travel and in-person interactions, and the effectiveness of action to contain and treat the disease in the United States, Europe and the Asia-Pacific region. We cannot presently predict with accuracy the duration, scope and severity of any potential business closures or disruptions, or the overall effects of COVID-19 on our business over time. Continued shutdowns or other business interruptions could result in material and negative effects on our ability to conduct our business in the manner and on the timelines presently planned, which could have a material adverse impact on our business, results of operation, and financial condition. See "Risk Factors - Our business, financial condition and results of operations have been and will continue to be adversely affected by the recent COVID-19 outbreak.” in our 2020 Annual Information Form.
For 2020 and 2019, we operated our business under two reportable segments (i) IoT Solutions and (ii) Embedded Broadband:
IoT Solutions
Our IoT Solutions segment is focused on end-to-end IoT solutions that include recurring connectivity services, cellular modules and gateways, and a cloud platform targeted primarily at enterprises and OEMs in the IoT space. Our primary focus is on three key markets: (i) Industrial Edge for manufacturing asset monitoring; (ii) Mobile Edge for mobile asset tracking; and (iii) Infrastructure Edge for commercial infrastructure and building monitoring. We believe the IoT opportunities we are focusing on have a high potential to generate recurring services to the customer along with our cloud platform, devices and management tools.
In this segment, we provide Device-to-Cloud IoT solutions that include: (i) our global cellular connectivity services, that are subscription-based and include our flexible Smart SIM and core network platforms; (ii) our cloud platform for deploying and managing subscriptions, over-the-air updates, devices and applications; and (iii) our unified data orchestration called Octave to provide enhanced data management from the edge of the network to the cloud.
Our embedded devices in this reporting segment are comprised of IoT embedded cellular wireless modules that include Low Power Wide Area ("LPWA") technologies, third generation ("3G"), and fourth generation ("4G") Long-Term Evolution ("LTE") products. We have launched our 5G cellular embedded modules in Europe and North America. We also have a broad offering of cellular gateways and routers complemented by cloud-based services and software for secure management. We launched our first 5G router this past quarter primarily for the transportation and public safety segments of the market.
Our gateway solutions address a broad range of vertical market applications within the mobility, industrial, and enterprise market segments. Our products are known for their technical capability and high reliability in mission-critical applications. These gateways leverage our expertise in wireless technologies and offer the latest capabilities in LTE networking, including Wi-Fi, Bluetooth, Global Navigation Satellite System ("GNSS") and FirstNet capability. We also provide a cloud platform that includes advanced reporting and analytics.
Embedded Broadband
Our Embedded Broadband segment is comprised of our high-speed cellular embedded modules that are typically used in non-industrial applications, namely Mobile Computing, Enterprise Networking and the Automotive market (the latter is now reported in discontinued operations). The products in this segment are typically high-speed 4G LTE, LTE-Advanced, and 5G cellular modules that are ordered in larger volumes. In this segment, we have limited opportunities to provide connectivity services or IoT solutions to the OEM customer. We have a strong customer base in the Embedded Broadband business and we make it simple for our customers to embed high-speed cellular technologies and manage these devices through our IoT cloud platform.
In the Mobile Computing market, we have secured a number of 5G design wins with existing customers and new customers. The design cycle in the Mobile Computing market is approximately one year. Our portfolio also includes our embedded application framework called Legato, which is an open source, Linux-based platform.
Change in Reportable Segments
During the first quarter of 2021, we revised our reportable segments to better reflect the way the Company manages its business. We reorganized our reportable segments in order to better align our various businesses for future growth and streamline operations. We will classify our operations into the following two reportable segments: IoT Solutions and Enterprise Solutions. Our new IoT Solutions segment will be comprised of our portfolio of cellular modules from LPWA through to high-speed embedded 5G broadband modules with IoT connectivity, solutions and software. The Enterprise Solutions segment will be comprised of our gateways, asset tracking and monitoring business, and our Enterprise connectivity, solutions and software.
Our Mission, Vision and Values
Our Mission is to be the leading IoT solutions provider for companies, combining devices, cloud platforms, software and connectivity to accelerate digital transformation. Our vision is to enable the connected world with intelligent wireless solutions that allows businesses to reimagine their future in the connected world. Our core values are:
•Innovation: We develop intelligent IoT solutions based on superior technology that provides value to our customers.
•Execution: We deliver on our commitments together as a team, and focus on quality and excellence in everything we do.
•Trust: We are responsive and collaborative with our customers to help them grow their businesses.
Our Strategy
The global IoT market is growing significantly and new IoT applications are helping people and organizations to lower operating costs and generate new revenue streams by providing new or evolved value-added services to their customers. An integral factor in the growth of IoT applications is cellular connectivity, which enables the transmission of data from connected devices (things) at the edge, through advanced mobile networks to cloud services such as advanced analytics and enterprise applications. Cellular connectivity supports applications such as connected industrial assets, smart buildings and cities, and the smart electrical grid. There is also a growing need for remote connectivity that supports individuals working from home during the COVID-19 pandemic as well as students who are studying online. There is also increasing demand for reliable mobile connectivity in public transportation networks such as buses and trains, and shared community places. Adoption of IoT solutions is driven by a number of factors, including lower wireless connectivity costs, higher wireless connection speeds, new wireless technologies designed specifically for IoT, lower computational and data storage costs, new tools to simplify application development and higher levels of focus on data analytics, artificial intelligence and machine learning.
We believe these factors will continue to create attractive growth opportunities for the Company going forward. We are widely recognized as an innovation leader in the IoT sector. We are also a leading provider of gateway and router solutions for industrial, enterprise and mobile applications.
We are seeking to leverage our strong position in cellular embedded modules and gateways to grow and enhance our IoT connectivity and services business and accordingly, our corporate strategy is to drive growth and value creation by:
•Solidifying our leadership position in IoT devices;
•Accelerating our IoT connectivity and cloud businesses by growing subscription-based recurring revenue globally; and
•Leveraging our leading position in IoT devices to build and scale our Device-to-Cloud solutions business.
In 2020, we continued to deliver on our corporate strategy through the following:
•Growing adoption of our first embedded cellular modules for the LPWA market;
•Scaling our Smart SIM technology to enable the delivery of highly differentiated connectivity services;
•Growing adoption of our Octave all-in-one, edge-to-cloud data orchestration solution for connecting IoT industrial assets;
•Growing adoption of our Ready-To-Connect technology that equips our wireless cellular modules with out-of-the-box connectivity;
•Securing new recurring revenue wins with Industrial and Enterprise customers primarily in Europe and North America;
•Increasing our total number of IoT connected devices, including our cloud management platform;
•Maturing our relationships with ecosystem partners, including a preferred partnership with Microsoft Azure to collaborate on IoT solutions;
•Continuing to invest in leading edge embedded modules, gateways and routers, including cellular embedded 5G technology;
•Acquired M2M Group in Australia and M2M One in New Zealand to increase our connectivity services in those markets; and
•Divested our auto business to focus resources and attention on growing our core IoT business.
Annual Overview
Key highlights for the year ended December 31, 2020:
Corporate:
•On January 7, 2020, we completed the acquisition of M2M Connectivity Pty Ltd, M2M One Pty Ltd and D-Square Innovation Pty Ltd (collectively, the "M2M Group") in Australia. Total purchase consideration for the acquisition of the M2M Group was $21.1 million, comprised of cash consideration to the shareholders of $19.6 million for 100% of the equity of the M2M Group, plus approximately $1.3 million for the retirement of certain obligations and $0.2 million for normal course working capital adjustments. The purchase consideration was fully paid in 2020. The M2M Group is focused on IoT connectivity services and cellular devices in Australia, and the acquisition expands the Company's IoT Solutions business in the Asia-Pacific region.
•On March 23, 2020, we announced the appointment of Gregory L. Waters to the Company’s Board of Directors. Mr. Waters is an experienced corporate director, CEO and advisor, having led three companies through successful transformations.
•On April 13, 2020, we announced that Samuel Cochrane would join as Chief Financial Officer on May 6, 2020. Mr. Cochrane is an experienced financial executive, most recently serving as a Vice President of Motorola Solutions Inc. (“Motorola”) and before that as the CFO of Avigilon, which was acquired by Motorola in 2018. Mr. Cochrane took over the CFO role from David McLennan, whose planned retirement was announced in December 2019. Mr. McLennan retired on June 30, 2020 upon completion of the transition of the CFO duties to Mr. Cochrane.
•On April 16, 2020, we announced that the Company entered into an agreement with Lion Point Capital, LP ("Lion Point"), an investment firm which controls approximately 6.0% of the Company's total shares outstanding, regarding the membership and composition of the Sierra Wireless Board of Directors (the “Board”) and its committees, as well as certain customary standstill restrictions. Under the terms of the agreement with Lion Point, (i) Mr. Paul C. Cataford and Ms. Joy Chik, stepped down from the Board and two new independent directors, Mr. Jim Anderson and Ms. Karima Bawa, were appointed to the Board on April 16, 2020 and (ii) we agreed to propose and recommend for approval at our annual and special meeting of shareholders (the “Meeting”) a special resolution providing for an increase in the maximum size of the Board from nine (9) to twelve (12) directors (the “Board Expansion Resolution”). Following the approval of the Board Expansion Resolution at the Meeting, we announced on May 22, 2020, that the Board of Directors appointed Thomas K. Linton, Martin Mc Court, and Mark Twaalfhoven as independent directors of the Company.
•On May 11, 2020, Steve Harmon joined the Company as Senior Vice President, Americas Sales following six years at Blackberry in senior sales roles. Mr. Harmon is responsible for all sale and delivery activities in the Americas and reports directly to Kent Thexton, President and CEO of Sierra Wireless.
•On November 18, 2020, we announced the completion of the sale of our Shenzhen, China-based automotive embedded module product line to Rolling Wireless as described in the "Business Overview" section above.
•On December 15, 2020, we completed the acquisition of M2M One NZ Ltd ("M2M New Zealand") in New Zealand. Total purchase consideration for the acquisition of M2M New Zealand was $3.7 million, comprised of cash consideration to the shareholders of $3.3 million for 100% of the equity of M2M New Zealand, plus a $0.4 million cash holdback amount to be released to the seller on December 15, 2021, to secure the purchaser's rights of indemnification under the share purchase agreement.
•On January 7, 2021, we announced the appointment of James Armstrong as Senior Vice President and General Manager, Enterprise Solutions to lead Sierra's Enterprise business. Mr. Armstrong reports directly to Kent Thexton, President and CEO of Sierra Wireless. Mr. Armstrong most recently served a Chief Operating Officer and EVP, Products at Spirent Communications Plc.
•On January 21, 2021, we announced the planned retirement of Kent Thexton from his position as President & CEO. Kent has committed to remain with the Company until June 30th to allow his successor to be hired and to support an orderly transition. The Board of Directors have commenced a process to find Kent’s successor and have engaged a top tier executive search firm to undertake a search for his replacement.
IoT Solutions:
•On February 12, 2020, we announced our Ready-to-Connect Series of embedded modules to simplify IoT development, reduce costs, and accelerate time to market. The RC series modules deliver all of the key elements needed for an IoT application - cellular module, integrated SIM that is pre-connected to global mobile networks, IoT management platform, and end-to-end security-in-one integrated bundle.
•On March 11, 2020, Liveable Cities, a division of Canada-based LED Roadway Lighting, selected our LPWA solution to enable smart city applications. Liveable Cities is using our Wireless Ready-to-Connect HL78 modules for its SilQ Luminaire streetlight and the tool-less Sensor Platform ANSI Controller, which can add radar, pollution, and noise sensors to transform any streetlight into a network that provides data to cities to help them reduce pollution and keep citizens safe.
•On June 22, 2020, we announced a new collaboration with New Boundary Technologies, a leading provider of innovative Internet of Things and Machine-to-Machine applications to simplify the development and deployment of IoT applications for industrial OEMs, distributors, and IoT solution providers. New Boundary Technologies' RemoteAwareTM IoT Application Service now integrates with OctaveTM, Sierra's all-in-one edge-to-cloud solution for connecting industrial assets to the cloud.
•On October 19, 2020, we announced the availability of our AirLink MG90 5G platform, the industry's first multi-network 5G vehicle networking solution that provides secure, always-on mobile connectivity for mission-critical public safety, field service and transit applications.
•On November 11, 2020, we announced that our Octave solution has been selected as winner of the "IoT Innovation of the Year" award in the fourth annual Mobile Breakthrough Awards program conducted by Mobile Breakthrough, a leading independent market intelligence organization that recognizes top companies, technologies, and products in the global wireless and mobile market.
•On December 17, 2020, we announced that Thermigas Chauffage Industriel S.A.S. ("Thermigas"), a worldwide leader in decentralized liquid-heating products for industrial processes, is using Octave, the Company's all-in-one edge-to-cloud solution to increase uptime and reduce maintenance costs for industrial water heaters. Using Octave, IoT services and strategy consulting firm Oxelar developed and deployed a preventive maintenance Industrial IoT application for Thermigas in less than two months.
•On January 13, 2021, we announced that LUCI, a hardware and software platform that uses stereo vision, infrared, ultrasonic, and radar to enable power wheelchairs to ‘see’ their environment, was recently named one of Time Magazine’s best inventions of 2020, as well as one of the greatest innovations of 2020 in the Popular Science Best of What’s New 2020 list. LUCI uses the Company’s LPWA solution, including HL7800 modules and Enhanced Carrier Connectivity services, to make power wheelchairs smarter and safer, helping wheelchair users avoid collisions, drop-offs, and falls, and giving them more freedom and independence.
•January 27, 2021, we announced that Virocom has selected our AirLink end-to-end networking solution to enable smart locker applications. Virocom is using Sierra Wireless’ ready-to-connect AirLink LX60 routers and Smart Connectivity Services integrated with its Ascension Cloud portal, to provide connected intelligent cabinets and returns kiosks with 100 percent uptime. Smart lockers are a key tool enabling retailers to provide contactless, 24/7 service options for customers during the COVID-19 pandemic.
Embedded Broadband:
•On February 24, 2020, we announced the an expanded portfolio of mobile broadband embedded modules for mobile computing, routers, gateways, industrial automation, and new IoT applications, such as robotics, drones and private networks. Sierra's first-to-market 5G EM919x and 4G LTE Cat-20 EM769x embedded modules are sampling to OEMs and system integrators requiring secure connectivity and the highest possible speeds to deploy cellular on their mobile computing, networking, and IoT platforms worldwide.
•On August 19, 2020, we announced commercial availability of our first-to-market EM919x 5G NR Sub-6 GHz and mmWave embedded modules that will enable OEMs to deploy secure connectivity worldwide at the highest possible speeds with ultra-low latency for mobile computing, routers, gateways, industrial automation, and many new Industrial IoT applications.
CONSOLIDATED ANNUAL RESULTS OF OPERATIONS
The following table sets forth our consolidated statements of operations for the years ended December 31, 2020, 2019 and 2018.
| | | | | | | | | | | | | | | | | | | | | | | | | | |
| (In thousands of U.S. dollars, except where otherwise stated) | | 2020 | | | 2019 | | | 2018 |
| Revenue | | | | | | | | |
| IoT Solutions | | 327,323 | | | | 377,808 | | | | 373,937 | |
| Embedded Broadband | | 121,265 | | | | 169,468 | | | | 262,232 | |
| | 448,588 | | | | 547,276 | | | | 636,169 | |
| Cost of sales | | | | | | | | |
| IoT Solutions | | 205,419 | | | | 237,650 | | | | 234,335 | |
| Embedded Broadband | | 84,418 | | | | 112,140 | | | | 165,809 | |
| | 289,837 | | | | 349,790 | | | | 400,144 | |
| Gross margin | | 158,751 | | | | 197,486 | | | | 236,025 | |
| Gross margin % | | 35.4 | % | | | 36.1 | % | | | 37.1 | % |
| Expenses | | | | | | | | |
| Sales and marketing | | 86,481 | | | | 87,185 | | | | 82,687 | |
| Research and development | | 82,029 | | | | 78,761 | | | | 82,032 | |
| Administration | | 48,513 | | | | 47,127 | | | | 59,696 | |
| Restructuring | | 8,740 | | | | 26,262 | | | | 6,844 | |
| Acquisition-related and integration | | 440 | | | | 974 | | | | 3,962 | |
| Impairment | | — | | | | 877 | | | | — | |
| Loss on disposal of iTank business | | — | | | | — | | | | 2,064 | |
| Amortization | | 20,584 | | | | 20,554 | | | | 25,780 | |
| | | 246,787 | | | | 261,740 | | | | 263,065 | |
| Loss from operations | | (88,036) | | | | (64,254) | | | | (27,040) | |
| Foreign exchange gain (loss) | | 8,003 | | | | (1,224) | | | | (5,345) | |
| Other income (expense) | | (2,027) | | | | (307) | | | | 46 | |
| Loss before income taxes | | (82,060) | | | | (65,785) | | | | (32,339) | |
| Income tax expense (recovery) | | (11,909) | | | | 8,878 | | | | (1,739) | |
| Net loss from continuing operations | | (70,151) | | | | (74,663) | | | | (30,600) | |
| Net earnings from discontinued operations | | 20,810 | | | | 4,125 | | | | 5,990 | |
| Net loss | | (49,341) | | | | (70,538) | | | | (24,610) | |
| Basic and diluted net earnings (loss) per share (in dollars) | | | | | | | | |
| Continuing operations | | $ | (1.93) | | | | $ | (2.06) | | | | $ | (0.85) | |
| Discontinued operations | | 0.57 | | | | 0.11 | | | | 0.17 | |
| | $ | (1.36) | | | | $ | (1.95) | | | | $ | (0.68) | |
Weighted average number of shares of shares (in thousands)
- basic and diluted | | 36,393 | | | | 36,166 | | | | 36,019 | |
| Product revenue | | 332,544 | | | | 449,063 | | | | 541,702 | |
| Recurring and other services revenue | | 116,044 | | | | 98,213 | | | | 94,467 | |
Non-GAAP Financial Measures(1): | | | | | | | | |
| Adjusted EBITDA | | (34,930) | | | | 9,833 | | | | 44,266 | |
| Adjusted earnings (loss) from continuing operations | | (50,967) | | | | (6,047) | | | | 26,109 | |
| Basic and diluted adjusted earnings (loss) per share from continuing operations (in dollars) | | $ | (1.40) | | | | $ | (0.17) | | | | $ | 0.72 | |
(1) Refer to the section titled “Non-GAAP Financial Measures” for reconciliations to the applicable U.S. GAAP financial measures.
DISCUSSION OF CONSOLIDATED ANNUAL RESULTS OF OPERATIONS
Results of operations described below exclude operating results of our Automotive Business as they are classified as discontinued operations.
Fiscal Year 2020 Compared to Fiscal Year 2019
Revenue
Revenue decreased by $98.7 million, or 18.0%, to $448.6 million in 2020 compared to 2019. This decrease was primarily attributable to reduced revenue from each of our Embedded Broadband and IoT Solutions segments.
| | | | | | | | | | | | | | | | | |
| (In thousands of U.S. dollars, except where otherwise stated) | 2020 | | 2019 |
| $ | % of Revenue | | $ | % of Revenue |
| Product | 332,544 | | 74.1 | % | | 449,063 | | 82.1 | % |
| Recurring and other services | 116,044 | | 25.9 | % | | 98,213 | | 17.9 | % |
| 448,588 | | 100.0 | % | | 547,276 | | 100.0 | % |
| | | | | |
Product revenue decreased by $116.5 million, or 25.9%, to $332.5 million in 2020 compared to 2019. The decrease was primarily due to lower revenue from Enterprise gateway products, Integrated IoT Solutions modules, and mobile computing and networking customers, partially offset by higher LPWA IoT module sales. Recurring and other services revenue increased by $17.8 million, or 18.2%, to $116.0 million in 2020 compared to 2019 driven by growth in connected devices, in particular growth in the offender monitoring segment, and the addition of M2M Group revenue, acquired in January 2020.
For 2020 and 2019, we operated our business under two reportable segments (i) IoT Solutions and (ii) Embedded Broadband:
IoT Solutions Revenue
In 2020 compared to 2019, IoT Solutions segment revenue decreased by $50.5 million, or 13.4%, to $327.3 million due to lower hardware sales in Enterprise gateway products and Integrated IoT Solutions modules as a result of entering the first quarter of 2020 with higher than normal inventory in the distribution channel, impact of COVID-19, competitive pressure in hardware-only segments, and a transition to lower device ASPs with increasing sales of LPWA technologies, partially offset by stronger recurring and other services revenue, and the addition of revenue from the M2M Group.
Embedded Broadband Revenue
Embedded Broadband revenue decreased by $48.2 million, or 28.4%, to $121.3 million, reflecting lower volume in mobile computing and networking sales due to previously communicated design losses of two higher-margin mobile computing customers. The fourth quarter of 2020 is the last period impacted by these design losses.
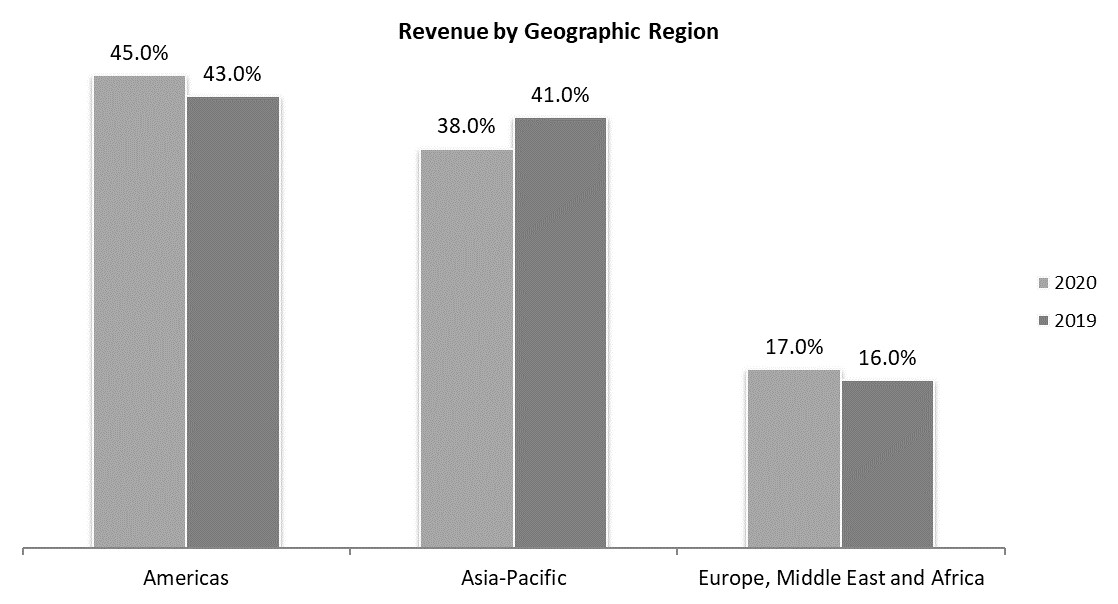
Revenue by Geographical Region
Our geographic revenue mix for the years ended December 31, 2020 and 2019 was as follows:
We sell certain products through resellers, OEMs, and wireless service providers who sell these products to end-users. In 2020, we did not have any customers that accounted for more than 10% of total revenue. In 2019, we had one customer that accounted for 10.2% of total revenue.
Gross margin
Gross margin was 35.4% of revenue in 2020 compared to 36.1% in 2019. In 2020, gross margin was impacted by a less favorable shift in product and customer mix. Embedded Broadband gross margin was 30.4% in 2020 compared to 33.8% in 2019. The decrease in gross margin percentage was due to lower sales of higher-margin percentage mobile computing and networking embedded modules as previously discussed. The fourth quarter of 2020 is the last period impacted by these design losses. Gross margin percentage of 37.2% in our IoT Solutions segment in 2020 was consistent year-over-year.
Gross margin included stock-based compensation expense and related social taxes of $0.3 million and $0.2 million in 2020 and 2019, respectively.
Sales and marketing
Sales and marketing expense decreased by $0.7 million, or 0.8%, to $86.5 million in 2020 compared to 2019, primarily driven by lower travel-related expenses and tradeshows due to COVID-19 restrictions and lower sales commissions, partially offset the addition of expenses from M2M Group.
Sales and marketing expense included stock-based compensation and related social taxes of $5.3 million in 2020 compared to $3.8 million in 2019.
Research and development
Research and development ("R&D") expense increased by $3.3 million, or 4.1%, to $82.0 million in 2020 compared to 2019. This increase was mainly driven by higher investment in R&D resources in 5G projects, development and certification costs, partially offset by contributions from COVID-19 related government subsidies.
R&D expense included stock-based compensation and related social taxes of $4.0 million in 2020 compared to $2.9 million in 2019. R&D expense also included acquisition-related amortization of $0.3 million in each of 2020 and 2019.
Administration
Administration expense increased by $1.4 million, or 2.9%, to $48.5 million in 2020 compared to 2019, primarily due to higher consulting and professional fees mostly related to a now settled lawsuit and costs relating to the divestiture of the Automotive Business.
Administration expense included stock-based compensation and related social taxes of $8.4 million in 2020 compared to $6.0 million in 2019.
Restructuring
Restructuring expense of $8.7 million in 2020 related to our new initiative we announced in the third quarter of 2020 to reduce operating expenses in conjunction with the expected sale of our Automotive Business in the fourth quarter of 2020.
Restructuring expense of $26.3 million in 2019 related to restructuring activities to accelerate our transformation to a Device-to-Cloud IoT solutions company which started in late 2018 and throughout 2019.
Acquisition-related and integration
Acquisition-related and integration costs decreased by $0.5 million, or 54.8%, to $0.4 million in 2020 compared to 2019 as we have substantially completed integration activities of Numerex, partially offset by acquisition-related costs of the M2M Group and M2M New Zealand.
Impairment
We recorded a right-of-use asset impairment of $0.9 million in 2019 related to an office lease in France as we cease to use and then sublease part of the building. No impairment charges were recorded in 2020.
Amortization
Amortization expense of $20.6 million in 2020 is consistent year-over-year. Amortization expense in 2020 included $14.4 million of acquisition-related amortization compared to $14.3 million in 2019.
Foreign exchange gain (loss)
Foreign exchange gain was $8.0 million in 2020 compared to foreign exchange loss of $1.2 million in 2019. The foreign exchange gain in 2020 was primarily driven by the strengthening of the value of the Euro and the Australian dollar compared to the U.S. dollar.
Income tax expense (recovery)
Income tax recovery was $11.9 million in 2020 compared to income tax expense of $8.9 million in 2019. In 2020, income tax recovery was mainly due to a notional income tax recovery (corresponding notional income tax expense recorded under discontinued operations) as a result of the sale of our Automotive Business and a tax recovery of $3.0 million under the Coronavirus Aid, Relief, and Economic Security (CARES) Act. In 2019, income tax expense was mainly due to a decrease in the realizability of tax assets.
Net loss from continuing operations
Net loss from continuing operations was $70.2 million in 2020 compared to $74.7 million in 2019. The decrease was primarily attributable to lower restructuring expense, tax recovery, and more favorable foreign exchange movement, partially offset by lower gross margin and higher R&D expense.
Net loss from continuing operations in 2020 included stock-based compensation expense and related social taxes of $18.0 million and acquisition related amortization of $14.6 million, respectively. Net loss from continuing operations in 2019 included stock-based compensation expense and related social taxes $12.8 million and acquisition-related amortization of $14.5 million, respectively.
Net earnings from discontinued operations
Net earnings from discontinued operations was $20.8 million in 2020 compared to $4.1 million in 2019. The increase was mainly due to gain on sale of the Automotive Business (net of taxes), higher revenue and gross margin, partially offset by higher operating expenses.
Net earnings from discontinued operations in 2020 included stock based compensation expense and related social taxes of $2.0 million compared to $0.4 million in 2019.
Weighted average number of shares
The weighted average basic and diluted shares outstanding were 36.4 million for the year ended December 31, 2020 and 36.2 million for the year ended December 31, 2019.
The number of shares outstanding was 36.6 million at December 31, 2020, compared to 36.2 million at December 31, 2019.
Fiscal Year 2019 Compared to Fiscal Year 2018
Revenue
Revenue decreased by $88.9 million, or 14.0%, to $547.3 million in 2019 compared to 2018. This decrease was primarily driven by reduced revenue from or Embedded Broadband segment, partially offset by modest growth in our IoT Solutions segment.
| | | | | | | | | | | | | | | | | | | | |
| (In thousands of U.S. dollars, except where otherwise stated) | | 2019 | | 2018 |
| | $ | % of Revenue | | $ | % of Revenue |
| Product | | 449,063 | | 82.1 | % | | 541,702 | | 85.2 | % |
| Recurring and other services | | 98,213 | | 17.9 | % | | 94,467 | | 14.8 | % |
| | 547,276 | | 100.0 | % | | 636,169 | | 100.0 | % |
| | | | | | |
Product revenue decreased by $92.6 million, or 17.1%, in 2019 compared to 2018. The decrease was primarily due to lower revenue from mobile computing and networking customers and lower revenue from 2G/3G Integrated
IoT Solutions modules, offset by higher revenue from Enterprise gateway products. Recurring and other services revenue increased by $3.7 million, or 4.0%, to $98.2 million in 2019 compared to 2018, primarily driven by growth in connected devices.
IoT Solutions Revenue
In 2019, compared to 2018, IoT Solutions segment revenue increased modestly by $3.9 million, or 1.0%, to $377.8 million. This increase was primarily due to strong contributions from our recurring and other services, as well as our Enterprise gateway products, partially offset by lower revenue from 2G/3G Integrated IoT solutions modules.
Embedded Broadband Revenue
Embedded Broadband revenue decreased by $92.8 million, or 35.4%, to $169.5 million, primarily due to lower volume in mobile computing and networking sales due to previously communicated design losses of two higher-margin mobile computing customers.
Our geographic revenue mix for the years ended December 31, 2019 and 2018 was as follows:
In 2019, we had one customer that accounted for 10.2% of total revenue. In 2018, we did not have any customers that accounted for more than 10% of total revenue.
Gross margin
Gross margin was 36.1% of revenue in 2019 compared to 37.1% in 2018. In 2019, gross margin was impacted by a less favorable shift in product and customer mix. Embedded Broadband gross margin was 33.8% in 2019 compared to 36.8% in 2018. The decrease in gross margin percentage was due to lower sales of higher-margin percentage mobile computing and networking embedded module sales from design losses of two higher-margin mobile computing customers. Gross margin percentage of 37.1% in our IoT Solutions segment in 2019 was consistent year-over-year.
Gross margin included stock-based compensation expense and related social taxes of $0.2 million and $0.5 million in 2019 and 2018, respectively.
Sales and marketing
Sales and marketing expenses in 2019 increased by $4.5 million, or 5.4%, to $87.2 million compared to 2018, primarily driven by higher investments in our sales force and corporate marketing initiatives to accelerate our transformation to a Device-to-Cloud IoT solutions company.
Sales and marketing expenses include stock-based compensation and related social taxes of $3.8 million in 2019 compared to $2.8 million in 2018.
Research and development
Research and development expenses in 2019 decreased by $3.3 million, or 4.0%, to $78.8 million compared to 2018. This decrease was mainly driven by various cost reduction initiatives we commenced in the fourth quarter of 2018 and through 2019 to accelerate our transformation to a Device-to-Cloud IoT solutions company, combined with lower certification costs and the completion of certain large development projects in 2019.
R&D expenses included stock-based compensation and related social taxes of $2.9 million in 2019 compared to $2.4 million in 2018. R&D expenses also included acquisition-related amortization of $0.3 million in each of 2019 and 2018.
Administration
Administration expenses in 2019 decreased by $12.6 million, or 21.1%, to $47.1 million compared to 2018. Administration expense in 2018 included one-time separation costs related to our former CEO's retirement, including higher stock-based compensation expense in connection with accelerated vesting of equity awards and higher consulting fees.
Administration expenses included stock-based compensation expense and related social taxes of $6.0 million in 2019 compared to $6.8 million in 2018.
Restructuring
In late 2018 and the second quarter of 2019, we commenced various initiatives to accelerate our transformation to a Device-to-Cloud IoT solutions company, including consolidation of our engineering programs and sites, consolidation of product management resources, outsourcing activities of certain general and administrative functions, and certain organizational structure changes. In 2019, we recorded $26.3 million in severance and other related costs associated with these initiatives. In 2018, we recorded $2.0 million in severance and other related costs associated with these initiatives.
In the first quarter of 2018, we commenced various efficiency and effectiveness initiatives focused on capturing synergies related to the integration of Numerex into our business as well as other initiatives designed to produce efficiency gains in other areas of our business. In 2018, we recorded $4.8 million in severance and other related costs associated with this initiative.
Acquisition-related and integration
Acquisition-related and integration costs decreased by $3.0 million, or 75.4%, to $1.0 million in 2019 compared to 2018. The decrease in integration costs reflects lower levels of integration activities for Numerex as we substantially completed the integration in the second quarter of 2019. In the fourth quarter of 2019, we recorded acquisition costs of $0.1 million related to the acquisition of M2M Group which we completed in January 2020.
Impairment
We recorded a right-of-use asset impairment of $0.9 million in 2019 related to an office lease in France as we cease to use and then sublease part of the building. No impairment charges were recorded in 2018.
Loss on disposal
In 2018, we recorded a loss on disposal of $2.1 million from the sale of our remote tank monitoring business, iTank.
Amortization
Amortization expense decreased by $5.2 million, or 20.3%, to $20.6 million in 2019 compared to 2018 due to completion of amortization on certain older acquisition-related intangible assets and other assets. Amortization expense in 2019 included $14.3 million of acquisition-related amortization compared to $18.3 million in 2018.
Foreign exchange gain (loss)
Foreign exchange loss was $1.2 million in 2019 compared to $5.3 million in 2018. Foreign exchange loss decreased in 2019 due to strengthening of the value of the Euro compared to the U.S. dollar in 2018.
Income tax expense (recovery)
Income tax expense was $8.9 million in 2019 compared to a recovery of $1.7 million in 2018 due to changes in the realizability of tax assets in certain jurisdictions.
Net loss from continuing operations
We incurred a net loss from continuing operations of $74.7 million in 2019 compared to $30.6 million in 2018. This increase was primarily attributable to lower revenue and gross margin, higher restructuring expense, and higher income tax expense, partially offset by lower administration and R&D expense.
Net loss in 2019 included stock-based compensation expense and related social taxes of $12.8 million and acquisition-related amortization of $14.5 million. Net earnings in 2018 included stock-based compensation expense and related social taxes of $12.6 million and acquisition-related amortization of $18.6 million.
Net earnings from discontinued operations
Net earnings from discontinued operations was $4.1 million in 2019 compared to $6.0 million in 2018. The decrease was mainly due to lower gross margin, partially offset by lower operating expenses.
Net earnings from discontinued operations included stock based compensation expense and related social taxes of $0.4 million in each of 2019 and 2018.
Weighted average number of shares
The weighted average basic and diluted shares outstanding were 36.2 million for the year ended December 31, 2019 and 36.0 million for the year ended December 31, 2018.
The number of shares outstanding was 36.2 million at December 31, 2019, compared to 36.1 million at December 31, 2018.
SUMMARY OF QUARTERLY CONSOLIDATED RESULTS OF OPERATIONS
The following table highlights selected consolidated financial information for each of the eight most recent quarters that, in management’s opinion, have been prepared on a basis consistent with the audited consolidated financial statements for the year ended December 31, 2020. The selected consolidated financial information presented below reflects all adjustments, consisting primarily of normal recurring adjustments, which are, in the opinion of management, necessary for a fair presentation of results for the interim periods. These results are not necessarily indicative of results for any future period. You should not rely on these results to predict future performance. | | | | | | | | | | | | | | | | | | | | | | | | | | |
| (in thousands of U.S. dollars, except where otherwise stated) | 2020 | 2019 |
| Q4 | Q3 | Q2 | Q1 | Q4 | Q3 | Q2 | Q1 |
| Revenue | 120,478 | | 113,371 | | 111,718 | | 103,021 | | 125,107 | | 136,695 | | 145,665 | | 139,809 | |
| Cost of sales | 77,112 | | 73,919 | | 70,710 | | 68,096 | | 80,347 | | 87,071 | | 92,684 | | 89,688 | |
| Gross margin | 43,366 | | 39,452 | | 41,008 | | 34,925 | | 44,760 | | 49,624 | | 52,981 | | 50,121 | |
| Gross margin % | 36.0 | % | 34.8 | % | 36.7 | % | 33.9 | % | 35.8 | % | 36.3 | % | 36.4 | % | 35.8 | % |
| Expenses | | | | | | | | |
| Sales and marketing | 21,663 | | 20,072 | | 21,192 | | 23,554 | | 21,070 | | 22,286 | | 22,514 | | 21,315 | |
| Research and development | 20,878 | | 17,699 | | 22,065 | | 21,387 | | 20,787 | | 18,796 | | 19,275 | | 19,903 | |
| Administration | 13,402 | | 11,199 | | 12,122 | | 11,790 | | 11,273 | | 11,496 | | 12,388 | | 11,970 | |
| Restructuring | 4,800 | | 3,089 | | 245 | | 606 | | 2,251 | | 4,588 | | 18,083 | | 1,340 | |
| Acquisition-related and integration | 115 | | 140 | | 185 | | — | | 274 | | 291 | | 314 | | 95 | |
| Impairment | — | | — | | — | | — | | 877 | | — | | — | | — | |
| Amortization | 4,829 | | 5,040 | | 5,324 | | 5,391 | | 5,356 | | 5,013 | | 4,954 | | 5,231 | |
| 65,687 | | 57,239 | | 61,133 | | 62,728 | | 61,888 | | 62,470 | | 77,528 | | 59,854 | |
| Loss from operations | (22,321) | | (17,787) | | (20,125) | | (27,803) | | (17,128) | | (12,846) | | (24,547) | | (9,733) | |
| Foreign exchange gain (loss) | 3,734 | | 3,659 | | 3,544 | | (2,934) | | 1,661 | | (2,929) | | 851 | | (807) | |
| Other income (expense) | (564) | | (988) | | (283) | | (192) | | (111) | | (122) | | (105) | | 31 | |
| Loss before income tax | (19,151) | | (15,116) | | (16,864) | | (30,929) | | (15,578) | | (15,897) | | (23,801) | | (10,509) | |
| Income tax expense (recovery) | (7,984) | | (633) | | 427 | | (3,719) | | (262) | | 3,864 | | 5,160 | | 116 | |
| Net loss from continuing operations | (11,167) | | (14,483) | | (17,291) | | (27,210) | | (15,316) | | (19,761) | | (28,961) | | (10,625) | |
| Net earnings (loss) from discontinued operations | 12,123 | | 2,456 | | 1,684 | | 4,547 | | 4,398 | | (460) | | 785 | | (598) | |
| Net earnings (loss) | 956 | | (12,027) | | (15,607) | | (22,663) | | (10,918) | | (20,221) | | (28,176) | | (11,223) | |
| Basic and diluted net earnings (loss) per share (in dollars) | | | | | | | | |
| Continuing operations | $ | (0.31) | | $ | (0.40) | | $ | (0.48) | | $ | (0.75) | | $ | (0.42) | | $ | (0.55) | | $ | (0.80) | | $ | (0.29) | |
| Discontinued operations | 0.33 | | 0.07 | | 0.05 | | 0.13 | | 0.12 | | (0.01) | | 0.02 | | (0.02) | |
| $ | 0.03 | | $ | (0.33) | | $ | (0.43) | | $ | (0.62) | | $ | (0.30) | | $ | (0.56) | | $ | (0.78) | | $ | (0.31) | |
| Weighted average number of shares (in thousands) - basic and diluted | 36,534 | | 36,417 | | 36,341 | | 36,277 | | 36,222 | | 36,179 | | 36,156 | | 36,106 | |
| Product revenue | 87,856 | | 83,560 | | 84,820 | | 76,308 | | 99,024 | | 112,177 | | 120,859 | | 117,003 | |
| Recurring and other services revenue | 32,622 | | 29,811 | | 26,898 | | 26,713 | | 26,083 | | 24,518 | | 24,806 | | 22,806 | |
Non-GAAP Financial Measures(1): | | | | | | | | |
| Adjusted EBITDA | (2,894) | | (7,094) | | (8,734) | | (16,208) | | (3,193) | | 3,532 | | 5,739 | | 3,755 | |
| Adjusted earnings (loss) from continuing operations | (7,006) | | (11,724) | | (13,023) | | (19,214) | | (6,883) | | (289) | | 1,548 | | (423) | |
| Basic and diluted adjusted earnings (loss) per share from continuing operations (in dollars) | $ | (0.19) | | $ | (0.32) | | $ | (0.36) | | $ | (0.53) | | $ | (0.19) | | $ | (0.01) | | $ | 0.04 | | $ | (0.01) | |
| | | | | | | | |
(1) Refer to the section titled “Non-GAAP Financial Measures” for reconciliations to the applicable U.S. GAAP financial measures.
DISCUSSION OF QUARTERLY RESULTS OF OPERATIONS
Fourth Quarter of 2020 Compared to Fourth Quarter of 2019
•Revenue decreased by $4.6 million, or 3.7% to $120.5 million in the fourth quarter of 2020 compared to the fourth quarter of 2019, driven by lower revenues from each of our IoT Solutions and Embedded Broadband segments.
•In the fourth quarter of 2020, compared to the same period of 2019, Embedded Broadband segment revenue decreased by $1.3 million, or 3.8%, due to weaker sales from mobile computing and networking customers. IoT Solutions segment revenue decreased by $3.3 million, or 3.7%, in the fourth quarter of 2020, compared to the same period of 2019 due to lower hardware sales in Enterprise gateway products and Integrated IoT Solutions modules. Within the IoT Solutions segment, recurring and other services revenue was up 25.1% in the fourth quarter of 2020 compared to the same period of 2019 due to growth in connected devices and the addition of the M2M Group in Australia.
•Gross margin was 36.0% in the fourth quarter of 2020 compared to 35.8% in the same period of 2019. The modest increase was driven by changes in product and customer mix in our Embedded Broadband and IoT Solutions segment. IoT Solutions gross margin was 38.5% in the fourth quarter of 2020 compared to 37.0% in the same period of 2019 due to higher volume in connected devices. Embedded Broadband margin was 29.3% in the fourth quarter of 2020 compared to 32.5% in the same period of 2019 due to lower volume in higher-margin percentage mobile computing and networking sales due to previously communicated design losses of two mobile computing customers. The fourth quarter of 2020 is the last period impacted by these design losses.
•Operating expenses were $65.7 million in the fourth quarter of 2020 compared to $61.9 million in the same period of 2019. In the fourth quarter of 2020, we recorded COVID-19 related government grants of $1.0 million.
•Net loss from continuing operations was $11.2 million in the fourth quarter of 2020 compared to $15.3 million in the same period of 2019 due to higher tax recovery and foreign exchange gain, partially offset by higher restructuring and administration expenses.
•Net earnings from discontinued operations was $12.1 million in the fourth quarter of 2020 compared to $4.4 million in the same period of 2019 primarily driven by gain on sale of the Automotive Business, partially offset by higher income tax, higher operating expenses and lower revenue and gross margin.
•Cash and cash equivalents and restricted cash at the end of the fourth quarter of 2020 were $171.4 million, an increase of $99.4 million compared to $72.0 million (including cash held for sale) at the end of the third quarter of 2020. The increase in cash was mainly due to net proceeds from the sale of our Automotive Business, partially offset by repayment of short-term borrowings and long-term debt, acquisition of M2M New Zealand, purchase of treasury shares for RSU distribution and capital expenditures.
Comparison of Quarterly Results of 2020 and 2019
Our quarterly results may fluctuate from quarter-to-quarter, driven by variation in sales volume, product mix, and the combination of variable and fixed operating expenses, as well as from the impact of acquisitions completed in the quarter. The impact of significant items incurred during the first three interim periods of the year ended December 31, 2020 are discussed in more detail and disclosed in our quarterly reports and management’s discussion and analysis. Certain of the factors that affected our quarterly results are listed below.
•In the fourth quarter of 2020, net earnings was $1.0 million compared to net loss of $12.0 million in the third quarter of 2020, primarily driven by gain on sale of the Automotive Business, higher revenue and gross margin, higher income tax recovery, partially offset by higher operating expenses and restructuring costs.
•In the third quarter of 2020, net loss was $12.0 million compared to net loss of $15.6 million in the second quarter of 2020, primarily driven by lower operating expenses due to contributions from COVD-19 government subsidies, partially offset by higher restructuring costs.
•In the second quarter of 2020, net loss was $15.6 million compared to $22.7 million in the first quarter of 2020, primarily attributable to higher revenue and gross margin, foreign exchange gain, lower sales and marketing costs, partially offset by higher income tax expense.
•In the first quarter of 2020, net loss was $22.7 million compared to net loss of $10.9 million in the fourth quarter of 2019, mainly due to a lower revenue and gross margin, higher sales and marketing costs, higher foreign exchange loss, partially offset by higher income tax recovery and lower restructuring costs.
•In the fourth quarter of 2019, net loss was $10.9 million compared to $20.2 million in the third quarter of 2019 due to lower income tax expense and more favorable foreign exchange movement, partially offset by lower revenue and gross margin.
•In the third quarter of 2019, net loss was $20.2 million compared to $28.2 million in the second quarter of 2019, primarily driven by lower restructuring costs, administration expense and income tax expenses, partially offset by unfavorable foreign exchange loss.
•In the second quarter of 2019, net loss was $28.2 million compared to $11.2 million in the first quarter of 2019, mainly due to higher restructuring costs related to the consolidation of our engineering programs and sites, outsourcing activities, and other organizational changes we implemented in late 2018 and higher income tax expense, partially offset by higher revenue and gross margins.
•In the first quarter of 2019, net loss was $11.2 million compared to $3.8 million in the fourth quarter of 2018, primarily due to lower revenue and gross margins, higher tax expense, partially offset by the absence of loss on disposal of iTank business, lower administration, restructuring, and foreign exchange loss.
LIQUIDITY AND CAPITAL RESOURCES
Selected Consolidated Financial Information:
The following table and discussion includes cash flows from continuing and discontinued operations.
| | | | | | | | | | | |
| (in thousands of U.S. dollars) | 2020 | 2019 | 2018 |
| Cash flows provided by (used in): | | | |
| Operating activities | $ | (7,767) | | $ | 6,862 | | $ | 47,230 | |
| Investing activities | 100,603 | | (16,372) | | (16,006) | |
| Financing activities | (2,773) | | (1,662) | | (5,927) | |
| | | |
Free Cash Flow (1) | $ | (29,742) | | $ | (13,411) | | $ | 26,131 | |
| | | |
(1) See section titled "Non-GAAP Financial Measures" for a reconciliation to the applicable U.S. GAAP financial measure.
Operating Activities
Cash used in operating activities increased by $14.6 million to $7.8 million in 2020 compared to 2019. Cash used in operating activities before changes in non-cash working capital increased by $21.6 million to $34.1 million in 2020 compared to 2019. Changes in non-cash working capital between 2020 and 2019 had a positive impact of $7.0 million. Non-cash working capital was impacted by a reduction in inventory and prepaids and an increase in accounts payable and accrued liabilities.
Investing Activities
Cash provided by investing activities increased by $117.0 million to $100.6 million in 2020 compared to 2019. In 2020, we received $144.2 million proceeds, net of cash, from the sale of our Automotive Business, which was partially offset by the acquisitions of the M2M Group of $18.4 million and M2M New Zealand of $3.5 million (both net of cash acquired).
Capital expenditures of $22.0 million in 2020 were primarily for R&D equipment, networking and monitoring equipment, including replacement of certain equipment that was sold in the sale of our Automotive Business, while cash used for intangible assets was primarily for capitalized software costs.
Financing Activities
Net cash used in financing activities increased by $1.1 million to $2.8 million in 2020 compared to 2019, mainly due to higher purchase of treasury shares for Restricted Share Unit ("RSU") distribution and higher taxes paid related to net settlement of equity awards, partly offset by higher proceeds received from stock option exercises.
Free Cash Flow
Free cash flow is defined and calculated under "Non-GAAP Financial Measures" section below.
Free cash flow in 2020 decreased by $16.3 million compared to 2019, mainly as a result of the increase in cash used in operating activities discussed previously.
Cash Requirements
Our near-term cash requirements are primarily related to funding our operations, including restructuring expenditures, inventory and other working capital items, capital expenditures, and other obligations. Cash will be used for share purchases to settle certain restricted share units distribution and may also be used to finance acquisitions of businesses in line with our strategy. As at November 18, 2020, we reclassified $55.7 million of working capital relating to the Automotive Business to assets/liabilities held for sale and transferred the amount to Rolling Wireless upon closing of the Sale Transaction. In light of the current COVID-19 environment, we have taken actions to manage our cash flow by limiting hiring to key replacements and selected investment areas as well as exercising general austerity measures. As at December 31, 2020, our credit facility with CIBC had a credit limit of $50 million as discussed below. On February 17, 2021 we further amended our credit facility with CIBC. See "Credit Facilities" below for details.
We continue to believe our cash and cash equivalents balance of $160.6 million plus the $10.0 million escrow included in restricted cash as at December 31, 2020, combined with undrawn availability under our Amended Revolving Facility (as defined below) and receivable purchase facility, will be sufficient to fund our expected working capital, purchases of shares for future RSU settlement, capital expenditure, restructuring, and acquisition requirements for at least the next twelve months based on current business plans. Total market RSUs outstanding as at December 31, 2020 was 2,614,135, vesting 13% in 2021, 64% in 2022 and 23% in 2023.
However, we cannot be certain that our actual cash requirements will not be greater than we currently expect. In addition, our ability to achieve our business and cash generation plans is based on a number of assumptions which involve significant judgment and estimates of future performance, our ability to realize the anticipated benefits of the Sale Transaction, borrowing capacity and credit availability which cannot at all times be assured. See "Cautionary Note Regarding Forward-Looking Statements".
The following table presents the aggregate amount of future cash outflows for contractual obligations as of December 31, 2020.
| | | | | | | | | | | | | | | | | | | | | | | |
Payments due by period
(in thousands of U.S. dollars) | Total | 2021 | 2022 | 2023 | 2024 | 2025 | Thereafter |
| Operating lease obligations | $ | 27,224 | | $ | 7,447 | | $ | 2,063 | | $ | 3,190 | | $ | 2,268 | | $ | 2,002 | | $ | 10,254 | |
| Finance lease obligations | 210 | | 181 | | 14 | | 14 | | 1 | | | |
Purchase obligations - Contract Manufacturers(1) | 93,865 | | 93,865 | | — | | — | | — | | — | | — | |
Purchase obligations - Mobile Network Operators (2) | 2,836 | | 2,365 | | 471 | | — | | — | | — | | — | |
Purchase obligation - Cloud Computing Service (3) | 2,478 | | 1,749 | | 729 | | — | | — | | — | | — | |
| Other long-term liabilities | 421 | | 13 | | 408 | | — | | — | | — | | — | |
| Total | $ | 127,034 | | $ | 105,620 | | $ | 3,685 | | $ | 3,204 | | $ | 2,269 | | $ | 2,002 | | $ | 10,254 | |
| | | | | | | |
(1) Purchase obligations represent obligations with certain contract manufacturers and suppliers to buy a minimum amount of designated products between January 2021 and June 2021. In certain of these arrangements, we may be required to acquire and pay for such products up to the prescribed minimum or forecasted purchases.
(2) Purchase obligations represent obligations with certain mobile network operators to purchase a minimum amount of wireless data and wireless data services between January 2021 and October 2022.
(3) Purchase obligation represents obligation with a supplier to purchase a minimum amount of cloud computing services between January 2021 and May 2022.
Capital Resources
The source of funds for our future capital expenditures and commitments includes cash, cash from operations, and borrowings under our credit facilities. | | | | | | | | | | | | | | | | | | | | | | | | | | | | | | | | | |
| | 2020 | | | 2019 |
| (in thousands of U.S. dollars) | | Dec 31 | Sep 30 | Jun 30 | Mar 31 | | | Dec 31 | Sep 30 | Jun 30 | Mar 31 |
| Cash and cash equivalents | | $ | 160,560 | | $ | 68,943 | | $ | 60,111 | | $ | 70,334 | | | | $ | 75,454 | | $ | 86,900 | | $ | 84,769 | | $ | 74,143 | |
| Unused committed revolving credit facility | | 50,000 | | 25,000 | | 35,000 | | 5,000 | | | | 30,000 | | 30,000 | | 30,000 | | 30,000 | |
| Total | | $ | 210,560 | | $ | 93,943 | | $ | 95,111 | | $ | 75,334 | | | | $ | 105,454 | | $ | 116,900 | | $ | 114,769 | | $ | 104,143 | |
| | | | | | | | | | | |
As at December 31, 2020, we have committed capital expenditures of $5.6 million (Dec 31, 2019 - $5.8 million). Our capital expenditures during the first quarter of 2021 are expected to be primarily for R&D equipment, production equipment, and networking equipment.
As at December 31, 2020, $10.0 million was held in escrow related to the divestiture of the Automotive Business that we recorded in restricted cash and was released on January 8, 2021.
Credit Facilities
On April 30, 2020, we amended the revolving credit agreement (the “Revolving Facility”) with the Canadian Imperial Bank of Commerce (“CIBC”) as sole lender and as Administrative Agent, which increased our total borrowing capacity to $50 million and extended the maturity date to April 30, 2023. The amendments also included revising the availability under the Revolving Facility to be subject to a borrowing base related to eligible accounts receivable and inventory and is the lesser of the facility size or borrowing base. The Revolving Facility is secured by a pledge against substantially all of our assets. The Revolving Facility will be used for general corporate purposes, including, but not limited to, capital expenditures, working capital requirements and/or certain acquisitions permitted under the Revolving Facility. Borrowings under the Revolving Facility may bear interest at US Base Rate or LIBOR plus applicable margin. The Revolving Facility contains a financial covenant that requires
the Company to be below a maximum total leverage ratio. As at December 31, 2020, there were no outstanding borrowings under the Revolving Facility (2019 — nil). In 2020, we recorded interest expense of $578 (2019-nil).
On July 22, 2020, we amended the Revolving Facility and added a $12.5 million Canadian dollar term loan facility (the “Loan”) with CIBC. The Loan is backed by the Government of Canada under the Business Credit Availability Program (“BCAP”); specifically, 80% of the principal of the Loan is guaranteed by the Business Development Bank of Canada (“BDC”). The Loan bears interest at CIBC’s Prime Lending rate or Bankers Acceptance rate plus applicable margin. Repayment is interest only for the first 12 months, followed by regular quarterly payments of principal based on a ten-year amortization schedule plus interest. The outstanding amount owing plus accrued interest and fees are repayable on the maturity date, July 22, 2025. Under the terms of the BCAP, the proceeds must be used to finance operations, may not be used to refinance existing debt obligations, pay dividends or other distributions to shareholders, make shareholder contributions or shareholder loans, buy back shares, and includes certain restrictions on executive compensation payouts. During 2020, we borrowed and fully repaid $9.4 million (Cdn $12.5 million) under the Loan. In 2020, we recorded interest expense of $161 (2019 - nil).
On February 17, 2021, we entered into an additional amending agreement to the revolving credit agreement (the “Amended Revolving Facility”) with CIBC as sole lender and as Administrative Agent to rightsize the facility following the sale of the Automotive Business. We reduced the total borrowing capacity under the Revolving Facility to $30 million from $50 million. The Revolving Facility will be used for general corporate purposes, including, but not limited to, capital expenditures, working capital requirements and/or certain acquisitions permitted under the Revolving Facility. Borrowings under the Revolving Facility may bear interest at US Base Rate or LIBOR plus applicable margin. Availability under the Amended Revolving Facility is no longer subject to a borrowing base. The Amended Revolving Facility contains customary affirmative, negative, and financial covenants.
We have access to a standby letter of credit facility of $1.5 million from Toronto Dominion Bank. The credit facility is used for the issuance of letters of credit and guarantees and is guaranteed by Export Development Canada. As of December 31, 2020, letters of credit issued against the revolving standby letter of credit facility were for a total value of $1.4 million (2019 — $0.1 million).
Accounts Receivables Purchase Agreement
We have an uncommitted Receivables Purchase Agreement (the “RPA”) with CIBC, as purchaser, to improve our liquidity during high working capital periods. Under the RPA, the Company may offer to sell certain eligible accounts receivable (the “Receivables”) to CIBC, which may accept such offer, and purchase the offered Receivables. Under the RPA, up to $75.0 million of Receivables may be sold and remain outstanding at any time. Receivables are sold at 100% face value less discount with a 10% limited recourse to us arising from certain repurchase events. The RPA is on an uncommitted basis with no expiry date and carries a discount rate of Canadian Dollar Offered Rate (CDOR) for purchased Receivables in Canadian dollars and London Inter-Bank Offered Rate (LIBOR) for purchased Receivables in U.S. dollars, plus an applicable margin. After the sale, we do not retain any interests in the Receivables, but continue to service and collect, in an administrative capacity, the outstanding Receivables on behalf of CIBC.
We account for the sold Receivables as a sale in accordance with Financial Accounting Standards Board ("FASB") ASC 860, Transfers and Servicing. Proceeds from the sale reflect the face value of the Receivables less discount fees charged by CIBC and one-time legal costs and are classified under operating activities in the consolidated statements of cash flows.
Pursuant to the RPA, the Company sold and de-recognized $163.4 million Receivables in 2020 (2019 - $86.9 million). As at December 31, 2020, $19.4 million remained outstanding to be collected from customers and remitted to CIBC (2019 - $18.2 million). Discount fees of $0.4 million for 2020 are included in Other expense in the consolidated statements of operations (2019 - discount fees and administration expense of $0.5 million). As at December 31, 2020, we collected $0.8 million from Receivables that we previously sold and that have not been
remitted to CIBC due to timing of settlement dates. We recorded the amount in Restricted cash in the consolidated balance sheets with a corresponding increase in accrued liabilities (2019 - $3.4 million).
NON-GAAP FINANCIAL MEASURES
Our consolidated financial statements are prepared in accordance with U.S. GAAP on a basis consistent for all periods presented. In addition to results reported in accordance with U.S. GAAP, we use non-GAAP financial measures as supplemental indicators of our operating performance. The term “non-GAAP financial measure” is used to refer to a numerical measure of a company’s historical or future financial performance, financial position or cash flows that: (i) excludes amounts, or is subject to adjustments that have the effect of excluding amounts, that are included in the most directly comparable measure calculated and presented in accordance with U.S. GAAP in a company’s statement of earnings, balance sheet or statement of cash flows; or (ii) includes amounts, or is subject to adjustments that have the effect of including amounts, that are excluded from the most directly comparable measure so calculated and presented.
Our non-GAAP financial measures include adjusted net earnings (loss) from continuing operations, adjusted basic and diluted net earnings (loss) per share from continuing operations, adjusted EBITDA (earnings before interest, taxes, depreciation, and amortization), and free cash flow.
Adjusted net earnings (loss) from continuing operations excludes the impact of stock-based compensation expense and related social taxes, phantom RSU expense which represents expenses related to compensation units settled in cash based on the stock price at vesting, restructuring costs, acquisition-related and integration costs, government grants related to COVID-19 relief, impairment, loss on disposal of iTank business, certain other non-recurring costs or recoveries, acquisition-related amortization, the impact of foreign exchange gains or losses on translation of certain balance sheet accounts, foreign exchange gains or losses on forward contracts, and certain tax adjustments.
Adjusted EBITDA from continuing operations is defined as net earnings (loss) from continuing operations plus stock-based compensation expense and related social taxes, phantom RSU expense which represents expenses related to compensation units settled in cash based on the stock price at vesting, restructuring costs, acquisition-related and integration costs, government grants related to COVID-19 relief, impairment, loss on disposal of iTank business, certain other non-recurring costs or recoveries, amortization, interest and other income (expense), foreign exchange gains or losses on translation of certain balance sheet accounts, unrealized foreign exchange gains or losses on forward contracts, and income tax expense (recovery). Adjusted EBITDA is a metric used by investors and analysts for valuation purposes and is an important indicator of our operating performance and our ability to generate liquidity through operating cash flow that will fund future working capital needs and fund future capital expenditures.
Free cash flow is defined as cash flow from operating activities less capital expenditures and increases in intangibles. We believe that disclosure of free cash flow provides a good measure of our ability to internally generate cash that can be used for investment in the business and is an important indicator of our financial strength and performance. We also believe that certain investors and analysts use free cash flow to assess our business.
We use the above-noted non-GAAP financial measures for planning purposes and to allow us to assess the performance of our business before including the impacts of the items noted above as they affect the comparability of our financial results. These non-GAAP measures are reviewed regularly by management and the Board of Directors as part of the ongoing internal assessment of our operating performance.
We disclose these non-GAAP financial measures as we believe they provide useful information to investors and analysts to assist them in their evaluation of our operating results and to assist in comparisons from one period to another. Readers are cautioned that non-GAAP financial measures do not have any standardized meaning
prescribed by U.S. GAAP and therefore may not be comparable to similar measures presented by other companies.
We strongly encourage investors to review our financial information in its entirety and not to rely on a single financial measure. We therefore believe that despite these limitations, it is appropriate to supplement the U.S. GAAP measures with certain non-GAAP measures defined in this section of our MD&A.
The following table(1) provides a reconciliation of the non-GAAP financial measures to U.S. GAAP results for years ended December 31: | | | | | | | | | | | |
| (in thousands of U.S. dollars, except where otherwise stated) | 2020 | 2019 | 2018 |
| | | |
| Net earnings (loss) from continuing operations - GAAP | $ | (70,151) | | $ | (74,663) | | $ | (30,600) | |
| Stock-based compensation and related social taxes | 18,002 | | 12,815 | | 12,559 | |
| Phantom RSU expense | 1,167 | | 210 | | 280 | |
| Restructuring | 8,740 | | 26,262 | | 6,844 | |
| Acquisition-related and integration | 440 | | 974 | | 3,962 | |
| COVID-19 government relief | (7,252) | | — | | — | |
| Impairment | — | | 877 | | — | |
| Loss on disposal of iTank business | — | | — | | 2,064 | |
| Other non-recurring costs | 868 | | 2,903 | | 9,421 | |
| Amortization | 30,633 | | 30,233 | | 36,738 | |
| Interest and other (income) expense, net | 2,027 | | 307 | | (46) | |
| Foreign exchange loss (gain), net of realized gain/loss on hedge contracts | (7,495) | | 1,037 | | 4,783 | |
| Income tax expense (recovery) | (11,909) | | 8,878 | | (1,739) | |
| Adjusted EBITDA | $ | (34,930) | | $ | 9,833 | | $ | 44,266 | |
| | | |
| Net earnings (loss) from continuing operations - GAAP | $ | (70,151) | | $ | (74,663) | | $ | (30,600) | |
| Stock-based compensation and related social taxes | 18,002 | | 12,815 | | 12,559 | |
| Phantom RSU expense | 1,167 | | 210 | | 280 | |
| Restructuring | 8,740 | | 26,262 | | 6,844 | |
| Acquisition-related and integration | 440 | | 974 | | 3,962 | |
| COVID-19 government relief | (7,252) | | — | | — | |
| Impairment | — | | 877 | | — | |
| Loss on disposal of iTank business | — | | — | | 2,064 | |
| Other non-recurring costs | 868 | | 2,903 | | 9,421 | |
| Acquisition-related amortization | 14,636 | | 14,514 | | 18,575 | |
| Foreign exchange loss (gain), net of realized gain/loss on hedge contracts | (7,495) | | 1,037 | | 4,783 | |
| Income tax expense (recovery) adjustment | (9,922) | | 9,024 | | (1,779) | |
| Adjusted earnings (loss) from continuing operations | $ | (50,967) | | $ | (6,047) | | $ | 26,109 | |
| | | |
| Weighted average number of shares (in thousands) - basic and diluted | 36,393 | | 36,166 | | 36,019 | |
| | | |
| Basic and diluted adjusted net earnings (loss) per share from continuing operations (in dollars) | $ | (1.40) | | $ | (0.17) | | $ | 0.72 | |
| | | |
(1) Prior periods have been adjusted to include phantom RSU expense.
The following table(1) provides a quarterly reconciliation of the non-GAAP financial measures to our most directly comparable U.S. GAAP results:
| | | | | | | | | | | | | | | | | | | | | | | | | | | | | |
| (in thousands of U.S. dollars, except where otherwise stated) | 2020 | | 2019 |
| Q4 | Q3 | Q2 | Q1 | | Q4 | Q3 | Q2 | Q1 |
| | | | | | | | | |
| Net earnings (loss) from continuing operations - GAAP | $ | (11,167) | | $ | (14,483) | | $ | (17,291) | | $ | (27,210) | | | $ | (15,316) | | $ | (19,761) | | $ | (28,961) | | $ | (10,625) | |
| Stock-based compensation and related social taxes | 6,461 | | 5,085 | | 3,256 | | 3,200 | | | 1,773 | | 3,763 | | 3,979 | | 3,300 | |
| Phantom RSU expense | 691 | | 261 | | 141 | | 74 | | | 35 | | 55 | | 76 | | 44 | |
| Restructuring | 4,800 | | 3,089 | | 245 | | 606 | | | 2,251 | | 4,588 | | 18,083 | | 1,340 | |
| Acquisition-related and integration | 115 | | 140 | | 185 | | — | | | 274 | | 291 | | 314 | | 95 | |
| COVID-19 government relief | (954) | | (6,298) | | — | | — | | | — | | — | | — | | — | |
| Impairment | — | | — | | — | | — | | | 877 | | — | | — | | — | |
| Other non-recurring costs | 330 | | 299 | | 152 | | 87 | | | 795 | | 279 | | 662 | | 1,167 | |
| Amortization | 7,054 | | 8,030 | | 7,823 | | 7,726 | | | 7,849 | | 7,378 | | 7,355 | | 7,651 | |
| Interest and other (income) expense, net | 564 | | 988 | | 283 | | 192 | | | 111 | | 122 | | 105 | | (31) | |
| Foreign exchange loss (gain), net of realized gain/loss on hedge contracts | (2,804) | | (3,572) | | (3,955) | | 2,836 | | | (1,580) | | 2,953 | | (1,034) | | 698 | |
| Income tax expense (recovery) | (7,984) | | (633) | | 427 | | (3,719) | | | (262) | | 3,864 | | 5,160 | | 116 | |
| Adjusted EBITDA | $ | (2,894) | | $ | (7,094) | | $ | (8,734) | | $ | (16,208) | | | $ | (3,193) | | $ | 3,532 | | $ | 5,739 | | $ | 3,755 | |
| | | | | | | | | |
| Net earnings (loss) from continuing operations - GAAP | $ | (11,167) | | $ | (14,483) | | $ | (17,291) | | $ | (27,210) | | | $ | (15,316) | | $ | (19,761) | | $ | (28,961) | | $ | (10,625) | |
| Stock-based compensation and related social taxes | 6,461 | | 5,085 | | 3,256 | | 3,200 | | | 1,773 | | 3,763 | | 3,979 | | 3,300 | |
| Phantom RSU expense | 691 | | 261 | | 141 | | 74 | | | 35 | | 55 | | 76 | | 44 | |
| Restructuring | 4,800 | | 3,089 | | 245 | | 606 | | | 2,251 | | 4,588 | | 18,083 | | 1,340 | |
| Acquisition-related and integration | 115 | | 140 | | 185 | | — | | | 274 | | 291 | | 314 | | 95 | |
| COVID-19 government relief | (954) | | (6,298) | | — | | — | | | — | | — | | — | | — | |
| Impairment | — | | — | | — | | — | | | 877 | | — | | — | | — | |
| Other non-recurring costs | 330 | | 299 | | 152 | | 87 | | | 795 | | 279 | | 662 | | 1,167 | |
| Acquisition-related amortization | 3,306 | | 3,555 | | 3,886 | | 3,889 | | | 3,593 | | 3,610 | | 3,624 | | 3,687 | |
| Foreign exchange loss (gain), net of realized gain/loss on hedge contracts | (2,804) | | (3,572) | | (3,955) | | 2,836 | | | (1,580) | | 2,953 | | (1,034) | | 698 | |
| Income tax expense (recovery) adjustment | (7,784) | | 200 | | 358 | | (2,696) | | | 415 | | 3,933 | | 4,805 | | (129) | |
| Adjusted earnings (loss) from continuing operations | $ | (7,006) | | $ | (11,724) | | $ | (13,023) | | $ | (19,214) | | | $ | (6,883) | | $ | (289) | | $ | 1,548 | | $ | (423) | |
| | | | | | | | | |
| Weighted average number of shares (in thousands) - basic and diluted | 36,534 | | 36,417 | | 36,341 | | 36,277 | | | 36,222 | | 36,179 | | 36,156 | | 36,106 | |
| | | | | | | | | |
| Basic and diluted adjusted net earnings (loss) per share from continuing operations (in dollars) | $ | (0.19) | | $ | (0.32) | | $ | (0.36) | | $ | (0.53) | | | $ | (0.19) | | $ | (0.01) | | $ | 0.04 | | $ | (0.01) | |
| | | | | | | | | |
(1) Prior periods have been adjusted to include phantom RSU expense.
The following table provides a reconciliation of the non-GAAP free cash flow measure to similar U.S. GAAP terms:
| | | | | | | | | | | |
| (In thousands of U.S. dollars) | 2019 | 2018 | 2017 |
| | | |
| Cash flows from operating activities | $ | (7,767) | | $ | 6,862 | | $ | 47,230 | |
| Capital expenditures and increase in intangible assets | (21,975) | | (20,273) | | (21,099) | |
| Free Cash Flow | $ | (29,742) | | $ | (13,411) | | $ | 26,131 | |
| | | |
OFF-BALANCE SHEET ARRANGEMENTS
We have the RPA in place that allows us to sell, with limited recourse, qualifying Receivables. Details are outlined in the "Liquidity and Capital Resources - Accounts Receivable Purchase Agreement" section above.
TRANSACTIONS BETWEEN RELATED PARTIES
We did not undertake any transactions with related parties during the years ended December 31, 2020 and 2019.
CRITICAL ACCOUNTING POLICIES AND ESTIMATES
We prepare our consolidated financial statements in accordance with U.S. GAAP and we make certain estimates and assumptions that affect the reported amounts of assets, liabilities, revenue, expenses and the related disclosure of contingent liabilities. Note 2, Summary of significant accounting policies, in the December 31, 2020 consolidated financial statements includes a summary of the significant accounting policies used in the preparation of our consolidated financial statements. While all of the significant accounting policies are important to the annual consolidated financial statements, some of these policies may be viewed as involving a high degree of judgment.
On an ongoing basis, we evaluate our estimates and judgments, including those related to business combinations, revenue recognition, valuation of goodwill and intangible assets, income taxes, adequacy of warranty reserve, royalty costs, contingencies, stock-based compensation, and discontinued operations. We base our estimates on historical experience, anticipated results and trends and on various other assumptions that we believe are reasonable under the circumstances. By their nature, estimates are subject to an inherent degree of uncertainty. Actual results could differ materially from our estimates.
The following critical accounting policies require management’s most difficult, subjective and complex judgments, and are subject to measurement uncertainty.
Business combinations
We account for our business combinations using the acquisition method. Under this method, estimates we make to determine the fair values of acquired assets and liabilities assumed include judgments in our determinations of acquired intangible assets and assessment of the fair value of existing property and equipment. Assumed liabilities can include litigation and other contingency reserves existing at the time of the acquisition. Goodwill is recognized as of the acquisition date as the excess of the fair value of consideration transferred over the estimated fair values of net identifiable assets acquired and liabilities assumed at their acquisition date. Acquisition related expenses are separately recognized from business combination and are expensed as incurred.
When establishing fair values, we make significant estimates and assumptions, especially with respect to intangible assets. Intangible assets acquired and recorded by us may include patents, intellectual property, customer relationships, brand, backlog and in-process research and development. Estimates include but are not limited to the forecasting of future cash flows and discount rates. From time to time, we may engage third-party firms to assist us in determining the fair value of assets and liabilities assumed. Our estimates of fair values are
based upon assumptions believed to be reasonable, but which are inherently uncertain and unpredictable. As a result, actual results may differ from estimates impacting our earnings.
Revenue recognition
Product revenue includes sales from embedded cellular modules, short range and GNSS wireless modules, intelligent routers and gateways, asset tracking and vertical market smart devices, antennas and accessories, and Smart SIMs. Recurring and other services revenue includes sales from cloud services, cellular connectivity services, managed connectivity and application services, software licenses, technical support services, extended warranty services, solution design and consulting services.
We recognize revenues when we satisfy performance obligations by transferring the control of promised products or services to customers. Product revenue is recognized at a point in time when a good is shipped or delivered to the customer. Recurring and other services revenue is recognized over time as the service is rendered or at a point in time upon completion of a service. Our customer contracts can include various combinations of products and services, which are generally capable of being distinct and accounted for as separate performance obligations. Revenue is recognized net of allowances for returns and any taxes collected from customers.
Our products are generally highly dependent on, and interrelated with, the underlying firmware and cannot function without the firmware. In these cases, the hardware and the firmware are accounted for as a single performance obligation and revenue is recognized at the point in time when control is transferred to resellers and distributors, OEMs, or directly to end customers.
Certain customers may receive cash-based incentives or credits, which are accounted for as variable consideration. We estimate the amount of incentives or credits to be provided to customers and reduce revenue recognized. The variable consideration is included in the transaction price to the extent that a significant reversal in the amount of cumulative revenue recognized is not expected to occur when the uncertainty associated with the variable consideration is subsequently resolved.
The expected costs associated with assurance-type warranty are recognized as expense when products are sold. Warranty service that is in addition to the assurance that the product complies with agreed upon specifications is a separate performance obligation; its revenue is recognized ratably over the service period.
Cloud and connectivity services are provided on either a subscription or consumption basis. Revenue related to cloud and connectivity services provided on a subscription basis is recognized ratably over the contract period. Revenue related to cloud and connectivity services provided on a consumption basis is recognized based on the customer utilization of such resources. Revenues from SIM activation and initial application setup are deferred and recognized over the estimated customer life on a straight-line basis.
Licenses for on-premise software provide the customer with a right to use the software as it exists when made available to the customer. Revenue from distinct on-premise licenses are recognized upfront at the point in time when the software is made available to the customer. Revenue from software maintenance, unspecified upgrades and technical support contracts are recognized over the period such items are delivered or services are provided. Technical support contracts extending beyond the current period are deferred and revenue is recognized over the applicable earning period.
Revenue from solution design and consulting services are recognized as services are being provided.
Contract acquisition and fulfillment costs
We recognize an asset for the incremental costs of obtaining or fulfilling a contract with a customer if we expect the benefit of those costs to be longer than one year. We have determined that certain sales incentive bonuses and initial setup costs of managed IoT services meet the requirements to be capitalized. We applied a practical
expedient to expense costs as incurred for costs to obtain a contract with a customer when the amortization period would have been one year or less.
The incremental costs of obtaining or fulfilling a contract with a customer are deferred and amortized over the estimated life of the customer relationship. We classify these deferred contract costs as current or non-current based on the timing of when we expect to recognize the expense. The current and non-current portions of deferred contract costs are included in Prepaids and other current assets and Other assets respectively in our consolidated balance sheets.
Significant judgment
We determine the transaction price of a customer contract by multiplying the unit price of a good or service with the committed order volume or service period.
Certain customers may receive cash-based incentives or credits, which are accounted for as variable consideration. We estimate the expected amount to be provided to customers and exclude it from the transaction price. Sales credits are included in Accounts payable and accrued liabilities in our consolidated balance sheets.
Our customer contracts can include various combinations of products and services. When a customer contract includes multiple performance obligations, we allocate the transaction price to each performance obligation on a relative standalone selling price basis. We generally determine standalone selling prices based on the price charged to customers or a combination of expected cost, plus a margin and residual methods.
Product revenue is recognized at a point in time when a good is shipped or delivered to the customer as it represents the transfer of control of the promised good to a customer. Cloud, connectivity, and managed service revenues are recognized over time as the customer simultaneously receives and consumes the benefits provided by our performance as we perform. Other service revenue is recognized at a point in time upon completion of a service.
Contract Balances
Receivables - We recognize a right to consideration as a receivable when only the passage of time is required before payment of that consideration is due.
Contract Assets - We recognize a right to consideration in exchange for goods or service that we have transferred to a customer as contract assets. Contract assets are comprised mainly of accrued revenue related to monthly IoT service subscriptions, which may include connectivity, cloud applications, and managed services. Contract assets are included in Accounts receivable in our consolidated balance sheet.
Deferred Revenue - We recognize an obligation to transfer goods or services to a customer for which we have received consideration from the customer as deferred revenue. Deferred revenue consists of advance payments and billings in excess of revenue recognized, which includes support, extended warranty, cloud application services, and activation fees.
Payment terms and conditions vary by contract type, although terms generally include a requirement of payment within 30 to 60 days.
Goodwill and intangible assets
We performed an annual Goodwill impairment test on October 1, 2020. In addition, goodwill and intangible assets are assessed for impairment whenever circumstances indicate that the carrying value of the goodwill and intangible assets might be impaired. Circumstances may include an adverse change in business climate, legal factors, operating performance indicators, competition or sale or disposition of a significant portion of a reporting
unit. On at least a quarterly basis, we assess whether such circumstances exist. An evaluation of recoverability of goodwill requires judgment, including the identification of reporting units, assigning assets and liabilities to reporting units, assigning goodwill to reporting units, and determining the estimated fair value of each reporting unit. Significant judgments that are required on our part to estimate the fair value of reporting units include estimating future cash flows, determining appropriate discount rates, consideration of appropriate control premium, market conditions, and other assumptions. Changes in these estimates and assumptions could materially affect the determination of fair value for each reporting unit and may result in impairment charges in future periods.
At December 31, 2020, our goodwill balance was $175.5 million. We determined that there was no impairment as the fair values of each of our reporting units exceeded their respective carrying values as at October 1, 2020. Our analysis took into consideration an income valuation approach using the expected discounted cash flows for each reporting unit. The principal factors used in the discounted cash flow analysis were the projected results of operations, the discount rate based on our estimated weighted average cost of capital, and terminal value assumptions for each reporting unit. The discounted cash flow model used was based on our business plan. For years subsequent to those contained in our business plan, we analyzed third party forecasts and other macro-economic indicators that impact our reporting units to provide a reasonable estimate of revenue growth in future periods. Our gross margins and operating expense estimates reflect anticipated changes in our business mix as we transform to incorporate more recurring services in our business mix. We also developed assumptions for the amount of working capital and capital expenditures needed to support each reporting unit.
In addition to the discounted cash flow valuation approach noted above, we reconciled the implied enterprise value from the discounted cash flow analysis to our market capitalization, which was approximately $408 million at October 1, 2020. We then prepared an alternative valuation analysis based on transaction and trading revenue multiples. The analysis confirmed our conclusion that the fair value exceeded the carrying value.
In March 2020, the World Health Organization declared a global pandemic caused by the outbreak of the novel coronavirus specifically identified as COVID-19. It is not possible to reliably estimate the length or severity of these developments and the impact on the financial results of the Company in the future. There are significant uncertainties with respect to future development and impact to the Company related to COVID-19, including the duration, severity and scope of the outbreak and the measures taken by governments and businesses to contain the pandemic. We did not identify any indicators of impairment for the year ended December 31, 2020. The COVID-19 pandemic and its impact on the economy is constantly evolving and presents many variables and contingencies for modeling.
In future periods, the effects of the pandemic may have material impacts on our anticipated revenue levels and the recoverable amount of our reporting units.
Income taxes
We recognize and measure each tax position related to income tax positions taken or expected to be taken in a tax return. We have reviewed our tax positions to determine which should be recognized and measured according to the more likely than not threshold requirement. The tax benefits recognized in the financial statements are measured based on the largest benefit that has a greater than fifty percent likelihood of being realized upon ultimate resolution. If the realization of a tax position is not considered more likely than not, we provide for a valuation allowance. The ultimate realization of our deferred tax assets is dependent upon the generation of future taxable income during the periods in which temporary differences become deductible. We consider projected future taxable income from operations, tax planning strategies and transactions in making our assessment. If our assessment of our ability to realize our deferred tax assets changes, we may make an adjustment to our deferred tax assets that would be charged to income (loss).
We do not provide for taxes on foreign earnings as it is our intention to indefinitely reinvest undistributed earnings of our foreign subsidiaries. It is not practical to estimate the income tax liability that might be incurred if there is a change in management’s intention in the event that a remittance of such earnings occurs in the future.
The ultimate amount of future income taxes and income tax provision could be materially different from those recorded, as it is influenced by our future operating results and our tax interpretations.
Royalty costs
Under certain license agreements we are committed to royalty payments based on the sales of products using certain technologies. We recognize royalty costs as determinable in accordance with agreement terms.
Where agreements are not in place, we recognize our current best estimate of the royalty obligation in cost of goods sold, accrued liabilities and long-term liabilities. We base our estimate on the smallest saleable unit (“SSU”) principle (i.e., the principle that any royalty obligations should be no more than a portion of the profits for a component within the product that implements the patented technology) as the appropriate methodology for determining FRAND standard essential patent (“SEP”) royalties. Using this principle, the royalty accrual on our products is based on the value of the patented technology in the chipset, representing the SSU that implements the technology.
Contingencies
We are from time to time involved in litigation, certain other claims and arbitration matters arising in the ordinary course of our business, including IP matters. We accrue for a liability when it is both probable that a liability has been incurred and the amount of the loss can be reasonably estimated. Significant judgment is required in both the determination of probability and the determination as to whether an amount of a loss is reasonably estimable. These accruals are reviewed at least quarterly and adjusted to reflect the impacts of negotiations, settlements, rulings, advice of legal counsel and technical experts and other information and events pertaining to the particular matter. To the extent there is a reasonable possibility (within the meaning of ASC 450, Contingencies) that the losses could exceed the amounts already accrued, management believes that the amount of any such additional loss would not be material to our results of operations or financial condition.
In some instances, we are unable to reasonably estimate any potential loss or range of loss. The nature and progression of litigation can make it difficult to predict the impact a particular lawsuit will have on the Company. There are many reasons why we cannot make these assessments, including, among others, one or more of the following: in the early stage of a proceeding related to IP matters, the claimant is not required to specifically identify the patent that has allegedly been infringed; damages sought that are unspecified, unsupportable, unexplained or uncertain; discovery not having been started or being incomplete; the complexity of the facts that are in dispute (e.g., once a patent is identified, the analysis of the patent and a comparison to our activities is a labour-intensive and highly technical process); the difficulty of assessing novel claims; the parties not having engaged in any meaningful settlement discussions; the possibility that other parties may share in any ultimate liability; and the often slow pace of patent litigation.
We are required to apply judgment with respect to any potential loss or range of loss in connection with litigation. While we believe we have meritorious defenses to the claims asserted against us in our currently outstanding litigation, and intend to defend ourselves vigorously in all cases, in light of the inherent uncertainties in litigation there can be no assurance that the ultimate resolution of these matters will not significantly exceed the reserves currently accrued by us for those cases for which an estimate can be made. Losses in connection with any litigation for which we are not presently able to reasonable estimate any potential loss or range of loss could be material to our results of operations and financial condition.
Stock-based compensation
We recognize stock-based compensation expense for all stock-based compensation awards based on the fair value at grant date. We recognize stock-based compensation expense on a straight-line basis over the requisite service period of the award and account for forfeitures as they occur.
Determining the appropriate fair value model and calculating the fair value of share-based payment awards requires subjective assumptions. The assumptions used in calculating the fair value of share-based payment awards represent management’s best estimates, but these estimates involve inherent uncertainties and the application of management’s judgment. As a result, if factors change and we use different assumptions, our stock-based compensation expense could be materially different in the future.
Discontinued operations
We report a disposal of a component or a group of components as discontinued operations if the disposal represents a strategic shift that has (or will have) a major effect of the Company's operations and financial results when the components meet the criteria to be classified as held for sale. At the time an operation qualifies for held-for-sale accounting, the operation is evaluated to determine whether or not its carrying amount exceeds its fair value less cost to sell. Any loss as a result of carrying amounts in excess of fair value less cost to sell is recorded in the period the operation qualifies for held-for-sale accounting. Assets, once classified as held for sale, are not subject to depreciation or amortization, and both the assets and any liabilities directly associated with the assets held for sale are classified as current in the Company’s consolidated balance sheets. When a portion of a reporting unit that constitutes a business is disposed of, goodwill associated with that business is included in the carrying amount of the business in determining the gain or loss on disposal. The amount of goodwill is based on the relative fair values of the business to be disposed of and the portion of the reporting unit that will be retained. Management judgment is required to (i) assess the criteria required to qualify for held-for-sale accounting and (ii) estimate fair value. Our Automotive Business is presented as discontinued operations for all periods and as assets or liabilities held for sale for the year ended December 31, 2019. Our consolidated statements of cash flows include discontinued operations. Supplemental cash flow information relating to discontinued operations is disclosed separately in the note disclosure.
OUTSTANDING SHARE DATA
As of March 16, 2021, we had 36,879,903 common shares issued and outstanding, 1,102,364 stock options exercisable into common shares at a weighted average exercise price of $17.91 and 1,055,172 restricted treasury share units (166,204 of which include performance-based vesting at a multiple not to exceed 200%) outstanding that could result in the issuance of up to 1,221,376 common shares.
IMPACT OF ACCOUNTING PRONOUNCEMENTS AFFECTING CURRENT PERIOD
In June 2016, the FASB issued ASU 2016-13, Financial Instruments - Credit Losses, Measurement of Credit Losses on Financial Instruments ("ASC 326"), replacing the incurred loss impairment model that recognizes losses when a probable threshold is met with a requirement to recognize lifetime expected credit losses immediately when a financial asset is originated or purchased. The standard is effective for fiscal years beginning after December 15, 2019, including interim periods within those fiscal years. The new guidance on the current expected credit loss ("CECL") impairment model requires an estimate of expected credit loss, measured over the contractual life of an asset, that considers reasonable and supportable forecasts of future economic conditions in addition to historical experience and current conditions. The objective is to present the entity’s estimate of the net amount expected to be collected on the financial assets. The measurement of expected credit losses under the CECL methodology is applicable to financial assets measured at amortized cost, net investment in leases recognized by lessor and off-balance sheet credit exposures not accounted for as insurance. In addition, ASC 326 made changes to the accounting for available for sale debt securities.
On January 1, 2020, we adopted ASC 326 using the modified retrospective method. Results for reporting periods beginning after January 1, 2020 are presented under ASC 326 while prior period amounts continue to be reported in accordance with previously applicable GAAP. We recorded a net decrease to retained earnings of $779 as of January 1, 2020 for the cumulative effect of adopting ASC 326 as a result of measuring expected credit losses on trade accounts receivable.
In January 2017, FASB issued ASU 2017-04, Intangibles - Goodwill and Other (Topic 350): Simplifying the Test for Goodwill Impairment. This new guidance simplifies the subsequent measurement of goodwill by eliminating Step 2 from the goodwill impairment test. Under the new guidance, entities will perform goodwill impairment tests by comparing fair value of a reporting unit with its carrying amount and recognize an impairment charge for the amount by which the carrying amount exceeds the reporting unit’s fair value. The standard is effective for fiscal years beginning after December 15, 2019 and we adopted this standard on January 1, 2020. The standard did not have any impact on our consolidated statements at adoption.
In February 2016, the FASB issued ASU 2016-02, Leases (Topic 842) and subsequent amendments to the initial guidance: ASU 2017-13, ASU 2018-10, ASU 2018-11, ASU 2018-20 and ASU 2019-01 (collectively, Topic 842). This update is to improve transparency and comparability among organizations by requiring lessees to recognize ROU assets and lease liabilities on the balance sheet and requiring additional disclosure about leasing arrangements. The standard is effective for fiscal years beginning after December 15, 2018. We adopted the standard effective January 1, 2019, applying the optional transition method permitted under ASU 2018-11, which relieves entities from restating comparative financial statements, allowing entities to apply and adopt the new lease standard as at the effective date, rather than as of the first date of the earliest period presented. We elected the package of practical expedients provided under the guidance, which applies to expired or existing leases and allows the Company not to reassess whether a contract contains a lease, the lease classification, and any initial direct costs incurred. We also elected the practical expedient to expense short term leases (12 months or less) on a straight-line basis over the lease term, and to not separate the lease and non-lease components for all of our leases.
Upon adoption of Topic 842 effective January 1, 2019, we recognized operating lease liabilities of $31.5 million and corresponding ROU assets of $27.0 million. The $4.5 million difference between operating lease liabilities and right-of-use assets recognized is due to deferred rent and exit cost accruals recorded under prior lease accounting standards. Topic 842 requires such balances to be reclassified against ROU assets at transition. In future periods such balances will not be presented separately. Our accounting for finance leases remains substantially unchanged.
IMPACT OF ACCOUNTING PRONOUNCEMENTS AFFECTING FUTURE PERIODS
In December 2019, the FASB issued ASU 2019-12 Income Taxes (Topic 740): Simplifying the Accounting for Income Taxes (ASU 2019-12), which simplifies the accounting for income taxes, including the methodology for calculating taxes in an interim period and the recognition of deferred tax liabilities for outside basis differences. ASU 2019-12 is effective for fiscal years beginning after December 15, 2020, including interim periods within those fiscal years. The Company is currently assessing the impact of ASU 2019-12 on its consolidated financial statements and will implement the new standard prospectively starting in the first quarter of 2021.
DISCLOSURE CONTROLS AND PROCEDURES
Our management is responsible for establishing and maintaining adequate disclosure controls and procedures for the Company. Our disclosure controls and procedures are designed to ensure that information required to be disclosed in our reports filed with securities regulatory authorities is recorded, processed, summarized and reported within time periods specified in applicable securities regulations, and is accumulated and communicated to our management, including our Chief Executive Officer and our Chief Financial Officer, as appropriate, to allow timely decisions regarding required disclosure.
We conducted an evaluation of the effectiveness of our disclosure controls and procedures, which was carried out under the supervision of, and with the participation of, our management, including our Chief Executive Officer and our Chief Financial Officer, as of December 31, 2020. Based on that evaluation, our Chief Executive Officer and our Chief Financial Officer have concluded that our disclosure controls and procedures were effective as of December 31, 2020 to ensure that information required to be disclosed by us in the reports we file or submit under applicable securities laws and regulations is recorded, processed, summarized, and reported within the time periods specified thereby.
We do not expect that our disclosure controls and procedures will prevent all errors and all fraud. Control procedures, no matter how well conceived and operated, can provide only reasonable, not absolute, assurance that the objectives of the control procedures are met. Because of the inherent limitations in all control procedures, no evaluation of controls can provide absolute assurance that all control issues and instances of fraud, if any, within our company have been detected. These inherent limitations include the realities that judgments in decision-making can be faulty, and that breakdowns can occur because of simple error or mistake. Additionally, controls can be circumvented by the individual acts of some persons, by collusion of two or more people, or by management override of the control. We considered these limitations during the development of our disclosure controls and procedures and will periodically re-evaluate them to ensure they provide reasonable assurance that such controls and procedures are effective.
INTERNAL CONTROL OVER FINANCIAL REPORTING
Management’s Annual Report on Internal Control over Financial Reporting
Our management is responsible for establishing and maintaining adequate internal control over financial reporting, as such term is defined in Rules 13a-15(f) and 15d-15(f) under the U.S. Securities Exchange Act of 1934 and has designed such internal control over financial reporting to provide reasonable assurance regarding the reliability of financial reporting and the preparation of financial statements for external purposes in accordance with U.S. GAAP.
Our internal control over financial reporting includes those policies and procedures that: (1) pertain to the maintenance of records that, in reasonable detail, accurately and fairly reflect the transactions and dispositions of our assets; (2) provide reasonable assurance that transactions are recorded as necessary to permit preparation of financial statements in accordance with U.S. GAAP, and that our receipts and expenditures are being made only in accordance with authorizations of our management and directors; and (3) provide reasonable assurance regarding prevention or timely detection of unauthorized acquisition, use or disposition of our assets that could have a material effect on the financial statements.
Because of its inherent limitations, internal control over financial reporting may not prevent or detect misstatements on a timely basis. Also, projections of any evaluation of effectiveness of internal control over financial reporting to future periods are subject to the risk that controls may become inadequate because of changes in conditions, or that the degree of compliance with the policies or procedures may deteriorate.
Under the supervision and with the participation of our Chief Executive Officer and our Chief Financial Officer, management conducted an evaluation of the effectiveness of our internal control over financial reporting, as of December 31, 2020, based on the framework set forth in Internal Control-Integrated Framework (2013) issued by the Committee of Sponsoring Organizations of the Treadway Commission ("COSO"). Based on its evaluation under this framework, management concluded that our internal control over financial reporting was effective as of that date.
Ernst & Young LLP ("EY"), an independent registered public accounting firm, who audited and reported on our consolidated financial statements as at and for the year ended December 31, 2020, has issued an attestation report on our internal control over financial reporting as of December 31, 2020. Their attestation report is included with our consolidated financial statements.
There were no changes in our internal control over financial reporting during the year ended December 31, 2020 that materially affected, or are reasonably likely to materially affect, our internal control over financial reporting.
During 2019, we initiated outsourcing of a select group of general and administrative transaction-based activities to a global outsourcing partner. Transition activities commenced in the third quarter of 2019 and were substantially completed in the third quarter of 2020. Management has assessed the impact and concluded that the outsourcing did not materially affect the Company’s internal controls in 2020.
Over the course of fiscal 2020, our employees have transitioned to working from home as the COVID-19 situation has evolved in each jurisdiction. Management has concluded that these work from home arrangements have not materially affected the Company’s internal controls in 2020. Management will continue to assess the impact of COVID-19 on the Company’s internal controls over financial reporting.
FINANCIAL RISK MANAGEMENT
Financial instruments consist primarily of cash and cash equivalents, restricted cash, accounts receivable, derivatives such as foreign currency forward and option contracts, accounts payable and accrued liabilities.
We have exposure to the following business risks:
We maintain substantially all of our cash and cash equivalents with major financial institutions or invest in government instruments. Our deposits with banks may exceed the amount of insurance provided on such deposits.
We outsource manufacturing of our products to third parties and, accordingly, we are dependent upon the development and deployment by third parties of their manufacturing abilities. The inability of any supplier or manufacturer to fulfill our supply requirements could impact future results. We have supply commitments to our contract manufacturers based on our estimates of customer and market demand. Where actual results vary from our estimates, whether due to execution on our part or market conditions, we are at risk.
Financial instruments that potentially subject us to concentrations of credit risk are primarily accounts receivable. We perform on-going credit evaluations of our customer’s financial condition and require letters of credit or other guarantees whenever deemed appropriate.
Although a significant portion of our revenues are in U.S. dollars, we incur operating costs that are denominated in other currencies. Fluctuations in the exchange rates between these currencies could have a material impact on our business, financial condition and results of operations.
To manage our foreign currency risks, we enter into foreign currency forward contracts and options contracts to reduce our exposure to future foreign exchange fluctuations. Foreign currency forward and options contracts are recorded in Accounts receivable or Account payable and accrued liabilities. As at December 31, 2020, we had foreign currency forward contracts totaling $28.8 million Canadian dollars with an average forward rate of 1.3140, maturing between January and December 2021.
We are subject to risks typical of an international business including, but not limited to, differing economic conditions, changes in political climate, differing tax structures other regulations and restrictions and foreign exchange rate volatility. Accordingly, our future results could be materially affected by changes in these or other factors.