United States
Securities and Exchange Commission
Washington, D.C. 20549
Form 10-K
| x | Annual Report Pursuant to Section 13 or 15(d) of the Securities Exchange Act of 1934 |
For the Fiscal Year Ended December 31, 2012
| ¨ | Transition Report Under Section 13 or 15(d) of the Securities Exchange Act of 1934 |
For the transition period from to
Commission File Number: 001-32212
Endeavour International Corporation
(Exact name of registrant as specified in its charter)
| | |
| Nevada | | 88-0448389 |
(State or other jurisdiction of incorporation or organization) | | (I.R.S. Employer Identification No.) |
811 Main Street, Suite 2100, Houston, Texas 77002
(Address of principal executive offices) (Zip Code)
(713) 307-8700
(Registrant’s telephone number, including area code)
Securities registered pursuant to Section 12(b) of the Act:
| | |
Title of Each Class of Stock | | Name of Each Exchange on Which Registered |
| Common Stock - $0.001 par value per share | | New York Stock Exchange |
Securities registered pursuant to Section 12(g) of the Act: None
Indicate by check mark if the registrant is a well-known seasoned issuer as defined in Rule 405 of the Securities Act. ¨ Yes x No
Indicate by check mark if the registrant is not required to file reports pursuant to Section 13 or Section 15(d) of the Act. ¨ Yes x No
Indicate by check mark whether the registrant (1) has filed all reports required to be filed by Section 13 or 15(d) of the Securities Exchange Act of 1934 during the preceding 12 months (or for such shorter period that the registrant was required to file such reports), and (2) has been subject to such filing requirements for the past 90 days. x Yes ¨ No
Indicate by check mark whether the registrant has submitted electronically and posted on its corporate Web site, if any, every Interactive Data File required to be submitted and posted pursuant to Rule 405 of Regulation S-T (§ 232.405 of this chapter) during the preceding 2 months (or for such shorter period that the registrant was required to submit and post such files). x Yes ¨ No
Indicate by check mark if disclosure of delinquent filers pursuant to Item 405 of Regulation S-K (§ 229.405 of this chapter) is not contained herein, and will not be contained, to the best of registrant’s knowledge, in definitive proxy or information statements incorporated by reference in Part III of this Form 10-K or any amendment to this Form 10-K. x
Indicate by check mark whether the registrant is a large accelerated filer, an accelerated filer, a non-accelerated filer, or a smaller reporting company. See definition of “large accelerated filer,” “accelerated filer” and “smaller reporting company” in Rule 12b-2 of the Exchange Act:
| | | | | | |
| Large accelerated filer | | ¨ | | Accelerated filer | | x |
| | | |
| Non-accelerated filer | | ¨ | | Smaller reporting company | | ¨ |
Indicate by check mark whether the registrant is a shell company (as defined in Rule 12b-2 of the Exchange Act). ¨ Yes x No
The aggregate market value of the voting and non-voting common equity held by non-affiliates of the registrant was $364.1 million computed by reference to the closing sale price of the registrant’s common stock on the New York Stock Exchange on June 29, 2012, the last business day of the registrant’s most recently completed second fiscal quarter. Shares of common stock held by executive officers and directors of the registrant are not included in the computation.
As of March 13, 2013, 47.4 million shares of the registrant’s common stock were outstanding.
Documents Incorporated By Reference:
Portions of the registrant’s definitive proxy statement relating to the 2013 Annual Meeting of Stockholders, which will be filed within 120 days of December 31, 2012, are incorporated by reference into Part III of this Annual Report on Form 10-K.
Table of Contents
Quantities of natural gas are expressed in this Annual Report on Form 10-K in terms of thousand cubic feet (“Mcf”) and million cubic feet (“MMcf”). Oil, which includes natural gas liquids, is quantified in terms of barrels (“Bbls”) and thousands of barrels (“Mbbls”). Natural gas is compared to oil in terms of barrels of oil equivalent (“BOE”), thousand barrels of oil equivalent (“MBOE’) or million barrels of oil equivalent (“MMBOE”). One barrel of oil is the approximate energy equivalent of six Mcf of natural gas. This is a physical correlation and does not reflect a value or price relationship between the commodities. With respect to information relating to our working interest in wells or acreage, “net” oil and gas wells or acreage is determined by multiplying gross wells or acreage by our working interest therein. References to number of potential well locations are gross, unless otherwise indicated. References to “GAAP” refer to U.S. generally accepted accounting principles.
Endeavour International Corporation
Part I
Item 1. Business
Unless the context otherwise requires, references to “Endeavour,” the “Company,” “we,” “us” or “our” mean Endeavour International Corporation and its consolidated subsidiaries.
Our Company
Endeavour International Corporation (a Nevada corporation formed in 2000) is an independent oil and gas company engaged in the acquisition, exploration and development of energy reserves and resources in the United Kingdom (“U.K.”) North Sea and United States (“U.S.”) onshore. We began our operations focused on the U.K. and Norwegian sectors of the North Sea. In 2008, we initiated operations in the U.S. and announced our first production there in January 2009. In 2009 we sold our Norwegian operations, utilizing the proceeds to expand our U.S. position in the fourth quarter of 2009 and early 2010, purchasing both producing properties and exploration acreage. Since 2010, our focus has been advancing development projects in the U.K. and completing the acquisition of additional interests in two of our U.K. fields – Bacchus in 2011 and Alba in 2012.
Strategic Alternatives
On February 14, 2013, we announced that our board of directors approved a review of strategic alternatives. The primary objective of the strategic review is to accelerate the deleveraging of the balance sheet and unlock the value of our underlying assets. The Board of Directors will consider a full range of options, including:
| | • | | a sale, joint venture or partnership in respect of our activities in the North Sea; |
| | • | | a sale of specific assets; |
| | • | | a sale or merger of the Company; or |
| | • | | continuing to execute on our operational plan. |
Tudor, Pickering, Holt & Co. and Lambert Energy Advisory Ltd. have been engaged as our financial advisors in this process. We will announce the results of the effort once a course of action is chosen.
Our Areas of Operation
Our operations are organized into two main geographic regions as follows: the U.K. North Sea and U.S. onshore. As of December 31, 2012, our estimated proved reserves were 25.7 MMBOE, up 13% from 22.7 MMBOE as of December 31, 2011, of which approximately 90% were located in the U.K. and approximately 10% were located in the U.S. U.K. proved reserves increased by 10.7 MMBOE from 2011 to 2012; however, this increase was offset by a decrease in U.S. reserves of 7.8 MMBOE, primarily as a result of lower U.S. natural gas prices.
1
Endeavour International Corporation
| | | | | | | | | | | | | | | | |
| | | As of December 31, 2012 | | | Year Ended | |
| | | Estimated Proved
Reserves | | | | | | December 31, 2012 | |
| | | Total
(MMBOE) | | | % Oil | | | % Proved
Developed | | | Average Daily Production
(BOE/d) | |
U.K. North Sea | | | | | | | | | | | | | | | | |
Alba | | | 9.9 | | | | 96 | % | | | 44 | % | | | 3,452 | |
Bacchus | | | 1.9 | | | | 95 | % | | | 57 | % | | | 1,613 | |
Rochelle | | | 9.0 | | | | 17 | % | | | — | | | | — | |
Other fields | | | 2.4 | | | | 65 | % | | | 0 | % | | | 424 | |
| | | | | | | | | | | | | | | | |
Total North Sea | | | 23.2 | | | | 59 | % | | | 25 | % | | | 5,489 | |
U.S. Onshore | | | 2.5 | | �� | | — | | | | 100 | % | | | 2,379 | |
| | | | | | | | | | | | | | | | |
Total | | | 25.7 | | | | 59 | % | | | 32 | % | | | 7,868 | |
| | | | | | | | | | | | | | | | |
U.K. North Sea
The North Sea is a proven resource area where we have a significant development project, producing properties and additional exploration licenses. Although capital and production costs are higher than conventional developments in the U.S., the quality of the oil, the political stability of the region, and the proximity of important markets with strong demand in Western Europe has made the North Sea an important oil and natural gas producing region.
Alba
In May 2012, we acquired an additional 23.43% interest in the Alba field, which increased our total working interest in the field to 25.68%. During 2012, Alba production volumes were impacted by water handling issues. While production volumes are still being impacted, the matter is being dealt with by the operator and it is anticipated that the asset will return to normal production levels during 2013.
Bacchus
At December 31, 2012, we held a 30% working interest in our Bacchus field asset, which is operated by Apache Corporation, who owns a 50% working interest. In April and July 2012, we achieved production from the first and second development wells, respectively, on the Bacchus field. Following completion of the second development well, the Bacchus partners decided to evaluate the positive data gained from the second development well and observe production results before making a final decision on the placement of the third development well to ensure optimization of the entire reservoir. That analysis has been completed and we expect to begin drilling the third well toward the end of the first quarter of 2013.
2
Endeavour International Corporation
Rochelle
Our working interest in the Rochelle area is 44% and we are the operator of the field, which is comprised of Blocks 15/26b, 15/26c and 15/27. During the third quarter of 2012, we began drilling the first of two planned development wells. With drilling delays, the Rochelle project subsea infrastructure outpaced the drilling operations. The joint interest partners decided to suspend the first well due to the inability to perform simultaneous pipe-lay and development drilling operations. In October 2012, the drilling rig moved off location to allow for the hook-up of the pipelines and flow-lines to the subsea manifolds, thereby delaying our estimated start of production from the fourth quarter of 2012 to the first quarter of 2013. Since October 2012, the pipeline system, umbilicals and tie-ins to the offtake solution at the Scott platform have been completed and tested. In January 2013, the rig returned to the East Rochelle site to continue final drilling.
In February 2013, following a severe storm lasting several days, we performed a routine inspection of the conductor, well head and blow out preventer systems which revealed that the cement around the top of the conductor pipe, which anchors the well to the seabed floor, had been lost creating a non- uniform hole around the conductor. The hole extended approximately 4 to 7 feet in diameter and 25 feet in depth.
As a result of this finding, drilling operations were suspended on the East Rochelle well. The work to repair the cementing around the conductor pipe has been completed. We are conducting a thorough analysis to identify the cause of the cement loss and evaluate if there has been any potential fatigue damage to the conductor pipe itself. Our preliminary findings suggest that swirling currents caused by severe storms created vibrations that liquidized the sands surrounding the cement anchorage. With the loss of integrity of the surrounding sands, those sands were eroded, creating the resulting crater. Our investigation is still ongoing. We are also investigating the structural integrity of the conductor pipe to determine if we can safely re-enter the existing well to complete the drilling phase.
To mitigate delays while we conduct our analysis, we moved the rig to the West Rochelle area and commenced drilling of the second production well. By switching to the West Rochelle area, drilling and completion of the second production well may proceed without the delay. If drilling and completion proceed as expected, we anticipate first production from the West Rochelle well could begin in mid-2013 at the earliest.
U.S. Onshore
During 2009, we began acquiring acreage in U.S. onshore resource plays. We believe that our U.S. acreage provides us with development projects with shorter time frames to first production at lower costs than our North Sea assets. Our U.S. activity has targeted reserve and production growth in proven shale gas plays, including the Louisiana Haynesville and Pennsylvania Marcellus areas. We are also targeting emerging oil-prone and liquids-rich plays, including the Montana Heath oil play and our new interests in the Colorado Niobrara area.
3
Endeavour International Corporation
Our strategy for our U.S. operations has been to employ a measured approach that seeks to balance U.S. natural gas prices with drilling costs. We plan to continue this disciplined approach, which includes:
| | • | | using our flexibility to curtail drilling expenditures, where possible, until U.S. natural gas prices and well economics improve; |
| | • | | expanding the existing Marcellus gathering infrastructure at our Daniel field in 2013 and completing up to three gross Marcellus wells which have already been drilled and cased; |
| | • | | drilling only necessary wells in the Haynesville area to maintain acreage positions, and no wells are currently planned in 2013; |
| | • | | leasing and testing new areas that we believe provide liquids-rich potential, such as our Colorado Niobrara acreage; and |
| | • | | a thorough analysis of well results in the Heath Shale oil play in Montana before finalizing any development plans in this exploratory shale oil play. |
Our U.S. operations are spending minimal capital, primarily on strategic positioning, while we monitor U.S. gas prices and await the outcome of our strategic review.
Marcellus Area
We have 31,200 net acres in the Pennsylvania Marcellus area, an increase of 12,800 net acres from December 31, 2011. In October 2012, we completed an exchange with domestic co-venturer, J-W Operating Company (“J-W”), whereby we exchanged our Bull Bayou Haynesville and Willow Springs Cotton Valley properties, a total of approximately 2,100 net acres, for 15,500 net acres of J-W’s upstream and midstream interests in the Pennsylvania Marcellus area. In parallel, we secured a third party gas gathering agreement for the Daniel Project in Cameron County, Pennsylvania. We now operate and control the Marcellus assets while retaining a 50% position in our remaining producing Haynesville acreage.
In addition to ownership of the existing gathering facilities in Cameron County, we have secured additional take-away capacity of up to 10 MMCF/D which will be operational by year-end 2013. We currently have five producing wells and three horizontal wells which have been drilled and are expected to be completed in 2013 once the expanded gathering facilities are operational. No new drilling is required until late 2014 to hold key leasehold acreage in Cameron County.
Haynesville Area
Following the exchange with J-W, we retained our 50% interest in three remaining Haynesville producing project areas in Louisiana totaling approximately 7,450 gross acres and 3,370 net acres. We have working interests in 19 Haynesville Units which are currently held by production with an estimated 80 or more remaining gross locations yet to be developed, depending on ultimate development well spacing. These undeveloped locations are not reflected in the proved reserve report as of year-end 2012 but represent reserve potential for the Company with improved gas prices in the future. No new drilling is currently required in the Haynesville area to maintain our acreage position.
4
Endeavour International Corporation
Heath Shale Oil Play
We have interests in approximately 88,900 net acres in the emerging Heath Shale oil play in Montana, primarily in Rosebud and Garfield Counties. During 2012, we continued to evaluate our four vertical pilot test wells drilled in 2011 and the associated horizontal targets within the Heath Shale and Tyler Formation. We are evaluating offset well results in the surrounding area and will consider that information as we determine our next operational steps, which could include a horizontal reentry of one of our existing pilot wells or some other operation. Until we have completed our evaluation, we do not expect to have significant capital expenditures related our interests in the Heath Shale oil play.
Niobrara Play
During 2012, we acquired leasehold and drilling rights to earn over 23,000 gross acres in the Niobrara play in northwest Colorado which has liquids-rich potential. We have formed a 23,000 acre Federal Unit and plan to drill an initial test well in 2013. We expect to continue building our inventory of prospects in Colorado through leasehold acquisitions and drill-to-earn arrangements.
2013 Planned Expenditures
With the uncertainties around our strategic review, we have not finalized our total capital expenditures budget for 2013. While we perform our strategic review, we are monitoring our capital expenditures and delaying discretionary or other spending where appropriate. Our board of directors has approved a preliminary capital expenditures budget for 2013, that is dependent upon a positive outcome from our strategic review, as follows:
| | |
| | | Preliminary Capital Budget |
United Kingdom: | | |
Drilling and completions | | $90 million to $100 million |
Maintenance capital | | $35 million |
Exploration, seismic and other | | $15 million |
| | |
Total U.K. | | $140 million - $150 million |
| | |
United States | | $30 million to $40 million (*) |
| | |
Total direct oil and gas capital | | $170 million to $190 million |
| | |
| (*) | Primarily discretionary and dependent on the outcome of our strategic review. The U.S. capital expenditures are anticipated to primarily occur in the latter half of 2013. |
In the U.K., the anticipated capital expenditures are primarily to bring the Rochelle development on line, drill the third well at Bacchus and maintain production at Alba. Once the analysis of the East Rochelle well is concluded, we will be able to determine if we can safely re-enter the existing well to complete the drilling phase or should plug and abandon the well and drill a new
5
Endeavour International Corporation
well. The anticipated capital expenditures do not include the capital expenditures to drill a new well at East Rochelle, if it is required. Anticipated exploration expenditures in the U.K. include the drilling of a well at our Centurion prospect, where we hold a 33.3% interest. The exploration well at Centurion represents a firm well commitment that was originally scheduled by the operator to be drilled in 2012 and has been delayed until 2013.
The U.S. anticipated capital expenditures are primarily discretionary and will be re-evaluated once Rochelle production is on-line and after the completion of the strategic review process.
Our 2013 anticipated capital expenditures are also subject to change depending on a number of factors, including the result of our strategic review, the availability and costs of drilling and completion equipment, crews, economic and industry conditions, prevailing and anticipated prices for oil and gas, the availability of sufficient capital resources, drilling success and other normal factors affecting the oil and gas industry.
Decommissioning Expenditures
Production from each of our Ivanhoe, Rob Roy, Hamish (collectively, “IVRRH”), Renee, Rubie and Goldeneye fields has ceased and we have performed minor maintenance and decommissioning activities over the last several years. Previously, we expected to re-develop our IVRRH, Renee and Rubie fields if commercially viable once the development activities at Rochelle are operational. During 2012, we determined that it was no longer practicable to re-develop these fields. As a result, decommissioning work on the fields will be accelerated and we expect to incur approximately $36 million in decommissioning charges during 2013.
For a complete discussion of our available sources of liquidity and our expected financing needs, please see Item 7. “Management’s Discussion and Analysis of Financial Condition and Results of Operations — 2013 Liquidity and Capital Resources.”
Geographical Data
We operate in one industry segment, that being oil and gas exploration and production, in two geographical areas. See Notes 21 and 25 to our consolidated financial statements in “Item 8, Financial Statements and Supplementary Data” for geographic operating segment information, including results of operations and segment assets.
Competition
We encounter intense competition from other oil and gas companies in all areas of our operations, including the acquisition of producing properties and undeveloped acreage. Our competitors include major integrated oil and gas companies, numerous independent oil and gas companies and individuals. Many of our competitors are large, well-established companies with substantially larger operating staffs and greater capital resources and have been engaged in the oil and gas business for a much longer time than our company.
6
Endeavour International Corporation
Petroleum and natural gas producers also compete with other suppliers of energy and fuel to industrial, commercial and individual customers. Competitive conditions may be substantially affected by various forms of energy legislation and/or regulation considered from time to time by the governments and/or agencies thereof and other factors out of our control including, international political conditions, overall levels of supply and demand for oil and gas, and the markets for synthetic fuels and alternative energy sources.
Significant Customers
Our sales in the U.K. are to a limited number of customers, each of which accounted for more than 10% of revenue for the year ended December 31, 2012: Chevron North Sea Ltd and Shell U.K. Limited. Our sales in the U.S. are sold through our arrangements with the operators of the fields, with the majority of the sales being to J-W.
Employees
As of March 8, 2013, we 60 full-time employees and 27 consultants, primarily in the operations area. We believe that we maintain good relationships with our employees, none of whom are covered by a collective bargaining agreement.
Environmental Matters and Regulation
Endeavour was established on a commitment to find and develop energy resources in a manner that protects the health and safety of people and preserves the quality of the environment. Adhering to high performance standards in the areas of health, safety and the environment (“HSE”) is a primary goal of our operations and an integral part in our efforts to end each day “injury and incident free.”
North Sea
Our operations in the U.K. portions of the North Sea are subject to numerous U.K. and European Union (“E.U.”) laws and regulations relating to environmental matters, health and safety. Environmental matters are addressed before oil and gas production activities commence and during the exploration and production activities. Before a U.K. licensing round begins, the Department of Energy and Climate Change (the “DECC”) will consult with various public bodies that have responsibility for the environment. Applicants for production licenses are required to submit a summary of their management systems and how those systems will be applied to the proposed work program. Additionally, the Offshore Petroleum Production and Pipelines (Assessment of Environmental Effects) Regulations 1999 require the Secretary of State to exercise his licensing powers under the U.K. Petroleum Act in such a way to ensure that an environmental assessment is undertaken and considered before consent is given to certain projects.
There are a number of recent and forthcoming rules that may impact our North Sea operations. In response to the apparent blowout of the Deepwater Horizon drilling rig in the Gulf of Mexico in 2010, the DECC has increased rig inspections over the last several years. In addition, more
7
Endeavour International Corporation
rigor has been introduced in the approval process for emergency plans and the provision of financial responsibility for well control contingencies. The E.U. is also proposing to introduce a directive on offshore safety. We expect these measures to continue, or increase, over the near term. Our operations in the North Sea are subject to the European Union’s REACH program, which requires the registration and ultimate phase out of certain hazardous chemicals. Finally, depending on the scale of our operations, our offshore production facilities may be subject to compliance obligations under the E.U. emissions trading system (“E.U. ETS”). Compliance with the above regulations may cause us to incur additional costs in our North Sea operations.
United States
Our U.S. operations are subject to stringent federal, state and local laws and regulations relating to environmental protection, as well as controlling the manner in which various substances, including wastes generated in connection with oil and gas industry operations, are released into the environment. Compliance with these laws and regulations requires the acquisition of permits authorizing air emissions and wastewater discharge from operations and can affect the location or size of wells and facilities, limit or prohibit the extent to which exploration and development may be allowed, and require proper closure of wells and restoration of properties that are being abandoned. Failure to comply with these laws and regulations may result in the assessment of administrative, civil or criminal penalties, imposition of remedial obligations, incurrence of capital costs to comply with governmental standards, and even injunctions that limit or prohibit exploration and production operations or the disposal of substances generated in connection with our operations.
We currently lease a number of properties that for many years have been used for the exploration and production of oil and gas. Although we have utilized operating and disposal practices that were standard in the industry at the time, hydrocarbons or wastes may have been disposed of or released on or under the properties operated or leased by us or on or under other locations where such hydrocarbons or wastes have been taken for recycling or disposal. In addition, many of these properties have been operated by third parties whose treatment and disposal or release of hydrocarbons or wastes was not under our control. These properties and the hydrocarbons and wastes disposed thereon may be subject to laws and regulations imposing joint and several, strict liability, without regard to fault or the legality of the original conduct, that could require us to remove or remediate previously disposed wastes or environmental contamination, or to perform remedial well plugging or pit closure to prevent future contamination.
Hydraulic Fracturing
Hydraulic fracturing is an important and common practice that is used to stimulate production of hydrocarbons, particularly natural gas, from tight formations. We routinely utilize hydraulic fracturing techniques in many of our natural gas well drilling and completion programs. The process involves the injection of water, sand and chemicals under pressure into the formation to fracture the surrounding rock and stimulate production. The process is typically regulated by state oil and gas commissions. However, the United States Environmental Protection Agency (the “EPA”) recently asserted federal regulatory authority over hydraulic fracturing involving diesel additives under the Safe Drinking Water Act’s Underground Injection Control Program.
8
Endeavour International Corporation
While the EPA has yet to take any action to enforce or implement this newly asserted regulatory authority, industry groups have filed suit challenging the EPA’s recent decision. At the same time, the EPA has commenced a study of the potential environmental impacts of hydraulic fracturing activities on water resources. The EPA’s study includes 18 separate research projects addressing topics such as water acquisition, chemical mixing, well injection, flowback and produced water, and wastewater treatment and disposal. The EPA has indicated that it expects to issue its study report in late 2014. Legislation has been introduced before the United States Congress (“Congress”) to provide for federal regulation of hydraulic fracturing and to require disclosure of the chemicals used in the fracturing process. In addition, some states have adopted, and other states are considering adopting, regulations that could impose more stringent permitting, disclosure and well construction requirements on hydraulic fracturing operations. For example, Pennsylvania, Colorado, and Wyoming have each adopted a variety of well construction, set back, and disclosure regulations limiting how fracturing can be performed and requiring various degrees of chemical disclosure. If new laws or regulations that significantly restrict hydraulic fracturing are adopted, such laws could make it more difficult or costly for us to perform fracturing to stimulate production from tight formations. In addition, if hydraulic fracturing becomes regulated at the federal level as a result of federal legislation or regulatory initiatives by the EPA, our fracturing activities could become subject to additional permitting requirements, and also to attendant permitting delays and potential increases in costs. Restrictions on hydraulic fracturing could also reduce the amount of oil and natural gas that we are ultimately able to produce from our reserves.
Climate Change
Globally, our operations may be impacted by various international, national, and local efforts to respond to climate change by controlling greenhouse gas (“GHG”) emissions. With the second commitment period of the Kyoto Protocol — which began on January 1, 2013 — still under negotiation, there is uncertainty as to the precise nature of commitments that will be made by the parties. The Durban Platform, which was recently approved, renews the possibility of a broader global climate agreement entering into force by 2020, but substantial uncertainties regarding the ultimate structure of such an agreement remain. However, any new international agreements and domestic laws to implement them may adversely impact our operations by imposing GHG emission limits on our activities and potentially reducing demand for our products. Within Europe, the European Union has commenced the third phase of the E.U. ETS, running from 2013 to 2020, and therefore our activities in the North Sea are still potentially subject to the impacts of GHG limitations. While allowance prices on the E.U. ETS remain low, the E.U. is currently considering proposals to increase credit prices by deferring the marketability of allowances through backloading. In addition, the U.K. has instituted a carbon floor price that will be effective beginning April 1, 2013. The carbon floor price sets a minimum price for carbon in the U.K. and is administered as a top-up payment levied on U.K.-based generators of fossil-fuel fired electricity when E.U. carbon allowances are below the U.K.’s desired price. Many other countries, including the United States, are weighing a variety of legislative and regulatory strategies that may impose controls on GHG emissions.
9
Endeavour International Corporation
Beginning in 2009, the EPA took a series of steps to begin regulating GHG emissions under the Clean Air Act. As of January 2, 2011, the EPA’s rules impose limitations on GHG emissions from motor vehicles and certain large stationary sources. In addition, the EPA has issued regulations requiring certain sectors to monitor and report their greenhouse gas emissions, and requiring the permitting of certain GHG emissions sources under the New Source Review and Title V programs (which are administered by state or local governments in certain jurisdictions). On January 1, 2011, our exploration and production activities also became subject to the monitoring and reporting requirements, and we will incur costs related to compliance with these regulations.
In addition, Congress has from time to time considered adopting legislation to reduce emissions of greenhouse gases and almost one-half of the states have already taken legal measures to reduce emissions of greenhouse gases primarily through the planned development of greenhouse gas emission inventories and/or regional greenhouse gas cap and trade programs. Most of these cap and trade programs work by requiring major sources of emissions, such as electric power plants, or major producers of fuels, such as refineries and gas processing plants, to acquire and surrender emission allowances. The number of allowances available for purchase is reduced each year in an effort to achieve the overall greenhouse gas emission reduction goal.
The adoption of legislation or regulatory programs to reduce emissions of greenhouse gases in areas where we operate could require us to incur increased operating costs, such as costs to purchase and operate emissions control systems, to acquire emissions allowances or comply with new regulatory or reporting requirements. Any such legislation or regulatory programs could also increase the cost of consuming, and thereby reduce demand for, the oil and natural gas we produce. Consequently, legislation and regulatory programs to reduce emissions of greenhouse gases could have an adverse effect on our business, financial condition and results of operations.
Finally, it should be noted that some scientists have concluded that increasing concentrations of greenhouse gases in the Earth’s atmosphere may produce climate changes that have significant physical effects, such as increased frequency and severity of storms, droughts, and floods and other climatic events. If any such effects were to occur, they could have an adverse effect on our financial condition and results of operations.
We have made, and will continue to make, expenditures in connection with our effort to comply with environmental laws and regulations. We believe that we are in compliance with applicable environmental laws and regulations currently in effect and that continued compliance with existing requirements will not have a material adverse impact on us. However, we also believe that it is reasonably likely that the trend in environmental legislation and regulation will continue toward stricter standards and, thus, we cannot give any assurance that we will not be adversely affected in the future.
We have established internal guidelines to be followed in order to comply with environmental laws and regulations in the U.S. We employ a safety department whose responsibilities include providing assurance that our operations are carried out in accordance with applicable environmental guidelines and safety precautions. Although we maintain pollution insurance to cover a portion of the potential costs of cleanup obligations, public liability and physical damage, there is no assurance that such insurance will be adequate to cover all such costs or that such insurance will continue to be available in the future. To date, we believe that compliance with existing requirements of such governmental bodies has not had a material effect on our operations.
10
Endeavour International Corporation
Other Regulation of the Oil and Gas Industry
The oil and gas industry is extensively regulated by numerous federal, state and local authorities. Legislation affecting the oil and gas industry is under constant review for amendment or expansion, frequently increasing the regulatory burden. Also, numerous departments and agencies, both federal and state, are authorized by statute to issue rules and regulations binding on the oil and gas industry and its individual members, some of which carry substantial penalties for failure to comply. Although the regulatory burden on the oil and gas industry increases our cost of doing business and, consequently, affects our profitability, these burdens generally do not affect us any differently or to any greater or lesser extent than they affect other companies in the industry with similar types, quantities and locations of production.
Legislation continues to be introduced in Congress and development of regulations continues in the U.S. Department of Homeland Security and other agencies concerning the security of industrial facilities, including oil and gas facilities. Our operations may be subject to such laws and regulations. Presently, it is not possible to accurately estimate the costs we could incur to comply with any such facility security laws or regulations, but such expenditures could be substantial.
Production Regulation
Our operations are subject to various types of regulation at federal, state and local levels. These types of regulation include requiring permits for the drilling of wells, drilling bonds and reports concerning operations. Most states, and some counties and municipalities, in which we operate, also regulate one or more of the following:
| | • | | the method of drilling and casing wells; |
| | • | | the surface use and restoration of properties upon which wells are drilled; |
| | • | | the plugging and abandoning of wells; and |
| | • | | notice to surface owners and other third parties. |
The various states regulate the drilling for, and the production of, oil and natural gas, including imposing severance taxes and requirements for obtaining drilling permits. States also regulate the method of developing new fields, the spacing and operation of wells and the prevention of waste of oil and natural gas resources. States may regulate rates of production and may establish maximum daily production allowable from oil and gas wells based on market demand or resource conservation, or both. States do not regulate wellhead prices or engage in other similar direct economic regulation, but there can be no assurance that they will not do so in the future. The effect of these regulations may be to limit the amounts of oil and natural gas that may be produced from our wells, and to limit the number of wells or locations we can drill.
11
Endeavour International Corporation
Regulation
The exploration, production and sale of oil and gas are extensively regulated by governmental bodies. Applicable legislation is under constant review for amendment or expansion. Oil and gas mineral rights may be held by individuals, corporations or governments having jurisdiction over the area in which such mineral rights are located. As a general rule, parties holding such mineral rights grant licenses or leases to third parties to facilitate the exploration and development of these mineral rights. The terms of the leases and licenses are generally established to require timely development. Notwithstanding the ownership of mineral rights, the government of the jurisdiction in which mineral rights are located generally retains authority over the manner of development of those rights.
Title to Properties
We believe that our title to the various interests set forth above is satisfactory and consistent with generally accepted industry standards, subject to exceptions that would not materially detract from the value of the interests or materially interfere with their use in our operations. Individual properties may be subject to burdens such as royalty, overriding royalty and other outstanding interests customary in the industry. In addition, interests may be subject to obligations or duties under applicable laws or burdens such as production payments, net profits interest, liens incident to operating agreements and for current taxes, development obligations under crude oil and natural gas leases or capital commitments under production sharing contracts or exploration licenses.
Offices
Our principal executive offices are located at 811 Main Street, Suite 2100, Houston, Texas 77002, and our telephone number is (713) 307-8700. We also have offices in London and Aberdeen in the United Kingdom and in Denver, Colorado.
Available Information
We file annual, quarterly and current reports with the Securities and Exchange Commission (the “SEC”). The public may read and copy any materials that we file with the SEC at the SEC’s Public Reference Room at 100 F Street, NE, Washington, DC 20549. The public may obtain information on the operation of the Public Reference Room by calling the SEC at 1-800-SEC-0330. Also, the SEC maintains a website that contains reports, proxy and information statements and other information regarding issuers, including Endeavour, that file electronically with the SEC. The public can obtain any document we file at the SEC web page, www.sec.gov.
Our website is available atwww.endeavourcorp.com. We make available, free of charge, on our website, Annual Report on Form 10-K, Quarterly Reports on Form 10-Q, Current Reports on Form 8-K and amendments to those reports, as soon as reasonably practicable after providing such reports to the SEC. Also, our Governance Guidelines, the charters of the Audit Committee, the Compensation Committee, the Governance and Nominating Committee and the Technology & Reserves Committee, and the Code of Conduct and Code of Ethics for Senior Officers are
12
Endeavour International Corporation
available on our website and in print to any stockholder who provides a written request to the Corporate Secretary at 811 Main Street, Suite 2100, Houston, Texas 77002. Our Code of Conduct applies to all directors, officers and employees, including the chief executive officer and chief financial officer.
Information contained on or connected to our website is not incorporated by reference into this Annual Report on Form 10-K and should not be considered part of this report or any other filing that we make with the SEC.
Financial Information about Segment and Geographical Areas
We operate in one industry segment, that being oil and gas exploration and production, in two geographical areas. See Note 25 to our consolidated financial statements in “Item 8. Financial Statements and Supplementary Data” for geographic operating segment information, including results of operations and segment assets. Our revenues and long-lived assets by geographic area are included in Note 21 to our consolidated financial statements in “Item 8. Financial Statements and Supplementary Data” and incorporated herein by reference.
Average Sales Prices and Production Costs by Geographical Area
Information on average sales prices and production costs by geographic area is included in Item 7 and incorporated herein by reference.
Item 1A. Risk Factors
Cautionary Statement Concerning Forward-Looking Statements
Certain matters discussed in this Annual Report on Form 10-K are “forward-looking statements” intended to qualify for the safe harbors from liability established by the Private Securities Litigation Reform Act of 1995, Section 27A of the Securities Act of 1933, as amended (the “Securities Act”), and Section 21E of the Securities Exchange Act of 1934, as amended (the “Exchange Act”). These forward-looking statements include statements that express a belief, expectation, or intention, as well as those that are not statements of historical fact, and may include projections and estimates concerning the timing and success of specific projects and our future production, revenues, income and capital spending. Our forward-looking statements are generally accompanied by words such as “estimate,” “project,” “predict,” “believe,” “expect,” “anticipate,” “potential,” “plan,” “goal” or other words that convey the uncertainty of future events or outcomes. We caution you not to rely on them unduly. In particular, this Annual Report on Form 10-K contains forward-looking statements pertaining to the following:
| | • | | our future financial position; |
| | • | | the outcome of our strategic review; |
| | • | | recent and pending acquisitions; |
13
Endeavour International Corporation
| | • | | projected costs, savings and plans; |
| | • | | objectives of management for future operations; |
We have based these forward-looking statements on our current expectations and assumptions about future events. While our management considers these expectations and assumptions to be reasonable, they are inherently subject to significant business, economic, competitive, regulatory and other risks, contingencies and uncertainties, most of which are difficult to predict and many of which are beyond our control. These risks, contingencies and uncertainties, which may not be exhaustive, relate to, among other matters, the following:
| | • | | discovery, estimation, development and replacement of oil and gas reserves; |
| | • | | decreases in proved reserves due to technical or economic factors; |
| | • | | drilling of wells and other planned exploitation activities; |
| | • | | our high level of indebtedness; |
| | • | | adverse weather conditions; |
| | • | | timing and amount of future production of oil and gas; |
| | • | | the volatility of oil and gas prices; |
| | • | | availability and terms of capital; |
| | • | | operating costs such as lease operating expenses, administrative costs and other expenses; |
| | • | | our future operating or financial results; |
| | • | | amount, nature and timing of capital expenditures, including future development costs; |
| | • | | cash flow and anticipated liquidity; |
| | • | | availability of drilling and production equipment; |
| | • | | uncertainties related to drilling and production operations; |
| | • | | cost and access to natural gas gathering, treatment and pipeline facilities; |
| | • | | outcome of legal disputes; |
| | • | | environmental hazards, such as natural gas leaks, oil spills and discharges of toxic gases; |
| | • | | business strategy and the availability of acquisition opportunities; |
| | • | | the outcome of our strategic review; and |
| | • | | factors not known to us at this time. |
Any of these factors, or a combination of these factors, could materially affect our future financial condition or results of operations and the ultimate accuracy of a forward-looking statement. The forward-looking statements are not guarantees of our future performance, and our actual results and future developments may differ materially from those projected in the forward-looking statements. In addition, any or all of our forward-looking statements in this Annual Report on Form 10-K may turn out to be incorrect. They can be affected by inaccurate assumptions we might make or by known risks and uncertainties, as mentioned in this “Item 1A. Risk Factors” and elsewhere in this Annual Report on Form 10-K. Except as required by law, we undertake no obligation to update publicly or release any revisions to these forward-looking statements to reflect events or circumstances after the date of this Annual Report on Form 10-K. These cautionary statements qualify all forward-looking statements attributable to us or persons acting on our behalf.
14
Endeavour International Corporation
Risks related to access to capital and financing
Our debt levels could negatively impact our financial condition, results of operations and business prospects.
As of December 31, 2012, we had $874.2 million in outstanding indebtedness. Subsequent to December 31, 2012, we entered into a forward sale and an agreement providing for the sale and purchase of a monetary production payment to provide us additional liquidity for our operations. Our indebtedness and other obligations could have important consequences on our operations, including:
| | • | | placing restrictions on certain operating activities; |
| | • | | making it more difficult for us to satisfy our obligations under our indentures or the terms of our other debt instruments and increasing the risk that we may default on our debt obligations; |
| | • | | requiring us to dedicate a substantial portion of our cash flow from operating activities to required payments on debt and other obligations, thereby reducing the availability of cash flow for working capital, capital expenditures and other general business activities; |
| | • | | limiting our ability to obtain additional financing in the future for working capital, capital expenditures, acquisitions and other general business activities; |
| | • | | decreasing our ability to withstand a downturn in our business or the economy generally; and |
| | • | | placing us at a competitive disadvantage against other less leveraged competitors. |
We may not have sufficient funds to repay our outstanding debt and other obligations. In addition, we cannot assure you that we will be able to generate sufficient cash flow from operating activities to pay the interest on our debt and other obligations or that future borrowings, equity financings or proceeds from the sale of assets will be available to repay or refinance such debt. Furthermore, any future debt instruments we enter into may contain certain restrictions on our ability to repay other debt.
Factors that will affect our ability to raise cash through an offering of our capital stock, a refinancing of our debt or a sale of assets include financial market conditions, our market value, our reserve levels and our operating performance at the time of such offering or other financing. We cannot assure you that any such offering, refinancing or sale of assets can be successfully completed. The inability to repay or refinance our debt could have a material adverse effect on our operations and negatively impact our capital program.
A change of control may adversely affect our liquidity, require refinancing of certain debt instruments and trigger severance payments or accelerated vesting of equity awards.
Upon certain specified change of control events, the lenders under our various debt facilities may cancel the facility and declare as due and payable any outstanding indebtedness, accrued interest and other outstanding fees. The terms of the indentures governing the 2018 Notes (as defined below) may require us to repurchase all or a portion of the notes if the proceeds from certain dispositions are not applied in a specific manner. We cannot assure you we would have
15
Endeavour International Corporation
sufficient financial resources to purchase the debt instruments for cash or repay the lenders upon the occurrence of a change of control or disposition. There can be no assurance that we would be able to refinance our indebtedness or, if a refinancing were to occur, that the refinancing would be on terms favorable to us.
We provide severance benefits through Mr. Transier’s employment agreement and through change in control agreements with each of our remaining executive vice presidents. These agreements provide for severance compensation to be paid if employment is terminated under certain conditions, such as at the executive’s election for “good reason” following a change in control, as defined in the agreements. Additionally, our long-term incentive grant agreements provide for accelerated vesting of equity awards upon the occurrence of a change in control.
Our development and exploration operations require substantial capital, and we may be unable to generate sufficient cash flow from operations or obtain needed capital or financing on satisfactory terms, which could lead to a loss of properties and a decline in our oil and gas reserves.
The oil and gas industry is capital intensive. We make and expect to continue to make substantial capital expenditures in our business and operations for the exploration, development, production and acquisition of oil and gas reserves. We intend to finance our future capital expenditures primarily with cash on hand, cash flow from operations and access to the debt and equity markets. Our cash flow from operations and access to capital is subject to a number of variables, including:
| | • | | the level of natural gas and crude oil we are able to produce from existing wells; |
| | • | | our oil and gas reserves; |
| | • | | the prices at which natural gas and crude oil are sold; |
| | • | | the timing and amount of capital expenditures; |
| | • | | our ability to control the development efforts, costs and timing of our operations; and |
| | • | | our ability to acquire, locate and produce new reserves. |
If our revenues decrease as a result of lower oil and gas prices, operating difficulties, declines in reserves or for any other reason or our capital expenditures increase as a result of operating difficulties, higher drillings costs or for any other reason, we may have limited ability to generate sufficient cash flow from operations or obtain the capital necessary to sustain our operations at current levels or to further develop and exploit our current properties, or for exploratory activity. In order to fund our capital expenditures, we may need to seek additional financing. Any future indebtedness we incur may contain covenants restricting our ability to incur additional indebtedness without the consent of the lenders.
Furthermore, we may not be able to obtain debt or equity financing in the future on terms favorable to us, or at all. The failure to obtain additional financing could result in a curtailment of our operations relating to exploration and development of our prospects, which in turn could lead to a possible loss of properties and a decline in our natural gas, crude oil and natural gas liquids reserves.
16
Endeavour International Corporation
If we are unable to fulfill commitments under any of our oil and gas interests, we will lose our interest, and our entire investment, in such interest.
Our ability to retain oil and gas interests will depend on our ability to fulfill the commitments made with respect to each interest. We cannot assure you that we or the other participants in the projects will have the financial ability to fund these potential commitments. If we are unable to fulfill commitments under any of our interests, we will lose our interest, and our entire investment, in such interest.
Risks related to executing our strategy and operations
Our business involves many uncertainties and operating risks that can prevent us from realizing profits and can cause substantial losses.
Our development activities may be unsuccessful for many reasons, including adverse weather conditions (such as storms in the North Sea), cost overruns, equipment shortages, geological issues and mechanical difficulties. Moreover, the successful drilling of a natural gas or oil well does not assure we will realize a profit on our investment. A variety of factors, both geological and market-related, can cause a well to become uneconomical or only marginally economical. In addition to their costs, unsuccessful wells hinder our efforts to replace reserves.
Our oil and natural gas exploration and production activities, including well stimulation and completion activities such as hydraulic fracturing, involve a variety of operating risks, including:
| | • | | blow-outs and surface cratering; |
| | • | | uncontrollable flows of natural gas, oil and formation water; |
| | • | | natural disasters, such as severe storms, hurricanes and other adverse weather conditions; |
| | • | | inability to obtain insurance at reasonable rates; |
| | • | | failure to receive payment on insurance claims in a timely manner, or for the full amount claimed; |
| | • | | pipe, cement, subsea well or pipeline failures; |
| | • | | casing collapses or failures; |
| | • | | mechanical difficulties, such as lost or stuck oil field drilling and service tools; |
| | • | | abnormally pressured formations or rock compaction; and |
| | • | | environmental hazards, such as natural gas leaks, oil spills, pipeline ruptures, encountering naturally occurring radioactive materials, and discharges of brine, well stimulation and completion fluids, toxic gases, or other pollutants into the surface and subsurface environment. |
17
Endeavour International Corporation
If we experience any of these problems, well bores, platforms, gathering systems and processing facilities could be affected, which could adversely affect our ability to conduct operations. We could also incur substantial losses as a result of:
| | • | | injury or loss of life; |
| | • | | damage to and destruction of property, natural resources and equipment; |
| | • | | pollution and other environmental damage; |
| | • | | clean-up responsibilities; |
| | • | | regulatory investigation and penalties; |
| | • | | suspension of our operations; |
| | • | | repairs required to resume operations; and |
Offshore operations are also subject to a variety of operating risks related to the marine environment, such as capsizing, collisions and damage or loss from severe storms, hurricanes or other adverse weather conditions. These conditions can cause substantial damage to facilities and interrupt production. As a result, we could incur substantial liabilities that could reduce or eliminate funds available for exploration, exploitation and acquisitions or result in the loss of property and equipment.
Our offshore operations involve special risks that could increase our cost of operations and adversely affect our ability to produce oil and gas.
Offshore operations are subject to a variety of operating risks specific to the marine environment, such as capsizing, collisions and damage or loss from hurricanes or other adverse weather conditions. These conditions can cause substantial damage to facilities and interrupt production. As a result, we could incur substantial liabilities that could reduce or eliminate the funds available for exploration, development or leasehold acquisitions, or result in loss of equipment and properties. Offshore drilling in the North Sea generally requires more time and more advanced drilling technologies, involving a higher risk of technological failure and usually higher drilling costs. Moreover, offshore projects often lack proximity to the physical and oilfield service infrastructure, necessitating significant capital investment in subsea flow line infrastructure. Subsea tieback production systems require substantial time and the use of advanced and very sophisticated installation equipment supported by remotely operated vehicles. These operations may encounter mechanical difficulties and equipment failures that could result in significant cost overruns. As a result, a significant amount of time and capital must be invested before we can market the associated oil or gas of a commercial discovery, increasing both the financial and operational risk involved with these operations. Because of the lack and high cost of infrastructure, some offshore reserve discoveries may never be produced economically.
Our insurance may not protect us against business and operating risks, including an operator of a prospect in which we participate failing to maintain or obtain adequate insurance.
Oil and gas operations are subject to particular hazards incident to the drilling and production of oil and gas, such as blowouts, cratering, explosions, uncontrollable flows of oil, gas or well fluids, fires and pollution and other environmental risks. These hazards can cause personal injury and loss of life, severe damage to and destruction of property and equipment, pollution or environmental damage and suspension of operations. We maintain insurance for some, but not all, of the potential risks and liabilities associated with our business. If a significant accident or
18
Endeavour International Corporation
other event resulting in damage to our operations, including severe weather, terrorist acts, war, civil disturbances, pollution or environmental damage, occurs and is not fully covered by insurance, it could adversely affect our financial condition and results of operations. We do not currently operate all of our oil and gas properties. In the projects in which we own non-operating interests, the operator may maintain insurance of various types to cover our operations with policy limits and retention liability customary in the industry. The occurrence of a significant adverse event that is not fully covered by insurance could result in the loss of our total investment in a particular prospect and additional liability for us, which could have a material adverse effect on our financial condition and results of operations and prospects.
To maintain and grow our production and cash flow, we must continue to develop and produce existing reserves and discover or acquire new oil and gas reserves to develop and produce.
Our future oil and gas production is highly dependent upon our level of success in finding or acquiring additional reserves. Producing oil and gas reserves are generally characterized by declining production rates that vary depending on reservoir characteristics and other factors. Our reserves will decline unless we acquire properties with proved reserves or conduct successful development and exploration drilling activities. We accomplish this through successful drilling programs and the acquisition of properties. However, we may be unable to find, develop or acquire additional reserves or production at an acceptable cost or at all. Acquisition opportunities in the oil and gas industry are very competitive, which can increase the cost of, or cause us to refrain from, pursuing acquisitions.
If we are unable to find, develop or acquire additional reserves to replace our current and future production, our production rates will decline even if we drill the undeveloped locations that were included in our estimated proved reserves. Our future oil and gas reserves and production, and therefore our cash flow and income, are dependent on our success in economically finding or acquiring new reserves and efficiently developing our existing reserves.
Our expectations for future drilling and development activities will be realized over several years, making them susceptible to uncertainties that could materially alter the occurrence or timing of such activities.
We have identified drilling locations, prospects for future drilling opportunities and development plans for our commercial discoveries, including development, exploratory and other drilling and enhanced recovery activities. These drilling and development locations and prospects represent a significant part of our future drilling and development plans. Our ability to drill and develop these locations depends on a number of factors, including the availability of capital, seasonal conditions, third-party operators, approval or other participants to drill wells and implement other work programs, availability of suitable drilling rigs, equipment and qualified operating personnel, regulatory approvals, negotiation of agreements with third parties, commodity prices, costs and drilling results. In particular, delays in obtaining regulatory approvals relating to our field development programs for our North Sea discoveries can materially impact our ability to commence production at these discoveries which would materially impact our reserves, cash flow and results of operations. Furthermore, because of these uncertainties, we cannot give any
19
Endeavour International Corporation
assurance as to the timing of these activities or that they will ultimately result in the realization of proved reserves or meet our expectations for success. As such, our actual drilling and enhanced recovery activities may materially differ from our current expectations, which could have a significant adverse effect on our financial condition and results of operations.
We are involved in litigation related to a terminated acquisition for Marcellus shale play assets, and such litigation, if resolved adversely to us, could have a material adverse effect on us.
On July 17, 2011, we entered into agreements (the “SM Purchase Agreements”) with SM Energy Company and certain other sellers named therein (collectively, “SM Energy”) for the purchase of oil and gas leases, producing properties, geophysical data, a pipeline and related assets in the Marcellus shale play in Pennsylvania (the “SM Acquisition”). On December 14, 2011, we terminated the SM Purchase Agreements based on our conclusion that (i) the title defects we identified, after analyzing SM Energy’s responses to the notice of defects and valuation of the defects, exceeded the contractual threshold of 15% of the applicable purchase price; and (ii) the condition of the pipeline was not in compliance with applicable regulatory standards, which would constitute a material violation of a representation and warranty contained in the applicable SM Purchase Agreement. Following our termination of each of the SM Purchase Agreements, SM Energy filed a lawsuit against us in Texas state court on December 20, 2011 alleging, among other things, breach of contract for refusing to close on the SM Acquisition. SM Energy is seeking an award of unspecified actual damages, including costs and reasonable attorney’s fees, and specific performance to complete the SM Acquisition. If we are unsuccessful in defending against these claims, we may be subject to a range of potential adverse outcomes. While we intend to contest these claims vigorously, we cannot predict with any certainty the outcome of this litigation, and the lawsuit, if resolved adversely to us, could have a material adverse effect on our business, results of operations or financial condition.
Our drilling projects are based in part on seismic and other technical data, which cannot ensure the commercial success of a prospect.
Our decisions to purchase, explore, develop and exploit prospects or properties depend in part on data obtained through geophysical and geological analyses, production data and engineering studies, the results of which are often uncertain. Seismic data and visualization techniques only assist geoscientists and geologists in identifying subsurface structures and hydrocarbon indicators and do not enable an interpreter to conclusively determine whether hydrocarbons are present or producible economically. In addition, the use of seismic and other advanced technologies may require greater predrilling expenditures than other drilling strategies. Because of these factors and the inherent uncertainties surrounding the evaluation of exploration prospects, we could incur losses as a result of exploratory drilling expenditures. Poor results from drilling activities would have a material adverse effect on our future cash flows, ability to replace reserves and results of operations.
20
Endeavour International Corporation
Reserve estimates depend on many assumptions that may turn out to be inaccurate and any material inaccuracies in the reserve estimates or underlying assumptions of our assets will materially affect the quantities and present value of those reserves.
Estimating oil and gas reserves is complex and inherently imprecise. It requires interpretation of the available technical data and making many assumptions about future conditions, including price and other economic factors. In preparing such estimates, projection of production rates, timing of development expenditures and available geological, geophysical, production and engineering data are analyzed. The extent, quality and reliability of these data can vary. This process also requires economic assumptions about matters such as oil and gas prices, drilling and operating expenses, capital expenditures, taxes and availability of funds. If our interpretations or assumptions used in arriving at our reserve estimates prove to be inaccurate, the amount of oil and gas that will ultimately be recovered may differ materially and adversely from the estimated quantities and net present value of reserves owned by us.
A significant portion of our total estimated net proved reserves at December 31, 2012 were undeveloped, and those reserves may not ultimately be developed.
At December 31, 2012, approximately 68% of our total estimated net proved reserves were undeveloped. Recovery of undeveloped reserves requires significant capital expenditures and successful drilling. Our reserve data assumes that we can and will make these expenditures and conduct these operations successfully. These assumptions, however, may not prove correct. If we choose not to spend the capital to develop these reserves or if we are not otherwise able to successfully develop these reserves we may be required to write-off these reserves. Any such write-offs of our reserves could materially reduce our ability to borrow money and the value of our securities.
Certain of our U.K. oil fields are dependent upon tanker liftings to deliver oil production to buyers, which may result in fluctuations in our revenue and results of operations.
We record oil revenues using the sales method (i.e., when delivery has occurred). While certain of our U.K. fields produce into pipelines (causing revenue to be recorded consistently with such production), certain other fields are dependent upon tanker liftings to deliver oil production to buyers. As a result, our revenues from this oil production will fluctuate in connection with the frequency and volume of tanker liftings, which are factors not entirely within our control. Accordingly, the revenues from our oil production in the U.K. are expected to be more volatile than the associated physical production, which is expected to remain relatively steady.
Actual production could differ significantly from forecasts.
From time to time we provide forecasts of expected quantities of future oil and gas production. These forecasts are based on a number of estimates, including expectations of production decline rates from existing wells, outcomes from future drilling activity and assumptions relating to ongoing operations and maintenance of producing wells. Should these estimates prove inaccurate, actual production could be adversely impacted. Furthermore, downturns in commodity prices could make certain drilling activities or production uneconomical, which would also adversely impact production. We may also adjust estimates of proved reserves to reflect production history, results of exploration and development, prevailing oil and gas prices and other factors, many of which are beyond our control.
21
Endeavour International Corporation
The cost of decommissioning is uncertain.
We expect to incur obligations to abandon and decommission certain structures associated with our producing properties. To date, the industry has little experience of removing oil and gas structures from the North Sea, because few of the structures in the North Sea have been removed. Because experience is limited, we cannot precisely predict the costs of any future decommissions for which we might become obligated. Furthermore, we are required to post collateral as security over certain of our decommissioning liabilities in the North Sea. If actual decommission or abandonment costs exceed our estimates or reserves to satisfy such obligations, or we are required to provide a significant amount of collateral in cash or other security for these future costs, our financial condition, results of operations and prospects could be materially adversely affected.
We may be unable to make attractive acquisitions, and any acquisition we complete is subject to substantial risks that could impact our business.
As part of our growth strategy, we intend to continue to pursue strategic acquisitions of new properties or businesses that expand our current asset base and potentially offer unexploited reserve potential. Our growth strategy could be impeded if we are unable to acquire additional interests in oil and gas prospects on a profitable basis. Acquisition opportunities in the oil and gas industry are very competitive, which can increase the cost of, or cause us to refrain from, completing acquisitions. The success of any acquisition will depend on a number of factors and involves potential risks, including among other things:
| | • | | the inability to estimate accurately the costs to develop the interests in oil and gas prospects, the recoverable volumes of reserves, rates of future production and future net cash flows attainable from the reserves; |
| | • | | the assumption of unknown liabilities, losses or costs for which we are not indemnified or for which the indemnity we receive is inadequate; |
| | • | | the validity of assumptions about costs, including synergies; |
| | • | | the impact on our liquidity or financial leverage of using available cash or debt to finance acquisitions; |
| | • | | the diversion of management’s attention from other business concerns; and |
| | • | | an inability to hire, train or retain qualified personnel to manage and operate our growing business and assets. |
All of these factors affect whether an acquisition will ultimately generate cash flows sufficient to provide a suitable return on investment. Consistent with industry practices, we typically are only able to perform limited reviews of the properties we seek to acquire. As a result, among other risks, our initial estimates of reserves, and the costs associated with developing those estimated reserves, may be subject to revision following an acquisition, which may materially and adversely impact the desired benefits of the acquisition.
22
Endeavour International Corporation
Risks related to our business
We operate internationally and are subject to political, economic and other uncertainties.
We currently have operations in the U.S. and U.K. and may expand our operations to other countries or regions. International operations are subject to political, economic and other uncertainties, including:
| | • | | the risk of war, acts of terrorism, revolution, border disputes, expropriation, renegotiation or modification of existing contracts, and import, export and transportation regulations and tariffs; |
| | • | | taxation policies, including royalty and tax increases and retroactive tax claims; |
| | • | | exchange controls, currency fluctuations and other uncertainties arising out of foreign government sovereignty over our international operations; |
| | • | | laws and policies of the U.S. affecting foreign trade, taxation and investment; and |
| | • | | the possibility of being subject to the exclusive jurisdiction of foreign courts in connection with legal disputes and the possible inability to subject foreign persons to the jurisdiction of courts in the U.S. |
The exploration, production and sale of oil and gas are extensively regulated by governmental bodies, which subject us to increased costs in order to comply with applicable laws and regulations as well as significant uncertainties due to the potential for such laws and regulations to change and evolve. Applicable legislation and regulations are under constant review for amendment or expansion. These efforts frequently result in an increase in the regulatory burden on companies in our industry and consequently an increase in the cost of doing business and decrease in profitability. Numerous governmental departments and agencies are authorized to, and have, issued rules and regulations imposing additional burdens on the oil and gas industry that often are costly to comply with and carry substantial penalties for failure to comply. Production operations are affected by changing tax and other laws relating to the petroleum industry, by constantly changing administrative regulations and possible interruptions or termination by government authorities.
Oil and gas mineral rights may be held by individuals, corporations or governments having jurisdiction over the area in which such mineral rights are located. As a general rule, parties holding such mineral rights grant licenses or leases to third parties to facilitate the exploration and development of these mineral rights. The terms of the leases and licenses are generally established to require timely development. Notwithstanding the ownership of mineral rights, the government of the jurisdiction in which mineral rights are located generally retains authority over the manner of development of those rights. As such, we may become subject to certain requirements, obligations and timelines as established or demanded by the holder of the oil and gas mineral rights and such requirements or obligations may adversely impact our operations, cash flow and capital plans.
23
Endeavour International Corporation
Economic conditions in the U.S. and key international markets may materially adversely impact our operating results, which could hinder or prevent us from meeting our future capital needs.
The U.S., U.K. and other world economies are slowly recovering from a recession which began in 2008 and extended into 2009. Growth has resumed, but remains modest. There are likely to be significant long-term effects resulting from the recession and credit market crisis, including a future global economic growth rate that is slower than what was experienced prior to the recession. In addition, more volatility may occur before a sustainable, yet lower, growth rate is achieved. Because global economic growth drives demand for energy from all sources, including fossil fuels, a lower future economic growth rate will result in decreased demand growth for our crude oil and natural gas production as well as lower commodity prices, which will reduce our cash flows from operations and our profitability and may adversely affect our ability to obtain funding for our projects.
Due to these and other factors, we cannot be certain that funding will be available if needed, and to the extent required, on acceptable terms or at all. If funding is not available as needed, or is available only on unfavorable terms, we may be unable to (i) meet our obligations as they come due, or (ii) implement our capital program, enhance our existing business, complete acquisitions or otherwise take advantage of business opportunities or respond to competitive pressures, any of which could have a material adverse effect on our production, revenues, results of operations and prospects.
Oil and gas prices are volatile, and a decline in oil and gas prices would reduce our revenues, profitability and cash flow and impede our growth.
Our revenues, profitability and cash flow depend substantially upon the prices and demand for oil and gas. The markets for these commodities are volatile, and even relatively modest drops in prices can significantly affect our financial results and impede our growth. The U.S. gas market is heavily impacted by the increased supply from shale drilling, which has served to depress natural gas prices relative to the U.K. market. Prices for oil and gas fluctuate in response to relatively minor changes in the supply and demand for oil and gas, market uncertainty and a variety of additional factors beyond our control, such as:
| | • | | global supply of oil and gas; |
| | • | | level of consumer product demand; |
| | • | | technological advances affecting oil and gas consumption; |
| | • | | global economic conditions; |
| | • | | price and availability of alternative fuels; |
| | • | | actions of the Organization of Petroleum Exporting Countries and other state-controlled oil companies relating to oil price and production controls; |
| | • | | governmental regulations and taxation; |
| | • | | political conditions in or affecting other oil-producing and gas-producing countries; |
| | • | | the proximity, capacity, cost and availability of pipeline and other transportation facilities; and |
| | • | | the impact of energy conservation efforts. |
24
Endeavour International Corporation
Lower oil and gas prices may not only decrease our revenues on a per unit basis, but significant or extended price declines may also reduce the amount of oil and gas that we can produce economically. A reduction in production could result in a shortfall in expected cash flows and require us to reduce capital spending or borrow funds to cover any such shortfall. Any of these factors could negatively impact our future rate of growth and ability to replace our production.
In addition, we may, from time to time, enter into long-term contracts based upon our reasoned expectations for commodity price levels. If commodity prices subsequently decrease significantly for a sustained period, we may be unable to perform our obligations or otherwise breach any such contract and be liable for damages.
Competition for oil and gas properties and prospects is intense and some of our competitors have larger financial, technical and personnel resources that give them an advantage in evaluating, obtaining and developing properties and prospects.
We operate in a highly competitive environment for reviewing prospects, acquiring properties, marketing oil and gas and securing trained personnel. Many of our competitors are major or independent oil and gas companies that have longer operating histories in our areas of operation and employ superior financial resources which allow them to obtain substantially greater technical and personnel resources and which better enable them to acquire and develop the prospects that they have identified. We also actively compete with other companies when acquiring new licenses or oil and gas properties. Specifically, competitors with greater resources than our own have certain advantages that are particularly important in reviewing prospects and purchasing properties. Competitors may be able to evaluate, bid for and purchase a greater number of properties and prospects than our financial or personnel resources permit. Competitors may also be able to pay more for producing oil and gas properties and exploratory prospects than we are able or willing to pay. If we are unable to compete successfully in these areas in the future, our future revenues and growth may be diminished or restricted.
These competitors may also be better able to withstand sustained periods of unsuccessful drilling or downturns in the economy, including decreases in the price of commodities. Larger competitors may also be able to absorb the burden of any changes in laws and regulations more easily than we can, which would also adversely affect our competitive position. In addition, most of our competitors have been operating for a much longer time and have demonstrated the ability to operate through industry cycles.
We are dependent on our executive officers and need to attract and retain additional qualified personnel.
Our future success depends in large part on the service of our executive officers. The loss of these executives could have a material adverse effect on our business. Although we have employment agreements with certain of our executive officers, there can be no assurance that we will have the ability to retain their services. Further, we do not maintain key-person life insurance on any executive officers.
25
Endeavour International Corporation
Our future success also depends upon our ability to attract, assimilate and retain highly qualified technical and other management personnel who are essential for the identification and development of our prospects. There can be no assurance that we will be able to attract, integrate and retain key personnel, and our failure to do so would have a material adverse effect on our business.
Our operations are sensitive to currency rate fluctuations.
Our operations are sensitive to fluctuations in foreign currency exchange rates, particularly between the U.S. dollar and the British pound. Our financial statements, presented in U.S. dollars, are affected by foreign currency fluctuations through both translation risk and transaction risk. Volatility in exchange rates may adversely affect our results of operations, particularly through the weakening of the U.S. dollar relative to other currencies.
Our use of derivative transactions may limit future revenues from price increases and involves the risk that our counterparties may be unable to satisfy their obligations to us.
To manage our exposure to price risk with our production, we may enter into commodity derivative contracts. The goal of these derivative contracts is to limit volatility and increase the predictability of cash flow. Although the use of derivative contracts limits the downside risk of price declines, their use also may limit future revenues from price increases. In addition, derivative contracts may expose us to the risk of financial loss in certain circumstances, including instances in which our production is less than expected or a sudden, unexpected event materially impacts oil or gas prices.
Derivative contracts also involve the risk that counterparties, which generally are financial institutions, may be unable to satisfy their obligations to us. If any one of our counterparties were to default on its obligations to us under the derivative contracts or seek bankruptcy protection, it could have a material adverse effect on our expected cash flows and our ability to fund our planned activities and could result in a larger percentage of our future production being subject to commodity price changes. In addition, in the current economic environment and tight financial markets, the risk of a counterparty default is heightened and it is possible that fewer counterparties will participate in future derivative transactions, which could result in greater concentration of our exposure to any one counterparty or a larger percentage of our future production being subject to commodity price changes.
Risks related to environmental and other regulations
We are subject to environmental regulations that can have a significant impact on our operations.
Our operations are subject to a variety of national, state, local and international laws and regulations governing the discharge of materials into the environment or otherwise relating to environmental protection. Failure to comply with these laws and regulations can result in the imposition of substantial fines and penalties as well as potential orders suspending or terminating
26
Endeavour International Corporation
our rights to operate. Some environmental laws to which we are subject to provide for strict liability for pollution damages and cleanup costs, rendering a person liable without regard to negligence or fault on the part of such person. In addition, we may be subject to claims alleging personal injury or property damage as a result of alleged exposure to hazardous substances such as oil and gas related products. Aquatic environments in which we operate are often particularly sensitive to environmental impacts, which may expose us to greater potential liability than that associated with exploration, development and production at many onshore locations.
Changes in environmental laws and regulations occur frequently, and any changes that result in more stringent or costly requirements for oil and gas exploration and production activities could require us, as well as others in our industry, to make significant expenditures to attain and maintain compliance which could have a corresponding material adverse effect on our competitive position, financial condition or results of operations. We cannot provide assurance that we will be able to comply with future laws and regulations to the same extent that we have complied in the past. Similarly, we cannot always precisely predict the potential impact of environmental laws and regulations which may be adopted in the future, including whether any such laws or regulations would restrict our operations in any area.
Current and future environmental regulations, including restrictions on emissions of greenhouse gases due to concerns about climate change, could reduce the demand for our products. Our business, financial condition and results of operations could be materially and adversely affected if this were to occur.
Under certain environmental laws and regulations, we could be subject to liability arising out of the conduct of operations or conditions caused by others, or for activities that were in compliance with all applicable laws at the time they were performed. Such liabilities can be significant, and if imposed could have a material adverse effect on our financial condition or results of operations.
Governmental regulations to which we are subject could expose us to significant fines and/or penalties and our cost of compliance with such regulations could be substantial.
Oil and gas exploration, development and production are subject to various types of regulation by local, state and national agencies. Regulations and laws affecting the oil and gas industry are comprehensive and under constant review for amendment and expansion. These regulations and laws carry substantial penalties for failure to comply. The regulatory burden on the oil and gas industry increases our cost of doing business and, consequently, adversely affects our profitability. In addition, competitive conditions may be substantially affected by various forms of energy legislation and/or regulation considered from time to time by the governments and/or agencies thereof.
27
Endeavour International Corporation
We may be exposed to liabilities under the U.S. Foreign Corrupt Practices Act and similar anti-corruption laws, and any determination that we violated such laws could have a material adverse effect on our business.
We are subject to the United States Foreign Corrupt Practices Act of 1977 (the “FCPA”), as amended, and may be subject to similar worldwide anti-bribery laws including the UK Bribery Act 2010 that generally prohibit companies and their personnel and intermediaries from offering, authorizing, or making improper payments to government officials and to other persons or entities for the purpose of obtaining or retaining business, or securing some improper advantage in business. We do business and may do additional business in the future in countries and regions in which we may face, directly or indirectly, corrupt demands by officials, tribal or insurgent organizations, or private entities. As a result, we face the risk that an unauthorized payment or offer of payment could be made by one of our employees or intermediaries, even if such parties are not always subject to our control or are not themselves subject to the FCPA or other anti-bribery laws to which we may be subject. It is our policy to implement safeguards to prohibit these practices. However, existing safeguards and any future improvements may not prevent all such conduct, and it is possible that our employees and intermediaries may engage in conduct for which we might be investigated by U.S., UK, or other authorities, and held responsible. Violations of the FCPA and other anti-bribery laws (either due to our acts or our inadvertence) may result in criminal and civil sanctions and could subject us to other liabilities in the U.S., UK, and elsewhere. Even allegations of such violations could disrupt our business and result in a material adverse effect on our business and operations.
Federal and state legislative regulatory initiatives relating to hydraulic fracturing could result in increased costs and additional operating restrictions or delays.
Hydraulic fracturing is an important and common practice that is used to stimulate production of hydrocarbons from tight formations. We routinely utilize hydraulic fracturing techniques in many of our drilling and completion programs. The process involves the injection of water, sand and chemicals under pressure into the formation to fracture the surrounding rock and stimulate production. In the U.S., the process is typically regulated by state oil and gas commissions. However, the EPA recently asserted federal regulatory authority over hydraulic fracturing involving diesel additives under the Safe Drinking Water Act’s Underground Injection Control Program.
At the same time, the White House Council on Environmental Quality is coordinating an administration-wide review of hydraulic-fracturing practices, and the EPA has commenced a study of the potential environmental impacts of hydraulic fracturing activities on water resources. The EPA’s study includes 18 separate research projects addressing topics such as water acquisition, chemical mixing, well injection, flowback and produced water, and wastewater treatment and disposal. The EPA has indicated that it expects to issue its study report in late 2014. In addition, the U.S. Department of Energy is conducting an investigation into practices the agency could recommend to better protect the environment from drilling using hydraulic-fracturing completion methods. Additionally, certain members of Congress have called upon the U.S. Government Accountability Office to investigate how hydraulic fracturing might adversely affect water resources, the SEC to investigate the natural gas industry and any
28
Endeavour International Corporation
possible misleading of investors or the public regarding the economic feasibility of pursuing natural gas deposits in shales by means of hydraulic fracturing, and the U.S. Energy Information Administration to provide a better understanding of that agency’s estimates regarding natural gas reserves, including reserves from shale formations, as well as uncertainties associated with those estimates. Legislation also has been introduced before Congress to provide for federal regulation of hydraulic fracturing and to require disclosure of the chemicals used in the hydraulic fracturing process. These ongoing or proposed studies, depending on their degree of pursuit and any meaningful results obtained, could spur initiatives to further regulate hydraulic fracturing under the Safe Drinking Water Act or other regulatory mechanism.
In addition, some states have adopted, and other states are considering adopting, regulations that could impose more stringent permitting, disclosure and well construction requirements on hydraulic fracturing operations. For example, Colorado, Pennsylvania, and Wyoming have each adopted a variety of well construction, set back, and disclosure regulations limiting how fracturing can be performed and requiring various degrees of chemical disclosure. In addition, Texas and several other states have adopted laws requiring public disclosure of certain information regarding chemical ingredients and additives used in the hydraulic fracturing process. In addition to state laws, local land use restrictions, such as city ordinances, may restrict or prohibit the performance of well drilling in general and/or hydraulic fracturing in particular. In the event state, local, or municipal legal restrictions are adopted in areas where we are currently conducting, or in the future plan to conduct operations, we may incur additional costs to comply with such requirements that may be significant in nature, experience delays or curtailment in the pursuit of exploration, development, or production activities, and perhaps even be precluded from the drilling of wells.
If new laws or regulations that significantly restrict hydraulic fracturing are adopted, such laws could make it more difficult or costly for us to perform fracturing to stimulate production from tight formations. In addition, if hydraulic fracturing becomes regulated at the federal level as a result of federal legislation or regulatory initiatives by the EPA, our fracturing activities could become subject to additional permitting requirements, and also to attendant permitting delays and potential increases in costs. Restrictions on hydraulic fracturing could also reduce the amount of oil and natural gas that we are ultimately able to produce from our reserves.
Climate change legislation or regulations restricting emissions of “greenhouse gases” could result in increased operating costs and reduced demand for the crude oil and natural gas that we produce.
There are a number of programs at the international, national, and local levels that aim to reduce GHG emissions. Changes to the existing laws or the enactment of new laws and regulations could increase our operating costs and reduce demand for our products. At this time, there is substantial uncertainty about the future of GHG emission limitations in the areas where we operate. For example, the first commitment period of the Kyoto Protocol expired on December 31, 2012 and the details of the third commitment period, which began on January 1, 2013, are still being negotiated. In addition, the Parties to the Framework Convention on Climate Change continue negotiations under the Durban Platform, an approach to develop a new legally binding agreement on climate change by 2015 that will enter into force by 2020. While this agreement will not impact our operations in the near term, a new agreement on global climate change could further reduce demand for the oil and natural gas that we produce.
29
Endeavour International Corporation
Rapidly evolving domestic legal and regulatory structures governing GHG emissions may increase the costs imposed upon our operations. For example, since December 2009, the EPA has declared that GHGs threaten the environment, imposed limitations on GHGs from mobile sources and certain large stationary sources, and required certain industries to monitor and report their GHG emissions. Entities involved in the production and distribution of oil and natural gas currently subject to the requirements of Subpart W of the Mandatory Reporting of Greenhouse Gases Rule, and must report 2011 GHG emissions to the EPA. These reports are in addition to those required under Subpart Y for petroleum refineries. On March 27, 2012, the EPA proposed New Source Performance Standards (“NSPS”) under the Clean Air Act. These standards will require all new power plants 73 MW or larger to achieve a GHG emission rate of 1,000 pounds CO2 per MWh which the EPA estimates can be achieved by natural-gas combined cycle plants. In addition, the EPA is obligated under a consent decree to promulgate GHG NSPS for petroleum refineries and is expected to promulgate GHG standards for existing stationary sources. At the state level, California is implementing the cap and trade program called for in the Global Warming Solutions Act, and beginning in 2015, distributors of transportation, natural gas, and other fuels will be subject to the requirements of the program. To the extent we or our customers are subject to any of these regulations, we may face increased costs and decreased demand for our product.
The adoption of legislation or regulatory programs to reduce emissions of greenhouse gases could require us to incur increased operating costs, such as costs to purchase and operate emissions control systems, to acquire emissions allowances or comply with new regulatory or reporting requirements. Any such legislation or regulatory programs could also increase the cost of consuming, and thereby reduce demand for, the oil and natural gas we produced. Consequently, legislation and regulatory programs to reduce emissions of greenhouse gases could have an adverse effect on our business, financial condition and results of operations.
Recently proposed or finalized rules and guidance imposing more stringent requirements on the oil and gas exploration and production industry could cause us to incur increased capital expenditures and operating costs as well as decrease our levels of production.
On April 17, 2012, the EPA approved final regulations under the Clean Air Act that, among other things, require additional emissions controls for natural gas and natural gas liquids production, including NSPS to address emissions of sulfur dioxide and volatile organic compounds (“VOCs”) and a separate set of emission standards to address hazardous air pollutants frequently associated with such production activities. The final regulations require, among other things, the reduction of VOC emissions from natural gas wells through the use of reduced emission completions or “green completions” on all hydraulically fractured wells constructed or refractured after January 1, 2015. For well completion operations occurring at such well sites before January 1, 2015, the final regulations allow operators to capture and direct flowback emissions to completion combustion devices, such as flares, in lieu of performing green completions. These regulations also establish specific new requirements regarding emissions from dehydrators, storage tanks and other production equipment. Compliance with these requirements could increase our costs of development and production, which costs may be significant.
30
Endeavour International Corporation
The enactment of derivatives legislation could have an adverse effect on our ability to use derivative instruments to reduce the effect of commodity price, interest rate and other risks associated with our business.
On July 21, 2010, new comprehensive financial reform legislation, known as the Dodd-Frank Wall Street Reform and Consumer Protection Act (the “Act”), was enacted that establishes federal oversight and regulation of the over-the-counter derivatives market and entities, such as us, that participate in that market. The Act requires the CFTC, the SEC and other regulators to promulgate rules and regulations implementing the new legislation. In its rulemaking under the Act the CFTC has issued final regulations to set position limits for certain futures and option contracts in the major energy markets and for swaps that are their economic equivalents. Certain bona fide hedging transactions would be exempt from these position limits. The position limits rule was vacated by the United States District Court for the District of Colombia in September of 2012 although the CFTC has stated that it will appeal the District Court’s decision. The CFTC also has finalized other regulations, including critical rulemakings on the definition of “swap”, “security-based swap”, “swap dealer” and “major swap participant”. The Act and CFTC Rules also will require us in connection with certain derivatives activities to comply with clearing and trade-execution requirements (or take steps to qualify for an exemption to such requirements). In addition new regulations may require us to comply with margin requirements although these regulations are not finalized and their application to us is uncertain at this time. Other regulations also remain to be finalized, and the CFTC recently has delayed the compliance dates for various regulations already finalized. As a result it is not possible at this time to predict with certainty the full effects of the Act and CFTC rules on us and the timing of such effects. The Act also may require the counterparties to our derivative instruments to spin off some of their derivatives activities to a separate entity, which may not be as creditworthy as the current counterparty.
The Act and any new regulations could significantly increase the cost of derivative contracts (including from swap recordkeeping and reporting requirements and through requirements to post collateral which could adversely affect our available liquidity), materially alter the terms of derivative contracts, reduce the availability of derivatives to protect against risks we encounter, reduce our ability to monetize or restructure our existing derivatives contract, and increase our exposure to less creditworthy counterparties. If we reduce our use of derivatives as a result of the Act and regulations, our results of operations may become more volatile and our cash flows may be less predictable, which could adversely affect our ability to plan for and fund capital expenditures. Finally, the Act was intended, in part, to reduce the volatility of oil and natural gas prices, which some legislators attributed to speculative trading in derivatives and commodity instruments related to oil and natural gas. Our revenues could therefore be adversely affected if a consequence of the Act and regulations is to lower commodity prices. Any of these consequences could have a material adverse effect on us, our financial condition, and our results of operations.
31
Endeavour International Corporation
Certain federal income tax deductions currently available with respect to oil and natural gas exploration and development may be eliminated as a result of proposed legislation.
Legislation has been proposed that would, if enacted into law, make significant changes to U.S. federal income tax laws, including the elimination of certain key U.S. federal income tax incentives currently available to oil and natural gas exploration and production companies. These changes include, but are not limited to, (i) the repeal of the percentage depletion allowance for oil and natural gas properties, (ii) the elimination of current deductions for intangible drilling and development costs, (iii) the elimination of the deduction for certain domestic production activities, and (iv) an extension of the amortization period for certain geological and geophysical expenditures. It is unclear whether these or similar changes will be enacted and, if enacted, how soon any such changes could become effective. The passage of this legislation or any other similar changes in U.S. federal income tax laws could eliminate or postpone certain tax deductions that are currently available with respect to oil and natural gas exploration and development, and any such change could have a material, adverse effect on us, our financial condition and results of operations.
Risks related to potential impairments
Our financial results could be adversely affected by goodwill impairments.
As a result of mergers, acquisitions and dispositions, at December 31, 2012 we had $262.8 million of goodwill on our balance sheet. Goodwill is not amortized, but instead must be tested at least annually for impairment by applying a fair-value-based test. Goodwill is deemed impaired to the extent that its carrying amount exceeds the implied fair value of the reporting unit. Although our latest tests indicate that no goodwill impairment is currently required, future deterioration in market conditions could lead to goodwill impairments that could have a substantial negative effect on our profitability.
Lower oil and gas prices and other factors may result in ceiling test write-downs or other impairments.
We capitalize the costs to acquire, find and develop our oil and gas properties under the full cost accounting method. The net capitalized costs of our oil and gas properties may not exceed the present value of estimated future net cash flows from proved reserves, plus the lower of cost or fair market value for unproved properties. This quarterly test is called a “ceiling test.” If net capitalized costs of our oil and gas properties exceed this ceiling test, we must charge the amount of the excess to earnings. Although a ceiling test write-down does not impact cash flow from operating activities, it does reduce net income and our stockholders’ equity. Once recorded, a ceiling test write-down is not reversible at a later date even if oil and gas prices increase.
We review the net capitalized costs of our properties quarterly, based on prices in effect (excluding the effect of our hedging contracts that are not designated for hedge accounting) as of the end of each quarter or as of the time of reporting our results. We also assess investments in unproved properties periodically to determine whether impairment has occurred.
32
Endeavour International Corporation
The risk that we will be required to further write down the carrying value of our oil and gas properties increases when oil and gas prices are low or volatile. In addition, write-downs may occur if we experience substantial downward adjustments to our estimated proved reserves or our unproved property values, or if estimated future development costs increase. We may experience further ceiling test write-downs or other impairments in the future. In addition, any future ceiling test cushion would be subject to fluctuation as a result of acquisition or divestiture activity.
Risks relating to our common stock
An active liquid trading market for our common stock may not be maintained and the trading price of our common stock may be volatile.
Liquid and active trading markets usually result in less price volatility and more efficiency in carrying out stockholders’ purchase and sale orders. Smaller capitalized companies like ours often experience substantial fluctuations in the trading price of their securities. An active and liquid trading market for our common stock may not be maintained. The trading price of our common stock has fluctuated significantly and may be subject to similar fluctuations in the future. The market price of our common stock could vary significantly as a result of a number of factors, some of which are beyond our control.
If we, our existing stockholders or holders of our securities that are convertible into shares of our common stock sell any shares of our common stock, the market price of our common stock could significantly decline.
The market price of our common stock could decline as a result of sales of a large number of shares of common stock in the public market or the perception that such sales could occur. These sales, or the possibility that these sales may occur, might make it more difficult for us to sell equity securities in the future at a time and at a price that we deem appropriate.
As of March 13, 2013, we had approximately 47.4 million shares of common stock outstanding. Of those shares, approximately 1.1 million shares are restricted shares subject to vesting periods of up to three years. The remainder of these shares are freely tradable.
In addition, 0.2 million shares are issuable upon the exercise of presently outstanding stock options under our employee incentive plans and 3.0 million shares are issuable upon the exercise of presently outstanding options and warrants outside our employee incentive plans. Also 7.3 million shares are issuable upon the conversion of our 5.5% convertible notes, based upon the conversion price of $18.51 per share; 4.2 million shares are issuable upon conversion of our Series C preferred stock (“Series C Preferred Stock”), based upon the conversion price of $8.75 per share; and 4.3 million shares are issuable upon conversion of our 11.5% Convertible Bonds (as defined below), based on a conversion price of $16.52 per share.
33
Endeavour International Corporation
Provisions in our articles of incorporation, bylaws and the Nevada Revised Statutes may discourage a change of control.
Certain provisions of our amended and restated articles of incorporation and amended and restated bylaws and the Nevada Revised Statutes (“NRS”) could delay or make more difficult a change of control transaction or other business combination that may be beneficial to stockholders. These provisions include, but are not limited to, the ability of our board of directors to issue a series of preferred stock, classification of our board of directors into three classes and limiting the ability of our stockholders to call a special meeting.
We are subject to the “Combinations with Interested Stockholders Statute” and the “Control Share Acquisition Statute” of the NRS. The Combinations Statute with Interested Stockholders provides that specified persons who, together with affiliates and associates, own, or within three years did own, 10% or more of the outstanding voting stock of a corporation cannot engage in specified business combinations with the corporation for a period of two years after the date on which the person became an interested stockholder, unless the combination or the transaction by which the person first became an interested stockholder is approved by the corporation’s board of directors before the person first became an interested stockholder.
The Control Share Acquisition Statute provides that persons who acquire a “controlling interest” as defined by the statute, in a company may only be given full voting rights in their shares if such rights are conferred by the stockholders of the company at an annual or special meeting. However, any stockholder that does not vote in favor of granting such voting rights is entitled to demand that the company pay fair value for their shares if the acquiring person has acquired at least a majority of all of the voting power of the company. As such, persons acquiring a controlling interest may not be able to vote their shares.
Item 1B. Unresolved Staff Comments
None.
Item 2. Properties
Drilling Statistics
A well is considered productive for purposes of the following table if it justifies the installation of permanent equipment for the production of oil or gas. The information contained in the table should not be considered indicative of future performance, nor should it be assumed that there is necessarily any correlation between the number of productive wells drilled, quantities of reserves found or economic value. The following table shows the results of the oil and gas wells in which we participated, drilled and tested during 2012, 2011 and 2010:
34
Endeavour International Corporation
| | | | | | | | | | | | | | | | | | | | | | | | |
| | | Productive Wells | | | Dry Holes | | | In Progress Wells | |
| | | Gross | | | Net | | | Gross | | | Net | | | Gross | | | Net | |
Exploration | | | | | | | | | | | | | | | | | | | | | | | | |
2012: | | | | | | | | | | | | | | | | | | | | | | | | |
United States | | | — | | | | — | | | | — | | | | — | | | | 4 | | | | 1.00 | |
2011: | | | | | | | | | | | | | | | | | | | | | | | | |
United Kingdom | | | — | | | | — | | | | — | | | | — | | | | 1 | | | | 0.20 | |
United States | | | — | | | | — | | | | 2 | | | | 1.00 | | | | 4 | | | | 1.00 | |
2010: | | | | | | | | | | | | | | | | | | | | | | | | |
United Kingdom | | | 3 | | | | 0.38 | | | | 1 | | | | 0.10 | | | | — | | | | — | |
United States | | | — | | | | — | | | | — | | | | — | | | | 2 | | | | 1.00 | |
Development | | | | | | | | | | | | | | | | | | | | | | | | |
2012: | | | | | | | | | | | | | | | | | | | | | | | | |
United Kingdom | | | 4 | | | | 1.11 | | | | — | | | | — | | | | 1 | | | | 0.44 | |
United States | | | 2 | | | | 0.66 | | | | — | | | | — | | | | 3 | | | | 3.00 | |
2011: | | | | | | | | | | | | | | | | | | | | | | | | |
United Kingdom | | | 4 | | | | 0.09 | | | | — | | | | — | | | | 3 | | | | 0.90 | |
United States | | | 16 | | | | 4.36 | | | | — | | | | — | | | | 4 | | | | 1.66 | |
2010: | | | — | | | | — | | | | — | | | | — | | | | 2 | | | | 0.05 | |
United Kingdom | | | 13 | | | | 3.00 | | | | — | | | | — | | | | 2 | | | | 1.00 | |
We do not own any drilling rigs, and all of our drilling activities are conducted by independent drilling contractors.
35
Endeavour International Corporation
Productive Well Summary
At December 31, 2012, our productive wells included the following:
| | | | | | | | | | | | | | | | |
| | | Oil Wells | | | Gas Wells | |
| | | Gross | | | Net | | | Gross | | | Net | |
United Kingdom | | | 37 | | | | 8.66 | | | | — | | | | — | |
United States | | | 3 | | | | 1.63 | | | | 44 | | | | 14.91 | |
| | | | | | | | | | | | | | | | |
Total | | | 40 | | | | 10.29 | | | | 44 | | | | 14.91 | |
| | | | | | | | | | | | | | | | |
Reserves
Our proved oil and gas reserves at December 31, 2012, 2011 and 2010 included the following:
| | | | | | | | | | | | |
| | | Oil | | | Gas | | | Oil Equivalents | |
| | | (MBbls) | | | (MMcf) | | | (MBOE) | |
2012: | | | | | | | | | | | | |
United Kingdom | | | 13,733 | | | | 56,901 | | | | 23,217 | |
United States | | | 6 | | | | 14,690 | | | | 2,454 | |
| | | | | | | | | | | | |
| | | 13,739 | | | | 71,591 | | | | 25,671 | |
| | | | | | | | | | | | |
2011: | | | | | | | | | | | | |
United Kingdom | | | 4,060 | | | | 50,723 | | | | 12,514 | |
United States | | | 41 | | | | 60,978 | | | | 10,204 | |
| | | | | | | | | | | | |
| | | 4,101 | | | | 111,701 | | | | 22,718 | |
| | | | | | | | | | | | |
2010: | | | | | | | | | | | | |
United Kingdom | | | 3,664 | | | | 56,177 | | | | 13,027 | |
United States | | | 59 | | | | 31,777 | | | | 5,355 | |
| | | | | | | | | | | | |
| | | 3,723 | | | | 87,954 | | | | 18,382 | |
| | | | | | | | | | | | |
At December 31, 2012, the Alba field, in the U.K. North Sea, represented more than 15% of our proved reserves, with 9.9 MMBOE, 1.2 MMBOE and 0.9 MMBOE of our proved reserves at December 31, 2012, 2011 and 2010, respectively.
The Rochelle field, one of our non-producing North Sea development assets, represented more than 15% of our proved reserves at December 31, 2012, 2011, and 2010. Rochelle had 9.0 MMBOE, 8.2 MMBOE and 9.4 MMBOE of proved reserves at December 31, 2012, 2011and 2010, respectively.
36
Endeavour International Corporation
At December 31, 2011, the Grand Cane field, a gas field in the Haynesville area, represented more than 15% of our proved reserves, with 3.8 MMBOE and 0.1 MMBOE of proved reserves at December 31, 2011 and 2010, respectively.
Our proved undeveloped reserves are primarily related to our development projects in the U.K. and the results of successful exploration drilling in the U.S. We expect our proved undeveloped reserves in the U.K. to become proved developed reserves over the next two years as development plans are completed and production commences on Rochelle. In the U.S., all proved undeveloped reserves in 2012 were removed from proved reserves due to adverse gas market conditions. When market conditions improve, it is expected that these undeveloped reserves will be economic to develop and will be restored to proved reserves. See Note 5 to our consolidated financial statements in “Item 8. Financial Statements and Supplementary Data” for additional information on the costs associated with our proved developed reserves and unproved properties. Our proved developed and undeveloped oil and gas reserves at December 31, 2012, 2011 and 2010 included the following:
| | | | | | | | | | | | |
| | | Proved
Developed
Reserves | | | Proved
Undeveloped
Reserves | | | Total
Proved
Reserves | |
| | | (MBOE) | | | (MBOE) | | | (MBOE) | |
2012: | | | | | | | | | | | | |
United Kingdom | | | 5,785 | | | | 17,432 | | | | 23,217 | |
United States | | | 2,454 | | | | — | | | | 2,454 | |
| | | | | | | | | | | | |
| | | 8,239 | | | | 17,432 | | | | 25,671 | |
| | | | | | | | | | | | |
2011: | | | | | | | | | | | | |
United Kingdom | | | 1,402 | | | | 11,112 | | | | 12,514 | |
United States | | | 3,825 | | | | 6,379 | | | | 10,204 | |
| | | | | | | | | | | | |
| | | 5,227 | | | | 17,491 | | | | 22,718 | |
| | | | | | | | | | | | |
2010: | | | | | | | | | | | | |
United Kingdom | | | 1,333 | | | | 11,694 | | | | 13,027 | |
United States | | | 2,227 | | | | 3,128 | | | | 5,355 | |
| | | | | | | | | | | | |
| | | 3,560 | | | | 14,822 | | | | 18,382 | |
| | | | | | | | | | | | |
Preparation of Oil and Gas Reserve Information
We have established internal controls over reserve estimation processes and procedures to support the accurate and timely preparation and disclosure of reserve estimations in accordance with SEC and GAAP requirements. These controls include oversight of the reserves estimation reporting processes by our technical staff, annual external audits of all of our proved reserves by independent reserve engineers and secured access to reservoir databases and systems. Proved reserve estimates are prepared by our technical staff and reviewed and approved by our executive team, including our Executive Vice-President – International and Executive Vice President –
37
Endeavour International Corporation
North America. In addition, we have a “Technology and Reserves” committee of our Board of Directors. The committee supports the board by providing increased focus on emerging technologies in the upstream industry and oversight of our reserve evaluation and reporting processes. Reserves are reviewed internally with senior management quarterly and presented to the Technology and Reserves Committee and our Board of Directors on an annual basis for their review.
Our oil and gas reserve estimates were prepared by our internal reservoir engineers and audited by independent reserve engineers, Netherland, Sewell & Associates, Inc. (“NSAI”).
Each year, our internal technical staff evaluates all technical data available on each field, including production data, well logs, pressure data, petrophysical analysis, fluid properties, seismic data, seismic interpretations and well control along with offset well data. We estimate the quantity of oil and gas reserves and provide our estimates, analysis and data to our independent reserve engineers.
Qualification of Reserves Preparers and Auditors
We employ oil and gas technical professionals, including geophysicists, petrophysicists, geologists, and reservoir engineers, who have 10 to 35 years of experience in their technical fields. Our Director of Reservoir Engineering, who has over 25 years of experience and a master’s degree in petroleum engineering, supervises our technical professionals in the evaluation and estimation of our oil and gas reserves. In addition, we engage experienced and qualified consultants to perform various comprehensive seismic acquisitions, processing, reprocessing, interpretation, and other related services.
The reserves estimates shown herein have been independently evaluated by Netherland, Sewell & Associates, Inc. (“NSAI”), a worldwide leader of petroleum property analysis for industry and financial organizations and government agencies. NSAI was founded in 1961 and performs consulting petroleum engineering services under Texas Board of Professional Engineers Registration No. F-2699. Within NSAI, the technical persons primarily responsible for preparing the estimates set forth in the NSAI reserves report incorporated herein meet or exceed the education, training, and experience requirements set forth in the Standards Pertaining to the Estimating and Auditing of Oil and Gas Reserves Information promulgated by the Society of Petroleum Engineers; both are proficient in judiciously applying industry standard practices to engineering and geoscience evaluations as well as applying SEC and other industry reserves definitions and guidelines. NSAI opined that the overall proved reserves for the reviewed properties as estimated by us are, in the aggregate, reasonable, prepared in accordance with generally accepted petroleum engineering and evaluation principles and conform to the SEC’s definition of proved reserves as set forth in Rule 210.4-10(a) of Regulation S-X. NSAI has informed us that the tests and procedures used during its reserves audit conform to the Standards Pertaining to the Estimating and Auditing of Oil and Gas Reserves Information promulgated by the Society of Petroleum Engineers. Paragraph 2.2(f) of the Standards Pertaining to the Estimating and Auditing of Oil and Gas Reserves Information defines a reserves audit as the process of reviewing certain of the pertinent facts interpreted and assumptions made that have resulted in an estimate of reserves prepared by others and the rendering of an opinion about:
38
Endeavour International Corporation
| | • | the appropriateness of the methodologies employed; |
| | • | the adequacy and quality of the data relied upon; |
| | • | the depth and thoroughness of the reserves estimation process; |
| | • | the classification of reserves appropriate to the relevant definitions used; and |
| | • | the reasonableness of the estimated reserve quantities. |
A reserve audit is not the same as a financial audit and is less rigorous in nature than an independent reserve report where the independent reserve engineer determines the reserves on his or her own.
Acreage
The following table sets forth certain information regarding our developed and undeveloped acreage as of December 31, 2012, in the areas indicated.
| | | | | | | | | | | | | | | | |
| | | Developed | | | Undeveloped | |
| | | Gross | | | Net | | | Gross | | | Net | |
United Kingdom | | | 48,971 | | | | 15,393 | | | | 268,124 | | | | 86,077 | |
United States | | | 8,301 | | | | 4,219 | | | | 516,371 | | | | 149,628 | |
| | | | | | | | | | | | | | | | |
Total | | | 57,272 | | | | 19,612 | | | | 784,495 | | | | 235,705 | |
| | | | | | | | | | | | | | | | |
As of December 31, 2012, we had approximately 49,300, 15,800 and 36,000 net acres in the U.K. and U.S combined that are scheduled to expire by December 31, 2013, 2014 and 2015, respectively, if we take no action to continue the term of the underlying license through operational or administrative actions. This includes all of our acreage in Alabama, where we have 14,800 net acres and have suspended operations. It also includes approximately 33,600 net acres in Montana that will expire in 2013-2015, where we have rights to extend certain leases for an additional five years. We have a total of 88,900 net acres in Montana. For our other acreage in the U.S. and U.K., we currently have plans to continue the terms of various licenses through operational or administrative actions and do not expect a significant portion of our net acreage position to expire before such actions occur.
Sales Volumes and Prices
Information regarding our annual average sales volumes, sales prices and average production costs is contained in Item 7 of this Annual Report on Form 10-K. Additional detail of production costs is contained in Note 25 to our consolidated financial statements under Item 8 of this Annual Report on Form 10-K.
At December 31, 2011, the Grand Cane field, in the Haynesville area, represented more than 15% of our proved reserves. Grand Cane is a gas field and represented 1,921 MMcf, 662 MMcf and 48 MMcf of our gas sales in 2012, 2011 and 2010, respectively.
39
Endeavour International Corporation
At December 31, 2012, the Alba field, in the U.K. North Sea, represented more than 15% of our proved reserves. Alba is an oil field and represented 1,263 Mbbls, 191 Mbbls and 231 Mbbls of our oil sales in 2012, 2011 and 2010, respectively.
Item 3. Legal Proceedings
We are a party to various lawsuits, claims, and proceedings from time to time in the ordinary course of business. These proceedings are subject to uncertainties inherent in any litigation, and the outcome of these matters is inherently difficult to predict with any certainty. We believe that the amount of any potential loss associated with these proceedings would not be material to our consolidated financial position; however, in the event of an unfavorable outcome, the potential loss could have an adverse effect on our results of operations and cash flow in the reporting periods in which any such actions are resolved.
Terminated Acquisition of Marcellus Assets
On July 17, 2011, we entered into agreements with SM Energy for the purchase of oil and gas leases, producing properties, geophysical data, a pipeline and related assets in the Marcellus shale play in Pennsylvania for aggregate consideration of approximately $110 million. We terminated the agreements on December 14, 2011, based on our conclusion that (i) the title defects we identified, after analyzing SM Energy’s responses to the notice of defects and valuation of the defects, exceeded the contractual threshold of 15% of the purchase price for the applicable asset group ($85 million); and (ii) the condition of the pipeline was not in compliance with applicable regulatory standards, which would constitute a material violation of a representation and warranty contained in the applicable SM Purchase Agreement.
SM Energy filed a lawsuit against us in Texas state court on December 20, 2011 alleging that we breached the SM Purchase Agreements by terminating them and refusing to close on the transactions. Specifically, SM Energy has alleged, among other things, that most of our asserted title defects are without merit and, in any event, would not exceed 15% of the applicable purchase price. SM Energy seeks the award of unspecified actual damages, including costs and reasonable attorney’s fees, and specific performance. On January 17, 2012, we filed an answer and counterclaim denying the allegations and seeking the return of our $6 million deposit, which we believe we are entitled to recover pursuant to the terms of the SM Purchase Agreements, and for the damages that we suffered as a result of SM Energy’s misrepresentations. We intend to contest the case vigorously.
Item 4. Mine Safety Disclosures
Not applicable.
40
Endeavour International Corporation
Part II
Item 5. Market for Registrant’s Common Equity, Related Stockholder Matters and Issuer Purchases of Equity Securities
On March 15, 2011, we completed the transfer of the primary listing for our common stock from the NYSE Amex to the New York Stock Exchange (“NYSE”) under the symbol “END.” Our common stock is also listed on the London Stock Exchange under the symbol “ENDV.”
Reverse Stock Split
In October 2010, our Board of Directors authorized a share consolidation of our common stock, in the form of a one-for-seven reverse stock split, effective at the opening of trading on November 18, 2010. As a result of the share consolidation, every seven shares of our common stock outstanding were automatically combined into one share of our common stock. All share information and prices per share discussed in this Annual Report on Form 10-K have been restated to reflect the share consolidation.
Historical Stock Prices
The following table sets forth the range of high and low prices per share of our common stock for each of the calendar quarters identified below as reported by the NYSE, and prior to March 15, 2011, the NYSE Amex. These quotations represent inter-dealer prices, without retail mark-up, markdown or commission, and may not represent actual transactions.
| | | | | | | | | | | | | | | | |
| | | 2012 | | | 2011 | |
| | | High | | | Low | | | High | | | Low | |
First Quarter | | $ | 13.48 | | | $ | 8.81 | | | $ | 14.51 | | | $ | 11.13 | |
Second Quarter | | | 13.21 | | | | 5.73 | | | | 15.14 | | | | 11.59 | |
Third Quarter | | | 10.48 | | | | 7.37 | | | | 16.43 | | | | 7.27 | |
Fourth Quarter | | | 10.02 | | | | 4.66 | | | | 10.23 | | | | 5.80 | |
Holders
As of March 13, 2013, the number of holders of record of our common stock was 165. We believe that there are a number of additional beneficial owners of our common stock who hold such shares in street name.
41
Endeavour International Corporation
Dividends
We have not paid any cash dividends on our common stock to date and have no intention of declaring or paying any cash dividends on our common stock in the foreseeable future. The declaration and payment of dividends is subject to the discretion of our Board of Directors and to certain limitations imposed under Nevada corporate laws and the agreements governing our debt obligations. The timing, amount and form of dividends, if any, will depend on, among other things, our results of operations, financial condition, cash requirements and other factors deemed relevant by our Board of Directors.
Our Series B preferred stock is subject to a cumulative 8% dividend (the “Series B Preferred Stock”). Unless the full amount of the foregoing dividends accrued for the Series B Preferred Stock is paid in full, we cannot declare or pay any dividend on our common stock. In addition, certain of our debt facilities contain restrictions on the payment of dividends to the holders of our common stock.
Our Series C Preferred Stock is subject to a cumulative dividend, payable in cash or common stock at 4.5% or 4.92%, respectively. Dividends on the Series C Preferred Stock also participate in any dividends paid on our common stock and are payable to the preferred stock investors prior to payment of any other dividend on any other shares of our capital stock.
Shareholder Return Performance Presentation
The performance graph shown below was prepared based upon the following assumptions:
| | • | $100 was invested in our Common Stock on December 31, 2007, and $100 was invested in each of the S&P 500 Index and the industry peer group (“Peer Group”) on December 31, 2007 at the closing price on such date. |
| | • | The Peer Group investment is weighted based on the market capitalization of each individual company within the applicable peer group at the beginning of the period and each year. |
| | • | Dividends are reinvested on the ex-dividend dates. |
The Peer Group is comprised of the following oil and gas producers: Carrizo Oil & Gas Inc.; Crimson Exploration Inc.; Gastar Exploration, Ltd.; Goodrich Petroleum Corp.; McMoRan Exploration Co.; Rosetta Resources, Inc.; Swift Energy Co.; and W&T Offshore Inc. The performance of the indices is shown on a total return (dividend reinvestment) basis; however, we paid no dividends on our Common Stock during the period shown. The graph lines merely connect the beginning and end of the measuring periods and do not reflect fluctuations between those dates.
42
Endeavour International Corporation
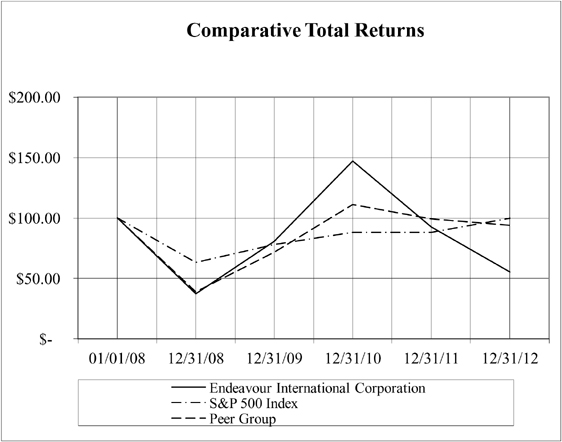
There can be no assurance that the Company’s stock performance will continue into the future with the same or similar trends depicted in the performance graph. The Company will not make or endorse any predictions as to future stock performance.
Item 6. Selected Financial Data
The following table sets forth some of our historical consolidated financial data for each of the five years ended December 31, 2012. Significant property acquisitions and dispositions during these periods have materially affected the comparability of our year-to-year financial data.
The following data should be read in conjunction with “Item 7. Management’s Discussion and Analysis of Financial Condition and Results of Operations” and the Consolidated Financial Statements and Notes thereto included in “Item 8. Financial Statements and Supplementary Data.” The selected consolidated financial data provided below are not necessarily indicative of our future results of operations or financial performance.
43
Endeavour International Corporation
Summary Financial Data(1)
| | | | | | | | | | | | | | | | | | | | |
(Amounts in thousands, except per share data) | | Year Ended December 31, | |
| | | 2012 | | | 2011 | | | 2010 | | | 2009 | | | 2008 | |
Summary Income Statement Data: | | | | | | | | | | | | | | | | | | | | |
Revenues | | $ | 219,058 | | | $ | 60,091 | | | $ | 71,675 | | | $ | 62,293 | | | $ | 170,781 | |
Operating Profit (Loss) | | | 19,801 | | | | (67,614 | ) | | | 1,327 | | | | (50,398 | ) | | | 18,236 | |
Net Income (Loss) to Common Shareholders | | | (128,049 | ) | | | (132,969 | ) | | | 54,304 | | | | (62,206 | ) | | | 45,681 | |
Net Income (Loss) Per Common Share - Basic: | | | | | | | | | | | | | | | | | | | | |
Continuing Operations | | $ | (3.01 | ) | | $ | (3.70 | ) | | $ | 2.34 | | | $ | (5.84 | ) | | $ | 0.82 | |
Discontinued Operations | | | — | | | | — | | | | — | | | | 2.50 | | | | 1.67 | |
| | | | | | | | | | | | | | | | | | | | |
Total | | $ | (3.01 | ) | | $ | (3.70 | ) | | $ | 2.34 | | | $ | (3.34 | ) | | $ | 2.49 | |
| | | | | | | | | | | | | | | | | | | | |
Net Income (Loss) Per Common Share - Diluted: | | | | | | | | | | | | | | | | | | | | |
Continuing Operations | | $ | (3.01 | ) | | $ | (3.70 | ) | | $ | 1.95 | | | $ | (4.70 | ) | | $ | 0.59 | |
Discontinued Operations | | | — | | | | — | | | | — | | | | 2.50 | | | | 1.20 | |
| | | | | | | | | | | | | | | | | | | | |
Total | | $ | (3.01 | ) | | $ | (3.70 | ) | | $ | 1.95 | | | $ | (2.20 | ) | | $ | 1.79 | |
| | | | | | | | | | | | | | | | | | | | |
Summary Balance Sheet Data: | | | | | | | | | | | | | | | | | | | | |
Working Capital | | $ | (39,605 | ) | | $ | 38,351 | | | $ | 71,145 | | | $ | 24,885 | | | $ | 22,902 | |
Total Assets | | | 1,442,472 | | | | 924,991 | | | | 750,287 | | | | 538,879 | | | | 737,470 | |
Debt, net of discount | | | 859,506 | | | | 467,378 | | | | 345,306 | | | | 223,385 | | | | 227,855 | |
Convertible Preferred Stock | | | 43,703 | | | | 43,703 | | | | 53,152 | | | | 59,058 | | | | 125,000 | |
Equity | | | 99,431 | | | | 154,079 | | | | 154,618 | | | | 60,133 | | | | 117,971 | |
| (1) | Includes the following: |
| | • | acquisition of an additional 23.43% interest in the Alba field in 2012; |
| | • | acquisition of producing properties and exploration acreage in the U.S. in 2009 and 2010; |
| | • | disposition of our interests in the Cygnus reserves in 2010 for a gain of $87 million; |
| | • | disposition of our discontinued operations in Norway in 2009 for a gain of $47 million; |
| | • | impairments of $53.1 million, $65.7 million, $7.7 million, $43.9 million, and $37.0 million, in 2012, 2011, 2010, 2009, and 2008, respectively; and |
| | • | unrealized gains (losses) on derivatives of $5.1 million, $8.4 million, $12.3 million, $(55.6) million, and $76.7 million, in 2012, 2011, 2010, 2009, and 2008, respectively. |
Information regarding each of these transactions is included in the notes to the Consolidated Financial Statements included elsewhere in this report.
44
Endeavour International Corporation
Item 7. Management’s Discussion and Analysis of Financial Condition and Results of Operations
This Management’s Discussion and Analysis of Financial Condition and Results of Operations and other parts of this Annual Report on Form 10-K contain forward-looking statements that involve risks and uncertainties. All forward-looking statements included in this Annual Report on Form 10-K are based on information available to us on the date hereof, and we assume no obligation to update any such forward-looking statements. Our actual results could differ materially from those anticipated in these forward-looking statements as a result of a number of factors, including those set forth in the section captioned “Risk Factors” in Item 1A and elsewhere in this Annual Report on Form 10-K. The following should be read in conjunction with the audited financial statements and the notes thereto included in “Item 8. Financial Statements and Supplementary Data.” The following discussion also includes non-GAAP financial measures, which may not be comparable to similarly titled measures presented by other companies. Accordingly, we strongly encourage investors to review our financial statements in their entirety and not rely on any single financial measure.
Overview
We are an independent oil and gas company engaged in the production, exploration, development and acquisition of crude oil and natural gas in the U.K. North Sea and U.S. onshore. Our U.K. operations have been focused on development projects and acquisition, while our U.S. operations are spending minimal capital, primarily on strategic positioning, while we monitor U.S. gas prices. During 2012 and 2011, our primary focus has been on completing the acquisition of additional interests in both the Bacchus and Alba fields and then moving the Bacchus and Rochelle fields from development to first production. By the end of 2012, we had made progress toward those goals. We closed on the Bacchus and Alba acquisitions in 2011 and 2012, respectively, and achieved first production at Bacchus during the second quarter of 2012. Our goal for 2012 was to increase production, cash flows and proved reserves as we believe that longer-term this creates value for our shareholders. During 2012, and as a result of the above events, we:
| | • | increased production year over year by 231%; |
| | • | increased proved reserves year over year in the UK by 186% and overall by 113%; and |
| | • | increased production cash flows to $160.6 million. |
During the third quarter of 2012, we began drilling the first of two planned development wells at Rochelle. We completed the hook-up of the pipelines and flow-lines to the subsea manifolds for the field but encountered operational difficulties following severe weather in early 2013. As a result, we have suspended drilling operations on the East Rochelle well and moved the rig to the second well site at West Rochelle. While we had originally anticipated first production at Rochelle would occur in the fourth quarter of 2012, delays in receiving the drilling rig, the operational difficulties at East Rochelle and the further estimated time to drill West Rochelle have delayed our anticipated first production until mid-2013 at the earliest.
45
Endeavour International Corporation
During 2010, we acquired both producing and exploration acreage in U.S. onshore unconventional oil and gas shale developments targeting reserve and production growth. Our ongoing U.S. program and expenditures have been tailored based on drilling results and the decline in U.S. gas prices over the last several years. We have limited capital expenditures to those necessary to fulfill drilling commitments and maintain acreage positions.
In the last two years, we have incurred substantial capital expenditures and acquisition costs as we advanced development projects at Bacchus and Rochelle and completed acquisitions. We also experienced delays in the timing of first production from our Bacchus and Rochelle developments, a slowing of production from our U.S. drilling operations as we curtailed the U.S. drilling program in response to declining U.S. gas prices, increased capital costs due to the production delays at Bacchus and Rochelle projects and increased debt service costs required to financing the drilling and acquisition program. The production delays and increased capital costs and debt service costs placed a strain on our cash flow from operations and our ability to reduce our debt leverage.
Strategic Alternatives
As discussed previously, in February 2013, we initiated a review of strategic alternatives and will announce the results of the effort once a course of action is chosen. The primary objective of the strategic review is to accelerate the deleveraging of the balance sheet and unlock the value of our underlying assets. The Board of Directors will consider a full range of options, including:
| | • | a sale, joint venture or partnership in respect of our activities in the North Sea; |
| | • | a sale of specific assets; |
| | • | a sale or merger of the Company; or |
| | • | continuing to execute on our operational plan. |
Tudor, Pickering, Holt & Co. and Lambert Energy Advisory Ltd. have been engaged as our financial advisors in this process. There is no assurance that this strategic alternatives review will result in a change to our current business plan, pursuing a particular transaction or completing any such transaction.
Since year-end 2012, we have also completed several transactions to improve our liquidity position and extended the maturities of some of our debt and other obligations. The completion of these recent financing activities are designed to provide sufficient liquidity to bring the Rochelle development on line, drill a third well at Bacchus and allow sufficient time for a thoughtful and disciplined strategic review process. These transactions include:
| | • | extended or replaced reimbursement agreements covering certain of our abandonment liabilities in the U.K. which would have expired in 2013; |
| | • | entered into a forward sale agreement for a payment of approximately $22.5 million in return for a specified volume of crude oil in excess of 200,000 barrels to be delivered over a six month delivery period from our UK North Sea production; |
| | • | entered into a sale and purchase agreement (the “Sale and Purchase Agreement”) for $107.5 million providing for the sale and purchase of a monetary production payment; and |
46
Endeavour International Corporation
| | • | extended the maturity of approximately $100 million of the commitments under our revolving credit facility (“ Revolving Credit Facility”) from October 12, 2013 to June 30, 2014. |
Each of these transactions are discussed in Note 24 to our consolidated financial statements in “Item 8. Financial Statements and Supplementary Data.”
2013 Liquidity and Capital Resources
During 2013, our primary uses of financial resources are expected to be:
| | • | our drilling activities, principally at our Alba, Bacchus and Rochelle fields in the U.K.; and |
| | • | interest payments on existing credit facilities and fees related to our reimbursement agreements covering our abandonment obligations. |
As of December 31, 2012, we had $815.0 million in outstanding indebtedness, net of $59.2 million in cash. Being highly leveraged, servicing our debt and other long-term obligations will continue to require a significant portion of our cash flow from operations and available cash on hand. The combination of these debt servicing requirements, capital expenditures and the delay in cash flow resulting from the mechanical issues experienced at the Rochelle field may exceed the cash flow from our current operations. Ultimately, our primary uses and sources of financial resources will be impacted by the outcome of our strategic review.
If we are unable to meet any short-term liquidity needs out of cash on hand, we would attempt to refinance debt, sell forward our production, sell assets, issue debt or equity, delay discretionary capital expenditures, decline to participate in non-operated drilling or perform any other alternatives resulting from our strategic review. No assurance can be given however that we could successfully consummate any of these alternatives.
Results of Operations
Our revenues and cash flows from operating activities are very sensitive to changes in the prices we receive for the oil and natural gas we produce. Our production is sold at prevailing market prices, which may be volatile and subject to numerous factors which are outside of our control. Further, the current tightly balanced supply and demand market means a small variation in supply or demand can significantly impact the market prices for these commodities. Our realized price per BOE, before derivatives, increased from $48.67 per BOE in 2011 to $76.07 per BOE in 2012. Our revenues increased from $60.1 million for the year ended December 31, 2011 to $219.1 million for 2012, primarily as a result of higher production volumes related to first production from Bacchus in the second quarter of 2012 and our purchase of the additional interest in Alba. Our revenues decreased from $71.7 million for the year ended December 31, 2010 to $60.1 million for 2011 primarily as a result of lower production volumes from our producing assets partially offset by higher commodity prices.
47
Endeavour International Corporation
In October 2010, we sold our interests in the Cygnus reserves in the Southern Gas Basin of the North Sea for $110 million (the “Cygnus Sale”). Upon the closing of that transaction, we recognized a gain of $87 million. The cash proceeds were not burdened by any taxes payable and were primarily used to accelerate our development projects and fund our acquisition of an additional 20% interest in the Bacchus field, which closed in February 2011.
For 2012, net loss to common stockholders was $(128.0) million, or $(3.01) per diluted share. This net loss includes a $53.1 impairment related to our U.S. properties, increased interest expense resulting from borrowings under existing debt agreements and issuances of new debt obligations and a loss on the early extinguishment of debt of $21.7 million. Net loss to common stockholders was $(133.0) million for 2011, or $(3.70) per diluted share. Net income to common stockholders for 2010 was $54.3 million, or $1.95 per diluted share, including a gain on the Cygnus Sale of $87 million.
Net income can be significantly affected by various non-cash items, such as unrealized gains and losses on our commodity derivatives, currency impact of long-term liabilities and deferred taxes. Cash flow provided by (used in) operations was $38.6 million in 2012 versus $(39.3) million in 2011 and $17.0 million in 2010. Adjusted EBITDA (as defined below) was $129.9 million in 2012, as compared to $25.1 million in 2011 and $124.8 million in 2010. These fluctuations in Adjusted EBITDA are primarily due to the changes in our production volumes, interest expense and operating costs. In addition, Adjusted EBITDA for 2010 includes the gain on the Cygnus Sale.
Given the significant impact that non-cash items may have on our net income, we use various measures in addition to net income, including non-financial performance indicators and non-GAAP measures as key metrics to manage our business. These key metrics demonstrate our company’s ability to maintain or grow production levels and reserves, internally fund capital expenditures and service debt as well as provide comparisons to other oil and gas exploration and production companies. These measures include, among others, debt and cash balances, production levels, oil and gas reserves, drilling results, adjusted earnings before interest, taxes, depreciation, depletion and amortization (“Adjusted EBITDA”) and net income as adjusted.
Net loss as adjusted for 2012 was $(54.2) million. Net loss as adjusted for 2011 was $(49.7) million, as compared to net income as adjusted of $57.4 million in 2010.
For definitions of net income as adjusted and Adjusted EBITDA, and a reconciliation of these non-GAAP measures to the appropriate GAAP measure, please see “Non-GAAP Financial Measures and Reconciliations.”
Revenues
Our revenues and sales volumes have fluctuated significantly during the last three years primarily due to the following:
| | • | Our revenues increased from $60.1 million for the year ended December 31, 2011 to $219.1 million for the year ended December 31, 2012, primarily due to increases in U.K. oil production from our increased interest in the Alba field and initial production from the Bacchus field. |
48
Endeavour International Corporation
| | • | As a result of substantially decreased U.K. gas production from the Goldeneye field and decreases in U.S. natural gas prices, partially offset by increased oil prices, our revenues decreased from $71.7 million for the year ended December 31, 2010 to $60.1 million for the year ended December 31, 2011. |
| | • | U.S. production increased from 2010 to 2011 primarily due to the results of our successful drilling and completion of wells during 2010. |
49
Endeavour International Corporation
The following table shows our annual average sales volumes, sales prices and average production costs.
| | | | | | | | | | | | |
| | | Year Ended December 31, | |
| | | 2012 | | | 2011 | | | 2010 | |
Sales volume(1) | | | | | | | | | | | | |
Oil and condensate sales (Mbbls): | | | | | | | | | | | | |
United Kingdom | | | 1,994 | | | | 373 | | | | 545 | |
United States | | | 3 | | | | 7 | | | | 6 | |
| | | | | | | | | | | | |
Total | | | 1,997 | | | | 380 | | | | 551 | |
| | | | | | | | | | | | |
Gas sales (MMcf): | | | | | | | | | | | | |
United Kingdom | | | 91 | | | | 94 | | | | 3,071 | |
United States | | | 5,207 | | | | 5,033 | | | | 2,636 | |
| | | | | | | | | | | | |
Total | | | 5,298 | | | | 5,127 | | | | 5,707 | |
| | | | | | | | | | | | |
Oil equivalent sales (MBOE) | | | | | | | | | | | | |
United Kingdom | | | 2,009 | | | | 388 | | | | 1,057 | |
United States | | | 871 | | | | 846 | | | | 445 | |
| | | | | | | | | | | | |
Total | | | 2,880 | | | | 1,234 | | | | 1,502 | |
| | | | | | | | | | | | |
Total BOE per day | | | 7,868 | | | | 3,382 | | | | 4,115 | |
| | | | | | | | | | | | |
Physical production volume (BOE per day)(1): | | | | | | | | | | | | |
United Kingdom | | | 5,494 | | | | 1,095 | | | | 2,904 | |
United States | | | 2,379 | | | | 2,319 | | | | 1,221 | |
| | | | | | | | | | | | |
Total | | | 7,873 | | | | 3,414 | | | | 4,125 | |
| | | | | | | | | | | | |
Realized Price, before and after derivatives: | | | | | | | | | | | | |
Oil and condensate price ($ per Bbl) | | | 103.56 | | | | 109.20 | | | | 76.39 | |
| | | | | | | | | | | | |
Gas price ($ per Mcf) | | | 2.32 | | | | 3.63 | | | | 5.18 | |
| | | | | | | | | | | | |
Equivalent oil price ($ per BOE) | | $ | 76.07 | | | $ | 48.67 | | | $ | 47.72 | |
| | | | | | | | | | | | |
Operating Costs ($ per BOE)(2) | | $ | 20.33 | | | $ | 14.31 | | | $ | 10.22 | |
| | | | | | | | | | | | |
| (1) | We record oil revenues on the sales method and use the entitlements method to account for sales of gas production. Physical production may differ from sales volumes based on the timing of tanker liftings for our international sales. |
| (2) | Operating costs are costs incurred to operate and maintain our wells and related equipment and include cost of labor, well service and repair, location maintenance, power and fuel, transportation, cost of production and production related general and administrative costs. |
Our revenues, profitability and cash flow depend substantially upon the prices and demand for oil and gas and are subject to numerous operational and financial risks, some of which are beyond our control. The markets for these commodities are volatile, and even relatively modest drops in prices can significantly affect our financial results and impede our growth.
The markets in which we sell our oil and natural gas also materially impact our revenues and cash flows. Oil trades on a worldwide market, and, consequently, price movements for all types and grades of crude oil generally trend in the same direction and within a relatively narrow price range. However, natural gas prices vary among geographic areas as the prices received are
50
Endeavour International Corporation
largely impacted by local supply and demand conditions as the global transportation infrastructure for natural gas is still developing. As such, the oil we produce and sell is typically sold at prices in line with global prices, whereas our natural gas is to a large extent impacted by regional supply and demand issues and to a lesser extent by global fuel prices, including oil and coal. The U.S. gas market is heavily impacted by the increased supply from shale drilling, which has served to depress natural gas prices relative to the U.K. market.
Operating Expenses
For 2012, operating expenses increased to $58.5 million as compared to $17.7 million for 2011, primarily due to costs related to our increased interest in the Alba field and initial production from the Bacchus field. Operating costs per BOE increased to $20.33 per BOE for 2012 from $14.31 per BOE for 2011 primarily due to the increasing portion of U.K. operations to our total expenses. In addition, 2012 operating expenses increased as a result of the sale of $9.7 million of oil inventory purchased in the Alba Acquisition. On average, our U.K. operations have higher operating costs per BOE than our U.S. operations, thereby increasing our overall operating costs per BOE.
For 2011, operating expenses increased to $17.7 million as compared to $15.3 million for 2010, primarily due to increased U.S. workover expense and increases in transportation expense and production taxes as a result of increased U.S. sales volumes. Operating costs per BOE increased to $14.31 per BOE for 2011 from $10.22 per BOE for 2010. The increase in operating costs per BOE is due to the impact of both the increases in the dollar levels of operating expenses and the decreased volumes discussed above.
DD&A and Impairment of Oil and Gas Properties
Depreciation, depletion and amortization (“DD&A”) expense increased from 2011 to 2012 primarily due to increased production due to our acquisition of additional interest in Alba and initial production from Bacchus. DD&A expense decreased from 2010 to 2011 as a result of impairments in oil and gas properties. DD&A per BOE was $23.11, $21.45 and $19.24 for the years ended December 31, 2012, 2011 and 2010, respectively.
In 2012, 2011 and 2010, we recorded $53.1 million, $65.7 million and $7.7 million, respectively, in impairment of oil and gas properties, pre-tax, through the application of the full cost ceiling test at the end of each quarter. The 2012 impairment was primarily related to the declines in U.S. gas prices. The 2011 impairment was primarily related to declines in U.S. gas prices and the impact of our determination that the likely economic returns in the future would not warrant further investment in our test wells in the Alabama area. Our decision to discontinue activities in that area resulted in the reclassification of related amounts as being evaluated for full cost accounting purposes.
The impairment during 2010 was also related to our U.S. oil and gas properties, pre-tax, and was primarily due to the declaration of two wells as dry holes during the first quarter of 2010.
51
Endeavour International Corporation
General and Administrative (“G&A”) Expenses
Our G&A expenses increased from $17.9 million in 2011 to $21.1 million for 2012 as a result of an increase in employee compensation expense and an increase in consulting costs associated with the additional staff to pursue the Rochelle development as operator and our expanding U.K. operations. The decrease in G&A expense from $18.4 million in 2010 to $17.9 million in 2011 was a result of a decrease in employee compensation expense, partially offset by an increase in consulting costs.
Non-cash stock-based compensation is comprised of expense related to grants of restricted stock and performance awards, which were granted for the first time in 2012. The restricted stock awards were valued based on the closing price of our common stock on the measurement date, typically the date of grant. The performance awards are valued on the date of grant using a Monte Carlo simulation model. In January 2012, certain of our executive officers were granted a target number of performance shares that will be earned as the relative total shareholder return ranking is measured among a designated peer group at the end of a three-year performance period. Payouts will be based on a predetermined schedule at the end of the performance period and may range from 0% to 200% of the number of performance units. See Note 13 to our consolidated financial statements in “Item 8. Financial Statements and Supplementary Data.”
Components of G&A expenses for these periods are as follows:
| | | | | | | | | | | | |
| | | Year Ended December 31, | |
(Amounts in thousands) | | 2012 | | | 2011 | | | 2010 | |
Compensation | | $ | 20,520 | | | $ | 17,363 | | | $ | 18,110 | |
Consulting, legal and accounting fees | | | 9,160 | | | | 6,461 | | | | 5,843 | |
Other expenses | | | 3,299 | | | | 3,600 | | | | 3,888 | |
| | | | | | | | | | | | |
Total gross cash G&A expenses | | | 32,979 | | | | 27,424 | | | | 27,841 | |
Non-cash stock-based compensation | | | 6,036 | | | | 3,697 | | | | 3,692 | |
| | | | | | | | | | | | |
Gross G&A expenses | | | 39,015 | | | | 31,121 | | | | 31,533 | |
Less: capitalized G&A expenses | | | (17,930 | ) | | | (13,268 | ) | | | (13,118 | ) |
| | | | | | | | | | | | |
Net G&A expenses | | $ | 21,085 | | | $ | 17,853 | | | $ | 18,415 | |
| | | | | | | | | | | | |
Interest Expense and Other
The increase in interest expense from $44.9 million in 2011 to $84.1 million in 2012 reflects the increases in interest expense that occurred as we completed several financing transactions during 2012 and 2011 that have had a significant impact on our interest expense, including the issuance of new debt facilities and the repayment of extinguished debt. Components of interest expense are as follows:
52
Endeavour International Corporation
| | | | | | | | | | | | |
| | | Year Ended December 31, | |
(Amounts in thousands) | | 2012 | | | 2011 | | | 2010 | |
Interest expense on debt outstanding | | $ | 77,128 | | | $ | 10,706 | | | $ | 8,461 | |
Interest expense on retired debt | | | 19,701 | | | | 36,664 | | | | 19,794 | |
Amortization of loan costs and discount | | | 14,179 | | | | 12,234 | | | | 10,262 | |
| | | | | | | | | | | | |
Gross interest expense | | | 111,008 | | | | 59,604 | | | | 38,517 | |
Less: capitalized interest | | | (26,886 | ) | | | (14,711 | ) | | | (3,925 | ) |
| | | | | | | | | | | | |
Net interest expense | | $ | 84,122 | | | $ | 44,893 | | | $ | 34,592 | |
| | | | | | | | | | | | |
Each of our debt instruments and transactions are discussed in Note 9 to our consolidated financial statements in “Item 8. Financial Statements and Supplementary Data.”
53
Endeavour International Corporation
Income Taxes
The following summarizes the components of tax expense (benefit):
| | | | | | | | | | | | | | | | |
(Amounts in thousands) | | U.K. | | | U.S. | | | Other | | | Total | |
Year Ended December 31, 2012: | | | | | | | | | | | | | | | | |
Net income (loss) before taxes | | $ | (22,959 | ) | | $ | (91,383 | ) | | $ | 2,344 | | | $ | (111,998 | ) |
Current tax expense | | | 31,796 | | | | — | | | | 26 | | | | 31,822 | |
Deferred tax benefit | | | (26,181 | ) | | | — | | | | — | | | | (26,181 | ) |
Deferred tax expense related to U.K. tax law change | | | 8,587 | | | | — | | | | — | | | | 8,587 | |
| | | | | | | | | | | | | | | | |
Total tax expense | | | 14,202 | | | | — | | | | 26 | | | | 14,228 | |
| | | | | | | | | | | | | | | | |
Net income (loss) after taxes | | $ | (37,161 | ) | | $ | (91,383 | ) | | $ | 2,318 | | | $ | (126,226 | ) |
| | | | | | | | | | | | | | | | |
Year Ended December 31, 2011: | | | | | | | | | | | | | | | | |
Net income (loss) before taxes | | $ | (9,806 | ) | | $ | (99,409 | ) | | $ | 5,281 | | | $ | (103,934 | ) |
Current tax (benefit) expense | | | 5,926 | | | | 4 | | | | 15 | | | | 5,945 | |
Deferred tax benefit | | | (4,308 | ) | | | — | | | | — | | | | (4,308 | ) |
Deferred tax expense related to U.K. tax law change | | | 25,424 | | | | — | | | | — | | | | 25,424 | |
| | | | | | | | | | | | | | | | |
Total tax expense | | | 27,042 | | | | 4 | | | | 15 | | | | 27,061 | |
| | | | | | | | | | | | | | | | |
Net income (loss) after taxes | | $ | (36,848 | ) | | $ | (99,413 | ) | | $ | 5,266 | | | $ | (130,995 | ) |
| | | | | | | | | | | | | | | | |
Year Ended December 31, 2010: | | | | | | | | | | | | | | | | |
Net income (loss) before taxes | | $ | 90,160 | | | $ | (30,978 | ) | | $ | (3,439 | ) | | $ | 55,743 | |
Current tax (benefit) expense | | | 2,734 | | | | — | | | | (154 | ) | | | 2,580 | |
Deferred tax (benefit) expense | | | (2,388 | ) | | | — | | | | (929 | ) | | | (3,317 | ) |
Foreign currency losses on deferred tax liabilities | | | — | | | | — | | | | (51 | ) | | | (51 | ) |
| | | | | | | | | | | | | | | | |
Total tax (benefit) expense | | | 346 | | | | — | | | | (1,134 | ) | | | (788 | ) |
| | | | | | | | | | | | | | | | |
Net income (loss) after taxes | | $ | 89,814 | | | $ | (30,978 | ) | | $ | (2,305 | ) | | $ | 56,531 | |
| | | | | | | | | | | | | | | | |
We currently do not record tax benefits for losses in the U.S. as there was no assurance that we could generate any U.S. taxable earnings, resulting in a full valuation allowance of all deferred tax assets generated. Therefore, our income tax expense relates primarily to our operations in the U.K. During 2012, the U.K. government enacted legislation (retroactive to March 2012) to restrict decommissioning expenditures to 20% for supplemental corporate tax, in addition to the U.K. corporate tax of 30%. This resulted in total tax relief available for decommissioning at 50%. As a result of this enactment, we incurred additional income tax expense of $8.6 million.
During 2011, $25.4 million of the tax expense is attributable to the increase in the supplemental corporate tax rate due to a tax law change, enacted by the U.K. government, in July 2011, that raised the existing supplementary charge on profits from North Sea oil and gas production from 20% to 32%.
Our current tax expense is related to Petroleum Revenue Tax (“PRT”) on our Alba field in the U.K. The increase in current tax expenses from 2011 to 2012 is primarily due to our acquisition of the additional interest in the Alba field in 2012.
54
Endeavour International Corporation
The following table presents the principal reasons for the difference between our effective tax rates and the United States federal statutory income tax rate of 35%.
| | | | | | | | | | | | |
| | | Year Ended December 31, | |
| | | 2012 | | | 2011 | | | 2010 | |
Federal income tax expense (benefit) at statutory rate | | $ | (39,199 | ) | | $ | (36,378 | ) | | $ | 19,500 | |
Taxation of foreign operations | | | 5,859 | | | | 3,254 | | | | (579 | ) |
Effect of out-of-period adjustment | | | 6,997 | | | | — | | | | — | |
Tax-free gain on sale of reserves in place | | | — | | | | — | | | | (30,510 | ) |
Change in valuation allowance – U.S. | | | 30,329 | | | | 24,604 | | | | (2,252 | ) |
U.K. Tax increase from tax law and rate changes | | | 8,587 | | | | 25,424 | | | | — | |
Foreign currency (gain) loss on deferred taxes | | | — | | | | — | | | | (50 | ) |
Deemed foreign dividend of wholly owned subsidiaries | | | — | | | | 8,572 | | | | 11,466 | |
Disallowed executive compensation | | | 1,655 | | | | 1,585 | | | | 765 | |
Other | | | — | | | | — | | | | 872 | |
| | | | | | | | | | | | |
Total Income Tax Expense | | $ | 14,228 | | | $ | 27,061 | | | $ | (788 | ) |
| | | | | | | | | | | | |
Effective Income Tax Rate | | | -13 | % | | | -26 | % | | | -1 | % |
| | | | | | | | | | | | |
Liquidity and Capital Resources
Our capital expenditures and acquisitions were as follows:
| | | | | | | | | | | | |
| | | Year Ended December 31, | |
(Amounts in thousands) | | 2012 | | | 2011 | | | 2010 | |
Direct Oil & Gas Capital Expenditures: | | | | | | | | | | | | |
U.K. | | $ | 174,138 | | | $ | 97,829 | | | $ | 42,765 | |
U.S. | | | 14,271 | | | | 76,021 | | | | 41,682 | |
| | | | | | | | | | | | |
| | | 188,409 | | | | 173,850 | | | | 84,447 | |
Acquisitions | | | 192,214 | | | | 51,542 | | | | 43,725 | |
| | | | | | | | | | | | |
| | | 380,623 | | | | 225,392 | | | | 128,172 | |
Capitalized G&A, Interest and Other | | | 49,215 | | | | 31,897 | | | | 19,682 | |
Asset Retirement Obligations | | | 137,675 | | | | 14,612 | | | | 2,819 | |
| | | | | | | | | | | | |
Total Capital Expenditures and Acquisitions | | $ | 567,513 | | | $ | 271,901 | | | $ | 150,673 | |
| | | | | | | | | | | | |
Asset Retirement Obligations Paid | | $ | 8,521 | | | $ | 15,256 | | | $ | 9,508 | |
| | | | | | | | | | | | |
55
Endeavour International Corporation
North Sea Acquisition
On December 23, 2011, we entered into a purchase agreement (the “COP Purchase Agreement”), through our wholly owned subsidiary Endeavour Energy UK Limited (“EEUK”), with ConocoPhillips (U.K.) Limited, ConocoPhillips Petroleum Limited and ConocoPhillips (U.K.) Lambda Limited, subsidiaries of ConocoPhillips (collectively, the “Sellers”), to acquire their interest in three producing U.K. oil fields in the Central North Sea. On May 31, 2012, we closed the Alba field portion of this acquisition (the “Alba Acquisition”), which consisted of an additional 23.43% interest in the Alba field. This increased our total working interest in the Alba field to 25.68%. The Alba Acquisition was closed for aggregate cash consideration of approximately $229.6 million.
Concurrently with the closing of the Alba Acquisition, we entered into a reimbursement agreement related to approximately $120 million of abandonment liabilities for the Alba field. Under the agreement, we agreed to reimburse the issuers of letter of credit covering our abandonment liabilities in the event that the letter of credit is drawn. We pay a fee of 13% per year, payable quarterly, computed based on the outstanding amount of each letter of credit. As of December 31, 2012, we do not expect to begin decommissioning activities for the Alba field for many years.
After substantial effort and extensions, we and the Sellers (as defined in Note 3 to the Consolidated Financial Statements) were unable to reach the unanimous agreement and consent required to transfer the interests in the two remaining U.K. oil fields (the MacCulloch and Nicol fields) due to failure to agree on certain commercial terms related to the future timing and amount of collateral required to be posted for future decommissioning costs. As a result of the parties being unable to reach agreement to enable the transfers to occur, the purchase agreement with respect to these two fields was terminated in accordance with its terms on December 14, 2012.
United Kingdom Capital Program
Our capital program in the U.K. for 2012 was focused on two large projects in the North Sea, the Bacchus and Rochelle fields, as well as infield drilling at Alba.
At December 31, 2012, we held a 30% working interest in our Bacchus field asset, which is operated by Apache Corporation, who owns a 50% working interest. During 2012, we drilled the first and second development wells and achieved production in April and July, respectively. With the additional positive data gained from the second development well, the Bacchus partners have decided to observe production results before making a final decision on the placement of the third development well to insure optimization of the entire reservoir. That analysis has been completed and we expect to begin drilling the third well toward the end of the first quarter of 2013.
Our working interest in the Rochelle area is 44% and we are the operator of the field, which is comprised of Blocks 15/26b, 15/26c and 15/27. During the third quarter of 2012, we began drilling the first of two planned development wells. With drilling delays, the Rochelle project subsea infrastructure outpaced the drilling operations. The joint interest partners decided to
56
Endeavour International Corporation
suspend the first well due to the inability to perform simultaneous pipe-lay and development drilling operations. In October 2012, the drilling rig moved off location to allow for the hook-up of the pipelines and flow-lines to the subsea manifolds, thereby delaying our estimated start of production from the fourth quarter of 2012 to the first quarter of 2013. Since October 2012, the pipeline system, umbilicals and tie-ins to the offtake solution at the Scott platform have been completed and tested. In January 2013, the rig returned to the East Rochelle site to continue final drilling.
In February 2013, following a severe storm lasting several days, we performed a routine inspection of the conductor, well head and blow out preventer systems which revealed that the cement around the top of the conductor pipe, which anchors the well to the seabed floor, had been lost creating a non- uniform hole around the conductor. The hole extended approximately 4 to 7 feet in diameter and 25 feet in depth.
As a result of this finding, drilling operations were suspended on the East Rochelle well. The work to repair the cementing around the conductor pipe has been completed. We are conducting a thorough analysis to identify the cause of the cement loss and evaluate if there has been any potential fatigue damage to the conductor pipe itself. Our preliminary findings suggest that swirling currents caused by severe storms created vibrations that liquidized the sands surrounding the cement anchorage. With the loss of integrity of the surrounding sands, those sands were eroded, creating the resulting crater. Our investigation is still ongoing. We are also investigating the structural integrity of the conductor pipe to determine if we can safely re-enter the existing well to complete the drilling phase.
To mitigate delays while we conduct our analysis, we moved the rig to the West Rochelle area and commenced drilling of the second production well. By switching to the West Rochelle area, drilling and completion of the second production well may proceed without the delay. If drilling and completion proceed as expected, we anticipate first production from the West Rochelle well could begin in mid-2013 at the earliest.
We had previously disclosed a potential commitment on a drilling rig in our North Sea operations relating to a dispute with the rig operator. On June 6, 2011, we entered into a settlement agreement with the rig operator whereby the parties were mutually released from all future claims. We incurred costs of $14 million related to the settlement, which are included in capital expenditures.
United States Capital Program
Our primary focus in the U.S. has been onshore unconventional oil and gas developments. During 2011 and 2010, we completed 16 and 13 productive wells, respectively, and had an additional eight and four wells, respectively, awaiting on completion. During 2012, we completed two Haynesville gas wells and currently have three Marcellus wells and four Heath wells waiting on completion. With declining U.S. gas prices, we have limited drilling our capital expenditures in 2012 to primarily those expenditures necessary to maintain our acreage positions and fulfill minor drilling commitments.
57
Endeavour International Corporation
Capital Resources
| | | | | | | | | | | | |
| | | Year Ended December 31, | |
(Amounts in thousands) | | 2012 | | | 2011 | | | 2010 | |
Net cash provided by (used in) operating activities | | $ | 38,613 | | | $ | (39,343 | ) | | $ | 17,019 | |
| | | | | | | | | | | | |
Net cash used in investing activities | | $ | (484,550 | ) | | $ | (166,411 | ) | | $ | (56,314 | ) |
| | | | | | | | | | | | |
Net cash provided by financing activities | | $ | 399,086 | | | $ | 212,523 | | | $ | 111,275 | |
| | | | | | | | | | | | |
Our primary sources of financial resources and liquidity are cash on hand, internally generated cash flows from operations and access to the credit and capital markets, to the extent necessary.
Cash flow provided by (used in) operations increased to $38.6 million for 2012 from $(39.3) million for 2011 due to cash flows from our purchase of the additional interest in Alba. Cash flow provided by (used in) operations decreased to $(39.3) million for 2011 from $17.0 million for 2010 primarily due to lower oil and gas revenue resulting from lower production, and working capital changes, lower gas prices in the U.S. and increased interest expense following our issuance of additional debt facilities. Net cash provided by financing activities has provided the necessary funding for our capital expenditures, primarily related to our two drilling activities at our Bacchus and Rochelle fields in the U.K., and our acquisitions of additional interests in Bacchus and Alba and U.S. acreage.
Our debt facilities, letters of credit, reimbursement agreements and related transactions for 2012, 2011 and 2010 are as follows:
| | • | Revolving Credit Facility:In April 2012, we entered into a $100 million Credit Agreement with Cyan, as administrative agent, which was subsequently increased to $125 million. At December 31, 2012, we have $115 million outstanding under the Revolving Credit Facility. Subsequent to December 31, 2012, we extended the maturity of $100 million of the commitments under our Revolving Credit Facility from October 12, 2013 to June 30, 2014. |
| | • | 2018 Notes:In 2012, we closed the private placement of $554 million of 12% notes due 2018 (the “2018 Notes”). The private placement took place in three parts: |
| | • | | $350 million aggregate principal amount of 12% first priority notes due 2018 (the “First Priority Notes”) in February, priced at 96% of par; |
| | • | | $150 million aggregate principal amount of 12% second priority notes due 2018 (the “Second Priority Notes,”) also in February, priced at 96% of par; and |
| | • | | an additional $54 million aggregate principal amount of the First Priority Notes in October, priced at 109% of par. |
Prior to the closing of the Alba Acquisition, the net proceeds of the offering were held in an escrow account. In May 2012, concurrent with the closing of the Alba Acquisition, the net proceeds were used to fund the acquisition and repay all outstanding amounts under the Senior Term Loan (see below).
58
Endeavour International Corporation
| | • | Reimbursement Agreements: During the second quarter of 2012, we entered into two reimbursement agreements related to abandonment liabilities for certain of our U.K. oil and gas properties that replaced previously outstanding letters of credit and assisted in the closing of the Alba Acquisition. Under these agreements, we agreed to reimburse the issuers of letters of credit covering approximately $153 million of certain of our abandonment liabilities in the event that the letters of credit are drawn. We have no cash collateral associated with the reimbursement agreements and the commitments under the reimbursement agreements have not been recorded as liabilities. |
| | • | 5.5% Convertible Notes: In July 2011, we issued $135 million aggregate principal amount of our 5.5% Convertible Notes. We issued the 5.5% Convertible Notes, expecting to utilize the majority of the net proceeds of this offering to fund an acquisition of acreage and related midstream assets in the Marcellus shale play. As we terminated the acquisition agreement in December 2011, these proceeds have been used for general corporate purposes. |
| | • | Letters of Credit: In July 2011, we secured new letters of credit that allowed us to release $33 million of restricted cash that served as collateral for previous letters of credit related to certain of our abandonment liabilities. We terminated this letter of credit facility agreement in May 2012. |
| | • | Senior Term Loan:In August 2010, we entered into a credit agreement with Cyan, as administrative agent, and various lenders for a senior, secured term loan, in the aggregate amount of $150 million, which was subsequently increased to $160 million (the “Senior Term Loan”). In July 2011, we amended our Senior Term Loan providing for an increase of $75 million in the amounts available under the Senior Term Loan. In May 2012, we repaid the outstanding balance of our Senior Term Loan with a portion of the proceeds from our 2018 Notes offering. |
| | • | 6% Senior Convertible Notes: In April 2011, we redeemed all $81.25 million of our outstanding 6% Senior Convertible Notes with a portion of the proceeds from our common stock offering completed in March 2011. |
| | • | 11.5% Convertible Senior Bonds: In January 2008, we issued 11.5% Convertible Bonds due 2014 for gross proceeds of $40 million. In March 2011, we amended our 11.5% Convertible Bonds to: extend of the maturity date of the 11.5% Convertible Bonds; extend the date on which holders may exercise a put right, and the occurrence of price reset if not exercised; and reduce the interest rate payable after March 31, 2014 to 7.5%. |
| | • | $50 million Subordinated Notes: In November 2009, we issued an aggregate $50 million of subordinated notes due 2014 (the “Subordinated Notes”). We utilized a portion of the proceeds from our October 2012 offering of additional First Priority Notes to redeem our outstanding Subordinated Notes. |
Our equity issuances for 2012, 2011 and 2010 are as follows:
| | • | June 2012: a public offering of 8.6 million shares of our common stock offering for net proceeds of $61.3 million; |
| | • | March 2011: a public offering of 11.5 million shares of our common stock offering for net proceeds of $118.4 million. |
59
Endeavour International Corporation
2013 Planned Expenditures
With the uncertainties around our strategic review, we have not finalized our total capital expenditures budget for 2013. While we perform our strategic review, we are monitoring our capital expenditures and delaying discretionary or other spending where appropriate. Our board of directors has approved a preliminary capital expenditures budget for 2013, that is dependent upon a positive outcome from our strategic review, as follows:
| | |
| | | Preliminary Capital Budget |
United Kingdom: | | |
Drilling and completions | | $90 million to $100 million |
Maintenance capital | | $35 million |
Exploration, seismic and other | | $15 million |
| | |
Total U.K. | | $140 million -$150 million |
| | |
United States | | $30 million to $40 million (*) |
| | |
Total direct oil and gas capital | | $170 million to $190 million |
| | |
| (*) | Primarily discretionary and dependent on the outcome of our strategic review. The U.S. capital expenditures are anticipated to primarily occur in the latter half of 2013. |
In the U.K., the anticipated capital expenditures are primarily to bring the Rochelle development on line, drill the third well at Bacchus and maintain production at Alba. Once the analysis of the East Rochelle well is concluded, we will be able to determine if we can safely re-enter the existing well to complete the drilling phase or should plug and abandon the well and drill a new well. The anticipated capital expenditures do not include the capital expenditures to drill a new well at East Rochelle, if it is required. Anticipated exploration expenditures in the U.K. include the drilling of a well at our Centurion prospect, where we hold a 33.3% interest. The exploration well at Centurion represents a firm well commitment that was originally scheduled by the operator to be drilled in 2012 and has been delayed until 2013.
The U.S. anticipated capital expenditures are primarily discretionary and will be re-evaluated once Rochelle production is on-line and after the completion of the strategic review process.
Our 2013 anticipated capital expenditures are also subject to change depending on a number of factors, including the result of our strategic review, the availability and costs of drilling and completion equipment, crews, economic and industry conditions, prevailing and anticipated prices for oil and gas, the availability of sufficient capital resources, drilling success and other normal factors affecting the oil and gas industry.
Decommissioning Expenditures
Production from each of our Ivanhoe, Rob Roy, Hamish (collectively, “IVRRH”), Renee, Rubie and Goldeneye fields has ceased and we have performed minor maintenance and decommissioning activities over the last several years. Previously, we expected to re-develop
60
Endeavour International Corporation
our IVRRH, Renee and Rubie fields if commercially attractive and practicable once the development activities at Rochelle are operational. During 2012, we determined that it was no longer practicable to re-develop these fields. As a result, decommissioning work on the fields will be accelerated and we expect to incur approximately $36 million in decommissioning charges during 2013.
Non-GAAP Financial Measures and Reconciliations
Net income can be significantly affected by various non-cash items, such as unrealized gains and losses on our commodity derivatives, currency impact of long-term liabilities and deferred taxes. Given the significant impact that non-cash items may have on our net income, we use various measures in addition to net income and net cash provided by operating activities, including non-financial performance indicators and non-GAAP measures, such as income (loss) as adjusted and Adjusted EBITDA, as key metrics to manage our business. These metrics demonstrate our ability to maintain or grow production levels and reserves, internally fund capital expenditures and service debt as well as provide comparisons to other oil and gas exploration and production companies. We define “net income (loss), as adjusted” as net income (loss), without the effect of impairments, derivative transactions and currency impacts of deferred taxes. We define “Adjusted EBITDA” as net income (loss) before interest, taxes, depreciation, depletion and amortization adjusted for the early termination of commodity derivatives and income (loss) from discontinued operations. These measures are internal, supplemental measures of our performance that are not required by, or presented in accordance with GAAP. The calculations of these non-GAAP measures and the reconciliation of net income (loss) to these non-GAAP measures are provided below.
We view these non-GAAP measures, and we believe that others in the oil and gas industry, securities analysts, investors, and other interested parties view these, or similar, non-GAAP measures, as commonly used analytic indicators to compare performance among companies in our industry and in the evaluation of issuers.
Because net income (loss) as adjusted and Adjusted EBITDA are not measures determined in accordance with GAAP and thus are susceptible to varying calculations, they may not be comparable to similarly titled measures of other companies. Net income (loss) as adjusted and Adjusted EBITDA have limitations as analytical tools, and you should not consider these measures in isolation, or as a substitute for analysis of our financial statement data presented in the consolidated financial statements as reported under GAAP.
61
Endeavour International Corporation
| | | | | | | | | | | | |
| | | Year Ended December 31, | |
(Amounts in thousands) | | 2012 | | | 2011 | | | 2010 | |
Net income (loss) | | $ | (126,226 | ) | | $ | (130,995 | ) | | $ | 56,531 | |
Impairment of oil and gas properties (net of tax)(1) | | | 53,072 | | | | 65,706 | | | | 7,692 | |
Unrealized gain on derivatives (net of tax)(2) | | | (7,326 | ) | | | (10,269 | ) | | | (6,820 | ) |
Loss on early extinguishment of debt (net of tax)(3) | | | 17,662 | | | | 402 | | | | — | |
Deferred tax expense related to U.K. tax rate change | | | 8,587 | | | | 25,484 | | | | | |
Currency impact on deferred taxes | | | — | | | | — | | | | (51 | ) |
| | | | | | | | | | | | |
Net Income (Loss) as Adjusted | | $ | (54,231 | ) | | $ | (49,672 | ) | | $ | 57,352 | |
| | | | | | | | | | | | |
Net income (loss) | | $ | (126,226 | ) | | $ | (130,995 | ) | | $ | 56,531 | |
Unrealized gain on derivatives | | | (5,141 | ) | | | (8,378 | ) | | | (12,291 | ) |
Net interest expense | | | 83,872 | | | | 44,781 | | | | 34,517 | |
Letter of credit fees | | | 21,903 | | | | — | | | | — | |
Loss on early extinguishment of debt | | | 21,661 | | | | 402 | | | | — | |
Depreciation, depletion and amortization | | | 66,564 | | | | 26,478 | | | | 28,894 | |
Impairment of oil and gas properties | | | 53,072 | | | | 65,706 | | | | 7,692 | |
Income tax expense (benefit) | | | 14,228 | | | | 27,061 | | | | (788 | ) |
Early termination of commodity derivatives | | | — | | | | — | | | | 10,201 | |
| | | | | | | | | | | | |
Adjusted EBITDA | | $ | 129,933 | | | $ | 25,055 | | | $ | 124,756 | |
| | | | | | | | | | | | |
| (1) | Since the impairments related to U.S. oil and gas properties, we recognized no tax benefits as there was no assurance that we could generate any U.S. taxable earnings. |
| (2) | Net of tax (expense) benefit of $(2,185), $(1,891) and $5,471 in 2012, 2011 and 2010, respectively. |
| (3) | Net of tax benefit of $3,899 for 2012. |
Disclosures about Contractual Obligations and Commercial Commitments
The following table sets forth our obligations and commitments to make future payments under our lease agreements and other long-term obligations as of December 31, 2012:
62
Endeavour International Corporation
| | | | | | | | | | | | | | | | | | | | |
(Amounts in thousands) | | Payments due by Period | |
| | | Total | | | Less than 1
Year | | | 1-3 Years | | | 3-5 Years | | | After 5
Years | |
Long-term debt(1): | | | | | | | | | | | | | | | | | | | | |
Principal | | $ | 874,192 | | | $ | 115,163 | | | $ | — | | | $ | 205,029 | | | $ | 554,000 | |
Interest(2) | | | 411,594 | | | | 88,895 | | | | 147,810 | | | | 159,309 | | | | 15,580 | |
Asset retirement obligations | | | 176,076 | | | | 36,255 | | | | 69,497 | | | | 33,553 | | | | 36,771 | |
Letter of credit fees(1) | | | 27,734 | | | | 19,934 | | | | 7,800 | | | | — | | | | — | |
Leases for offices and equipment | | | 6,101 | | | | 1,665 | | | | 2,931 | | | | 1,505 | | | | — | |
| | | | | | | | | | | | | | | | | | | | |
Total Contractual Obligations | | $ | 1,495,697 | | | $ | 261,912 | | | $ | 228,038 | | | $ | 399,396 | | | $ | 606,351 | |
| | | | | | | | | | | | | | | | | | | | |
| (1) | Our debt and letter of credit fees reflect the amounts outstanding at December 31, 2012 and reflect the maturity dates in effect at that date. Subsequent to December 31, 2012, portions of our debt and reimbursement agreements were extended. See Note 24 for additional discussion. |
| (2) | Interest on our 11.5% convertible bonds is added to the outstanding principal balance each quarter and reflected as due upon maturity. |
Off-Balance Sheet Arrangements
At December 31, 2012, our reimbursement agreements related to abandonment liabilities were off-balance sheet arrangements. The reimbursement agreements cover approximately $153 million of our abandonment liabilities for certain of our U.K. oil and gas properties. Under these agreements, unaffiliated third parties pledged cash to secure letters of credit covering certain of our abandonment liabilities and we agreed to reimburse the pledged cash in the event that the letters of credit are drawn and pledged cash is utilized to satisfy the commitment. We have no cash collateral associated with the reimbursement agreements and the commitments under the reimbursement agreements are not recorded as liabilities. The associated abandonment obligations are recorded in other long-term liabilities as part of our asset retirement obligations. Fees and expenses related to the reimbursement agreements are included in other expenses on our condensed consolidated statement of operations. See Note 20 to our consolidated financial statements in “Item 8. Financial Statements and Supplementary Data” for additional discussion.
Critical Accounting Policies and Estimates
The accompanying financial statements have been prepared on the accrual basis of accounting in accordance with accounting principles generally accepted in the United States of America and have been presented on a going concern basis, which contemplates the realization of assets and satisfaction of liabilities in the normal course of business. These accounting principles require management to use estimates, judgments and assumptions that affect the reported amounts of assets and liabilities as of the date of the financial statements, and revenues and expenses during the reporting period. While management regularly reviews its estimates, including those related to the determination of proved reserves, estimates of future dismantlement costs, income taxes and litigation, actual results could differ from those estimates.
63
Endeavour International Corporation
Management believes it is reasonably possible that the following material estimates affecting the financial statements could change in the coming year: (1) estimates of proved oil and gas reserves, (2) estimates as to the expected future cash flow from proved oil and gas properties, (3) estimates of future dismantlement and restoration costs, (4) estimates of fair values used in purchase accounting and (5) estimates of the fair value of derivative instruments. In addition, alternatives may exist among various accounting methods. In such cases, the choice of accounting method may also have a significant impact on reported amounts.
Our critical accounting policies are as follows:
Full Cost Accounting
Under the full cost method of accounting for oil and gas activities, all acquisition, exploration and development costs incurred for the purpose of finding oil and gas, are capitalized and accumulated in pools on a country-by-country basis. Capitalized costs include the cost of drilling and equipping productive wells, such as the estimated costs of dismantling and abandoning these assets, dry hole costs, lease acquisition costs, seismic and other geological and geophysical costs, delay rentals, costs related to such activities, certain directly-related employee costs and a portion of interest expense. Employee costs associated with production and other operating activities and general corporate activities are expensed in the period incurred.
Capitalized costs are limited on a country-by-country basis (the ceiling test). Under the ceiling test, if the capitalized cost of the full cost pool, net of deferred taxes, exceeds the ceiling limitation, the excess is charged as an impairment expense. The ceiling test limitation is calculated as the present value, discounted at 10%, of:
| | • | | the future net cash flows related to estimated production of proved reserves; |
| | • | | the effect of derivative instruments that qualify as cash flow hedges; |
| | • | | the lower of cost or estimated fair value of unproved properties; and |
| | • | | the expected income tax effects of the above items. |
Future net cash flows use the average, first-day-of-the-month price for commodities during 2012, 2011 and 2010.
We utilize a single cost center for each country where we have operations for amortization purposes. Any sales or other conveyances of properties are treated as adjustments to the cost of oil and gas properties with no gain or loss recognized unless the operations are suspended in the entire cost center or the conveyance is significant in nature.
Unproved property costs include the costs associated with unevaluated properties and properties under development and are not initially included in the full cost amortization base (where proved reserves exist) until the project is evaluated. These costs include unproved leasehold acreage, seismic data, wells and production facilities in progress and wells pending determination, together with interest costs capitalized for these projects. Seismic data costs are associated with specific unevaluated properties where the seismic data is acquired for the purpose of evaluating acreage or trends covered by a leasehold interest owned by us.
64
Endeavour International Corporation
Significant unproved properties are assessed periodically for possible impairment or reduction in value. If a reduction in value has occurred, these property costs are considered impaired and are transferred to the related full cost pool. Geological and geophysical costs included in unproved properties are transferred to the full cost amortization base along with the associated leasehold costs on a specific project basis. Costs associated with wells in progress and wells pending determination are transferred to the amortization base once a determination is made whether or not proved reserves can be assigned to the property. Costs of dry holes are transferred to the amortization base immediately upon determination that the well is unsuccessful. Unproved properties whose acquisition costs are not individually significant are aggregated and the portion of such costs estimated to be ultimately nonproductive, based on experience, are amortized to the full cost pool over an average holding period.
In countries where the existence of proved reserves has not yet been determined, unevaluated property costs remain capitalized in unproved property cost centers until proved reserves have been established, exploration activities cease or impairment and reduction in value occurs. If exploration activities result in the establishment of a proved reserve base, amounts in the unproved property cost center are reclassified as proved properties and become subject to amortization and the application of the ceiling test. When it is determined that the value of unproved property costs have been permanently diminished (in part or in whole) based on the impairment evaluation and future exploration plans, the unproved property cost centers related to the area of interest are impaired, and accumulated costs charged against earnings.
We capitalize interest on expenditures for significant exploration and development projects while activities are in progress to bring the assets to their intended use. Capitalized interest is calculated by multiplying our weighted-average interest rate on debt by the amount of qualifying costs and is limited to gross interest expense. As costs are transferred to the full cost pool, the associated capitalized interest is also transferred to the full cost pool.
Business Combinations
Assets and liabilities acquired through a business combination are recorded at estimated fair value. We use all available information to make these fair value determinations, including information commonly considered by our engineers in valuing individual oil and gas properties and sales prices for similar assets. Estimated deferred taxes are based on available information concerning the tax basis of the acquired company’s assets and liabilities and carryforwards at the merger date.
Any excess of the acquisition cost of the acquired business over the fair value amounts assigned to assets and liabilities is recorded as goodwill. Any excess of the amounts assigned to assets and liabilities over the acquisition of the acquired business is recorded as a gain on acquisition on the income statement. The amount of goodwill recorded in any particular business combination can vary significantly depending upon the fair values attributed to assets acquired and liabilities assumed relative to the total acquisition cost.
65
Endeavour International Corporation
Goodwill and Intangible Assets
Goodwill represents the excess of the purchase price over the estimated fair value of the assets acquired and liabilities assumed in an acquisition. We assess the carrying amount of goodwill and other indefinite-lived intangible assets by testing the asset for impairment annually at year-end, or more frequently if events or changes in circumstances indicate that the asset might be impaired. The impairment test requires allocating goodwill and all other assets and liabilities to reporting units. The fair value of each reporting unit is determined and compared to the book value of the reporting unit. An impairment loss is recognized to the extent that the carrying amount exceeds the reporting unit’s fair value.
At December 31, 2012, we had $262.8 million of goodwill recorded related to past business combinations. This goodwill is not amortized, but is required to be assessed for impairment annually, or more often as facts and circumstances warrant. The first step of that process is to compare the fair value of the reporting unit to which goodwill has been assigned to the carrying amount of the associated net assets and goodwill. The reporting units used to evaluate and measure goodwill for impairment are determined from the manner in which the business is managed. We have determined we have a single reporting unit. Goodwill is tested annually at year end. Although we cannot predict when or if goodwill will be impaired, impairment charges may occur if we are unable to replace the value of our depleting asset base or if other adverse events (for example, lower sustained oil and gas prices) reduce the fair value of the reporting unit.
We completed our 2012 annual goodwill impairment test with no impairment indicated as the estimated fair value of our reporting unit was substantially greater than its book value. We considered our market capitalization based on average stock prices for 20 days before December 31, 2012.
A lower fair value estimate in the future could result in impairment. Examples of factors that could cause a lower fair value estimate could be sustained declines in prices, increases in costs, and changes in discount rate assumptions due to market conditions.
Dismantlement, Restoration and Environmental Costs
We recognize liabilities for asset retirement obligations associated with tangible long-lived assets, such as producing well sites, offshore production platforms, and natural gas processing plants, with a corresponding increase in the related long-lived asset. The asset retirement cost is depreciated along with the property and equipment in the full cost pool. The asset retirement obligation is recorded at fair value and accretion expense, recognized over the life of the property, increases the liability to its expected settlement value. If the fair value of the estimated asset retirement obligation changes, an adjustment is recorded for both the asset retirement obligation and the asset retirement cost.
66
Endeavour International Corporation
Estimating future asset retirement obligations requires us to make estimates and judgments regarding timing, amount and existence of a liability, as well as what constitutes adequate restoration. We use the present value of estimated cash flows related to our asset retirement obligations to determine fair value. Our liability is determined using significant assumptions, including current estimates of plugging and abandonment costs, inflation factors, the productive lives of wells and our risk-adjusted interest rate. In addition, there are other external factors which could significantly affect the ultimate settlement costs for these obligations including changes in environmental regulations and other statutory requirements, fluctuations in industry costs and advances in technology.
Revenue Recognition
We use the entitlements method to account for sales of gas production. We may receive more or less than our entitled share of production. Under the entitlements method, if we receive more than our entitled share of production, the imbalance is treated as a liability at the market price at the time the imbalance occurred. If we receive less than our entitled share, the imbalance is recorded as an asset at the lower of the current market price or the market price at the time the imbalance occurred. Oil revenues are recognized when production is sold to a purchaser at a fixed or determinable price, when delivery has occurred, title has transferred and collectability of the revenue is probable.
Derivative Instruments and Hedging Activities
From time to time, we may utilize derivative financial instruments to hedge cash flows from operations or to hedge the fair value of financial instruments. We may use derivative financial instruments with respect to a portion of our oil and gas production or a portion of our variable rate debt to achieve a more predictable cash flow by reducing our exposure to price fluctuations. These transactions are likely to be swaps, collars or options and to be entered into with major financial institutions or commodities trading institutions. Derivative financial instruments are intended to reduce our exposure to declines in the market prices of crude oil and natural gas that we produce and sell, to increases in interest rates and to manage cash flows in support of our annual capital expenditure budget. We also have embedded derivatives related to our debt instruments and convertible preferred stock.
We record all derivatives at fair market value in our Consolidated Balance Sheets at the end of each period. The accounting for the fair market value, and the changes from period to period, depends on the intended use of the derivative and the resulting designation. This evaluation is determined at each derivative’s inception and begins with the decision to account for the derivative as a hedge, if applicable. The accounting for changes in the fair value of a derivative instrument that is not accounted for as a hedge is included in other (income) expense as an unrealized gain or loss.
67
Endeavour International Corporation
Income Taxes
We use the liability method of accounting for income taxes under which deferred tax assets and liabilities are recognized for the estimated future tax consequences attributable to differences between the financial statement carrying amounts of existing assets and liabilities, and their respective tax bases. Deferred tax assets and liabilities are measured using enacted tax rates in effect for the year in which those temporary differences are expected to be recovered or settled. The effect on deferred tax assets and liabilities of a change in tax rates is recognized as part of the provision for income taxes in the period that includes the enactment date. Deferred tax assets are reduced by a valuation allowance when, in the opinion of management, it is more likely than not that some portion of, or all of, the deferred tax assets will not be realized.
Stock-Based Compensation Arrangements
We recognize all share-based payments to employees, including grants of employee stock options, based on their fair values. The share-based compensation cost is measured at the grant date, based on the calculated fair value of the award, and is recognized as general and administrative expense over the employee’s requisite service period (generally the vesting period of the equity award). We apply the fair value method in accounting for stock option grants to non-employees using the Black-Scholes Method.
It is our policy to use authorized but unissued shares of stock when stock options are exercised. At December 31, 2012, we had approximately 2.4 million additional shares available for issuance pursuant to our existing stock incentive plan.
Fair Value
We estimate fair value for the measurement of derivatives, long-lived assets during certain impairment tests, reporting units for goodwill impairment testing, the initial measurement of an asset retirement obligation and the initial measurement of our Series C Preferred Stock upon its redemption and modification. When we are required to measure fair value, and there is not a market observable price for the asset or liability, or a market observable price for a similar asset or liability, we generally utilize an income valuation approach. This approach utilizes management’s best assumptions regarding expectations of projected cash flows, and discounts the expected cash flows using a commensurate risk adjusted discount rate. Such evaluations involve a significant amount of judgment since the results are based on expected future events or conditions, such as sales prices; estimates of future oil and gas production; development and operating costs and the timing thereof; economic and regulatory climates and other factors. Our estimates of future net cash flows are inherently imprecise because they reflect management’s expectation of future conditions that are often outside of management’s control. However, assumptions used reflect a market participant’s view of long-term prices, costs and other factors, and are consistent with assumptions used in our business plans and investment decisions.
68
Endeavour International Corporation
Item 7A. Quantitative and Qualitative Disclosures About Market Risk
Foreign Exchange Risk
The international scope of our business operations exposes us to the risk of fluctuations in foreign currency markets. As a result, we are subject to foreign currency exchange rate risk due to effects that foreign exchange rate movements have on our costs and on the cash flows that we receive from foreign operations. Our oil revenues are received in U.S. dollars while gas revenues in the U.K. are received in pounds sterling. Capital expenditures, payroll and operating expenses may be denominated in U.S. dollars or pounds sterling. We operate a centralized currency management operation to take advantage of potential opportunities to naturally offset exposures against each other. To date, we have addressed our foreign currency exchange rate risks principally by maintaining our liquid assets in interest-bearing accounts, until payments in foreign currency are required. As the timing of expenditures in pounds sterling has been predictable, we have been able to match revenues received in pounds sterling and foreign currency purchases to minimize our exposure to foreign currency exchange rate risk. At December 31, 2012, we have exposure to exchange rate changes applicable to cash balances in our U.K. pound denominated bank accounts. A 10% change in the foreign-currency exchange rate would not have a material effect on our financial position or results of operations.
Interest Rate Risk
Our exposure to changes in interest rates is not significant as all of our borrowings are subject to fixed interest rates. Changes in interest rates only affect the interest earned on cash and cash equivalents.
69
Endeavour International Corporation
Item 8. Financial Statements and Supplementary Data
Report of Independent Registered Public Accounting Firm
The Board of Directors and Stockholders of
Endeavour International Corporation
We have audited the accompanying consolidated balance sheet of Endeavour International Corporation and subsidiaries as of December 31, 2012 and the related consolidated statements of operations, stockholders’ equity and cash flows for the year then ended. These financial statements are the responsibility of the Company’s management. Our responsibility is to express an opinion on these consolidated financial statements based on our audit.
We conducted our audit in accordance with the standards of the Public Company Accounting Oversight Board (United States). Those standards require that we plan and perform the audit to obtain reasonable assurance about whether the financial statements are free of material misstatement. An audit includes examining, on a test basis, evidence supporting the amounts and disclosures in the financial statements. An audit also includes assessing the accounting principles used and significant estimates made by management, as well as evaluating the overall financial statement presentation. We believe that our audit provides a reasonable basis for our opinion.
In our opinion, the financial statements referred to above present fairly, in all material respects, the consolidated financial position of Endeavour International Corporation and subsidiaries at December 31, 2012 and the consolidated results of their operations and their cash flows for the year then ended, in conformity with U.S. generally accepted accounting principles.
We also have audited, in accordance with the standards of the Public Company Accounting Oversight Board (United States), Endeavour International Corporation and subsidiaries’ internal control over financial reporting as of December 31, 2012, based on criteria established in Internal Control-Integrated Framework issued by the Committee of Sponsoring Organizations of the Treadway Commission and our report dated March 18, 2013 expressed an unqualified opinion on the effectiveness of the Company’s internal control over financial reporting.
/s/ Ernst & Young LLP
Houston, Texas
March 18, 2013
70
Endeavour International Corporation
Report of Independent Registered Public Accounting Firm
The Board of Directors and Stockholders
Endeavour International Corporation:
We have audited the accompanying consolidated balance sheet of Endeavour International Corporation and subsidiaries (the Company) as of December 31, 2011, and the related consolidated statements of operations, stockholders’ equity, and cash flows for each of the years in the two-year period ended December 31, 2011. These consolidated financial statements are the responsibility of the Company’s management. Our responsibility is to express an opinion on these consolidated financial statements based on our audits.
We conducted our audits in accordance with the standards of the Public Company Accounting Oversight Board (United States). Those standards require that we plan and perform the audit to obtain reasonable assurance about whether the consolidated financial statements are free of material misstatement. An audit includes examining, on a test basis, evidence supporting the amounts and disclosures in the financial statements. An audit also includes assessing the accounting principles used and significant estimates made by management, as well as evaluating the overall financial statement presentation. We believe that our audits provide a reasonable basis for our opinion.
In our opinion, the consolidated financial statements referred to above present fairly, in all material respects, the financial position of Endeavour International Corporation and subsidiaries as of December 31, 2011, and the results of their operations and their cash flows for each of the years in the two-year period ended December 31, 2011, in conformity with U.S. generally accepted accounting principles.
(signed) KPMG LLP
Houston, Texas
March 7, 2012, except for Note 23, as to which date is March 18, 2013
71
Endeavour International Corporation
Consolidated Balance Sheets
(Amounts in thousands)
| | | | | | | | |
| | | December 31, | |
| | | 2012 | | | 2011 | |
| Assets | |
Current Assets: | | | | | | | | |
Cash and cash equivalents | | $ | 59,185 | | | $ | 106,036 | |
Restricted cash | | | 178 | | | | — | |
Accounts receivable | | | 46,003 | | | | 8,649 | |
Prepaid expenses and other current assets | | | 20,995 | | | | 18,840 | |
| | | | | | | | |
Total Current Assets | | | 126,361 | | | | 133,525 | |
Property and Equipment, Net ($349,433 and $258,334 not subject to amortization at 2012 and 2011, respectively) | | | 1,003,441 | | | | 549,196 | |
Goodwill | | | 262,764 | | | | 211,886 | |
Other Assets | | | 49,906 | | | | 30,384 | |
| | | | | | | | |
Total Assets | | $ | 1,442,472 | | | $ | 924,991 | |
| | | | | | | | |
See accompanying notes to consolidated financial statements.
72
Endeavour International Corporation
Consolidated Balance Sheets
(Amounts in thousands)
| | | | | | | | |
| | | December 31, | |
| | | 2012 | | | 2011 | |
| Liabilities and Stockholders’ Equity | |
Current Liabilities: | | | | | | | | |
Accounts payable | | $ | 60,153 | | | $ | 62,275 | |
Current maturities of debt | | | 15,713 | | | | 12,350 | |
Accrued expenses and other | | | 90,100 | | | | 20,549 | |
| | | | | | | | |
Total Current Liabilities | | | 165,966 | | | | 95,174 | |
Long-Term Debt | | | 843,793 | | | | 455,028 | |
Deferred Taxes | | | 141,887 | | | | 115,759 | |
Other Liabilities | | | 147,692 | | | | 61,248 | |
| | | | | | | | |
Total Liabilities | | | 1,299,338 | | | | 727,209 | |
Commitments and Contingencies | | | | | | | | |
Series C Convertible Preferred Stock: | | | | | | | | |
Series C preferred stock - Liquidation preference: $37,000 and $37,000 December 31, 2012 and 2011, respectively | | | 43,703 | | | | 43,703 | |
Stockholders’ Equity: | | | | | | | | |
Series B preferred stock (Liquidation preference: $3,588 and $3,430 at 2012 and 2011, respectively) | | | — | | | | — | |
Common stock; shares issued and outstanding (46,691 and 37,663 shares at 2012 and 2011, respectively) | | | 47 | | | | 38 | |
Additional paid-in capital | | | 493,804 | | | | 420,412 | |
Treasury stock, at cost (72 and 72 shares at 2012 and 2011, respectively) | | | (587 | ) | | | (587 | ) |
Accumulated deficit | | | (393,833 | ) | | | (265,784 | ) |
| | | | | | | | |
Total Stockholders’ Equity | | | 99,431 | | | | 154,079 | |
| | | | | | | | |
Total Liabilities and Stockholders’ Equity | | $ | 1,442,472 | | | $ | 924,991 | |
| | | | | | | | |
See accompanying notes to consolidated financial statements.
73
Endeavour International Corporation
Consolidated Statement of Operations
(Amounts in thousands, except per share data)
| | | | | | | | | | | | |
| | | Year Ended December 31, | |
| | | 2012 | | | 2011 | | | 2010 | |
Revenues | | $ | 219,058 | | | $ | 60,091 | | | $ | 71,675 | |
Cost of Operations: | | | | | | | | | | | | |
Operating expenses | | | 58,536 | | | | 17,668 | | | | 15,347 | |
Depreciation, depletion and amortization | | | 66,564 | | | | 26,478 | | | | 28,894 | |
Impairment of oil and gas properties | | | 53,072 | | | | 65,706 | | | | 7,692 | |
General and administrative | | | 21,085 | | | | 17,853 | | | | 18,415 | |
| | | | | | | | | | | | |
Total Expenses | | | 199,257 | | | | 127,705 | | | | 70,348 | |
| | | | | | | | | | | | |
Income (Loss) From Operations | | | 19,801 | | | | (67,614 | ) | | | 1,327 | |
| | | | | | | | | | | | |
Other Income (Expense): | | | | | | | | | | | | |
Derivatives: | | | | | | | | | | | | |
Realized gains (losses) | | | — | | | | — | | | | (11,753 | ) |
Unrealized gains | | | 5,141 | | | | 8,378 | | | | 12,291 | |
Interest expense | | | (84,122 | ) | | | (44,893 | ) | | | (34,592 | ) |
Gain on sale of reserves in place | | | — | | | | — | | | | 87,171 | |
Loss on early extinguishment of debt | | | (21,661 | ) | | | (402 | ) | | | — | |
Letter of credit fees | | | (21,903 | ) | | | — | | | | — | |
Other income (expense) | | | (9,254 | ) | | | 597 | | | | 1,299 | |
| | | | | | | | | | | | |
Total Other Income (Expense) | | | (131,799 | ) | | | (36,320 | ) | | | 54,416 | |
| | | | | | | | | | | | |
Income (Loss) Before Income Taxes | | | (111,998 | ) | | | (103,934 | ) | | | 55,743 | |
Income Tax Expense (Benefit) | | | 14,228 | | | | 27,061 | | | | (788 | ) |
| | | | | | | | | | | | |
Net Income (Loss) | | | (126,226 | ) | | | (130,995 | ) | | | 56,531 | |
Preferred Stock Dividends: | | | 1,823 | | | | 1,974 | | | | 2,227 | |
| | | | | | | | | | | | |
Net Income (Loss) to Common Stockholders | | $ | (128,049 | ) | | $ | (132,969 | ) | | $ | 54,304 | |
| | | | | | | | | | | | |
Net Income (Loss) per Common Share: | | | | | | | | | | | | |
Basic | | $ | (3.01 | ) | | $ | (3.70 | ) | | $ | 2.34 | |
| | | | | | | | | | | | |
Diluted | | $ | (3.01 | ) | | $ | (3.70 | ) | | $ | 1.95 | |
| | | | | | | | | | | | |
Weighted Average Number of Common Shares Outstanding: | | | | | | | | | | | | |
Basic | | | 42,533 | | | | 35,957 | | | | 23,252 | |
| | | | | | | | | | | | |
Diluted | | | 42,533 | | | | 35,957 | | | | 28,886 | |
| | | | | | | | | | | | |
See accompanying notes to consolidated financial statements.
74
Endeavour International Corporation
Consolidated Statement of Cash Flows
(Amounts in thousands)
| | | | | | | | | | | | |
| | | Year Ended December 31, | |
| | | 2012 | | | 2011 | | | 2010 | |
Cash Flows from Operating Activities: | | | | | | | | | | | | |
Net income (loss) | | $ | (126,226 | ) | | $ | (130,995 | ) | | $ | 56,531 | |
Adjustments to reconcile net income (loss) to net cash provided by operating activities: | | | | | | | | | | | | |
Depreciation, depletion and amortization | | | 66,564 | | | | 26,478 | | | | 28,894 | |
Impairment of oil and gas properties | | | 53,072 | | | | 65,706 | | | | 7,692 | |
Deferred tax expense (benefit) | | | (17,594 | ) | | | 21,116 | | | | (3,367 | ) |
Unrealized gains on derivatives | | | (5,141 | ) | | | (8,378 | ) | | | (12,291 | ) |
Gain on sales of reserves in place | | | — | | | | — | | | | (87,171 | ) |
Amortization of non-cash compensation | | | 4,401 | | | | 3,697 | | | | 3,692 | |
Amortization of loan costs and discount | | | 14,179 | | | | 12,234 | | | | 10,262 | |
Non-cash interest expense | | | 8,684 | | | | 12,811 | | | | 8,764 | |
Loss on early extinguishment of debt | | | 21,661 | | | | 402 | | | | — | |
Other | | | 15,365 | | | | 1,518 | | | | (2,086 | ) |
Changes in operating assets and liabilities: | | | | | | | | | | | | |
(Increase) decrease in receivables | | | (24,319 | ) | | | (531 | ) | | | 6,732 | |
Increase in other current assets | | | (592 | ) | | | (13,328 | ) | | | (4,668 | ) |
Increase (decrease) in liabilities | | | 28,559 | | | | (30,073 | ) | | | 4,035 | |
| | | | | | | | | | | | |
Net Cash Provided by (Used in) Operating Activities | | | 38,613 | | | | (39,343 | ) | | | 17,019 | |
Cash Flows From Investing Activities: | | | | | | | | | | | | |
Capital expenditures | | | (246,925 | ) | | | (165,062 | ) | | | (92,007 | ) |
Acquisitions, net of cash acquired | | | (238,854 | ) | | | (33,075 | ) | | | (43,726 | ) |
Proceeds from sales, net of cash | | | 1,407 | | | | — | | | | 108,316 | |
(Increase) decrease in restricted cash | | | (178 | ) | | | 31,726 | | | | (28,897 | ) |
| | | | | | | | | | | | |
Net Cash Used in Investing Activities | | | (484,550 | ) | | | (166,411 | ) | | | (56,314 | ) |
Cash Flows From Financing Activities: | | | | | | | | | | | | |
Repayments of borrowings | | | (274,629 | ) | | | (103,225 | ) | | | (75,342 | ) |
Borrowings under debt agreements, net of debt discount | | | 654,023 | | | | 210,000 | | | | 185,000 | |
Proceeds from issuance of common stock | | | 60,805 | | | | 118,444 | | | | 30,181 | |
Dividends paid | | | (1,665 | ) | | | (1,816 | ) | | | (2,070 | ) |
Payments for early extinguishment of debt | | | (7,248 | ) | | | — | | | | — | |
Financing costs paid | | | (32,204 | ) | | | (11,401 | ) | | | (26,590 | ) |
Other financing | | | 4 | | | | 521 | | | | 96 | |
| | | | | | | | | | | | |
Net Cash Provided by Financing Activities | | | 399,086 | | | | 212,523 | | | | 111,275 | |
Net Increase (Decrease) in Cash and Cash Equivalents | | | (46,851 | ) | | | 6,769 | | | | 71,980 | |
Cash and Cash Equivalents, Beginning of Period | | | 106,036 | | | | 99,267 | | | | 27,287 | |
| | | | | | | | | | | | |
Cash and Cash Equivalents, End of Period | | $ | 59,185 | | | $ | 106,036 | | | $ | 99,267 | |
| | | | | | | | | | | | |
See accompanying notes to consolidated financial statements.
75
Endeavour International Corporation
Consolidated Statement of Stockholders’ Equity
(Amounts in thousands)
| | | | | | | | | | | | | | | | | | | | |
| | | | | | | | | Additional | | | | | | Total | |
| | | Common | | | Treasury | | | Paid-In | | | Accumulated | | | Stockholder’s | |
| | | Stock | | | Stock | | | Capital | | | Deficit | | | Equity | |
Balance, January 1, 2010 | | $ | 19 | | | $ | (587 | ) | | $ | 247,820 | | | $ | (187,119 | ) | | $ | 60,133 | |
Preferred stock dividend | | | — | | | | — | | | | — | | | | (2,227 | ) | | | (2,227 | ) |
Common stock issuance | | | 5 | | | | — | | | | 30,176 | | | | — | | | | 30,181 | |
Series C preferred stock conversion | | | 1 | | | | — | | | | 5,906 | | | | — | | | | 5,907 | |
Amortization of deferred compensation | | | — | | | | — | | | | 3,660 | | | | — | | | | 3,660 | |
Other | | | — | | | | — | | | | 433 | | | | — | | | | 433 | |
Net Income | | | — | | | | — | | | | — | | | | 56,531 | | | | 56,531 | |
| | | | | | | | | | | | | | | | | | | | |
Balance, December 31, 2010 | | $ | 25 | | | $ | (587 | ) | | $ | 287,995 | | | $ | (132,815 | ) | | $ | 154,618 | |
| | | | | | | | | | | | | | | | | | | | |
Preferred stock dividend | | | — | | | | — | | | | — | | | | (1,974 | ) | | | (1,974 | ) |
Common stock issuance | | | 12 | | | | — | | | | 118,433 | | | | — | | | | 118,445 | |
Series C preferred stock conversion | | | 1 | | | | — | | | | 9,448 | | | | — | | | | 9,449 | |
Amortization of deferred compensation | | | — | | | | — | | | | 3,697 | | | | — | | | | 3,697 | |
Other | | | — | | | | — | | | | 839 | | | | — | | | | 839 | |
Net Loss | | | — | | | | — | | | | — | | | | (130,995 | ) | | | (130,995 | ) |
| | | | | | | | | | | | | | | | | | | | |
Balance, December 31, 2011 | | $ | 38 | | | $ | (587 | ) | | $ | 420,412 | | | $ | (265,784 | ) | | $ | 154,079 | |
| | | | | | | | | | | | | | | | | | | | |
Preferred stock dividend | | | — | | | | — | | | | — | | | | (1,823 | ) | | | (1,823 | ) |
Common stock issuance | | | 9 | | | | — | | | | 60,796 | | | | — | | | | 60,805 | |
Issuance of Warrants | | | | | | | | | | | 6,273 | | | | | | | | 6,273 | |
Amortization of deferred compensation | | | — | | | | — | | | | 6,033 | | | | — | | | | 6,033 | |
Other | | | — | | | | — | | | | 290 | | | | — | | | | 290 | |
Net Loss | | | — | | | | — | | | | — | | | | (126,226 | ) | | | (126,226 | ) |
| | | | | | | | | | | | | | | | | | | | |
Balance, December 31, 2012 | | $ | 47 | | | $ | (587 | ) | | $ | 493,804 | | | $ | (393,833 | ) | | $ | 99,431 | |
| | | | | | | | | | | | | | | | | | | | |
See accompanying notes to consolidated financial statements.
76
Endeavour International Corporation
Notes to Consolidated Financial Statements
(Amounts in tables in thousands, except per unit data)
Note 1 – General
Description of Business
Endeavour International Corporation is an independent oil and gas company engaged in the exploration, development, production and acquisition of energy reserves in the U.S. and U.K. Endeavour was incorporated under the laws of the state of Nevada on January 13, 2000. As used in these Notes to Consolidated Financial Statements, the terms “Endeavour,” “Company,” “we,” “us,” “our” and similar terms refer to Endeavour International Corporation and, unless the context indicates otherwise, its consolidated subsidiaries.
2013 Liquidity and Capital Resources
As of December 31, 2012, we had $874.2 million in outstanding indebtedness. Being highly leveraged, servicing our debt and other long-term obligations will continue to require a significant portion of our cash flow from operations and available cash on hand. The combination of these debt servicing requirements, capital expenditures and the delay in cash flow resulting from the Rochelle mechanical issues may exceed the cash flow from our current operations. Ultimately, our primary uses and sources of financial resources will be impacted by the outcome of our strategic review.
During 2013, our primary uses of financial resources are expected to be:
| | • | | our capital expenditures, primarily related to our drilling activities at our Alba, Bacchus and Rochelle fields in the U.K.; and |
| | • | | interest payments on existing credit facilities and payments in support of our reimbursement agreements covering our abandonment obligations. |
We believe we will be able to fund operations for the foreseeable future including our capital expenditures and other expenditure requirements based on our projections of funds generated from operations, cash available and existing sources of financing. Since year-end 2012, we have also completed several transactions to improve our liquidity position and extended the maturities of some of our debt and other obligations. The completion of these recent financing activities are designed to provide sufficient liquidity to bring the Rochelle development on line, drill a third well at Bacchus and allow sufficient time for a thoughtful and disciplined strategic review process. These transactions include:
| | • | | extending or replacing reimbursement agreements covering certain of our abandonment liabilities in the U.K. which would have expired in 2013; |
| | • | | entering into a forward sale agreement; |
| | • | | entering into a sale and purchase agreement providing for the sale and purchase of a production payment; and |
| | • | | extending the maturity of a majority of the commitments under our revolving credit facility. |
77
Endeavour International Corporation
Notes to Consolidated Financial Statements
(Amounts in tables in thousands, except per unit data)
If we are unable to meet any short-term liquidity needs out of cash on hand, we would attempt to refinance debt, sell forward our production, sell assets, issue debt or equity or perform any other alternatives resulting from our strategic review.
Note 2 – Summary of Significant Accounting Policies
Basis of Presentation and Use of Estimates
The accompanying financial statements have been prepared on the accrual basis of accounting in accordance with accounting principles generally accepted in the United States of America (“US GAAP”) and have been presented on a going concern basis, which contemplates the realization of assets and satisfaction of liabilities in the normal course of business. In the opinion of management, all normal recurring adjustments considered necessary for a fair presentation have been included in these financial statements. Certain amounts for prior periods have been reclassified to conform to the current presentation.
These accounting principles require management to use estimates, judgments and assumptions that affect the amounts of assets, liabilities, revenues and expenses reported herein. While management regularly reviews its estimates, actual results could differ from those estimates.
Management believes it is reasonably possible that the following material estimates affecting the financial statements could change in the coming year:
| | • | | estimates of proved oil and gas reserves, |
| | • | | estimates as to the expected future cash flow from proved oil and gas properties, |
| | • | | estimates of future dismantlement and restoration costs, |
| | • | | estimates of fair values used in purchase accounting and |
| | • | | estimates of the fair value of derivative instruments. |
Principles of Consolidation
The accompanying consolidated financial statements include all of the accounts of Endeavour and our consolidated subsidiaries. All significant intercompany accounts and transactions have been eliminated. Investments in entities over which we have significant influence, but not control, are carried at cost adjusted for equity in earnings or (losses) and distributions received.
Cash and Cash Equivalents
We consider all highly liquid instruments with an original maturity of 90 days or less at the time of purchase to be cash equivalents.
78
Endeavour International Corporation
Notes to Consolidated Financial Statements
(Amounts in tables in thousands, except per unit data)
Restricted Cash
Restricted cash has historically included amounts held in escrow for drilling rig commitments, as collateral for lines of credit, and for acquisitions.
Inventories
Materials and supplies and oil inventories are valued at the lower of cost or market value (net realizable value).
Full Cost Accounting for Oil and Gas Operations
Under the full cost method of accounting for oil and gas activities, all acquisition, exploration and development costs incurred for the purpose of finding oil and gas, are capitalized and accumulated in pools on a country-by-country basis. Capitalized costs include the cost of drilling and equipping productive wells, such as the estimated costs of dismantling and abandoning these assets, dry hole costs, lease acquisition costs, seismic and other geological and geophysical costs, delay rentals, costs related to such activities, certain directly-related employee costs and a portion of interest expense. Employee costs associated with production and other operating activities and general corporate activities are expensed in the period incurred.
Capitalized costs are limited on a country-by-country basis (the ceiling test). Under the ceiling test, if the capitalized cost of the full cost pool, net of deferred taxes, exceeds the ceiling limitation, the excess is charged as an impairment expense. The ceiling test limitation is calculated as the present value, discounted 10%, of:
| | • | | the future net cash flows related to estimated production of proved reserves, utilizing the average, first-day-of-the-month price for commodities; |
| | • | | the effect of derivative instruments that qualify as cash flow hedges; |
| | • | | the lower of cost or estimated fair value of unproved properties; and |
| | • | | the expected income tax effects of the above items. |
We utilize a single cost center for each country where we have operations for amortization purposes. Any sales or other conveyances of properties are treated as adjustments to the cost of oil and gas properties with no gain or loss recognized unless the operations are suspended in the entire cost center or the conveyance is significant in nature. Proved properties are amortized on a country-by-country basis using the units of production method (“UOP”). The amortization base in the UOP calculation includes the sum of proved property, net of accumulated DD&A, estimated future development costs (future costs to access and develop proved reserves), and asset retirement costs, less related salvage value.
Unproved property costs include the costs associated with unevaluated properties and properties under development and are not initially included in the full cost amortization base (where proved reserves exist) until the project is evaluated. These costs include unproved leasehold acreage, seismic data, wells and production facilities in progress and wells pending determination, together with interest costs capitalized for these projects. Seismic data costs are associated with specific unevaluated properties where the seismic data is acquired for the purpose of evaluating acreage or trends covered by a leasehold interest owned by us.
79
Endeavour International Corporation
Notes to Consolidated Financial Statements
(Amounts in tables in thousands, except per unit data)
Significant unproved properties are assessed periodically for possible impairment or reduction in value. If a reduction in value has occurred, these property costs are considered impaired and are transferred to the related full cost pool. Geological and geophysical costs included in unproved properties are transferred to the full cost amortization base along with the associated leasehold costs on a specific project basis. Costs associated with wells in progress and wells pending determination are transferred to the amortization base once a determination is made whether or not proved reserves can be assigned to the property. Costs of dry holes are transferred to the amortization base immediately upon determination that the well is unsuccessful. Unproved properties whose acquisition costs are not individually significant are aggregated and the portion of such costs estimated to be ultimately nonproductive, based on experience, are amortized to the full cost pool over an average holding period.
In countries where the existence of proved reserves has not yet been determined, unevaluated property costs remain capitalized in unproved property cost centers until proved reserves have been established, exploration activities cease or impairment and reduction in value occurs. If exploration activities result in the establishment of a proved reserve base, amounts in the unproved property cost center are reclassified as proved properties and become subject to amortization and the application of the ceiling test. When it is determined that the value of unproved property costs have been permanently diminished (in part or in whole) based on the impairment evaluation and future exploration plans, the unproved property cost centers related to the area of interest are impaired, and accumulated costs charged against earnings.
Other Property and Equipment
Other oil and gas assets, computer equipment and furniture and fixtures are recorded at cost, less accumulated depreciation. The assets are depreciated using the straight-line method over their estimated useful lives of two to five years.
Capitalized Interest
We capitalize interest on expenditures for significant exploration and development projects while activities are in progress to bring the assets to their intended use. Capitalized interest is calculated by multiplying our weighted-average interest rate on debt by the amount of qualifying costs and is limited to gross interest expense.
Business Combinations
Assets and liabilities acquired through a business combination are recorded at estimated fair value. We use all available information to make these fair value determinations, including information commonly considered by our engineers in valuing individual oil and gas properties and sales prices for similar assets. Estimated deferred taxes are based on available information concerning the tax basis of the acquired company’s assets and liabilities and carryforwards at the merger date.
80
Endeavour International Corporation
Notes to Consolidated Financial Statements
(Amounts in tables in thousands, except per unit data)
Any excess of the acquisition cost of the acquired business over the fair value amounts assigned to assets and liabilities is recorded as goodwill. Any excess of the amounts assigned to assets and liabilities over the acquisition of the acquired business is recorded as a gain on acquisition on the income statement. The amount of goodwill recorded in any particular business combination can vary significantly depending upon the fair values attributed to assets acquired and liabilities assumed relative to the total acquisition cost.
Goodwill and Intangible Assets
We assess the carrying amount of goodwill and other indefinite-lived intangible assets by testing the asset for impairment annually at year-end, or more frequently if events or changes in circumstances indicate that the asset might be impaired. The impairment test requires allocating goodwill and all other assets and liabilities to reporting units. The fair value of each reporting unit is determined and compared to the book value of the reporting unit. An impairment loss is recognized to the extent that the carrying amount exceeds the asset’s fair value.
Dismantlement, Restoration and Environmental Costs
We recognize liabilities for asset retirement obligations associated with tangible long-lived assets, such as producing well sites, offshore production platforms, and natural gas processing plants, with a corresponding increase in the related long-lived asset. The asset retirement cost is depreciated along with the property and equipment in the full cost pool. The asset retirement obligation is recorded at fair value and accretion expense, recognized over the life of the property, increases the liability to its expected settlement value. If the fair value of the estimated asset retirement obligation changes, an adjustment is recorded for both the asset retirement obligation and the asset retirement cost.
Revenue Recognition
We use the entitlements method to account for sales of gas production. We may receive more or less than our entitled share of production. Under the entitlements method, if we receive more than our entitled share of production, the imbalance is treated as a liability at the market price at the time the imbalance occurred. If we receive less than our entitled share, the imbalance is recorded as an asset at the lower of the current market price or the market price at the time the imbalance occurred. Oil revenues are recognized when production is sold to a purchaser at a fixed or determinable price, when delivery has occurred, title has transferred and collectability of the revenue is probable.
81
Endeavour International Corporation
Notes to Consolidated Financial Statements
(Amounts in tables in thousands, except per unit data)
Significant Customers
Our sales in the U.K. are to a limited number of customers, each of which accounted for more than 10% of revenue for the year ended December 31, 2012: Chevron North Sea Ltd and Shell U.K. Limited. Our sales in the U.S. are sold through our arrangements with the operators of the fields, with the majority of the sales being to J-W Operating Company.
Derivative Instruments and Hedging Activities
From time to time, we may utilize derivative financial instruments to hedge cash flows from operations or to hedge the fair value of financial instruments. We also have embedded derivatives related to our debt instruments and convertible preferred stock.
We may use derivative financial instruments with respect to a portion of our oil and gas production or a portion of our variable rate debt to achieve a more predictable cash flow by reducing our exposure to price fluctuations. These transactions are likely to be swaps, collars or options and to be entered into with major financial institutions or commodities trading institutions. Derivative financial instruments are intended to:
| | • | | reduce our exposure to declines in the market prices of crude oil and natural gas that we produce and sell, |
| | • | | reduce our exposure to increases in interest rates, and |
| | • | | manage cash flows in support of our annual capital expenditure budget. |
We record all derivatives at fair market value in our Consolidated Balance Sheets at the end of each period. The accounting for the fair market value, and the changes from period to period, depends on the intended use of the derivative and the resulting designation. This evaluation is determined at each derivative’s inception and begins with the decision to account for the derivative as a hedge, if applicable. The accounting for changes in the fair value of a derivative instrument that is not accounted for as a hedge is included in other (income) expense as an unrealized gain or loss. At December 31, 2012 and 2011, we had no outstanding derivatives that were accounted for as a hedge.
Where we intend to account for a derivative as a hedge, we document, at its inception, the hedging relationship, the risk management objective and the strategy for undertaking the hedge. The documentation includes the identification of the hedging instrument, the hedged item or transaction, the nature of the risk being hedged, and the method that will be used to assess effectiveness of derivative instruments that receive hedge accounting treatment.
Changes in fair value to hedge instruments, to the extent the hedge is effective, are recognized in other comprehensive income until the forecasted transaction occurs. Hedge effectiveness is assessed at least quarterly based on total changes in the derivative’s fair value. Any ineffective portion of the derivative instrument’s change in fair value is recognized immediately in other (income) expense.
82
Endeavour International Corporation
Notes to Consolidated Financial Statements
(Amounts in tables in thousands, except per unit data)
We discontinue hedge accounting prospectively when: (1) we determine that the derivative is no longer effective in offsetting changes in the fair value or cash flows of a hedged item (including hedged items such as firm commitments or forecasted transactions); (2) the derivative expires; (3) it is no longer probable that the forecasted transaction will occur; (4) a hedged firm commitment no longer meets the definition of a firm commitment; or (5) management determines that designating the derivative as a hedging instrument is no longer appropriate.
Concentrations of Credit and Market Risk
Financial instruments that potentially subject us to concentrations of credit risk consist principally of cash deposits at financial institutions. At various times during the year, we may exceed the federally insured limits. To mitigate this risk, we place our cash deposits only with high credit quality institutions. Management believes the risk of loss is minimal.
Derivative financial instruments that hedge the price of oil and gas, interest rates or currency exposure will be generally executed with major financial or commodities trading institutions which expose us to market and credit risks, and may at times be concentrated with certain counterparties or groups of counterparties. Although notional amounts are used to express the volume of these contracts, the amounts potentially subject to credit risk, in the event of non-performance by the counterparties, are substantially smaller. We review the credit ratings of our counterparties to derivative contracts on a regular basis and to date we have not experienced any non-performance by any of our various counterparties.
As an independent oil and gas producer, our revenue, profitability and future rate of growth are substantially dependent upon prevailing prices for oil and gas, which are dependent upon numerous factors beyond our control, such as economic, political and regulatory developments and competition from other sources of energy. The energy markets have historically been very volatile, and there can be no assurance that oil and gas prices will not be subject to wide fluctuations in the future. A substantial or extended decline in oil and gas prices could have a material adverse effect on our financial position, results of operations, cash flows and our access to capital and on the quantities of oil and gas reserves that may be economically produced.
Foreign Currency Translation
The U.S. dollar is the functional currency for all of our existing operations, as a majority of all revenue and financing transactions in these operations are denominated in U.S. dollars. For foreign operations with the U.S. dollar as the functional currency, monetary assets and liabilities are remeasured into U.S. dollars at the exchange rate on the balance sheet date. Nonmonetary assets and liabilities are translated into U.S. dollars at historical exchange rates. Income and expense items are translated at exchange rates prevailing during each period. Adjustments are recognized currently as a component of foreign currency gain or loss and deferred income taxes. To the extent that business transactions are not denominated in U.S. dollars, we are exposed to foreign currency exchange rate risk.
83
Endeavour International Corporation
Notes to Consolidated Financial Statements
(Amounts in tables in thousands, except per unit data)
Income Taxes
We use the liability method of accounting for income taxes under which deferred tax assets and liabilities are recognized for the estimated future tax consequences attributable to differences between the financial statement carrying amounts of existing assets and liabilities, and their respective tax bases. Deferred tax assets and liabilities are measured using enacted tax rates in effect for the year in which those temporary differences are expected to be recovered or settled. The effect on deferred tax assets and liabilities of a change in tax rates is recognized as part of the provision for income taxes in the period that includes the enactment date. Deferred tax assets are reduced by a valuation allowance when, in the opinion of management, it is more likely than not that some portion of, or all of, the deferred tax assets will not be realized.
Share-Based Payments
We recognize all share-based payments to employees, including grants of employee stock options, based on their fair values. The share-based compensation cost is measured at the grant date, based on the calculated fair value of the award, and is recognized as general and administrative expense over the employee’s requisite service period (generally the vesting period of the equity award). We apply the fair value method in accounting for stock option grants using the Black-Scholes Method.
It is our policy to use authorized but unissued shares of stock when stock options are exercised. At December 31, 2012, we had approximately 2.4 million additional shares available for issuance pursuant to our existing stock incentive plan.
Adoption of New Accounting Standards
On January 1, 2012, we adopted the following new standards without material effects on our results of operations or financial position:
| | • | | Fair Value - An accounting standard on fair value measurements that clarifies the application of existing guidance and disclosure requirements, changes certain fair value measurement principles and requires additional disclosures about fair value measurements. |
| | • | | Comprehensive Income - Guidance impacting the presentation of comprehensive income. The guidance eliminates the current option to report components of other comprehensive income in the statement of changes in equity or in a footnote to the financial statements. |
84
Endeavour International Corporation
Notes to Consolidated Financial Statements
(Amounts in tables in thousands, except per unit data)
| | • | | Goodwill - Amendment to the previously issued guidance on testing goodwill for impairment. The revised guidance provides entities with an option of performing a qualitative assessment prior to calculating the fair value of the reporting unit. |
Note 3– Business Combinations
On December 23, 2011, we entered into a Sale and Purchase Agreement (the “Purchase Agreement”), through our wholly owned subsidiary EEUK, with ConocoPhillips (U.K.) Limited, ConocoPhillips Petroleum Limited and ConocoPhillips (U.K.) Lambda Limited, subsidiaries of ConocoPhillips (collectively, the “Sellers”), to acquire their interest in three producing U.K. oil fields in the Central North Sea.
On May 31, 2012, we closed the Alba field portion of the acquisition, which consisted of an additional 23.43% interest in the Alba field. This increased our total working interest in the Alba field to 25.68%. The Alba Acquisition was closed for aggregate cash consideration of approximately $229.6 million.
Upon the closing of the Alba Acquisition, the net proceeds from the offering of our 2018 Notes were released from escrow. We used approximately $205 million of the net proceeds from the sale of the Senior Notes due 2018 together with approximately $24 million of borrowings under our Revolving Credit Facility with Cyan, as administrative agent and the other lenders party thereto, to fund the cash consideration for the acquisition of the Alba field portion of the COP Acquisition. Additional information on these related financing transactions is discussed in Note 9.
85
Endeavour International Corporation
Notes to Consolidated Financial Statements
(Amounts in tables in thousands, except per unit data)
The acquisition of the additional interest in the Alba field was accounted for using the business combination method. The following summarizes the allocation of the purchase price for the Alba Acquisition:
| | | | |
Purchase Price | | $ | 255,400 | |
Purchase Price adjustments for estimated after-tax cash flows from the acquired asset and interest costs from effective date of January 1, 2011 to closing | | | (25,823 | ) |
| | | | |
Total purchase price | | $ | 229,577 | |
| | | | |
Allocation of purchase price: | | | | |
Property and equipment | | $ | 186,801 | |
Goodwill | | | 50,878 | |
Current assets | | | 24,632 | |
Current liabilities | | | (12,815 | ) |
Deferred tax liability | | | (5,818 | ) |
Other long-term liabilities | | | (14,101 | ) |
| | | | |
Total purchase price | | $ | 229,577 | |
| | | | |
Goodwill was the excess of the consideration transferred over the net assets recognized and represents the future economic benefits arising from assets acquired that could not be individually identified and separately recognized. The assessments of the fair values of oil and gas properties acquired were based on projections of expected future net cash flows, discounted to present value.
The following table sets forth unaudited pro forma condensed combined financial and operating data which are presented to give effect to the Alba acquisition as if it had occurred January 1, 2011. The information does not purport to be indicative of actual results, if any of these transactions had been in effect for the periods indicated, or future results.
| | | | | | | | |
| | | Year Ended December 31, | |
| | | 2012 | | | 2011 | |
Revenues | | $ | 291,575 | | | $ | 318,476 | |
Net income (loss) to common shareholders | | $ | (95,245 | ) | | $ | (131,881 | ) |
Net Income (loss) per share - basic and diluted | | $ | (2.24 | ) | | $ | (3.67 | ) |
Revenues and income from operations associated with the acquired interest in the Alba field for the period from May 31, 2012 through December 31, 2012 were $ 119.7 million and $ 13.7 million, respectively.
After substantial effort and extensions, we and the Sellers were unable to reach the unanimous agreement and consent required to transfer the interests in the two remaining U.K. oil fields due to failure to agree on certain commercial terms related to the future timing and amount of collateral required to be posted for future decommissioning costs.
86
Endeavour International Corporation
Notes to Consolidated Financial Statements
(Amounts in tables in thousands, except per unit data)
As a result of the parties being unable to reach agreement to enable the transfers to occur, the Purchase Agreement terminated in accordance with its terms on December 14, 2012. As previously disclosed, we paid a $10 million deposit in connection with the acquisition of the interests in the two remaining fields, which ConocoPhillips retained.
Note 4 – Prepaid Expenses and Other Current Assets
Prepaid expenses and other current assets consisted of the following:
| | | | | | | | |
| | | December 31, | |
| | | 2012 | | | 2011 | |
Prepaid well and drilling costs | | $ | 2,843 | | | $ | 3,053 | |
Prepaid insurance | | | 3,330 | | | | 1,346 | |
Inventory | | | 5,127 | | | | 1,629 | |
Fair market value of commodity derivatives – current | | | — | | | | 1,247 | |
Deposits and other costs related to the Alba Acquisition | | | — | | | | 9,064 | |
Deferred tax asset | | | 8,089 | | | | — | |
Other | | | 1,606 | | | | 2,501 | |
| | | | | | | | |
| | $ | 20,995 | | | $ | 18,840 | |
| | | | | | | | |
87
Endeavour International Corporation
Notes to Consolidated Financial Statements
(Amounts in tables in thousands, except per unit data)
Note 5 – Property and Equipment
Property and equipment included the following:
| | | | | | | | |
| | | December 31, | |
| | | 2012 | | | 2011 | |
Oil and gas properties under the full cost method: | | | | | | | | |
Subject to amortization | | $ | 915,801 | | | $ | 496,667 | |
Not subject to amortization: | | | | | | | | |
Acquired in 2012 | | | 141,837 | | | | — | |
Acquired in 2011 | | | 107,510 | | | | 138,912 | |
Acquired in 2010 | | | 47,148 | | | | 47,208 | |
Acquired prior to 2010 | | | 52,938 | | | | 72,214 | |
| | | | | | | | |
| | | 1,265,234 | | | | 755,001 | |
Computers, furniture and fixtures | | | 8,863 | | | | 6,421 | |
| | | | | | | | |
Total property and equipment | | | 1,274,097 | | | | 761,422 | |
Accumulated depreciation, depletion and amortization | | | (270,656 | ) | | | (212,226 | ) |
| | | | | | | | |
Net property and equipment | | $ | 1,003,441 | | | $ | 549,196 | |
| | | | | | | | |
The costs not subject to amortization include
| | • | | values assigned to unproved reserves acquired, |
| | • | | exploration costs such as drilling costs for projects awaiting approved development plans or the determination of whether or not proved reserves can be assigned, and |
| | • | | other seismic and geological and geophysical costs. |
These costs are transferred to the amortization base when it is determined whether or not proved reserves can be assigned to such properties. This analysis is dependent upon well performance, results of infield drilling, approval of development plans, drilling results and development of identified projects and periodic assessment of reserves. We expect acquisition costs excluded from amortization to be transferred to the amortization base over the next five years due to a combination of well performance and results of infield drilling relating to currently producing assets and the drilling and development of identified projects acquired, such as the Rochelle field. We expect exploration costs not subject to amortization to be transferred to the amortization base over the next three years as development plans are completed and production commences on existing discoveries.
88
Endeavour International Corporation
Notes to Consolidated Financial Statements
(Amounts in tables in thousands, except per unit data)
The following is a summary of our oil and gas properties not subject to amortization as of December 31, 2012:
| | | | | | | | | | | | | | | | | | | | |
| | | Costs Incurred in the Year Ended December 31, | |
| | | 2012 | | | 2011 | | | 2010 | | | Prior to 2010 | | | Total | |
Acquisition costs | | $ | 47,995 | | | $ | 48,904 | | | $ | 23,648 | | | $ | 15,176 | | | $ | 135,723 | |
Exploration costs | | | 72,490 | | | | 54,729 | | | | 23,500 | | | | 37,762 | | | | 188,481 | |
Capitalized interest | | | 21,352 | | | | 3,877 | | | | — | | | | — | | | | 25,229 | |
| | | | | | | | | | | | | | | | | | | | |
Total oil and gas properties not subject to amortization | | $ | 141,837 | | | $ | 107,510 | | | $ | 47,148 | | | $ | 52,938 | | | $ | 349,433 | |
| | | | | | | | | | | | | | | | | | | | |
During 2012, 2011 and 2010, we capitalized $17.9 million, $13.3 million and $13.1 million, respectively, in certain directly related employee costs. During 2012, 2011 and 2010, we capitalized $26.9 million, $14.7 million and $3.9 million, respectively, in interest.
During 2012, 2011 and 2010, we recorded $53.1 million, $65.7 million and $7.7 million, respectively, of impairment through the application of the full cost ceiling test. The 2012 impairment was primarily due to the decline in U.S. oil and gas prices. The 2011 impairment was primarily related to declines in U.S. gas prices and the impact of our determination that the likely economic returns in the future would not warrant further investment in our test wells in the Alabama area. Our decision to discontinue activities in that area resulted in the reclassification of related amounts as being evaluated for full cost accounting purposes.
The impairment during 2010 was also related to our U.S. oil and gas properties, pre-tax, and was primarily due to the declaration of two wells as dry holes during the first quarter of 2010 – the Alligator Bayou well which was spud in 2008 and a well under a participation agreement.
Assets Acquisitions
United Kingdom
On February 23, 2011, we closed our acquisition of an additional 20% working interest in the Bacchus field for approximately $9.2 million in cash paid at closing and approximately $6.2 million in cash paid in 2012. In addition, we paid capital costs incurred by the seller of $9.4 million. Following the acquisition, we hold an aggregate 30% working interest in the Bacchus field.
89
Endeavour International Corporation
Notes to Consolidated Financial Statements
(Amounts in tables in thousands, except per unit data)
Marcellus and Haynesville
During 2010, we entered into a participation agreement with a private oil and gas operator, and acquired interests in certain acreage in North Louisiana/East Texas and Western Pennsylvania, primarily in the Haynesville and Marcellus areas. Our initial investment was $15 million in cash, and we will pay a share of that operator’s drilling and completion expenditures as wells are drilled in Haynesville over the next few years. Under this agreement, we also acquired additional acreage in the Marcellus area for approximately $7.5 million during the second quarter of 2010.
On October 26, 2012, we completed a nonmonetary exchange with our domestic co-venturer whereby we exchanged our Bull Bayou Haynesville and Willow Springs Cotton Valley properties for all of the co-venturer’s upstream and midstream interests in the Pennsylvania Marcellus area. In parallel, we secured a third party gas gathering agreement for the Daniel Project in Cameron County, Pennsylvania. We now operate and control the Marcellus assets while retaining a 50% position in our remaining producing Haynesville acreage.
Alabama
During 2010, we also acquired interests in an exploratory gas shale play in Alabama with an initial net investment of approximately $8.0 million. During the third quarter of 2011, we completed our analysis of our test wells in the Alabama area and determined that the likely economic returns in the future would not warrant further investment and therefore reclassified these amounts as evaluated for full cost accounting purposes.
Business Combination
On May 31, 2012, we closed the Alba Acquisition, which consisted of an additional 23.43% interest in the Alba field. This increased our total working interest in the Alba field to 25.68%. The Alba Acquisition was closed for aggregate cash consideration of approximately $229.6 million.
Asset Disposition
On October 19, 2010, we completed the Cygnus Sale for $110 million in cash, and recorded a gain of $87 million. The cash proceeds were not burdened by any current taxes payable and were primarily used to accelerate our development projects.
90
Endeavour International Corporation
Notes to Consolidated Financial Statements
(Amounts in tables in thousands, except per unit data)
Note 6 – Goodwill
In connection with several business acquisitions, we recorded goodwill for the excess of the purchase price over the value assigned to individual assets acquired and liabilities assumed.
| | | | | | | | |
| | | December 31, | |
| | | 2012 | | | 2011 | |
Balance at beginning of year | | $ | 211,886 | | | $ | 211,886 | |
Additions related to acquisitions | | | 50,878 | | | | — | |
| | | | | | | | |
Balance at end of year | | $ | 262,764 | | | $ | 211,886 | |
| | | | | | | | |
Note 7 – Other Assets
Other long-term assets consisted of the following at December 31:
| | | | | | | | |
| | | 2012 | | | 2011 | |
Debt issuance costs | | $ | 30,599 | | | $ | 23,460 | |
Deferred issuance costs related to reimbursement agreements | | | 11,290 | | | | — | |
Deposits related to SM Energy litigation | | | 6,000 | | | | 6,000 | |
Other | | | 2,017 | | | | 924 | |
| | | | | | | | |
| | $ | 49,906 | | | $ | 30,384 | |
| | | | | | | | |
Debt issuance costs and deferred issuance costs related to our reimbursement agreements are amortized over the life of the related obligation. During 2012, we incurred $32.2 million in debt issuance costs related to the issuance of our 2018 Notes and Revolving Credit Facility. See Note 9 for additional discussion.
As discussed in Note 20, we are in litigation concerning the terminated acquisition of properties from SM Energy. We paid $6.0 million in a deposit upon executing the acquisition agreement with SM Energy, and SM Energy has retained the deposit, which we believe we are entitled to recover.
91
Endeavour International Corporation
Notes to Consolidated Financial Statements
(Amounts in tables in thousands, except per unit data)
Note 8 – Accrued Expenses
We had the following accrued expenses and other current liabilities outstanding:
| | | | | | | | |
| | | December 31, | |
| | | 2012 | | | 2011 | |
Foreign taxes payable | | $ | 18,989 | | | $ | 445 | |
Accrued interest | | | 25,932 | | | | 3,186 | |
Preferred dividends | | | 1,617 | | | | 1,459 | |
Accrued compensation | | | 1,882 | | | | 4,671 | |
Current portion of asset retirement obligations | | | 36,255 | | | | 2,078 | |
Development asset accrual | | | — | | | | 6,160 | |
Other | | | 5,425 | | | | 2,550 | |
| | | | | | | | |
| | $ | 90,100 | | | $ | 20,549 | |
| | | | | | | | |
92
Endeavour International Corporation
Notes to Consolidated Financial Statements
(Amounts in tables in thousands, except per unit data)
Note 9 – Debt Obligations
Our debt consisted of the following at December 31:
| | | | | | | | |
| | | 2012 | | | 2011 | |
Senior notes, 12% fixed rate, due 2018 | | $ | 554,000 | | | $ | — | |
Convertible senior notes, 5.5% fixed rate, due 2016 | | | 135,000 | | | | 135,000 | |
Revolving credit facility, 13% fixed rate, due 2013 | | | 115,163 | | | | — | |
Convertible bonds, 11.5% until March 31, 2014 and 7.5% thereafter, due 2016 | | | 70,029 | | | | 62,523 | |
Senior term loan, 15% fixed rate, due 2013 | | | — | | | | 240,349 | |
Subordinated notes, 12% fixed rate, due 2014 | | | — | | | | 32,012 | |
| | | | | | | | |
| | | 874,192 | | | | 469,884 | |
Less: debt discount, net of premium | | | (14,686 | ) | | | (2,506 | ) |
Less: current maturities | | | (15,713 | ) | | | (12,350 | ) |
| | | | | | | | |
Long-term debt | | $ | 843,793 | | | $ | 455,028 | |
| | | | | | | | |
Standby letters of credit outstanding for abandonment liabilities | | $ | — | | | $ | 31,724 | |
| | | | | | | | |
Principal maturities of debt at December 31, 2012 are as follows:
| | | | |
2013 | | $ | 15,713 | |
2014 | | | 99,450 | |
2015 | | | — | |
2016 | | | 205,029 | |
2017 | | | — | |
Thereafter | | | 554,000 | |
Senior Notes
On February 23, 2012, we closed the private placement of $350 million aggregate principal amount of 12% first priority notes due 2018 (the “First Priority Notes”) and $150 million aggregate principal amount of 12% second priority notes due 2018 (the “Second Priority Notes,” and, together with the First Priority Notes, the “2018 Notes”). Each series of 2018 Notes issued in February 2012 was priced at 96% of par, at a yield to maturity of 12.975% for the First Priority Notes and 12.954% for the Second Priority Notes, for an aggregate $20 million discount. We also paid approximately $21 million in other financing costs related to the 2018 Notes.
93
Endeavour International Corporation
Notes to Consolidated Financial Statements
(Amounts in tables in thousands, except per unit data)
On May 31, 2012, concurrent with the closing of the Alba Acquisition, the net proceeds were used to fund the acquisition and repay all outstanding amounts under the senior term loan (“Senior Term Loan”) (discussed below).
On October 15, 2012 we completed a private placement of an additional $54 million aggregate principal amount of our First Priority Notes, priced at 109% of par. In connection with the offering of the First Priority Notes, we received net proceeds of $57.9 million. The new first priority notes and those first priority notes initially issued in February 2012 are treated as a single class of debt securities under the same indenture. We utilized a portion of the proceeds from the October 2012 offering to retire the $25 million outstanding under our 12% senior subordinated notes due 2014. We will use the remainder of the net proceeds to finance a portion of the construction, improvement and other capital costs related to our U.S. and U.K. properties.
Revolving Credit Facility
On April 12, 2012, we entered into a $100 million Revolving Credit Facility, with Cyan, as administrative agent, and borrowed $40 million. The Revolving Credit Facility matures on October 12, 2013.
Prior to the termination of the Senior Term Loan, the closing of the Alba Acquisition and certain other conditions, borrowings under the Revolving Credit Facility were limited to $40 million and incurred interest at a rate of 12% per year, with an additional 3% payment-in-kind. After the termination of the Senior Term Loan and the closing of the Alba Acquisition, borrowings under the Revolving Credit Facility bear interest at a rate of 13% per year.
On May 31, 2012, we entered into a First Amendment to the Revolving Credit Facility, providing for an increase in the amount available for borrowing under the Revolving Credit Facility from $40 million to $100 million upon closing of the acquisition of the Alba Acquisition. In connection with the closing of the Alba Acquisition, we drew down the additional $60 million available for borrowing. The First Amendment to the Revolving Credit Facility contained certain amendments allowing us to enter certain reimbursement agreements discussed in Note 13.
On September 27, 2012, we increased the amount available for borrowing under the Revolving Credit Facility to $125 million. In connection with the increase, we agreed to pay a fee of $1.25 million to Cyan. On September 28, 2012, we borrowed an additional $15 million under the Revolving Credit Facility.
Subsequent to December 31, 2012, we amended the Revolving Credit Facility to extend the maturity date of $100 million of the facility to June 30, 2014. See Note 24 for additional discussion.
94
Endeavour International Corporation
Notes to Consolidated Financial Statements
(Amounts in tables in thousands, except per unit data)
Senior Term Loan
In August 2010, we entered into a credit agreement with Cyan, as administrative agent, and various lenders for the Senior Term Loan, in the aggregate amount of $150 million, which was subsequently increased to $235 million. We paid $25.4 million in financing costs related to the issuance of the Senior Term Loan.
On May 31, 2012, we used approximately $255 million of the net proceeds from our offering of the 2018 Notes to repay all amounts outstanding under Senior Term Loan. This repayment included a prepayment fee of approximately $7 million. Following the repayment the Senior Term Loan was terminated and all of the liens on the collateral securing our obligations were released.
5.5% Convertible Senior Notes
In July 2011, we issued $135 million aggregate principal amount of our 5.5% convertible senior notes due July 15, 2016 (the “5.5% Convertible Senior Notes”). Interest on these notes is payable semiannually at a rate of 5.5% per annum. The 5.5% Convertible Senior Notes are convertible into shares of our common stock at an initial conversion rate of 54.019 shares (equivalent to $18.51 per share) of common stock per $1,000 principal amount of the notes, subject to certain anti-dilution adjustments. In addition, following certain Make-Whole Fundamental Changes, as defined, we will increase the conversion rate for a holder who elects to convert its 5.5% Convertible Senior Notes.
The 5.5% Convertible Senior Notes are unsecured but guaranteed by our existing material domestic subsidiaries. We may not redeem the 5.5% Convertible Senior Notes prior to their maturity. The indenture governing the 5.5% Convertible Senior Notes provides for customary events of default.
If we undergo a “fundamental change” as defined, the holders of the 5.5% Convertible Senior Notes have the right, subject to certain conditions, to redeem the 5.5% Convertible Senior Notes and accrued interest. The 5.5% Convertible Senior Notes may become immediately due upon the occurrence of certain events of default, as defined.
11.5% Convertible Bonds
In January 2008, we issued 11.5% convertible bonds due 2014 (the “11.5% Convertible Bonds”) for gross proceeds of $40 million pursuant to a private offering to a sophisticated investor in Norway. The net proceeds from the issuance of the 11.5% Convertible Bonds were used to repay a portion of our outstanding indebtedness. The 11.5% Convertible Bonds bear interest at a rate of 11.5% per annum, compounded quarterly. Interest is compounded quarterly and added to the outstanding principal balance each quarter. The bonds are convertible into shares of our
95
Endeavour International Corporation
Notes to Consolidated Financial Statements
(Amounts in tables in thousands, except per unit data)
common stock at a conversion price of $16.52 per $1,000 of principal, which represents a conversion rate of approximately 61 shares of our common stock per $1,000 of principal. The conversion price will be adjusted in accordance with the terms of the bonds upon occurrence of certain events, including payment of common stock dividends, common stock splits or issuance of common stock at a price below the then current market price.
If we undergo a “change of control” as defined, the holders of the bonds have the right, subject to certain conditions, to redeem the bonds and accrued interest. The bonds may become immediately due upon the occurrence of certain events of default, as defined.
Two derivatives are associated with the conversion and change in control features of the 11.5% Convertible Bonds. At December 31, 2012, the combined fair market value of these derivatives is $4.4 million, reflecting a $9.4 million decrease during 2012 that was recorded in unrealized gains (losses) on derivatives.
On March 11, 2011, we entered into an amendment to the Trust Deed related to our 11.5% Convertible Bonds. The amendment provided for:
| | • | | the amendment of the maturity date of the 11.5% Convertible Bonds from January 24, 2014 to January 24, 2016; |
| | • | | the amendment of the date upon which the holders of the 11.5% Convertible Bonds may first exercise a put right, and the occurrence of the conversion price reset if such put right is not exercised, from January 24, 2012 to January 24, 2016; and |
| | • | | a reduction in the interest rate payable from 11.5% to 7.5% on and after March 31, 2014. |
We recorded a loss of $0.8 million in other expenses related to this amendment, representing the difference between the fair value of the debt and the book value of the debt at March 11, 2011.
Subordinated Notes
Our Subordinated Notes bear interest at an annual rate of 10%, plus 2% capitalized to the outstanding principal amount. We utilized a portion of the proceeds from our October 2012 offering of additional First Priority Notes due 2018 to redeem, repurchase, or otherwise retire our outstanding 12% senior subordinated notes.
Fair Value
The fair value of our outstanding debt obligations was $869.5 million and $419.8 million at December 31, 2012 and 2011, respectively. The fair values of long-term debt were determined based upon external market quotes for our 2018 Notes and 5.5% Convertible Senior Notes and discounted cash flows for other debt, which results in a Level 3 fair-value measurement.
96
Endeavour International Corporation
Notes to Consolidated Financial Statements
(Amounts in tables in thousands, except per unit data)
Letter of Credit Agreement
In July 2011, we entered into a letter of credit facility agreement with Commonwealth Bank of Australia (“CBA”), pursuant to which CBA issued letters of credit to us in the amount of £20.6 million (approximately $35 million upon issuance). The letters of credit secured decommissioning obligations in connection with certain of our United Kingdom Continental Shelf Petroleum Production Licenses. Concurrent with the issuance of the letters of credit, prior restrictions on £20.6 million of our restricted cash were removed and the cash returned for general corporate purposes. We terminated this letter of credit facility agreement in May 2012.
97
Endeavour International Corporation
Notes to Consolidated Financial Statements
(Amounts in tables in thousands, except per unit data)
Note 10 – Income Taxes
The income (loss) before income taxes and the components of the income tax expense (benefit) recognized on the Consolidated Statement of Income are as follows:
| | | | | | | | | | | | | | | | |
(Amounts in thousands) | | U.K. | | | U.S. | | | Other | | | Total | |
Year Ended December 31, 2012: | | | | | | | | | | | | | | | | |
Net income (loss) before taxes | | $ | (22,959 | ) | | $ | (91,383 | ) | | $ | 2,344 | | | $ | (111,998 | ) |
Current tax expense | | | 31,796 | | | | — | | | | 26 | | | | 31,822 | |
Deferred tax expense related to U.K. tax rate change | | | 8,587 | | | | — | | | | — | | | | 8,587 | |
Deferred tax benefit | | | (26,181 | ) | | | — | | | | — | | | | (26,181 | ) |
| | | | | | | | | | | | | | | | |
Total tax expense | | | 14,202 | | | | — | | | | 26 | | | | 14,228 | |
| | | | | | | | | | | | | | | | |
Net income (loss) after taxes | | $ | (37,161 | ) | | $ | (91,383 | ) | | $ | 2,318 | | | $ | (126,226 | ) |
| | | | | | | | | | | | | | | | |
Year Ended December 31, 2011: | | | | | | | | | | | | | | | | |
Net income (loss) before taxes | | $ | (9,806 | ) | | $ | (99,409 | ) | | $ | 5,281 | | | $ | (103,934 | ) |
Current tax expense | | | 5,926 | | | | 4 | | | | 15 | | | | 5,945 | |
Deferred tax expense related to U.K. tax rate change | | | 25,424 | | | | — | | | | — | | | | 25,424 | |
Deferred tax benefit | | | (4,308 | ) | | | — | | | | — | | | | (4,308 | ) |
| | | | | | | | | | | | | | | | |
Total tax expense | | | 27,042 | | | | 4 | | | | 15 | | | | 27,061 | |
| | | | | | | | | | | | | | | | |
Net income (loss) after taxes | | $ | (36,848 | ) | | $ | (99,413 | ) | | $ | 5,266 | | | $ | (130,995 | ) |
| | | | | | | | | | | | | | | | |
Year Ended December 31, 2010: | | | | | | | | | | | | | | | | |
Net income (loss) before taxes | | $ | 90,160 | | | $ | (30,978 | ) | | $ | (3,439 | ) | | $ | 55,743 | |
Current tax (benefit) expense | | | 2,734 | | | | | | | | (154 | ) | | | 2,580 | |
Deferred tax (benefit) expense | | | (2,388 | ) | | | | | | | (929 | ) | | | (3,317 | ) |
Foreign currency losses on deferred tax liabilities | | | — | | | | — | | | | (51 | ) | | | (51 | ) |
| | | | | | | | | | | | | | | | |
Total tax (benefit) expense | | | 346 | | | | — | | | | (1,134 | ) | | | (788 | ) |
| | | | | | | | | | | | | | | | |
Net income (loss) after taxes | | $ | 89,814 | | | $ | (30,978 | ) | | $ | (2,305 | ) | | $ | 56,531 | |
| | | | | | | | | | | | | | | | |
98
Endeavour International Corporation
Notes to Consolidated Financial Statements
(Amounts in tables in thousands, except per unit data)
Effective Tax Rate Reconciliation
The following table presents the principal reasons for the difference between our effective tax rates and the United States federal statutory income tax rate of 35%.
| | | | | | | | | | | | |
| | | Year Ended December 31, | |
| | | 2012 | | | 2011 | | | 2010 | |
Federal income tax expense (benefit) at statutory rate | | $ | (39,199 | ) | | $ | (36,378 | ) | | $ | 19,500 | |
Effect of out-of-period adjustment | | | 6,997 | | | | — | | | | — | |
Taxation of foreign operations | | | 5,859 | | | | 3,254 | | | | (579 | ) |
Tax-free gain on sale of reserves in place | | | — | | | | — | | | | (30,510 | ) |
Change in valuation allowance – U.S. | | | 30,329 | | | | 24,604 | | | | (2,252 | ) |
U.K. Tax increase from tax law and rate changes | | | 8,587 | | | | 25,424 | | | | — | |
Foreign currency (gain) loss on deferred taxes | | | — | | | | — | | | | (50 | ) |
Deemed foreign dividend of wholly owned subsidiaries | | | — | | | | 8,572 | | | | 11,466 | |
Disallowed executive compensation | | | 1,655 | | | | 1,585 | | | | 765 | |
Other | | | — | | | | — | | | | 872 | |
| | | | | | | | | | | | |
Total Income Tax Expense | | $ | 14,228 | | | $ | 27,061 | | | $ | (788 | ) |
| | | | | | | | | | | | |
Effective Income Tax Rate | | | -13 | % | | | -26 | % | | | -1 | % |
| | | | | | | | | | | | |
During 2012, 2011 and 2010, we incurred taxes primarily related to our operations in the U.K. In 2012, 2011 and 2010, we had a loss before taxes of $91.4 million, $99.4 million and $31.0 million, respectively, in the U.S. and we did not record any income tax benefits on these losses as there was no assurance that we could generate any future U.S. taxable earnings. As a result, we recorded a valuation allowance on the full amount of all deferred tax assets generated in the U.S.
Deferred Tax Assets and Liabilities
Deferred income taxes result from the net tax effects of temporary timing differences between the carrying amounts of assets and liabilities reflected on the financial statements and the amounts recognized for income tax purposes. The tax effects of temporary differences that give rise to significant portions of deferred tax assets and liabilities are as follows at December 31:
99
Endeavour International Corporation
Notes to Consolidated Financial Statements
(Amounts in tables in thousands, except per unit data)
| | | | | | | | |
| | | 2012 | | | 2011 | |
Deferred tax asset: | | | | | | | | |
Deferred compensation | | $ | 2,268 | | | $ | 5,859 | |
Unrealized loss on commodity derivative instruments | | | — | | | | 1,260 | |
Asset retirement obligation | | | 87,787 | | | | 29,122 | |
Net operating loss and capital loss carryforward | | | 334,121 | | | | 157,570 | |
Unrealized loss on embedded derivative instruments | | | 1,084 | | | | 4,005 | |
Property, plant and equipment | | | 19,596 | | | | 12,427 | |
Inventory / other | | | 8,089 | | | | — | |
| | | | | | | | |
Total deferred tax assets | | | 452,945 | | | | 210,243 | |
Less valuation allowance | | | (84,691 | ) | | | (58,532 | ) |
| | | | | | | | |
Total deferred tax assets after valuation allowance | | | 368,254 | | | | 151,711 | |
Deferred tax liability: | | | | | | | | |
Property, plant and equipment | | | (478,719 | ) | | | (258,779 | ) |
Petroleum revenue tax, net of tax benefit | | | (22,703 | ) | | | (229 | ) |
Debt discount | | | (630 | ) | | | (752 | ) |
Other | | | — | | | | (7,710 | ) |
| | | | | | | | |
Total deferred tax liabilities | | | (502,052 | ) | | | (267,470 | ) |
| | | | | | | | |
Net deferred tax liability | | $ | (133,798 | ) | | $ | (115,759 | ) |
| | | | | | | | |
Tax Attributes
At December 31, 2012, we had the following tax attributes available to reduce future income taxes:
| | | | | | | | | | | | | | |
| | | | | As of December 31, | |
| | | | | 2012 | | | 2011 | |
| | | Types of
Tax
Attributes | | Years of
Expiration | | Carry-
forward
Amount | | | Years of
Expiration | | Carry-
forward
Amount | |
U.K. | | | | | | | | | | | | | | |
Corporate tax | | NOL | | Indefinite | | $ | 500,789 | | | Indefinite | | $ | 228,701 | |
Supplemental Corporate tax | | NOL | | Indefinite | | | 378,602 | | | Indefinite | | | 159,316 | |
U.S. | | | | | | | | | | | | | | |
Corporate Income tax | | NOL | | 2023 - 2032 | | | 177,206 | | | 2023 - 2031 | | | 106,535 | |
Capital gains tax | | Capital loss | | 2015 | | | 1,848 | | | 2015 | | | 1,848 | |
100
Endeavour International Corporation
Notes to Consolidated Financial Statements
(Amounts in tables in thousands, except per unit data)
As of December 31, 2012, the U.K. tax attributes shown above have been recognized for financial statement reporting purposes to reduce deferred tax liability.
Valuation Allowances and Unrecognized Tax Benefits
Recognition of the benefits of the deferred tax assets requires that we generate future taxable income. In the U.S., there can be no assurance that we will generate any earnings or any specific level of earnings in future years. Therefore, we have established a valuation allowance for deferred tax assets of approximately $84.7 million and $58.5 million as of December 31, 2012 and 2011, respectively, primarily related to our U.S. operations. During 2012, the valuation allowance in the U.S. increased $29.1 million due to net operating losses and decreased $3.0 million in other jurisdictions. During 2011, the valuation allowance in the U.S. increased $24.6 million due to net operating losses and decreased $3.9 million in other jurisdictions. During 2010, the valuation allowance in the U.S. decreased $2.2 million due to net revisions of the net operating loss and increased $1.3 million for net operating losses in other jurisdictions.
For U.S. federal income tax purposes, certain limitations are imposed on an entity’s ability to utilize its net operating losses (“NOLs”) in future periods if a change of control, as defined for federal income tax purposes, has taken place. In general terms, the limitation on utilization of NOLs and other tax attributes during any one year is determined by the value of an acquired entity at the date of the change of control multiplied by the then-existing long-term, tax-exempt interest rate. We have determined that, for federal income tax purposes, a change of control occurred during 2004 and 2007, however, we do not believe such limitations will significantly impact our ability to utilize the NOL. The timing of NOL utilization will be determined by our future net income.
Uncertain Tax Positions
At December 31, 2012, we have an unrecognized tax benefit of $6.8 million relating to various U.K. tax matters. Any interest and penalties that may be incurred as part of this liability would be recognized as a component of interest expense and other expense, respectively. As of December 31, 2012, no interest or penalty expense had been incurred.
101
Endeavour International Corporation
Notes to Consolidated Financial Statements
(Amounts in tables in thousands, except per unit data)
The following represents a reconciliation of the change in our unrecognized tax benefits, for the year ended December 31, 2012.
| | | | | | | | | | | | |
| | | Year Ended December 31, | |
| | | 2012 | | | 2011 | | | 2010 | |
Balance at the beginning of the year | | $ | — | | | $ | — | | | $ | — | |
Increase in unrecognized tax benefits from current period tax position | | | 6,820 | | | | — | | | | — | |
| | | | | | | | | | | | |
Balance at the end of the year | | $ | 6,820 | | | $ | — | | | $ | — | |
| | | | | | | | | | | | |
As of December 31, 2012, we believe that no current tax positions that have resulted in unrecognized tax benefits will significantly increase or decrease within the next year. If recognized, none of the unrecognized tax benefits would have an impact on our effective tax rate.
The following tax years remain subject to examination:
| | |
Tax Jurisdiction | | |
U.K. | | 2011 |
All others | | 2009 - 2011 |
Foreign Earnings and Credits
As of December 31, 2012, we had de minimus unremitted earnings in our foreign subsidiaries. If these unremitted earnings had been dividend to the U.S., the U.S. NOLs not subject to the limitations mentioned above would be fully available to offset any incremental U.S. federal income tax. Further, the foreign tax credits associated with the unremitted earnings would be sufficient to offset any incremental U.S. tax liabilities associated with the dividend.
102
Endeavour International Corporation
Notes to Consolidated Financial Statements
(Amounts in tables in thousands, except per unit data)
Note 11 – Other Liabilities
Other liabilities included the following:
| | | | | | | | |
| | | December 31, | |
| | | 2012 | | | 2011 | |
Asset retirement obligations | | $ | 139,821 | | | $ | 45,180 | |
Long-term derivative liabilities | | | 7,402 | | | | 16,067 | |
Other | | | 469 | | | | 1 | |
| | | | | | | | |
Total Other Liabilities | | $ | 147,692 | | | $ | 61,248 | |
| | | | | | | | |
Our asset retirement obligations relate to obligation of the plugging and abandonment of oil and gas properties. The asset retirement obligation is recorded at fair value and accretion expense, recognized over the life of the property, increases the liability to its expected settlement value. If the fair value of the estimated asset retirement obligation changes, an adjustment is recorded for both the asset retirement obligation and the asset retirement cost. The following table provides a rollforward of the asset retirement obligations for the year ended December 31, 2012 and 2011:
| | | | | | | | |
| | | Year Ended
December 31, | |
| | | 2012 | | | 2011 | |
Carrying amount of asset retirement obligations, as of beginning of period | | $ | 47,258 | | | $ | 42,997 | |
Increase due to revised estimates | | | 102,447 | | | | 14,609 | |
Accretion expense (included in DD&A expense) | | | 7,542 | | | | 4,478 | |
Impact of foreign currency exchange rate changes | | | 3,019 | | | | 430 | |
Payment of asset retirement obligations | | | (8,521 | ) | | | (15,256 | ) |
Liabilities incurred and assumed | | | 24,331 | | | | — | |
| | | | | | | | |
Carrying amount of asset retirement obligations, as of end of year | | | 176,076 | | | | 47,258 | |
Less: current portion of asset retirement obligations | | | (36,255 | ) | | | (2,078 | ) |
| | | | | | | | |
Long-term asset retirement obligations | | $ | 139,821 | | | $ | 45,180 | |
| | | | | | | | |
103
Endeavour International Corporation
Notes to Consolidated Financial Statements
(Amounts in tables in thousands, except per unit data)
Note 12 – Equity
The activity in shares of our common and preferred stock during 2012, 2011 and 2010 included the following:
| | | | | | | | | | | | |
| | | Year Ended December 31, | |
| | | 2012 | | | 2011 | | | 2010 | |
Common Stock: | | | | | | | | | | | | |
Outstanding at the beginning of the year | | | 37,663 | | | | 24,784 | | | | 18,803 | |
Issuance of common stock | | | 8,625 | | | | 11,531 | | | | 4,638 | |
Exercise of stock options | | | — | | | | 93 | | | | 23 | |
Conversion of preferred stock | | | — | | | | 914 | | | | 572 | |
Issuance of stock based compensation | | | 403 | | | | 341 | | | | 748 | |
| | | | | | | | | | | | |
Outstanding at the end of the year | | | 46,691 | | | | 37,663 | | | | 24,784 | |
| | | | | | | | | | | | |
Series B Preferred Stock: | | | | | | | | | | | | |
Outstanding at the end of the year | | | 20 | | | | 20 | | | | 20 | |
| | | | | | | | | | | | |
Series C Convertible Preferred Stock: | | | | | | | | | | | | |
Outstanding at the beginning of the year | | | 37 | | | | 45 | | | | 50 | |
Conversion to common stock | | | — | | | | (8 | ) | | | (5 | ) |
| | | | | | | | | | | | |
Outstanding at the end of the year | | | 37 | | | | 37 | | | | 45 | |
| | | | | | | | | | | | |
Treasury Stock: | | | | | | | | | | | | |
Outstanding at the beginning of the year | | | (72 | ) | | | (72 | ) | | | (72 | ) |
| | | | | | | | | | | | |
Outstanding at the end of the year | | | (72 | ) | | | (72 | ) | | | (72 | ) |
| | | | | | | | | | | | |
Common Stock
The Common Stock is $0.001 par value common stock, and 125,000,000 shares are authorized.
In June 2012, we completed an underwritten public offering of 8.6 million shares of common stock at a price of $7.50 per common share ($7.13 per common share, net of underwriting discounts) for net proceeds of $61.3 million.
In May 2012, we entered into warrant agreements (the “Warrant Agreements”) through which we issued certain investors warrants to purchase a total of 2,000,000 shares of our common stock at an exercise price of $10.50 per share. The Warrant Agreements were entered into in connection with the May 31, 2012 reimbursement agreement (see Note 19 for additional discussion of this reimbursement agreement). The terms of each of the Warrant Agreements are substantially identical. The warrants expire on January 24, 2016 and are subject to customary anti-dilution provisions. We also agreed to provide the investors with customary resale registration rights as soon as reasonably practicable.
104
Endeavour International Corporation
Notes to Consolidated Financial Statements
(Amounts in tables in thousands, except per unit data)
The Warrant Agreements include a cashless exercise provision entitling each investor to surrender a portion of the underlying common stock that has a value equal to the aggregate exercise price in lieu of paying cash upon exercise of a warrant. In addition, any in-the-money warrants still outstanding at the expiration date are subject to an automatic cashless exercise.
In March 2011, we completed an underwritten public offering of 11.5 million shares of common stock at a price of $11.00 per common share ($10.34 per common share, net of underwriting discounts) for net proceeds of $118.4 million. In April 2011, we used a portion of the offering proceeds to redeem all $81.25 million of our outstanding 6% senior notes.
In October 2010, our Board of Directors authorized a one-for-seven share consolidation of our common stock, in the form of a reverse stock split. This consolidation was effective at the opening of trading on November 18, 2010. As a result of the share consolidation, every seven shares of our common stock outstanding were automatically combined into one share of our common stock. Each shareholder continues to hold the same percentage of our outstanding common shares. The shares were rounded up to the next whole share for those holders who would have otherwise received fractional shares. The share consolidation was intended to make our common stock available to a broader range of investors and reposition the company’s trading metrics.
In August 2010, in connection with the issuance of the Senior Term Loan, we completed a registered direct offering to Cyan of 1.3 million shares of our common stock for aggregate net cash consideration of approximately $10.1 million, after deducting expenses. The purchase price per share was $7.91, the closing price of our common stock on the NYSE Amex on August 13, 2010. The net proceeds from this offering were used for general corporate purposes.
In February 2010, we completed a private placement of 3.4 million shares of our common stock to certain existing stockholders, certain directors and other third-party investors, for aggregate net cash consideration of approximately $20.5 million. The purchase price per share was $6.30, the closing price of our common stock on February 3, 2010. The net proceeds from this private placement were used to partially fund our 2010 capital budget.
Series C Convertible Preferred Stock
We have 37,000 shares of Series C convertible preferred stock (the “Series C Preferred Stock”) outstanding, convertible into 4.2 million shares of common stock. The Series C Preferred Stock is convertible into common stock at any time at the option of the holders. The Series C Preferred Stock ranks senior to any of our other existing or future shares of capital stock. Dividends on the Series C Preferred Stock are:
| | • | | compounded quarterly based on the original issue price; |
| | • | | payable in cash or common stock, at 4.5% or 4.92%, respectively; and |
| | • | | payable to the preferred stock investors prior to payment of any other dividend on any other shares of our capital stock. |
105
Endeavour International Corporation
Notes to Consolidated Financial Statements
(Amounts in tables in thousands, except per unit data)
The Series C Preferred Stock also participates on an as-converted basis with respect to any dividends paid on the common stock.
In November 2009, we redeemed 60% of the outstanding shares of Series C Preferred Stock, which required the modified Series C Preferred Stock to be recorded at fair market value at the redemption date. The fair value of the modified Series C Preferred Stock was greater than the carrying value by $11.5 million. This excess of fair value over carrying value was recorded as a non-cash charge to preferred stock dividends and increased the carrying value of the Series C Preferred Stock. As holders convert the Series C Preferred Stock, the $11.5 million non-cash charge will be transferred to equity on a ratio of shares converted to shares of Series C Preferred Stock outstanding.
We have an embedded derivative associated with the change in control features of the Series C Preferred Stock. This embedded derivative is recorded in other liabilities.
The Series C Preferred Stock is convertible into common stock at any time at the option of the preferred stock investors, at (i) a conversion price of $8.75 and (ii) in an amount of common stock equal to the quotient of the liquidation preference of $1,000 per share plus accrued but unpaid dividends (the “Liquidation Preference”) divided by the conversion price.
Issuance of dividends in the form of common stock are subject to the following equity conditions (the “Equity Conditions”), which are waivable by two-thirds of the holders of the Series C Preferred Stock: (i) such common stock is listed on the NYSE Amex, the New York Stock Exchange or the Nasdaq Stock Market, and not subject to any trading suspension; (ii) we are not then subject to any bankruptcy event; and (iii) such common stock will be immediately re-saleable by the holders pursuant to an effective registration statement and otherwise in compliance with all applicable laws. If we do not maintain the effectiveness of the registration statement, then the dividend rate on the Series C Preferred Stock will be increased by the product of 2.5% (if the dividend is paid in cash) or 2.63% (if the dividend is paid in stock) times the number of quarters (or portions thereof) in which the failure occurs or we fail to cure such failure.
We may redeem all of the Series C Preferred Stock in exchange for a cash payment to the preferred stock investors of an amount equal to 102% of the sum of the Liquidation Preference. If we call the Series C Preferred Stock for redemption, the holders thereof will have the right to convert their shares into a newly issued preferred stock identical in all respects to the Series C Preferred Stock except that such newly issued preferred stock will not bear a dividend (the “Alternate Preferred Stock”). We may not redeem the Series C Preferred Stock if the Equity Conditions are not then satisfied with respect to the common stock into which the Alternate Preferred Stock is convertible.
106
Endeavour International Corporation
Notes to Consolidated Financial Statements
(Amounts in tables in thousands, except per unit data)
Upon the tenth anniversary of the initial issuance of the Series C Preferred Stock, we must redeem all of the Series C Preferred Stock for an amount equal to the Liquidation Preference plus accrued and unpaid dividends payable by us in cash or common stock at our election. Issuance by us of common stock for such redemption is subject to the Equity Conditions and to the market value of the outstanding shares of common stock immediately prior to such redemption equaling at least $500 million.
In the event of a change of control of Endeavour, we will be required to offer to redeem all of the Series C Preferred Stock for the greater of: (i) the amount equal to which such holder would be entitled to receive had the holder converted such Series C Preferred Stock into common stock; (ii) 115% of the sum of the Liquidation Preference plus accrued and unpaid dividends; and (iii) the amount resulting in an internal rate of return to such holder of 15% from the date of issuance of such Series C Preferred Stock through the date that Endeavour pays the redemption price for such shares.
In January 2010, we and the holders of our outstanding Series C Preferred Stock corrected a technical oversight in the Subscription and Registration Rights Agreement for our Series C Preferred Stock. The amendment aligns the number of common shares reserved for the potential conversion of the Series C Preferred Stock to the terms of the Series C Preferred Stock after our partial redemption in November 2009. In March 2010, we also amended the Certificate of Designation for the Series C Preferred Stock and the $50 million subordinated notes issued to the holders of the Series C Preferred Stock to make certain technical changes that align certain definitions and provisions relating to potential repurchases of securities by us.
During 2011, holders of a portion of our Series C Preferred Stock converted 8,000 preferred shares, with a face value of $8 million, into 0.9 million shares of our common stock. In 2010, a combined 5,000 shares of our Series C Preferred Stock were converted into 0.6 million shares of our common stock.
Series B Preferred Stock
In September 2002, we authorized and designated 500,000 shares of preferred stock, as Series B preferred stock par value $.001 per share (the “Series B Preferred Stock”).
The Series B Preferred Stock is entitled to dividends of 8% of the original issuing price per share per annum, which are cumulative prior to any dividends on the common stock and on parity with the payment of any dividend or other distribution on any other series of preferred stock that has similar characteristics. The holders of each share of Series B Preferred Stock are entitled to be paid out of available funds prior to any distributions to holders of common stock in the amount of $100.00 per outstanding share plus all accrued dividends. We may, upon approval of our Board, redeem all or a portion of the outstanding shares of Series B Preferred Stock at a cost of the liquidation preference and all accrued and unpaid dividends.
107
Endeavour International Corporation
Notes to Consolidated Financial Statements
(Amounts in tables in thousands, except per unit data)
Note 13 – Stock-Based Compensation Arrangements
We grant restricted stock, performance units and stock options to employees and directors as incentive compensation. The restricted stock and options generally vest over three years. The vesting of these shares and options is dependent upon the continued service of the grantees with Endeavour. Upon the occurrence of a change in control, each outstanding share of restricted stock and stock option will immediately vest.
At December 31, 2012, total compensation cost related to nonvested awards not yet recognized was approximately $7.7 million and is expected to be recognized over a weighted average period of less than three years. For the year ended December 31, 2012, we included approximately $1.6 million of stock-based compensation in capitalized G&A in property and equipment.
Stock Options
The fair value of each option award is estimated on the date of grant using the Black-Scholes option-pricing model. We did not grant any options during 2012, 2011 and 2010. Information relating to stock options, including notional stock options, is summarized as follows:
| | | | | | | | | | | | | | | | |
| | | | | | Weighted | | | Weighted | | | | |
| | | Number of | | | Average | | | Average | | | | |
| | | Shares | | | Exercise | | | Contractual | | | Aggregate | |
| | | Underlying | | | Price per | | | Life in | | | Intrinsic | |
| | | Options | | | Share | | | Years | | | Value | |
Balance outstanding January 1, 2012 | | | 299 | | | $ | 8.95 | | | | | | | | | |
Exercised | | | (1 | ) | | | 6.73 | | | | | | | | | |
Expired | | | (110 | ) | | | 12.04 | | | | | | | | | |
| | | | | | | | | | | | | | | | |
Balance outstanding - December 31, 2012 | | | 188 | | | $ | 6.72 | | | | 5.5 | | | $ | 85 | |
| | | | | | | | | | | | | | | | |
Currently exercisable - December 31, 2012 | | | 188 | | | $ | 6.72 | | | | 5.5 | | | $ | 85 | |
| | | | | | | | | | | | | | | | |
Of options granted prior to 2009, 0.2 million options were granted pursuant to incentive plans which have been approved by our stockholders. All other stock options have been granted pursuant to stock option plans that were not subject to stockholder approval.
108
Endeavour International Corporation
Notes to Consolidated Financial Statements
(Amounts in tables in thousands, except per unit data)
Information relating to stock options outstanding at December 31, 2012 is summarized as follows:
| | | | | | | | | | | | | | | | | | | | |
| | | Options Outstanding | | | Options Exercisable | |
Range of Exercise Prices | | Number of
Options
Outstanding | | | Weighted
Average
Remaining
Contractual
Life | | | Weighted
Average
Exercise
Price Per
Share | | | Number
Exercisable | | | Weighted
Average
Exercise
Price Per
Share | |
Less than $5.00 | | | 61 | | | | 6.0 | | | $ | 3.78 | | | | 61 | | | $ | 3.78 | |
$5.00 - $8.00 | | | 36 | | | | 5.8 | | | | 5.25 | | | | 36 | | | | 5.25 | |
Greater than $8.00 | | | 91 | | | | 5.0 | | | | 9.23 | | | | 91 | | | | 9.23 | |
| | | | | | | | | | | | | | | | | | | | |
Total | | | 188 | | | | 5.5 | | | $ | 6.72 | | | | 188 | | | $ | 6.72 | |
| | | | | | | | | | | | | | | | | | | | |
Restricted Stock
At December 31, 2012, our employees and directors held 0.8 million restricted shares of our common stock that vest over the service period of up to three years. The restricted stock awards were valued based on the closing price of our common stock on the measurement date, typically the date of grant, and compensation expense is recorded on a straight-line basis over the restricted share vesting period.
Status of the restricted shares as of December 31, 2012 and the changes during the year ended December 31, 2012 are presented below:
| | | | | | | | |
| | | | | | Weighted | |
| | | | | | Average Grant | |
| | | | | | Date Fair | |
| | | Number of | | | Value per | |
| | | Shares | | | Share | |
Balance outstanding - January 1, 2012 | | | 830 | | | $ | 10.13 | |
Granted | | | 458 | | | | 9.09 | |
Vested | | | (452 | ) | | | 9.28 | |
Forfeited | | | (82 | ) | | | 10.34 | |
| | | | | | | | |
Balance outstanding - December 31, 2012 | | | 754 | | | $ | 10.11 | |
| | | | | | | | |
Total grant date fair value of shares vesting during the period | | $ | 4,199 | | | | | |
| | | | | | | | |
109
Endeavour International Corporation
Notes to Consolidated Financial Statements
(Amounts in tables in thousands, except per unit data)
Non-Cash stock-based compensation is recorded in G&A expenses or capitalized G&A as follows:
| | | | | | | | | | | | |
| | | Year Ended
December 31, | |
| | | 2012 | | | 2011 | | | 2010 | |
G&A Expenses | | $ | 4,641 | | | $ | 2,988 | | | $ | 3,191 | |
Capitalized G&A | | | 1,634 | | | | 1,051 | | | | 988 | |
| | | | | | | | | | | | |
Total non-cash stock-based compensation | | $ | 6,275 | | | $ | 4,039 | | | $ | 4,179 | |
| | | | | | | | | | | | |
Performance-Based Share Awards
In January 2012, certain of our executive officers were granted a target number of performance shares under individual Performance Unit Award Agreements. The performance shares will be earned as the relative total shareholder return ranking is measured among a designated peer group at the end of a three-year performance period. Payouts will be based on a predetermined schedule at the end of the performance period. The shares issued may range from 0% to 200% of the number of Performance Units specified in the agreements. The fair value of each performance-based award is estimated on the date of grant using a Monte Carlo simulation model.
Status of the performance-based share awards as of December 31, 2012 and the changes during the year ended December 31, 2012 are presented below:
| | | | | | | | |
| | | | | | Weighted | |
| | | | | | Average Grant | |
| | | | | | Date Fair | |
| | | Number of | | | Value per | |
| | | Shares | | | Share | |
Granted | | | 422 | | | | 16.72 | |
Forfeited | | | (65 | ) | | | 16.72 | |
| | | | | | | | |
Balance outstanding - December 31, 2012 | | | 357 | | | $ | 16.72 | |
| | | | | | | | |
Note 14 – Earnings per Share
Basic income (loss) per common share is computed by dividing net income (loss) to common stockholders by the weighted average number of common shares outstanding for the period. Diluted income (loss) per share includes the effect of our outstanding stock options, warrants and shares issuable pursuant to convertible debt, convertible preferred stock and certain stock incentive plans under the treasury stock method, if including such instruments is dilutive.
110
Endeavour International Corporation
Notes to Consolidated Financial Statements
(Amounts in tables in thousands, except per unit data)
| | | | | | | | | | | | |
| | | Year Ended December 31, | |
| | | 2012 | | | 2011 | | | 2010 | |
Net income (loss) to common shareholders | | | | | | | | | | | | |
Basic | | $ | (128,049 | ) | | $ | (132,969 | ) | | $ | 54,304 | |
Add Effect of: | | | | | | | | | | | | |
Preferred dividends | | | — | | | | — | | | | 2,070 | |
| | | | | | | | | | | | |
Diluted | | $ | (128,049 | ) | | $ | (132,969 | ) | | $ | 56,374 | |
| | | | | | | | | | | | |
Weighted Average Number of Common Shares Outstanding: | | | | | | | | | | | | |
Basic | | | 42,533 | | | | 35,957 | | | | 23,252 | |
Add Effect of: | | | | | | | | | | | | |
Stock compensation grants and warrants | | | — | | | | — | | | | 380 | |
Preferred stock | | | — | | | | — | | | | 5,254 | |
| | | | | | | | | | | | |
Diluted | | | 42,533 | | | | 35,957 | | | | 28,886 | |
| | | | | | | | | | | | |
For each of the periods presented, shares associated with stock options, warrants, convertible debt, convertible preferred stock and certain stock incentive plans are not included when their inclusion would be antidilutive (i.e., reduce the net loss per share). The common shares potentially issuable arising from these instruments excluded from weighted average diluted shares outstanding consisted of:
| | | | | | | | | | | | |
| | | For the Year Ended December 31, | |
| | | 2012 | | | 2011 | | | 2010 | |
Options, warrants and stock-based compensation | | | 2,111 | | | | 111 | | | | — | |
Convertible debt | | | 11,532 | | | | 11,078 | | | | 5,691 | |
Convertible preferred stock | | | 4,229 | | | | 4,229 | | | | — | |
| | | | | | | | | | | | |
Common shares potentially issuable | | | 17,872 | | | | 15,418 | | | | 5,691 | |
| | | | | | | | | | | | |
111
Endeavour International Corporation
Notes to Consolidated Financial Statements
(Amounts in tables in thousands, except per unit data)
Note 15 – Supplementary Cash Flow Disclosures
Cash paid during the period for interest and income taxes was as follows:
| | | | | | | | | | | | |
| | | Year Ended December 31, | |
| | | 2012 | | | 2011 | | | 2010 | |
Interest paid | | $ | 66,365 | | | $ | 31,928 | | | $ | 18,668 | |
| | | | | | | | | | | | |
Income taxes paid (refunded) | | $ | 426 | | | $ | 9,427 | | | $ | (172 | ) |
| | | | | | | | | | | | |
Non-Cash Investing and Financing Transactions
During 2012, we completed a nonmonetary exchange of our Bull Bayou Haynesville and Willow Springs Cotton Valley properties for all of J-W’s upstream and midstream interests in the Pennsylvania Marcellus area. The exchanged properties were recorded on a carryover basis.
As discussed in Note 12, in 2011, a combined 8,000 shares of our Series C Preferred Stock were converted into 0.9 million shares of our common stock.
In 2012, 2011 and 2010, we recorded $8.7 million, $12.8 million and $8.8 million, respectively, in non-cash interest expense that was added to the principal balance of the 11.5% Convertible Bonds, the $50 million Subordinated Notes and the Senior Term Loan.
112
Endeavour International Corporation
Notes to Consolidated Financial Statements
(Amounts in tables in thousands, except per unit data)
Note 16 – Financial Instruments
| | | | | | | | | | | | | | | | |
| | | December
31, 2012 | | | December
31, 2011 | |
| | | Fair Value | | | Carrying
Value | | | Fair Value | | | Carrying
Value | |
Assets: | | | | | | | | | | | | | | | | |
Derivative instruments | | $ | — | | | $ | — | | | $ | 1,247 | | | $ | 1,247 | |
Liabilities: | | | | | | | | | | | | | | | | |
Debt | | | 869,488 | | | | 859,506 | | | | 419,847 | | | | 467,378 | |
Derivative instruments | | | 7,402 | | | | 7,402 | | | | 16,067 | | | | 16,067 | |
The carrying amounts reflected in the consolidated balance sheets for cash and equivalents, short-term receivables and short-term payables approximate their fair value due to the short maturity of the instruments. The fair values of commodity derivative instruments and interest rate swaps were determined based upon quotes obtained from brokers. The fair values of long-term debt were determined based upon quotes obtained from brokers for our senior notes and discounted cash flows for our other debt.
Note 17 – Related Party Transactions
The Founding Partner and Chief Investment Officer, Ashok Nayyar, of Cyan Partners, LP became a member of our Board of Directors in September 2012. In September 2012, we increased the amount available for borrowing under the Revolving Credit Facility to $125 million and borrowed $15 million of the additional capacity. In connection with the increase, we agreed to pay a fee of $1.25 million to Cyan Partners, LP. Mr. Nayyar resigned from our Board of Directors in March 2013.
Note 18 – Fair Value Measurements
We measure the fair value of financial assets and liabilities on a recurring basis, defining fair value as the price that would be received to sell an asset or paid to transfer a liability in an orderly transaction between market participants at the measurement date. The fair value is based on assumptions that market participants would use when pricing an asset or liability, including assumptions about risk and the risks inherent in valuation techniques and the inputs to valuations. This includes not only the credit standing of counterparties involved and the impact of credit enhancements but also the impact of our own nonperformance risk on our liabilities. Fair value measurements are classified and disclosed in one of the following categories:
113
Endeavour International Corporation
Notes to Consolidated Financial Statements
(Amounts in tables in thousands, except per unit data)
| Level 1: | Fair value is based on actively-quoted market prices, if available. |
| Level 2: | In the absence of actively-quoted market prices, we seek price information from external sources, including broker quotes and industry publications. Substantially all of these inputs are observable in the marketplace during the entire term of the instrument, can be derived from observable data, or supported by observable levels at which transactions are executed in the marketplace. |
| Level 3: | If valuations require inputs that are both significant to the fair value measurement and less observable from objective sources, we must estimate prices based on available historical and near-term future price information and certain statistical methods that reflect our market assumptions. |
We apply fair value measurements to certain assets and liabilities including commodity derivative instruments and embedded derivatives relating to conversion and change in control features in certain of our debt instruments. We seek to maximize the use of observable inputs and minimize the use of unobservable inputs when measuring fair value.
Financial assets and liabilities are classified based on the lowest level of input that is significant to the fair value measurement. The following table summarizes the valuation of our investments and financial instruments by pricing levels as of December 31, 2012:
| | | | | | | | | | | | | | | | |
| | | Quoted Market Prices | | | Significant Other | | | Significant | | | | |
| | | in Active Markets - | | | Observable Inputs - | | | Unobservable Inputs - | | | Total | |
| | | Level 1 | | | Level 2 | | | Level 3 | | | Fair Value | |
As of December 31, 2012: | | | | | | | | | | | | | | | | |
Embedded derivatives | | $ | — | | | $ | — | | | $ | (7,402 | ) | | $ | (7,402 | ) |
| | | | | | | | | | | | | | | | |
Total derivative liabilities | | $ | — | | | $ | — | | | $ | (7,402 | ) | | $ | (7,402 | ) |
| | | | | | | | | | | | | | | | |
As of December 31, 2011: | | | | | | | | | | | | | | | | |
Oil and gas derivative contracts: | | | | | | | | | | | | | | | | |
Oil and gas puts | | $ | — | | | $ | 1,038 | | | $ | 209 | | | | 1,247 | |
Embedded derivatives | | | — | | | | — | | | | (16,067 | ) | | | (16,067 | ) |
| | | | | | | | | | | | | | | | |
Total derivative liabilities | | $ | — | | | $ | 1,038 | | | $ | (15,858 | ) | | $ | (14,820 | ) |
| | | | | | | | | | | | | | | | |
Our commodity derivative contracts have been measured using models that consider various inputs including current market and contractual prices for the underlying instruments, quoted forward prices for natural gas and crude oil, volatility factors and interest rates, such as a LIBOR curve for a similar length of time as the derivative contract term. The inputs for the fair value models for our oil puts, which terminated as of December 31, 2012, were all observable market data and those instruments were classified as Level 2. Although we utilized the same option
114
Endeavour International Corporation
Notes to Consolidated Financial Statements
(Amounts in tables in thousands, except per unit data)
pricing models to assess the fair values of our gas puts, an active futures market did not exist for our U.K. gas derivatives, which also terminated as of December 31, 2012. We based the inputs to the option models for our U.K. gas derivatives on observable market data in other markets to verify the reasonableness of the counterparty quotes. These U.K. gas derivatives were classified as Level 3.
We use a derivative valuation model to derive the value of our embedded derivative features. Key inputs into this valuation model are our current stock price, risk-free interest rates, the stock volatility and our implied credit spread. The first three aforementioned inputs are based on observable market data and are considered Level 2 inputs while the last two aforementioned inputs are unobservable and thus require management’s judgment and are considered Level 3 inputs. At December 31, 2012, a decrease or increase in the implied credit spread of 5% would increase or decrease, respectively, the liability by approximately $0.9 million. A similar 5% decrease or increase in the stock volatility has an inverse effect to the change in the liability and would result in an approximately $0.6 million decrease or increase, respectively.
The following is a reconciliation of changes in fair value of net derivative assets and liabilities classified as Level 3:
| | | | | | | | |
| | | Year Ended | |
| | | December 31, | |
| | | 2012 | | | 2011 | |
Balance at beginning of period | | $ | (15,858 | ) | | $ | (26,703 | ) |
Total gains or losses (realized/unrealized) | | | | | | | | |
Included in earnings | | | 8,456 | | | | 11,428 | |
Purchases | | | — | | | | 1,239 | |
Settlements | | | — | | | | (1,822 | ) |
| | | | | | | | |
Balance at end of period | | $ | (7,402 | ) | | $ | (15,858 | ) |
| | | | | | | | |
Changes in unrealized gains (losses) relating to derivatives assets and liabilities still held at the end of the period | | $ | 8,665 | | | $ | 11,428 | |
| | | | | | | | |
Assets and Liabilities Measured at Fair Value on a Nonrecurring Basis
Certain assets and liabilities are reported at fair value on a nonrecurring basis in our consolidated balance sheets. The following methods and assumptions were used to estimate the fair values:
Goodwill -Goodwill is tested annually at year end for impairment. The first step of that process is to compare the fair value of the reporting unit to which goodwill has been assigned to the carrying amount of the associated net assets and goodwill. Significant Level 3 inputs may be used in the determination of the fair value of the reporting unit, including present values of expected cash flows from operations.
115
Endeavour International Corporation
Notes to Consolidated Financial Statements
(Amounts in tables in thousands, except per unit data)
When we are required to measure fair value, and there is not a market observable price for the asset or liability, or a market observable price for a similar asset or liability, we generally utilize an income valuation approach. This approach utilizes management’s best assumptions regarding expectations of projected cash flows, and discounts the expected cash flows using a commensurate risk adjusted discount rate. Such evaluations involve a significant amount of judgment since the results are based on expected future events or conditions, such as sales prices; estimates of future oil and gas production; development and operating costs and the timing thereof; economic and regulatory climates and other factors. Our estimates of future net cash flows are inherently imprecise because they reflect management’s expectation of future conditions that are often outside of management’s control. However, assumptions used reflect a market participant’s view of long-term prices, costs and other factors, and are consistent with assumptions used in our business plans and investment decisions.
Note 19 – Derivative Instruments
We had embedded derivatives related to debt instruments at December 31, 2012 and 2011. The fair market value of these derivative instruments is included in our balance sheet as follows:
| | | | | | | | |
| | | December 31, | |
| | | 2012 | | | 2011 | |
Derivatives not designated as hedges: | | | | | | | | |
Oil and gas commodity derivatives: | | | | | | | | |
Prepaid expenses and other current assets | | $ | — | | | $ | 1,247 | |
Embedded derivatives related to debt instrument: | | | | | | | | |
Other liabilities - long-term | | | (7,402 | ) | | | (16,067 | ) |
| | | | | | | | |
116
Endeavour International Corporation
Notes to Consolidated Financial Statements
(Amounts in tables in thousands, except per unit data)
The effect of the derivatives not designated as hedges on our results of operations was as follows:
| | | | | | | | | | | | |
| | | Year Ended December 31, | |
| | | 2012 | | | 2011 | | | 2010 | |
Derivatives not designated as hedges: | | | | | | | | | | | | |
Oil and gas commodity derivatives: | | | | | | | | | | | | |
Realized gains (losses) | | $ | — | | | $ | — | | | $ | (11,753 | ) |
Unrealized gains (losses) | | | (3,524 | ) | | | (3,050 | ) | | | 10,943 | |
| | | | | | | | | | | | |
| | | (3,524 | ) | | | (3,050 | ) | | | (810 | ) |
Embedded derivatives related to debt and equity instruments: | | | | | | | | | | | | |
Unrealized gains | | $ | 8,665 | | | $ | 11,428 | | | $ | 1,348 | |
| | | | | | | | | | | | |
Note 20 – Commitments and Contingencies
General
The oil and gas industry is subject to regulation by federal, state and local authorities. In particular, oil and gas production operations and economics are affected by environmental protection statutes, tax statutes and other laws and regulations relating to the petroleum industry. We believe we are in compliance with all federal, state and local laws, regulations applicable to Endeavour and its properties and operations, the violation of which would have a material adverse effect on us or our financial condition.
Terminated Acquisition of Marcellus Assets
On July 17, 2011, we entered into agreements with SM Energy Company and certain other sellers named therein (“SM Energy”) for the purchase of oil and gas leases, producing properties, geophysical data, a pipeline and related assets in the Marcellus shale play in Pennsylvania for aggregate consideration of approximately $110 million (the “SM Purchase Agreements”). We terminated the agreements on December 14, 2011, based on our conclusion that (i) the title defects we identified, after analyzing SM Energy’s responses to the notice of defects and valuation of the defects, exceeded the contractual threshold of 15% of the purchase price for the applicable asset group ($85 million); and (ii) the condition of the pipeline was not in compliance with applicable regulatory standards, which would constitute a material violation of a representation and warranty contained in the applicable SM Purchase Agreement.
SM Energy filed a lawsuit against us in Texas state court on December 20, 2011 alleging that we breached the SM Purchase Agreements by terminating them and refusing to close on the transactions. Specifically, SM Energy has alleged, among other things, that most of our asserted title defects are without merit and, in any event, would not exceed 15% of the applicable purchase price. SM Energy seeks the award of unspecified actual damages, including costs and reasonable attorney’s fees, and specific performance. On January 17, 2012, we filed an answer
117
Endeavour International Corporation
Notes to Consolidated Financial Statements
(Amounts in tables in thousands, except per unit data)
and counterclaim denying the allegations and seeking the return of our $6 million deposit, which we believe we are entitled to recover pursuant to the terms of the SM Purchase Agreements, and for the damages that we suffered as a result of SM Energy’s misrepresentations. Discovery is proceeding. We intend to contest the case vigorously.
Reimbursement Agreements
During the second quarter of 2012, we entered into two reimbursement agreements related to abandonment liabilities for certain of our U.K. oil and gas properties. Under these agreements, unaffiliated third parties pledged cash to secure letters of credit covering certain of our abandonment liabilities and we agreed to reimburse the pledged cash in the event that the letters of credit are drawn and pledged cash is utilized to satisfy the commitment. We have no cash collateral associated with the reimbursement agreements and the commitments under the reimbursement agreements are not recorded as liabilities. The associated abandonment obligations are recorded in other long-term liabilities as part of our asset retirement obligations. Fees and expenses related to the reimbursement agreements are included in other expenses on our condensed consolidated statement of operations.
The first reimbursement agreement, covering approximately $33 million relates to our decommissioning obligations at the IVRRH, Renee and Rubie fields where we are currently paying certain asset retirement costs (the “IVRRH Reimbursement Agreement”). We pay a fee of 11.5% per year, computed based on the outstanding amount of each letter of credit (capitalized quarterly and payable upon release of the letters of credit). We are also required to pay a fee equal to 1% of the outstanding letters of credit on May 22, 2013 (the expiration date of the letters of credit). If we have not obtained replacement letters of credit before the expiration date of the letters of credit, then we must reimburse the pledgor for all amounts pledged. Concurrent with the issuance of the IVRRH Reimbursement Agreement, the restrictions on our previously restricted cash were removed, the cash was returned to us, and our letter of credit facility agreement was extinguished. We unconditionally guarantee the obligations under the IVRRH Reimbursement Agreement, but our reimbursement obligations are unsecured. In connection with this reimbursement agreement, we issued warrants to purchase two million shares of our common stock, with an exercise price of $10.50 per share, to the investors.
On January 10, 2013, we entered into a letter of credit procurement agreement (the “LOC Procurement Agreement”). (See Note 24 “Subsequent Events” for additional discussion.) In connection with the LOC Procurement Agreement, we terminated the IVRRH Reimbursement Agreement and paid all outstanding and accrued fees totaling approximately $3.8 million.
The second reimbursement agreement covers approximately $120 million related to our decommissioning obligations for the Alba field (the “Alba Reimbursement Agreement). We pay a fee of 13% per year, payable quarterly, computed based on the outstanding amount of each letter of credit. We have agreed to procure the release of the pledged cash securing the letter of credit on or before December 31, 2013 (the expiration date of the letter of credit). In addition,
118
Endeavour International Corporation
Notes to Consolidated Financial Statements
(Amounts in tables in thousands, except per unit data)
our obligations under the Alba Reimbursement Agreement are secured on a pari passu basis with our obligations under the Revolving Credit Facility by a first lien on substantially all of our assets. As of December 31, 2012, we do not expect to begin decommissioning activities for the Alba field for many years. The timing of decommissioning activities will be determined by the ultimate performance and life of the reservoir.
Rig Commitments
We have previously disclosed a potential commitment on a drilling rig in our North Sea operations relating to a dispute with the rig operator. In June 2011, we entered into a settlement agreement with the rig operator whereby the parties were mutually released from all future claims. We incurred costs of $14 million related to the settlement, which are included in capital expenditures.
Operating Leases
At December 31, 2012, we have leases for office space and equipment with lease payments as follows:
| | | | |
2013 | | $ | 1,665 | |
2014 | | | 1,457 | |
2015 | | | 1,474 | |
2016 | | | 1,250 | |
2017 | | | 255 | |
Thereafter | | | — | |
119
Endeavour International Corporation
Notes to Consolidated Financial Statements
(Amounts in tables in thousands, except per unit data)
Note 21 – Segment and Geographic Information
We have determined we have one reportable operating segment being the acquisition, exploration and development of oil and gas properties. Our operations are conducted in geographic areas as follows:
| | | | | | | | | | | | | | | | | | | | | | | | |
| | | 2012 | | | 2011 | | | 2010 | |
| | | Revenue | | | Long-lived
Assets | | | Revenue | | | Long-lived
Assets | | | Revenue | | | Long-lived
Assets | |
United States | | $ | 11,877 | | | $ | 123,977 | | | $ | 18,337 | | | $ | 139,236 | | | $ | 11,174 | | | $ | 115,114 | |
United Kingdom | | | 207,181 | | | | 1,189,870 | | | | 41,754 | | | | 650,943 | | | | 60,501 | | | | 486,467 | |
Other | | | — | | | | 2,264 | | | | — | | | | 1,287 | | | | — | | | | 877 | |
| | | | | | | | | | | | | | | | | | | | | | | | |
Total | | $ | 219,058 | | | $ | 1,316,111 | | | $ | 60,091 | | | $ | 791,466 | | | $ | 71,675 | | | $ | 602,458 | |
| | | | | | | | | | | | | | | | | | | | | | | | |
Total International | | $ | 207,181 | | | $ | 1,192,134 | | | $ | 41,754 | | | $ | 652,230 | | | $ | 60,501 | | | $ | 487,344 | |
| | | | | | | | | | | | | | | | | | | | | | | | |
120
Endeavour International Corporation
Notes to Consolidated Financial Statements
(Amounts in tables in thousands, except per unit data)
Note 22 – Quarterly Financial Data (Unaudited)
| | | | | | | | | | | | | | | | |
| | | First
Quarter | | | Second
Quarter | | | Third
Quarter | | | Fourth
Quarter | |
| | | 2012 (1) (3) | |
Revenues | | $ | 15,165 | | | $ | 23,003 | | | $ | 83,275 | | | $ | 97,615 | |
Operating expenses | | | 33,866 | | | | 41,359 | | | | 64,175 | | | | 59,857 | |
Operating profit (loss) | | | (18,701 | ) | | | (18,356 | ) | | | 19,100 | | | | 37,758 | |
Net loss to common stockholders | | | (35,718 | ) | | | (51,264 | ) | | | (34,158 | ) | | | (6,910 | ) |
Net loss per common share - basic and diluted | | | (0.94 | ) | | | (1.31 | ) | | | (0.73 | ) | | | (0.15 | ) |
| | | 2011 (2) | |
Revenues | | $ | 14,104 | | | $ | 19,053 | | | $ | 10,302 | | | $ | 16,632 | |
Operating expenses | | | 16,077 | | | | 18,304 | | | | 42,524 | | | | 50,800 | |
Operating profit (loss) | | | (1,973 | ) | | | 749 | | | | (32,222 | ) | | | (34,168 | ) |
Net loss to common stockholders | | | (8,002 | ) | | | (16,110 | ) | | | (63,756 | ) | | | (45,101 | ) |
Net loss per common share - basic and diluted | | | (0.30 | ) | | | (0.42 | ) | | | (1.63 | ) | | | (1.15 | ) |
| (1) | Includes impairments of oil and gas properties of $15.7 million, $20.0 million, $11.4 million, and $6.0 million for the first, second, third and fourth quarters of 2012, respectively. |
| (2) | Includes impairments of oil and gas properties of $28.8 million and $36.9 million, for the third and fourth quarters of 2011, respectively. |
| (3) | Includes $7.0 million in the fourth quarter of 2012 related to the correction of an error in deferred income taxes in prior periods that was not material to the current year operations. |
Note 23 – Guarantor Subsidiaries
Certain of our wholly-owned domestic subsidiaries have, jointly and severally, fully and unconditionally guaranteed the 2018 Notes. Pursuant to SEC regulations, we have presented in columnar format the condensed consolidating financial information for Endeavour International Corporation, the guarantor subsidiaries on a combined basis, and all non-guarantor subsidiaries on a combined basis.
121
Endeavour International Corporation
Notes to Consolidated Financial Statements
(Amounts in tables in thousands, except per unit data)
The subsidiary guarantees are unsecured obligations of each subsidiary guarantor and rank equally in right of payment with all senior indebtedness of that subsidiary guarantor and senior in right of payment to all subordinated indebtedness of that subsidiary guarantor. The subsidiary guarantees are effectively subordinated to any secured indebtedness of the subsidiary guarantor with respect to the assets securing the indebtedness. In addition, the subsidiary guarantees may be released in certain customary circumstances, including (i) the sale of all or substantially all of the properties or assets of a guarantor, (ii) the sale of the capital stock of a guarantor, (iii) the designation of a guarantor as an “Unrestricted Subsidiary,” (iv) upon legal defeasance of the 2018 Notes or satisfaction and discharge of the indentures governing the 2018 Notes, (v) upon the liquidation or dissolution of the guarantor or (vi) if the guarantor ceases to guarantee other of our indebtedness and ceases to be a material subsidiary, each of which is subject to important limitations in the indentures governing the 2018 Notes.
122
Endeavour International Corporation
Notes to Consolidated Financial Statements
(Amounts in tables in thousands, except per unit data)
Condensed consolidating financial statements for our guarantor subsidiaries and non-guarantor subsidiaries are presented in the following tables:
| | | | | | | | | | | | | | | | | | | | |
| | |
As of December 31, 2012 | |
| | | Endeavour
International
Corporation | | | Combined
Guarantor
Subsidiaries | | | Combined Non-
Guarantor
Subsidiaries | | | Eliminations | | | Consolidated | |
Cash and cash equivalents | | $ | — | | | $ | 27,800 | | | $ | 31,385 | | | $ | — | | | $ | 59,185 | |
Restricted cash | | | — | | | | 50 | | | | 128 | | | | — | | | | 178 | |
Accounts receivable | | | — | | | | 2,645 | | | | 43,358 | | | | — | | | | 46,003 | |
Current receivables due from affiliates | | | 950,210 | | | | 36,725 | | | | 71,964 | | | | (1,058,899 | ) | | | — | |
Prepaid expenses and other | | | — | | | | 508 | | | | 20,487 | | | | — | | | | 20,995 | |
| | | | | | | | | | | | | | | | | | | | |
Current Assets | | | 950,210 | | | | 67,728 | | | | 167,322 | | | | (1,058,899 | ) | | | 126,361 | |
Property, plant and equipment, net | | | — | | | | 92,692 | | | | 910,749 | | | | — | | | | 1,003,441 | |
Goodwill | | | — | | | | — | | | | 262,764 | | | | — | | | | 262,764 | |
Long-term receivables due from affiliates | | | — | | | | 599,000 | | | | — | | | | (599,000 | ) | | | — | |
Investments in subsidiaries | | | 57,662 | | | | 120,058 | | | | — | | | | (177,720 | ) | | | — | |
Other assets | | | 25,200 | | | | 6,085 | | | | 18,621 | | | | — | | | | 49,906 | |
| | | | | | | | | | | | | | | | | | | | |
Total Assets | | $ | 1,033,072 | | | $ | 885,563 | | | $ | 1,359,456 | | | $ | (1,835,619 | ) | | $ | 1,442,472 | |
| | | | | | | | | | | | | | | | | | | | |
Accounts payable | | $ | — | | | $ | 2,622 | | | $ | 57,531 | | | $ | — | | | $ | 60,153 | |
Current maturities of debt | | | — | | | | — | | | | 15,713 | | | | — | | | | 15,713 | |
Current liabilities due to affiliates | | | 34,509 | | | | 987,664 | | | | 36,726 | | | | (1,058,899 | ) | | | — | |
Accrued expenses and other | | | 27,549 | | | | 1,516 | | | | 61,035 | | | | — | | | | 90,100 | |
| | | | | | | | | | | | | | | | | | | | |
Current Liabilities | | | 62,058 | | | | 991,802 | | | | 171,005 | | | | (1,058,899 | ) | | | 165,966 | |
Long-term debt | | | 676,413 | | | | — | | | | 167,380 | | | | — | | | | 843,793 | |
Long-term liabilities due to affiliates | | | — | | | | — | | | | 599,000 | | | | (599,000 | ) | | | — | |
Deferred taxes | | | — | | | | — | | | | 141,887 | | | | — | | | | 141,887 | |
Other liabilities | | | 3,032 | | | | 562 | | | | 144,098 | | | | — | | | | 147,692 | |
| | | | | | | | | | | | | | | | | | | | |
Total Liabilities | | | 741,503 | | | | 992,364 | | | | 1,223,370 | | | | (1,657,899 | ) | | | 1,299,338 | |
Series C convertible preferred stock | | | 43,703 | | | | — | | | | — | | | | — | | | | 43,703 | |
Stockholders’ equity | | | 247,866 | | | | (106,801 | ) | | | 136,086 | | | | (177,720 | ) | | | 99,431 | |
| | | | | | | | | | | | | | | | | | | | |
Total Liabilities and Equity | | $ | 1,033,072 | | | $ | 885,563 | | | $ | 1,359,456 | | | $ | (1,835,619 | ) | | $ | 1,442,472 | |
| | | | | | | | | | | | | | | | | | | | |
123
Endeavour International Corporation
Notes to Consolidated Financial Statements
(Amounts in tables in thousands, except per unit data)
| | | | | | | | | | | | | | | | | | | | |
As of December 31, 2011 | |
| | | Endeavour
International
Corporation | | | Combined
Guarantor
Subsidiaries | | | Combined Non-
Guarantor
Subsidiaries | | | Eliminations (1) | | | Consolidated | |
Cash and cash equivalents | | $ | — | | | $ | 2,951 | | | $ | 103,085 | | | $ | — | | | $ | 106,036 | |
Accounts receivable | | | — | | | | 4,141 | | | | 4,508 | | | | — | | | | 8,649 | |
Current receivables due from affiliates | | | 388,676 | | | | 45,305 | | | | 11,142 | | | | (445,123 | ) | | | — | |
Prepaid expenses and other | | | — | | | | 1,129 | | | | 17,711 | | | | — | | | | 18,840 | |
| | | | | | | | | | | | | | | | | | | | |
Current Assets | | | 388,676 | | | | 53,526 | | | | 136,446 | | | | (445,123 | ) | | | 133,525 | |
Property, plant and equipment, net | | | — | | | | 127,739 | | | | 421,457 | | | | — | | | | 549,196 | |
Goodwill | | | — | | | | — | | | | 211,886 | | | | — | | | | 211,886 | |
Long-term receivables due from affiliates | | | — | | | | 99,000 | | | | 57,250 | | | | (156,250 | ) | | | — | |
Investments in subsidiaries | | | 57,662 | | | | 120,077 | | | | — | | | | (177,739 | ) | | | — | |
Other assets | | | 5,414 | | | | 6,083 | | | | 18,887 | | | | — | | | | 30,384 | |
| | | | | | | | | | | | | | | | | | | | |
Total Assets | | $ | 451,752 | | | $ | 406,425 | | | $ | 845,926 | | | $ | (779,112 | ) | | $ | 924,991 | |
| | | | | | | | | | | | | | | | | | | | |
Accounts payable | | $ | — | | | $ | 17,655 | | | $ | 44,620 | | | $ | — | | | $ | 62,275 | |
Current maturities of debt | | | 10,000 | | | | — | | | | 2,350 | | | | — | | | | 12,350 | |
Current liabilities due to affiliates | | | — | | | | 513,914 | | | | 45,715 | | | | (559,629 | ) | | | — | |
Accrued expenses and other | | | 4,847 | | | | 4,799 | | | | 10,903 | | | | — | | | | 20,549 | |
| | | | | | | | | | | | | | | | | | | | |
Current Liabilities | | | 14,847 | | | | 536,368 | | | | 103,588 | | | | (559,629 | ) | | | 95,174 | |
Long-term debt | | | 157,012 | | | | — | | | | 298,016 | | | | — | | | | 455,028 | |
Long-term liabilities due to affiliates | | | — | | | | (57,250 | ) | | | 99,000 | | | | (41,750 | ) | | | — | |
Deferred taxes | | | — | | | | — | | | | 108,762 | | | | 6,997 | | | | 115,759 | |
Other liabilities | | | 2,326 | | | | 282 | | | | 58,634 | | | | 6 | | | | 61,248 | |
| | | | | | | | | | | | | | | | | | | | |
Total Liabilities | | | 174,185 | | | | 479,400 | | | | 668,000 | | | | (594,376 | ) | | | 727,209 | |
Series C convertible preferred stock | | | 43,703 | | | | — | | | | — | | | | — | | | | 43,703 | |
Stockholders’ equity | | | 233,864 | | | | (72,975 | ) | | | 177,926 | | | | (184,736 | ) | | | 154,079 | |
| | | | | | | | | | | | | | | | | | | | |
Total Liabilities and Equity | | $ | 451,752 | | | $ | 406,425 | | | $ | 845,926 | | | $ | (779,112 | ) | | $ | 924,991 | |
| | | | | | | | | | | | | | | | | | | | |
124
Endeavour International Corporation
Notes to Consolidated Financial Statements
(Amounts in tables in thousands, except per unit data)
| | | | | | | | | | | | | | | | | | | | |
For the Year Ended December 31, 2012 | |
| | | Endeavour
International
Corporation | | | Combined
Guarantor
Subsidiaries | | | Combined Non-
Guarantor
Subsidiaries | | | Eliminations (1) | | | Consolidated | |
Revenue | | $ | — | | | $ | 11,877 | | | $ | 207,181 | | | $ | — | | | $ | 219,058 | |
Operating expenses | | | — | | | | 6,968 | | | | 51,568 | | | | — | | | | 58,536 | |
DD&A expense | | | — | | | | 8,603 | | | | 57,961 | | | | — | | | | 66,564 | |
Impairment of oil and gas properties | | | — | | | | 53,072 | | | | — | | | | — | | | | 53,072 | |
G&A expenses | | | 2,629 | | | | 9,887 | | | | 8,569 | | | | — | | | | 21,085 | |
| | | | | | | | | | | | | | | | | | | | |
Income (loss) from Operations | | | (2,629 | ) | | | (66,653 | ) | | | 89,083 | | | | — | | | | 19,801 | |
Derivatives: | | | | | | | | | | | | | | | | | | | | |
Unrealized gains (losses) | | | (705 | ) | | | — | | | | 5,846 | | | | — | | | | 5,141 | |
Interest expense | | | (54,241 | ) | | | (951 | ) | | | (67,673 | ) | | | 38,743 | | | | (84,122 | ) |
Letter of credit fees | | | — | | | | — | | | | (21,903 | ) | | | — | | | | (21,903 | ) |
Loss on early extinguishment of debt | | | — | | | | — | | | | (21,661 | ) | | | — | | | | (21,661 | ) |
Other income (expense) | | | — | | | | 33,796 | | | | (4,307 | ) | | | (38,743 | ) | | | (9,254 | ) |
| | | | | | | | | | | | | | | | | | | | |
Loss before taxes | | | (57,575 | ) | | | (33,808 | ) | | | (20,615 | ) | | | — | | | | (111,998 | ) |
Income tax expense | | | — | | | | — | | | | 21,225 | | | | (6,997 | ) | | | 14,228 | |
| | | | | | | | | | | | | | | | | | | | |
Net loss | | | (57,575 | ) | | | (33,808 | ) | | | (41,840 | ) | | | 6,997 | | | | (126,226 | ) |
Preferred stock dividends | | | 1,823 | | | | — | | | | — | | | | — | | | | 1,823 | |
| | | | | | | | | | | | | | | | | | | | |
Net loss to common shareholders | | $ | (59,398 | ) | | $ | (33,808 | ) | | $ | (41,840 | ) | | $ | 6,997 | | | $ | (128,049 | ) |
| | | | | | | | | | | | | | | | | | | | |
| | | | | | | | | | | | | | | | | | | | |
For the Year Ended December 31, 2011 | |
| | | Endeavour
International
Corporation | | | Combined
Guarantor
Subsidiaries | | | Combined Non-
Guarantor
Subsidiaries | | | Eliminations | | | Consolidated | |
Revenue | | $ | — | | | $ | 18,337 | | | $ | 41,754 | | | $ | — | | | $ | 60,091 | |
Operating expenses | | | — | | | | 9,046 | | | | 8,622 | | | | — | | | | 17,668 | |
DD&A expense | | | — | | | | 11,490 | | | | 14,988 | | | | — | | | | 26,478 | |
Impairment of oil and gas properties | | | — | | | | 65,706 | | | | — | | | | — | | | | 65,706 | |
G&A expenses | | | 2,198 | | | | 10,789 | | | | 4,866 | | | | — | | | | 17,853 | |
| | | | | | | | | | | | | | | | | | | | |
Income (loss) from Operations | | | (2,198 | ) | | | (78,694 | ) | | | 13,278 | | | | — | | | | (67,614 | ) |
Derivatives: | | | | | | | | | | | | | | | | | | | | |
Unrealized gains (losses) | | | (2,642 | ) | | | — | | | | 11,020 | | | | — | | | | 8,378 | |
Interest expense | | | (10,623 | ) | | | (3,964 | ) | | | (38,894 | ) | | | 8,588 | | | | (44,893 | ) |
Loss on early extinguishment of debt | | | (402 | ) | | | — | | | | — | | | | — | | | | (402 | ) |
Other income (expense) | | | (211 | ) | | | (678 | ) | | | 10,074 | | | | (8,588 | ) | | | 597 | |
| | | | | | | | | | | | | | | | | | | | |
Loss before taxes | | | (16,076 | ) | | | (83,336 | ) | | | (4,522 | ) | | | — | | | | (103,934 | ) |
Income tax expense | | | — | | | | 3 | | | | 27,058 | | | | — | | | | 27,061 | |
| | | | | | | | | | | | | | | | | | | | |
Net loss | | | (16,076 | ) | | | (83,339 | ) | | | (31,580 | ) | | | — | | | | (130,995 | ) |
Preferred stock dividends | | | 1,974 | | | | — | | | | — | | | | — | | | | 1,974 | |
| | | | | | | | | | | | | | | | | | | | |
Net loss to common shareholders | | $ | (18,050 | ) | | $ | (83,339 | ) | | $ | (31,580 | ) | | $ | — | | | $ | (132,969 | ) |
| | | | | | | | | | | | | | | | | | | | |
125
Endeavour International Corporation
Notes to Consolidated Financial Statements
(Amounts in tables in thousands, except per unit data)
| | | | | | | | | | | | | | | | | | | | |
For the Year Ended December 31, 2010 | |
| | | Endeavour
International
Corporation | | | Combined
Guarantor
Subsidiaries | | | Combined Non-
Guarantor
Subsidiaries | | | Eliminations | | | Consolidated | |
Revenue | | $ | — | | | $ | 11,174 | | | $ | 60,501 | | | $ | — | | | $ | 71,675 | |
Operating expenses | | | (19 | ) | | | 4,280 | | | | 11,086 | | | | — | | | | 15,347 | |
DD&A expense | | | — | | | | 6,202 | | | | 22,692 | | | | — | | | | 28,894 | |
Impairment of oil and gas properties | | | — | | | | 7,692 | | | | — | | | | — | | | | 7,692 | |
G&A expenses | | | 2,629 | | | | 11,465 | | | | 4,321 | | | | — | | | | 18,415 | |
| | | | | | | | | | | | | | | | | | | | |
Income (loss) from Operations | | | (2,610 | ) | | | (18,465 | ) | | | 22,402 | | | | — | | | | 1,327 | |
Derivatives: | | | | | | | | | | | | | | | | | | | | |
Realized losses | | | — | | | | — | | | | (11,753 | ) | | | — | | | | (11,753 | ) |
Unrealized gains | | | 2,258 | | | | — | | | | 10,033 | | | | — | | | | 12,291 | |
Interest expense | | | (11,476 | ) | | | (591 | ) | | | (25,079 | ) | | | 2,554 | | | | (34,592 | ) |
Gain on sale of reserves in place | | | — | | | | — | | | | 87,171 | | | | — | | | | 87,171 | |
Other income (expense) | | | (1 | ) | | | (93 | ) | | | 3,947 | | | | (2,554 | ) | | | 1,299 | |
| | | | | | | | | | | | | | | | | | | | |
Income (loss) before taxes | | | (11,829 | ) | | | (19,149 | ) | | | 86,721 | | | | — | | | | 55,743 | |
Income tax benefit | | | — | | | | — | | | | (788 | ) | | | — | | | | (788 | ) |
| | | | | | | | | | | | | | | | | | | | |
Net income (loss) | | | (11,829 | ) | | | (19,149 | ) | | | 87,509 | | | | — | | | | 56,531 | |
Preferred stock dividends | | | 2,227 | | | | — | | | | — | | | | — | | | | 2,227 | |
| | | | | | | | | | | | | | | | | | | | |
Net income (loss) to common shareholders | | $ | (14,056 | ) | | $ | (19,149 | ) | | $ | 87,509 | | | $ | — | | | $ | 54,304 | |
| | | | | | | | | | | | | | | | | | | | |
126
Endeavour International Corporation
Notes to Consolidated Financial Statements
(Amounts in tables in thousands, except per unit data)
| | | | | | | | | | | | | | | | | | | | |
For the Year Ended December 31, 2012 | |
| | | Endeavour
International
Corporation | | | Combined
Guarantor
Subsidiaries | | | Combined Non-
Guarantor
Subsidiaries | | | Eliminations (1) | | | Consolidated | |
Cash Flows from Operating Activities: | | | | | | | | | | | | | | | | | | | | |
Net loss | | $ | (57,575 | ) | | $ | (33,808 | ) | | $ | (41,840 | ) | | $ | 6,997 | | | $ | (126,226 | ) |
Adjustments to reconcile net loss to net cash provided by (used in) operations | | | | | | | | | | | | | | | | | | | | |
DD&A expense | | | — | | | | 8,603 | | | | 57,961 | | | | — | | | | 66,564 | |
Impairment of oil and gas properties | | | — | | | | 53,072 | | | | — | | | | — | | | | 53,072 | |
Deferred tax benefit | | | — | | | | — | | | | (10,597 | ) | | | (6,997 | ) | | | (17,594 | ) |
Unrealized (gains) losses on derivatives | | | 705 | | | | — | | | | (5,846 | ) | | | — | | | | (5,141 | ) |
Amortization of non-cash compensation | | | 854 | | | | — | | | | — | | | | 3,547 | | | | 4,401 | |
Amortization of loan costs and discount | | | 6,908 | | | | 5 | | | | 7,266 | | | | — | | | | 14,179 | |
Non-cash interest expense | | | 445 | | | | — | | | | 8,239 | | | | — | | | | 8,684 | |
Loss on early extinguishment of debt | | | — | | | | — | | | | 21,661 | | | | | | | | 21,661 | |
Other | | | 283 | | | | 173 | | | | 14,909 | | | | — | | | | 15,365 | |
Changes in operating assets and liabilities: | | | | | | | | | | | | | | | | | | | | |
(Increase) decrease in receivables | | | — | | | | 1,495 | | | | (25,814 | ) | | | — | | | | (24,319 | ) |
(Increase) decrease in other current assets | | | — | | | | (9,223 | ) | | | 8,631 | | | | — | | | | (592 | ) |
Increase (decrease) in liabilities | | | (493,026 | ) | | | 546,749 | | | | (21,617 | ) | | | (3,547 | ) | | | 28,559 | |
| | | | | | | | | | | | | | | | | | | | |
Net Cash Provided by (Used in) | | | | | | | | | | | | | | | | | | | | |
Operating Activities | | | (541,406 | ) | | | 567,066 | | | | 12,953 | | | | — | | | | 38,613 | |
Cash Flows From Investing Activities: | | | | | | | | | | | | | | | | | | | | |
Capital expenditures | | | — | | | | (39,794 | ) | | | (207,131 | ) | | | — | | | | (246,925 | ) |
Acquisitions, net of cash acquired | | | — | | | | (2,372 | ) | | | (236,482 | ) | | | — | | | | (238,854 | ) |
Proceeds from sales, net of cash | | | — | | | | — | | | | 1,407 | | | | — | | | | 1,407 | |
Issuance of note receivable to affiliate | | | — | | | | (500,000 | ) | | | — | | | | 500,000 | | | | — | |
Increase in restricted cash | | | — | | | | (50 | ) | | | (128 | ) | | | — | | | | (178 | ) |
| | | | | | | | | | | | | | | | | | | | |
Net Cash Used in Investing Activities | | | — | | | | (542,216 | ) | | | (442,334 | ) | | | 500,000 | | | | (484,550 | ) |
Cash Flows From Financing Activities: | | | | | | | | | | | | | | | | | | | | |
Repayments of borrowings | | | (32,457 | ) | | | — | | | | (242,172 | ) | | | — | | | | (274,629 | ) |
Borrowings under debt agreements, net of debt discount | | | 538,860 | | | | — | | | | 115,163 | | | | — | | | | 654,023 | |
Borrowings from affiliates | | | — | | | | — | | | | 500,000 | | | | (500,000 | ) | | | — | |
Proceeds from issuance of common stock | | | 60,805 | | | | — | | | | — | | | | — | | | | 60,805 | |
Dividends paid | | | (1,665 | ) | | | — | | | | — | | | | — | | | | (1,665 | ) |
Payments for early extinguishment of debt | | | — | | | | — | | | | (7,248 | ) | | | — | | | | (7,248 | ) |
Financing costs paid | | | (24,141 | ) | | | — | | | | (8,063 | ) | | | — | | | | (32,204 | ) |
Other financing | | | 4 | | | | — | | | | — | | | | — | | | | 4 | |
| | | | | | | | | | | | | | | | | | | | |
Net Cash Provided by (Used in) | | | | | | | | | | | | | | | | | | | | |
Financing Activities | | | 541,406 | | | | — | | | | 357,680 | | | | (500,000 | ) | | | 399,086 | |
Net Change in Cash and Cash Equivalents | | | — | | | | 24,849 | | | | (71,700 | ) | | | — | | | | (46,851 | ) |
Cash and Cash Equivalents, Beginning of Period | | | — | | | | 2,951 | | | | 103,085 | | | | — | | | | 106,036 | |
| | | | | | | | | | | | | | | | | | | | |
Cash and Cash Equivalents, End of Period | | $ | — | | | $ | 27,800 | | | $ | 31,385 | | | $ | — | | | $ | 59,185 | |
| | | | | | | | | | | | | | | | | | | | |
127
Endeavour International Corporation
Notes to Consolidated Financial Statements
(Amounts in tables in thousands, except per unit data)
| | | | | | | | | | | | | | | | | | | | |
For the Year Ended December 31, 2011 | |
| | | Endeavour
International
Corporation | | | Combined
Guarantor
Subsidiaries | | | Combined Non-
Guarantor
Subsidiaries | | | Eliminations | | | Consolidated | |
Cash Flows from Operating Activities: | | | | | | | | | | | | | | | | | | | | |
Net loss | | $ | (16,076 | ) | | $ | (83,339 | ) | | $ | (31,580 | ) | | $ | — | | | $ | (130,995 | ) |
Adjustments to reconcile net income (loss) to net cash provided by (used in) operations | | | | | | | | | | | | | | | | | | | | |
DD&A expense | | | — | | | | 11,490 | | | | 14,988 | | | | — | | | | 26,478 | |
Impairment of oil and gas properties | | | — | | | | 65,706 | | | | — | | | | — | | | | 65,706 | |
Deferred tax expense (benefit) | | | — | | | | — | | | | 21,116 | | | | — | | | | 21,116 | |
Unrealized (gains) losses on derivatives | | | 2,642 | | | | — | | | | (11,020 | ) | | | — | | | | (8,378 | ) |
Amortization of non-cash compensation | | | 624 | | | | — | | | | — | | | | 3,073 | | | | 3,697 | |
Amortization of loan costs and discount | | | 1,049 | | | | (403 | ) | | | 11,588 | | | | — | | | | 12,234 | |
Loss on early extinguishment of debt | | | 402 | | | | — | | | | — | | | | — | | | | 402 | |
Non-cash interest expense | | | 880 | | | | — | | | | 11,931 | | | | — | | | | 12,811 | |
Other | | | (82 | ) | | | 105 | | | | 1,495 | | | | — | | | | 1,518 | |
Changes in operating assets and liabilities: | | | | | | | | | | | | | | | | | | | | |
(Increase) decrease in receivables | | | — | | | | (1,597 | ) | | | 1,066 | | | | — | | | | (531 | ) |
(Increase) decrease in other current assets | | | 34 | | | | 2,872 | | | | (16,234 | ) | | | — | | | | (13,328 | ) |
Increase (decrease) in liabilities | | | (134,457 | ) | | | 95,725 | | | | 11,732 | | | | (3,073 | ) | | | (30,073 | ) |
| | | | | | | | | | | | | | | | | | | | |
Net Cash Provided by (Used in) | | | | | | | | | | | | | | | | | | | | |
Operating Activities | | | (144,984 | ) | | | 90,559 | | | | 15,082 | | | | — | | | | (39,343 | ) |
Cash Flows From Investing Activities: | | | | | | | | | | | | | | | | | | | | |
Capital expenditures | | | — | | | | (80,279 | ) | | | (84,783 | ) | | | — | | | | (165,062 | ) |
Acquisitions, net of cash acquired | | | — | | | | (8,027 | ) | | | (25,048 | ) | | | — | | | | (33,075 | ) |
(Increase) decrease in restricted cash | | | — | | | | — | | | | 31,726 | | | | — | | | | 31,726 | |
| | | | | | | | | | | | | | | | | | | | |
Net Cash Provided by (Used in) | | | | | | | | | | | | | | | | | | | | |
Investing Activities | | | — | | | | (88,306 | ) | | | (78,105 | ) | | | — | | | | (166,411 | ) |
Cash Flows From Financing Activities: | | | | | | | | | | | | | | | | | | | | |
Repayments of borrowings | | | (101,250 | ) | | | — | | | | (1,975 | ) | | | — | | | | (103,225 | ) |
Borrowings under debt agreements, net of debt discount | | | 135,000 | | | | — | | | | 75,000 | | | | — | | | | 210,000 | |
Proceeds from issuance of common stock | | | 118,444 | | | | — | | | | — | | | | — | | | | 118,444 | |
Dividends paid | | | (1,816 | ) | | | — | | | | — | | | | — | | | | (1,816 | ) |
Financing costs paid | | | (5,926 | ) | | | — | | | | (5,475 | ) | | | — | | | | (11,401 | ) |
Other financing | | | 532 | | | | (11 | ) | | | — | | | | — | | | | 521 | |
| | | | | | | | | | | | | | | | | | | | |
Net Cash Provided by Financing Activities | | | 144,984 | | | | (11 | ) | | | 67,550 | | | | — | | | | 212,523 | |
Net Increase in Cash and Cash Equivalents | | | — | | | | 2,242 | | | | 4,527 | | | | — | | | | 6,769 | |
Cash and Cash Equivalents, Beginning of Period | | | — | | | | 709 | | | | 98,558 | | | | — | | | | 99,267 | |
| | | | | | | | | | | | | | | | | | | | |
Cash and Cash Equivalents, End of Period | | $ | — | | | $ | 2,951 | | | $ | 103,085 | | | $ | — | | | $ | 106,036 | |
| | | | | | | | | | | | | | | | | | | | |
128
Endeavour International Corporation
Notes to Consolidated Financial Statements
(Amounts in tables in thousands, except per unit data)
| | | | | | | | | | | | | | | | | | | | |
For the Year Ended December 31, 2010 | |
| | | Endeavour
International
Corporation | | | Combined
Guarantor
Subsidiaries | | | Combined Non-
Guarantor
Subsidiaries | | | Eliminations | | | Consolidated | |
Cash Flows from Operating Activities: | | | | | | | | | | | | | | | | | | | | |
Net loss | | $ | (11,829 | ) | | $ | (19,149 | ) | | $ | 87,509 | | | $ | — | | | $ | 56,531 | |
Adjustments to reconcile net loss to net cash provided by (used in) operations | | | | | | | | | | | | | | | | | | | | |
DD&A expense | | | — | | | | 6,202 | | | | 22,692 | | | | — | | | | 28,894 | |
Impairment of oil and gas properties | | | — | | | | 7,692 | | | | — | | | | — | | | | 7,692 | |
Deferred tax expense (benefit) | | | — | | | | — | | | | (3,367 | ) | | | — | | | | (3,367 | ) |
Unrealized (gains) losses on derivatives | | | (2,258 | ) | | | — | | | | (10,033 | ) | | | — | | | | (12,291 | ) |
Gain on sale | | | — | | | | — | | | | (87,171 | ) | | | — | | | | (87,171 | ) |
Amortization of non-cash compensation | | | 689 | | | | — | | | | — | | | | 3,003 | | | | 3,692 | |
Amortization of loan costs and discount | | | 537 | | | | — | | | | 9,725 | | | | — | | | | 10,262 | |
Non-cash interest expense | | | 1,010 | | | | — | | | | 7,754 | | | | — | | | | 8,764 | |
Other | | | 307 | | | | (20 | ) | | | (2,373 | ) | | | — | | | | (2,086 | ) |
Changes in operating assets and liabilities: | | | | | | | | | | | | | | | | | | | | |
Decrease in receivables | | | — | | | | (829 | ) | | | 7,561 | | | | — | | | | 6,732 | |
(Increase) decrease in other current assets | | | 1,252 | | | | (4,907 | ) | | | (1,013 | ) | | | — | | | | (4,668 | ) |
Increase (decrease) in liabilities | | | (17,915 | ) | | | 85,445 | | | | (3,242 | ) | | | (60,253 | ) | | | 4,035 | |
| | | | | | | | | | | | | | | | | | | | |
Net Cash Provided by (Used in) | | | | | | | | | | | | | | | | | | | | |
Operating Activities | | | (28,207 | ) | | | 74,434 | | | | 28,042 | | | | (57,250 | ) | | | 17,019 | |
Cash Flows From Investing Activities: | | | | | | | | | | | | | | | | | | | | |
Capital expenditures | | | — | | | | (34,036 | ) | | | (57,971 | ) | | | — | | | | (92,007 | ) |
Acquisitions, net of cash acquired | | | — | | | | (42,542 | ) | | | (1,184 | ) | | | — | | | | (43,726 | ) |
Proceeds from sales, net of cash | | | — | | | | 1 | | | | 108,315 | | | | — | | | | 108,316 | |
Issuance of note receivable to affiliate | | | — | | | | — | | | | (57,250 | ) | | | 57,250 | | | | — | |
(Increase) decrease in restricted cash | | | — | | | | 2,450 | | | | (31,347 | ) | | | — | | | | (28,897 | ) |
| | | | | | | | | | | | | | | | | | | | |
Net Cash Provided by (Used in) | | | | | | | | | | | | | | | | | | | | |
Investing Activities | | | — | | | | (74,127 | ) | | | (39,437 | ) | | | 57,250 | | | | (56,314 | ) |
Cash Flows From Financing Activities: | | | | | | | | | | | | | | | | | | | | |
Repayments of borrowings | | | — | | | | — | | | | (75,342 | ) | | | — | | | | (75,342 | ) |
Borrowings under debt agreements, net of debt discount | | | — | | | | | | | | 185,000 | | | | — | | | | 185,000 | |
Proceeds from issuance of common stock | | | 30,181 | | | | — | | | | — | | | | — | | | | 30,181 | |
Dividends paid | | | (2,070 | ) | | | — | | | | — | | | | — | | | | (2,070 | ) |
Financing costs paid | | | — | | | | — | | | | (26,590 | ) | | | — | | | | (26,590 | ) |
Other financing | | | 96 | | | | — | | | | — | | | | — | | | | 96 | |
| | | | | | | | | | | | | | | | | | | | |
Net Cash Provided by (Used in) | | | | | | | | | | | | | | | | | | | | |
Financing Activities | | | 28,207 | | | | — | | | | 83,068 | | | | — | | | | 111,275 | |
Net Decrease in Cash and Cash Equivalents | | | — | | | | 307 | | | | 71,673 | | | | — | | | | 71,980 | |
Cash and Cash Equivalents, Beginning of Period | | | — | | | | 402 | | | | 26,885 | | | | — | | | | 27,287 | |
| | | | | | | | | | | | | | | | | | | | |
Cash and Cash Equivalents, End of Period | | $ | — | | | $ | 709 | | | $ | 98,558 | | | $ | — | | | $ | 99,267 | |
| | | | | | | | | | | | | | | | | | | | |
129
Endeavour International Corporation
Notes to Consolidated Financial Statements
(Amounts in tables in thousands, except per unit data)
| (1) | The $7.0 million adjustment reflects the correction of an immaterial error in deferred income taxes that was corrected to beginning stockholder’s equity as of January 1, 2010 in the separate financials of the non-guarantor subsidiaries but reflected in the current year statement of operations for Endeavour. |
Note 24 – Subsequent Events
Entry into Procurement Agreement
In January 2013, we entered into the Procurement Agreement with an unaffiliated third party entity, which matures on July 9, 2014. The Procurement Agreement was entered into in connection with the unaffiliated third party’s entry into a credit support arrangement with a providing bank. Pursuant to this credit support arrangement, the third party pledged cash, contributed by one of our shareholders, to secure letters of credit in the amount of $33.0 million. The letters of credit secure decommissioning obligations in connection with certain of our U.K. license agreements.
Under the Procurement Agreement, we agreed:
| | • | to reimburse the third party in the event that the letters of credit are drawn and the pledged cash must be paid to the letter of credit provider; |
| | • | pay a quarterly fee computed at a rate of 9% per year on the outstanding amount of each letter of credit, along with an initial fee equal to 1% on the initial outstanding amount of each letter of credit; |
| | • | pay a fee of 2% on the outstanding amount of each letter of credit upon termination; |
| | • | pay a fee of 0.65% per year on the aggregate balance of any outstanding letters of credit. |
The Procurement Agreement contains customary representations, warranties and non-financial covenants. We also issued warrants to purchase a total of 1,000,000 shares of our common stock at an exercise price of $7.31 per share to the investor. The warrants expire on January 9, 2018 and are subject to customary anti-dilution provisions.
Concurrent with our entry into the Procurement Agreement, we terminated the IVRRH Reimbursement Agreement dated May 23, 2012, which secured letters of credit. Upon termination of the IVRRH Reimbursement Agreement, we paid all outstanding and accrued fees totaling approximately $3.8 million.
Strategic Alternatives
On February 14, 2013, we announced that our board of directors approved a review of strategic alternatives. In an effort to unlock the value of our underlying assets, we will consider a full range of options, including:
130
Endeavour International Corporation
Notes to Consolidated Financial Statements
(Amounts in tables in thousands, except per unit data)
| | • | A sale, joint venture or partnership in respect of our activities in the North Sea; |
| | • | A sale of specific assets; |
| | • | A sale or merger of the Company; or |
| | • | Continuing to execute on our operational plan. |
We will announce the results of the effort once a course of action is chosen. There is no assurance that this strategic alternatives review will result in a change to our current business plan, pursuing a particular transaction or completing any such transaction.
Forward Sale
In February 2013, we entered into a forward sale agreement with one of our established purchasers for a payment of approximately $22.5 million, which was received on March 1, 2013 in return for a specified volume of crude oil in excess of 200,000 barrels to be delivered over a six month delivery period from our UK North Sea production.
Production Payment
In March 2013, our wholly-owned subsidiary, EEUK, entered into a sale and purchase agreement (the “Sale and Purchase Agreement”) for $107.5 million providing for the sale and purchase of a production payment over the proceeds of sale from a proportion of EEUK’s entitlement to production from its interests in the Alba and Bacchus fields located in the UK sector of the North Sea (the “Production Payment Transaction”) and the issuance of warrants (discussed below). Repayment of the production payment will come solely from the proceeds from the sale of production from EEUK’s entitlement from the Alba and Bacchus fields.
In the event that the Production Payment Transaction is not consummated under the terms of the Sale and Purchase Agreement, the deposit paid to EEUK upon signing of the Sale and Purchase Agreement and all or part of a $1.2 million termination fee would become due and payable by EEUK.
The completion of the Production Payment Transaction is conditional upon, amongst other things, the approval of the UK Secretary of State for Energy and Climate Change. Contemporaneously with completion under the Sale and Purchase Agreement, we expect to issue 3,440,000 warrants to purchase shares of common stock at an exercise price of $3.014 per share (the “Warrants”).
EEUK’s obligations to refund the deposit and pay the termination fee are secured by first priority liens on EEUK’s interests in the licenses and certain joint operating agreements governing the fields giving rise to the production subject to the production payment. Upon closing of the purchase and sale of the production payment, EEUK’s obligations under the production payment will be secured by first priority liens in the same assets and second priority liens in certain other assets of the Company and its subsidiaries.
131
Endeavour International Corporation
Notes to Consolidated Financial Statements
(Amounts in tables in thousands, except per unit data)
Revolving Credit Agreement
In March 2013, the Company, EEUK, Cyan, and certain lenders entered into a third amendment to the Revolving Credit Facility whereby (i) the lenders consented to the Production Payment Transaction and (ii) the maturity of $100 million of the commitments under the under the Revolving Credit Facility was extended from October 12, 2013 to June 30, 2014. The remaining principal of the Revolving Credit Facility will mature on October 12, 2013, as previously provided.
Reimbursement Agreement
In March 2013, we amended the Alba Reimbursement Agreement to (i) allow us to enter the Production Payment Transaction, (ii) extend the maturity of the obligations under the Alba Reimbursement Agreement from December 31, 2013 to June 30, 2014, and (iii) the parties agreed to agree to take the steps necessary to extend the letter of credit issued pursuant to the Alba Reimbursement Agreement from December 31, 2013 to December 31, 2014.
132
Endeavour International Corporation
Notes to Consolidated Financial Statements
(Amounts in tables in thousands, except per unit data)
Note 25 – Supplemental Oil and Gas Disclosures (Unaudited)
| | | | | | | | | | | | |
| Capitalized Costs Relating to Oil and Gas Producing Activities | |
| | | |
| | | United
Kingdom | | | United
States | | | Total | |
December 31, 2012: | | | | | | | | | | | | |
Proved | | $ | 876,536 | | | $ | 39,265 | | | $ | 915,801 | |
Unproved | | | 273,298 | | | | 76,135 | | | | 349,433 | |
| | | | | | | | | | | | |
Total capitalized costs | | | 1,149,834 | | | | 115,400 | | | | 1,265,234 | |
Accumulated depreciation, depletion and amortization | | | (241,338 | ) | | | (24,269 | ) | | | (265,607 | ) |
| | | | | | | | | | | | |
Net capitalized costs | | $ | 908,496 | | | $ | 91,131 | | | $ | 999,627 | |
| | | | | | | | | | | | |
December 31, 2011: | | | | | | | | | | | | |
Proved | | $ | 429,246 | | | $ | 67,421 | | | $ | 496,667 | |
Unproved | | | 183,110 | | | | 75,224 | | | | 258,334 | |
| | | | | | | | | | | | |
Total capitalized costs | | | 612,356 | | | | 142,645 | | | | 755,001 | |
Accumulated depreciation, depletion and amortization | | | (192,027 | ) | | | (16,735 | ) | | | (208,762 | ) |
| | | | | | | | | | | | |
Net capitalized costs | | $ | 420,329 | | | $ | 125,910 | | | $ | 546,239 | |
| | | | | | | | | | | | |
133
Endeavour International Corporation
Notes to Consolidated Financial Statements
(Amounts in tables in thousands, except per unit data)
| | | | | | | | | | | | |
| Costs Incurred in Oil and Gas Property Acquisition, Exploration and Development Activities | |
| | | |
| | | United
Kingdom | | | United
States | | | Total | |
Year Ended December 31, 2012: | | | | | | | | | | | | |
Acquisition costs: | | | | | | | | | | | | |
Proved | | $ | 143,004 | | | $ | 1,176 | | | $ | 144,180 | |
Unproved | | | 46,878 | | | | 1,156 | | | | 48,034 | |
Exploration costs | | | 46,730 | | | | 15,397 | | | | 62,127 | |
Development costs | | | 302,038 | | | | 8,099 | | | | 310,137 | |
| | | | | | | | | | | | |
Total costs incurred | | $ | 538,650 | | | $ | 25,828 | | | $ | 564,478 | |
| | | | | | | | | | | | |
Year Ended December 31, 2011: | | | | | | | | | | | | |
Acquisition costs: | | | | | | | | | | | | |
Proved | | $ | 2,595 | | | $ | — | | | $ | 2,595 | |
Unproved | | | 46,107 | | | | 2,840 | | | | 48,947 | |
Exploration costs | | | 51,820 | | | | 75,880 | | | | 127,700 | |
Development costs | | | 79,898 | | | | 10,560 | | | | 90,458 | |
| | | | | | | | | | | | |
Total costs incurred | | $ | 180,420 | | | $ | 89,280 | | | $ | 269,700 | |
| | | | | | | | | | | | |
Year Ended December 31, 2010: | | | | | | | | | | | | |
Acquisition costs: | | | | | | | | | | | | |
Proved | | $ | — | | | $ | 2,386 | | | $ | 2,386 | |
Unproved | | | 1,184 | | | | 40,155 | | | | 41,339 | |
Exploration costs | | | 50,328 | | | | 32,027 | | | | 82,355 | |
Development costs | | | 22,047 | | | | 1,884 | | | | 23,931 | |
| | | | | | | | | | | | |
Total costs incurred | | $ | 73,559 | | | $ | 76,452 | | | $ | 150,011 | |
| | | | | | | | | | | | |
134
Endeavour International Corporation
Notes to Consolidated Financial Statements
(Amounts in tables in thousands, except per unit data)
| | | | | | | | | | | | |
| Results of Operations for Oil and Gas Producing Activities | |
| | | |
| | | United
Kingdom | | | United
States | | | Total | |
Year Ended December 31, 2012: | | | | | | | | | | | | |
Revenues | | $ | 207,181 | | | $ | 11,877 | | | $ | 219,058 | |
Production expenses | | | 51,568 | | | | 6,968 | | | | 58,536 | |
DD&A | | | 56,813 | | | | 7,574 | | | | 64,387 | |
Impairment of oil and gas properties | | | — | | | | 53,072 | | | | 53,072 | |
Income tax expense (benefit) | | | 61,256 | | | | (19,508 | ) | | | 41,748 | |
| | | | | | | | | | | | |
Results of activities | | $ | 37,544 | | | $ | (36,229 | ) | | $ | 1,315 | |
| | | | | | | | | | | | |
Year Ended December 31, 2011: | | | | | | | | | | | | |
Revenues | | $ | 41,754 | | | $ | 18,337 | | | $ | 60,091 | |
Production expenses | | | 8,622 | | | | 9,046 | | | | 17,668 | |
DD&A | | | 14,312 | | | | 10,713 | | | | 25,025 | |
Impairment of oil and gas properties | | | — | | | | 65,706 | | | | 65,706 | |
Income tax expense (benefit) | | | 11,104 | | | | (23,495 | ) | | | (12,391 | ) |
| | | | | | | | | | | | |
Results of activities | | $ | 7,716 | | | $ | (43,633 | ) | | $ | (35,917 | ) |
| | | | | | | | | | | | |
Year Ended December 31, 2010: | | | | | | | | | | | | |
Revenues | | $ | 60,501 | | | $ | 11,174 | | | $ | 71,675 | |
Production expenses | | | 11,086 | | | | 4,261 | | | | 15,347 | |
DD&A | | | 22,020 | | | | 5,273 | | | | 27,293 | |
Impairment of oil and gas properties | | | — | | | | 7,692 | | | | 7,692 | |
Income tax expense (benefit) | | | 13,698 | | | | (2,118 | ) | | | 11,580 | |
| | | | | | | | | | | | |
Results of activities | | $ | 13,697 | | | $ | (3,934 | ) | | $ | 9,763 | |
| | | | | | | | | | | | |
Oil and Gas Reserves
Proved reserves are estimated quantities of oil, gas and natural gas liquids that geological and engineering data demonstrate with reasonable certainty to be recoverable in future years from known reservoirs under existing economic and operating conditions. Proved developed reserves are proved reserves that can reasonably be expected to be recovered through existing wells with existing equipment and operating methods. The reserve volumes presented are estimates only and should not be construed as being exact quantities. These reserves may or may not be recovered and may increase or decrease as a result of our future operations and changes in economic conditions. Our oil and gas reserves were audited by independent reserve engineers at December 31, 2012, 2011 and 2010.
135
Endeavour International Corporation
Notes to Consolidated Financial Statements
(Amounts in tables in thousands, except per unit data)
| | | | | | | | | | | | |
| | | United
Kingdom | | | United
States | | | Total | |
Proved Oil Reserves (MBbls): | | | | | | | | | | | | |
Proved reserves at January 1, 2010 | | | 3,348 | | | | 18 | | | | 3,366 | |
Production | | | (545 | ) | | | (6 | ) | | | (551 | ) |
Extensions and discoveries | | | 457 | | | | 34 | | | | 491 | |
Revisions of previous estimates | | | 404 | | | | 13 | | | | 417 | |
| | | | | | | | | | | | |
Proved reserves at December 31, 2010 | | | 3,664 | | | | 59 | | | | 3,723 | |
Production | | | (373 | ) | | | (7 | ) | | | (380 | ) |
Purchases of reserves | | | 303 | | | | — | | | | 303 | |
Revisions of previous estimates | | | 466 | | | | (11 | ) | | | 455 | |
| | | | | | | | | | | | |
Proved reserves at December 31, 2011 | | | 4,060 | | | | 41 | | | | 4,101 | |
Production | | | (1,994 | ) | | | (3 | ) | | | (1,997 | ) |
Purchases of reserves | | | 11,071 | | | | — | | | | 11,071 | |
Sales of reserves in place | | | — | | | | (19 | ) | | | (19 | ) |
Extensions and discoveries | | | 1,992 | | | | — | | | | 1,992 | |
Revisions of previous estimates | | | (1,396 | ) | | | (13 | ) | | | (1,409 | ) |
| | | | | | | | | | | | |
Proved reserves at December 31, 2012 | | | 13,733 | | | | 6 | | | | 13,739 | |
| | | | | | | | | | | | |
Proved Developed Oil Reserves (MBbls): | | | | | | | | | | | | |
At December 31, 2010 | | | 1,240 | | | | 14 | | | | 1,254 | |
| | | | | | | | | | | | |
At December 31, 2011 | | | 1,270 | | | | 41 | | | | 1,311 | |
| | | | | | | | | | | | |
At December 31, 2012 | | | 5,261 | | | | 6 | | | | 5,267 | |
| | | | | | | | | | | | |
136
Endeavour International Corporation
Notes to Consolidated Financial Statements
(Amounts in tables in thousands, except per unit data)
| | | | | | | | | | | | |
| | | United
Kingdom | | | United
States | | | Total | |
Proved Gas Reserves (MMcf): | | | | | | | | | | | | |
Proved reserves at January 1, 2010 | | | 78,316 | | | | 10,784 | | | | 89,100 | |
Production | | | (3,071 | ) | | | (2,636 | ) | | | (5,707 | ) |
Purchases of reserves | | | — | | | | 2,657 | | | | 2,657 | |
Sales of reserves in place | | | (51,522 | ) | | | — | | | | (51,522 | ) |
Extensions and discoveries | | | 26,692 | | | | 24,181 | | | | 50,873 | |
Revisions of previous estimates | | | 5,762 | | | | (3,209 | ) | | | 2,553 | |
| | | | | | | | | | | | |
Proved reserves at December 31, 2010 | | | 56,177 | | | | 31,777 | | | | 87,954 | |
Production | | | (94 | ) | | | (5,076 | ) | | | (5,170 | ) |
Purchases of reserves | | | 90 | | | | — | | | | 90 | |
Extensions and discoveries | | | — | | | | 46,100 | | | | 46,100 | |
Revisions of previous estimates | | | (5,450 | ) | | | (11,823 | ) | | | (17,273 | ) |
| | | | | | | | | | | | |
Proved reserves at December 31, 2011 | | | 50,723 | | | | 60,978 | | | | 111,701 | |
Production | | | (91 | ) | | | (5,206 | ) | | | (5,297 | ) |
Purchases of reserves | | | 1,409 | | | | 998 | | | | 2,407 | |
Sales of reserves in place | | | — | | | | (5,213 | ) | | | (5,213 | ) |
Extensions and discoveries | | | 473 | | | | — | | | | 473 | |
Revisions of previous estimates | | | 4,387 | | | | (36,867 | ) | | | (32,480 | ) |
| | | | | | | | | | | | |
Proved reserves at December 31, 2012 | | | 56,901 | | | | 14,690 | | | | 71,591 | |
Proved Developed Gas Reserves (MMcf): | | | | | | | | | | | | |
At December 31, 2010 | | | 555 | | | | 13,281 | | | | 13,836 | |
| | | | | | | | | | | | |
At December 31, 2011 | | | 795 | | | | 22,704 | | | | 23,499 | |
| | | | | | | | | | | | |
At December 31, 2012 | | | 3,147 | | | | 14,690 | | | | 17,837 | |
| | | | | | | | | | | | |
137
Endeavour International Corporation
Notes to Consolidated Financial Statements
(Amounts in tables in thousands, except per unit data)
| | | | | | | | | | | | |
| | | United
Kingdom | | | United
States | | | Total | |
Proved Reserves (MBOE): | | | | | | | | | | | | |
Proved reserves at January 1, 2010 | | | 16,401 | | | | 1,815 | | | | 18,216 | |
Production | | | (1,057 | ) | | | (445 | ) | | | (1,502 | ) |
Extensions and discoveries | | | 4,906 | | | | 4,064 | | | | 8,970 | |
Purchase of proved reserves, in place | | | — | | | | 443 | | | | 443 | |
Sales of reserves | | | (8,587 | ) | | | — | | | | (8,587 | ) |
Revisions of previous estimates | | | 1,364 | | | | (522 | ) | | | 842 | |
| | | | | | | | | | | | |
Proved reserves at December 31, 2010 | | | 13,027 | | | | 5,355 | | | | 18,382 | |
Production | | | (389 | ) | | | (853 | ) | | | (1,242 | ) |
Extensions and discoveries | | | — | | | | 7,683 | | | | 7,683 | |
Purchase of proved reserves, in place | | | 318 | | | | — | | | | 318 | |
Revisions of previous estimates | | | (442 | ) | | | (1,981 | ) | | | (2,423 | ) |
| | | | | | | | | | | | |
Proved reserves at December 31, 2011 | | | 12,514 | | | | 10,204 | | | | 22,718 | |
Production | | | (2,009 | ) | | | (871 | ) | | | (2,880 | ) |
Extensions and discoveries | | | 2,071 | | | | — | | | | 2,071 | |
Purchase of proved reserves, in place | | | 11,306 | | | | 166 | | | | 11,472 | |
Sale of reserves | | | — | | | | (888 | ) | | | (888 | ) |
Revisions of previous estimates | | | (665 | ) | | | (6,157 | ) | | | (6,822 | ) |
| | | | | | | | | | | | |
Proved reserves at December 31, 2012 | | | 23,217 | | | | 2,454 | | | | 25,671 | |
| | | | | | | | | | | | |
Proved Developed Reserves (MBOE): | | | | | | | | | | | | |
At December 31, 2010 | | | 1,333 | | | | 2,227 | | | | 3,560 | |
| | | | | | | | | | | | |
At December 31, 2011 | | | 1,402 | | | | 3,825 | | | | 5,227 | |
| | | | | | | | | | | | |
At December 31, 2012 | | | 5,785 | | | | 2,454 | | | | 8,239 | |
| | | | | | | | | | | | |
Standardized Measure of Discounted Future Net Cash Flows
Future cash inflows and future production and development costs are determined by applying average 12-month pricing for the year. Oil, gas and condensate prices are escalated only for fixed and determinable amounts under provisions in some contracts. Estimated future income taxes are computed using current statutory income tax rates where production occurs. The resulting future net cash flows are reduced to present value amounts by applying a 10% annual discount factor.
138
Endeavour International Corporation
Notes to Consolidated Financial Statements
(Amounts in tables in thousands, except per unit data)
At December 31, 2012 and 2011, the prices used to determine the estimates of future cash inflows were as follows:
| | | | | | | | | | | | | | | | |
| | | December 31, | |
| | | 2012 | | | 2011 | |
| | | Oil | | | Gas | | | Oil | | | Gas | |
United Kingdom ($/Barrel) | | | 111.13 | | | | 9.34 | | | | 110.77 | | | | 8.75 | |
United States ($/Mcf) | | | 94.71 | | | | 2.75 | | | | 96.04 | | | | 4.14 | |
Estimated future cash inflows are reduced by estimated future development, production, abandonment and dismantlement costs based on year-end cost levels, assuming continuation of existing economic conditions, and by estimated future income tax expense. Income tax expense, both U.S. and foreign, is calculated by applying the existing statutory tax rates, including any known future changes, to the pretax net cash flows giving effect to any permanent differences and reduced by the applicable tax basis. The effect of tax credits is considered in determining the income tax expense.
The standardized measure of discounted future net cash flows is not intended to present the fair market value of our oil and gas reserves. An estimate of fair value would also take into account, among other things, the recovery of reserves in excess of proved reserves, anticipated future changes in prices and costs, an allowance for return on investment and the risks inherent in reserve estimates.
139
Endeavour International Corporation
Notes to Consolidated Financial Statements
(Amounts in tables in thousands, except per unit data)
Standardized Measure of Discounted Future Net Cash Flows
| | | | | | | | | | | | |
| | | United
Kingdom | | | United
States | | | Total | |
December 31, 2012: | | | | | | | | | | | | |
Future cash inflows | | $ | 2,035,208 | | | $ | 31,258 | | | $ | 2,066,466 | |
Future production costs | | | (568,414 | ) | | | (10,101 | ) | | | (578,515 | ) |
Future development costs | | | (581,277 | ) | | | (896 | ) | | | (582,173 | ) |
Future income tax expense | | | (277,436 | ) | | | — | | | | (277,436 | ) |
| | | | | | | | | | | | |
Future net cash flows (undiscounted) | | | 608,081 | | | | 20,261 | | | | 628,342 | |
Annual discount of 10% for estimated timing | | | 122,780 | | | | 6,584 | | | | 129,364 | |
| | | | | | | | | | | | |
Standardized measure of future net cash flows | | $ | 485,301 | | | $ | 13,677 | | | $ | 498,978 | |
| | | | | | | | | | | | |
December 31, 2011: | | | | | | | | | | | | |
Future cash inflows | | $ | 941,208 | | | $ | 218,295 | | | $ | 1,159,503 | |
Future production costs | | | (144,106 | ) | | | (47,344 | ) | | | (191,450 | ) |
Future development costs | | | (306,628 | ) | | | (64,757 | ) | | | (371,385 | ) |
Future income tax expense | | | (238,111 | ) | | | — | | | | (238,111 | ) |
| | | | | | | | | | | | |
Future net cash flows (undiscounted) | | | 252,363 | | | | 106,194 | | | | 358,557 | |
Annual discount of 10% for estimated timing | | | 37,250 | | | | 56,435 | | | | 93,685 | |
| | | | | | | | | | | | |
Standardized measure of future net cash flows | | $ | 215,113 | | | $ | 49,759 | | | $ | 264,872 | |
| | | | | | | | | | | | |
Principal Sources of Change in the Standardized Measure of Discounted Future Net Cash Flows
| | | | | | | | | | | | |
| | |
| | | 2012 | | | 2011 | | | 2010 | |
Standardized measure, beginning of period | | $ | 264,872 | | | $ | 111,297 | | | $ | 55,698 | |
Net changes in prices and production costs | | | (33,520 | ) | | | 147,776 | | | | 86,915 | |
Future development costs incurred | | | 172,462 | | | | 76,721 | | | | 21,112 | |
Net changes in estimated future development costs | | | (193,359 | ) | | | (9,261 | ) | | | (48,356 | ) |
Revisions of previous quantity estimates | | | (56,525 | ) | | | (36,421 | ) | | | 16,375 | |
Extensions and discoveries | | | 102,386 | | | | 68,452 | | | | 110,059 | |
Accretion of discount | | | 42,589 | | | | 18,801 | | | | 2,630 | |
Changes in income taxes, net | | | (74,778 | ) | | | (136,157 | ) | | | (35,306 | ) |
Sale of oil and gas produced, net of production costs | | | (165,547 | ) | | | (44,556 | ) | | | (56,327 | ) |
Purchased reserves | | | 457,033 | | | | 26,340 | | | | 2,386 | |
Sales of reserves in place | | | (6,971 | ) | | | — | | | | (48,310 | ) |
Change in production, timing and other | | | (9,664 | ) | | | 41,880 | | | | 4,421 | |
| | | | | | | | | | | | |
Standardized measure, end of period | | $ | 498,978 | | | $ | 264,872 | | | $ | 111,297 | |
| | | | | | | | | | | | |
140
Endeavour International Corporation
Item 9. Changes in and Disagreements with Accountants on Accounting and Financial Disclosure.
None.
Item 9A. Controls and Procedures.
Evaluation of Disclosure Controls and Procedures
Under the supervision and with the participation of our management, including our chief executive officer and chief financial officer, we evaluated the effectiveness of our disclosure controls and procedures as of the end of the period covered by this Annual Report on Form 10-K, December 31, 2012. Based on that evaluation, our chief executive officer and chief financial officer concluded that our disclosure controls and procedures are effective to ensure that information we are required to disclose in our reports filed or submitted under the Securities Exchange Act of 1934, as amended, is accumulated and communicated to management as appropriate to allow timely decisions regarding required disclosures.
Management’s Report on Internal Control Over Financial Reporting
Management is responsible for establishing and maintaining adequate internal controls over financial reporting, as defined in Rules 13a-15(f) and 15d-15(f) of the Securities Exchange Act of 1934, as amended. Our internal controls were designed to provide reasonable assurance as to the reliability of our financial reporting and the preparation and presentation of the consolidated financial statements for external purposes in accordance with accounting principles generally accepted in the United States.
Because of its inherent limitations, internal control over financial reporting may not detect or prevent misstatements. Projections of any evaluation of the effectiveness to future periods are subject to the risk that controls may become inadequate because of changes in conditions, or that the degree of compliance with the policies or procedures may deteriorate.
Our management assessed the effectiveness of our internal control over financial reporting as of December 31, 2012. In making this assessment, our management used the criteria established in Internal Control-Integrated Framework issued by the Committee of Sponsoring Organizations of the Treadway Commission (COSO). Based on our assessment, management concluded our internal control over financial reporting was effective as of December 31, 2012.
Ernst & Young LLP, an independent registered public accounting firm, audited the effectiveness of the Company’s internal control over financial reporting as of December 31, 2012 and issued their attestation report set forth in this Item 9A.
141
Endeavour International Corporation
Changes in Internal Control over Financial Reporting
There were no changes in our internal controls over financial reporting during the quarterly period ended December 31, 2012 that have materially affected, or are reasonably likely to materially affect, our internal control over financial reporting.
Report of Independent Registered Public Accounting Firm
The Board of Directors and Stockholders of
Endeavour International Corporation
We have audited Endeavour International Corporation and subsidiaries’ internal control over financial reporting as of December 31, 2012, based on criteria established in Internal Control—Integrated Framework issued by the Committee of Sponsoring Organizations of the Treadway Commission (the COSO criteria). Endeavour International Corporation’s management is responsible for maintaining effective internal control over financial reporting, and for its assessment of the effectiveness of internal control over financial reporting included in the accompanying Management’s Report on Internal Control Over Financial Reporting. Our responsibility is to express an opinion on the company’s internal control over financial reporting based on our audit.
We conducted our audit in accordance with the standards of the Public Company Accounting Oversight Board (United States). Those standards require that we plan and perform the audit to obtain reasonable assurance about whether effective internal control over financial reporting was maintained in all material respects. Our audit included obtaining an understanding of internal control over financial reporting, assessing the risk that a material weakness exists, testing and evaluating the design and operating effectiveness of internal control based on the assessed risk, and performing such other procedures as we considered necessary in the circumstances. We believe that our audit provides a reasonable basis for our opinion.
A company’s internal control over financial reporting is a process designed to provide reasonable assurance regarding the reliability of financial reporting and the preparation of financial statements for external purposes in accordance with generally accepted accounting principles. A company’s internal control over financial reporting includes those policies and procedures that (1) pertain to the maintenance of records that, in reasonable detail, accurately and fairly reflect the transactions and dispositions of the assets of the company; (2) provide reasonable assurance that transactions are recorded as necessary to permit preparation of financial statements in accordance with generally accepted accounting principles, and that receipts and expenditures of the company are being made only in accordance with authorizations of management and directors of the company; and (3) provide reasonable assurance regarding prevention or timely detection of unauthorized acquisition, use, or disposition of the company’s assets that could have a material effect on the financial statements.
142
Endeavour International Corporation
Because of its inherent limitations, internal control over financial reporting may not prevent or detect misstatements. Also, projections of any evaluation of effectiveness to future periods are subject to the risk that controls may become inadequate because of changes in conditions, or that the degree of compliance with the policies or procedures may deteriorate.
In our opinion, Endeavour International Corporation and subsidiaries maintained, in all material respects, effective internal control over financial reporting as of December 31, 2012, based on the COSO criteria.
We also have audited, in accordance with the standards of the Public Company Accounting Oversight Board (United States), the 2012 consolidated financial statements of Endeavour International Corporation and subsidiaries and our report dated March 18, 2013 expressed an unqualified opinion thereon.
/s/ Ernst & Young LLP
Houston, Texas
March 18, 2013
143
Endeavour International Corporation
Item 9B. Other Information
None.
144
Endeavour International Corporation
Part III
Item 10. Directors, Executive Officers and Corporate Governance of the Registrant
Our Definitive Proxy Statement for our 2013 Annual Meeting of Stockholders, when filed pursuant to Regulation 14A under the Securities Exchange Act of 1934, will be incorporated by reference into this Annual Report on Form 10-K pursuant to General Instruction G(3) of Form 10-K and will provide the information required under Part III, Item 10.
Our Code of Business Conduct and the Code of Ethics for Senior Officers can be found on our website located atwww.endeavourcorp.com. Any stockholder may request a printed copy of these codes by submitting a written request to our Corporate Secretary.
Item 11. Executive Compensation
Our Definitive Proxy Statement for our 2013 Annual Meeting of Stockholders, when filed pursuant to Regulation 14A under the Securities Exchange Act of 1934, will be incorporated by reference into this Annual Report on Form 10-K pursuant to General Instruction G(3) of Form 10-K and will provide the information required under Part III, Item 11.
Item 12. Security Ownership of Certain Beneficial Owners and Management and Related Stockholders Matters
Our Definitive Proxy Statement for our 2013 Annual Meeting of Stockholders, when filed pursuant to Regulation 14A under the Securities Exchange Act of 1934, will be incorporated by reference into this Annual Report on Form 10-K pursuant to General Instruction G(3) of Form 10-K and will provide the information required under Part III, Item 12.
Item 13. Certain Relationships and Related Transactions, and Director Independence
Our Definitive Proxy Statement for our 2013 Annual Meeting of Stockholders, when filed pursuant to Regulation 14A under the Securities Exchange Act of 1934, will be incorporated by reference into this Annual Report on Form 10-K pursuant to General Instruction G(3) of Form 10-K and will provide the information required under Part III, Item 13.
145
Endeavour International Corporation
Item 14. Principal Accounting Fees and Services
Our Definitive Proxy Statement for our 2013 Annual Meeting of Stockholders, when filed pursuant to Regulation 14A under the Securities Exchange Act of 1934, will be incorporated by reference into this Annual Report on Form 10-K pursuant to General Instruction G(3) of Form 10-K and will provide the information required under Part III, Item 14.
Part IV
Item 15. Exhibits and Financial Statement Schedules
(a) (1) and (2) Financial Statements and Financial Statement Schedules.
See our consolidated financial statements included in Item 8 herein.
(a) (3) Exhibits.
See “Index of Exhibits” herein which lists the documents filed as exhibits with this Annual Report on Form 10-K.
(b) Exhibits.
See “Index of Exhibits” herein which lists the documents filed as exhibits with this Annual Report on Form 10-K.
146
Endeavour International Corporation
Signatures
Pursuant to the requirements of Section 13 or 15(d) of the Securities Exchange Act of 1934, the registrant has duly caused this Annual Report on Form 10-K to be signed on its behalf by the undersigned, thereunto duly authorized.
Endeavour International Corporation
| | |
| By: | | /s/ Catherine L. Stubbs |
| | Catherine L. Stubbs Senior Vice President and Chief Financial Officer |
Date: March 18, 2013
Pursuant to the requirements of the Securities Exchange Act of 1934, this report has been signed below by the following persons on behalf of the registrant and in the capacities and on the dates indicated.
| | | | |
Signature | | Title | | Date |
| | |
/s/ William L. Transier William L. Transier | | Chief Executive Officer, President and Director (Principal Executive Officer) | | March 18, 2013 |
| | |
/s/ Catherine L. Stubbs Catherine L. Stubbs | | Chief Financial Officer (Principal Financial Officer) | | March 18, 2013 |
| | |
/s/ Stanley W. Farmer Stanley W. Farmer | | Chief Accounting Officer (Principal Accounting Officer) | | March 18, 2013 |
| | |
/s/ John B. Connally III John B. Connally III | | Director | | March 18, 2013 |
| | |
/s/ Sheldon R. Erikson Sheldon Erikson | | Director | | March 18, 2013 |
| | |
/s/ Charles Hue Williams Charles Hue Williams | | Director | | March 18, 2013 |
| | |
/s/ Nancy K. Quinn Nancy K. Quinn | | Director | | March 18, 2013 |
| | |
/s/ John N. Seitz John N. Seitz | | Director | | March 18, 2013 |
147
Endeavour International Corporation
Exhibit Index
| | |
Exhibit | | Description |
| |
| **2.1 | | Purchase and Sale Agreement, dated as of July 17, 2011, by and among Endeavour Operating Corporation, SM Energy Company, Potato Creek LLC, Open Flow Gas Supply Corporation and SJ Exploration LLC (Incorporated by reference to Exhibit 2.1 of our Quarterly Report on Form 10-Q (Commission File No. 001-32212) for the quarter ended June 30, 2011). |
| |
| **2.2 | | Membership Interest Purchase Agreement, dated as of July 17, 2011, by and among Endeavour Operating Corporation, SM Energy Company, and Potato Creek LLC. (Incorporated by reference to Exhibit 2.1 of our Quarterly Report on Form 10-Q (Commission File No. 001-32212) for the quarter ended June 30, 2011). |
| |
| **2.3 | | Sale and Purchase Agreement between Endeavour Energy UK Limited and ConocoPhillips (U.K.) Limited, ConocoPhillips Petroleum Limited and ConocoPhillips (U.K.) Lambda Limited. Schedules and Exhibits are omitted pursuant to Section 601(b)(2) of Regulation S-K. Endeavour agrees to furnish supplementally a copy of any omitted Schedule to the SEC upon request. (Incorporated by reference to Exhibit 2.1 of our Current Report on Form 8-K (Commission File No. 001-32212) filed on December 30, 2011). |
| |
| 2.3(b) | | Letter agreement to amend Sale and Purchase Agreement between Endeavour Energy UK Limited and ConocoPhillips (U.K.) Limited, ConocoPhillips Petroleum Limited and ConocoPhillips (U.K.) Lambda Limited (Incorporated by Reference to Exhibit 2.1 to our Current Report on Form 8-K (Commission File No. 001-32212) filed on December 3, 2012). |
| |
| 3.1(a) | | Amended and Restated Articles of Incorporation (Incorporated by reference to Exhibit 3.2 of our Quarterly Report on Form 10-Q (Commission File No. 001-32212) for the quarter ended June 30, 2004). |
| |
| 3.1(b) | | Certificate of Amendment dated June 1, 2006 (Incorporated by reference to Exhibit 4.2 of our Registration Statement on Form S-3 (Commission File No. 333-139304) filed on December 13, 2006). |
| |
| 3.1(c) | | Certificate of Amendment dated June 1, 2010 (Incorporated by reference to Exhibit 3.1 to our Current Report on Form 8-K (Commission File No. 001-32212) filed on June 3, 2010). |
| |
| 3.1(d) | | Amendment to Articles of Incorporation, dated November 17, 2010 (Incorporated by reference to Exhibit 3.1(d) of our Annual Report on Form 10-K (Commission File No. 001-32212) for the year ended December 31, 2010). |
| |
| *3.2 | | Amended and Restated Bylaws. |
| |
| 3.3 | | Amended and Restated Certificate of Designation of Series B Preferred Stock filed February 26, 2004 (Incorporated by reference to Exhibit 3.3 of our Quarterly Report on Form 10-Q (Commission File No. 001-32212) for the quarter ended June 30, 2004). |
148
Endeavour International Corporation
Exhibit Index
| | |
Exhibit | | Description |
| |
| 3.4 | | Specimen of Common Stock Certificate (Incorporated by reference to Exhibit 3.7 of our Quarterly Report on Form 10-Q (Commission File No. 001-32212) for the quarter ended June 30, 2004). |
| |
| 3.5 | | Certificate of Designation of Series A Preferred Stock of Endeavour International Corporation (Incorporated by reference to Exhibit 3.1 to our Current Report on Form 8-K (Commission File No. 001-32212) filed on November 6, 2006). |
| |
| 3.6(a) | | Certificate of Designation of Series C Preferred Stock of Endeavour International Corporation, (Incorporated by reference to Exhibit 3.2 to our Current Report on Form 8-K (Commission File No. 001-32212) filed on November 6, 2006). |
| |
| 3.6(b) | | Amendment to Certificate of Designation of Series C Preferred Stock of Endeavour International Corporation, dated November 17, 2009 (Incorporated by reference to Exhibit 4.1 to our Current Report on Form 8-K (Commission File No. 001-32212) filed on November 23, 2009). |
| |
| 3.6(c) | | Amendment to Certificate of Designation of Series C Preferred Stock of Endeavour International Corporation, dated March 10, 2010 (Incorporated by reference to Exhibit 3.6(c) of our Annual Report on Form 10-K (Commission File No. 001-32212) for the year ended December 31, 2009). |
| |
| 3.7 | | Certificate of Designation of Series D Junior Preferred Stock of Endeavour International Corporation (Incorporated by reference to Exhibit 3.3 to our Current Report on Form 8-K (Commission File No. 001-32212) filed on November 6, 2006). |
| |
| 4.1 (a) | | Warrants to Purchase Common Stock issued to Trident Growth Fund, LP dated July 29, 2003 (warrant # 2003-3) (Incorporated by reference to Exhibit 4.7 of our Annual Report on Form 10-KSB (Commission File No. 000-33439) for the year ended December 31, 2003). |
| |
| 4.1 (b) | | First Amendment to Warrants to Purchase Common Stock dated February 26, 2004 (warrant # 2003-3) (Incorporated by reference to Exhibit 4.7 of our Annual Report on Form 10-KSB (Commission File No. 000-33439) for the year ended December 31, 2003). |
| |
| 4.2(a) | | Warrants to Purchase Common Stock issued to Gemini Capital, L.P. (Warrant #2002-1) (Incorporated by reference to Exhibit 4.6 of our Quarterly Report on Form 10-QSB (Commission File No. 000-33439) for the Quarter Ended June 30, 2002). |
| |
| 4.2(b) | | First Amendment to Warrants to Purchase Common Stock dated July 29, 2003 (Warrant # 2002-1) (Incorporated by reference to Exhibit 4.5 of our Annual Report on Form 10-KSB (Commission File No. 000-33439) for the year ended December 31, 2003). |
149
Endeavour International Corporation
Exhibit Index
| | |
Exhibit | | Description |
| |
| 4.2(c) | | Second Amendment to Warrants to Purchase Common Stock dated February 26, 2004 (Warrant # 2002-1) (Incorporated by reference to Exhibit 4.5 of our Annual Report on Form 10-KSB (Commission File No. 000-33439) for the year ended December 31, 2003). |
| |
| 4.3 | | Registration Rights Agreement dated January 24, 2008 by and between Endeavour International Corporation and Smedvig QIF Plc (Incorporated by reference to Exhibit 4.2 to our Current Report on Form 8-K (Commission File No. 001-32212) filed on January 28, 2008). |
| |
| 4.4(a) | | Trust Deed dated January 24, 2008 by and among Endeavour International Corporation, Endeavour Energy Luxembourg S.a.r.l. and BNY Corporate Trustee Services Limited, as trustee (Incorporated by reference to Exhibit 4.1 to our Current Report on Form 8-K (Commission File No. 001-32212) filed on January 28, 2008). |
| |
| 4.4(b) | | Amendment Deed dated March 11, 2011, to Trust Deed dated January 24, 2008 by and among Endeavour International Corporation, Endeavour Energy Luxembourg S.a.r.l. and BNY Corporate Trustee Services Limited, as trustee (Incorporated by reference to Exhibit 4.1 to our Current Report on Form 8-K (Commission File No. 001-32212) filed on March 14, 2011). |
| |
| 4.5 | | Indenture dated as of July 22, 2011 among Endeavour International Corporation, the Guarantors named therein and Well Fargo Bank, National Association, as trustee (Incorporated by reference to Exhibit 4.1 to our Current Report on Form 8-K (Commission File No. 001-32212) filed on July 22, 2011). |
| |
| 4.6 | | Form of 5.5% Global Note, dated July 22, 2011 (included in Exhibit 4.5). |
| |
| 4.7 | | First Priority Indenture, dated February 23, 2012, among Endeavour International Corporation, the subsidiary guarantors party thereto, and Wells Fargo Bank, National Association, as trustee and collateral agent (Incorporated by reference to Exhibit 4.1 to our Current Report on Form 8-K (Commission File No. 001-32212) filed on February 29, 2012). |
| |
| 4.8 | | Form of First Priority 12% Senior Notes due 2018 (included in Exhibit 4.7). |
| |
| 4.9 | | Second Priority Indenture, dated February 23, 2012, among Endeavour International Corporation, the subsidiary guarantors party thereto, Wilmington Trust, National Association, as trustee and Wells Fargo Bank, National Association, as collateral agent (incorporated by reference to Exhibit 4.3 to our Current Report on Form 8-K (Commission File No. 001-32212) filed on February 29, 2012). |
| |
| 4.10 | | Form of Second Priority 12% Senior Notes due 2018 (included in Exhibit 4.9). |
150
Endeavour International Corporation
Exhibit Index
| | |
Exhibit | | Description |
| |
| 4.11 | | Form of Warrant (Incorporated by reference as Exhibit A to Exhibit 10.2 to our Current Report on Form 8-K (Commission File No. 001-32212) filed on May 30, 2012). |
| |
| 4.12 | | Warrant to Purchase Common Stock (Incorporated by reference as Exhibit A to Exhibit 10.2 to our Current Report on Form 8-K (Commission File No. 001-32212) filed on January 14, 2013). |
| |
| †10.1 | | 2004 Incentive Plan, effective February 26, 2004 (Incorporated by reference to Exhibit 10.36 of our Annual Report on Form 10-KSB (Commission File No. 000-33439) for the year ended December 31, 2003). |
| |
| †10.2 | | 2007 Incentive Plan (Incorporated by reference to Exhibit 10.1 to our Quarterly Report (Commission File No. 001-32212) for the quarter ended June 30, 2007). |
| |
| †10.3(a) | | 2010 Incentive Plan (Incorporated by reference to Exhibit A to our definitive proxy statement on Schedule 14A filed on April 20, 2010). |
| |
| †10.3(b) | | First Amendment to 2010 Incentive Plan, dated as of May 24, 2012 (Incorporated by reference to Exhibit 10.1 to our Current Report on Form 8-K (Commission File No. 001-32212) filed on May 29, 2012). |
| |
| †10.4 | | Employment Agreement, effective as of January 1, 2013, by and between William L. Transier and Endeavour International Corporation (Incorporated by reference to Exhibit 10.1 to our Current on Form 8-K (Commission File No. 001-32212) filed on January 11, 2013). |
| |
| †10.5 | | Employment Offer Letter to Carl Grenz, dated August 15, 2008 (Incorporated by reference to Exhibit 10.1 of our Quarterly Report on Form 10-Q (Commission File No. 001-32212) for the quarter ended September 30, 2008). |
| |
| †10.6 | | Form of Change in Control on Termination of Benefits Agreement (Incorporated by reference to Exhibit 10.1 to our Current Report on Form 8-K (Commission File No. 000-32212) filed on February 15, 2008). |
| |
| †10.7 | | Form of Amended Change in Control Termination Benefits Agreement between Endeavour International Corporation and Grenz (Incorporated by reference to Exhibit 10.8 of our Annual Report on Form 10-K for the year ended December 31, 2008). |
| |
| †10.8 | | Change in Control and Termination Benefits Agreement dated January 11, 2010, by and between Endeavour International Corporation and James Joseph Emme (Incorporated by reference to Exhibit 10.7 of our Annual Report on Form 10-K for the year ended December 31, 2009). |
| |
| †10.9 | | Form of Restricted Stock Agreement under the 2010 Incentive Plan (Incorporated by reference to Exhibit 10.2 of our Quarterly Report on Form 10-Q (Commission File No. 001-32212) for the quarter ended September 30, 2010). |
151
Endeavour International Corporation
Exhibit Index
| | |
Exhibit | | Description |
| |
| †10.10 | | Form of Stock Option Agreement under the 2010 Incentive Plan (Incorporated by reference to Exhibit 10.3 to our Quarterly Report on Form 10-Q (Commission File No. 001-32212) for the quarter ended September 30, 2010). |
| |
| 10.11(a) | | Subscription and Registration Rights Agreement, dated October 19, 2006, by and among Endeavour International Corporation and the Investors party thereto (Incorporated by reference to Exhibit 10.1 to our Current Report on Form 8-K (Commission File No. 001-32212) filed on October 25, 2006). |
| |
| 10.11(b) | | Amendment No. 1 to Subscription and Registration Rights Agreement, January 29, 2010, by and among Endeavour International Corporation and the Investors party thereto (Incorporated by reference to Exhibit 10.1 to our Current Report on Form 8-K (Commission File No. 001-32212) filed on February 1, 2010). |
| |
| **10.12 | | Final Participation Agreement between Endeavour and Cohort Energy Company (Incorporated by reference to Exhibit 10.2 to our Current Report on Form 8-K (Commission File No. 001-32212) filed on January 19, 2010). |
| |
| 10.13(a) | | Credit Agreement dated as of April 12, 2012 among Endeavour International Corporation, Endeavour Energy UK Limited, Cyan Partners, LP, as administrative agent, and certain lenders party thereto (Incorporated by reference to Exhibit 10.3 to our Quarterly Report on Form 10-Q (Commission File No. 001-32212) for the quarterly period ended March 31, 2012). |
| |
| 10.13(b) | | First Amendment to Credit Agreement; U.S. Security Agreement and Subsidiaries Guaranty dated as of May 31, 2012, by and among Endeavour International Corporation, Endeavour Energy U.K. Limited, the subsidiary guarantors party thereto, Cyan Partners, LP, as administrative agent and collateral agent, and the other lenders party thereto. (Incorporated by reference to Exhibit 10.1 to our Current Report on Form 8-K (Commission File No. 001-32212) filed on June 6, 2012). |
| |
| 10.13(c) | | Incremental Increase Agreement dated as of September 28, 2012 between Endeavour Energy UK Limited, Endeavour International Corporation, Whitebox Credit Arbitrage Partners, LP, Pandora Select Partners, LP and Whitebox Multi-Strategy Partners, LP and Cyan Partners, LP., as administrative agent (Incorporated by reference to Exhibit 10.1 to our Quarterly Report on Form 10-Q (Commission File No. 001-32212) for the quarterly period ended June 30, 2012). |
| |
| 10.13(d) | | Incremental Increase Agreement dated as of September 28, 2012 between Endeavour Energy UK Limited, Endeavour International Corporation, Farallon Capital Partners, L.P., Farallon Capital Institutional Partners, L.P., Farallon Capital Institutional Partners II, L.P., Farallon Capital Institution Partners II, L.P., and Cyan Partners, LP., as administrative agent (Incorporated by reference to Exhibit 10.2 to our Quarterly Report on Form 10-Q (Commission File No. 001-32212) for the quarterly period ended June 30, 2012). |
152
Endeavour International Corporation
Exhibit Index
| | |
Exhibit | | Description |
| |
| 10.13(e) | | Second Amendment to Credit Agreement, dated as of October 10, 2012, between Endeavour International Corporation, Endeavour Energy UK Limited, Cyan Partners, LP, and the other lenders party thereto (Incorporated by reference to Exhibit 10.2 to our Current Report on Form 8-K (Commission File No. 001-32212) filed on October 15, 2012). |
| |
| †10.14 | | Stock Option Agreement between Endeavour International Corporation and Carl D. Grenz dated November 3, 2008 (Incorporated by reference to Exhibit 10.22 to our Annual Report on Form 10-K (Commission File No. 001-32212) for the year ended December 31, 2008). |
| |
| †10.15 | | Stock Option Agreement between Endeavour International Corporation and Carl D. Grenz dated November 3, 2008 (Incorporated by reference to Exhibit 10.23 to our Annual Report on Form 10-K (Commission File No. 001-32212) for the year ended December 31, 2008). |
| |
| †10.16 | | Restricted Stock Award Agreement between Endeavour International Corporation and James J. Emme dated January 10, 2010 (Incorporated by reference to Exhibit 10.22 of our Annual Report on Form 10-K (Commission File No. 001-32212) for the year ended December 31, 2010). |
| |
| †10.17 | | Restricted Stock Award Agreement between Endeavour International Corporation and Ralph A. Midkiff, dated as of June 1, 2012 (Incorporated by Reference to Exhibit 10.6 to our Quarterly Report on Form 10-Q (Commission File No. 001-32212) for the quarterly period ended June 30, 2012). |
| |
| †10.18 | | Form of Stock Redemption Agreement dated November 17, 2009 by and among Endeavour International Corporation and the holders of its Series C Preferred Stock (Incorporated by reference to Exhibit 10.1 to our Current Report on Form 8-K (Commission File No. 001-32212) filed on November 23, 2009). |
| |
| 10.19(a) | | Form of Note Agreement dated November 17, 2009 by and among Endeavour International Corporation and the holders of its Series C Preferred Stock (Incorporated by reference to Exhibit 10.2 to our Current Report on Form 8-K (Commission File No. 001-32212) filed on November 23, 2009). |
| |
| 10.19(b) | | Amendment to Note Agreement dated November 17, 2009 by and among Endeavour International Corporation and the holders of its Series C Preferred Stock, dated March 10, 2010 (Incorporated by reference to Exhibit 10.26(b) of our Annual Report on Form 10-K for the year ended December 31, 2009). |
| |
| 10.20 | | Letter of Credit Facility Agreement dated as of July 25, 2011 by and between Endeavour International Corporation and Commonwealth Bank of Australia (Incorporated by reference to Exhibit 10.3 to our Quarterly Report on Form 10-Q (Commission File No. 001-32212) for the quarter ended June 30, 2011). |
153
Endeavour International Corporation
Exhibit Index
| | |
Exhibit | | Description |
| |
| 10.21 | | Purchase Agreement, dated July 18, 2011 between the Company, the Guarantors, Citigroup Global Markets Inc. and Morgan Stanley & Co. LLC (incorporated by reference to Exhibit 10.1 to our Current Report on Form 8-K (Commission File No. 001-32212) filed on July 22, 2011). |
| |
| 10.22 | | Purchase Agreement dated as of February 13, 2012, among Endeavour International Corporation, the guarantors named therein and Citigroup Global Markets Inc., as representative of the Initial Purchasers named therein (incorporated by reference to Exhibit 10.1 to our Current Report on Form 8-K (Commission File No. 001-32212) filed on February 13, 2012). |
| |
| 10.23 | | First Priority Registration Rights Agreement, dated February 23, 2012, among Endeavour International Corporation, the subsidiary guarantors party thereto and Citigroup Global Markets Inc., as representative of the initial purchasers named therein (incorporated by reference to Exhibit 4.5 to our Current Report on Form 8-K (Commission File No. 001-32212) filed on February 29, 2012). |
| |
| 10.24 | | Second Priority Registration Rights Agreement, dated February 23, 2012, among Endeavour International Corporation, the subsidiary guarantors party thereto and Citigroup Global Markets Inc. (incorporated by reference to Exhibit 4.6 to our Current Report on Form 8-K (Commission File No. 001-32212) filed on February 29, 2012). |
| |
| 10.25 | | Reimbursement Agreement, dated as of May 23, 2012, among Endeavour International Corporation, Endeavour Energy U.K. Limited and Yellow Rock S.a.r.l. (Incorporated by reference to Exhibit 10.1 to our Current Report on 8-K (Commission File No. 001-32212) filed on May 30, 2012). |
| |
| 10.26 | | Form of Warrant Agreement to Purchase Common Stock (Incorporated by reference to Exhibit 10.2 to our Current Report on Form 8-K (Commission File No. 001-32212) filed on May 30, 2012). |
| |
| 10.27(a) | | Reimbursement Agreement, dated May 31, 2012, among Endeavour International Corporation, Endeavour Energy U.K. Limited, New Pearl S.a.r.l. and Cyan Partners, LP, as collateral agent. (Incorporated by reference to Exhibit 10.2 to our Current Report on Form 8-K (Commission File No. 001-32212) filed on June 6, 2012). |
| |
| 10.27(b) | | First Amendment to Reimbursement Agreement, dated as of October 10, 2012, between Endeavour International Corporation, Endeavour Energy UK Limited, Cyan Partners, LP, and New Pearl, Sa.r.l. (Incorporated by reference to Exhibit 10.3 to our Current Report on Form 8-K (Commission File No. 001-32212) filed on October 15, 2012). |
| |
| 10.28 | | Registration Rights Agreement, dated October 15, 2012 (Incorporated by reference to Exhibit 4.1 to our Current Report on Form 8-K (Commission File No. 001-32212) filed on October 15, 2012). |
154
Endeavour International Corporation
Exhibit Index
| | |
Exhibit | | Description |
| |
| 10.29 | | Warrant Agreement between Endeavour International Corporation and HBK Master Fund L.P. dated January 9, 2013 (Incorporated by reference to Exhibit 10.2 to our Current Report (Commission File No. 001-32212) filed on January 14, 2013). |
| |
| *12.1 | | Computation of Ratios of Earnings to Fixed Charges. |
| |
| *12.2 | | Computation of Ratios of Earnings to Fixed Charges and Preference Securities Dividends. |
| |
| 14.1 | | Code of Business Conduct of Endeavour International Corporation (Incorporated by reference to Exhibit 14.1 to our Annual Report on Form 10-K (Commission File No. 001-32212) for the year ended December 31, 2011). |
| |
| *21.1 | | List of Subsidiaries. |
| |
| *23.1 | | Consent of Independent Registered Public Accounting Firm – KPMG LLP. |
| |
| *23.2 | | Consent of Independent Registered Public Accounting Firm – KPMG LLP. |
| |
| *23.3 | | Consent of Independent Registered Public Accounting Firm – KPMG LLP. |
| |
| *23.4 | | Consent of Independent Reserve Engineers – Netherland, Sewell & Associates, Inc. |
| |
| *23.5 | | Consent of Independent Registered Public Accounting Firm – Ernst & Young LLP. |
| |
| *23.6 | | Consent of Independent Registered Public Accounting Firm – Ernst & Young LLP. |
| |
| *23.7 | | Consent of Independent Registered Public Accounting Firm – Ernst & Young LLP. |
| |
| *31.1 | | Certification of William L. Transier, Chief Executive Officer, pursuant to Rule 13a-14(a) of the Securities and Exchange Act of 1934, as amended. |
| |
| *31.2 | | Certification of Catherine L. Stubbs, Chief Financial Officer, pursuant to Rule 13a-14(a) of the Securities and Exchange Act of 1934, as amended. |
| |
| ‡32.1 | | Certification of William L. Transier, Chief Executive Officer, pursuant to 18 U.S.C. Section 1350, as Adopted Pursuant to Section 906 of the Sarbanes-Oxley Act of 2002. |
| |
| ‡32.2 | | Certification of Catherine L. Stubbs, Chief Financial Officer, pursuant to 18 U.S.C. Section 1350, as Adopted Pursuant to Section 906 of the Sarbanes-Oxley Act of 2002. |
| |
| ‡99.1 | | Report of Netherland, Sewell & Associates, Inc., Independent Petroleum Engineers and Geologists. |
| |
| *99.2 | | Audited Financial Statements of Endeavour Energy UK Limited. |
| |
| *99.3 | | Audited Financial Statements of Endeavour International Holding B.V. |
155
Endeavour International Corporation
Exhibit Index
| | |
Exhibit | | Description |
| |
| *101.INS | | XBRL Instance Document. |
| |
| *101.SCH | | XBRL Taxonomy Extension Schema Document. |
| |
| *101.CA | | XBRL Taxonomy Extension Calculation Linkbase. |
| |
| *101.DEF | | XBRL Taxonomy Extension Definition Linkbase. |
| |
| *101.LAB | | XBRL Taxonomy Extension Label Linkbase. |
| |
| *101.PRE | | Taxonomy Extension Presentation Linkbase. |
| |
| * | | Filed herewith. |
| |
| ‡ | | Furnished herewith. |
| |
| † | | Identifies management contracts and compensatory plans or arrangements. |
| |
| ** | | Portions of this exhibit have been omitted pursuant to a request for confidential treatment under Rule 24b-2 of the Securities Exchange Act of 1934, and the omitted material has been separately filed with the Securities and Exchange Commission. |
156