SECURITIES AND EXCHANGE COMMISSION
Washington, D.C. 20549
SCHEDULE 14A
(Rule 14a-101)
INFORMATION REQUIRED IN
PROXY STATEMENT
SCHEDULE 14A INFORMATION
Proxy Statement Pursuant to Section 14(a) of
the Securities Exchange Act of 1934
Filed by the registrant [ X ]
Filed by a party other than the registrant [ ]
Check the appropriate box:
[ ] Preliminary Proxy Statement
[ ] Confidential, for Use of the Commission Only (as permitted by Rule 14a-6(e)(2))
[ X ] Definitive Proxy Statement
[ ] Definitive Additional Materials
[ ] Soliciting Material Pursuant to Section 240.14a-11(c) or Section 240.14a-12
PAVILION BANCORP, INC.
(Name of registrant as specified in its charter)
________________________________________________________________________
(Name of person(s) filing Proxy Statement, if other than the Registrant)
Payment of filing fee (Check the appropriate box):
[ X ] No fee required
[ ] Fee computed on table below per Exchange Act Rules 14a-6(i)(1) and 0-11
| (1) | Title of each class of securities to which transaction applies: ______________________________________ |
| (2) | Aggregate number of securities to which transaction applies:______________________________________ |
| (3) | Per unit price or other underlying value of transaction computed pursuant to Exchange Act Rule 0-11 (set forth the amount on which the filing fee is calculated and state how it was determined): _________________________ |
| (4) | Proposed maximum aggregate value of transaction: _____________________________________________ |
| (5) | Total fee Paid: _________________________________________________________________________ |
[ ] Fee paid previously with preliminary materials
[ ] Check box if any part of the fee is offset as provided by Exchange Act Rule 0-11(a)(2) and identify the filing for which the offsetting fee was paid previously. Identify the previous filing by registration statement number, or the form or schedule and the date of its filing.
| (1) | Amount previously paid: _________________________________________________________________ |
| (2) | Form, schedule, or registration statement no.: __________________________________________________ |
| (3) | Filing party: ___________________________________________________________________________ |
| (4) | Date filed: ____________________________________________________________________________ |
PAVILION BANCORP, INC.
135 East Maumee Street
Adrian, Michigan 49221
NOTICE OF ANNUAL MEETING OF SHAREHOLDERS
To Be Held April 17, 2003
NOTICE IS HEREBY GIVEN that the Annual Meeting of Shareholders (the “Annual Meeting”) of Pavilion Bancorp, Inc. (the “Corporation”), a Michigan corporation, will be held on April 17, 2003, at 7:00 p.m. (local time) at the Dominican Hall, Siena Heights University, 1247 East Siena Heights Drive, Adrian, Michigan, for the following purposes:
| 1. | To elect two (2) directors, each to hold office for a three-year term. | |
| 2. | To approve of the selection of the Corporation’s auditors for the 2003 fiscal year. | |
| 3. | To consider and act upon ashareholder’s proposal as described in this proxy statement. | |
| 4. | To transact such other business as may properly come before the meeting or any adjournment thereof. |
The Board of Directors has fixed March 7, 2003, as the record date for the determination of shareholders entitled to notice of and to vote at the meeting or any adjournment thereof.
By order of the Board of Directors |
| Your vote is important. Even if you plan to attend the meeting, please date and sign the enclosed proxy form,indicate your choice with respect to the matters to be voted upon, and return it promptly in the enclosed envelope.Note that if the stock is held in more than one name, all parties must sign the proxy form. |
Dated: March 18, 2003
PAVILION BANCORP, INC.
135 East Maumee Street
Adrian, Michigan 49221
PROXY STATEMENT
This Proxy Statement and the enclosed proxy are furnished in connection with the solicitation of proxies by the Board of Directors of Pavilion Bancorp, Inc. (the “Corporation”), to be voted at the Annual Meeting of Shareholders of the Corporation to be held on Thursday, April 17, 2003, at 7:00 p.m. (local time), at the Dominican Hall, Siena Heights University, 1247 East Siena Heights Drive, Adrian, Michigan, or at any adjournment or adjournments thereof, for the purposes set forth in the accompanying Notice of Annual Meeting of Shareholders and in this Proxy Statement.
VOTING AT THE MEETING
This Proxy Statement has been mailed on or about March 18, 2003, to all holders of record of common stock of the Corporation as of the record date. The Board of Directors of the Corporation has fixed the close of business on March 7, 2003, as the record date for the determination of shareholders entitled to notice of and to vote at the Annual Meeting of Shareholders and any adjournment thereof.
The Corporation has only one class of capital stock authorized, which is common stock. As of the record date, there were 824,880 shares of common stock of the Corporation outstanding. Each outstanding share will entitle the holder thereof to one vote on each separate matter presented for vote at the meeting. Votes cast at the meeting and votessubmitted by proxy, are counted by the inspectors of the meeting, who are appointed by the Corporation.
If a Proxy in the enclosed form is properly executed and returned to the Corporation, the shares represented by the Proxy will be voted at the Annual Meeting and any adjournment thereof. If a shareholder specifies a choice, the Proxy will be voted as specified. If no choice is specified, the shares represented by the Proxy will be votedFOR the election of all of the nominees named in the Proxy Statement,FOR the proposal to approve the selection of the Corporation’s auditors for the 2003 fiscal year andAGAINST the shareholder proposal to require the Corporation’s Board of Directors to consider restrictions on certain incentive based compensation, all as set forth in this Proxy Statement, and in accordance with the judgment of the persons named as proxies with respect to any other matter which may come before the meeting. A proxy may be revoked before exercise by notifying the Secretary of the Corporation in writing or in open meeting, by submitting a proxy of a later date, or attending the meeting and voting in person. All shareholders are encouraged to date and sign the enclosed proxy form, indicate your choice with respect to the matters to be voted upon, and return it to the Corporation.
ELECTION OF DIRECTORS
The Articles of Incorporation of the Corporation authorize the Board of Directors to establish the size of the Board. The Board of Directors has established the size of the Board for 2003 at seven (7) persons. The Articles of Incorporation also provide for the division of the Board of Directors into three (3) classes of nearly equal size with staggered 3-year terms of office. Two people have been nominated by the Board of Directors for election to the Board to serve a three-year term expiring at the 2006 Annual Meeting of Shareholders. The Board has nominated J. David Stutzman and Edward J. Engle, Jr., each for a 3-year term. Each nominee is an incumbent director previously elected by the Corporation’s shareholders.
Unless otherwise directed by a shareholder’s proxy, the persons named as proxy holders in the accompanying proxy will vote for the nominees named above. In the event any of such nominees shall become unavailable, which is not anticipated, the Board of Directors in its discretion may designate substitute nominees, in which event the enclosed proxy will be voted for such substitute nominees. Proxies cannot be voted for a greater number of persons than the number of nominees named.
Except for those persons nominated by the Board of Directors, no other persons may be nominated for election at the 2003 annual meeting. The Corporation’s Bylaws require at least 60 days prior written notice of any other proposed shareholder nomination and no such notice has been received.
A plurality of the votes cast at the meeting is required to elect the nominees as directors of the Corporation. As such, individuals who receive the largest number of votes cast at the meeting will be elected as directors. Shares not voted at the meeting, whether by abstention, broker nonvote, or otherwise, will not be treated as votes cast at the meeting.
The Board of Directors recommends a vote FOR the election of all the persons nominated by the Board.
-2-
RELATIONSHIP WITH AND APPROVAL OF INDEPENDENT CERTIFIED PUBLIC ACCOUNTANTS
The financial statements of the Corporation for the year ended December 31, 2002, have been examined by Crowe, Chizek and Company LLP, certified public accountants, as independent auditors of the Corporation for the 2002 fiscal year. No representative of Crowe, Chizek and Company LLP is expected to be at the annual meeting of shareholders. Crowe, Chizek and Company LLP has been the Corporation’s auditor for many years and has been reappointed by the Audit Committee of the Board of Directors as the independent public accountant for the Corporation and its subsidiaries for the year ending December 31, 2003.
Although the submission of this matter for approval by shareholders is not legally required, The Board of Directors believes that such submission follows sound corporate business practice and is in the best interests of the shareholders. If the shareholders do not approve the selection of Crowe, Chizek and Company LLP, the selection of such firm as independent auditors for the Corporation will be reconsidered by the Board of Directors.
Audit Fees
Aggregate fees billed by Crowe, Chizek and Company LLP for professional services rendered for the audit of the Corporation’s annual consolidated financial statements and related services with respect to the annual report on Form 10-K and review of quarterly reports on Form 10-Q for the year ended December 31, 2002, were $71,600.
Financial Information System Design and Implementation Fees
No professional services were rendered by Crowe, Chizek and Company LLP for the year ended December 31, 2002, with respect to, directly or indirectly, operating, or supervising the operation of, the Corporation’s information systems or managing the Corporation’s local area network or designing or implementing a hardware or software system that aggregates source data underlying the financial statements or generates information that is significant to the Corporation’s financial statements taken as a whole.
All Other Fees
The aggregate fees billed for services rendered by Crowe, Chizek and Company LLP for services not covered under the two preceding captions for the year ended December 31, 2002 totaled $71,500.
The Corporation’s Audit Committee has concluded that the provision of services covered under the captions Financial Information System Design and Implementation Fees and All Other Fees is compatible with Crowe, Chizek and Company LLP maintaining their independence. None of the hours expended by Crowe, Chizek and Company, LLP’s engagement to audit the Corporation’s consolidated financial statements for the year ended December 31, 2002, were attributed to work performed by persons other than Crowe, Chizek and Company, LLP’s full-time, permanent employees.
Vote Required For Approval
The affirmative vote of a majority of the Corporation’s common stock voted at the annual meeting, in person or by proxy, is required to approve the selection of Crowe, Chizek and Company LLP as auditors for 2003. Shares not voted at the meeting, whether by abstention, broker non-vote or otherwise, will not be treated as votes cast at the meeting. Unless otherwise directed by marking the accompanying proxy, the proxy holder named therein will vote for the approval of Crowe, Chizek and Company LLP as the Corporation’s auditors.
The Board of Directors recommends a vote FOR approval of the selection of Crowe, Chizek and Company LLP as the Corporation’s auditors for 2003.
-3-
SHAREHOLDER PROPOSAL TO REQUIRE THE CORPORATION’S
BOARD OF DIRECTORS TO CONSIDER RESTRICTIONS ON CERTAIN
INCENTIVE BASED COMPENSATION
A certain record holder of the Corporation’s common stock has given notice that he, or his legal representative, intends to present the following resolution at the Corporation’s Annual Meeting being held on April 17, 2003. The name and address of the shareholder proposing the following resolution may be obtained from the Corporation by any of the Corporation’s shareholders providing the Corporation with a written or oral request for such information. In accordance with applicable proxy regulations, the proposed resolution and supporting statement, for which neither the Corporation nor the Corporation’s Board of Directors takes any responsibility, are set forth below. Approval of this proposal would require the affirmative vote of a majority of the Corporation’s outstanding shares present in person or by proxy and entitled to vote at the Corporation’s Annual Meeting on April 17, 2003.
The Board of Directors strongly and unanimously recommends a vote AGAINST this shareholder proposal.
Stock Option-Bonus-Restricted Share Resolution
Resolved “that as soon as possible, and in conformity with contractual obligations, that the board of directors will take under consideration that all members of top corporate management listed in the proxy statement as the Pavilion Bancorp, Inc. chief executive officer and chief financial officer no longer be remunerated with stock options, bonuses or restricted shares without a favorable vote of the majority of the shareholders.”
Supporting Statement
The major rational[sic] for offering stock options and bonuses to management is that they provide a major incentive for management to insure corporate profitability. These forms of management compensation are designed as rewards for achievement in corporate profitability and long term growth. I believe that in many instances bonuses, options and restricted shares are given for corporate performances which range from poor, mediocre, to adequate profitability.
However, the essential thrust of this resolution is that those members of management that hold a significant share of corporate assets should NOT require additional monetary incentives as motivators to insure corporate profitability. Any reasonable individual would understand that growth and corporate profitability would directly accrue to the shareholders including the executives indicated in the resolution above. How many more motivators do they require?
These unnecessary incentives become a raid on corporate assets and hardly meet the standards of reasonableness and fairness. I believe that compensation of this type is hardly a rationale for inducing higher levels of performance of management.
There is no clear correlation between corporate performance and the granting of stock options, bonuses and restricted shares.
A 30% LOSS in shareholder value was experienced by shareholders during the last two years. Yet bonuses and stock options continued to be given to bank officers.
It has taken over 8 years for shareholder value, as measured by split-adjusted price per share, to increase 72%. That is a compounded annual increase of just 7%.
I believe those members of management who are supremely confident in their abilities to expand corporate profitability and desire greater shares in its success are always free to buy stock on the open market, taking the same risks as the common shareholder.
November 14, 2002
-4-
Board of Directors’ Response in Opposition
The Board of Directors strongly and unanimously recommends a voteAGAINST the above shareholder proposal for the following reasons: (i) the Board of Directors is already firmly committed to maximizing shareholder value and makes all of its decisions with its fiduciary duties to the Corporation’s shareholders in mind; (ii) the shareholders already approved the Corporation’s 2001 stock option plan at the Corporation’s annual meeting held on April 18, 2001; (iii) the Board of Directors believes that current bonuses and incentives offered to the Corporation’s Chief Executive Officer and Chief Financial Officer are well in line with incentive compensation paid to management of comparable financial institutions; (iv) the Board of Directors believes there is strong empirical evidence that granting such incentives allows the Corporation to attract and retain talented management, which in turn assists in improved corporate performance; and (v) the shareholder’s references to the value of the Corporation’s stock are, at least misleading.
The Shareholder proposal requires that the Board of Directors take under consideration that the Corporation’s Chief Executive Officer and Chief Financial Officer no longer be remunerated with stock options, bonuses or restricted shares without a favorable vote of the majority of the shareholders. Without formally adopting this resolution, but with its firm commitment to maximizing shareholder value in mind, the Board of Directors has already taken into consideration whether or not it should seek such a favorable vote and has determined that it is not in the best interests of the Corporation or its shareholders to do so. The Corporation’s Compensation Committee oversees all the Corporation’s executive compensation programs. As explained in the Compensation Committee’s report beginning on page 11, the goals of the Corporation’s executive compensation programs are to attract, retain and motivate qualified executive officers, align executive compensation with shareholder interests, and link pay to corporation and individual performance.
Furthermore, at the Corporation’s 2001 Annual Meeting, shareholders already voted to approve the Corporation’s 2001 Stock Option Plan which granted the Board of Directors the ability to grant stock options to, among others, the Corporation’s Chief Executive Officer and Chief Financial Officer. Re-addressing this particular issue each time the Board of Directors seeks to exercise authority already granted to it would be redundant and expensive, as it would require the Corporation to produce materials to solicit shareholder approval of an action the shareholders have previously approved.
The Board of Directors believes that current bonuses and incentives offered to the Corporation’s Chief Executive Officer and Chief Financial Officer are well in line with incentive compensation paid to management of comparable financial institutions. As stated in the Compensation Committee’s report beginning on page 11, information and compensation levels of other institutions is obtained from compensation surveys published by the Michigan Bankers Association, the Bank Administration Institute, and other similar sources. Annual cash bonuses are based on discretionary evaluations of the performance of the Corporation and the subsidiary bank served by the officer. Bonuses also take into account recognition of specific personal achievements of the individual officers and operating results of the Corporation. The Corporation’s policy is to set salaries at levels that would be competitive with other comparable financial institutions in order to enable the Corporation to retain and, when needed, attract qualified executive officers. Further restricting the Board of Directors ability to address executive compensation requirements could have serious detrimental effects in retaining and, if necessary, attracting qualified executive officers. Indeed, the Corporation is currently conducting a search for an executive officer that could be detrimentally affected if the Board of Directors ability to address executive compensation issues with potential candidates is restricted. For example, if the Board of Directors were required to consider seeking shareholder approval for incentive packages offered to potential executive officers, highly sought-after executives could choose to pursue other career opportunities, including with competitors, due to the time consuming nature of obtaining shareholder approval. Also, practically speaking, employment agreement negotiations often require confidentiality, because potential candidates do not want their current employers to know of their job negotiations and the Corporation does not want competitors to know who the Corporation is pursuing or how much it is proposing to offer.
While the Corporation’s stock price has declined, it is performing well in comparison to similarly situated institutions as shown in the Shareholder Return Performance Graph contained on page 16 of this proxy statement. Indeed, using published market prices, the reference to a compound annual increase of “just 7%” is misleading given that during the eight-year period from December 1994 until year-end 2002, the actual yield if dividend payments are included, is 12.2%. The S&P 500 yielded only 7.73% over the same eight-year period. Also, simple variation in price to year-end 2002 was a 9.97 % capital appreciation only rate, not “just 7%.”
-5-
Over the past few years, the number of brokers that trade in the Corporation’s stock and the amount of trading of the stock have increased, resulting in the stock being more marketable than it has been historically.
The Board of Directors is sympathetic to shareholder concerns regarding executive compensation, but believes specific resolutions, such as the above shareholder resolution, are often flawed in their drafting or too impractical to implement. As stated above, the Board of Directors believes that the time, effort and expense necessary to complete the special review and produce materials for shareholder review would be impractical and expensive. Furthermore, it should be noted that the above shareholder proposal, if successful, merely requires the Corporation’s Board of Directors to take under “consideration” that the Chief Executive Officer and Chief Financial Officer no longer be remunerated with stock options, bonuses or restricted shares without a favorable vote of the majority of the shareholders. As stated above, the Board of Directors has already taken this under consideration and failed to find any merit in the above shareholder proposal.
The affirmative vote of a majority of the Corporation’s common stock voted at the annual meeting, in person or by proxy, is required to approve the above shareholder proposal. Shares not voted at the meeting, whether by abstention, broker non-vote or otherwise, will not be treated as votes cast at the meeting. Unless otherwise directed by marking the accompanying proxy, the proxy holder named therein will vote against the approval of the above shareholder proposal.
The Board of Directors unanimously recommends a vote AGAINST the shareholder proposal to require the Corporation’s Board of Directors to consider restrictions on certain incentive based compensation.
-6-
VOTING SECURITIES AND BENEFICIAL OWNERSHIP
BY MANAGEMENT AND OTHERS
At March 7, 2003, the Corporation had outstanding 824,880 shares of common stock. Shareholders are entitled to one vote for each full share of common stock registered in their names at the close of business on March 7, 2003, the record date fixed by the Board of Directors. Votes cast at the meeting, and votessubmitted by proxy, are counted by the inspectors of the meeting, who are appointed by the Corporation.
As of March 7, 2003, no person was known by management to be the beneficial owner of more than 5% of the outstanding common stock of the Company except as follows:
| Name and Address of Beneficial Owner | Amount and Nature of Beneficial Ownership(1)(5)(6) | Approximate Percent of Class(2) |
| Douglas L. Kapnick 159 North Scott Street Adrian, MI 49221 | 89,872(3) | 10.8% |
| HOLDON (ESOP/401(k) Trust)(4) 135 East Maumee Street Adrian, MI 49221 | 78,103 | 9.4% |
The information in the following table sets forth the beneficial ownership of the Corporation’s common stock by each of the Corporation’s directors and each of the executive officers listed in the Summary Compensation Table presented later and by all directors and executive officers as a group.
| Number of Shares Beneficially Owned(1)(5)(6) | Percent of Class(2) | |
| Douglas L. Kapnick (Director & Interim Executive Officer) | 89,872 | 10.8% |
| Allan F. Brittain (Director & Executive Officer) | 34,715 | 4.2% |
| Fred R. Duncan (Director) | 22,733(7) | 2.7% |
| Edward J. Engle, Jr. (Director) | 5,176 | * |
| William R. Gentner (Director) | 6,237 | * |
| Emory M. Schmidt (Director) | 3,472 | * |
| J. David Stutzman (Director) | 5,136 | * |
| Patrick K. Gill (Former Director & Former Executive Officer)(8) | 4,274(9) | * |
| Loren V. Happel (Executive Officer) | 668 | * |
| Pamela S. Fisher (Executive Officer) | 4,011 | * |
| All Directors and Executive Officers as a Group (10 persons) | 176,294 | 21.3% |
| *Less than 1% |
| (1) | The number of shares stated are, except as described in these notes, based on information furnished by each person listed and includes shares personally owned of record by that person and shares which under applicable regulations are deemed to be otherwise beneficially owned by that person. Under these regulations, a beneficial owner of a security includes any person who, directly or indirectly, through any contract, arrangement, understanding, relationship, or otherwise, has or shares voting power or investment power with respect to the security. Voting power includes the power to vote or to direct the voting of the security. Investment power includes the power to dispose or to direct the disposition of the security. A person is also considered the beneficial owner of a security if the person has a right to acquire beneficial ownership of the security within sixty (60) days. |
| (2) | Calculated based on shares outstanding plus shares subject to stock options held by any individual listed which are exercisable within sixty (60) days. |
-7-
| (3) | Includes shares as to which the indicated person is legally entitled to share voting or investment power by reason of joint ownership, trust, or other contract or property right, and shares held by spouses and children over whom the indicated person may have substantial influence by reason of the relationship. |
| (4) | Loren V. Happel, and Pamela S. Fisher, officers of the Corporation, are members of the Pension/ESOP/401(k) Committee (“ESOP Committee”) of the Corporation. Sky Financial is the trustee of the ESOP Trust, which holds shares of the Corporation for the ESOP. The trustee has voting and limited investment power over the shares held by the ESOP Trust which have not been allocated to an individual account, if any, and limited investment power over shares which have been allocated to an individual account. The ESOP Committee has the power to direct the trustee as to the voting of the shares held by the ESOP Trust that have not been allocated to an individual account, if any. Each of the members of the ESOP Committee disclaims beneficial ownership of shares held by the ESOP (except shares allocated to the person’s individual account under the ESOP), and the ESOP shares are not reported as beneficially owned by the members of the ESOP Committee as individuals unless the shares have been allocated to the person’s individual account under the ESOP. |
| (5) | Includes shares allocated to individual accounts under the ESOP. |
| (6) | Shares that may be acquired pursuant to stock options are included in the table for stock options that are exercisable within sixty (60) days. The number of shares subject to such options for the individuals are as follows: Allan F. Brittain: 3,644; Fred R. Duncan: 3,144; Edward J. Engle, Jr.: 3,144; William R. Gentner: 1,884; Douglas L. Kapnick: 3,144; Emory M. Schmidt: 3,144; J. David Stutzman: 3,144; and Patrick K. Gill: -0-. |
| (7) | Includes 1,077 shares held in trust by an adult child for the benefit of Mr. Duncan’s wife. Mr. Duncan disclaims beneficial ownership of those shares. |
| (8) | Mr. Gill resigned as Director and President/CEO of both the Corporation and the Bank of Lenawee as of October 31, 2002. |
| (9) | Includes 1,100 shares owned by a church as to which Mr. Gill served as trustee by virtue of his position with the Bank of Lenawee. Mr. Gill disclaimed any beneficial interest in those shares. |
INFORMATION ABOUT DIRECTORS AND DIRECTOR NOMINEES
The following information relating to the principal occupation or employment has been furnished to the Corporation by the respective directors and director nominees. Each of those persons has been engaged in the occupations stated below for more than 5 years and each of them serves as a director of the Bank of Lenawee.
Nominees for Election as Directors for Terms Expiring in 2006
J. David Stutzman (Director since 1993)
David Stutzman, 57, is a Member of Raymond & Stutzman LLC, which is a beef feeding and crop farming operation in Seneca, Michigan. Mr. Stutzman serves on the Audit, Loan Review and Compliance Committee of the Corporation and is a member of the Executive Committee and Loan Committee of the Bank of Lenawee. He also serves as a Board member of the Lenawee United Way, is an Advisory Board member of the Producer’s Livestock Association, is a past board member of Morenci Area Schools and currently serves on various boards for the First Congregational Church. Mr. Stutzman resides in Seneca, Michigan.
Edward J. Engle, Jr. (Director since 1986)
Edward Engle, 60, is President of Rima Manufacturing, a precision machined products company in Hudson, Michigan. He is Chairman of the Audit, Loan Review and Compliance Committee of Pavilion Bancorp; and serves on the Executive and Loan Committees of the Bank of Lenawee. Mr. Engle is a graduate of DePauw University and Toledo University. Mr. Engle resides in Hudson, Michigan.
Directors Whose Terms Expire in 2005
Allan F. Brittain (Director since 1976)
Allan Brittain, 65, is Chairman of the Board of the Bank of Lenawee. Mr. Brittain serves on the Executive Committee, Pension, ESOP/401(k) Administrative Committee and the Compensation Committee of the Corporation. He is a member of the Executive Committee and Asset/Liability Committee of the Bank of Lenawee. He also serves on the Board of Bank of Washtenaw and is a member of its Loan Committee. He is also a member of the Board of Trustees for Siena Heights University, and a Board member of the Adrian Public Schools Educational Foundation. Mr. Brittain began his career at the Bank in March of 1963 where he was employed continuously as a full-time employee until his retirement from full-time employment as the Bank’s Chief Executive Officer on December 31, 1997. He resides in Adrian, Michigan.
-8-
William R. Gentner (Director since 1997)
William Gentner, 66, is Owner and President of Gentner Inc. located in Saline, Michigan, which he founded in Brooklyn, Michigan in 1957. Gentner Inc. is a material supplier consisting of four transportation companies. It has 70 employees and nearly 50 Michigan Gravel Trains. Mr. Gentner serves on the Audit, Loan Review and Compliance Committee of the Corporation and the Asset/Liability Committee of the Bank of Lenawee. He presently serves on the Board of Bank of Washtenaw and is a member of its Asset/Liability Committee. He is also the President of the Michigan Aggregate Carriers Trucking Association. Mr. Gentner resides in Saline, Michigan.
Douglas L. Kapnick (Director since 1982)
Douglas Kapnick, 59, is President of Kapnick & Company. Kapnick & Company is a full service insurance broker with offices in Adrian, Ann Arbor and Southfield with 125 employees. Mr. Kapnick is Chairperson of the Pavilion Bancorp and serves on the Executive Committee and the Compensation Committee of the Corporation. He is on the Board of the Bank of Lenawee and serves on the Loan Committee and the Executive Committee of that bank. Mr. Kapnick is on the Board of the Bank of Washtenaw and is a member of the Executive Committee and Loan Committee of that bank. He also is a member of the Board of Trustees for Siena Heights University and serves as their Chairperson of the board. He is a director of the Emma L. Bixby Medical Center and a Board member of the Greater Adrian Industrial Development Corporation. He is a past recipient of the Lenawee Maple Leaf Award. Mr. Kapnick resides in Adrian, Michigan.
Directors Whose Terms Expire in 2004
Fred R. Duncan (Director since 1984)
Fred Duncan, 61, is the former owner of the Metamora Elevator (grain elevator business). He serves on the Executive Committee and Finance Committee of the Corporation and the Loan Committee of the Bank of Lenawee. He is also a youth camp counselor and mission team leader. Mr. Duncan resides in Shelby, Michigan.
Emory M. Schmidt (Director since 1994)
Emory Schmidt, 59, is Vice President of Brazeway, Inc. Brazeway is a world-wide leader of extruded aluminum tubing and heat transfer components with facilities in the U.S., Latin America, Europe and Asia. Mr. Schmidt serves as Chairman of the Executive Committee and also serves on the Finance Committee and the Compensation Committee of the Corporation. He also serves as Chairman of the Executive Committee of the Bank of Lenawee and is a member of its Asset/Liability Committee. He also serves as an Executive Committee Member of Lenawee Health Alliance, Chairman of the ProMedica Physicians Corporation and is a trustee of the ProMedica Health Systems Mr. Schmidt resides in Adrian, Michigan.
Director Compensation
Directors of the Corporation are not paid an annual retainer. Directors of the Bank of Lenawee and Bank of Washtenaw are paid an annual retainer fee of $600 ($5,400 to the Chairman of the Bank of Lenawee). Compensation is also paid for attendance at Corporation Board meetings ($250 each meeting) and Bank of Lenawee Board and Bank of Washtenaw Board meetings ($250 each meeting), and all committee meetings ($200 each meeting). Discretionary bonuses in the form of stock options were paid as listed below for the years ended December 31, 2002, 2001, and 2000 respectively. During 2002, the Board of Directors of the Corporation and the Banks held a total of 32 regular meetings. Various committees of the Boards held meetings as needed. Each Director attended at least 75% of the total number of meetings of the Boards of Directors and meetings of committees on which they served.
Mr. Brittain, Chairman of the Board of Directors of the Bank of Lenawee, and the Bank were parties to a consulting agreement under which he was paid an annual consulting fee of $50,000. The consulting agreement expired at the end of May, 2002. They are also parties to a supplemental retirement agreement, which provides for a supplemental retirement benefit for Mr. Brittain. The benefit under the agreement is equal to the difference between the benefit Mr. Brittain would have received under the Bank’s Retirement Plan if he had retired at age 65 (normal retirement age) rather than age 60 when he actually retired. His right to the supplemental benefits vested over a five- year period that ended December 31, 2002. The amount of the supplemental benefit is $532 per month.
-9-
Effective February 1, 2001, the Corporation adopted a Stock Option Plan for directors and executive officers. The plan was approved by the Corporation’s shareholders on April 18, 2001, and will terminate January 31, 2006. The plan provides for granting of options covering a total of up to 50,000 shares of the Corporation’s common stock. The plan provides for the grant each year to each director not actively employed by the Corporation or a Bank subsidiary, as of the effective date of the plan, of options covering 500 shares of common stock. The President of each Bank subsidiary and other individuals are entitled to receive options covering a number of shares determined by a committee of directors who are not employees of a Bank subsidiary or the Corporation. Options granted under the plan, vest at the rate of 20% at each anniversary of the option grant date. Vesting is accelerated upon the Optionee’s attainment of age 62, in the event of a change of control of the Corporation, the death of the Optionee or the Optionee’s total disability. A similar stock option plan was in effect from January 1, 1996 until January 18, 2001. The option price under all options granted to date has been the most recent independent appraised price for purposes of the Bank’s Employee Stock Ownership Plan. The term of each Option is established by the committee but may not exceed ten years from the date of grant.
Stock Options granted to directors:
| 2002 | 2001 | 2000 |
| Each Outside Director: 500 | Each Outside Director: 500 | Each Outside Director: 660 |
| Chairman: 500 | Chairman: 500 | Chairman: 660 |
| CEO: 400 | CEO: 400 | CEO: 440 |
| Exercise Price - ALL OPTIONS - $51.50 Per Share | Exercise Price - ALL OPTIONS - $51.00 Per Share | Exercise Price - ALL OPTIONS - $44.00 Per Share |
| (NOTE: All amounts shown have been adjusted for stock splits.) |
AUDIT COMMITTEE
The Audit Committee, comprised of four non-employee directors, met on four occasions during 2002. Each of the members of the Audit Committee is independent as defined in Rule 4200(a) of the NASD Listing Standards. Primary duties and responsibilities of the Audit Committee include annually recommending to the Board of Directors an independent public accounting firm to be appointed auditors of the Corporation and the Banks, reviewing the scope and fees for the audit, reviewing all the reports received from the independent certified public accountants, and coordinating matters with the internal auditing function. The Board of Directors has not adopted an Audit Committee Charter. On February 21, 2003, the Audit Committee submitted to the Board the following report.
Audit Committee Report
We have reviewed and discussed with management the Corporation’s audited financial statements as of and for the year ended December 31, 2002.
We have discussed with the independent auditors the matters required to be discussed by Statement on Auditing Standards No. 61, Communication with Audit Committees, as amended, by the Auditing Standards Board of the American Institute of Certified Public Accountants.
We have received and reviewed the written disclosures and the letter from the independent auditors, as required by Independence Standard No. 1, Independence Discussions with Audit Committees, as amended, by the Independence Standards Board, and have discussed with the auditors the auditors’ independence.
Based on the reviews and discussions referred to above, we recommend to the Board of Directors that the financial statements referred to above be included in the Corporation’s Form 10-K for the year ended December 31, 2002.
Respectfully submitted, Edward J. Engle, Jr., William R. Gentner, and J. David Stutzman.
-10-
COMPENSATION OF EXECUTIVE OFFICERS
Committee Report on Executive Compensation
All of the executive officers of the Corporation are also officers of one or more of the Corporation’s subsidiary banks. They serve as officers of the Corporation as an incident to their primary service as an officer and employee of a subsidiary bank and receive no compensation directly from the Corporation. Although there is a great deal of communication between the Board of Directors of the Corporation and the Boards of Directors of the subsidiary banks, the Boards of Directors of the subsidiary banks retain authority and responsibility for setting compensation for their own officers, including those officers who also serve as officers of the Corporation.
The Executive Committee of the Corporation serves as a Compensation Committee with respect to the Chief Executive Officer’s (“CEO”) compensation, with the CEO excluded from decisions with respect to his own compensation. The Board of Directors of the Corporation, except the CEO, serves as a committee to administer the Stock Option Plans of the Corporation. The Corporation’s Board of Directors has responsibility for establishing the formal Employee Benefit Plans, which are available to the employees of the subsidiary banks. These plans currently include a Defined Benefit Pension Plan, Qualified Employee Stock Ownership and 401(k) Plan, and the 2001 Stock Option Plan. The Board of Directors of the Corporation reviews the compensation to be paid to executive officers of the subsidiary banksand who also serve as officers of the Corporation. Recommendation and formal authorization of the compensation of subsidiary bank executive officers is, however, the role of the Board of Directors of the subsidiary banks.
All executive officers receive a salary and, if net income is satisfactory, an annual cash bonus. It is the policy of the Corporation and the subsidiary banks to set salaries at levels that will be competitive with other comparable financial institutions in order to enable the Corporation and the subsidiary banks to retain and, when needed, attract qualified executive officers. Information on compensation levels of other institutions is obtained from compensation surveys published by the Michigan Bankers Association, the Bank Administration Institute and from other similar sources. In setting salaries, the Corporation and the subsidiary banks also seek to assure relative fairness in the compensation of officers and to recognize the value of the contribution that each makes to the Corporation’s success. Annual cash bonuses are based on a discretionary evaluation of the performance of the Corporation and the subsidiary bank served by the officer. Bonuses also take into account recognition of specific personal achievements of the individual officers.
During 2002, stock options to purchase 400 shares were granted to Mr. Gill, the Corporation’s former President who also served as President of Bank of Lenawee. Stock options to purchase 300 shares were also granted to the President of Bank of Washtenaw. No stock options were granted to any other executives. The number of shares subject to each option was based upon the position and discretionary assessment of the performance of each grantee. The options awarded in 2002 vest at the rate of 20% each year.
The Corporation generally maintains a conservative level of perquisites and personal benefits. The dollar value of perquisites and personal benefits provided to each executive officer does not exceed $50,000 or 10% of such executive officer’s annual salary and bonus.
The salary and bonus of Patrick K. Gill, the former President and Chief Executive Officer of the Corporation and the Bank of Lenawee, was recommended by the Executive Committee of the Bank of Lenawee and approved by the Boards of Directors of the Corporation and the Bank of Lenawee. In recommending and approving Mr. Gill’s salary, the Committee and the Boards considered a survey of compensation paid to executive officers by Michigan financial institutions of more or less comparable size. Mr. Gill’s salary, bonus and stock option awards were also based on a discretionary evaluation of Mr. Gill’s personal performance and the operating results of the Corporation and the Bank of Lenawee. For this purpose, the Committee and the Board of Directors focused on the earnings of the Corporation and the Bank of Lenawee in the year just completed, the quality and productivity of the management team, reductions in administrative staffing, and continuing improvements made in loan quality, loans and loan allowance management, and loan documentation and procedures.
Respectfully submitted, Allan F. Brittain (member Executive and Compensation Committees), Douglas L. Kapnick (member Executive and Compensation Committees), Emory M. Schmidt (member Executive and Compensation Committees), Pamela S. Fisher (member Compensation Committee) and Walter G. Byers (member Compensation Committee).
-11-
COMPENSATION COMMITTEE INTERLOCKS AND INSIDER TRANSACTIONS
The members of the Compensation Committee are set forth in the preceding section. Allan F. Brittain, who retired in 1997, was formerly the President and CEO of the Corporation and Bank of Lenawee. Douglas L. Kapnick is currently serving as the interim President and CEO of the Corporation and of the Bank of Lenawee. Pamela S. Fisher is the Secretary of the Corporation and the Chief Operating Officer of Bank of Lenawee. Walter B. Byers is the President and CEO of the Bank of Washtenaw.
EXECUTIVE COMPENSATION SUMMARY
The following table sets forth the compensation paid by the Bank of Lenawee during the last three years to its Chief Executive Officer, Chief Financial Officer, and Corporate Secretary. There are no employees of the Corporation. All are employed by either the Bank of Lenawee or the Bank of Washtenaw. No other executive officers of the Corporation received annual compensation in excess of $100,000 during this period.
                                                        Annual Compensation
                                                        -------------------

                                                                                                   All Other
                                                                                                   ---------
      Name and Principal Position            Year            Salary             Bonus            Compensation
      ---------------------------            ----            ------             -----            ------------

Patrick K. Gill, President/CEO(1)            2002          $106,162           $77,252             $45,853(2)
                                             2001          $165,101           $50,846             $79,594(2)
                                             2000           150,500            77,282              70,633(2)

Douglas L. Kapnick, Interim
President/CEO(3)                             2002            $00.00            $00.00                 $00.00

Loren V. Happel, CFO                         2002           $91,377           $20,624                    N/A
                                             2001           $87,240           $13,852                    N/A
                                             2000            82,000            23,900

Pamela S. Fisher, Corp. Sec.                 2002           $93,893           $24,069                    N/A
                                             2001           $89,140           $14,318                    N/A
| (1) | Mr. Gill resigned as Director and President/CEO of both the Corporation and the Bank of Lenawee as of October 31, 2002. |
| (2) | Includes the- gain realized upon exercise of 2,024 shares available in Mr. Gill’s stock options which he exercised after he left the employment of the Bank, and the use of a Company vehicle. Share grants were -0- in 2002 and 1,000 in 2001 and 2000. |
| (3) | Mr. Kapnick was elected Interim President/CEO of the Company and Bank of Lenawee on October 17, 2002. |
-12-
The Corporation maintains a defined benefit pension plan for substantially all employees. The Corporation also maintains an Employee Stock Ownership and 401(k) plan covering substantially all employees.
EXECUTIVE OPTION GRANTS IN LAST FISCAL YEAR
                                       Percent of
                                          Total
                        Number of        Options
                          Shares       Granted to                                      Potential Realizable Value at
                        Underlying      Employees                                      Assumed Annual Rates of Stock
                         Options        in Fiscal     Exercise     Expiration      Price Appreciation for Option Term(2)
                         Granted          Year          Price         Date               5%                    10%
                         -------          ----          -----         ----               --                    ---

Patrick K. Gill            400             57%        $51.50(1)       2012             $10,874               $29,400
| (1) | Appraised value in the most recent independent appraisal performed for purposes of the Bank’s Employee Stock Ownership Plan. |
| (2) | Computed based on last sale price ($40.65 per share), during 2002, of which management is aware. |
YEAR END OPTION VALUES
                                                               Number of Shares Underlying        Value of Unexercised
                                                                 Unexercised Options at          In-the-Money Options at
                       Shares Acquired                              December 31, 2002             December 31, 2002(1)
        Name             On Exercise      Value Realized        Exercisable/Unexercisable       Exercisable/Unexercisable
        ----             -----------      --------------        -------------------------       -------------------------

Patrick K. Gill             2,024              $41,697                     -0-                             -0-
| (1) | Computed based on last sale price ($40.65 per share), during 2002, of which management is aware. |
-13-
DEFINED BENEFIT PENSION PLAN
The Plan formula provides a monthly life annuity, payable at Normal Retirement Age, equal to the sum of (a) and (b):
| (a) | For each year of Benefit Service from January 1, 1988 to December 31, 1991, 1% of Earnings plus 0.65% of Earnings in excess of $10,000. |
| (b) | For each year of Benefit Service after January 1, 1992, 1% of Earnings plus 0.65% of Earnings in excess of 50% of Social Security Covered Compensation. |
No more than 35 years of Benefit Service are counted.
The Earnings covered by the Plan include salary and bonus as reflected in the summary annual compensation table on page 12. Social Security Covered Compensation is defined as the average of the Social Security Maximum Taxable Wage Bases for the 35-year period ending with the year in which Social Security Retirement Age is attained. The Social Security Covered Compensation used in a given accrual year is the amount for an individual who reaches Social Security Retirement Age in that year.
Officers, or former officers, named in the summary annual compensation table have estimated accrued annual benefits (and accrued years of Benefit Service) payable at Normal Retirement Age from the Plan as follows: Patrick K. Gill — $22,963 (11 years); Douglas L. Kapnick — $0 (0 years); Loren V. Happel — $11,535 (8 years); and Pamela S. Fisher — $11,619 (15 years). These benefits are not subject to deduction for Social Security or any other offset amounts.
CERTAIN RELATIONSHIPS AND RELATED TRANSACTIONS
Certain directors and officers of the Corporation have had, and are expected to have in the future, loan and other extension of credit transactions with the subsidiary banks, or have been directors or officers of corporations, or members of partnerships, which have had and are expected to have in the future, such transactions with the subsidiary banks. All such transactions with officers and directors, either directly or indirectly, have been made in the ordinary course of business and on substantially the same terms, including interest rates and collateral, as those prevailing at the same time for comparable transactions with other customers, and these transactions do not involve more than the normal risk of collectability or present other unfavorable features. All such future transactions, including transactions with principal shareholders and other Corporation affiliates, will be made in the ordinary course of business, on terms no less favorable to the Corporation than with other customers, and will be subject to approval by a majority of the Corporation’s independent, outside disinterested directors.
The Corporation and the subsidiary banks purchase all of their insurance products through an insurance agency owned primarily by Mr. Kapnick, one of the directors. All insurance products are purchased at rates, which are believed to be competitive for the same or comparable insurance products that could be purchased through other agencies. Total premiums paid to Mr. Kapnick’s agency for one year of insurance coverage purchased by the Corporation and the subsidiary banks during 2002 were approximately $67,214. The Corporation and the subsidiary banks also purchase most of their office furniture through Today’s Office, a retail furniture franchise owned by Dr. Rupert, a former director who resigned in January, 2003. The furniture is purchased at prices that are competitive with other retail office furniture suppliers. Total invoices paid to Dr. Rupert’s store during 2002 were approximately $33,646.
-14-
SHAREHOLDER RETURN PERFORMANCE GRAPH
Set forth below is a line graph comparing the yearly percentage change in the cumulative total shareholder return on the Corporation’s common stock with that of the cumulative total return on the MG Group Index and the NASDAQ Stock Market Index for the five-year period ended December 31, 2002. The MG Group Index is an index composed of over 90 banks and bank holding companies located in the Midwest and published by Media General Financial Services. The following information is based on an investment of $100, on December 31, 1997, in the Corporation’s common stock, the MG Group Index, and the NASDAQ Stock Market Index, with dividends reinvested. There has been only limited trading in the Corporation’s common stock and the Corporation’s common stock does not trade on any stock exchange or on the NASDAQ market. Accordingly, the returns reflected in the following graph and table are based on sale prices of the Corporation’s stock of which management is aware. There may have been sales at higher or lower prices of which management is not aware.
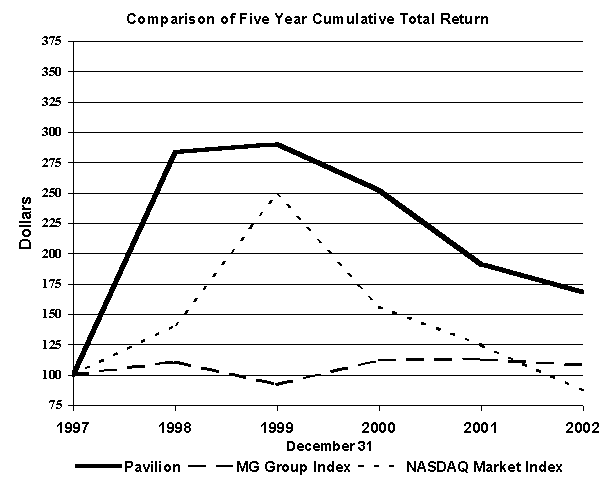 |
| 1997 | 1998 | 1999 | 2000 | 2001 | 2002 | |
| Pavilion Bancorp | 100.00 | 183.96 | 290.20 | 252.28 | 191.33 | 168.50 |
| MG Group Index | 100.00 | 110.94 | 92.07 | 112.11 | 113.07 | 108.21 |
| NASDAQ Market Index | 100.00 | 141.04 | 248.76 | 156.35 | 124.64 | 86.94 |
| Source: Media General Financial Services, Richmond, Virginia |
-15-
COMPLIANCE WITH SECTION 16 REPORTING
The rules of the Securities and Exchange Commission require that the Corporation disclose late filings of reports of stock ownership (and changes in stock ownership) by its directors, executive officers and beneficial owners of more than 10% of the Corporation’s common stock. Based solely on its review of the copies of such reports received by it, and written representations from certain reporting persons, the Corporation believes that during the year ended December 31, 2002, its directors, executive officers and beneficial owners of more than 10% of the Corporation’s common stock have complied with all filing requirements applicable to them.
SHAREHOLDER PROPOSALS
Any shareholder proposal to be considered by the Corporation for inclusion in the 2004 Annual Meeting of Shareholders proxy materials must be received by the Corporation no later than November 19, 2003. If a shareholder notifies the Corporation after 45 days before the first anniversary of the date on which this proxy statement is first mailed of an intent to present a proposal at the 2004 annual meeting of shareholders, the Corporation will have the right to exercise its discretionary voting authority with respect to such proposal without including information regarding such proposal in its proxy materials.
AVAILABILITY OF 10-K ANNUAL REPORT
An annual report on Form 10-K to the Securities and Exchange Commission for the year ended December 31, 2002, will be provided free to shareholders upon written request. Write to Pavilion Bancorp, Inc., Attention: Pamela S. Fisher, 135 East Maumee Street, Adrian, Michigan 49221. The Form 10-K and certain other periodic filings are filed with the Securities and Exchange Commission (the “SEC”). The SEC maintains an Internet web site that contains reports and other information regarding companies, including the Corporation, that file electronically. The SEC’s web site address is http:\\www.sec.gov.
MISCELLANEOUS
The management of the Corporation is not aware of any other matter to be presented for action at the meeting. However, if any such other matter is properly presented for action, it is the intention of the persons named in the accompanying form of proxy to vote thereon in accordance with their best judgment.
The cost of soliciting proxies in the accompanying forms will be borne by the Corporation. In addition to solicitation by mail, proxies may be solicited in person, or by telephone or telegraph, by some regular employees of the Corporation.
Shareholders are urged to sign and return the enclosed proxy in the enclosed envelope. A prompt response will be helpful and appreciated.
| BY ORDER OF THE BOARD OF DIRECTORS /s/ Pamela S. Fisher Pamela S. Fisher Secretary |
March 18, 2003
-16-
| Pavilion Bancorp, Inc. 135 East Maumee Street Adrian, Michigan 49221 | This Proxy is solicited on behalf of the Board of Directors |
PROXY
The undersigned holder of _________________ shares of capital stock of Pavilion Bancorp, Inc. hereby appoints Douglas L. Kapnick and Allan F. Brittain as Proxies, each with the power to appoint his substitute, and hereby authorizes them to represent and to vote, as designated below, all the shares of Common Stock of Pavilion Bancorp, Inc. held of record by the undersigned on March 7, 2003, at the annual meeting of shareholders to be held April 17, 2003, and at any adjournment thereof.
1. The election of two directors to be elected for terms expiring in 2006.
| [ ] FOR all nominees listed below (except as marked to the contrary below) | [ ] WITHHOLD AUTHORITY to vote for all nominees listed below |
| (INSTRUCTION: To withhold authority to vote for any individual nominee strike a line through the nominee's name in the list above.) |
J. David Stutzman - Edward J. Engle, Jr.
2. Proposal to approve the selection of the Corporation's auditors for the 2003 fiscal year.
| [ ] FOR | [ ] AGAINST | [ ] ABSTAIN |
3. Shareholders' proposal as described in the proxy statement.
| [ ] FOR | [ ] AGAINST | [ ] ABSTAIN |
4. In their discretion, the Proxies are authorized to vote upon such other business as may properly come before the meeting.
This Proxy, when properly executed, will be voted in the manner directed herein by the undersigned shareholder.If no direction is made, this Proxy will be voted FOR all nominees listed in Item 1, FOR the selection of the Corporation's auditors for the 2003 fiscal year in Item 2, and AGAINST the shareholders' proposal in Item 3.
Please sign exactly as name appears below. When shares are held by joint tenants, both should sign. When signing as attorney, executor, administrator, trustee or guardian, please give full title as such. If a corporation, please sign in full corporate name by president or other authorized officer. If a partnership or limited liability company, please sign in partnership or company name by authorized person.
| Signature | Signature if held jointly |
Dated:____________, 2002
PLEASE MARK, SIGN, DATE AND RETURN THE PROXY CARD PROMPTLY USING THE ENCLOSED ENVELOPE.
Lenawee Bancorp, Inc.
2002
Annual Report
This 2002 Annual Report contains audited financial statements and a detailed financial review. This is Pavilion Bancorp’s 2002 annual report to shareholders. Although attached to our proxy statement, this report is not part of our proxy statement, is not deemed to be soliciting material, and is not deemed to be filed with the Securities and Exchange Commission (the “SEC”) except to the extent that it is expressly incorporated by reference in a document filed with the SEC.
The 2002 Summary Annual Report to Shareholders accompanies this proxy statement. This report presents information concerning the business and financial results of Pavilion Bancorp in a format and level of detail that we believe shareholders will find useful and informative. Shareholder who would like to receive even more detailed information than that contained in this 2002 Annual Report are invited to request our Annual Report on Form 10-K.
Pavilion Bancorp, Inc.‘s Form 10-K Annual Report to the Securities and Exchange Commission will be provided to any shareholder without charge upon written request. Requests should be addressed toPavilion Bancorp, Inc., Attention: Pamela S. Fisher, 135 East Maumee Street, Adrian, Michigan 49221.
PAVILION BANCORP, INC.
CONSOLIDATED FINANCIAL STATEMENTS
December 31, 2002 and 2001
CONTENTS
| SELECTED FINANCIAL DATA............................................................................................................................ | 2 |
| MANAGEMENT'S DISCUSSION AND ANALYSIS............................................................................................ | 3 |
| MANAGEMENT'S RESPONSIBILITY FOR FINANCIAL REPORTING......................................................... | 16 |
| REPORT OF INDEPENDENT AUDITORS......................................................................................................... | 17 |
| CONSOLIDATED FINANCIAL STATEMENTS | |
| CONSOLIDATED BALANCE SHEETS.......................................................................................................... | 18 |
| CONSOLIDATED STATEMENTS OF INCOME.......................................................................................... | 19 |
| CONSOLIDATED STATEMENTS OF CHANGES IN SHAREHOLDERS' EQUITY................................. | 20 |
| CONSOLIDATED STATEMENTS OF CASH FLOWS................................................................................. | 21 |
| NOTES TO CONSOLIDATED FINANCIAL STATEMENTS...................................................................... | 22 |
| COMMON STOCK INFORMATION................................................................................................................. | 43 |
SELECTED FINANCIAL DATA
(In thousands, except per share data)
                                                            2002        2001        2000        1999        1998
For the Year:
Total interest income                                     $ 19,182    $ 21,012    $ 20,851    $  17,923   $  17,517
Total interest expense                                       6,029       8,198       8,710        6,312       7,205
Net interest income                                         13,153      12,814      12,141       11,611      10,312
Provision for loan losses                                      953         388          30        2,560         239
Noninterest income                                           5,975       4,151       2,064        2,237       2,850
Noninterest expense                                         13,993      12,182       9,414        8,994       8,913
Income before income taxes                                   4,182       4,395       4,761        2,294       4,010
Net income                                                   2,855       3,043       3,205        1,563       2,660

Per Share Data:
Basic earnings per share                                  $   3.39    $   3.58    $   3.75    $    1.83   $    3.13
Diluted earnings per share                                    3.37        3.54        3.71         1.83        3.12
Cash dividends declared per share                              .86         .80         .94          .75         .67
Shareholders' equity and net ESOP obligation per share       35.09       33.01       29.91        26.72       26.26
Shareholders' equity per share                               30.16       27.77       23.90        21.64       21.92

At Year-End:
Total assets                                              $287,286    $278,277    $259,747    $ 239,904   $ 220,414
Loans receivable                                           235,770     214,749     214,512      197,308     158,487
Allowance for loan losses                                    2,660       2,200       2,287        4,646       2,182
Deposits                                                   241,720     235,407     224,143      199,206     185,891
Borrowed funds                                               8,635       7,394       7,936       16,177      10,626
Shareholders' equity and net ESOP obligations               29,170      28,007      25,467       22,775      22,345
Shareholders' equity                                        25,059      23,563      20,353       18,449      18,648

Financial:
Net interest income to average earning assets                  5.12%       5.09%       5.26%       5.66%       5.07%
Return on average shareholders' equity and
  net ESOP obligation                                         9.94       11.58       13.29         6.65       12.46
Return on average shareholders' equity                       11.66       14.14       16.59         8.02       14.76
Return on average assets                                      1.02        1.12        1.28          .70        1.21
Tier 1 leverage ratio                                        12.00       11.90        9.90         9.90        9.90
Dividend payout ratio                                        25.37       22.35       25.07        40.98       21.41
Average shareholders' equity and net ESOP
  obligation to average total assets                         10.26        9.66        9.60        10.52        9.72
Average shareholders' equity to average total assets          8.75        7.91        7.72         8.72        8.21
All per share data has been adjusted to reflect stock splits and stock dividends.
2.
MANAGEMENT’S DISCUSSION AND ANALYSIS OF FINANCIAL CONDITION AND RESULTS OF OPERATIONS
INTRODUCTION
The following discussion provides information about the financial condition and results of operations of Pavilion Bancorp, Inc. It should be read in conjunction with the consolidated financial statements included elsewhere in this Annual Report.
BUSINESS OF PAVILION BANCORP, INC.
Pavilion Bancorp, Inc. (the Company), a bank holding company, was incorporated in Michigan in 1993. The shareholders elected to change its name to Pavilion Bancorp Inc. from Lenawee Bancorp Inc. on April 18, 2002. The Company holds all of the stock of the Bank of Lenawee, a Michigan banking corporation chartered in 1869, and the Bank of Washtenaw founded by the Company on January 8, 2001.
The business is concentrated primarily in a single industry segment — commercial banking. Each bank provides a full range of banking services to individuals, commercial businesses and industries located in its service area. Each bank maintains diversified loan portfolios, including loans to individuals for home mortgages, automobiles and personal expenditures, and loans to business enterprises for current operations and expansion. Each bank offers a variety of deposit products, including checking, savings, money market, individual retirement accounts and certificates of deposit.
The principal markets for financial services we provide are the mid-Michigan communities in which the banks are located and the areas immediately surrounding these communities. The banks serve these markets through 11 locations in or near their communities. The banks do not have any material foreign assets or income.
The principal source of revenue is interest and fees on loans. On a consolidated basis, interest and fees on loans accounted for 71 % of our total revenue in 2002 compared to 77% in 2001. Lower than normal interest rates during 2002 and 2001 resulted in a significant increase in the volume of mortgage loan sale activity and gains on sales of mortgage loans. These gains accounted for 19 % of our total revenue in 2002 as compared to 11% in 2001.
2002 FINANCIAL HIGHLIGHTS
Net income for the year ended December 31, 2002 was $2,855,342, which was a 6.17% decrease from our 2001 net income of $3,043,072. As a result our basic earnings per share decreased to $3.39 in 2002 from $3.58 in 2001. Diluted earnings per share decreased from $3.54 in 2001 to $3.37 in 2002. Our return on average equity including net ESOP obligation declined from 11.58% in 2001 to 9.94% in 2002.
Total assets grew to $287.3 million in 2002 from $278.3 million in 2001. Our net loan balances increased $20.5 million or 9.62%, an amount consistent with the prior year activity.
NET INTEREST INCOME
The largest component of our operating income is net interest income. Net interest income is the difference between the interest and fees the Company earns on our earning assets and the interest we pay on deposits and other borrowings. A number of factors influence net interest income. These factors include: changes in volume and mix of interest-earning assets and interest-bearing liabilities, government monetary and fiscal policies, national and local market interest rates and customer preference.
Our net interest income was $13.2 million in 2002, an increase of $339,000 over 2001. The 2002 increase in net interest income was primarily the result of decreased funding costs and growth in interest-earning assets. The table below shows the yields earned on our interest-earning assets and our costs of interest-bearing liabilities. The table also reflects our net interest margin for the years ended December 31, 2002, 2001 and 2000.
3.
Average Balance Sheet and Analysis of Net Interest Income
                                                                              Years ended December 31,
                                       ---------------2002------------    -------------2001--------------     -------------2000--------------
                                       Average                 Yield/     Average                 Yield/      Average                Yield/
                                       Balance    Interest      Rate      Balance    Interest      Rate       Balance    Interest     Rate
                                                                             (Dollars in thousands)
Interest-earning assets:
  Loans receivable                    $222,017     $17,786       8.01%   $217,424     $19,284       8.87%    $203,698     $19,268      9.46%
  Securities available for sale (1)     26,023       1,127       4.33      24,038       1,253       5.21       21,264       1,168      5.49
  Federal funds sold                     5,723          88       1.54       6,783         255       3.76        2,708         167      6.17
  Federal Home Loan Bank Stock           2,504         161       6.43       2,504         181       7.23        2,504         200      7.99
  Interest-bearing balances with
    other financial institutions           840          20       2.38         867          40       4.61          782          48      6.14
                                      --------     -------               --------     -------                --------      ------
      Total interest-earning assets    257,107      19,182       7.46     251,616      21,013       8.35      230,956      20,851      9.03
Noninterest-earning assets:
  Cash and due from financial
    institutions                        11,684                             10,316                               8,369
  Premises and equipment, net            6,562                              6,526                               6,333
  Other assets                           4,646                              3,424                               5,466
                                      --------                           --------                            --------
      Total assets                    $279,999                           $271,882                            $251,124
                                      ========                           ========                            ========

Interest-bearing liabilities:
  Interest-bearing demand deposits   $  55,635         647       1.16     $56,113    $  1,207       2.15    $  53,156    $  1,821      3.43%
  Savings deposits                      27,856         278       1.00      24,389         340       1.39       23,756         358      1.51
  Time deposits                        106,388       4,441       4.17     115,060       6,233       5.42       97,827       5,675      5.80
  Repurchase agreements and other
    borrowings                           7,811         351       4.49       3,083          86       2.79        3,955         191      4.83
  FHLB advances                          5,143         312       6.07       5,519         333       6.03       10,637         665      6.25
                                      --------     -------               --------     -------                --------      ------
      Total interest-bearing
         liabilities                   202,833       6,029       2.97     204,164       8,199       4.02      189,331       8,710      4.60
                                                   -------                            -------                              ------
Noninterest-bearing liabilities:
  Demand deposits                       45,681                             39,198                              35,839
  Other liabilities                      2,764                              2,251                               1,846
                                      --------                           --------                            --------
      Total liabilities                251,278                            245,613                             227,016
  Common stock subject to
      repurchase obligation in ESOP      4,225                              4,756                               4,720
  Shareholders' equity                  24,496                             21,513                              19,388
                                      --------                           --------                            --------
      Total liabilities and
         shareholders' equity         $279,999                           $271,882                            $251,124
                                      ========                           ========                            ========

Net interest income/interest rate
  spread                                           $13,153       4.49%                $12,814      4.33%                  $12,141      4.43%
                                                   =======       =====                =======      =====                  =======      =====

Net interest margin (2)                                          5.12%                             5.09%                               5.26%
                                                                 =====                             =====                               =====
Average interest-earning assets to
average interest-bearing liabilities                           126.76%                           123.24%                             121.99%
                                                               =======                           =======                             =======
(1) Interest income on tax-exempt securities has not been adjusted to a taxable equivalent basis.
(2) Net interest earnings divided by average interest-earning assets.
4.
Net interest margin is net interest income divided by average earning assets. Our net interest margin increased slightly to 5.12% in 2002 from 5.09% in 2001. During 2001, the Federal Reserve decreased the discount rate by 475 basis points from 6.0% to 1.25%. During 2002, the Federal Reserve decreased the discount rate an additional 50 basis to .75%. As a result, our prime lending rate decreased from 9.5% at December 31, 2000 to 4.75% at December 31, 2001 and then to 4.25% at December 31, 2002. With such a drastic change in interest rates, we have experienced a proportionate decline in momentum of gross revenues from this decrease in the prime lending rate. A large portion of our variable rate business and consumer loan portfolios are tied directly to the prime lending rate. Offsetting the impact of this reduction in interest income on our loan products is the decrease in our costs of local deposit funding. Nearly all funding is from the local markets we serve and our costs of funds decreased from 4.02% in 2001 to 2.97% in 2002.
The following table analyzes the effect of volume and rate changes on interest income and expense for the periods indicated.
                                       ---------2002 Compared to 2001-------  --------2001 Compared to 2000---------
                                         Amount        Amount         Net       Amount       Amount         Net
                                         Due to        Due to      Increase     Due to       Due to      Increase
                                         Volume         Rate      (Decrease)    Volume        Rate      (Decrease)
                                         ------         ----      ----------    ------        ----      ----------
                                                                      (In thousands)
Interest income
   Loans receivable                     $     400    $  (1,898)   $  (1,498)    $  1,256     $ (1,240)    $      16
   Securities available for sale               98         (224)        (126)         147          (62)           85
   Federal funds sold                         (35)        (132)        (167)         173          (85)           88
   Federal Home Loan Bank Stock                 -          (20)         (20)           -          (19)          (19)
   Interest-bearing balances with
     financial institutions                    (1)         (19)         (20)           5          (13)           (8)
                                        ---------    ---------    ---------     --------     --------     ---------
     Total interest income                    462       (2,293)      (1,831)       1,581       (1,419)          162

Interest expense
   Interest-bearing deposits
     Demand                                   (10)        (550)        (560)          96         (712)         (616)
     Savings                                   44         (106)         (62)           9          (27)          (18)
     Time                                    (443)      (1,349)      (1,792)         952         (394)          558
   Repurchase agreements and
     other borrowings                         190           75          265          (36)         (69)         (105)
   FHLB advances                              (23)           2          (21)        (310)         (22)         (332)
                                        ---------    ---------    ---------     --------     --------     ---------
     Total interest expense                  (242)      (1,928)      (2,170)         711       (1,224)         (513)
                                        ---------    ---------    ---------     --------     --------     ---------

Net interest income                     $     704    $    (365)   $     339     $    870     $   (197)    $     673
                                        =========    =========    =========     ========     ========     =========
5.
PROVISION FOR LOAN LOSSES
The provision for loan losses is the amount added to the allowance for loan losses to absorb losses that have been incurred. The loan loss provision is based on historical loss experience and individual economic factors, which, in our judgment, deserve current recognition in maintaining an adequate allowance for loan losses balance.
The provision for loan losses was $953,000 in 2002 and $388,000 in 2001. This $565,000 increase in provision for loan losses is representative of the inherent risk associated with additional loan volume combined with necessary dollar coverage of outstanding nonperforming loans. Additional loan growth of $ 21.0 million primarily occurred in commercial loans to small businesses. Nonperforming loans, also primarily small business loans, increased from $1.3 million to $1.6 million.
NONINTEREST INCOME
Noninterest income was $6.0 million in 2002 as compared to $4.2 million in 2001. This represents a 44% increase from 2001.
The largest contributing factor to our 2002 noninterest income growth was a $2.1 million increase in net gains on mortgage loan sales. The historically low interest rates over the course of 2002 continued to expand our mortgage refinancing business. During 2002, we sold $231.4 million of loans in the secondary market, resulting in net gains of $4.8 million. In 2001, we sold $158.3 million of loans in the secondary market, resulting in net gains of $2.7 million. In 2000, we sold $45.0 million of loans resulting in net gains of $652,000. Loan sale gains were partially offset by increased amortization of mortgage servicing rights as a significant portion of our loan servicing portfolio refinanced during the current year.
Contributing further to noninterest income, were increases in our service charges and fees which grew to $1.9 million in 2002 from $1.4 million in 2001. This increase is primarily attributable to the growth of additional deposit customers.
NONINTEREST EXPENSE
Noninterest expense of $14.0 million in 2002 is an increase of $1.8 million or 15% compared to the noninterest expense of $12.2 million in 2001. A significant amount of the increase is continued organizational expenses associated with opening the Bank of Washtenaw. We increased our staff from 150 full time equivalents at December 31, 2001 to 155 full time equivalents at December 31, 2002. While the staff member increase is 3% over the course of the year, salaries and employee benefits increased 18%. The 18% increase reflects a full year tenure of organizational staff at the Bank of Washtenaw for 2002. Salary expenses also grew as a result of the increased levels of mortgage loan originations and sales. Mortgage originators earned additional amounts of commission payments for higher levels of mortgages sold. Our efficiency ratio (noninterest expense as a percentage of net interest income plus noninterest income) worsened from 71.81% in 2001 to 73.15% in 2002.
6.
INCOME TAX EXPENSE
Our income tax expense was $1.3 million in 2002 compared to $1.4 million in 2001 and $1.6 million in 2000.
The statutory federal tax rate during 2002, 2001 and 2000 was 34%. Our effective tax rate was lower than the statutory rate in all three years, primarily due to our tax-exempt interest income. Our effective tax rate was 32% in 2002, 31% in 2001, and 33% in 2000.
SECURITIES PORTFOLIO
The following table shows securities by classification as of December 31, 2002 and the amounts and weighted-average yields by maturity period. Securities that are not due at a single maturity date, primarily mortgage-backed securities, are not shown.
                          ---------------------------------------------MATURING------------------------------------------------------
                                 Within             After One But          After Five But             After
                                   One               Within Five             Within Ten                Ten
                                  Year                  Years                  Years                  Years                  Total
                                                                (Dollars in thousands)
                           Amount     Yield       Amount     Yield       Amount     Yield       Amount     Yield       Amount     Yield
Available For Sale
U.S. Treasuries
and  government
  agencies                      -        -%   $   18,710     5.36%   $        -        -%   $        -        -%   $   18,710     5.36%
State and municipal (1)       961     4.36%        2,395     4.87%          576     5.89%          448     6.75%        4,380     5.08%
                       ----------             ----------             ----------             ----------             ----------
   Total               $      961             $   21,105             $      576             $      448             $   23,090
                       ==========             ==========             ==========             ==========             ==========
(1) Yields on tax-exempt securities are computed on a fully taxable-equivalent basis.
Our Asset/Liability Management Committee (Committee) is responsible for developing investment guidelines and strategies. The Committee relies on the expertise of an investment advisor to select appropriate investments for the portfolio. Decisions to purchase securities and the maturity date selected are coordinated with an overall plan to manage liquidity and interest rate exposure.
We do not invest in derivative securities. We held no impaired securities at December 31, 2002. As of December 31, 2002, securities we held which were issued by the State of Michigan and its political subdivisions carried an aggregate market value of $4.0 million.
The U.S. government agency securities identified as available for sale are laddered to mature over five years with a three year average life. The goal is to reduce the volatility of the securities portfolio yield and still provide a predictable source of liquidity.
We had no held to maturity securities as of December 31, 2002, 2001 and 2000. The fair value of securities available for sale, as of the dates indicated, are summarized as follows:
                                                                   -----------December 31,-------------
                                                                      2002        2001         2000
                                                                             (In thousands)

   U.S. Treasuries and government  agencies                       $  18,710     $ 18,064     $  7,283
   State and municipal                                                4,380        5,133        6,911
   Other securities                                                   2,126        2,772        5,127
                                                                  ---------     --------     --------

                                                                  $  25,216     $ 25,969     $ 19,321
                                                                  =========     ========     ========
7.
LOAN PORTFOLIO
Our lending efforts are concentrated primarily in the Michigan communities in which our banks’ branches are located. The banks have no foreign loans.
Our loan growth during 2002 was limited as a result of the significant refinancing activity experienced during 2002. Our total loans increased $21 million from year-end 2001 to 2002. Additionally, our loan servicing portfolio increased by approximately $73 million during the current year.
The following table presents the gross amount of loans outstanding by loan type:
                                                    --------------------------December 31,-------------------------
                                                        2002         2001         2000         1999         1998
                                                                             (In thousands)

Commercial, financial and agricultural              $  183,433   $  155,071   $  149,058    $ 135,324    $  112,451
Real estate - construction                               9,013        7,318       13,383        9,934             -
Real estate - mortgage                                  10,081       17,409       14,225       17,203        17,010
Consumer                                                33,243       34,951       37,846       34,847        29,026
                                                    ----------   ----------   ----------    ---------    ----------

                                                    $  235,770   $  214,749   $  214,512    $ 197,308    $  158,487
                                                    ==========   ==========   ==========    =========    ==========
The following table shows the maturity of loans outstanding (in thousands) at December 31, 2002. Also provided are the amounts due after one year, classified according to their sensitivity to changes in interest rates.
                                                                             Due
                                                              Due         After One          Due
                                                            Within       But Within         After
                                                           One Year      Five Years      Five Years        Total
                                                           --------      ----------      ----------        -----

Commercial, financial and agricultural                    $    67,738    $   106,116    $     9,579     $   183,433
Real estate-construction                                        9,013              -              -           9,013
Real estate-mortgage                                            4,692          3,456          1,933          10,081
Consumer                                                       15,795         12,207          5,241          33,243
                                                          -----------    -----------    -----------     -----------

                                                          $    97,238    $   121,779    $    16,753     $   235,770
                                                          ===========    ===========    ===========     ===========

Loans due after one year:
   Fixed rate                             $    54,442
   Floating or adjustable rate                 84,090
                                          -----------
                                          $   138,532
                                          ===========
8.
ASSET QUALITY
Management believes that a conservative credit culture is critical to successful performance. Through Officer and Director Loan Committees, management reviews and monitors the quality of the various loan portfolios. Internal and external loan review personnel also review our loan performance and underwriting regularly. The recent change in the momentum of the economy to static has begun to show signs of impacting some of our loan customers as shown in the nonperforming assets table below.
Loans are placed on non-accrual status when principal or interest is past due 90 days or more, the loan is not well-secured, is in the process of collection or when reasonable doubt exists concerning collectibility of interest or principal. Any interest previously accrued in the current period but not collected is reversed and charged against current earnings.
At December 31, 2002, the Banks were not aware of any loans for which payments were then current, but the borrowers were experiencing serious financial difficulties. As of December 31, 2002, 12.7% of the Banks loan portfolios were utilized to fund agricultural production, there were no other concentrations of loans exceeding 10% of total loans.
The following table summarizes non-accrual and past due loans and other real estate owned:
                                                    --------------------------December 31,-------------------------
                                                        2002         2001         2000         1999         1998
                                                                             (In thousands)

   Non-accruing loans past due                       $     648    $     230     $    113     $  3,071     $     121
   Loans past due 90 days or more                          949        1,046          523          275           275
                                                     ---------    ---------     --------     --------     ---------
     Total nonperforming loans                           1,597        1,276          636        3,346           396
   Other real estate                                     1,783          879          294          255           341
                                                     ---------    ---------     --------     --------     ---------

     Total nonperforming assets                      $   3,380    $   2,155     $    930     $  3,601     $     737
                                                     =========    =========     ========     ========     =========

   Nonperforming loans as a percent of
     total loans                                           .68%         .59%         .30%        1.73%          .25%
   Nonperforming assets as a percent of
     total assets                                         1.18%         .77%         .36%        1.50%          .33%
   Nonperforming loans as a percent of the
     loan loss reserve                                   60.05%       58.00%       27.81%       77.50%        18.15%
9.
ALLOWANCE FOR LOAN LOSSES
The following table summarizes changes in the allowance for loan losses.
                                                    --------------------Years ended December 31,-------------------
                                                                             (in thousands)
                                                        2002         2001         2000         1999         1998
                                                        ----         ----         ----         ----         ----
Loans:
   Average daily balance of loans for the year, net  $ 222,017    $ 217,424     $203,698     $171,276     $ 163,916
   Amount of loans outstanding at end of year, net   $ 233,049    $ 212,589     $212,317     $192,721     $ 156,272

Allowance for loan losses:
   Balance at beginning of year                      $   2,200    $   2,287     $  4,646     $  2,182     $   1,964
   Loans charged off:
     Real estate - mortgage                                 23            -            -           34            13
     Real estate - construction                              -            -           18            -             -
     Commercial and agricultural                           390          314        2,339           28            14
     Consumer                                              231          265          120           96            26
                                                     ---------    ---------     --------     --------     ---------
                                                           644          579        2,477          158            53
                                                     ---------    ---------     --------     --------     ---------
   Recoveries of loans previously charged-off:
     Real estate-mortgage                                    -            -            2           15             -
     Commercial and agricultural                           101           81           36            6            10
     Consumer                                               50           23           50           41            22
                                                     ---------    ---------     --------     --------     ---------
                                                           151          104           88           62            32
                                                     ---------    ---------     --------     --------     ---------

   Net loans charged-off (recoveries)                      493          475        2,389           96            21
   Additions to allowance charged to operations            953          388           30        2,560           239
                                                     ---------    ---------     --------     --------     ---------
     Balance at end of year                          $   2,660    $   2,200     $  2,287     $  4,646     $   2,182
                                                     =========    =========     ========     ========     =========

Ratios:
   Net loans charged off to average net loans
     outstanding                                           .22%         .22%        1.17%         .06%         .01%
   Allowance for loan losses to net loans
     outstanding                                          1.14%        1.03%        1.08%        2.41%        1.40%
The allowance for loan losses is allocated to the loan portfolios in the amount deemed necessary to provide for probable incurred losses. The year-end allocations were as follows:
                         ------------------------------------------------December 31,----------------------------------------------
                                 2002                  2001                 2000                  1999                  1998
                                 ----                  ----                 ----                  ----                  ----
                                     Percent               Percent              Percent               Percent               Percent
                                    of Loans              of Loans             of Loans              of Loans              of Loans
                                    to Total              to Total             to Total              to Total              to Total
                         Allowance    Loans    Allowance    Loans   Allowance    Loans    Allowance    Loans    Allowance    Loans
                         ----------------------------------------------------------------------------------------------------------
                                                                       (In thousands)
Commercial, financial
  and agricultural       $   2,034    77.80%   $   1,900    72.20%  $   1,774    69.49%   $   4,010    68.59%   $   1,680    70.95%
Real estate - mortgage          18     4.28            5     8.11           1     6.63           33     8.72           18    10.73
Real estate - construction      25     3.82           23     3.41         134     6.23           99     5.03           74        -
Consumer                       207    14.10          148    16.28         119    17.65          135    17.66          130    18.32
Unallocated                    376        -          124        -         259        -          369        -          280        -
                         --------- --------    --------- --------   --------- --------    --------- --------    --------- --------
                         $   2,660   100.00%   $   2,200   100.00%  $   2,287   100.00%   $   4,646   100.00%   $   2,182   100.00%
10.
LIQUIDITY
Liquidity is generally defined as the ability to meet cash flow needs of customers for loans and deposit withdrawals. To meet cash flow requirements, sufficient sources of liquid funds must be available. These sources include short-term investments, repayments of loans, maturing and called securities, sales of assets, growth in deposits and other liabilities and profits.
At present, Federal Reserve monetary policy combined with historically frail investment market conditions has placed a significant amount of unused cash in the markets we serve. These funds have been readily available in the form of bank deposits to cover our liquidity needs.
At December 31, 2002, we had $25.0 million of additional borrowing capacity at the Federal Home Loan Bank and $4.0 million of borrowing capacity with correspondent banks.
During 2002, we also generated $3.8 million in cash from operating activities. All of these sources are available to meet cash flow needs of loan and deposit customers.
We also need cash to pay dividends to our shareholders. Our primary source of cash is the dividends paid to the parent by our banks. We believe that cash from operations is sufficient to supply the cash needed to continue paying a reasonable dividend.
CAPITAL RESOURCES
At December 31, 2002, equity capital totaled $25.1 million. Management monitors the capital levels of the Company and the banks to provide for current and future business opportunities and to meet regulatory guidelines for “well capitalized” institutions. “Well capitalized” institutions are eligible for reduced FDIC premiums, and also enjoy other reduced regulatory restrictions.
At December 31, 2002, the Company and the banks exceeded all regulatory minimum capital requirements and are considered to be “well capitalized.”
ASSET LIABILITY MANAGEMENT
Asset liability management involves developing, implementing and monitoring strategies to maintain sufficient liquidity, maximize net interest income and minimize the impact that significant fluctuations in market interest rates would have on earnings. Our banks’ Asset/Liability Committees are responsible for managing this process.
Quantitative and Qualitative Disclosures about Market Risk
Our primary market risk exposure is interest rate risk and, to a lesser extent, liquidity risk. Our banks’ transactions are denominated in U.S. dollars with no specific foreign exchange exposure. Also, the banks have a limited exposure to commodity prices related to agricultural loans. Any impacts that changes in foreign exchange rate and commodity prices would have on interest rates are assumed to be insignificant.
Interest rate risk (IRR) is the exposure of a banking organization’s financial condition to adverse movements in interest rates. Accepting this risk can be an important source of profitability and shareholder value; however, excessive levels of IRR could pose a significant threat to earnings and capital. Accordingly, effective risk management that maintains IRR at prudent levels is essential to our safety and soundness.
11.
Evaluating exposure to changes in interest rates includes assessing both the adequacy of management’s process used to control IRR and the organization’s quantitative level of exposure. When assessing the IRR management process, we seek to ensure that appropriate policies, procedures, management information systems and internal controls are in place to maintain IRR at prudent levels with consistency and continuity. Evaluating the quantitative level of IRR exposure requires the assessment of existing and potential future effects of changes in interest rates on its consolidated financial condition, including capital adequacy, earnings, liquidity, and, where appropriate, asset quality.
We derive the majority of income from the excess of interest collected over interest paid. The rates of interest earned on assets and owed on liabilities generally are established contractually for a period of time. Since market interest rates change over time, we are exposed to lower profit margins (or losses) if we cannot adapt to interest rate changes. For example, assume that an institution’s assets carry intermediate or long-term fixed rates and that those assets are funded with short-term liabilities. If market interest rates rise, by the time the short-term liabilities must be refinanced, the increase in the institution’s interest expense on its liabilities may not be sufficiently offset if assets continue to earn at the long-term fixed rates. Accordingly, an institution’s profits could decrease because the institution will either have lower net interest income or possibly, net interest expense. Similar risks exist when assets are subject to contractual interest rate ceilings, or rate sensitive assets are funded by longer-term, fixed-rate liabilities in a decreasing rate environment.
Various techniques might be used by an institution to minimize IRR. We periodically analyze assets and liabilities and make future financing and investment decisions based on payment streams, interest rates, contractual maturities, and estimated sensitivity to actual or potential changes in market interest rates. Such activities fall under the broad definition of asset/liability management.
Several ways an institution can manage IRR include: selling existing assets or repaying certain liabilities; matching repricing periods for new assets and liabilities, for example, by shortening terms of new loans or investments and hedging existing assets, liabilities, or anticipated transactions. An institution might also invest in more complex financial instruments intended to hedge or otherwise change IRR. Interest rate swaps, futures contracts, options on futures, and other such derivative financial instruments are often used for this purpose. Because these instruments are sensitive to interest rate changes, they require management’s expertise to be effective. We have not purchased derivative financial instruments in the past and do not presently intend to purchase such instruments.
We are also subject to repayment risk when interest rates fall. For example, mortgage loans and other financial assets may be prepaid by a debtor so that the debtor may refinance its obligations at new, lower rates. Prepayments of assets carrying higher rates reduces interest income and overall asset yields.
Certain portions of an institution’s liabilities may be short-term or due on demand, while most of its assets may be invested in long-term loans or investments. Accordingly, we seek to have in place sources of cash to meet short-term demands. These funds can be obtained by increasing deposits or selling assets. Also, Federal Home Loan Bank advances and short-term borrowings provide additional sources of liquidity.
12.
The following table provides information about our financial instruments that were sensitive to changes in interest rates as of December 31, 2002. We had no derivative financial instruments, or trading portfolio, as of that date. The expected maturity date values for loans receivable, mortgage-backed securities and investment securities were calculated without adjusting the instrument’s contractual maturity date for expectations of prepayments. Expected maturity date values for interest-bearing core deposits were not based upon estimates of the period over which the deposits would be outstanding, but rather the opportunity for repricing.
Principal/notional amount as of December 31, 2002 maturing in:
                                                                                                                Fair
                                      2003       2004       2005       2006       2007  Thereafter    Total     Value
                                      ----       ----       ----       ----       ----  ----------    -----     -----
                                                                     (In thousands)
Rate Sensitive Assets
Fixed interest rate securities      $    -    $     -     $    -    $15,325    $ 3,590   $ 2,042    $ 20,957  $ 21,276
   Average interest rate                 -          -          -       5.47%      4.96%     5.77%       5.37%
Tax-exempt fixed rate securities       944        372        745        295        424       928       3,708
3,940
   Average interest rate              4.36%      5.85%      4.49%      4.40%      4.05%     6.24%       4.97%
FHLB stock                           2,504          -          -          -          -         -       2,504     2,504
   Average interest rate              6.25%         -          -          -          -         -        6.25%
FRB stock                              493          -          -          -          -         -         493       493
   Average interest rate              6.00%         -          -          -          -         -        6.00%
Fixed interest rate loans           59,924     10,920      5,238     28,234      7,233     2,817     114,366   114,733
   Average interest rate              7.65%      7.97%      8.66%      7.36%      7.32%     6.96%       7.62%
Variable interest rate loans        37,314     17,945      20,684    10,889     20,636    13,936     121,404   121,759
   Average interest rate              5.59%      7.85%      7.45%      7.42%      7.40%     7.11%       6.89% --------
                                 ---------    -------    -------    -------    -------   -------    --------
Total earning assets               101,179     29,237     26,667     54,743     31,883    19,723     263,432   264,766
                                 ---------    -------    -------    -------    -------   -------    --------   -------

Rate Sensitive Liabilities
Interest-bearing demand          $  59,549    $     -    $     -    $     -    $     -   $     -    $ 59,549  $ 59,549
   Average interest rate               .49%         -          -          -          -         -         .49%        -
Savings                             29,267          -          -          -          -         -      29,267    29,267
   Average interest rate               .71%         -          -          -          -         -         .71%
Time deposits                       65,349     26,592      8,923      1,827      1,385         -     104,076   108,289
   Average interest rate              3.40%      4.32%     3.98%       3.82%      5.25%        -        3.58%
Repurchase agreements and
   federal funds purchased           3,507          -          -          -          -         -       3,507     3,507
   Average interest rate%             2.00%         -          -          -          -         -        2.00%
Trust preferred securities               -          -          -          -          -     4,836       4,836     4,836
   variable rate                         -          -          -          -          -      5.17%       5.17%
Fixed interest rate FHLB advances      408        441        477      3,803          -         -       5,129     5,458
   Average interest rate              6.04%      6.04%      6.04%      6.04%         -%        -        6.04% --------
                                 ---------    -------    -------    -------    -------   -------    --------
Total interest bearing liabilities 158,080     27,033      9,400      5,630      1,385     4,836     255,192   259,734
                                 ---------    -------    -------    -------    -------   -------    --------  --------

Interest rate sensitivity gap    $ (56,901)   $ 2,204    $17,267    $49,113    $30,498   $14,887    $  8,240
                                 =========    =======    =======    =======    =======   =======    ========
Cumulative interest rate
   sensitivity gap               $ (56,901)  $(54,697)  $(37,430)   $11,683    $42,181   $ 8,240
                                 =========   ========   ========    =======    =======   =======
13.
Principal/notional amount as of December 31, 2001 maturing in:
                                                                                                                Fair
                                      2002       2003       2004       2005       2006  Thereafter    Total     Value
                                      ----       ----       ----       ----       ----  ----------    -----     -----
                                                                     (In thousands)
Rate Sensitive Assets
Federal funds sold               $   8,290    $     -    $     -    $     -    $     -   $     -    $  8,290  $   8,290
   Average interest rate              1.50%         -          -          -          -         -           -
Fixed interest rate securities       5,786          -      4,143      2,128      8,142       421      20,620     20,836
   Average interest rate              5.14%         -       5.24%      5.12%      5.85%     5.52%       5.44%
Tax-exempt fixed rate securities       316      1,056        697        757        716     1,426       4,968      5,133
   Average interest rate              5.94%      4.45%      5.24%      4.43%      5.32%     6.50%       5.37%
FHLB stock                           2,504          -          -          -          -         -       2,504      2,504
   Average interest rate              6.00%         -          -          -          -         -        6.00%
FRB stock                              480          -          -          -          -         -         480        480
   Average interest rate              6.00%         -          -          -          -         -        6.00%
Fixed interest rate loans           10,049      7,152     16,476     15,321     19,348    25,715      94,061     95,792
   Average interest rate              9.99%      9.13%      8.57%      8.43%      8.01%     7.58%       8.35%
Variable interest rate loans        62,814     13,629     15,553     19,955      5,968     2,769     120,688    122,869
   Average interest rate              5.35%      9.03%      8.11%      8.23%      8.71%     9.19%       6.85% ---------
                                 ---------    -------    -------    -------    -------   -------    --------
Total earning assets                90,239     21,837     36,869     38,161     34,174    30,331     251,611    255,904
                                 ---------    -------    -------    -------    -------   -------    --------  ---------

Rate Sensitive Liabilities
Interest-bearing demand          $  57,699    $     -    $     -    $     -    $     -   $     -    $ 57,699  $  57,699
   Average interest rate              1.19%         -          -          -          -          -       1.19%
Savings                             25,192          -          -          -          -          -     25,192     25,192
   Average interest rate              1.50%         -          -          -          -          -       1.50%
Time deposits                       73,044     20,995     10,920      1,095        975          -    107,029    109,503
   Average interest rate              4.28%      5.67%      6.00%      4.64%      4.64%         -       4.69%
Securities sold under  agreements
   to repurchase                     1,889          -          -          -          -          -      1,889      1,889
   Average interest rate%             1.54%         -          -          -          -          -       1.54%
Trust preferred securities               -          -          -          -          -      4,850      4,850      4,850
   variable rate                         -          -          -          -          -       6.02%      6.02%
Fixed interest rate FHLB advances      376        407        441        477      3,804          -      5,505      5,510
   Average interest rate              6.04%      6.04%      6.04%      6.04%      6.04%         -       6.04% ---------
                                 ---------    -------    -------    -------    -------    -------   --------
Total interest bearing liabilities 158,200     21,402      1,361      1,572      4,779      4,850    202,164    204,643
                                 ---------    -------    -------    -------    -------    -------   --------  ---------

Interest rate sensitivity gap    $ (67,961)   $   435    $25,508    $36,589    $29,395   $ 25,487   $ 49,447
                                 =========    =======    =======    =======    =======   ========   ========

Cumulative interest rate
   sensitivity gap               $ (67,961)  $(67,526)  $(42,018)   $(5,429)   $23,966   $ 49,447
                                 =========   ========   ========    =======    =======   ========
CRITICAL ACCOUNTING POLICIES
Certain of the Company’s accounting policies are important to the portrayal of the Company’s financial condition, since they require management to make difficult, complex or subjective judgments, some of which may relate to matters that are inherently uncertain. Estimates associated with these policies are susceptible to material changes as a result of changes in facts and circumstances. Facts and circumstances which could effect these judgments include, but without limitation, changes in interest rates, in the performance of the economy or in the financial condition of borrowers. Management believes that its
14.
critical accounting policies include determining the allowance for loan losses, determining the fair value of securities and other financial instruments and the valuation of mortgage servicing rights. The Company’s critical accounting policies are discussed in detail in Note 1 of the Notes to the Consolidated Financial Statements.
FORWARD-LOOKING STATEMENTS
This discussion and analysis of financial condition and results of operations and other sections of this Annual Report contain forward looking statements that are based on management’s beliefs, assumptions, current expectations, estimates and projections about the financial services industry, the economy and about the Company itself. Words such as “anticipates”, “believes”, “estimates”, “expects”, “forecasts”, “foresee”, “intends”, “is likely”, “plans”, “product”, “projects”, variations of such words and similar expressions are intended to identify such forward-looking statements. These statements are not guarantees of future performance and involve certain risks, uncertainties and assumptions (“Future Factors”) that are difficult to predict with regard to timing, extent, likelihood and degree of occurrence. Therefore, actual results and outcomes may materially differ from what may be expressed or forecasted in such forward-looking statements.
Furthermore, the Company undertakes no obligation to update, amend or clarify forward-looking statements, whether as a result of new information, future events or otherwise. Future Factors include:
- changes in interest rates and interest rate relationships; demand for products and services;
- the degree of competition by traditional and non-traditional competitors;
- changes in banking regulations;
- changes in tax laws;
- changes in prices, levies and assessments;
- the impact of technology, governmental and regulatory policy changes;
- the outcome of pending and future litigation and contingencies;
- trends in customer behavior as well as their ability to repay loans; and
- changes in the national and local economies.
These are representative of the Future Factors that could cause a difference between an actual outcome and a forward-looking statement.
15.
MANAGEMENT’S RESPONSIBILITY FOR FINANCIAL STATEMENTS
Management is responsible for the preparation of the Pavilion Bancorp, Inc.‘s consolidated financial statements and related information appearing in this Annual Report. Management believes that the consolidated financial statements fairly reflect the form and substance of transactions and reasonably present Pavilion Bancorp’s financial position and results of operations and were prepared in conformity with accounting principles generally accepted in the United States of America. Management also has included in the Company’s financial statements, amounts that are based on estimates and judgments which it believes are reasonable under the circumstances.
Pavilion Bancorp, Inc. maintains a system of internal controls designed to provide reasonable assurance that all assets are safeguarded and financial records are reliable for preparing the consolidated financial statements. The Company complies with laws and regulations relating to safety and soundness which are designated by the FDIC and other appropriate federal banking agencies. The selection and training of qualified personnel and the establishment and communication of accounting and administrative policies and procedures are elements of this control system. The effectiveness of internal controls is monitored by a program of internal audit. Management recognizes that the cost of a system of internal controls should not exceed the benefits derived and that there are inherent limitations to be considered in the potential effectiveness of any system. Management believes that Pavilion Bancorp’s system provides the appropriate balance between costs of controls and the related benefits.
The independent auditors have audited the Company’s consolidated financial statements in accordance with auditing standards generally accepted in the United States of America and provide an objective, independent review of the fairness of the reported operating results and financial position. The Board of Directors of Pavilion Bancorp has an Audit Committee composed of four non-management Directors. The Committee meets periodically with the internal auditors and the independent auditors.
| Douglas L. Kapnick Chairman and Chief Executive Officer | Loren V. Happel Chief Financial Officer |
16.
REPORT OF INDEPENDENT AUDITORS
Board of Directors and Shareholders
Pavilion Bancorp, Inc.
Adrian, Michigan
We have audited the accompanying consolidated balance sheets of Pavilion Bancorp, Inc. as of December 31, 2002 and 2001, and the related consolidated statements of income, changes in shareholders’ equity and cash flows for each of the years ended December 31, 2002, 2001 and 2000. These financial statements are the responsibility of the Company’s management. Our responsibility is to express an opinion on these financial statements based on our audits.
We conducted our audits in accordance with auditing standards generally accepted in the United States of America. Those standards require that we plan and perform the audit to obtain reasonable assurance about whether the financial statements are free of material misstatement. An audit includes examining, on a test basis, evidence supporting the amounts and disclosures in the financial statements. An audit also includes assessing the accounting principles used and significant estimates made by management, as well as evaluating the overall financial statement presentation. We believe that our audits provide a reasonable basis for our opinion.
In our opinion, the consolidated financial statements referred to above present fairly, in all material respects, the financial position of Pavilion Bancorp, Inc. as of December 31, 2002 and 2001, and the results of its operations and its cash flows for each of the years ended December 31, 2002, 2001 and 2000 in conformity with accounting principles generally accepted in the United States of America.
| Grand Rapids, Michigan February 4, 2003 | Crowe, Chizek and Company LLP |
17.
PAVILION BANCORP, INC.
CONSOLIDATED BALANCE SHEETS
December 31, 2002 and 2001
                                                                                    2002                 2001
                                                                                    ----                 ----
ASSETS
Cash and due from banks                                                      $      11,222,644    $      15,986,998
Federal funds sold                                                                           -            8,290,000
                                                                             -----------------    -----------------
     Total cash and cash equivalents                                                11,222,644           24,276,998

Securities available for sale                                                       25,215,853           25,969,241
Federal Home Loan Bank stock, at cost                                                2,503,700            2,503,700
Federal Reserve Bank stock, at cost                                                    493,350              480,000

Loans held for sale                                                                  1,473,300              416,600
Loans receivable, net of allowance for loan losses:
  $2,659,935 - 2002; $2,200,157 - 2001                                             233,048,728          212,589,534
Premises and equipment, net                                                          6,314,240            6,611,126
Accrued interest receivable                                                          1,867,988            1,877,744
Mortgage servicing rights                                                            2,715,011            2,065,958
Other assets                                                                         2,431,180            1,485,761
                                                                             -----------------    -----------------

         Total assets                                                        $     287,285,994    $     278,276,662
                                                                             =================    =================

LIABILITIES AND SHAREHOLDERS' EQUITY
Deposits
     Noninterest bearing                                                     $      48,827,584    $      45,487,597
     Interest bearing                                                              192,892,537          189,919,417
                                                                             -----------------    -----------------
         Total deposits                                                            241,720,121          235,407,014

Borrowed funds                                                                       8,635,176            7,394,232
Accrued interest payable                                                               506,603              849,994
Other liabilities                                                                    2,254,464            1,618,466
Guaranteed preferred beneficial interests in the Corporation's
         subordinated debentures (Note 9 - Trust Preferred Securities)               5,000,000            5,000,000
Common stock subject to repurchase obligation in ESOP                                4,100,407            4,444,244
                                                                             -----------------    -----------------
         Total liabilities                                                         262,216,771          254,713,950

Shareholders' equity
     Common stock and paid-in capital, no par
       value:  3,000,000 shares authorized; shares
       issued and outstanding:  831,182 - 2002; 848,537 - 2001                       9,711,476           10,186,534
     Retained earnings                                                              15,254,440           13,124,430
     Accumulated other comprehensive income                                            103,307              251,748
                                                                             -----------------    -----------------
         Total shareholders' equity                                                 25,069,223           23,562,712
                                                                             -----------------    -----------------

              Total liabilities and shareholders' equity                     $     287,285,994    $     278,276,662
                                                                             =================    =================
See accompanying notes to consolidated financial statements.
18.
PAVILION BANCORP, INC.
CONSOLIDATED STATEMENTS OF INCOME
Years ended December 31, 2002, 2001 and 2000
                                                                 2002                2001                2000
                                                                 ----                ----                ----
Interest and dividend income
     Loans receivable, including fees                       $    17,785,876     $    19,284,332    $     19,267,973
     Taxable securities                                             911,175             975,860             850,100
     Nontaxable securities                                          202,868             247,890             289,436
     Federal funds sold                                              88,331             255,321             166,828
     Dividend income                                                173,911             208,194             229,023
     Other                                                           19,757              40,911              47,993
                                                            ---------------     ---------------    ----------------
         Total interest and dividend income                      19,181,918          21,012,508          20,851,353

Interest expense
     Deposits                                                     5,365,835           7,779,154           7,853,587
     Trust preferred securities                                     292,697              26,345                   -
     Other borrowed funds                                           370,148             392,862             856,797
                                                            ---------------     ---------------    ----------------
         Total interest expense                                   6,028,680           8,198,361           8,710,384
                                                            ---------------     ---------------    ----------------

Net interest income                                              13,153,238          12,814,147          12,140,969
     Provision for loan losses                                      953,000             388,000              30,000
                                                            ---------------     ---------------    ----------------

Net interest income after provision for
  loan losses                                                    12,200,238          12,426,147          12,110,969

Noninterest income
     Service charges and fees                                     1,887,831           1,362,691             980,745
     Net gains on loan sales                                      4,839,085           2,715,924             651,733
     Loan servicing fees, net of amortization                    (1,159,165)           (290,590)            107,109
     Gain on sale of securities                                       8,838                   -                   -
     Other                                                          398,155             363,256             324,282
                                                            ---------------     ---------------    ----------------
                                                                  5,974,744           4,151,281           2,063,869

Noninterest expense
     Salaries and employee benefits                               8,456,260           7,188,368           5,018,659
     Occupancy and equipment                                      2,367,665           2,067,338           1,588,555
     Printing, postage  and supplies                                490,457             420,637             312,674
     Professional and outside services                              399,198             563,213             391,617
     Mobile banking costs                                           448,227             425,563             341,658
     Receivable financing services                                  201,938             249,149             296,733
     Other                                                        1,628,955           1,268,030           1,463,633
                                                            ---------------     ---------------    ----------------
                                                                 13,992,700          12,182,298           9,413,529
                                                            ---------------     ---------------    ----------------

Income before income taxes                                        4,182,282           4,395,130           4,761,309
     Income tax expense                                           1,326,940           1,352,058           1,556,376
                                                            ---------------     ---------------    ----------------

Net income                                                  $     2,855,342     $     3,043,072    $      3,204,933
                                                            ===============     ===============    ================

Basic earnings per share                                    $          3.39     $          3.58    $           3.75
                                                            ===============     ===============    ================

Diluted earnings per share                                  $          3.37     $          3.54    $           3.71
                                                            ===============     ===============    ================
See accompanying notes to consolidated financial statements.
19.
PAVILION BANCORP, INC.
CONSOLIDATED STATEMENTS OF CHANGES IN SHAREHOLDERS’ EQUITY
Years ended December 31, 2002, 2001 and 2000
                                                       Common                               Accumulated
                                                      Stock and                                Other               Total
                                                       Paid-In           Retained          Comprehensive       Shareholders'
                                                       Capital           Earnings          Income (Loss)          Equity
                                                       -------           --------          -------------          ------

Balance January 1, 2000                            $  10,430,303       $   8,352,940      $     (334,282)     $    18,448,961

Comprehensive income:
    Net income                                                             3,204,933                                3,204,933
    Unrealized gains (losses) on securities                                                      454,418
    Tax effect                                                                                  (154,539)
                                                                                          --------------
       Total other comprehensive income                                                          299,879              299,879
                                                                                          --------------      ---------------
          Total comprehensive income                                                                                3,504,812
                                                                                                              ---------------

Change in common stock subject to repurchase            (787,470)                                                    (787,470)

Retirement of stock - 3,441 shares                      (151,405)                                                    (151,405)

Proceeds from sale of stock - 2,582 shares               117,065                                                      117,065

Stock option expense                                      23,465                                                       23,465

Cash dividends - $.94 per share                                             (802,450)                                (802,450)
                                                   -------------       -------------      --------------      ---------------

Balance December 31, 2000                              9,631,958          10,755,423             (34,403)          20,352,978

Comprehensive income:
    Net income                                                             3,043,072                                3,043,072
    Unrealized gains (losses) on securities                                                      433,327
    Tax effect                                                                                  (147,176)
                                                                                          --------------
       Total other comprehensive income                                                          286,151              286,151
                                                                                          --------------      ---------------
          Total comprehensive income                                                                                3,329,223
                                                                                                              ---------------

Change in common stock subject to repurchase             669,526                                                      669,526

Retirement of stock - 5,619 shares                      (284,286)                                                    (284,286)

Proceeds from sale of stock - 2,605 shares               132,855                                                      132,855

Stock option expense                                      36,481                                                       36,481

Cash dividends - $.80 per share                                             (674,065)                                (674,065)
                                                   -------------       -------------      --------------      ---------------

Balance December 31, 2001                             10,186,534          13,124,430             251,748           23,562,712

Comprehensive income:
    Net income                                                             2,855,342                                2,855,342
    Establish minimum pension liability                                                         (398,683)
    Unrealized gains (losses) on securities                                                      168,667
    Tax effect                                                                                    81,575
                                                                                          --------------
       Total other comprehensive income                                                         (148,441)            (148,441)
                                                                                          --------------      ---------------
          Total comprehensive income                                                                                2,706,901
                                                                                                              ---------------

Change in common stock subject to repurchase             343,837                                                      343,837

Retirement of stock - 21,423 shares                   (1,019,130)                                                  (1,019,130)

Proceeds from sale of stock - 2,044 shares               105,260                                                      105,260

Stock option expense                                      34,451                                                       34,451

Stock options exercised                                   60,524                                                       60,524

Cash dividends - $.86 per share                                             (725,332)                                (725,332)
                                                   -------------       -------------      --------------      ---------------

Balance December 31, 2002                          $   9,711,476       $  15,254,440      $      103,307      $    25,069,223
                                                   =============       =============      ==============      ===============
See accompanying notes to consolidated financial statements.
20.
PAVILION BANCORP, INC.
CONSOLIDATED STATEMENTS OF CASH FLOWS
Years ended December 31, 2002, 2001 and 2000
                                                                 2002                2001                2000
                                                                 ----                ----                ----
Cash flows from operating activities
     Net income                                             $     2,855,342     $     3,043,072    $      3,204,933
     Adjustments to reconcile net income to
       net cash from operating activities
         Depreciation                                               902,923             804,504             690,753
         Stock option expense                                        34,451              36,481              23,465
         Provision for loan losses                                  953,000             388,000              30,000
         Net amortization and accretion on securities
           available for sale                                       291,654             102,372              69,728
         Net realized (gain) loss on sales of securities             (8,838)                  -                   -
         Amortization of mortgage servicing rights                1,782,696             790,896             314,534
         Loans originated for sale                             (230,040,837)       (156,501,748)        (37,696,914)
         Proceeds from sales of mortgage loans                  231,391,473         158,263,182          44,954,185
         Net gains on sales of mortgage loans                    (4,839,085)         (2,715,924)           (651,733)
     Net change in:
         Deferred loan origination fees                            (101,649)            (52,129)            (33,877)
         Accrued interest receivable                                  9,756              21,203            (322,668)
         Other assets                                               589,924           1,532,660            (481,094)
         Accrued interest payable                                  (343,391)            (95,797)            301,960
         Other liabilities                                          304,414             232,883             154,858
                                                            ---------------     ---------------    ----------------
              Net cash from operating activities                  3,781,833           5,849,655          10,558,130

Cash flows from investing activities
     Proceeds from:
         Maturities, calls and principal payments on
           securities available for sale                         18,135,401          10,207,721           4,087,858
         Sales of securities available for sale                   3,508,838                   -                   -
     Purchases of:
         Securities available for sale                          (21,005,000)        (16,525,000)                  -
         Federal Reserve Bank Stock                                 (13,350)           (120,000)                  -
         Premises and equipment, net                               (606,037)         (1,427,028)           (158,331)
     Net increase in loans                                      (22,982,728)         (1,552,221)        (26,951,438)
     Recoveries on loans charged-off                                151,316             103,993              87,547
                                                            ---------------     ---------------    ----------------
         Net cash from investing activities                     (22,811,560)         (9,312,535)        (22,934,364)

Cash flows from financing activities
     Net change in deposits                                       6,313,107          11,264,359          24,936,246
     Net change in short term borrowings                          1,617,356            (194,032)             80,917
     Proceeds from FHLB advances                                          -                   -          10,000,000
     Net proceeds from issuance of trust preferred securities             -           4,850,417                   -
     Repayment of FHLB advances                                    (376,412)           (347,886)        (18,321,521)
     Repurchase of common stock                                  (1,019,130)           (284,286)           (151,405)
     Issuance of common stock                                       105,260             132,855             117,065
     Stock options exercised                                         60,524                   -                   -
     Dividends paid                                                (725,332)           (674,065)           (802,450)
                                                            ---------------     ---------------    ----------------
         Net cash from financing activities                       5,975,373          14,747,362          15,858,852
                                                            ---------------     ---------------    ----------------

Net change in cash and cash equivalents                         (13,054,354)         11,284,482           3,482,618

Cash and cash equivalents at beginning of year                   24,276,998          12,992,516           9,509,898
                                                            ---------------     ---------------    ----------------

Cash and cash equivalents at end of year                    $    11,222,644     $    24,276,998    $     12,992,516
                                                            ===============     ===============    ================

Supplemental schedule of noncash activities
     Transfer from:
         Loans to foreclosed real estate                    $     1,520,867     $       839,840    $        126,318
         Portfolio loans to loans held for sale                           -                   -           9,592,343
         Loans held for sale to portfolio loans                           -                   -           2,447,377

     Cash paid for:
         Interest                                           $     6,372,071     $     8,294,158    $      8,408,424
         Income taxes                                             1,599,000             836,000           1,147,000
See accompanying notes to consolidated financial statements.
21.
PAVILION BANCORP, INC.
NOTES TO CONSOLIDATED FINANCIAL STATEMENTS
December 31, 2002, 2001 and 2000
NOTE 1 — SUMMARY OF ACCOUNTING POLICIES
The accounting and reporting policies of Pavilion Bancorp, Inc. (the Company) and its wholly owned subsidiaries, Bank of Lenawee and Bank of Washtenaw (the Banks), conform to accounting principles generally accepted in the United States of America and to general practice within the banking industry. The following describes the significant accounting and reporting policies which are employed in the preparation of the consolidated financial statements.
Principles of Consolidation: The consolidated financial statements include the accounts of the Company, Lenawee Capital Trust I, the Banks and Bank of Lenawee ‘s wholly owned subsidiaries, Pavilion Mortgage Company and Pavilion Financial Services. All significant intercompany balances and transactions have been eliminated in consolidation.
Lenawee Capital Trust I (“Capital Trust”) was formed in December 2001. All of the common securities of this special purpose trust are owned by the Company. The Trust exists solely to issue trust preferred securities. For financial reporting purposes, the Trust is reported as a subsidiary and is consolidated into the financial statements of the Company. The Trust Preferred Securities are presented as a separate line item on the consolidated balance sheet.
Nature of Operations, Industry Segments and Concentrations of Credit Risk: The Company is a two-bank holding company which conducts limited business activities. The Banks perform the majority of the business activities.
The Banks provide a full range of banking services to individuals, agricultural businesses, commercial businesses and light industries located in their service area. They maintain a diversified loan portfolio, including loans to individuals for home mortgages, automobiles and personal expenditures, and loans to business enterprises for current operations and expansion. The Banks offer a variety of deposit products, including checking, savings, money market, individual retirement accounts and certificates of deposit. Pavilion Mortgage Company originates personal mortgage loans, and the majority of the mortgage loans originated are sold on the secondary market. While the Company’s chief decision maker monitors the revenue stream of various Company products and services, operations are managed and financial performance is evaluated on a Company wide basis. Accordingly, all of the Company’s banking operations are considered by management to be aggregated into one operating segment.
The principal market for the Banks’ financial services are the Michigan communities in which the Banks are located and the areas immediately surrounding these communities. The Banks serve these markets through their offices located in Lenawee, Hillsdale and Washtenaw Counties in Michigan.
Use of Estimates: To prepare financial statements in conformity with accounting principles generally accepted in the United States of America, management makes estimates and assumptions based on available information. These estimates and assumptions affect the amounts reported in the financial statements and the disclosures provided, and future results could differ. The allowance for loan losses, mortgage servicing rights and fair values of securities and other financial instruments are particularly subject to change.
Cash Flow Reporting: Cash and cash equivalents include cash on hand, demand deposits with other financial institutions, federal funds sold and commercial paper with original maturities of 90 days or less. Cash flows are reported, net, for customer loan and deposit transactions, and borrowed funds with original maturities of 90 days or less.
(Continued)
22.
NOTE 1 — SUMMARY OF ACCOUNTING POLICIES (Continued)
Securities: Securities are classified as available for sale when they might be sold before maturity. Ssuuch securities are carried at fair value, with unrealized holding gains and losses reported in other comprehensive income. Other securities such as Federal Home Loan Bank and Federal Reserve Bank stock are carried at cost.
Gains and losses on sales are determined using the amortized cost of the specific security sold. Interest and dividend income, adjusted by amortization of purchase premiums and discounts, is included in earnings. Securities are written down to fair value when a decline in fair value is not temporary.
Loans Held for Sale: Loans held for sale are reported at the lower of cost or market value in aggregate. Net unrealized losses are recorded in a valuation allowance by charges to income.
Loans Receivable: Loans that management has the intent and the ability to hold for the foreseeable future or until maturity or payoff are reported at the principal balance outstanding, net of unearned interest, deferred loan fees and costs, and an allowance for loan losses. Interest income is reported on the interest method and includes amortization of net deferred loan fees and costs over the loan term.
Interest income is not reported when full loan repayment is in doubt, typically when payments are past due over 90 days, unless the loan is both well secured and in the process of collection. Payments received on such loans are reported as principal reductions. All interest accrued but not received for loans placed on nonaccrual is reversed against interest income. Interest received on such loans is accounted for on the cash-basis or cost-recovery method, until qualifying for return to accrual. Loans are returned to accrual status when all the principal and interest amounts contractually due are brought current and future payments are reasonably assured.
Allowance for Loan Losses: The allowance for loan losses is a valuation allowance for probable incurred credit losses, increased by the provision for loan losses and decreased by charge-offs less recoveries. Management estimates the allowance balance using past loan loss experience, the nature and volume of the portfolio, information about specific borrower situations and estimated collateral values, economic conditions, and other factors. Allocations of the allowance may be made for specific loans, but the entire allowance is available for any loan that, in management’s judgment, should be charged-off. Loan losses are charged against the allowance when management believes the uncollectibility of a loan balance is confirmed.
A loan is impaired when full payment under the loan terms is not expected. Impairment is evaluated in total for smaller-balance loans of similar nature such as residential mortgage and consumer loans and on an individual loan basis for other loans. If a loan is impaired, a portion of the allowance is allocated so that the loan is reported, net, at the present value of estimated future cash flows using the loan’s existing rate or at the fair value of collateral if repayment is expected solely from the collateral.
(Continued)
23.
NOTE 1 — SUMMARY OF ACCOUNTING POLICIES (Continued)
Premises and Equipment: Land is carried at cost. Premises and equipment are stated at cost less accumulated depreciation. Depreciation is computed using a combination of straight-line and accelerated methods with useful lives ranging from 10 to 40 years for buildings and improvements, and 3 to 10 years for furniture and equipment. These assets are reviewed for impairment when events indicate their carrying amount may not be recoverable from future undiscounted cash flows. Maintenance, repairs and minor alterations are charged to current operations as expenditures occur. Major improvements are capitalized.
Servicing Rights: Servicing rights represent the allocated value of servicing rights retained on loans sold. Servicing rights are expensed in proportion to, and over the period of, estimated net servicing revenues.
Impairment is evaluated based on the fair value of the rights, using groupings of the underlying loans as to interest rates and then, secondarily, as to geographic and prepayment characteristics. Any impairment of a grouping is reported as a valuation allowance.
Other Real Estate Owned: Real estate properties acquired through or instead of foreclosure are initially recorded at fair value at acquisition. After acquisition, a valuation allowance reduces the reported amount to the lower of the initial amount or fair value less costs to sell. Other real estate owned amounts to $1,783,000 and $879,000 at December 31, 2002 and 2001 and are included in other assets.
Repurchase Agreements: Substantially all repurchase agreement liabilities represent amounts advanced by various customers. Securities are pledged to cover these liabilities, which are not covered by federal deposit insurance.
Benefit Plans: A defined benefit pension plan covers substantially all employees, with benefits based on years of service and compensation prior to retirement. Pension expense is the net of service and interest cost, return on plan assets, and amortization of gains and losses not immediately recognized. The Company records a minimum pension liability when the Company’s accumulated benefit obligation exceeds the fair value of plan assets by reducing accumulated other comprehensive income, net of tax. Profit-sharing and 401(k) plan expense is the amount contributed as determined by Board decision.
Stock Compensation: Employee compensation expense under stock options is reported using the intrinsic value method. No stock-based compensation cost is reflected in net income unless options granted have an exercise price that is less than the market price of the underlying common stock at date of grant. During 2001 and 2000, stock options were granted with exercise prices that were less than the fair market value of the underlying common stock as of the grant date; therefore, the Company is recording compensation expense for the difference between the strike price and fair market value of the underlying common stock as of the respective grant dates for the 2001 and 2000 stock option grants. Accordingly compensation expense for these stock options has been recorded during 2002, 2001 and 2000 based on the vesting schedules of the related stock options. Compensation expense for stock options was $34,000, $36,000 and $23,000 during 2002, 2001 and 2000. The following table illustrates the effect on net income and earnings per share if expense was measured using the fair value recognition provision of FASB Statement No. 123, Accounting for Stock-Based Compensation.
(Continued)
24.
NOTE 1 — SUMMARY OF ACCOUNTING POLICIES (Continued)
                                                                2002              2001               2000
                                                                ----              ----               ----

       Net income as reported                              $    2,855,342    $     3,043,072    $    3,204,933
       Less:  Stock-based compensation expense
         determined under fair value based method                  61,002             69,534            53,808
                                                           --------------    ---------------    --------------

       Proforma net income                                 $    2,794,340    $     2,973,538    $    3,151,125
                                                           ==============    ===============    ==============

       Basic earnings per share as reported                $         3.39    $          3.58    $         3.75
       Proforma basic earnings per share                             3.32               3.50              3.69

       Diluted earnings per share as reported                        3.37               3.54              3.71
       Proforma diluted earnings per share                           3.29               3.46              3.64
The pro forma effects are computed using option pricing models, using the following weighted average assumptions as of grant date for the years ended December 31, 2002, 2001 and 2000:
                                                                   2002              2001               2000
                                                                   ----              ----               ----

       Risk-free interest rate                                      4.78%              4.88%             6.64%
       Expected option life                                       8 years            8 years           8 years
       Expected dividend yield                                      1.38%              1.44%             1.35%
       Expected stock price volatility                             22.92%             23.16%            20.92%
The weighted average fair value of stock options granted was $16.69, $20.18 and $24.86 for 2002, 2001 and 2000.
Income Taxes: Income tax expense is the total of the current year income tax due or refundable and the change in deferred tax assets and liabilities. Deferred tax assets and liabilities are the expected future tax consequences of temporary differences between carrying amounts and tax bases of assets and liabilities, computed using enacted tax rates. A valuation allowance, if needed, reduces deferred tax assets to the amount expected to be realized. No valuation allowance was needed as of December 31, 2002 and 2001.
Earnings and Dividends Per Share: Basic earnings per common share is based on net income divided by the weighted average number of common shares outstanding during the period. Diluted earnings per common share shows the dilutive effect of any additional potential common shares issuable under stock options.
Comprehensive Income: Comprehensive income consists of net income and other comprehensive income. Other comprehensive income includes the net change in unrealized appreciation (depreciation) on securities available for sale, net of tax, and the change in the Company’s minimum pension liability, net of tax, which are also recognized as a separate component of shareholders’ equity.
Financial Instruments with Off-Balance-Sheet Risk: Financial instruments include off-balance sheet credit instruments, such as commitments to make loans and standby letters of credit issued to meet customer’s needs. The face amount for these items represents the exposure to loss before considering customer collateral or ability to repay. Such financial instruments are recorded when they are funded.
(Continued)
25.
NOTE 1 — SUMMARY OF ACCOUNTING POLICIES (Continued)
Fair Values of Financial Instruments: Fair values of financial instruments are estimated using relevant market information and other assumptions, as more fully disclosed separately. Fair value estimates involve uncertainties and matters of significant judgment regarding interest rates, credit risk, prepayments, and other factors, especially in the absence of broad markets for particular items. Changes in assumptions or in market conditions could significantly affect the estimates. The fair value estimates of existing on and off-balance-sheet financial instruments does not include the value of anticipated future business or values of assets and liabilities not considered financial instruments.
Newly Issued But Not Yet Effective Accounting Standards: New accounting standards on asset retirement obligations, restructuring activities and exit costs, operating leases, and early extinguishment of debt were issued in 2002. Management determined that when the new accounting standards are adopted in 2003 they will not have a material impact on the Company’s financial condition or results of operations.
Reclassifications: Some items in the prior year financial statements have been reclassified to conform with the current year presentation.
NOTE 2 — SECURITIES
Year-end securities available for sale were as follows:
                                                                     Gross             Gross
                                                   Fair           Unrealized        Unrealized
                                                   Value             Gains            Losses
                                                   -----             -----            ------
2002
- ----
     U. S. Treasury and
        government agencies                  $    18,710,181    $     204,836     $            -
     Obligations of states and
        political subdivisions                     4,380,088          261,462                  -
     Mortgage-backed securities                    2,125,584           83,625                  -
                                             ---------------    -------------     --------------

                                             $    25,215,853    $     549,923     $            -
                                             ===============    =============     ==============


                                                                     Gross             Gross
                                                   Fair           Unrealized        Unrealized
                                                   Value             Gains            Losses
                                                   -----             -----            ------
2001
- ----
     U. S. Treasury and
        government agencies                  $    18,064,679    $     180,506     $       (1,490)
     Obligations of states and
        political subdivisions                     5,132,785          164,693                  -
     Mortgage-backed securities                    2,771,777           37,547                  -
                                             ---------------    -------------     --------------

                                             $    25,969,241    $     382,746     $       (1,490)
                                             ===============    =============     ==============
(Continued)
26.
NOTE 2 – SECURITIES (Continued)
Contractual maturities of debt securities at year-end 2002 were as follows. Securities not due at a single maturity date, primarily mortgage-backed securities, are shown separately.
                                                                                       Fair
                                                                                       Value
                                                                                       -----

     Due in one year or less                                                      $      961,297
     Due from one to five years                                                       21,105,002
     Due from five to ten years                                                          576,286
     Due after ten years                                                                 447,684
                                                                                  --------------
                                                                                      23,090,269
     Mortgage-backed securities                                                        2,125,584
                                                                                  --------------

                                                                                  $   25,215,853
                                                                                  ==============
Sales of securities available for sale were:
                                                            2002               2001                2000
                                                            ----               ----                ----

     Proceeds from sales                             $      3,508,838    $          -         $           -
     Gross gains from sales                                     8,838               -                     -
     Gross losses from sales                                        -               -                     -
In addition to Federal Home Loan Bank (FHLB) stock, securities with a fair value of approximately $4,030,000 and $5,023,000 at year-end 2002 and 2001 were pledged to secure, public deposits, repurchase agreements and U.S. Treasury demand notes. Except as indicated, total securities of any state (including all its political subdivisions) were less than 10% of shareholders’ equity. At year-end 2002 and 2001, fair value of securities issued by the state of Michigan and all its political subdivisions totaled $3,953,000 and $4,714,000.
NOTE 3 – LOANS RECEIVABLE
Year-end loans receivable are as follows:
                                                                                2002                 2001
                                                                                ----                 ----

     Commercial                                                          $    152,854,003     $    123,306,677
     Agricultural                                                              30,578,909           31,764,155
     Real Estate Mortgage                                                      10,081,177           17,408,540
     Real Estate Construction                                                   9,013,211            7,318,226
     Consumer                                                                  33,242,400           34,951,480
                                                                         ----------------     ----------------
       Gross loans receivable                                                 235,769,700          214,749,078
     Deferred loan origination fees/costs, net                                    (61,037)              40,613
     Allowance for loan losses                                                 (2,659,935)          (2,200,157)
                                                                         ----------------     ----------------

       Net loans receivable                                              $    233,048,728     $    212,589,534
                                                                         ================     ================
(Continued)
27.
NOTE 3 – LOANS RECEIVABLE(Continued)
Certain directors and executive officers of the Company, including associates of such persons, were loan customers of the Company during 2002 and 2001. A summary of aggregate related party loan activity for loans aggregating $60,000 or more to any related party is as follows:
                                                                                2002                 2001
                                                                                ----                 ----

     Balance at January 1                                                $      3,876,891     $      2,441,625
     New loans                                                                  6,174,454            4,840,600
     Repayments                                                                (6,713,026)          (3,489,144)
     Other adjustments                                                            (78,794)              83,810
                                                                         ----------------     ----------------

     Balance at December 31                                              $      3,259,525     $      3,876,891
                                                                         ================     ================
NOTE 4 — ALLOWANCE FOR LOAN LOSSES
Activity in the allowance for loan losses was as follows:
                                                             2002                 2001                2000
                                                             ----                 ----                ----

     Beginning balance                                 $      2,200,157    $       2,287,438    $      4,646,484
     Loan charge-offs                                          (644,538)            (579,274)         (2,476,593)
     Loan recoveries                                            151,316              103,993              87,547
                                                       ----------------    -----------------    ----------------
         Net loan charge-offs                                  (493,222)            (475,281)         (2,389,046)
     Provision for loan losses                                  953,000              388,000              30,000
                                                       ----------------    -----------------    ----------------

     Ending balance                                    $      2,659,935    $       2,200,157    $      2,287,438
                                                       ================    =================    ================
Impaired loans were as follows:
                                                             2002                 2001                2000
                                                             ----                 ----                ----
     Year-end loans with no allowance for
       loan losses allocated                           $         54,000    $               -    $              -
     Year-end loans with allowance for loan
       losses allocated                                       1,119,000              652,000             325,000
                                                       ----------------    -----------------    ----------------

     Total impaired loans                              $      1,173,000    $         652,000    $        325,000
                                                       ================    =================    ================

     Amount of the allowance allocated                 $        153,000    $         367,000    $        106,000

     Average of impaired loans during the year                1,195,000              433,000           1,946,000

     Interest income recognized during
       impairment                                               101,000                5,000              49,000

     Cash-basis interest income recognized                       75,000                1,000              14,000
(Continued)
28.
NOTE 4 — ALLOWANCE FOR LOAN LOSSES (Continued)
Nonperforming loans were as follows:
                                                                 2002                2001
                                                                 ----                ----

     Loans past due over 90 days still on accrual      $        949,000    $       1,046,000
     Nonaccrual loans                                           648,000              230,000
Nonperforming loans and impaired loans are defined differently. Some loans may be included in both categories, whereas other loans may only be included in one category.
NOTE 5 — LOAN SERVICING
Loans serviced for others are not reported as assets. These loans totaled $300,255,000 and $227,205,000 at year-end 2002 and 2001. Related escrow balances were $632,000 and $459,000 at year-end 2002 and 2001.
Activity for capitalized mortgage servicing rights was as follows:
                                                              2002                2001               2000
                                                              ----                ----               ----
     Servicing rights:
         Beginning of year                              $      2,065,958    $      1,515,924    $    1,335,419
         Additions                                             2,431,749           1,340,930           495,039
         Amortization                                         (1,782,696)           (790,896)         (314,534)
                                                        ----------------    ----------------    --------------

         End of year                                    $      2,715,011    $      2,065,958    $    1,515,924
                                                        ================    ================    ==============
There was no valuation allowance at year-end 2002, 2001 or 2000 for mortgage servicing rights.
NOTE 6 — PREMISES AND EQUIPMENT
Year-end premises and equipment consist of:
                                                                                  2002               2001
                                                                                  ----               ----

     Land                                                                  $         697,001    $      669,812
     Buildings and improvements                                                    6,950,416         6,873,193
     Furniture and equipment                                                       6,984,371         6,527,324
                                                                           -----------------    --------------
         Total cost                                                               14,631,788        14,070,329
     Accumulated depreciation                                                     (8,317,548)       (7,459,203)
                                                                           -----------------    --------------

                                                                           $       6,314,240    $    6,611,126
                                                                           =================    ==============
(Continued)
29.
NOTE 7 — DEPOSITS
At year-end 2002, stated maturities of time deposits were as follows, for the years ending December 31:
                  2003                                                     $      65,349,430
                  2004                                                            26,592,262
                  2005                                                             8,923,313
                  2006                                                             1,826,533
                  2007                                                             1,384,450
                                                                           -----------------

                                                                           $     104,075,988
                                                                           =================
Time deposits exceeding $100,000 were approximately $37,137,000 and $41,964,000 at year-end 2002 and 2001.
At year-end 2002, stated maturities of time deposits exceeding $100,000 were as follows:
                  In 3 months or less                                      $      17,491,183
                  Over 3 through 6 months                                          6,917,298
                  Over 6 through 12 months                                         3,240,731
                  Over 12 months                                                   9,487,906
                                                                           -----------------

                                                                           $      37,137,118
                                                                           =================
Related party deposits were $1,081,000 and $756,000 at year-end 2002 and 2001.
NOTE 8 — BORROWED FUNDS
Repurchase Agreements
Information concerning repurchase agreements is summarized as follows:
                                                                                    2002              2001
                                                                                    ----              ----

Amount outstanding at year-end                                               $     2,216,604    $    1,889,248
Weighted average interest rate at year-end                                             1.38%              1.54%
Average daily balance during the year                                        $     2,851,826    $    2,145,855
Weighted average interest rate during the year                                         1.98%              2.76%
Maximum month-end balance during the year                                    $     3,653,102    $    4,615,219
Federal Home Loan Bank Advances
Federal Home Loan Bank (FHLB) advances totaled $5,128,572 and $5,504,984 at year-end 2002 and 2001. The balance at both year-ends consisted of one fixed rate advance with an interest rate of 6.04%. The Company has additional borrowing capacity at the FHLB as well as some borrowing capacity with correspondent banks.
(Continued)
30.
NOTE 8 — BORROWED FUNDS (Continued)
Pursuant to collateral agreements with the Federal Home Loan Bank, in addition to Federal Home Loan stock, advances are secured under a blanket lien arrangement by qualified 1-to-4 family mortgage loans with a carrying value of approximately $10,689,000 and $13,176,000 at year-end 2002 and 2001.
At year-end 2002, scheduled principal reductions on the advance were as follows for the years ending December 31:
                                                                               2002
                                                                               ----

                  2003                                                   $       407,278
                  2004                                                           440,675
                  2005                                                           476,810
                  2006                                                         3,803,809
                                                                         ---------------

                      Total FHLB advances                                $     5,128,572
                                                                         ===============
Borrowed funds include $1,290,000 of federal funds purchased as of December 31, 2002, and these borrowings matured in January of 2003. There were no federal funds purchased as of December 31, 2001.
NOTE 9 – TRUST PREFERRED SECURITIES
In December 2001, Lenawee Capital Trust I (“Capital Trust”), a wholly owned subsidiary of the Company, closed a pooled private offering of 5,000 Trust Preferred Securities with a liquidation amount of $1,000 per security. The proceeds of the offering were loaned to the Company in exchange for junior subordinated debentures with terms similar to the Trust Preferred Securities. The sole assets of Capital Trust are the junior subordinated debentures of the Company and payment thereunder. The junior subordinated debentures and the back-up obligations, in the aggregate, constitute a full and unconditional guarantee by the Company of the obligations of Capital Trust under the Trust Preferred Securities. Distributions on the Trust Preferred Securities are payable semi-annually at a variable rate of interest and are included in interest expense in the consolidated financial statements. The variable rate of interest is equal to the sum of the six month London Interbank Offered Rate and 3.75% with a maximum rate of 11.0% during the first five years, and the rate of interest is equal to 5.17% as of December 31, 2002. These securities are considered Tier 1 capital (with certain limitations applicable) under current regulatory guidelines. As of December 31, 2002 and 2001, the outstanding principal balance of the Trust Preferred Securities was $5,000,000. The principal balance of the Trust Preferred Securities are presented as a liability in the financial statements.
The trust preferred securities, which mature December 8, 2031, are subject to mandatory redemption, in whole or in part, upon repayment of the subordinated debentures at maturity or their earlier redemption at the liquidation preference plus accrued but unpaid distributions. The subordinated debentures are redeemable prior to the maturity date at the option of the Company on or after December 8, 2006 at their principal amount plus accrued but unpaid interest. The subordinated debentures are also redeemable in whole or in part from time to time, upon the occurrence of specific events defined within the trust indenture. The Company has the option to defer distributions on the subordinated debentures from time to time for a period not to exceed 5 consecutive years
NOTE 10 — INCOME TAXES
Income tax expense consists of:
                                                            2002               2001             2000
                                                            ----               ----             ----

     Current                                          $     1,255,086    $    1,189,935     $      753,556
     Deferred                                                  71,854           162,123            802,820
                                                      ---------------    --------------     --------------
         Total                                        $     1,326,940    $    1,352,058     $    1,556,376
                                                      ===============    ==============     ==============
(Continued)
31.
Income tax expense calculated at the statutory federal income tax rate of 34% differs from actual income tax expense as follows:
                                                            2002              2001               2000
                                                            ----              ----               ----

     Statutory rates                                  $     1,421,976    $    1,494,344     $    1,618,845
     Increase (decrease) from:
         Tax-exempt securities income                         (89,050)         (108,880)          (105,095)
         Non-deductible interest expense                        4,280             8,766             15,615
         Other, net                                           (10,266)          (42,172)            27,011
                                                      ---------------    --------------     --------------

                                                      $     1,326,940    $    1,352,058     $    1,556,376
                                                      ===============    ==============     ==============
Year-end deferred tax assets and liabilities consist of:
                                                            2002              2001
                                                            ----              ----
     Deferred tax assets
         Allowance for loan losses                    $       654,745    $      503,356
         Net deferred loan fees                               214,356           216,207
         Pension expense                                       77,481            32,187
         Minimum pension liability                            135,552                 -
         Other                                                 75,190            74,716
                                                      ---------------    --------------
              Total deferred tax assets                     1,157,324           826,466
                                                      ---------------    --------------
     Deferred tax liabilities
         Depreciation                                        (293,568)         (305,330)
         Mortgage servicing rights                           (923,104)         (644,182)
         Net unrealized gains on securities
           available for sale                                (188,772)         (129,688)
                                                      ---------------    --------------
              Total deferred tax liabilities               (1,405,444)       (1,079,200)
                                                      ---------------    --------------
     Net deferred tax asset (liability)               $      (248,120)   $     (252,734)
                                                      ===============    ==============
(Continued)
32.
NOTE 11 — EARNINGS PER SHARE
A reconciliation of the numerators and denominators of the basic earnings per share and diluted earnings per share computations for the years ended is presented below:
                                                                2002              2001               2000
Basic earnings per share                                        ----              ----               ----
     Net income available to common
       shareholders                                        $    2,855,342    $     3,043,072    $    3,204,933
                                                           ==============    ===============    ==============

     Weighted average common shares
       outstanding                                                841,947            849,833           853,910
                                                           ==============    ===============    ==============

         Basic earnings per share                              $    3.39          $  3.58           $   3.75
                                                               =========          =======           ========

Diluted earnings per share
     Net income available to common
       shareholders                                        $    2,855,342    $     3,043,072    $    3,204,933
                                                           ==============    ===============    ==============

     Weighted average common shares
       outstanding                                                841,947            849,833           853,910
     Add:  Dilutive effects of exercise of
       stock options                                                6,174              9,554            10,881
                                                           --------------    ---------------    --------------

     Weighted average common and dilutive
       potential common shares outstanding                        848,121            859,387           864,791
                                                           ==============    ===============    ==============

     Diluted earnings per share                                $    3.37          $  3.54           $   3.71
                                                               =========          =======           ========
Stock options for 20,120 shares of common stock were not considered in computing diluted earnings per common share for 2002 because these options were not dilutive. All stock options outstanding were dilutive during 2001 and 2000.
(Continued)
33.
NOTE 12 — EMPLOYEE BENEFITS
Defined Benefit Plan
Information about the pension plan was as follows.
                                                                                   2002               2001
                                                                                   ----               ----
     Change in benefit obligation:
         Beginning benefit obligation                                        $     2,179,093    $    1,958,501
         Service cost                                                                180,930           146,675
         Interest cost                                                               157,242           138,067
         Actuarial (gain) loss                                                       239,102              (589)
         Benefits paid                                                               (62,891)          (63,561)
                                                                             ---------------    --------------

         Ending benefit obligation                                           $     2,693,476    $    2,179,093
                                                                             ===============    ==============

     Change in plan assets, at fair value:
         Beginning plan assets                                               $     1,627,333    $    1,444,811
         Actual return                                                              (149,669)          (67,809)
         Employer contribution                                                       262,384           313,892
         Benefits paid                                                               (62,891)          (63,561)
                                                                             ---------------    --------------

         Ending plan assets                                                  $     1,677,157    $    1,627,333
                                                                             ===============    ==============

     Net amount recognized:
         Funded status                                                       $    (1,016,319)   $     (551,760)
         Unrecognized net actuarial loss                                           1,044,315           585,855
         Unrecognized transition obligation                                            4,108             8,213
         Minimum pension liability                                                  (398,683)                -
         Unrecognized prior service cost                                               5,390             8,099
                                                                             ---------------    --------------

         Prepaid (accrued) benefit cost                                      $       361,189    $       50,407
                                                                             ===============    ==============
The components of pension expense and related actuarial assumptions were as follows.
                                                               2002               2001               2000
                                                               ----               ----               ----

     Service cost                                          $      180,930    $       146,675    $      154,300
     Interest cost                                                157,242            138,067           122,931
     Expected return on plan assets                              (112,919)          (103,156)          (94,578)
     Amortization of prior service cost                             2,709              2,709             2,709
     Amortization of transition obligation                          4,105              4,105             4,105
     Recognized net actuarial loss                                 43,230             17,435            12,141
     Special termination benefit loss                                   -                  -            65,300
                                                           --------------    ---------------    --------------

         Net pension expense                               $      275,297    $       205,835    $      266,908
                                                           ==============    ===============    ==============

     Discount rate on benefit obligation                          6.75%               7.25%              7.5%
     Long-term expected rate of return on plan assets               8.0%               8.0%              8.0%
     Rate of compensation increase                                  5.0%               5.0%              5.0%
(Continued)
34.
NOTE 12 — EMPLOYEE BENEFITS(continued)
Accumulated other comprehensive income was decreased by $263,000, net of tax effects, to recognize the Company’s minimum pension liability at December 31, 2002.
ESOP and 401(k) Plan
The Company maintains an employee stock ownership plan (ESOP) covering employees hired before January 1, 1995. On January 1, 1995, the Company ceased making contributions to the ESOP.
At year-end 2002 and 2001, the ESOP held 78,103 and 86,296 shares of the Company’s stock, all of which is allocated to employees. Upon distribution of shares to a participant, the participant has the right to require the Company to purchase shares at the most recent appraised value in accordance with the terms and conditions of the plan. As such, these shares are classified as a liability in the financial statements. The appraisal value of the shares held by the ESOP was $4,100,000 and $4,444,000 at year-end 2002 and 2001.
The ESOP plan includes a 401(k) provision. Employees may elect to contribute up to 15% of their salaries, and the Company will match 100% of the contribution up to 2% of the eligible salaries. Expense relating to the 401(k) provision was $110,000, $119,000 and $97,000 in 2002, 2001 and 2000.
(Continued)
35.
NOTE 12 — EMPLOYEE BENEFITS (Continued)
Stock Option Plan
Stock option plans are used to reward directors and certain executive officers and provide them with an additional equity interest. Options are issued for 10 year periods and vest over five years. Information about options available for grant and options granted follows:
                                                                                                     Weighted-
                                                                                                      Average
                                                          Available               Options            Exercise
                                                          For Grant             Outstanding            Price
                                                          ---------             -----------            -----

Balance at January 1, 2000                                   27,460                 22,160              25.14
     Options issued                                          (5,720)                 5,720              44.00
                                                       ------------            -----------        -----------
Balance at December 31, 2000                                 21,740                 27,880              29.01
     Expiration of non-granted options                      (21,740)                     -                  -
     Options approved                                        50,000                      -                  -
     Options issued                                          (7,200)                 7,200              51.00
                                                       ------------            -----------        -----------
Balance at December 31, 2001                                 42,800                 35,080              33.53
     Options issued                                          (7,200)                 7,200              51.50
     Options exercised                                            -                 (2,024)             22.90
     Options forfeited                                        1,496                 (1,496)             45.92
                                                       ------------            -----------        -----------
Balance at December 31, 2002                                 37,096                 38,760         $    36.94
                                                       ============            ===========        ===========
Options exercisable at year-end are as follows:
                                                                                            Weighted-
                                                                                             Average
                                                                        Number of           Exercise
                                                                         Options              Price
                                                                         -------              -----

                         2002                                              20,052        $     27.88
                         2001                                              16,176              24.52
                         2000                                               9,964              22.25
Options outstanding at year-end 2002 were as follows:
                                   ---------------Outstanding----------------       -------Exerciseable-------
                                                   Weighted
                                                    Average         Weighted                         Weighted
Range of                                           Remaining         Average                          Average
Exercise                                          Contractual       Exercise                         Exercise
Prices                              Number           Life             Price          Number            Price
- ------                              ------           ----             -----          ------            -----

$18-$25                               14,600              4.0         $21.40            13,412           $21.08
$36-$44                               10,560              6.6         $40.00             5,280           $39.20
$51-$52                               13,600              8.8         $51.25             1,360           $51.00
                                   ---------                                         ---------

Outstanding at year end               38,760              6.4         $36.94            20,052           $27.88
                                   =========                                         =========
(Continued)
36.
NOTE 13 - COMMITMENTS, OFF-BALANCE-SHEET RISK AND CONTINGENCIES
At year-end 2002 and 2001, reserves of $2,699,000 and $3,308,000 were required as deposits with the Federal Reserve or as cash on hand. These reserves do not earn interest.
Some financial instruments are used in the normal course of business to meet the financing needs of customers. These financial instruments include commitments to extend credit, standby letters of credit and financial guarantees. These involve, to varying degrees, credit and interest-rate risk in excess of the amount reported in the financial statements.
The Company has the following commitments outstanding at year-end:
                                                                                 2002                2001
                                                                                 ----                ----

     Commitments to extend credit                                          $    59,819,000     $    56,017,000
     Credit card arrangements                                                    3,220,000           3,023,000
     Standby letters of credit                                                   1,870,000           2,197,000
                                                                           ---------------     ---------------

                                                                           $    64,909,000     $    61,237,000
                                                                           ===============     ===============
Commitments outstanding as of December 31, 2002 include fixed rate commitments totaling $22,827,000, and the majority of these fixed rate commitments have interest rates ranging from 6% to 9%.
Exposure to credit loss if the other party does not perform is represented by the contractual amount for commitments to extend credit, standby letters of credit, and financial guarantees written. The same credit policies are used for commitments and conditional obligations as are used for loans.
Commitments to extend credit are agreements to lend to a customer as long as there is no violation of any condition established in the commitment. Commitments generally have fixed expiration dates or other termination clauses and may require payment of a fee. Since many of the commitments are expected to expire without being used, the total commitments do not necessarily represent future cash requirements. Standby letters of credit and financial guarantees written are conditional commitments to guarantee a customer’s performance to a third party.
NOTE 14 — PARENT CORPORATION CONDENSED
The Company’s primary source of funds to pay dividends to shareholders is the dividends it receives from the Banks. The Banks are subject to certain restrictions on the amount of dividends they may declare without prior regulatory approval. At December 31, 2002, approximately $11,900,000 of the Banks’ retained earnings is available for transfer in the form of dividends without prior approval from regulatory agencies.
Following are condensed parent corporation financial statements.
(Continued)
37.
NOTE 14 – PARENT CORPORATION CONDENSED (Continued)
                                             CONDENSED BALANCE SHEETS
                                            December 31, 2002 and 2001

                                                                                       2002               2001
                                                                                       ----               ----
Assets
Cash and cash equivalents                                                         $    1,516,614    $     4,814,693
Securities available for sale                                                            372,961            621,133
Investment in subsidiaries                                                            32,481,854         27,764,249
Other                                                                                    173,758            158,235
                                                                                  --------------    ---------------

     Total assets                                                                 $   34,545,187    $    33,358,310
                                                                                  ==============    ===============

Liabilities and Shareholders' Equity
Trust preferred securities                                                        $    5,000,000    $     5,000,000
Other                                                                                    375,557            351,354
Common stock subject to repurchase obligation in ESOP                                  4,100,407          4,444,244
Shareholders' equity                                                                  25,069,223         23,562,712
                                                                                  --------------    ---------------

     Total liabilities and shareholders' equity                                   $   34,545,187    $    33,358,310
                                                                                  ==============    ===============
                                          CONDENSED STATEMENTS OF INCOME
                                             Years ended December 31,

                                                                      2002              2001               2000
                                                                      ----              ----               ----

Dividends from subsidiaries                                    $    1,300,000     $    4,375,000    $     1,200,000
Interest on securities                                                 22,625             29,363             38,183
Interest on trust preferred securities                               (292,697)           (26,345)                 -
Other expenses                                                        (79,004)           (44,559)          (118,318)
                                                               --------------     --------------    ---------------

Income before equity in undistributed income
  of subsidiary banks                                                 950,924          4,333,459          1,119,865

Equity (excess) in undistributed net income of
  subsidiaries                                                      1,868,688         (1,290,387)         2,085,068
                                                               --------------     --------------    ---------------

Income before income taxes                                          2,819,612          3,043,072          3,204,933

Income tax expense (benefit)                                          (35,730)                 -                  -
                                                               --------------     --------------    ---------------

Net income                                                     $    2,855,342     $    3,043,072    $     3,204,933
                                                               ==============     ==============    ===============
(Continued)
38.
NOTE 14 — PARENT CORPORATION CONDENSED (Continued)
                                          CONDENSED STATEMENTS OF INCOME
                                             Years ended December 31,

                                                                     2002            2001              2000
                                                                     ----            ----              ----
Operating activities
Net income                                                     $    2,855,342    $   3,043,072    $   3,204,933
Adjustments to reconcile net income to net cash
  provided by operating activities
     (Equity) excess in undistributed net income of
       subsidiaries                                                (1,868,688)       1,290,387       (2,085,068)
     Net amortization of investment securities                           (118)           1,420            4,100
     Stock option expense                                              34,451           36,481           23,465
     Other                                                              7,319          271,982           87,862
                                                               --------------    -------------    -------------
         Net cash from operating activities                         1,028,306        4,643,342        1,235,292

Investing Activities
     Investment in banking subsidiaries                            (3,000,000)      (5,000,000)               -
Activity in available for sale securities
     Maturities and calls                                             252,293          115,000          215,000
                                                               --------------    -------------    -------------
         Net cash from investing activities                        (2,747,707)      (4,885,000)         215,000

Financing Activities
Net proceeds from trust preferred securities                                -        4,850,417                -
Repurchase of common stock                                         (1,019,130)        (284,286)        (151,405)
Issuance of common stock                                              105,260          132,855          117,065
Stock options exercised                                                60,524                -                -
Dividends paid                                                       (725,332)        (674,065)        (802,450)
                                                               --------------    -------------    -------------
     Net cash from financing activities                            (1,578,678)       4,024,921         (836,790)
                                                               --------------    -------------    -------------

Net change in cash and cash equivalents                            (3,298,079)       3,783,263          613,502

Beginning cash and cash equivalents                                 4,814,693        1,031,430          417,928
                                                               --------------    -------------    -------------

Ending cash and cash equivalents                               $    1,516,614    $   4,814,693    $   1,031,430
                                                               ==============    =============    =============
(Continued)
39.
NOTE 15 — FAIR VALUES OF FINANCIAL INSTRUMENTS
The following methods and assumptions were used to estimate fair values for financial instruments. The carrying amount is considered to approximate fair value for cash and cash equivalents, demand and savings deposits, short-term borrowings, accrued interest, and variable rate loans or deposits that reprice frequently and fully. Securities fair values are based on quoted market prices or, if no quotes are available, on the rate and term of the security and on information about the issuer. For fixed rate loans or deposits and for variable rate loans or deposits with infrequent repricing or repricing limits, the fair value is estimated by discounted cash flow analysis using current market rates for the estimated life and credit risk. Fair values for impaired loans are estimated using discounted cash flow analyses or underlying collateral values, where applicable. Fair value of loans held for sale is based on market estimates. Fair value of mortgage servicing rights is estimated using discounted cash flows based on current market interest rates. The fair value of long-term borrowings is based on currently available rates for similar financing. The fair value of other financial instruments and off-balance-sheet items approximate cost and are not considered significant to this presentation.
The estimated year-end fair values of financial instruments were:
                                                          2 0 0 2                              2 0 0 1
                                                          -------                              -------
                                                Carrying                            Carrying
                                                 Amount           Fair Value         Amount            Fair Value
                                                 ------           ----------         ------            ----------
Financial assets:
- ----------------

Cash and cash equivalents                 $     11,222,644    $    11,223,000     $   24,276,998    $    24,277,000
Securities available for sale                   25,215,853         25,216,000         25,969,241         25,969,000
Federal Home Loan Bank stock                     2,503,700          2,504,000          2,503,700          2,504,000
Federal Reserve Bank stock                         493,350            493,000            480,000            480,000
Loans held for sale                              1,473,300          1,473,000            416,600            416,000
Loans, net                                     233,048,728        233,832,000        212,589,534        216,501,000
Accrued interest receivable                      1,867,988          1,868,000          1,877,744          1,878,000
Mortgage servicing rights                        2,715,011          2,715,000          2,065,958          2,066,000

Financial liabilities:
- ---------------------

Demand and savings deposits               $   (137,644,133)   $  (137,644,000)    $ (128,377,476)   $  (128,377,000)
Time deposits                                 (104,075,988)      (108,289,000)      (107,029,538)      (109,503,000)
Borrowed funds                                  (8,635,176)        (8,964,000)        (7,394,232)        (7,399,000)
Trust preferred securities                      (5,000,000)        (5,000,000)        (5,000,000)        (5,000,000)
(Continued)
40.
NOTE 16 — REGULATORY MATTERS
Banks and bank holding companies are subject to regulatory capital requirements administered by federal banking agencies. Capital adequacy guidelines and, additionally for banks, prompt corrective action regulations involve quantitative measures of assets, liabilities, and certain off-balance-sheet items calculated under regulatory accounting practices. Capital amounts and classifications are also subject to qualitative judgments by regulators. Failure to meet capital requirements can initiate regulatory action.
Prompt corrective action regulations provide five classifications: well capitalized, adequately capitalized, undercapitalized, significantly undercapitalized, and critically undercapitalized, although these terms are not used to represent overall financial condition. If adequately capitalized, regulatory approval is required to accept brokered deposits. If undercapitalized, capital distributions are limited, as is asset growth and expansion, and plans for capital restoration are required.
The Company and both banks were categorized as well capitalized at year-end. Actual and required capital levels (in millions) and ratios were:
                                                                                                Minimum Required
                                                                                                   To Be Well
                                                                     Minimum Required              Capitalized
                                                                        For Capital          Under Prompt Corrective
                                                Actual               Adequacy Purposes         Action Regulations
                                                ------               -----------------         ------------------
                                          Amount      Ratio          Amount      Ratio         Amount     Ratio
                                          ------      -----          ------      -----         ------     -----
2002
- ----
Total capital (to risk weighted assets)
   Consolidated                           $  36.7    14.6%           $ 20.2      8.0%          $ 25.2     10.0%
   Bank of Lenawee                           27.8    14.0              15.9      8.0             19.9     10.0
   Bank of Washtenaw                          7.2    13.7               4.2      8.0              5.3     10.0
Tier 1 capital (to risk weighted assets)
   Consolidated                              34.1    13.5              10.1      4.0             15.1      6.0
   Bank of Lenawee                           25.7    12.9               8.0      4.0             12.0      6.0
   Bank of Washtenaw                          6.7    12.6               2.1      4.0              3.2      6.0
Tier 1 capital (to average assets)
   Consolidated                              34.1    12.0              11.3      4.0             14.2      5.0
   Bank of Lenawee                           25.7    10.6               9.7      4.0             12.2      5.0
   Bank of Washtenaw                          6.7    10.9               2.4      4.0              3.1      5.0

2001
- ----
Total capital (to risk weighted assets)
   Consolidated                           $  34.9    15.3%           $ 18.3      8.0%          $ 22.9     10.0%
   Bank of Lenawee                           25.2    12.8              15.8      8.0             19.8     10.0
   Bank of Washtenaw                          4.5    14.6               2.5      8.0              3.1     10.0
Tier 1 capital (to risk weighted assets)
   Consolidated                              32.6    14.3               9.1      4.0             13.7      6.0
   Bank of Lenawee                           23.3    11.8               7.9      4.0             11.9      6.0
   Bank of Washtenaw                          4.2    13.6               1.2      4.0              1.9      6.0
Tier 1 capital (to average assets)
   Consolidated                              32.6    11.9              11.0      4.0             13.7      5.0
   Bank of Lenawee                           23.3     9.2              10.1      4.0             12.6      5.0
   Bank of Washtenaw                          4.2    12.1               1.4      4.0              1.7      5.0
(Continued)
41.
NOTE 16 — REGULATORY MATTERS (Continued)
Regulatory capital includes trust preferred securities issued by Lenawee Capital Trust I in December 2001 subject to certain limitations. Federal Reserve guidelines limit the amount of trust preferred securities which can be included in Tier 1 capital of the Company to 25% of total Tier 1 capital. At year-end 2002 and 2001, all of the trust preferred securities were included as Tier 1 capital of the Company.
NOTE 17 — QUARTERLY FINANCIAL DATA (UNAUDITED)
                                 Interest        Net Interest            Net             Earnings per Share
                                  Income            Income             Income          Basic             Diluted
                                  ------            ------             ------          -----             -------
2002
- ----
     First quarter            $    4,781,000    $     3,180,000    $      747,000    $     0.88      $     0.87
     Second quarter                4,686,000          3,140,000           560,000          0.66            0.66
     Third quarter                 4,871,000          3,376,000           668,000          0.80            0.79
     Fourth quarter                4,844,000          3,457,000           880,000          1.05            1.05

2001
- ----
     First quarter            $    5,409,000    $     3,135,000    $      733,000    $     0.86      $     0.85
     Second quarter                5,419,000          3,165,000           723,000          0.85            0.84
     Third quarter                 5,220,000          3,270,000           767,000          0.90            0.89
     Fourth quarter                4,964,000          3,244,000           820,000          0.97            0.96
(Continued)
42.
COMMON STOCK INFORMATION
There is a limited market for the Company’s common stock, which is traded in the over-the-counter market and quoted on the OTC Bulletin Board under the symbol PVLN. There are occasional sales through brokers and direct sales by shareholders of which the Company’s management is aware.
The following table sets forth the range of high and low sales prices of the Company’s Common Stock during 2002, 2001, and 2000, based on information made available to the Company, as well as per share cash dividends declared during those periods. Although management is not aware of any transactions at higher or lower prices, there may have been transactions at prices outside the ranges listed below:
                                                                                     Cash
                                          Sales Prices (1)                  Dividends Declared (1)
                                          ----------------                  ----------------------
             2002                      High                Low
             ----                      ----                ---
First Quarter...............          $50.50             $46.00                     0.20
Second Quarter..............          $50.00             $38.00                     0.22
Third Quarter...............          $42.00             $35.00                     0.22
Fourth Quarter..............          $43.50             $40.65                     0.22

             2001                      High                Low
             ----                      ----                ---
First Quarter...............          $64.00             $50.00                     0.20
Second Quarter..............          $63.00             $53.00                     0.20
Third Quarter...............          $60.25             $56.00                     0.20
Fourth Quarter..............          $56.00             $47.75                     0.20

             2000                      High                Low
             ----                      ----                ---
First Quarter...............          $72.50             $65.00                     0.34
Second Quarter..............          $67.50             $62.50                     0.20
Third Quarter...............          $65.00             $60.00                     0.20
- ------------------------------        $67.50             $60.00                     0.20
Fourth Quarter..............
(1) Adjusted for all stock splits.
The prices quoted above were obtained from theBloomberg System. The over-the-counter market quotations reflect interdealer prices without retail mark-up, mark-down or commission.
There are 3,000,000 shares of the Company’s common stock authorized, of which 831,182 shares were issued and outstanding as of December 31, 2002. There were approximately 598 shareholders of record, including trusts and shares jointly owned, as of that date.
The holders of the Company’s common stock are entitled to dividends when, as and if declared by the Board of Directors of the Company out of funds legally available for that purpose. Dividends have been paid four times annually. In determining dividends, the Board of Directors considers the earnings, capital requirements and financial condition of the Company and the Banks, along with other relevant factors. The Company’s principal source of funds for cash dividends is the dividends paid by the Banks. The ability of the Company and the Banks to pay dividends is subject to regulatory restrictions and requirements.
43.