
| Fund (Class) | Costs of a $10,000 investment | Costs paid as a percentage of a $10,000 investment |
| Invesco American Franchise Fund (Class A) | $111 | 0.96% |
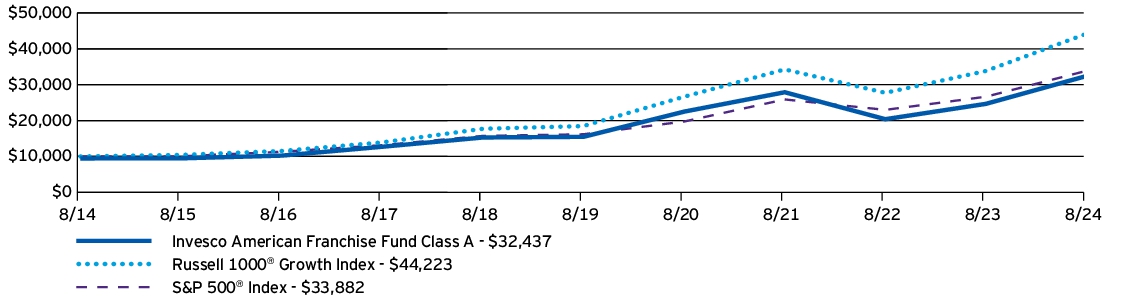
| AVERAGE ANNUAL TOTAL RETURNS | 1 Year | 5 Years | 10 Years |
| Invesco American Franchise Fund (Class A) —including sales charge | 24.27% | 14.65% | 12.49% |
| Invesco American Franchise Fund (Class A) —excluding sales charge | 31.53% | 15.96% | 13.12% |
| Russell 1000® Growth Index | 30.75% | 19.08% | 16.03% |
| S&P 500® Index | 27.14% | 15.92% | 12.98% |
| Fund net assets | $15,771,565,003 |
| Total number of portfolio holdings | 55 |
| Total advisory fees paid | $80,383,417 |
| Portfolio turnover rate | 51% |
(% of net assets)
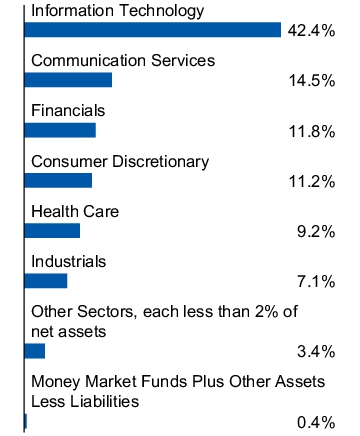
| NVIDIA Corp. | 10.91% |
| Microsoft Corp. | 9.58% |
| Apple, Inc. | 9.36% |
| Amazon.com, Inc. | 7.22% |
| Alphabet, Inc., Class A | 4.72% |
| Meta Platforms, Inc., Class A | 4.64% |
| Eli Lilly and Co. | 3.24% |
| Broadcom, Inc. | 3.20% |
| KKR & Co., Inc., Class A | 2.87% |
| Intuitive Surgical, Inc. | 2.44% |
| * Excluding money market fund holdings, if any. |
(% of net assets)


| Fund (Class) | Costs of a $10,000 investment | Costs paid as a percentage of a $10,000 investment |
| Invesco American Franchise Fund (Class C) | $197 | 1.71% |

| AVERAGE ANNUAL TOTAL RETURNS | 1 Year | 5 Years | 10 Years |
| Invesco American Franchise Fund (Class C) —including sales charge | 29.52% | 15.08% | 12.45% |
| Invesco American Franchise Fund (Class C) —excluding sales charge | 30.52% | 15.08% | 12.45% |
| Russell 1000® Growth Index | 30.75% | 19.08% | 16.03% |
| S&P 500® Index | 27.14% | 15.92% | 12.98% |
| Fund net assets | $15,771,565,003 |
| Total number of portfolio holdings | 55 |
| Total advisory fees paid | $80,383,417 |
| Portfolio turnover rate | 51% |
(% of net assets)
| NVIDIA Corp. | 10.91% |
| Microsoft Corp. | 9.58% |
| Apple, Inc. | 9.36% |
| Amazon.com, Inc. | 7.22% |
| Alphabet, Inc., Class A | 4.72% |
| Meta Platforms, Inc., Class A | 4.64% |
| Eli Lilly and Co. | 3.24% |
| Broadcom, Inc. | 3.20% |
| KKR & Co., Inc., Class A | 2.87% |
| Intuitive Surgical, Inc. | 2.44% |
| * Excluding money market fund holdings, if any. |
(% of net assets)
| Fund (Class) | Costs of a $10,000 investment | Costs paid as a percentage of a $10,000 investment |
| Invesco American Franchise Fund (Class R) | $140 | 1.21% |
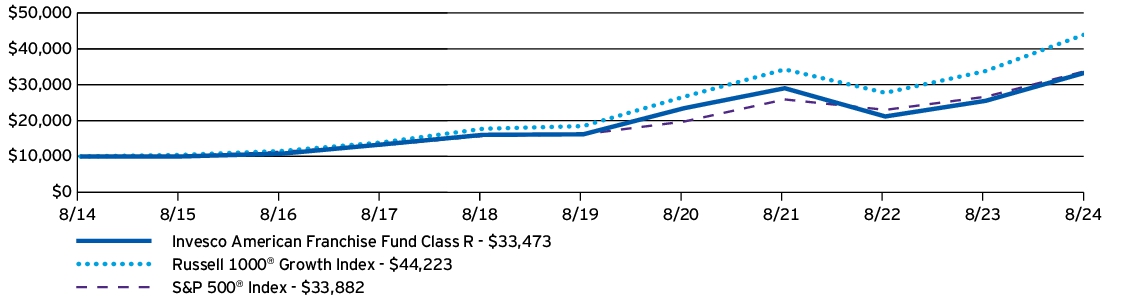
| AVERAGE ANNUAL TOTAL RETURNS | 1 Year | 5 Years | 10 Years |
| Invesco American Franchise Fund (Class R) | 31.16% | 15.65% | 12.84% |
| Russell 1000® Growth Index | 30.75% | 19.08% | 16.03% |
| S&P 500® Index | 27.14% | 15.92% | 12.98% |
| Fund net assets | $15,771,565,003 |
| Total number of portfolio holdings | 55 |
| Total advisory fees paid | $80,383,417 |
| Portfolio turnover rate | 51% |
(% of net assets)
| NVIDIA Corp. | 10.91% |
| Microsoft Corp. | 9.58% |
| Apple, Inc. | 9.36% |
| Amazon.com, Inc. | 7.22% |
| Alphabet, Inc., Class A | 4.72% |
| Meta Platforms, Inc., Class A | 4.64% |
| Eli Lilly and Co. | 3.24% |
| Broadcom, Inc. | 3.20% |
| KKR & Co., Inc., Class A | 2.87% |
| Intuitive Surgical, Inc. | 2.44% |
| * Excluding money market fund holdings, if any. |
(% of net assets)

| Fund (Class) | Costs of a $10,000 investment | Costs paid as a percentage of a $10,000 investment |
| Invesco American Franchise Fund (Class Y) | $82 | 0.71% |
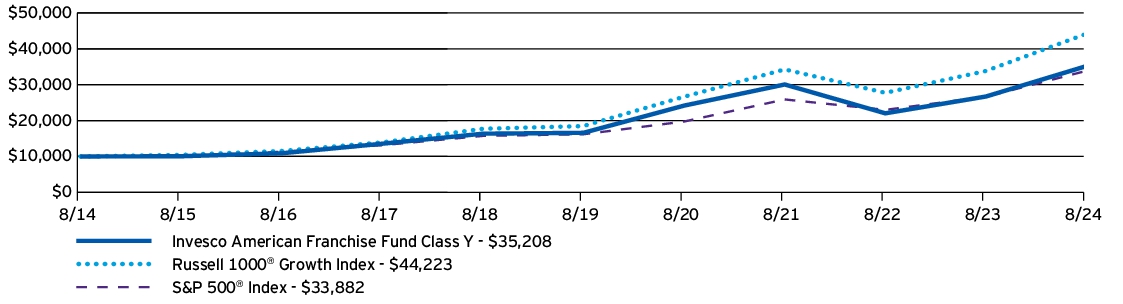
| AVERAGE ANNUAL TOTAL RETURNS | 1 Year | 5 Years | 10 Years |
| Invesco American Franchise Fund (Class Y) | 31.85% | 16.24% | 13.41% |
| Russell 1000® Growth Index | 30.75% | 19.08% | 16.03% |
| S&P 500® Index | 27.14% | 15.92% | 12.98% |
| Fund net assets | $15,771,565,003 |
| Total number of portfolio holdings | 55 |
| Total advisory fees paid | $80,383,417 |
| Portfolio turnover rate | 51% |
(% of net assets)
| NVIDIA Corp. | 10.91% |
| Microsoft Corp. | 9.58% |
| Apple, Inc. | 9.36% |
| Amazon.com, Inc. | 7.22% |
| Alphabet, Inc., Class A | 4.72% |
| Meta Platforms, Inc., Class A | 4.64% |
| Eli Lilly and Co. | 3.24% |
| Broadcom, Inc. | 3.20% |
| KKR & Co., Inc., Class A | 2.87% |
| Intuitive Surgical, Inc. | 2.44% |
| * Excluding money market fund holdings, if any. |
(% of net assets)

| Fund (Class) | Costs of a $10,000 investment | Costs paid as a percentage of a $10,000 investment |
| Invesco American Franchise Fund (Class R5) | $81 | 0.70% |
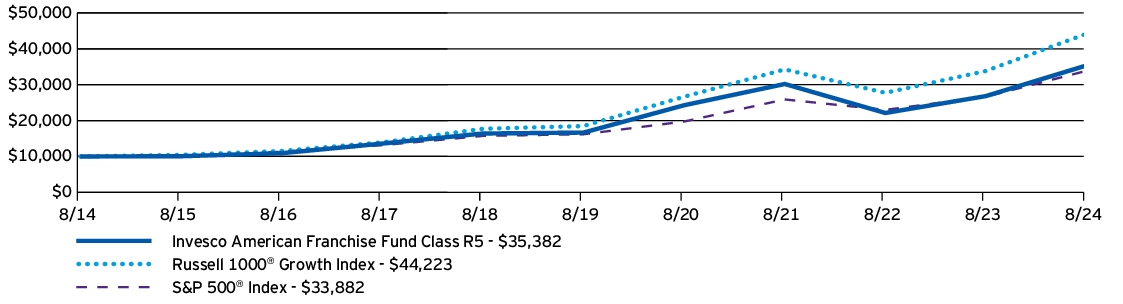
| AVERAGE ANNUAL TOTAL RETURNS | 1 Year | 5 Years | 10 Years |
| Invesco American Franchise Fund (Class R5) | 31.89% | 16.27% | 13.47% |
| Russell 1000® Growth Index | 30.75% | 19.08% | 16.03% |
| S&P 500® Index | 27.14% | 15.92% | 12.98% |
| Fund net assets | $15,771,565,003 |
| Total number of portfolio holdings | 55 |
| Total advisory fees paid | $80,383,417 |
| Portfolio turnover rate | 51% |
(% of net assets)
| NVIDIA Corp. | 10.91% |
| Microsoft Corp. | 9.58% |
| Apple, Inc. | 9.36% |
| Amazon.com, Inc. | 7.22% |
| Alphabet, Inc., Class A | 4.72% |
| Meta Platforms, Inc., Class A | 4.64% |
| Eli Lilly and Co. | 3.24% |
| Broadcom, Inc. | 3.20% |
| KKR & Co., Inc., Class A | 2.87% |
| Intuitive Surgical, Inc. | 2.44% |
| * Excluding money market fund holdings, if any. |
(% of net assets)

| Fund (Class) | Costs of a $10,000 investment | Costs paid as a percentage of a $10,000 investment |
| Invesco American Franchise Fund (Class R6) | $73 | 0.63% |
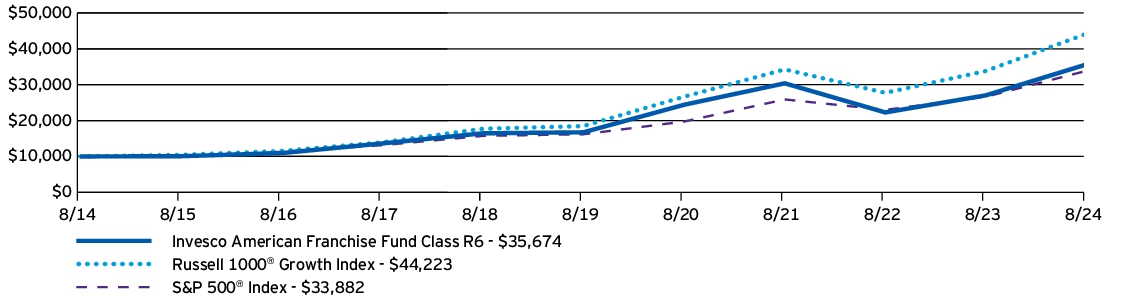
| AVERAGE ANNUAL TOTAL RETURNS | 1 Year | 5 Years | 10 Years |
| Invesco American Franchise Fund (Class R6) | 31.94% | 16.35% | 13.56% |
| Russell 1000® Growth Index | 30.75% | 19.08% | 16.03% |
| S&P 500® Index | 27.14% | 15.92% | 12.98% |
| Fund net assets | $15,771,565,003 |
| Total number of portfolio holdings | 55 |
| Total advisory fees paid | $80,383,417 |
| Portfolio turnover rate | 51% |
(% of net assets)
| NVIDIA Corp. | 10.91% |
| Microsoft Corp. | 9.58% |
| Apple, Inc. | 9.36% |
| Amazon.com, Inc. | 7.22% |
| Alphabet, Inc., Class A | 4.72% |
| Meta Platforms, Inc., Class A | 4.64% |
| Eli Lilly and Co. | 3.24% |
| Broadcom, Inc. | 3.20% |
| KKR & Co., Inc., Class A | 2.87% |
| Intuitive Surgical, Inc. | 2.44% |
| * Excluding money market fund holdings, if any. |
(% of net assets)

| Fund (Class) | Costs of a $10,000 investment | Costs paid as a percentage of a $10,000 investment |
| Invesco Capital Appreciation Fund (Class A) | $109 | 0.94%† |
† | Reflects fee waivers and/or expense reimbursements, without which expenses would have been higher. |
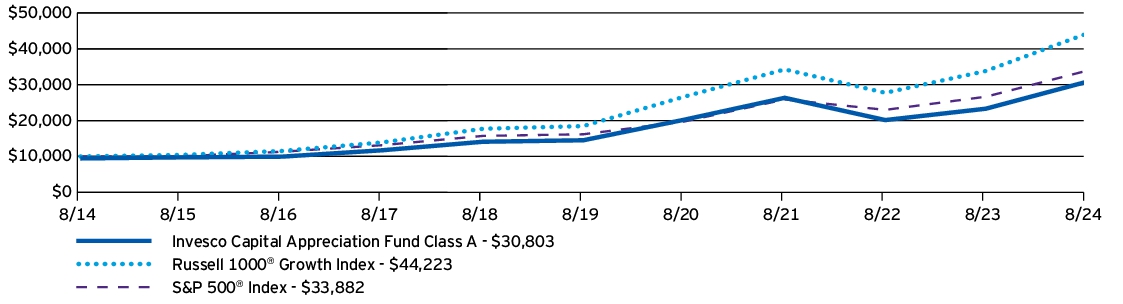
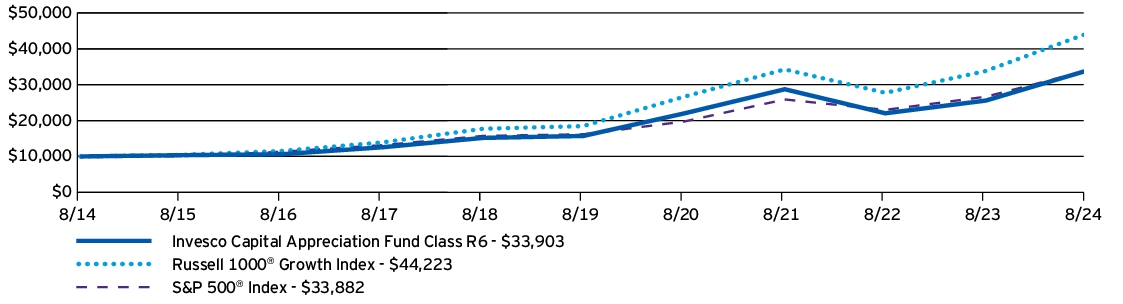
| AVERAGE ANNUAL TOTAL RETURNS | 1 Year | 5 Years | 10 Years |
| Invesco Capital Appreciation Fund (Class A) —including sales charge | 24.88% | 14.93% | 11.91% |
| Invesco Capital Appreciation Fund (Class A) —excluding sales charge | 32.15% | 16.24% | 12.54% |
| Russell 1000® Growth Index | 30.75% | 19.08% | 16.03% |
| S&P 500® Index | 27.14% | 15.92% | 12.98% |
| Fund net assets | $5,515,842,000 |
| Total number of portfolio holdings | 55 |
| Total advisory fees paid | $28,491,066 |
| Portfolio turnover rate | 55% |
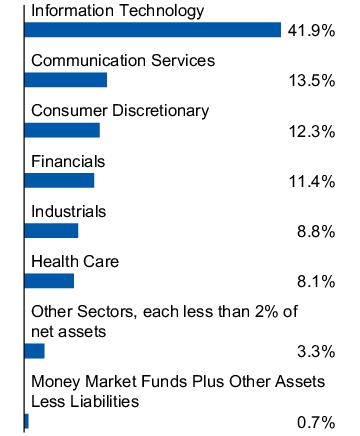
(% of net assets)
| NVIDIA Corp. | 10.71% |
| Microsoft Corp. | 9.70% |
| Apple, Inc. | 9.24% |
| Amazon.com, Inc. | 6.72% |
| Alphabet, Inc., Class C | 4.58% |
| Meta Platforms, Inc., Class A | 4.32% |
| Broadcom, Inc. | 3.14% |
| Eli Lilly and Co. | 2.93% |
| Netflix, Inc. | 2.24% |
| Boston Scientific Corp. | 2.15% |
| * Excluding money market fund holdings, if any. |
(% of net assets)

| Fund (Class) | Costs of a $10,000 investment | Costs paid as a percentage of a $10,000 investment |
| Invesco Capital Appreciation Fund (Class C) | $198 | 1.71%† |
† | Reflects fee waivers and/or expense reimbursements, without which expenses would have been higher. |
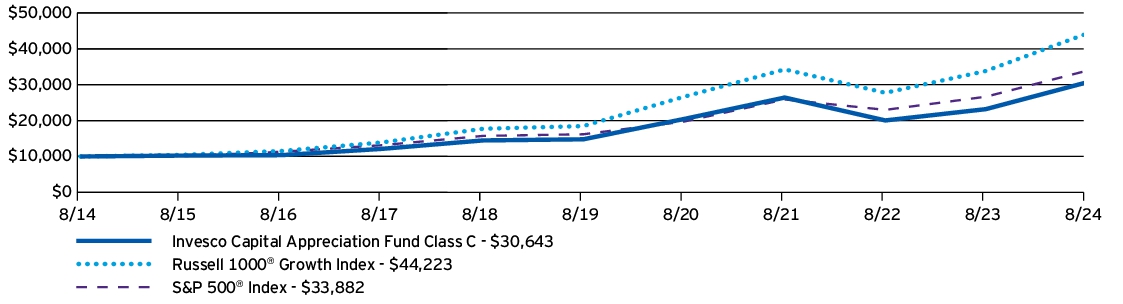
| AVERAGE ANNUAL TOTAL RETURNS | 1 Year | 5 Years | 10 Years |
| Invesco Capital Appreciation Fund (Class C) —including sales charge | 30.10% | 15.34% | 11.85% |
| Invesco Capital Appreciation Fund (Class C) —excluding sales charge | 31.10% | 15.34% | 11.85% |
| Russell 1000® Growth Index | 30.75% | 19.08% | 16.03% |
| S&P 500® Index | 27.14% | 15.92% | 12.98% |
| Fund net assets | $5,515,842,000 |
| Total number of portfolio holdings | 55 |
| Total advisory fees paid | $28,491,066 |
| Portfolio turnover rate | 55% |
(% of net assets)
| NVIDIA Corp. | 10.71% |
| Microsoft Corp. | 9.70% |
| Apple, Inc. | 9.24% |
| Amazon.com, Inc. | 6.72% |
| Alphabet, Inc., Class C | 4.58% |
| Meta Platforms, Inc., Class A | 4.32% |
| Broadcom, Inc. | 3.14% |
| Eli Lilly and Co. | 2.93% |
| Netflix, Inc. | 2.24% |
| Boston Scientific Corp. | 2.15% |
| * Excluding money market fund holdings, if any. |
(% of net assets)

| Fund (Class) | Costs of a $10,000 investment | Costs paid as a percentage of a $10,000 investment |
| Invesco Capital Appreciation Fund (Class R) | $140 | 1.21%† |
† | Reflects fee waivers and/or expense reimbursements, without which expenses would have been higher. |

| AVERAGE ANNUAL TOTAL RETURNS | 1 Year | 5 Years | 10 Years |
| Invesco Capital Appreciation Fund (Class R) | 31.79% | 15.93% | 12.24% |
| Russell 1000® Growth Index | 30.75% | 19.08% | 16.03% |
| S&P 500® Index | 27.14% | 15.92% | 12.98% |
| Fund net assets | $5,515,842,000 |
| Total number of portfolio holdings | 55 |
| Total advisory fees paid | $28,491,066 |
| Portfolio turnover rate | 55% |
(% of net assets)
| NVIDIA Corp. | 10.71% |
| Microsoft Corp. | 9.70% |
| Apple, Inc. | 9.24% |
| Amazon.com, Inc. | 6.72% |
| Alphabet, Inc., Class C | 4.58% |
| Meta Platforms, Inc., Class A | 4.32% |
| Broadcom, Inc. | 3.14% |
| Eli Lilly and Co. | 2.93% |
| Netflix, Inc. | 2.24% |
| Boston Scientific Corp. | 2.15% |
| * Excluding money market fund holdings, if any. |
(% of net assets)

| Fund (Class) | Costs of a $10,000 investment | Costs paid as a percentage of a $10,000 investment |
| Invesco Capital Appreciation Fund (Class Y) | $83 | 0.71%† |
† | Reflects fee waivers and/or expense reimbursements, without which expenses would have been higher. |

| AVERAGE ANNUAL TOTAL RETURNS | 1 Year | 5 Years | 10 Years |
| Invesco Capital Appreciation Fund (Class Y) | 32.43% | 16.50% | 12.80% |
| Russell 1000® Growth Index | 30.75% | 19.08% | 16.03% |
| S&P 500® Index | 27.14% | 15.92% | 12.98% |
| Fund net assets | $5,515,842,000 |
| Total number of portfolio holdings | 55 |
| Total advisory fees paid | $28,491,066 |
| Portfolio turnover rate | 55% |
(% of net assets)
| NVIDIA Corp. | 10.71% |
| Microsoft Corp. | 9.70% |
| Apple, Inc. | 9.24% |
| Amazon.com, Inc. | 6.72% |
| Alphabet, Inc., Class C | 4.58% |
| Meta Platforms, Inc., Class A | 4.32% |
| Broadcom, Inc. | 3.14% |
| Eli Lilly and Co. | 2.93% |
| Netflix, Inc. | 2.24% |
| Boston Scientific Corp. | 2.15% |
| * Excluding money market fund holdings, if any. |
(% of net assets)

| Fund (Class) | Costs of a $10,000 investment | Costs paid as a percentage of a $10,000 investment |
| Invesco Capital Appreciation Fund (Class R5) | $83 | 0.71% |

| AVERAGE ANNUAL TOTAL RETURNS | 1 Year | 5 Years | 10 Years |
| Invesco Capital Appreciation Fund (Class R5) | 32.43% | 16.55% | 12.70% |
| Russell 1000® Growth Index | 30.75% | 19.08% | 16.03% |
| S&P 500® Index | 27.14% | 15.92% | 12.98% |
| Fund net assets | $5,515,842,000 |
| Total number of portfolio holdings | 55 |
| Total advisory fees paid | $28,491,066 |
| Portfolio turnover rate | 55% |
(% of net assets)
| NVIDIA Corp. | 10.71% |
| Microsoft Corp. | 9.70% |
| Apple, Inc. | 9.24% |
| Amazon.com, Inc. | 6.72% |
| Alphabet, Inc., Class C | 4.58% |
| Meta Platforms, Inc., Class A | 4.32% |
| Broadcom, Inc. | 3.14% |
| Eli Lilly and Co. | 2.93% |
| Netflix, Inc. | 2.24% |
| Boston Scientific Corp. | 2.15% |
| * Excluding money market fund holdings, if any. |
(% of net assets)

| Fund (Class) | Costs of a $10,000 investment | Costs paid as a percentage of a $10,000 investment |
| Invesco Capital Appreciation Fund (Class R6) | $74 | 0.64% |
| AVERAGE ANNUAL TOTAL RETURNS | 1 Year | 5 Years | 10 Years |
| Invesco Capital Appreciation Fund (Class R6) | 32.54% | 16.61% | 12.99% |
| Russell 1000® Growth Index | 30.75% | 19.08% | 16.03% |
| S&P 500® Index | 27.14% | 15.92% | 12.98% |
| Fund net assets | $5,515,842,000 |
| Total number of portfolio holdings | 55 |
| Total advisory fees paid | $28,491,066 |
| Portfolio turnover rate | 55% |
(% of net assets)
| NVIDIA Corp. | 10.71% |
| Microsoft Corp. | 9.70% |
| Apple, Inc. | 9.24% |
| Amazon.com, Inc. | 6.72% |
| Alphabet, Inc., Class C | 4.58% |
| Meta Platforms, Inc., Class A | 4.32% |
| Broadcom, Inc. | 3.14% |
| Eli Lilly and Co. | 2.93% |
| Netflix, Inc. | 2.24% |
| Boston Scientific Corp. | 2.15% |
| * Excluding money market fund holdings, if any. |
(% of net assets)
| Fund (Class) | Costs of a $10,000 investment | Costs paid as a percentage of a $10,000 investment |
| Invesco Core Plus Bond Fund (Class A) | $78 | 0.74%† |
† | Reflects fee waivers and/or expense reimbursements, without which expenses would have been higher. |
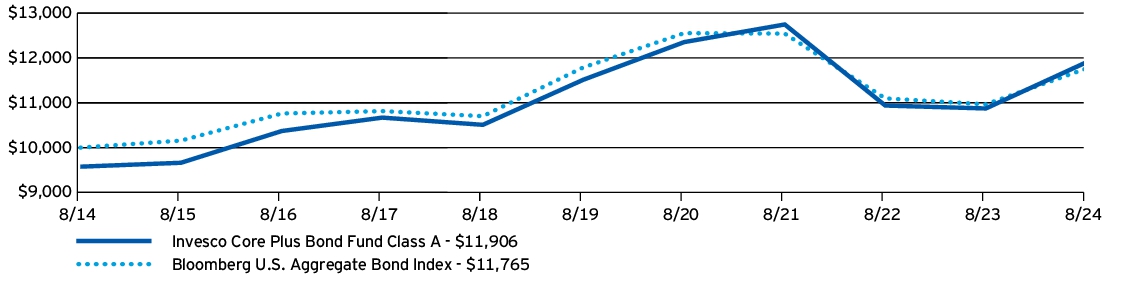
| AVERAGE ANNUAL TOTAL RETURNS | 1 Year | 5 Years | 10 Years |
| Invesco Core Plus Bond Fund (Class A) —including sales charge | 4.79% | (0.20)% | 1.76% |
| Invesco Core Plus Bond Fund (Class A) —excluding sales charge | 9.45% | 0.66% | 2.20% |
| Bloomberg U.S. Aggregate Bond Index | 7.30% | (0.04)% | 1.64% |
| Fund net assets | $5,494,700,631 |
| Total number of portfolio holdings | 1,446 |
| Total advisory fees paid | $16,707,685 |
| Portfolio turnover rate | 465% |
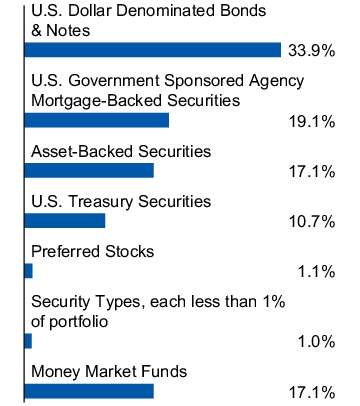
(% of total investments)

| Fund (Class) | Costs of a $10,000 investment | Costs paid as a percentage of a $10,000 investment |
| Invesco Core Plus Bond Fund (Class C) | $155 | 1.49%† |
† | Reflects fee waivers and/or expense reimbursements, without which expenses would have been higher. |
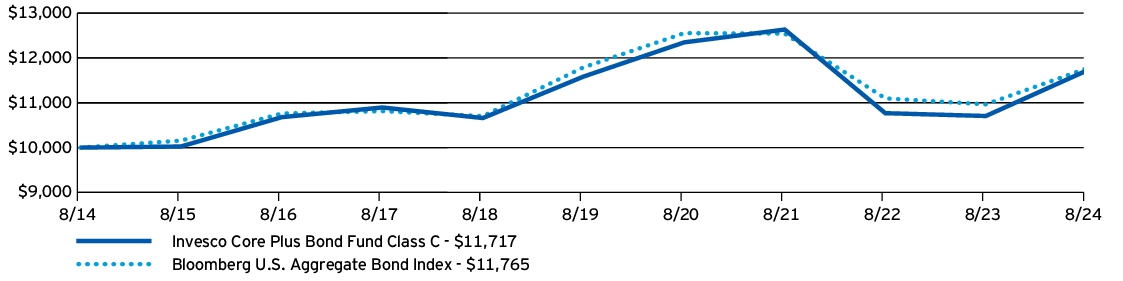
| AVERAGE ANNUAL TOTAL RETURNS | 1 Year | 5 Years | 10 Years |
| Invesco Core Plus Bond Fund (Class C) —including sales charge | 7.64% | (0.07)% | 1.60% |
| Invesco Core Plus Bond Fund (Class C) —excluding sales charge | 8.64% | (0.07)% | 1.60% |
| Bloomberg U.S. Aggregate Bond Index | 7.30% | (0.04)% | 1.64% |
| Fund net assets | $5,494,700,631 |
| Total number of portfolio holdings | 1,446 |
| Total advisory fees paid | $16,707,685 |
| Portfolio turnover rate | 465% |
(% of total investments)

| Fund (Class) | Costs of a $10,000 investment | Costs paid as a percentage of a $10,000 investment |
| Invesco Core Plus Bond Fund (Class R) | $104 | 0.99%† |
† | Reflects fee waivers and/or expense reimbursements, without which expenses would have been higher. |
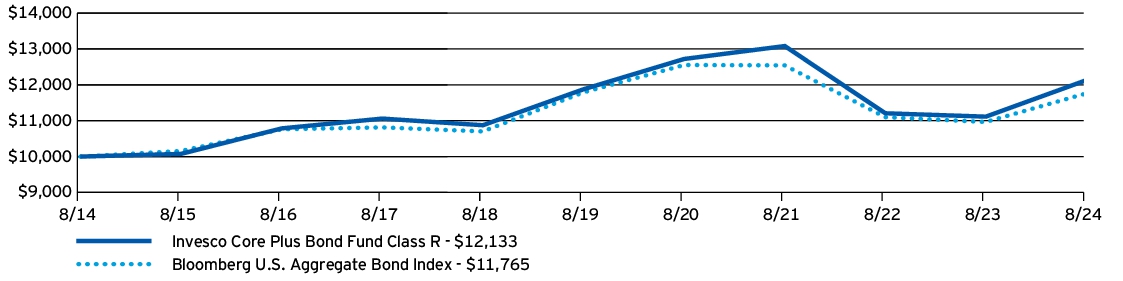
| AVERAGE ANNUAL TOTAL RETURNS | 1 Year | 5 Years | 10 Years |
| Invesco Core Plus Bond Fund (Class R) | 9.18% | 0.43% | 1.95% |
| Bloomberg U.S. Aggregate Bond Index | 7.30% | (0.04)% | 1.64% |
| Fund net assets | $5,494,700,631 |
| Total number of portfolio holdings | 1,446 |
| Total advisory fees paid | $16,707,685 |
| Portfolio turnover rate | 465% |
(% of total investments)
| Fund (Class) | Costs of a $10,000 investment | Costs paid as a percentage of a $10,000 investment |
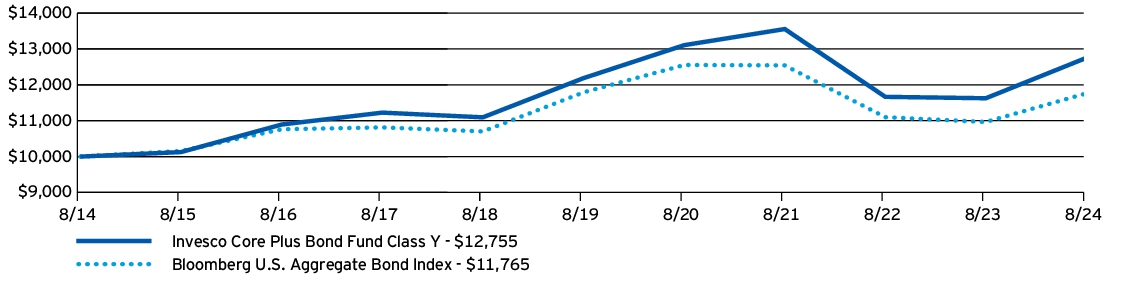
| Invesco Core Plus Bond Fund (Class Y) | $51 | 0.49%† |
† | Reflects fee waivers and/or expense reimbursements, without which expenses would have been higher. |
| AVERAGE ANNUAL TOTAL RETURNS | 1 Year | 5 Years | 10 Years |
| Invesco Core Plus Bond Fund (Class Y) | 9.72% | 0.92% | 2.46% |
| Bloomberg U.S. Aggregate Bond Index | 7.30% | (0.04)% | 1.64% |
| Fund net assets | $5,494,700,631 |
| Total number of portfolio holdings | 1,446 |
| Total advisory fees paid | $16,707,685 |
| Portfolio turnover rate | 465% |
(% of total investments)

| Fund (Class) | Costs of a $10,000 investment | Costs paid as a percentage of a $10,000 investment |
| Invesco Core Plus Bond Fund (Class R5) | $51 | 0.49%† |
† | Reflects fee waivers and/or expense reimbursements, without which expenses would have been higher. |

| AVERAGE ANNUAL TOTAL RETURNS | 1 Year | 5 Years | 10 Years |
| Invesco Core Plus Bond Fund (Class R5) | 9.72% | 0.93% | 2.47% |
| Bloomberg U.S. Aggregate Bond Index | 7.30% | (0.04)% | 1.64% |
| Fund net assets | $5,494,700,631 |
| Total number of portfolio holdings | 1,446 |
| Total advisory fees paid | $16,707,685 |
| Portfolio turnover rate | 465% |
(% of total investments)

| Fund (Class) | Costs of a $10,000 investment | Costs paid as a percentage of a $10,000 investment |
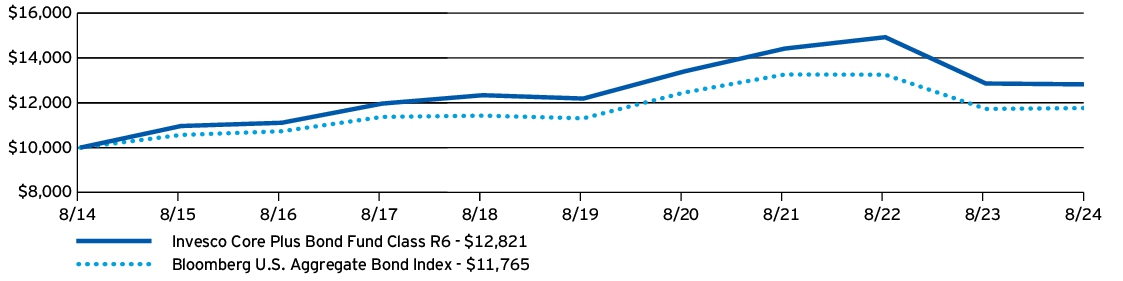
| Invesco Core Plus Bond Fund (Class R6) | $48 | 0.46%† |
† | Reflects fee waivers and/or expense reimbursements, without which expenses would have been higher. |
| AVERAGE ANNUAL TOTAL RETURNS | 1 Year | 5 Years | 10 Years |
| Invesco Core Plus Bond Fund (Class R6) | 9.77% | 0.97% | 2.52% |
| Bloomberg U.S. Aggregate Bond Index | 7.30% | (0.04)% | 1.64% |
| Fund net assets | $5,494,700,631 |
| Total number of portfolio holdings | 1,446 |
| Total advisory fees paid | $16,707,685 |
| Portfolio turnover rate | 465% |
(% of total investments)

| Fund (Class) | Costs of a $10,000 investment | Costs paid as a percentage of a $10,000 investment |
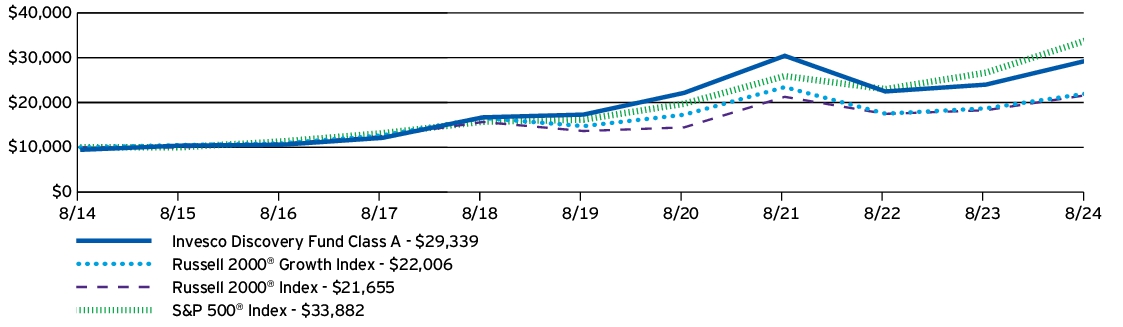
| Invesco Discovery Fund (Class A) | $116 | 1.04% |
| AVERAGE ANNUAL TOTAL RETURNS | 1 Year | 5 Years | 10 Years |
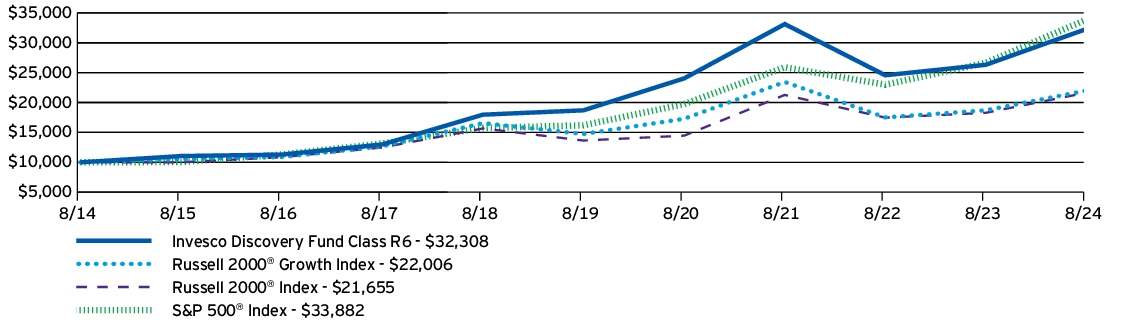
| Invesco Discovery Fund (Class A) —including sales charge | 15.59% | 9.89% | 11.36% |
| Invesco Discovery Fund (Class A) —excluding sales charge | 22.33% | 11.14% | 12.00% |
| Russell 2000® Growth Index | 17.67% | 8.35% | 8.21% |
| Russell 2000® Index | 18.47% | 9.68% | 8.03% |
| S&P 500® Index | 27.14% | 15.92% | 12.98% |
| Fund net assets | $4,716,854,154 |
| Total number of portfolio holdings | 111 |
| Total advisory fees paid | $24,136,937 |
| Portfolio turnover rate | 86% |
(% of net assets)
| Clean Harbors, Inc. | 2.64% |
| Comfort Systems USA, Inc. | 2.46% |
| Hamilton Lane, Inc., Class A | 2.34% |
| Evercore, Inc., Class A | 2.16% |
| Encompass Health Corp. | 1.88% |
| Carpenter Technology Corp. | 1.87% |
| Wingstop, Inc. | 1.85% |
| Modine Manufacturing Co. | 1.75% |
| CyberArk Software Ltd. | 1.73% |
| Onto Innovation, Inc. | 1.72% |
| * Excluding money market fund holdings, if any. |
(% of net assets)

| Fund (Class) | Costs of a $10,000 investment | Costs paid as a percentage of a $10,000 investment |
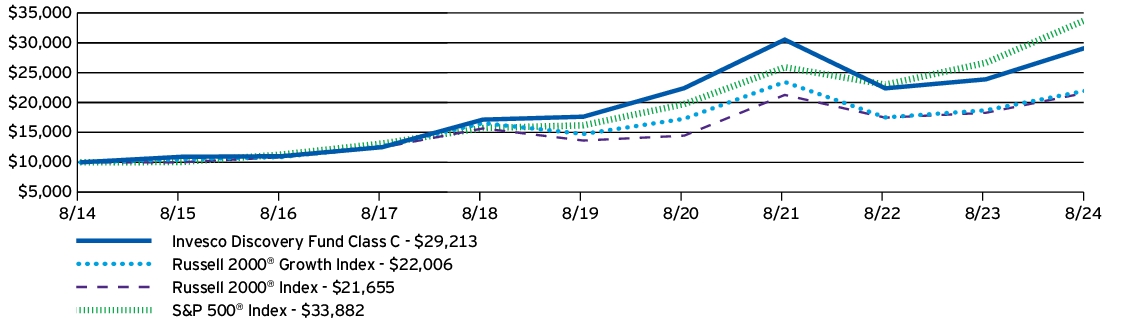
| Invesco Discovery Fund (Class C) | $199 | 1.80% |
| AVERAGE ANNUAL TOTAL RETURNS | 1 Year | 5 Years | 10 Years |
| Invesco Discovery Fund (Class C) —including sales charge | 20.38% | 10.29% | 11.32% |
| Invesco Discovery Fund (Class C) —excluding sales charge | 21.38% | 10.29% | 11.32% |
| Russell 2000® Growth Index | 17.67% | 8.35% | 8.21% |
| Russell 2000® Index | 18.47% | 9.68% | 8.03% |
| S&P 500® Index | 27.14% | 15.92% | 12.98% |
| Fund net assets | $4,716,854,154 |
| Total number of portfolio holdings | 111 |
| Total advisory fees paid | $24,136,937 |
| Portfolio turnover rate | 86% |
(% of net assets)
| Clean Harbors, Inc. | 2.64% |
| Comfort Systems USA, Inc. | 2.46% |
| Hamilton Lane, Inc., Class A | 2.34% |
| Evercore, Inc., Class A | 2.16% |
| Encompass Health Corp. | 1.88% |
| Carpenter Technology Corp. | 1.87% |
| Wingstop, Inc. | 1.85% |
| Modine Manufacturing Co. | 1.75% |
| CyberArk Software Ltd. | 1.73% |
| Onto Innovation, Inc. | 1.72% |
| * Excluding money market fund holdings, if any. |
(% of net assets)

| Fund (Class) | Costs of a $10,000 investment | Costs paid as a percentage of a $10,000 investment |
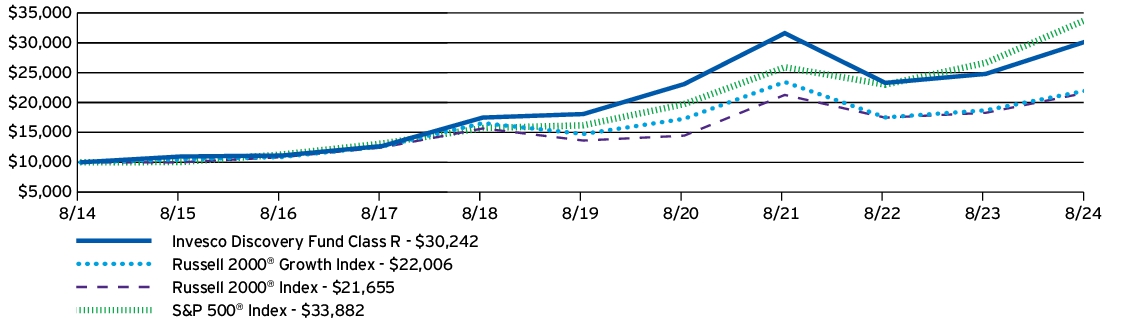
| Invesco Discovery Fund (Class R) | $144 | 1.30% |
| AVERAGE ANNUAL TOTAL RETURNS | 1 Year | 5 Years | 10 Years |
| Invesco Discovery Fund (Class R) | 21.98% | 10.85% | 11.70% |
| Russell 2000® Growth Index | 17.67% | 8.35% | 8.21% |
| Russell 2000® Index | 18.47% | 9.68% | 8.03% |
| S&P 500® Index | 27.14% | 15.92% | 12.98% |
| Fund net assets | $4,716,854,154 |
| Total number of portfolio holdings | 111 |
| Total advisory fees paid | $24,136,937 |
| Portfolio turnover rate | 86% |
(% of net assets)
| Clean Harbors, Inc. | 2.64% |
| Comfort Systems USA, Inc. | 2.46% |
| Hamilton Lane, Inc., Class A | 2.34% |
| Evercore, Inc., Class A | 2.16% |
| Encompass Health Corp. | 1.88% |
| Carpenter Technology Corp. | 1.87% |
| Wingstop, Inc. | 1.85% |
| Modine Manufacturing Co. | 1.75% |
| CyberArk Software Ltd. | 1.73% |
| Onto Innovation, Inc. | 1.72% |
| * Excluding money market fund holdings, if any. |
(% of net assets)

| Fund (Class) | Costs of a $10,000 investment | Costs paid as a percentage of a $10,000 investment |
| Invesco Discovery Fund (Class Y) | $89 | 0.80% |

| AVERAGE ANNUAL TOTAL RETURNS | 1 Year | 5 Years | 10 Years |
| Invesco Discovery Fund (Class Y) | 22.61% | 11.40% | 12.26% |
| Russell 2000® Growth Index | 17.67% | 8.35% | 8.21% |
| Russell 2000® Index | 18.47% | 9.68% | 8.03% |
| S&P 500® Index | 27.14% | 15.92% | 12.98% |
| Fund net assets | $4,716,854,154 |
| Total number of portfolio holdings | 111 |
| Total advisory fees paid | $24,136,937 |
| Portfolio turnover rate | 86% |
(% of net assets)
| Clean Harbors, Inc. | 2.64% |
| Comfort Systems USA, Inc. | 2.46% |
| Hamilton Lane, Inc., Class A | 2.34% |
| Evercore, Inc., Class A | 2.16% |
| Encompass Health Corp. | 1.88% |
| Carpenter Technology Corp. | 1.87% |
| Wingstop, Inc. | 1.85% |
| Modine Manufacturing Co. | 1.75% |
| CyberArk Software Ltd. | 1.73% |
| Onto Innovation, Inc. | 1.72% |
| * Excluding money market fund holdings, if any. |
(% of net assets)

| Fund (Class) | Costs of a $10,000 investment | Costs paid as a percentage of a $10,000 investment |
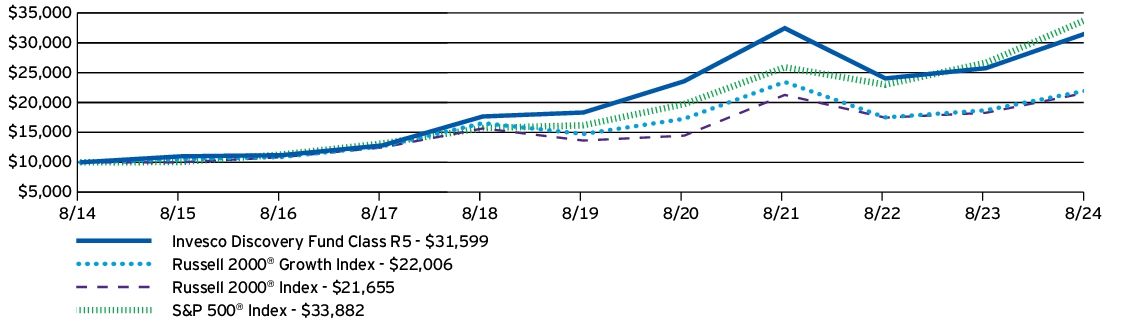
| Invesco Discovery Fund (Class R5) | $77 | 0.69% |
| AVERAGE ANNUAL TOTAL RETURNS | 1 Year | 5 Years | 10 Years |
| Invesco Discovery Fund (Class R5) | 22.76% | 11.51% | 12.19% |
| Russell 2000® Growth Index | 17.67% | 8.35% | 8.21% |
| Russell 2000® Index | 18.47% | 9.68% | 8.03% |
| S&P 500® Index | 27.14% | 15.92% | 12.98% |
| Fund net assets | $4,716,854,154 |
| Total number of portfolio holdings | 111 |
| Total advisory fees paid | $24,136,937 |
| Portfolio turnover rate | 86% |
(% of net assets)
| Clean Harbors, Inc. | 2.64% |
| Comfort Systems USA, Inc. | 2.46% |
| Hamilton Lane, Inc., Class A | 2.34% |
| Evercore, Inc., Class A | 2.16% |
| Encompass Health Corp. | 1.88% |
| Carpenter Technology Corp. | 1.87% |
| Wingstop, Inc. | 1.85% |
| Modine Manufacturing Co. | 1.75% |
| CyberArk Software Ltd. | 1.73% |
| Onto Innovation, Inc. | 1.72% |
| * Excluding money market fund holdings, if any. |
(% of net assets)

| Fund (Class) | Costs of a $10,000 investment | Costs paid as a percentage of a $10,000 investment |
| Invesco Discovery Fund (Class R6) | $74 | 0.66% |
| AVERAGE ANNUAL TOTAL RETURNS | 1 Year | 5 Years | 10 Years |
| Invesco Discovery Fund (Class R6) | 22.78% | 11.56% | 12.44% |
| Russell 2000® Growth Index | 17.67% | 8.35% | 8.21% |
| Russell 2000® Index | 18.47% | 9.68% | 8.03% |
| S&P 500® Index | 27.14% | 15.92% | 12.98% |
| Fund net assets | $4,716,854,154 |
| Total number of portfolio holdings | 111 |
| Total advisory fees paid | $24,136,937 |
| Portfolio turnover rate | 86% |
(% of net assets)
| Clean Harbors, Inc. | 2.64% |
| Comfort Systems USA, Inc. | 2.46% |
| Hamilton Lane, Inc., Class A | 2.34% |
| Evercore, Inc., Class A | 2.16% |
| Encompass Health Corp. | 1.88% |
| Carpenter Technology Corp. | 1.87% |
| Wingstop, Inc. | 1.85% |
| Modine Manufacturing Co. | 1.75% |
| CyberArk Software Ltd. | 1.73% |
| Onto Innovation, Inc. | 1.72% |
| * Excluding money market fund holdings, if any. |
(% of net assets)
| Fund (Class) | Costs of a $10,000 investment | Costs paid as a percentage of a $10,000 investment |
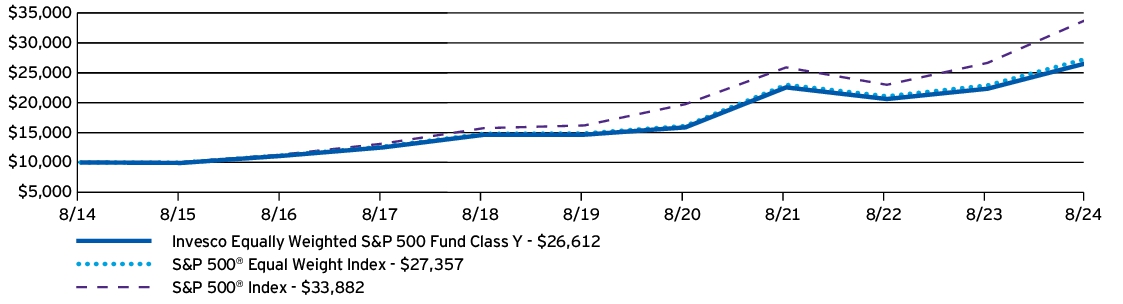
| Invesco Equally-Weighted S&P 500 Fund (Class A) | $59 | 0.54% |
| AVERAGE ANNUAL TOTAL RETURNS | 1 Year | 5 Years | 10 Years |
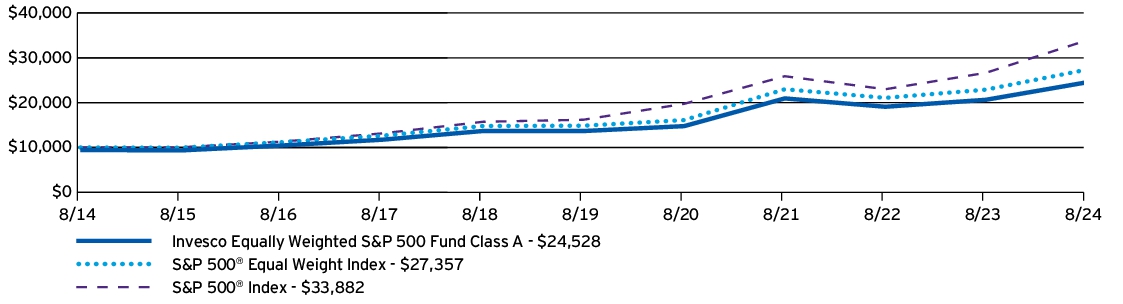
| Invesco Equally-Weighted S&P 500 Fund (Class A) —including sales charge | 12.35% | 11.15% | 9.39% |
| Invesco Equally-Weighted S&P 500 Fund (Class A) —excluding sales charge | 18.88% | 12.42% | 10.01% |
| S&P 500® Equal Weight Index | 19.49% | 12.99% | 10.59% |
| S&P 500® Index | 27.14% | 15.92% | 12.98% |
| Fund net assets | $6,867,543,191 |
| Total number of portfolio holdings | 508 |
| Total advisory fees paid | $6,779,584 |
| Portfolio turnover rate | 22% |
(% of net assets)
| Kellanova | 0.26% |
| Mohawk Industries, Inc. | 0.26% |
| Globe Life, Inc. | 0.25% |
| 3M Co. | 0.25% |
| CBRE Group, Inc., Class A | 0.25% |
| D.R. Horton, Inc. | 0.25% |
| Newmont Corp. | 0.24% |
| Iron Mountain, Inc. | 0.24% |
| KeyCorp | 0.24% |
| Equifax, Inc. | 0.24% |
| * Excluding money market fund holdings, if any. |
(% of net assets)

| Fund (Class) | Costs of a $10,000 investment | Costs paid as a percentage of a $10,000 investment |
| Invesco Equally-Weighted S&P 500 Fund (Class C) | $140 | 1.28% |
| AVERAGE ANNUAL TOTAL RETURNS | 1 Year | 5 Years | 10 Years |
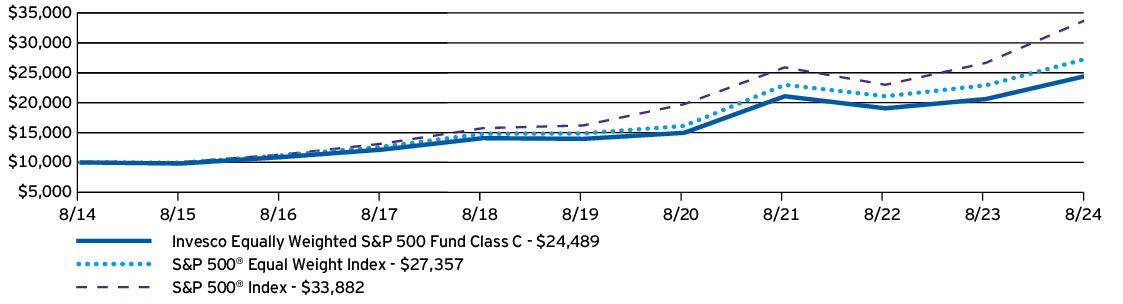
| Invesco Equally-Weighted S&P 500 Fund (Class C) —including sales charge | 17.01% | 11.59% | 9.37% |
| Invesco Equally-Weighted S&P 500 Fund (Class C) —excluding sales charge | 18.01% | 11.59% | 9.37% |
| S&P 500® Equal Weight Index | 19.49% | 12.99% | 10.59% |
| S&P 500® Index | 27.14% | 15.92% | 12.98% |
| Fund net assets | $6,867,543,191 |
| Total number of portfolio holdings | 508 |
| Total advisory fees paid | $6,779,584 |
| Portfolio turnover rate | 22% |
(% of net assets)
| Kellanova | 0.26% |
| Mohawk Industries, Inc. | 0.26% |
| Globe Life, Inc. | 0.25% |
| 3M Co. | 0.25% |
| CBRE Group, Inc., Class A | 0.25% |
| D.R. Horton, Inc. | 0.25% |
| Newmont Corp. | 0.24% |
| Iron Mountain, Inc. | 0.24% |
| KeyCorp | 0.24% |
| Equifax, Inc. | 0.24% |
| * Excluding money market fund holdings, if any. |
(% of net assets)

| Fund (Class) | Costs of a $10,000 investment | Costs paid as a percentage of a $10,000 investment |
| Invesco Equally-Weighted S&P 500 Fund (Class R) | $86 | 0.79% |

| AVERAGE ANNUAL TOTAL RETURNS | 1 Year | 5 Years | 10 Years |
| Invesco Equally-Weighted S&P 500 Fund (Class R) | 18.60% | 12.13% | 9.73% |
| S&P 500® Equal Weight Index | 19.49% | 12.99% | 10.59% |
| S&P 500® Index | 27.14% | 15.92% | 12.98% |
| Fund net assets | $6,867,543,191 |
| Total number of portfolio holdings | 508 |
| Total advisory fees paid | $6,779,584 |
| Portfolio turnover rate | 22% |
(% of net assets)
| Kellanova | 0.26% |
| Mohawk Industries, Inc. | 0.26% |
| Globe Life, Inc. | 0.25% |
| 3M Co. | 0.25% |
| CBRE Group, Inc., Class A | 0.25% |
| D.R. Horton, Inc. | 0.25% |
| Newmont Corp. | 0.24% |
| Iron Mountain, Inc. | 0.24% |
| KeyCorp | 0.24% |
| Equifax, Inc. | 0.24% |
| * Excluding money market fund holdings, if any. |
(% of net assets)

| Fund (Class) | Costs of a $10,000 investment | Costs paid as a percentage of a $10,000 investment |
| Invesco Equally-Weighted S&P 500 Fund (Class Y) | $32 | 0.29% |
| AVERAGE ANNUAL TOTAL RETURNS | 1 Year | 5 Years | 10 Years |
| Invesco Equally-Weighted S&P 500 Fund (Class Y) | 19.17% | 12.69% | 10.28% |
| S&P 500® Equal Weight Index | 19.49% | 12.99% | 10.59% |
| S&P 500® Index | 27.14% | 15.92% | 12.98% |
| Fund net assets | $6,867,543,191 |
| Total number of portfolio holdings | 508 |
| Total advisory fees paid | $6,779,584 |
| Portfolio turnover rate | 22% |
(% of net assets)
| Kellanova | 0.26% |
| Mohawk Industries, Inc. | 0.26% |
| Globe Life, Inc. | 0.25% |
| 3M Co. | 0.25% |
| CBRE Group, Inc., Class A | 0.25% |
| D.R. Horton, Inc. | 0.25% |
| Newmont Corp. | 0.24% |
| Iron Mountain, Inc. | 0.24% |
| KeyCorp | 0.24% |
| Equifax, Inc. | 0.24% |
| * Excluding money market fund holdings, if any. |
(% of net assets)

| Fund (Class) | Costs of a $10,000 investment | Costs paid as a percentage of a $10,000 investment |
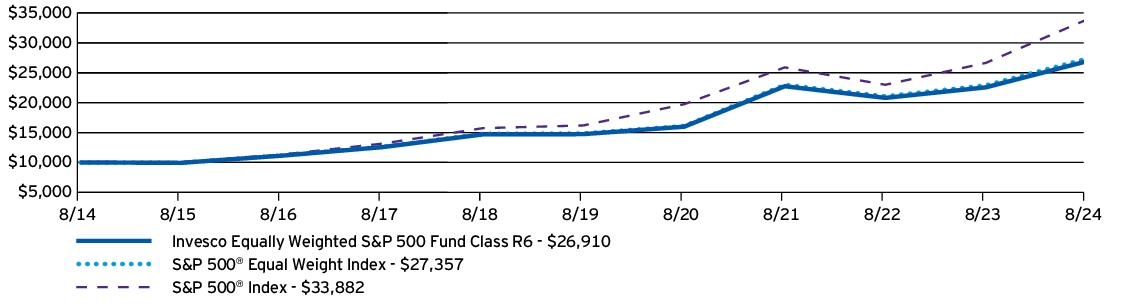
| Invesco Equally-Weighted S&P 500 Fund (Class R6) | $21 | 0.19% |
| AVERAGE ANNUAL TOTAL RETURNS | 1 Year | 5 Years | 10 Years |
| Invesco Equally-Weighted S&P 500 Fund (Class R6) | 19.30% | 12.81% | 10.41% |
| S&P 500® Equal Weight Index | 19.49% | 12.99% | 10.59% |
| S&P 500® Index | 27.14% | 15.92% | 12.98% |
| Fund net assets | $6,867,543,191 |
| Total number of portfolio holdings | 508 |
| Total advisory fees paid | $6,779,584 |
| Portfolio turnover rate | 22% |
(% of net assets)
| Kellanova | 0.26% |
| Mohawk Industries, Inc. | 0.26% |
| Globe Life, Inc. | 0.25% |
| 3M Co. | 0.25% |
| CBRE Group, Inc., Class A | 0.25% |
| D.R. Horton, Inc. | 0.25% |
| Newmont Corp. | 0.24% |
| Iron Mountain, Inc. | 0.24% |
| KeyCorp | 0.24% |
| Equifax, Inc. | 0.24% |
| * Excluding money market fund holdings, if any. |
(% of net assets)

| Fund (Class) | Costs of a $10,000 investment | Costs paid as a percentage of a $10,000 investment |
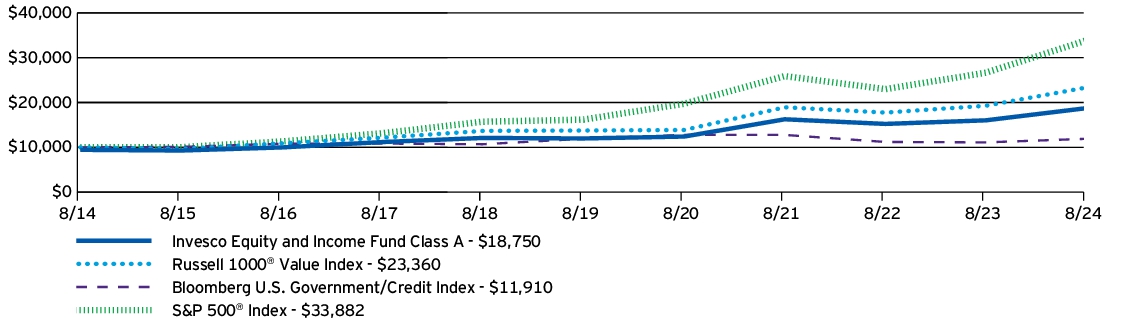
| Invesco Equity and Income Fund (Class A) | $84 | 0.77%† |
† | Reflects fee waivers and/or expense reimbursements, without which expenses would have been higher. |
| AVERAGE ANNUAL TOTAL RETURNS | 1 Year | 5 Years | 10 Years |
| Invesco Equity and Income Fund (Class A) —including sales charge | 10.48% | 8.12% | 6.49% |
| Invesco Equity and Income Fund (Class A) —excluding sales charge | 16.93% | 9.35% | 7.09% |
| Russell 1000® Value Index | 21.15% | 11.16% | 8.85% |
| Bloomberg U.S. Government/Credit Index | 7.21% | (0.02)% | 1.76% |
| S&P 500® Index | 27.14% | 15.92% | 12.98% |
| Fund net assets | $12,580,924,604 |
| Total number of portfolio holdings | 358 |
| Total advisory fees paid | $41,636,024 |
| Portfolio turnover rate | 139% |
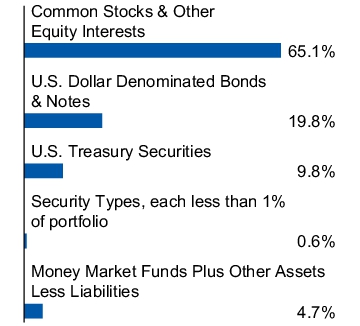
(% of net assets)
| U.S. Treasury Notes, 4.00%, 07/31/2029 | 2.56% |
| U.S. Treasury Notes, 4.38%, 07/31/2026 | 2.51% |
| Wells Fargo & Co. | 2.25% |
| Bank of America Corp. | 2.16% |
| U.S. Treasury Notes, 3.75%, 08/15/2027 | 1.81% |
| U.S. Treasury Notes, 4.13%, 07/31/2031 | 1.68% |
| Exxon Mobil Corp. | 1.57% |
| Parker-Hannifin Corp. | 1.46% |
| CBRE Group, Inc., Class A | 1.43% |
| Johnson & Johnson | 1.41% |
| * Excluding money market fund holdings, if any. |
(% of net assets)

| Fund (Class) | Costs of a $10,000 investment | Costs paid as a percentage of a $10,000 investment |
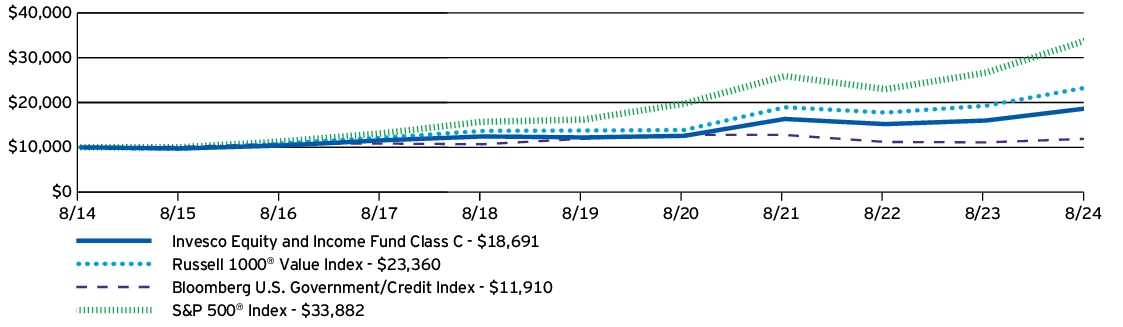
| Invesco Equity and Income Fund (Class C) | $163 | 1.51%† |
† | Reflects fee waivers and/or expense reimbursements, without which expenses would have been higher. |
| AVERAGE ANNUAL TOTAL RETURNS | 1 Year | 5 Years | 10 Years |
| Invesco Equity and Income Fund (Class C) —including sales charge | 15.13% | 8.55% | 6.45% |
| Invesco Equity and Income Fund (Class C) —excluding sales charge | 16.13% | 8.55% | 6.45% |
| Russell 1000® Value Index | 21.15% | 11.16% | 8.85% |
| Bloomberg U.S. Government/Credit Index | 7.21% | (0.02)% | 1.76% |
| S&P 500® Index | 27.14% | 15.92% | 12.98% |
| Fund net assets | $12,580,924,604 |
| Total number of portfolio holdings | 358 |
| Total advisory fees paid | $41,636,024 |
| Portfolio turnover rate | 139% |
(% of net assets)
| U.S. Treasury Notes, 4.00%, 07/31/2029 | 2.56% |
| U.S. Treasury Notes, 4.38%, 07/31/2026 | 2.51% |
| Wells Fargo & Co. | 2.25% |
| Bank of America Corp. | 2.16% |
| U.S. Treasury Notes, 3.75%, 08/15/2027 | 1.81% |
| U.S. Treasury Notes, 4.13%, 07/31/2031 | 1.68% |
| Exxon Mobil Corp. | 1.57% |
| Parker-Hannifin Corp. | 1.46% |
| CBRE Group, Inc., Class A | 1.43% |
| Johnson & Johnson | 1.41% |
| * Excluding money market fund holdings, if any. |
(% of net assets)

| Fund (Class) | Costs of a $10,000 investment | Costs paid as a percentage of a $10,000 investment |
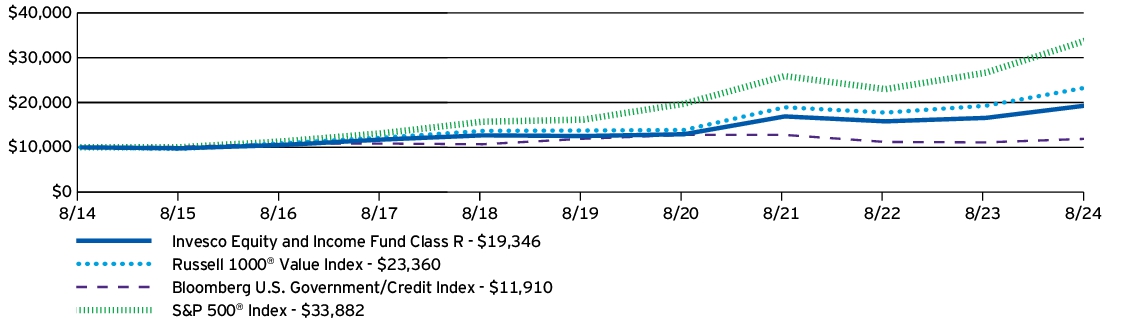
| Invesco Equity and Income Fund (Class R) | $111 | 1.02%† |
† | Reflects fee waivers and/or expense reimbursements, without which expenses would have been higher. |
| AVERAGE ANNUAL TOTAL RETURNS | 1 Year | 5 Years | 10 Years |
| Invesco Equity and Income Fund (Class R) | 16.74% | 9.10% | 6.82% |
| Russell 1000® Value Index | 21.15% | 11.16% | 8.85% |
| Bloomberg U.S. Government/Credit Index | 7.21% | (0.02)% | 1.76% |
| S&P 500® Index | 27.14% | 15.92% | 12.98% |
| Fund net assets | $12,580,924,604 |
| Total number of portfolio holdings | 358 |
| Total advisory fees paid | $41,636,024 |
| Portfolio turnover rate | 139% |
(% of net assets)
| U.S. Treasury Notes, 4.00%, 07/31/2029 | 2.56% |
| U.S. Treasury Notes, 4.38%, 07/31/2026 | 2.51% |
| Wells Fargo & Co. | 2.25% |
| Bank of America Corp. | 2.16% |
| U.S. Treasury Notes, 3.75%, 08/15/2027 | 1.81% |
| U.S. Treasury Notes, 4.13%, 07/31/2031 | 1.68% |
| Exxon Mobil Corp. | 1.57% |
| Parker-Hannifin Corp. | 1.46% |
| CBRE Group, Inc., Class A | 1.43% |
| Johnson & Johnson | 1.41% |
| * Excluding money market fund holdings, if any. |
(% of net assets)

| Fund (Class) | Costs of a $10,000 investment | Costs paid as a percentage of a $10,000 investment |
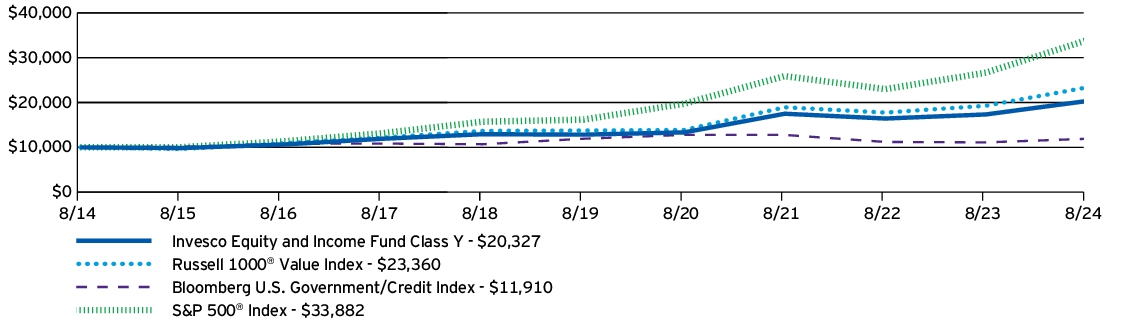
| Invesco Equity and Income Fund (Class Y) | $56 | 0.52%† |
† | Reflects fee waivers and/or expense reimbursements, without which expenses would have been higher. |
| AVERAGE ANNUAL TOTAL RETURNS | 1 Year | 5 Years | 10 Years |
| Invesco Equity and Income Fund (Class Y) | 17.23% | 9.63% | 7.35% |
| Russell 1000® Value Index | 21.15% | 11.16% | 8.85% |
| Bloomberg U.S. Government/Credit Index | 7.21% | (0.02)% | 1.76% |
| S&P 500® Index | 27.14% | 15.92% | 12.98% |
| Fund net assets | $12,580,924,604 |
| Total number of portfolio holdings | 358 |
| Total advisory fees paid | $41,636,024 |
| Portfolio turnover rate | 139% |
(% of net assets)
| U.S. Treasury Notes, 4.00%, 07/31/2029 | 2.56% |
| U.S. Treasury Notes, 4.38%, 07/31/2026 | 2.51% |
| Wells Fargo & Co. | 2.25% |
| Bank of America Corp. | 2.16% |
| U.S. Treasury Notes, 3.75%, 08/15/2027 | 1.81% |
| U.S. Treasury Notes, 4.13%, 07/31/2031 | 1.68% |
| Exxon Mobil Corp. | 1.57% |
| Parker-Hannifin Corp. | 1.46% |
| CBRE Group, Inc., Class A | 1.43% |
| Johnson & Johnson | 1.41% |
| * Excluding money market fund holdings, if any. |
(% of net assets)
| Fund (Class) | Costs of a $10,000 investment | Costs paid as a percentage of a $10,000 investment |
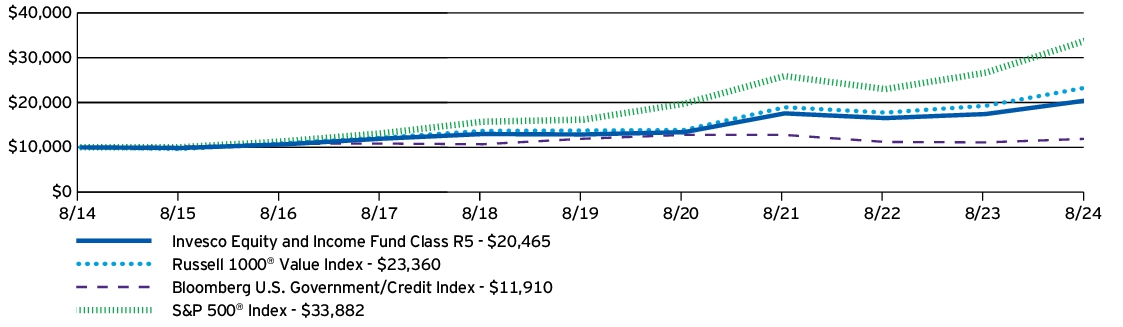
| Invesco Equity and Income Fund (Class R5) | $52 | 0.48%† |
† | Reflects fee waivers and/or expense reimbursements, without which expenses would have been higher. |
| AVERAGE ANNUAL TOTAL RETURNS | 1 Year | 5 Years | 10 Years |
| Invesco Equity and Income Fund (Class R5) | 17.39% | 9.71% | 7.42% |
| Russell 1000® Value Index | 21.15% | 11.16% | 8.85% |
| Bloomberg U.S. Government/Credit Index | 7.21% | (0.02)% | 1.76% |
| S&P 500® Index | 27.14% | 15.92% | 12.98% |
| Fund net assets | $12,580,924,604 |
| Total number of portfolio holdings | 358 |
| Total advisory fees paid | $41,636,024 |
| Portfolio turnover rate | 139% |
(% of net assets)
| U.S. Treasury Notes, 4.00%, 07/31/2029 | 2.56% |
| U.S. Treasury Notes, 4.38%, 07/31/2026 | 2.51% |
| Wells Fargo & Co. | 2.25% |
| Bank of America Corp. | 2.16% |
| U.S. Treasury Notes, 3.75%, 08/15/2027 | 1.81% |
| U.S. Treasury Notes, 4.13%, 07/31/2031 | 1.68% |
| Exxon Mobil Corp. | 1.57% |
| Parker-Hannifin Corp. | 1.46% |
| CBRE Group, Inc., Class A | 1.43% |
| Johnson & Johnson | 1.41% |
| * Excluding money market fund holdings, if any. |
(% of net assets)

| Fund (Class) | Costs of a $10,000 investment | Costs paid as a percentage of a $10,000 investment |
| Invesco Equity and Income Fund (Class R6) | $45 | 0.41%† |
† | Reflects fee waivers and/or expense reimbursements, without which expenses would have been higher. |

| AVERAGE ANNUAL TOTAL RETURNS | 1 Year | 5 Years | 10 Years |
| Invesco Equity and Income Fund (Class R6) | 17.48% | 9.77% | 7.50% |
| Russell 1000® Value Index | 21.15% | 11.16% | 8.85% |
| Bloomberg U.S. Government/Credit Index | 7.21% | (0.02)% | 1.76% |
| S&P 500® Index | 27.14% | 15.92% | 12.98% |
| Fund net assets | $12,580,924,604 |
| Total number of portfolio holdings | 358 |
| Total advisory fees paid | $41,636,024 |
| Portfolio turnover rate | 139% |
(% of net assets)
| U.S. Treasury Notes, 4.00%, 07/31/2029 | 2.56% |
| U.S. Treasury Notes, 4.38%, 07/31/2026 | 2.51% |
| Wells Fargo & Co. | 2.25% |
| Bank of America Corp. | 2.16% |
| U.S. Treasury Notes, 3.75%, 08/15/2027 | 1.81% |
| U.S. Treasury Notes, 4.13%, 07/31/2031 | 1.68% |
| Exxon Mobil Corp. | 1.57% |
| Parker-Hannifin Corp. | 1.46% |
| CBRE Group, Inc., Class A | 1.43% |
| Johnson & Johnson | 1.41% |
| * Excluding money market fund holdings, if any. |
(% of net assets)

| Fund (Class) | Costs of a $10,000 investment | Costs paid as a percentage of a $10,000 investment |
| Invesco Floating Rate ESG Fund (Class A) | $113 | 1.09% |

| AVERAGE ANNUAL TOTAL RETURNS | 1 Year | 5 Years | 10 Years |
| Invesco Floating Rate ESG Fund (Class A) —including sales charge | 5.41% | 4.05% | 3.60% |
| Invesco Floating Rate ESG Fund (Class A) —excluding sales charge | 8.03% | 4.58% | 3.86% |
| Credit Suisse Leveraged Loan Index | 9.81% | 5.54% | 4.72% |
| Bloomberg U.S. Aggregate Bond Index | 7.30% | (0.04)% | 1.64% |
| Fund net assets | $2,664,652,241 |
| Total number of portfolio holdings | 555 |
| Total advisory fees paid | $16,620,390 |
| Portfolio turnover rate | 46% |
(% of net assets)
| Monitronics International, Inc., Term Loan B, 13.01%, 06/30/2028 | 1.00% |
| Spin Holdco, Inc., Term Loan, 9.60%, 03/04/2028 | 0.94% |
| V Global Holdings LLC, Term Loan, 10.96%, 12/22/2027 | 0.79% |
| Virgin Media 02 - LG, Term Loan Q, 8.70%, 01/31/2029 | 0.76% |
| UPC - LG (Sunrise), Term Loan AX, 8.44%, 01/31/2029 | 0.71% |
| Restoration Forest Products Group, LLC | 0.69% |
| Robertshaw US Holding Corp., First Lien Term Loan, 0.00%, 02/28/2027 | 0.67% |
| Dun & Bradstreet Corp. (The), Incremental Term Loan B-2, 8.03%, 01/18/2029 | 0.66% |
| AI Aqua Merger Sub, Inc., Term Loan B, 8.84%, 07/31/2028 | 0.61% |
| Acrisure LLC, Term Loan B-6, 8.59%, 11/06/2030 | 0.61% |
| * Excluding money market fund holdings, if any. |
(% of total investments)
| BBB- | 1.4% |
| BB+ | 1.3% |
| BB | 8.5% |
| BB- | 7.9% |
| B+ | 14.7% |
| B | 23.3% |
| B- | 19.7% |
| CCC+ | 5.1% |
| CCC | 3.4% |
| CCC- | 0.2% |
| CC | 0.2% |
| D | 1.1% |
| Not-Rated | 9.9% |
| Equity | 3.3% |
| ** Source: S&P Global Ratings. A credit rating is an assessment provided by a nationally recognized statistical rating organization of the creditworthiness of an issuer with respect to debt obligations, including specific securities, money market instruments or other debts. Ratings are measured on a scale that generally ranges from AAA (highest) to D (lowest); ratings are subject to change without notice. “Non- Rated” indicates the debtor was not rated, and should not be interpreted as indicating low quality. For more information on S&P Global Ratings’ rating methodology, please visit spglobal.com and select “Understanding Credit Ratings” under About Ratings on the homepage. |
| Fund (Class) | Costs of a $10,000 investment | Costs paid as a percentage of a $10,000 investment |
| Invesco Floating Rate ESG Fund (Class C) | $165 | 1.59% |
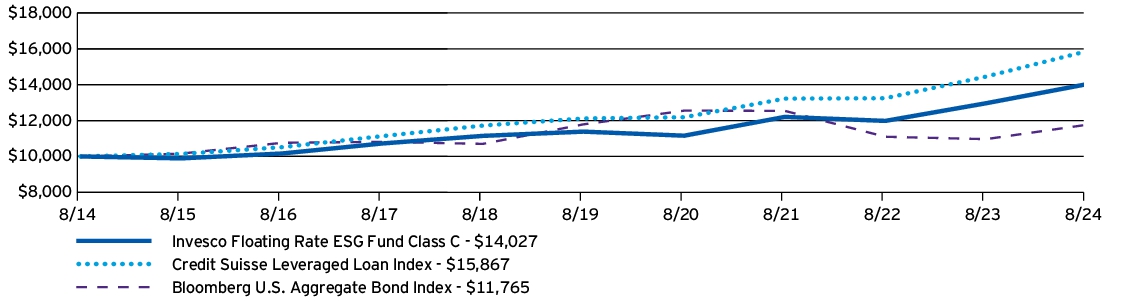
| AVERAGE ANNUAL TOTAL RETURNS | 1 Year | 5 Years | 10 Years |
| Invesco Floating Rate ESG Fund (Class C) —including sales charge | 6.66% | 4.05% | 3.44% |
| Invesco Floating Rate ESG Fund (Class C) —excluding sales charge | 7.49% | 4.05% | 3.44% |
| Credit Suisse Leveraged Loan Index | 9.81% | 5.54% | 4.72% |
| Bloomberg U.S. Aggregate Bond Index | 7.30% | (0.04)% | 1.64% |
| Fund net assets | $2,664,652,241 |
| Total number of portfolio holdings | 555 |
| Total advisory fees paid | $16,620,390 |
| Portfolio turnover rate | 46% |
(% of net assets)
| Monitronics International, Inc., Term Loan B, 13.01%, 06/30/2028 | 1.00% |
| Spin Holdco, Inc., Term Loan, 9.60%, 03/04/2028 | 0.94% |
| V Global Holdings LLC, Term Loan, 10.96%, 12/22/2027 | 0.79% |
| Virgin Media 02 - LG, Term Loan Q, 8.70%, 01/31/2029 | 0.76% |
| UPC - LG (Sunrise), Term Loan AX, 8.44%, 01/31/2029 | 0.71% |
| Restoration Forest Products Group, LLC | 0.69% |
| Robertshaw US Holding Corp., First Lien Term Loan, 0.00%, 02/28/2027 | 0.67% |
| Dun & Bradstreet Corp. (The), Incremental Term Loan B-2, 8.03%, 01/18/2029 | 0.66% |
| AI Aqua Merger Sub, Inc., Term Loan B, 8.84%, 07/31/2028 | 0.61% |
| Acrisure LLC, Term Loan B-6, 8.59%, 11/06/2030 | 0.61% |
| * Excluding money market fund holdings, if any. |
(% of total investments)
| BBB- | 1.4% |
| BB+ | 1.3% |
| BB | 8.5% |
| BB- | 7.9% |
| B+ | 14.7% |
| B | 23.3% |
| B- | 19.7% |
| CCC+ | 5.1% |
| CCC | 3.4% |
| CCC- | 0.2% |
| CC | 0.2% |
| D | 1.1% |
| Not-Rated | 9.9% |
| Equity | 3.3% |
| ** Source: S&P Global Ratings. A credit rating is an assessment provided by a nationally recognized statistical rating organization of the creditworthiness of an issuer with respect to debt obligations, including specific securities, money market instruments or other debts. Ratings are measured on a scale that generally ranges from AAA (highest) to D (lowest); ratings are subject to change without notice. “Non- Rated” indicates the debtor was not rated, and should not be interpreted as indicating low quality. For more information on S&P Global Ratings’ rating methodology, please visit spglobal.com and select “Understanding Credit Ratings” under About Ratings on the homepage. |
| Fund (Class) | Costs of a $10,000 investment | Costs paid as a percentage of a $10,000 investment |
| Invesco Floating Rate ESG Fund (Class R) | $139 | 1.34% |
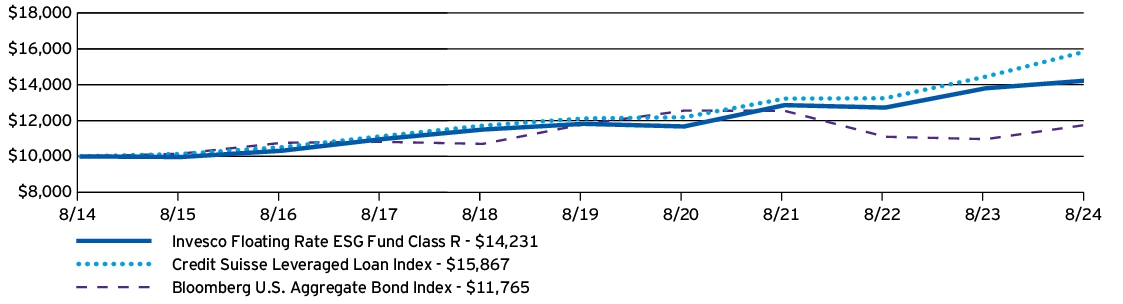
| AVERAGE ANNUAL TOTAL RETURNS | 1 Year | 5 Years | 10 Years |
| Invesco Floating Rate ESG Fund (Class R) | 7.93% | 4.32% | 3.59% |
| Credit Suisse Leveraged Loan Index | 9.81% | 5.54% | 4.72% |
| Bloomberg U.S. Aggregate Bond Index | 7.30% | (0.04)% | 1.64% |
| Fund net assets | $2,664,652,241 |
| Total number of portfolio holdings | 555 |
| Total advisory fees paid | $16,620,390 |
| Portfolio turnover rate | 46% |
(% of net assets)
| Monitronics International, Inc., Term Loan B, 13.01%, 06/30/2028 | 1.00% |
| Spin Holdco, Inc., Term Loan, 9.60%, 03/04/2028 | 0.94% |
| V Global Holdings LLC, Term Loan, 10.96%, 12/22/2027 | 0.79% |
| Virgin Media 02 - LG, Term Loan Q, 8.70%, 01/31/2029 | 0.76% |
| UPC - LG (Sunrise), Term Loan AX, 8.44%, 01/31/2029 | 0.71% |
| Restoration Forest Products Group, LLC | 0.69% |
| Robertshaw US Holding Corp., First Lien Term Loan, 0.00%, 02/28/2027 | 0.67% |
| Dun & Bradstreet Corp. (The), Incremental Term Loan B-2, 8.03%, 01/18/2029 | 0.66% |
| AI Aqua Merger Sub, Inc., Term Loan B, 8.84%, 07/31/2028 | 0.61% |
| Acrisure LLC, Term Loan B-6, 8.59%, 11/06/2030 | 0.61% |
| * Excluding money market fund holdings, if any. |
(% of total investments)
| BBB- | 1.4% |
| BB+ | 1.3% |
| BB | 8.5% |
| BB- | 7.9% |
| B+ | 14.7% |
| B | 23.3% |
| B- | 19.7% |
| CCC+ | 5.1% |
| CCC | 3.4% |
| CCC- | 0.2% |
| CC | 0.2% |
| D | 1.1% |
| Not-Rated | 9.9% |
| Equity | 3.3% |
| ** Source: S&P Global Ratings. A credit rating is an assessment provided by a nationally recognized statistical rating organization of the creditworthiness of an issuer with respect to debt obligations, including specific securities, money market instruments or other debts. Ratings are measured on a scale that generally ranges from AAA (highest) to D (lowest); ratings are subject to change without notice. “Non- Rated” indicates the debtor was not rated, and should not be interpreted as indicating low quality. For more information on S&P Global Ratings’ rating methodology, please visit spglobal.com and select “Understanding Credit Ratings” under About Ratings on the homepage. |
| Fund (Class) | Costs of a $10,000 investment | Costs paid as a percentage of a $10,000 investment |
| Invesco Floating Rate ESG Fund (Class Y) | $87 | 0.84% |

| AVERAGE ANNUAL TOTAL RETURNS | 1 Year | 5 Years | 10 Years |
| Invesco Floating Rate ESG Fund (Class Y) | 8.30% | 4.84% | 4.12% |
| Credit Suisse Leveraged Loan Index | 9.81% | 5.54% | 4.72% |
| Bloomberg U.S. Aggregate Bond Index | 7.30% | (0.04)% | 1.64% |
| Fund net assets | $2,664,652,241 |
| Total number of portfolio holdings | 555 |
| Total advisory fees paid | $16,620,390 |
| Portfolio turnover rate | 46% |
(% of net assets)
| Monitronics International, Inc., Term Loan B, 13.01%, 06/30/2028 | 1.00% |
| Spin Holdco, Inc., Term Loan, 9.60%, 03/04/2028 | 0.94% |
| V Global Holdings LLC, Term Loan, 10.96%, 12/22/2027 | 0.79% |
| Virgin Media 02 - LG, Term Loan Q, 8.70%, 01/31/2029 | 0.76% |
| UPC - LG (Sunrise), Term Loan AX, 8.44%, 01/31/2029 | 0.71% |
| Restoration Forest Products Group, LLC | 0.69% |
| Robertshaw US Holding Corp., First Lien Term Loan, 0.00%, 02/28/2027 | 0.67% |
| Dun & Bradstreet Corp. (The), Incremental Term Loan B-2, 8.03%, 01/18/2029 | 0.66% |
| AI Aqua Merger Sub, Inc., Term Loan B, 8.84%, 07/31/2028 | 0.61% |
| Acrisure LLC, Term Loan B-6, 8.59%, 11/06/2030 | 0.61% |
| * Excluding money market fund holdings, if any. |
(% of total investments)
| BBB- | 1.4% |
| BB+ | 1.3% |
| BB | 8.5% |
| BB- | 7.9% |
| B+ | 14.7% |
| B | 23.3% |
| B- | 19.7% |
| CCC+ | 5.1% |
| CCC | 3.4% |
| CCC- | 0.2% |
| CC | 0.2% |
| D | 1.1% |
| Not-Rated | 9.9% |
| Equity | 3.3% |
| ** Source: S&P Global Ratings. A credit rating is an assessment provided by a nationally recognized statistical rating organization of the creditworthiness of an issuer with respect to debt obligations, including specific securities, money market instruments or other debts. Ratings are measured on a scale that generally ranges from AAA (highest) to D (lowest); ratings are subject to change without notice. “Non- Rated” indicates the debtor was not rated, and should not be interpreted as indicating low quality. For more information on S&P Global Ratings’ rating methodology, please visit spglobal.com and select “Understanding Credit Ratings” under About Ratings on the homepage. |
| Fund (Class) | Costs of a $10,000 investment | Costs paid as a percentage of a $10,000 investment |
| Invesco Floating Rate ESG Fund (Class R5) | $87 | 0.84% |
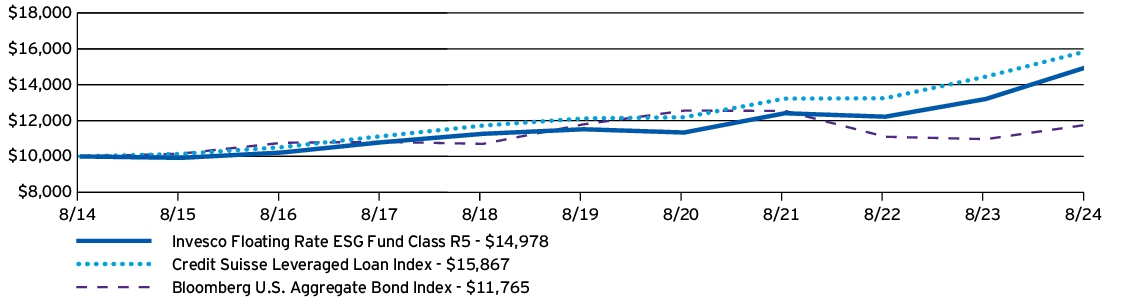
| AVERAGE ANNUAL TOTAL RETURNS | 1 Year | 5 Years | 10 Years |
| Invesco Floating Rate ESG Fund (Class R5) | 8.31% | 4.84% | 4.12% |
| Credit Suisse Leveraged Loan Index | 9.81% | 5.54% | 4.72% |
| Bloomberg U.S. Aggregate Bond Index | 7.30% | (0.04)% | 1.64% |
| Fund net assets | $2,664,652,241 |
| Total number of portfolio holdings | 555 |
| Total advisory fees paid | $16,620,390 |
| Portfolio turnover rate | 46% |
(% of net assets)
| Monitronics International, Inc., Term Loan B, 13.01%, 06/30/2028 | 1.00% |
| Spin Holdco, Inc., Term Loan, 9.60%, 03/04/2028 | 0.94% |
| V Global Holdings LLC, Term Loan, 10.96%, 12/22/2027 | 0.79% |
| Virgin Media 02 - LG, Term Loan Q, 8.70%, 01/31/2029 | 0.76% |
| UPC - LG (Sunrise), Term Loan AX, 8.44%, 01/31/2029 | 0.71% |
| Restoration Forest Products Group, LLC | 0.69% |
| Robertshaw US Holding Corp., First Lien Term Loan, 0.00%, 02/28/2027 | 0.67% |
| Dun & Bradstreet Corp. (The), Incremental Term Loan B-2, 8.03%, 01/18/2029 | 0.66% |
| AI Aqua Merger Sub, Inc., Term Loan B, 8.84%, 07/31/2028 | 0.61% |
| Acrisure LLC, Term Loan B-6, 8.59%, 11/06/2030 | 0.61% |
| * Excluding money market fund holdings, if any. |
(% of total investments)
| BBB- | 1.4% |
| BB+ | 1.3% |
| BB | 8.5% |
| BB- | 7.9% |
| B+ | 14.7% |
| B | 23.3% |
| B- | 19.7% |
| CCC+ | 5.1% |
| CCC | 3.4% |
| CCC- | 0.2% |
| CC | 0.2% |
| D | 1.1% |
| Not-Rated | 9.9% |
| Equity | 3.3% |
| ** Source: S&P Global Ratings. A credit rating is an assessment provided by a nationally recognized statistical rating organization of the creditworthiness of an issuer with respect to debt obligations, including specific securities, money market instruments or other debts. Ratings are measured on a scale that generally ranges from AAA (highest) to D (lowest); ratings are subject to change without notice. “Non- Rated” indicates the debtor was not rated, and should not be interpreted as indicating low quality. For more information on S&P Global Ratings’ rating methodology, please visit spglobal.com and select “Understanding Credit Ratings” under About Ratings on the homepage. |
| Fund (Class) | Costs of a $10,000 investment | Costs paid as a percentage of a $10,000 investment |
| Invesco Floating Rate ESG Fund (Class R6) | $80 | 0.77% |
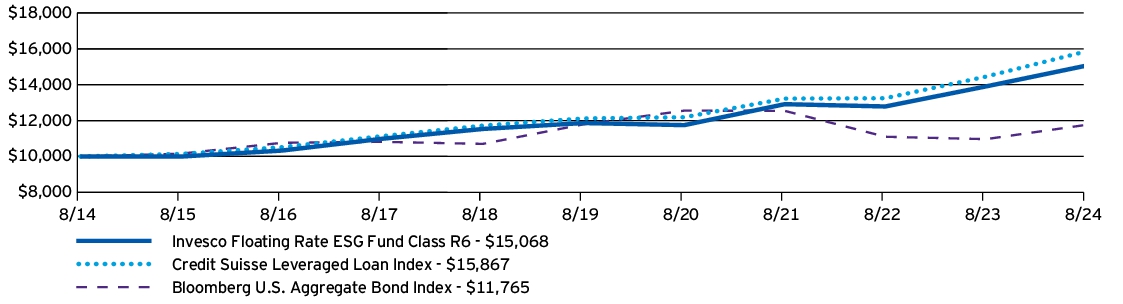
| AVERAGE ANNUAL TOTAL RETURNS | 1 Year | 5 Years | 10 Years |
| Invesco Floating Rate ESG Fund (Class R6) | 8.54% | 4.90% | 4.18% |
| Credit Suisse Leveraged Loan Index | 9.81% | 5.54% | 4.72% |
| Bloomberg U.S. Aggregate Bond Index | 7.30% | (0.04)% | 1.64% |
| Fund net assets | $2,664,652,241 |
| Total number of portfolio holdings | 555 |
| Total advisory fees paid | $16,620,390 |
| Portfolio turnover rate | 46% |
(% of net assets)
| Monitronics International, Inc., Term Loan B, 13.01%, 06/30/2028 | 1.00% |
| Spin Holdco, Inc., Term Loan, 9.60%, 03/04/2028 | 0.94% |
| V Global Holdings LLC, Term Loan, 10.96%, 12/22/2027 | 0.79% |
| Virgin Media 02 - LG, Term Loan Q, 8.70%, 01/31/2029 | 0.76% |
| UPC - LG (Sunrise), Term Loan AX, 8.44%, 01/31/2029 | 0.71% |
| Restoration Forest Products Group, LLC | 0.69% |
| Robertshaw US Holding Corp., First Lien Term Loan, 0.00%, 02/28/2027 | 0.67% |
| Dun & Bradstreet Corp. (The), Incremental Term Loan B-2, 8.03%, 01/18/2029 | 0.66% |
| AI Aqua Merger Sub, Inc., Term Loan B, 8.84%, 07/31/2028 | 0.61% |
| Acrisure LLC, Term Loan B-6, 8.59%, 11/06/2030 | 0.61% |
| * Excluding money market fund holdings, if any. |
(% of total investments)
| BBB- | 1.4% |
| BB+ | 1.3% |
| BB | 8.5% |
| BB- | 7.9% |
| B+ | 14.7% |
| B | 23.3% |
| B- | 19.7% |
| CCC+ | 5.1% |
| CCC | 3.4% |
| CCC- | 0.2% |
| CC | 0.2% |
| D | 1.1% |
| Not-Rated | 9.9% |
| Equity | 3.3% |
| ** Source: S&P Global Ratings. A credit rating is an assessment provided by a nationally recognized statistical rating organization of the creditworthiness of an issuer with respect to debt obligations, including specific securities, money market instruments or other debts. Ratings are measured on a scale that generally ranges from AAA (highest) to D (lowest); ratings are subject to change without notice. “Non- Rated” indicates the debtor was not rated, and should not be interpreted as indicating low quality. For more information on S&P Global Ratings’ rating methodology, please visit spglobal.com and select “Understanding Credit Ratings” under About Ratings on the homepage. |
| Fund (Class) | Costs of a $10,000 investment | Costs paid as a percentage of a $10,000 investment |
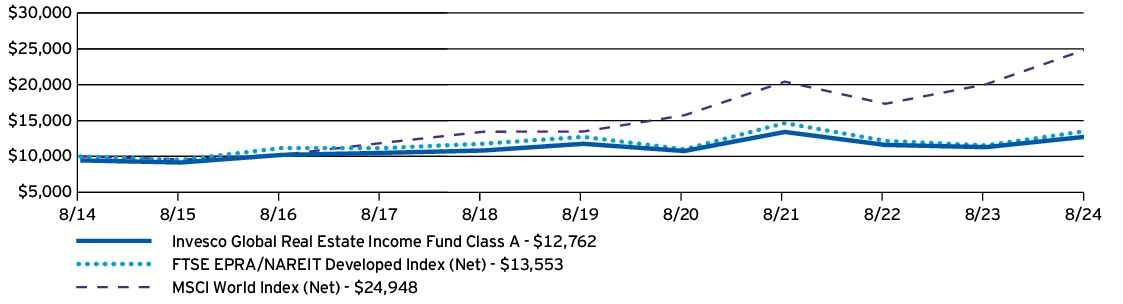
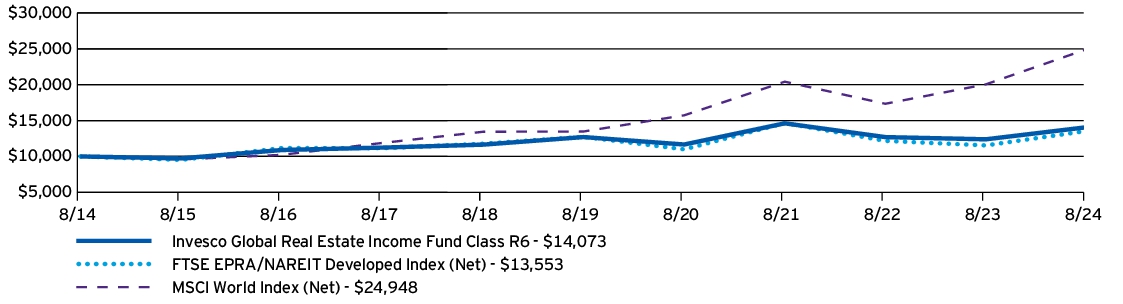
| Invesco Global Real Estate Income Fund (Class A) | $134 | 1.26% |
| AVERAGE ANNUAL TOTAL RETURNS | 1 Year | 5 Years | 10 Years |
| Invesco Global Real Estate Income Fund (Class A) —including sales charge | 6.77% | 0.49% | 2.47% |
| Invesco Global Real Estate Income Fund (Class A) —excluding sales charge | 12.96% | 1.64% | 3.05% |
| FTSE EPRA/NAREIT Developed Index (Net) | 17.45% | 1.26% | 3.09% |
| MSCI World Index (Net) | 24.43% | 13.11% | 9.57% |
| Fund net assets | $609,339,340 |
| Total number of portfolio holdings | 93 |
| Total advisory fees paid | $4,336,302 |
| Portfolio turnover rate | 49% |
(% of net assets)
| Prologis, Inc. | 7.08% |
| Equinix, Inc. | 3.97% |
| Public Storage | 3.96% |
| Rexford Industrial Realty, Inc. | 3.20% |
| Mitsui Fudosan Co. Ltd. | 2.97% |
| Realty Income Corp. | 2.93% |
| Simon Property Group, Inc. | 2.87% |
| Alexandria Real Estate Equities, Inc. | 2.77% |
| UMH Properties, Inc., Series D, Pfd., 6.38% | 2.21% |
| Prima Capital CRE Securitization Ltd., Series 2019-RK1, Class BT, 4.45%, 04/15/2038 | 2.13% |
| * Excluding money market fund holdings, if any. |
(% of net assets)
| Fund (Class) | Costs of a $10,000 investment | Costs paid as a percentage of a $10,000 investment |
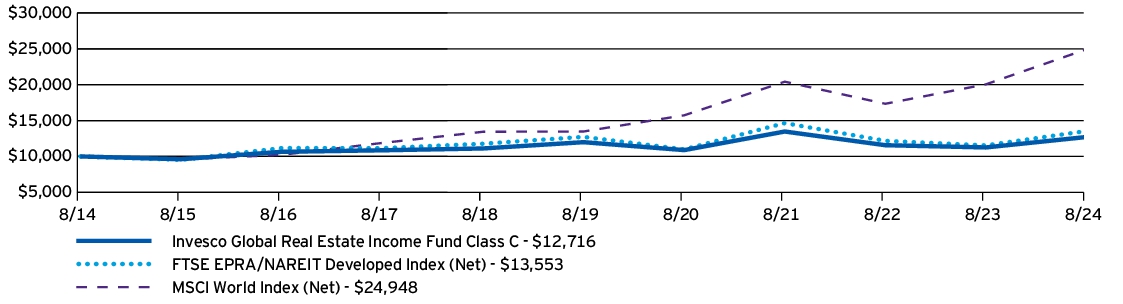
| Invesco Global Real Estate Income Fund (Class C) | $213 | 2.01% |
| AVERAGE ANNUAL TOTAL RETURNS | 1 Year | 5 Years | 10 Years |
| Invesco Global Real Estate Income Fund (Class C) —including sales charge | 11.13% | 0.87% | 2.43% |
| Invesco Global Real Estate Income Fund (Class C) —excluding sales charge | 12.13% | 0.87% | 2.43% |
| FTSE EPRA/NAREIT Developed Index (Net) | 17.45% | 1.26% | 3.09% |
| MSCI World Index (Net) | 24.43% | 13.11% | 9.57% |
| Fund net assets | $609,339,340 |
| Total number of portfolio holdings | 93 |
| Total advisory fees paid | $4,336,302 |
| Portfolio turnover rate | 49% |
(% of net assets)
| Prologis, Inc. | 7.08% |
| Equinix, Inc. | 3.97% |
| Public Storage | 3.96% |
| Rexford Industrial Realty, Inc. | 3.20% |
| Mitsui Fudosan Co. Ltd. | 2.97% |
| Realty Income Corp. | 2.93% |
| Simon Property Group, Inc. | 2.87% |
| Alexandria Real Estate Equities, Inc. | 2.77% |
| UMH Properties, Inc., Series D, Pfd., 6.38% | 2.21% |
| Prima Capital CRE Securitization Ltd., Series 2019-RK1, Class BT, 4.45%, 04/15/2038 | 2.13% |
| * Excluding money market fund holdings, if any. |
(% of net assets)

| Fund (Class) | Costs of a $10,000 investment | Costs paid as a percentage of a $10,000 investment |
| Invesco Global Real Estate Income Fund (Class Y) | $108 | 1.01% |

| AVERAGE ANNUAL TOTAL RETURNS | 1 Year | 5 Years | 10 Years |
| Invesco Global Real Estate Income Fund (Class Y) | 13.29% | 1.89% | 3.31% |
| FTSE EPRA/NAREIT Developed Index (Net) | 17.45% | 1.26% | 3.09% |
| MSCI World Index (Net) | 24.43% | 13.11% | 9.57% |
| Fund net assets | $609,339,340 |
| Total number of portfolio holdings | 93 |
| Total advisory fees paid | $4,336,302 |
| Portfolio turnover rate | 49% |
(% of net assets)
| Prologis, Inc. | 7.08% |
| Equinix, Inc. | 3.97% |
| Public Storage | 3.96% |
| Rexford Industrial Realty, Inc. | 3.20% |
| Mitsui Fudosan Co. Ltd. | 2.97% |
| Realty Income Corp. | 2.93% |
| Simon Property Group, Inc. | 2.87% |
| Alexandria Real Estate Equities, Inc. | 2.77% |
| UMH Properties, Inc., Series D, Pfd., 6.38% | 2.21% |
| Prima Capital CRE Securitization Ltd., Series 2019-RK1, Class BT, 4.45%, 04/15/2038 | 2.13% |
| * Excluding money market fund holdings, if any. |
(% of net assets)

| Fund (Class) | Costs of a $10,000 investment | Costs paid as a percentage of a $10,000 investment |
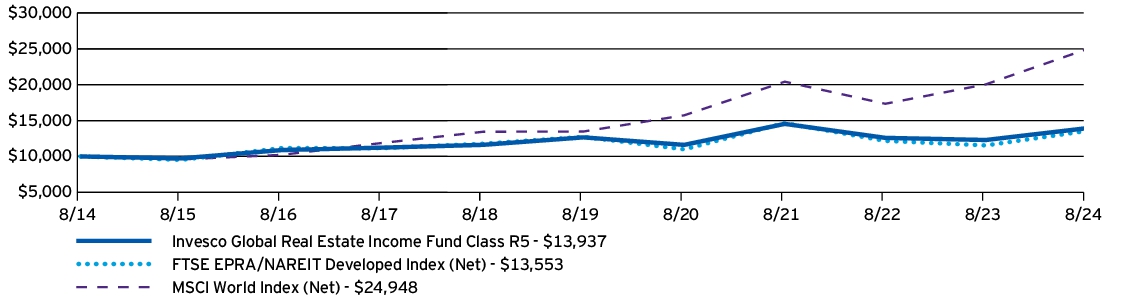
| Invesco Global Real Estate Income Fund (Class R5) | $97 | 0.91% |
| AVERAGE ANNUAL TOTAL RETURNS | 1 Year | 5 Years | 10 Years |
| Invesco Global Real Estate Income Fund (Class R5) | 13.38% | 1.94% | 3.38% |
| FTSE EPRA/NAREIT Developed Index (Net) | 17.45% | 1.26% | 3.09% |
| MSCI World Index (Net) | 24.43% | 13.11% | 9.57% |
| Fund net assets | $609,339,340 |
| Total number of portfolio holdings | 93 |
| Total advisory fees paid | $4,336,302 |
| Portfolio turnover rate | 49% |
(% of net assets)
| Prologis, Inc. | 7.08% |
| Equinix, Inc. | 3.97% |
| Public Storage | 3.96% |
| Rexford Industrial Realty, Inc. | 3.20% |
| Mitsui Fudosan Co. Ltd. | 2.97% |
| Realty Income Corp. | 2.93% |
| Simon Property Group, Inc. | 2.87% |
| Alexandria Real Estate Equities, Inc. | 2.77% |
| UMH Properties, Inc., Series D, Pfd., 6.38% | 2.21% |
| Prima Capital CRE Securitization Ltd., Series 2019-RK1, Class BT, 4.45%, 04/15/2038 | 2.13% |
| * Excluding money market fund holdings, if any. |
(% of net assets)

| Fund (Class) | Costs of a $10,000 investment | Costs paid as a percentage of a $10,000 investment |
| Invesco Global Real Estate Income Fund (Class R6) | $90 | 0.84% |
| AVERAGE ANNUAL TOTAL RETURNS | 1 Year | 5 Years | 10 Years |
| Invesco Global Real Estate Income Fund (Class R6) | 13.58% | 2.07% | 3.48% |
| FTSE EPRA/NAREIT Developed Index (Net) | 17.45% | 1.26% | 3.09% |
| MSCI World Index (Net) | 24.43% | 13.11% | 9.57% |
| Fund net assets | $609,339,340 |
| Total number of portfolio holdings | 93 |
| Total advisory fees paid | $4,336,302 |
| Portfolio turnover rate | 49% |
(% of net assets)
| Prologis, Inc. | 7.08% |
| Equinix, Inc. | 3.97% |
| Public Storage | 3.96% |
| Rexford Industrial Realty, Inc. | 3.20% |
| Mitsui Fudosan Co. Ltd. | 2.97% |
| Realty Income Corp. | 2.93% |
| Simon Property Group, Inc. | 2.87% |
| Alexandria Real Estate Equities, Inc. | 2.77% |
| UMH Properties, Inc., Series D, Pfd., 6.38% | 2.21% |
| Prima Capital CRE Securitization Ltd., Series 2019-RK1, Class BT, 4.45%, 04/15/2038 | 2.13% |
| * Excluding money market fund holdings, if any. |
(% of net assets)

| Fund (Class) | Costs of a $10,000 investment | Costs paid as a percentage of a $10,000 investment |
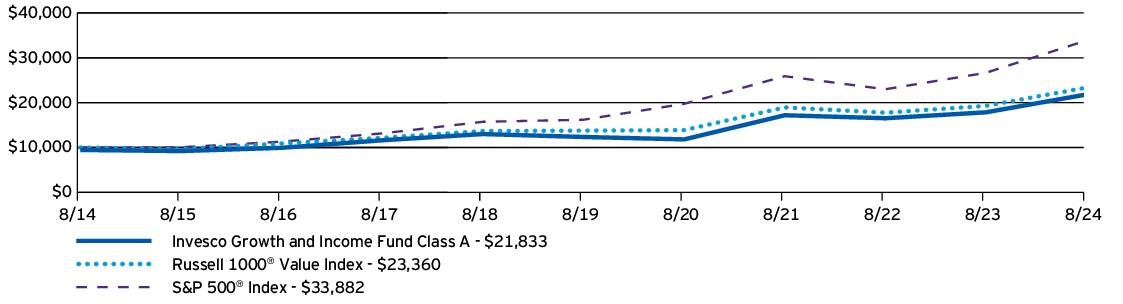
| Invesco Growth and Income Fund (Class A) | $88 | 0.79% |
| AVERAGE ANNUAL TOTAL RETURNS | 1 Year | 5 Years | 10 Years |
| Invesco Growth and Income Fund (Class A) —including sales charge | 15.67% | 10.82% | 8.12% |
| Invesco Growth and Income Fund (Class A) —excluding sales charge | 22.39% | 12.08% | 8.74% |
| Russell 1000® Value Index | 21.15% | 11.16% | 8.85% |
| S&P 500® Index | 27.14% | 15.92% | 12.98% |
| Fund net assets | $4,206,083,062 |
| Total number of portfolio holdings | 110 |
| Total advisory fees paid | $14,251,520 |
| Portfolio turnover rate | 25% |
(% of net assets)
| Wells Fargo & Co. | 3.26% |
| Bank of America Corp. | 3.23% |
| Exxon Mobil Corp. | 2.31% |
| CBRE Group, Inc., Class A | 2.29% |
| Parker-Hannifin Corp. | 2.17% |
| Johnson & Johnson | 2.15% |
| Alphabet, Inc., Class A | 2.12% |
| Johnson Controls International PLC | 2.09% |
| Amazon.com, Inc. | 2.02% |
| ConocoPhillips | 1.93% |
| * Excluding money market fund holdings, if any. |
(% of net assets)

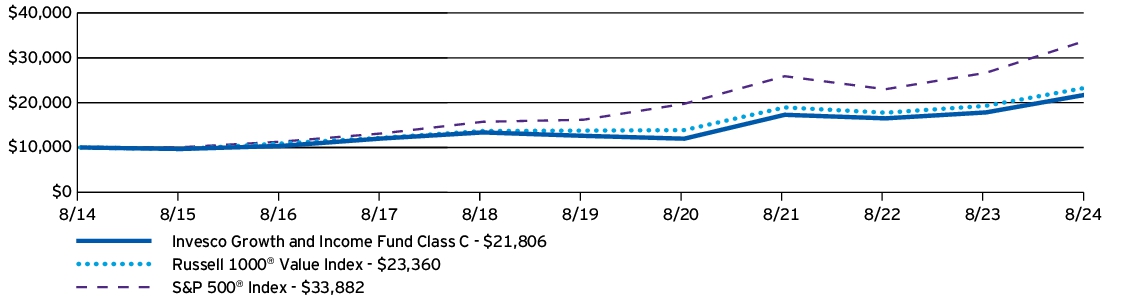
| Fund (Class) | Costs of a $10,000 investment | Costs paid as a percentage of a $10,000 investment |
| Invesco Growth and Income Fund (Class C) | $169 | 1.53% |
| AVERAGE ANNUAL TOTAL RETURNS | 1 Year | 5 Years | 10 Years |
| Invesco Growth and Income Fund (Class C) —including sales charge | 20.44% | 11.27% | 8.11% |
| Invesco Growth and Income Fund (Class C) —excluding sales charge | 21.44% | 11.27% | 8.11% |
| Russell 1000® Value Index | 21.15% | 11.16% | 8.85% |
| S&P 500® Index | 27.14% | 15.92% | 12.98% |
| Fund net assets | $4,206,083,062 |
| Total number of portfolio holdings | 110 |
| Total advisory fees paid | $14,251,520 |
| Portfolio turnover rate | 25% |
(% of net assets)
| Wells Fargo & Co. | 3.26% |
| Bank of America Corp. | 3.23% |
| Exxon Mobil Corp. | 2.31% |
| CBRE Group, Inc., Class A | 2.29% |
| Parker-Hannifin Corp. | 2.17% |
| Johnson & Johnson | 2.15% |
| Alphabet, Inc., Class A | 2.12% |
| Johnson Controls International PLC | 2.09% |
| Amazon.com, Inc. | 2.02% |
| ConocoPhillips | 1.93% |
| * Excluding money market fund holdings, if any. |
(% of net assets)

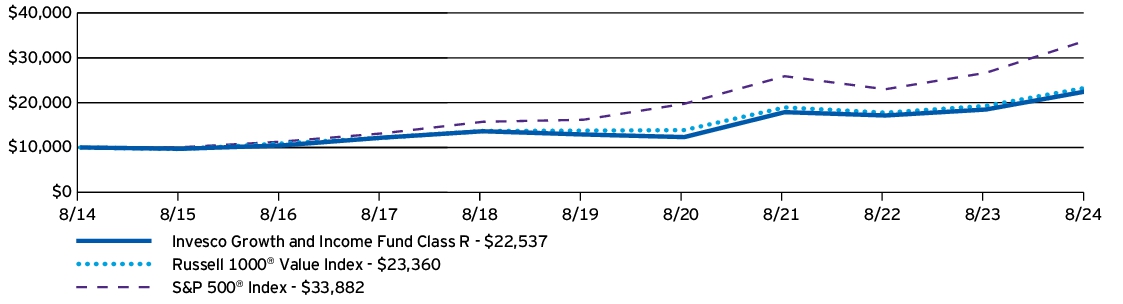
| Fund (Class) | Costs of a $10,000 investment | Costs paid as a percentage of a $10,000 investment |
| Invesco Growth and Income Fund (Class R) | $115 | 1.04% |
| AVERAGE ANNUAL TOTAL RETURNS | 1 Year | 5 Years | 10 Years |
| Invesco Growth and Income Fund (Class R) | 22.03% | 11.80% | 8.46% |
| Russell 1000® Value Index | 21.15% | 11.16% | 8.85% |
| S&P 500® Index | 27.14% | 15.92% | 12.98% |
| Fund net assets | $4,206,083,062 |
| Total number of portfolio holdings | 110 |
| Total advisory fees paid | $14,251,520 |
| Portfolio turnover rate | 25% |
(% of net assets)
| Wells Fargo & Co. | 3.26% |
| Bank of America Corp. | 3.23% |
| Exxon Mobil Corp. | 2.31% |
| CBRE Group, Inc., Class A | 2.29% |
| Parker-Hannifin Corp. | 2.17% |
| Johnson & Johnson | 2.15% |
| Alphabet, Inc., Class A | 2.12% |
| Johnson Controls International PLC | 2.09% |
| Amazon.com, Inc. | 2.02% |
| ConocoPhillips | 1.93% |
| * Excluding money market fund holdings, if any. |
(% of net assets)

| Fund (Class) | Costs of a $10,000 investment | Costs paid as a percentage of a $10,000 investment |
| Invesco Growth and Income Fund (Class Y) | $60 | 0.54% |

| AVERAGE ANNUAL TOTAL RETURNS | 1 Year | 5 Years | 10 Years |
| Invesco Growth and Income Fund (Class Y) | 22.67% | 12.36% | 9.01% |
| Russell 1000® Value Index | 21.15% | 11.16% | 8.85% |
| S&P 500® Index | 27.14% | 15.92% | 12.98% |
| Fund net assets | $4,206,083,062 |
| Total number of portfolio holdings | 110 |
| Total advisory fees paid | $14,251,520 |
| Portfolio turnover rate | 25% |
(% of net assets)
| Wells Fargo & Co. | 3.26% |
| Bank of America Corp. | 3.23% |
| Exxon Mobil Corp. | 2.31% |
| CBRE Group, Inc., Class A | 2.29% |
| Parker-Hannifin Corp. | 2.17% |
| Johnson & Johnson | 2.15% |
| Alphabet, Inc., Class A | 2.12% |
| Johnson Controls International PLC | 2.09% |
| Amazon.com, Inc. | 2.02% |
| ConocoPhillips | 1.93% |
| * Excluding money market fund holdings, if any. |
(% of net assets)

| Fund (Class) | Costs of a $10,000 investment | Costs paid as a percentage of a $10,000 investment |
| Invesco Growth and Income Fund (Class R5) | $56 | 0.50% |
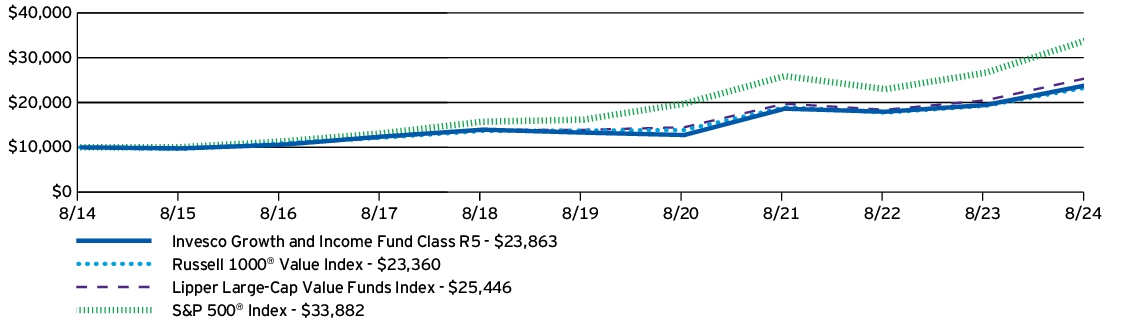
| AVERAGE ANNUAL TOTAL RETURNS | 1 Year | 5 Years | 10 Years |
| Invesco Growth and Income Fund (Class R5) | 22.69% | 12.42% | 9.09% |
| Russell 1000® Value Index | 21.15% | 11.16% | 8.85% |
| S&P 500® Index | 27.14% | 15.92% | 12.98% |
| Fund net assets | $4,206,083,062 |
| Total number of portfolio holdings | 110 |
| Total advisory fees paid | $14,251,520 |
| Portfolio turnover rate | 25% |
(% of net assets)
| Wells Fargo & Co. | 3.26% |
| Bank of America Corp. | 3.23% |
| Exxon Mobil Corp. | 2.31% |
| CBRE Group, Inc., Class A | 2.29% |
| Parker-Hannifin Corp. | 2.17% |
| Johnson & Johnson | 2.15% |
| Alphabet, Inc., Class A | 2.12% |
| Johnson Controls International PLC | 2.09% |
| Amazon.com, Inc. | 2.02% |
| ConocoPhillips | 1.93% |
| * Excluding money market fund holdings, if any. |
(% of net assets)

| Fund (Class) | Costs of a $10,000 investment | Costs paid as a percentage of a $10,000 investment |
| Invesco Growth and Income Fund (Class R6) | $48 | 0.43% |
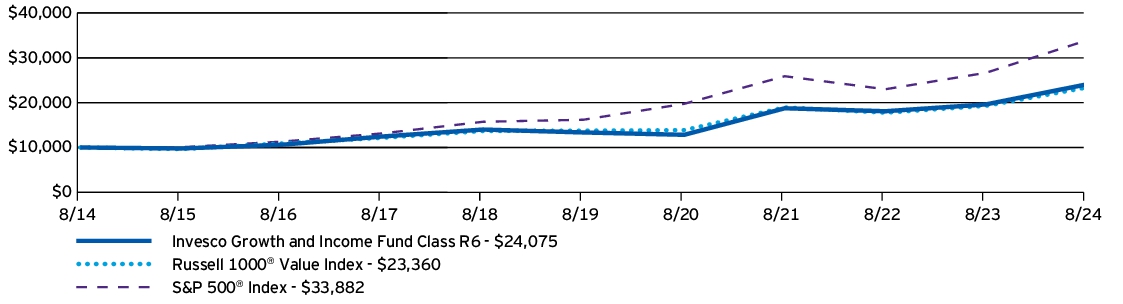
| AVERAGE ANNUAL TOTAL RETURNS | 1 Year | 5 Years | 10 Years |
| Invesco Growth and Income Fund (Class R6) | 22.77% | 12.51% | 9.18% |
| Russell 1000® Value Index | 21.15% | 11.16% | 8.85% |
| S&P 500® Index | 27.14% | 15.92% | 12.98% |
| Fund net assets | $4,206,083,062 |
| Total number of portfolio holdings | 110 |
| Total advisory fees paid | $14,251,520 |
| Portfolio turnover rate | 25% |
(% of net assets)
| Wells Fargo & Co. | 3.26% |
| Bank of America Corp. | 3.23% |
| Exxon Mobil Corp. | 2.31% |
| CBRE Group, Inc., Class A | 2.29% |
| Parker-Hannifin Corp. | 2.17% |
| Johnson & Johnson | 2.15% |
| Alphabet, Inc., Class A | 2.12% |
| Johnson Controls International PLC | 2.09% |
| Amazon.com, Inc. | 2.02% |
| ConocoPhillips | 1.93% |
| * Excluding money market fund holdings, if any. |
(% of net assets)
| Fund (Class) | Costs of a $10,000 investment | Costs paid as a percentage of a $10,000 investment |
| Invesco Income Advantage U.S. Fund (Class A) | $119 | 1.09%† |
† | Reflects fee waivers and/or expense reimbursements, without which expenses would have been higher. |
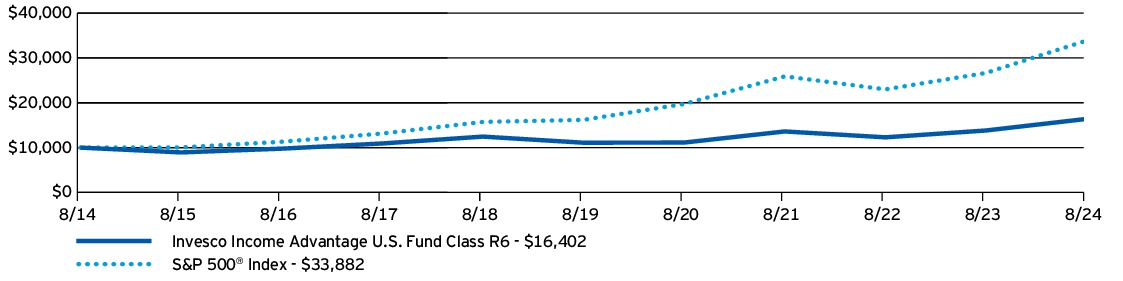
| AVERAGE ANNUAL TOTAL RETURNS | 1 Year | 5 Years | 10 Years |
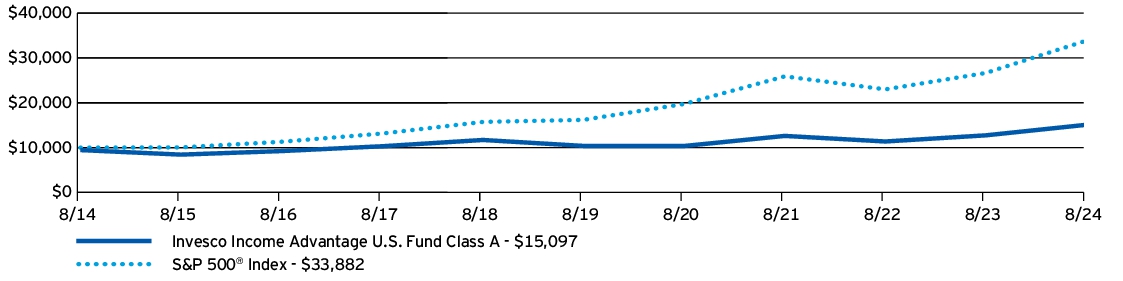
| Invesco Income Advantage U.S. Fund (Class A) —including sales charge | 11.93% | 6.56% | 4.21% |
| Invesco Income Advantage U.S. Fund (Class A) —excluding sales charge | 18.49% | 7.78% | 4.79% |
| S&P 500® Index | 27.14% | 15.92% | 12.98% |
| Fund net assets | $222,448,145 |
| Total number of portfolio holdings | 385 |
| Total advisory fees paid | $1,102,446 |
| Portfolio turnover rate | 54% |
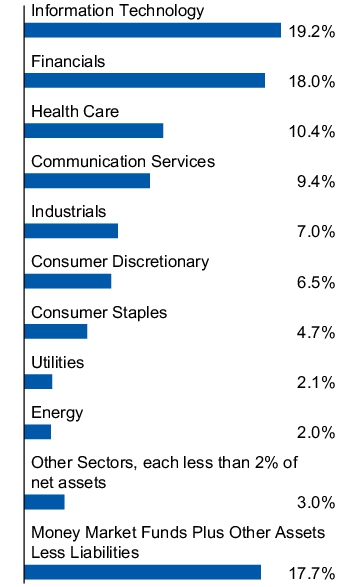
(% of net assets)
| Microsoft Corp. | 4.25% |
| NVIDIA Corp. | 3.16% |
| Apple, Inc. | 2.85% |
| Meta Platforms, Inc., Class A | 2.69% |
| Alphabet, Inc., Class A | 2.66% |
| Amazon.com, Inc. | 2.08% |
| Berkshire Hathaway, Inc., Class B | 1.76% |
| Johnson & Johnson | 1.45% |
| Visa, Inc., Class A | 1.42% |
| JPMorgan Chase & Co. | 1.29% |
| * Excluding money market fund holdings, if any. |
(% of net assets)

| Fund (Class) | Costs of a $10,000 investment | Costs paid as a percentage of a $10,000 investment |
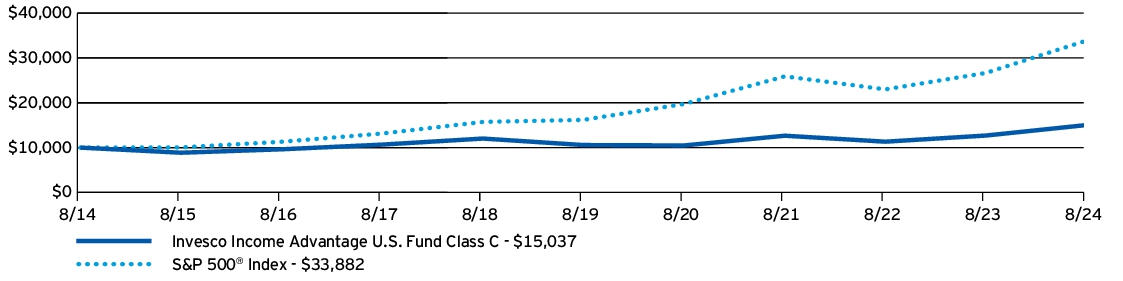
| Invesco Income Advantage U.S. Fund (Class C) | $200 | 1.84%† |
† | Reflects fee waivers and/or expense reimbursements, without which expenses would have been higher. |
| AVERAGE ANNUAL TOTAL RETURNS | 1 Year | 5 Years | 10 Years |
| Invesco Income Advantage U.S. Fund (Class C) —including sales charge | 16.61% | 6.98% | 4.16% |
| Invesco Income Advantage U.S. Fund (Class C) —excluding sales charge | 17.61% | 6.98% | 4.16% |
| S&P 500® Index | 27.14% | 15.92% | 12.98% |
| Fund net assets | $222,448,145 |
| Total number of portfolio holdings | 385 |
| Total advisory fees paid | $1,102,446 |
| Portfolio turnover rate | 54% |
(% of net assets)
| Microsoft Corp. | 4.25% |
| NVIDIA Corp. | 3.16% |
| Apple, Inc. | 2.85% |
| Meta Platforms, Inc., Class A | 2.69% |
| Alphabet, Inc., Class A | 2.66% |
| Amazon.com, Inc. | 2.08% |
| Berkshire Hathaway, Inc., Class B | 1.76% |
| Johnson & Johnson | 1.45% |
| Visa, Inc., Class A | 1.42% |
| JPMorgan Chase & Co. | 1.29% |
| * Excluding money market fund holdings, if any. |
(% of net assets)

| Fund (Class) | Costs of a $10,000 investment | Costs paid as a percentage of a $10,000 investment |
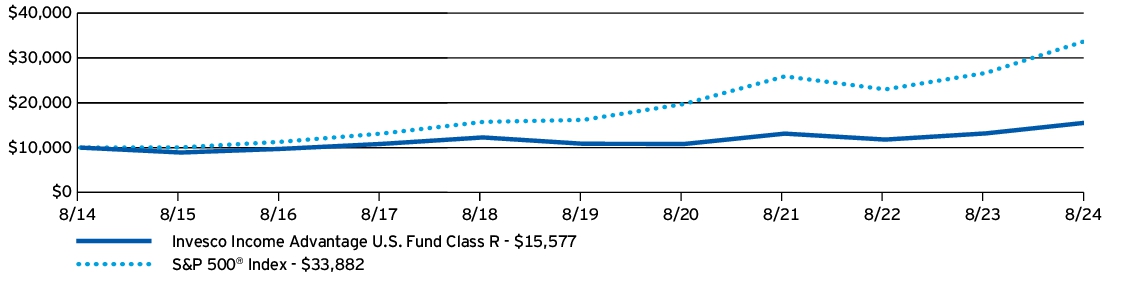
| Invesco Income Advantage U.S. Fund (Class R) | $146 | 1.34%† |
† | Reflects fee waivers and/or expense reimbursements, without which expenses would have been higher. |
| AVERAGE ANNUAL TOTAL RETURNS | 1 Year | 5 Years | 10 Years |
| Invesco Income Advantage U.S. Fund (Class R) | 18.15% | 7.50% | 4.53% |
| S&P 500® Index | 27.14% | 15.92% | 12.98% |
| Fund net assets | $222,448,145 |
| Total number of portfolio holdings | 385 |
| Total advisory fees paid | $1,102,446 |
| Portfolio turnover rate | 54% |
(% of net assets)
| Microsoft Corp. | 4.25% |
| NVIDIA Corp. | 3.16% |
| Apple, Inc. | 2.85% |
| Meta Platforms, Inc., Class A | 2.69% |
| Alphabet, Inc., Class A | 2.66% |
| Amazon.com, Inc. | 2.08% |
| Berkshire Hathaway, Inc., Class B | 1.76% |
| Johnson & Johnson | 1.45% |
| Visa, Inc., Class A | 1.42% |
| JPMorgan Chase & Co. | 1.29% |
| * Excluding money market fund holdings, if any. |
(% of net assets)

| Fund (Class) | Costs of a $10,000 investment | Costs paid as a percentage of a $10,000 investment |
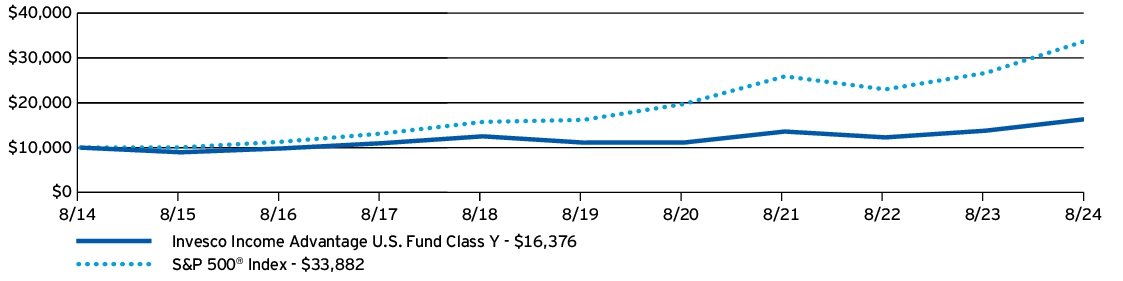
| Invesco Income Advantage U.S. Fund (Class Y) | $92 | 0.84%† |
† | Reflects fee waivers and/or expense reimbursements, without which expenses would have been higher. |
| AVERAGE ANNUAL TOTAL RETURNS | 1 Year | 5 Years | 10 Years |
| Invesco Income Advantage U.S. Fund (Class Y) | 18.85% | 8.05% | 5.06% |
| S&P 500® Index | 27.14% | 15.92% | 12.98% |
| Fund net assets | $222,448,145 |
| Total number of portfolio holdings | 385 |
| Total advisory fees paid | $1,102,446 |
| Portfolio turnover rate | 54% |
(% of net assets)
| Microsoft Corp. | 4.25% |
| NVIDIA Corp. | 3.16% |
| Apple, Inc. | 2.85% |
| Meta Platforms, Inc., Class A | 2.69% |
| Alphabet, Inc., Class A | 2.66% |
| Amazon.com, Inc. | 2.08% |
| Berkshire Hathaway, Inc., Class B | 1.76% |
| Johnson & Johnson | 1.45% |
| Visa, Inc., Class A | 1.42% |
| JPMorgan Chase & Co. | 1.29% |
| * Excluding money market fund holdings, if any. |
(% of net assets)

| Fund (Class) | Costs of a $10,000 investment | Costs paid as a percentage of a $10,000 investment |
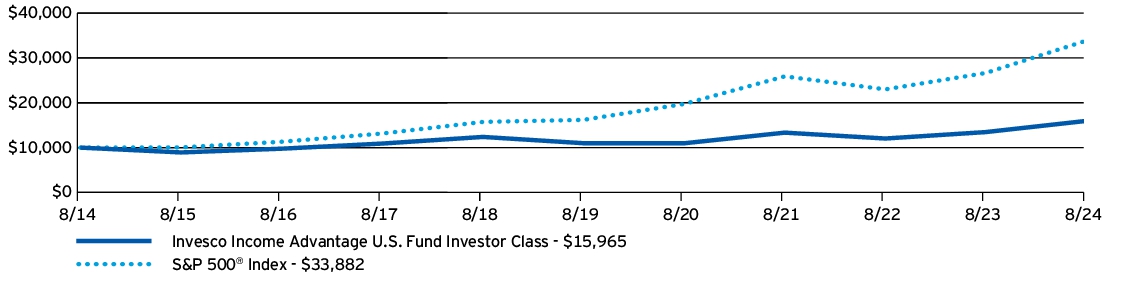
| Invesco Income Advantage U.S. Fund (Investor Class) | $119 | 1.09%† |
† | Reflects fee waivers and/or expense reimbursements, without which expenses would have been higher. |
| AVERAGE ANNUAL TOTAL RETURNS | 1 Year | 5 Years | 10 Years |
| Invesco Income Advantage U.S. Fund (Investor Class) | 18.56% | 7.77% | 4.79% |
| S&P 500® Index | 27.14% | 15.92% | 12.98% |
| Fund net assets | $222,448,145 |
| Total number of portfolio holdings | 385 |
| Total advisory fees paid | $1,102,446 |
| Portfolio turnover rate | 54% |
(% of net assets)
| Microsoft Corp. | 4.25% |
| NVIDIA Corp. | 3.16% |
| Apple, Inc. | 2.85% |
| Meta Platforms, Inc., Class A | 2.69% |
| Alphabet, Inc., Class A | 2.66% |
| Amazon.com, Inc. | 2.08% |
| Berkshire Hathaway, Inc., Class B | 1.76% |
| Johnson & Johnson | 1.45% |
| Visa, Inc., Class A | 1.42% |
| JPMorgan Chase & Co. | 1.29% |
| * Excluding money market fund holdings, if any. |
(% of net assets)
| Fund (Class) | Costs of a $10,000 investment | Costs paid as a percentage of a $10,000 investment |
| Invesco Income Advantage U.S. Fund (Class R5) | $83 | 0.76%† |
† | Reflects fee waivers and/or expense reimbursements, without which expenses would have been higher. |

| AVERAGE ANNUAL TOTAL RETURNS | 1 Year | 5 Years | 10 Years |
| Invesco Income Advantage U.S. Fund (Class R5) | 18.83% | 8.14% | 5.19% |
| S&P 500® Index | 27.14% | 15.92% | 12.98% |
| Fund net assets | $222,448,145 |
| Total number of portfolio holdings | 385 |
| Total advisory fees paid | $1,102,446 |
| Portfolio turnover rate | 54% |
(% of net assets)
| Microsoft Corp. | 4.25% |
| NVIDIA Corp. | 3.16% |
| Apple, Inc. | 2.85% |
| Meta Platforms, Inc., Class A | 2.69% |
| Alphabet, Inc., Class A | 2.66% |
| Amazon.com, Inc. | 2.08% |
| Berkshire Hathaway, Inc., Class B | 1.76% |
| Johnson & Johnson | 1.45% |
| Visa, Inc., Class A | 1.42% |
| JPMorgan Chase & Co. | 1.29% |
| * Excluding money market fund holdings, if any. |
(% of net assets)

| Fund (Class) | Costs of a $10,000 investment | Costs paid as a percentage of a $10,000 investment |
| Invesco Income Advantage U.S. Fund (Class R6) | $83 | 0.76%† |
† | Reflects fee waivers and/or expense reimbursements, without which expenses would have been higher. |
| AVERAGE ANNUAL TOTAL RETURNS | 1 Year | 5 Years | 10 Years |
| Invesco Income Advantage U.S. Fund (Class R6) | 18.72% | 8.14% | 5.07% |
| S&P 500® Index | 27.14% | 15.92% | 12.98% |
| Fund net assets | $222,448,145 |
| Total number of portfolio holdings | 385 |
| Total advisory fees paid | $1,102,446 |
| Portfolio turnover rate | 54% |
(% of net assets)
| Microsoft Corp. | 4.25% |
| NVIDIA Corp. | 3.16% |
| Apple, Inc. | 2.85% |
| Meta Platforms, Inc., Class A | 2.69% |
| Alphabet, Inc., Class A | 2.66% |
| Amazon.com, Inc. | 2.08% |
| Berkshire Hathaway, Inc., Class B | 1.76% |
| Johnson & Johnson | 1.45% |
| Visa, Inc., Class A | 1.42% |
| JPMorgan Chase & Co. | 1.29% |
| * Excluding money market fund holdings, if any. |
(% of net assets)

| Fund (Class) | Costs of a $10,000 investment | Costs paid as a percentage of a $10,000 investment |
| Invesco NASDAQ 100 Index Fund (Class R6) | $33 | 0.29%† |
† | Reflects fee waivers and/or expense reimbursements, without which expenses would have been higher. |
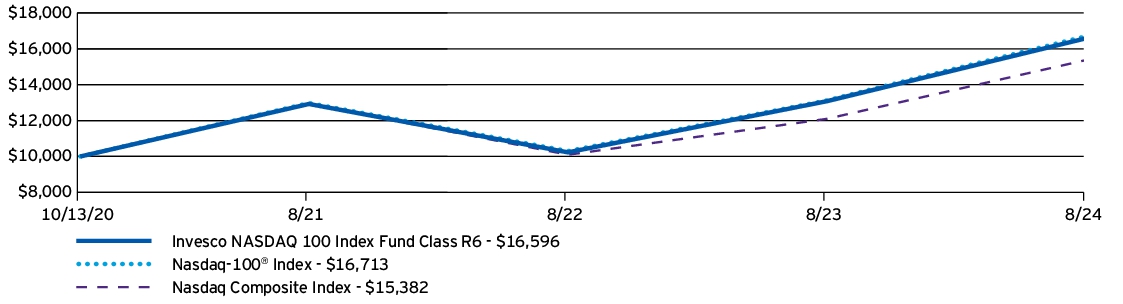
| AVERAGE ANNUAL TOTAL RETURNS | 1 Year | Since Inception (10/13/20) |
| Invesco NASDAQ 100 Index Fund (Class R6) | 26.89% | 13.94% |
| Nasdaq-100® Index | 27.30% | 14.15% |
| Nasdaq Composite Index | 27.15% | 11.73% |
| Fund net assets | $98,426,605 |
| Total number of portfolio holdings | 106 |
| Total advisory fees paid | $0 |
| Portfolio turnover rate | 7% |
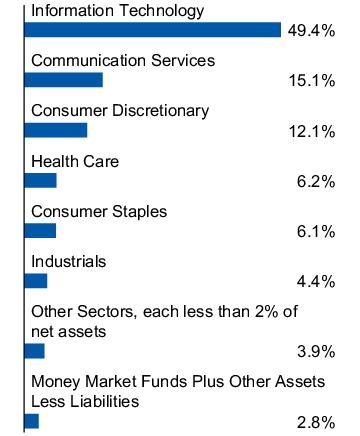
(% of net assets)
| Apple, Inc. | 8.90% |
| Microsoft Corp. | 7.86% |
| NVIDIA Corp. | 7.45% |
| Broadcom, Inc. | 4.94% |
| Amazon.com, Inc. | 4.71% |
| Meta Platforms, Inc., Class A | 4.61% |
| Tesla, Inc. | 2.62% |
| Costco Wholesale Corp. | 2.59% |
| Alphabet, Inc., Class A | 2.43% |
| Alphabet, Inc., Class C | 2.35% |
| * Excluding money market fund holdings, if any. |
(% of net assets)
| Fund (Class) | Costs of a $10,000 investment | Costs paid as a percentage of a $10,000 investment |
| Invesco S&P 500 Index Fund (Class A) | $61 | 0.54% |
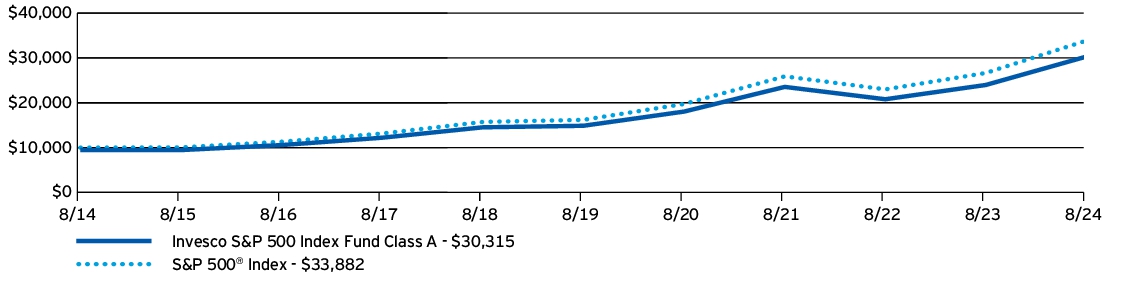
| AVERAGE ANNUAL TOTAL RETURNS | 1 Year | 5 Years | 10 Years |
| Invesco S&P 500 Index Fund (Class A) —including sales charge | 19.48% | 14.01% | 11.73% |
| Invesco S&P 500 Index Fund (Class A) —excluding sales charge | 26.45% | 15.31% | 12.36% |
| S&P 500® Index | 27.14% | 15.92% | 12.98% |
| Fund net assets | $3,334,591,169 |
| Total number of portfolio holdings | 508 |
| Total advisory fees paid | $3,180,343 |
| Portfolio turnover rate | 1% |
(% of net assets)
| Apple, Inc. | 6.81% |
| Microsoft Corp. | 6.40% |
| NVIDIA Corp. | 6.06% |
| Amazon.com, Inc. | 3.37% |
| Meta Platforms, Inc., Class A | 2.36% |
| Alphabet, Inc., Class A | 1.98% |
| Berkshire Hathaway, Inc., Class B | 1.78% |
| Alphabet, Inc., Class C | 1.67% |
| Eli Lilly and Co. | 1.58% |
| Broadcom, Inc. | 1.46% |
| * Excluding money market fund holdings, if any. |
(% of net assets)

| Fund (Class) | Costs of a $10,000 investment | Costs paid as a percentage of a $10,000 investment |
| Invesco S&P 500 Index Fund (Class C) | $145 | 1.29% |

| AVERAGE ANNUAL TOTAL RETURNS | 1 Year | 5 Years | 10 Years |
| Invesco S&P 500 Index Fund (Class C) —including sales charge | 24.50% | 14.47% | 11.70% |
| Invesco S&P 500 Index Fund (Class C) —excluding sales charge | 25.50% | 14.47% | 11.70% |
| S&P 500® Index | 27.14% | 15.92% | 12.98% |
| Fund net assets | $3,334,591,169 |
| Total number of portfolio holdings | 508 |
| Total advisory fees paid | $3,180,343 |
| Portfolio turnover rate | 1% |
(% of net assets)
| Apple, Inc. | 6.81% |
| Microsoft Corp. | 6.40% |
| NVIDIA Corp. | 6.06% |
| Amazon.com, Inc. | 3.37% |
| Meta Platforms, Inc., Class A | 2.36% |
| Alphabet, Inc., Class A | 1.98% |
| Berkshire Hathaway, Inc., Class B | 1.78% |
| Alphabet, Inc., Class C | 1.67% |
| Eli Lilly and Co. | 1.58% |
| Broadcom, Inc. | 1.46% |
| * Excluding money market fund holdings, if any. |
(% of net assets)

| Fund (Class) | Costs of a $10,000 investment | Costs paid as a percentage of a $10,000 investment |
| Invesco S&P 500 Index Fund (Class Y) | $33 | 0.29% |
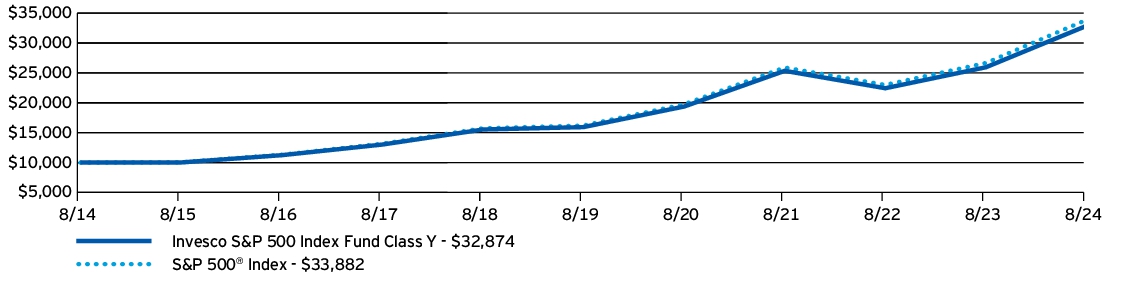
| AVERAGE ANNUAL TOTAL RETURNS | 1 Year | 5 Years | 10 Years |
| Invesco S&P 500 Index Fund (Class Y) | 26.75% | 15.59% | 12.64% |
| S&P 500® Index | 27.14% | 15.92% | 12.98% |
| Fund net assets | $3,334,591,169 |
| Total number of portfolio holdings | 508 |
| Total advisory fees paid | $3,180,343 |
| Portfolio turnover rate | 1% |
(% of net assets)
| Apple, Inc. | 6.81% |
| Microsoft Corp. | 6.40% |
| NVIDIA Corp. | 6.06% |
| Amazon.com, Inc. | 3.37% |
| Meta Platforms, Inc., Class A | 2.36% |
| Alphabet, Inc., Class A | 1.98% |
| Berkshire Hathaway, Inc., Class B | 1.78% |
| Alphabet, Inc., Class C | 1.67% |
| Eli Lilly and Co. | 1.58% |
| Broadcom, Inc. | 1.46% |
| * Excluding money market fund holdings, if any. |
(% of net assets)
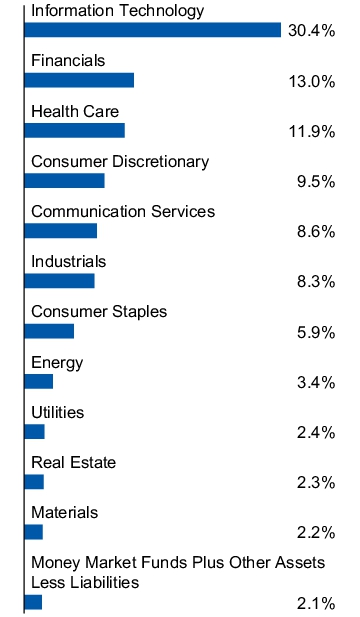
| Fund (Class) | Costs of a $10,000 investment | Costs paid as a percentage of a $10,000 investment |
| Invesco S&P 500 Index Fund (Class R6) | $22 | 0.19% |
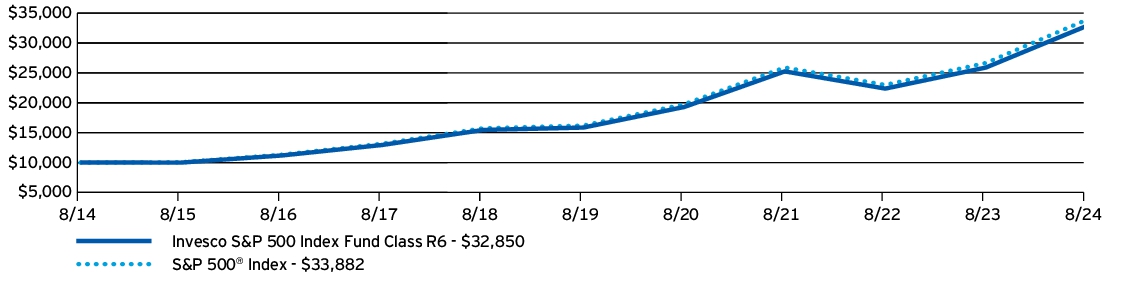
| AVERAGE ANNUAL TOTAL RETURNS | 1 Year | 5 Years | 10 Years |
| Invesco S&P 500 Index Fund (Class R6) | 26.87% | 15.68% | 12.63% |
| S&P 500® Index | 27.14% | 15.92% | 12.98% |
| Fund net assets | $3,334,591,169 |
| Total number of portfolio holdings | 508 |
| Total advisory fees paid | $3,180,343 |
| Portfolio turnover rate | 1% |
(% of net assets)
| Apple, Inc. | 6.81% |
| Microsoft Corp. | 6.40% |
| NVIDIA Corp. | 6.06% |
| Amazon.com, Inc. | 3.37% |
| Meta Platforms, Inc., Class A | 2.36% |
| Alphabet, Inc., Class A | 1.98% |
| Berkshire Hathaway, Inc., Class B | 1.78% |
| Alphabet, Inc., Class C | 1.67% |
| Eli Lilly and Co. | 1.58% |
| Broadcom, Inc. | 1.46% |
| * Excluding money market fund holdings, if any. |
(% of net assets)

| Fund (Class) | Costs of a $10,000 investment | Costs paid as a percentage of a $10,000 investment |
| Invesco Senior Floating Rate Fund (Class A) | $113 | 1.08%† |
† | Reflects fee waivers and/or expense reimbursements, without which expenses would have been higher. |
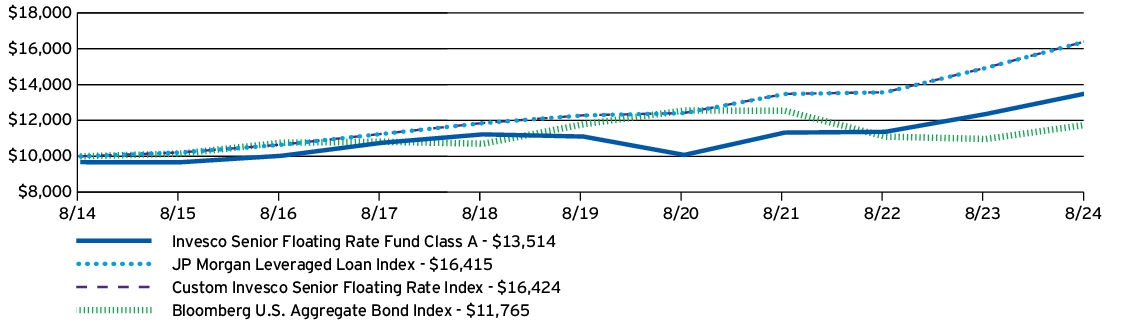
| AVERAGE ANNUAL TOTAL RETURNS | 1 Year | 5 Years | 10 Years |
| Invesco Senior Floating Rate Fund (Class A) —including sales charge | 5.86% | 3.31% | 3.06% |
| Invesco Senior Floating Rate Fund (Class A) —excluding sales charge | 9.35% | 4.01% | 3.40% |
| JP Morgan Leveraged Loan Index | 9.95% | 5.97% | 5.08% |
| Custom Invesco Senior Floating Rate Index | 9.95% | 5.97% | 5.09% |
| Bloomberg U.S. Aggregate Bond Index | 7.30% | (0.04)% | 1.64% |
| Fund net assets | $3,032,555,705 |
| Total number of portfolio holdings | 557 |
| Total advisory fees paid | $18,596,053 |
| Portfolio turnover rate | 48% |
(% of net assets)
| My Alarm Center LLC, Class A | 1.26% |
| Monitronics International, Inc., Term Loan B, 13.01%, 06/30/2028 | 1.00% |
| ACNR Holdings, Inc. | 0.90% |
| Spin Holdco, Inc., Term Loan, 9.60%, 03/04/2028 | 0.84% |
| AAdvantage Loyality IP Ltd. (American Airlines, Inc.), Term Loan, 10.29%, 04/20/2028 | 0.79% |
| Sigma Holdco B.V., Term Loan B-9, 8.18%, 01/03/2028 | 0.75% |
| Carnival Corp., Term Loan B, 8.00%, 10/18/2028 | 0.74% |
| Restoration Forest Products Group, LLC | 0.70% |
| Acrisure LLC, Term Loan B-6, 8.59%, 11/06/2030 | 0.65% |
| Ineos US Finance LLC, Term Loan, 8.50%, 02/18/2030 | 0.61% |
| * Excluding money market fund holdings, if any. |
(% of total investments)
| BBB- | 1.0% |
| BB+ | 1.5% |
| BB | 7.7% |
| BB- | 8.0% |
| B+ | 11.7% |
| B | 22.7% |
| B- | 19.6% |
| CCC+ | 6.3% |
| CCC | 3.6% |
| CCC- | 0.3% |
| CC | 0.2% |
| D | 1.0% |
| Non-Rated | 9.9% |
| Equity | 6.5% |
| ** Source: S&P Global Ratings. A credit rating is an assessment provided by a nationally recognized statistical rating organization of the creditworthiness of an issuer with respect to debt obligations, including specific securities, money market instruments or other debts. Ratings are measured on a scale that generally ranges from AAA (highest) to D (lowest); ratings are subject to change without notice. “Non- Rated” indicates the debtor was not rated, and should not be interpreted as indicating low quality. For more information on S&P Global Ratings’ rating methodology, please visit spglobal.com and select “Understanding Credit Ratings” under About Ratings on the homepage. |
| Fund (Class) | Costs of a $10,000 investment | Costs paid as a percentage of a $10,000 investment |
| Invesco Senior Floating Rate Fund (Class C) | $191 | 1.83%† |
† | Reflects fee waivers and/or expense reimbursements, without which expenses would have been higher. |
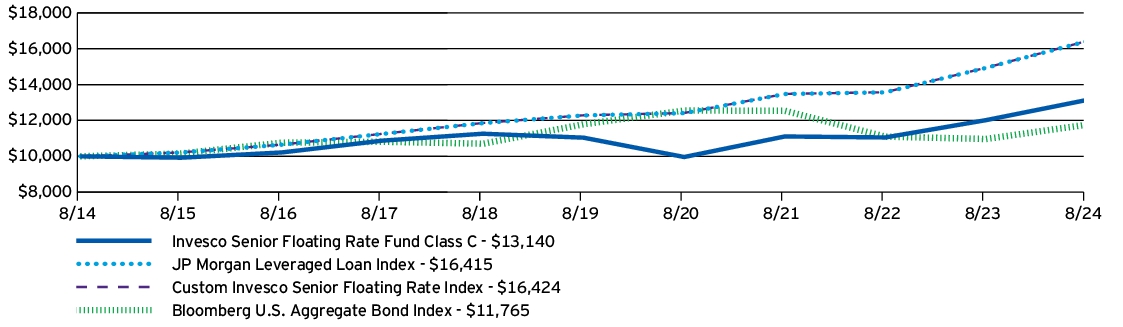
| AVERAGE ANNUAL TOTAL RETURNS | 1 Year | 5 Years | 10 Years |
| Invesco Senior Floating Rate Fund (Class C) —including sales charge | 7.70% | 3.26% | 2.77% |
| Invesco Senior Floating Rate Fund (Class C) —excluding sales charge | 8.53% | 3.26% | 2.77% |
| JP Morgan Leveraged Loan Index | 9.95% | 5.97% | 5.08% |
| Custom Invesco Senior Floating Rate Index | 9.95% | 5.97% | 5.09% |
| Bloomberg U.S. Aggregate Bond Index | 7.30% | (0.04)% | 1.64% |
| Fund net assets | $3,032,555,705 |
| Total number of portfolio holdings | 557 |
| Total advisory fees paid | $18,596,053 |
| Portfolio turnover rate | 48% |
(% of net assets)
| My Alarm Center LLC, Class A | 1.26% |
| Monitronics International, Inc., Term Loan B, 13.01%, 06/30/2028 | 1.00% |
| ACNR Holdings, Inc. | 0.90% |
| Spin Holdco, Inc., Term Loan, 9.60%, 03/04/2028 | 0.84% |
| AAdvantage Loyality IP Ltd. (American Airlines, Inc.), Term Loan, 10.29%, 04/20/2028 | 0.79% |
| Sigma Holdco B.V., Term Loan B-9, 8.18%, 01/03/2028 | 0.75% |
| Carnival Corp., Term Loan B, 8.00%, 10/18/2028 | 0.74% |
| Restoration Forest Products Group, LLC | 0.70% |
| Acrisure LLC, Term Loan B-6, 8.59%, 11/06/2030 | 0.65% |
| Ineos US Finance LLC, Term Loan, 8.50%, 02/18/2030 | 0.61% |
| * Excluding money market fund holdings, if any. |
(% of total investments)
| BBB- | 1.0% |
| BB+ | 1.5% |
| BB | 7.7% |
| BB- | 8.0% |
| B+ | 11.7% |
| B | 22.7% |
| B- | 19.6% |
| CCC+ | 6.3% |
| CCC | 3.6% |
| CCC- | 0.3% |
| CC | 0.2% |
| D | 1.0% |
| Non-Rated | 9.9% |
| Equity | 6.5% |
| ** Source: S&P Global Ratings. A credit rating is an assessment provided by a nationally recognized statistical rating organization of the creditworthiness of an issuer with respect to debt obligations, including specific securities, money market instruments or other debts. Ratings are measured on a scale that generally ranges from AAA (highest) to D (lowest); ratings are subject to change without notice. “Non- Rated” indicates the debtor was not rated, and should not be interpreted as indicating low quality. For more information on S&P Global Ratings’ rating methodology, please visit spglobal.com and select “Understanding Credit Ratings” under About Ratings on the homepage. |
| Fund (Class) | Costs of a $10,000 investment | Costs paid as a percentage of a $10,000 investment |
| Invesco Senior Floating Rate Fund (Class R) | $139 | 1.33%† |
† | Reflects fee waivers and/or expense reimbursements, without which expenses would have been higher. |
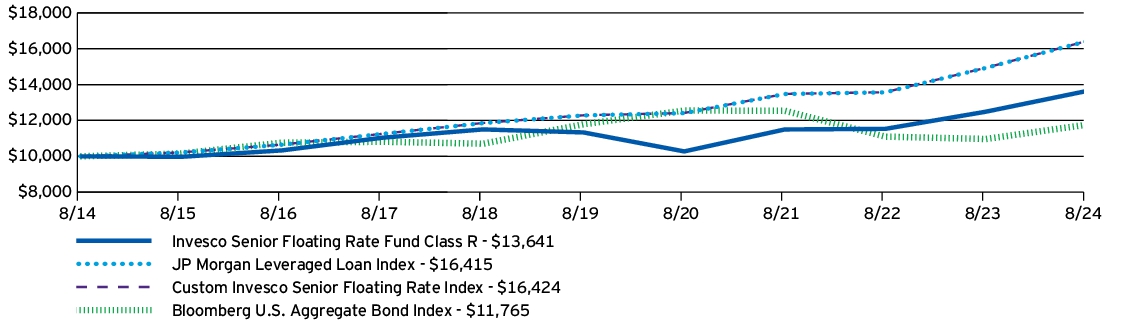
| AVERAGE ANNUAL TOTAL RETURNS | 1 Year | 5 Years | 10 Years |
| Invesco Senior Floating Rate Fund (Class R) | 9.07% | 3.78% | 3.15% |
| JP Morgan Leveraged Loan Index | 9.95% | 5.97% | 5.08% |
| Custom Invesco Senior Floating Rate Index | 9.95% | 5.97% | 5.09% |
| Bloomberg U.S. Aggregate Bond Index | 7.30% | (0.04)% | 1.64% |
| Fund net assets | $3,032,555,705 |
| Total number of portfolio holdings | 557 |
| Total advisory fees paid | $18,596,053 |
| Portfolio turnover rate | 48% |
(% of net assets)
| My Alarm Center LLC, Class A | 1.26% |
| Monitronics International, Inc., Term Loan B, 13.01%, 06/30/2028 | 1.00% |
| ACNR Holdings, Inc. | 0.90% |
| Spin Holdco, Inc., Term Loan, 9.60%, 03/04/2028 | 0.84% |
| AAdvantage Loyality IP Ltd. (American Airlines, Inc.), Term Loan, 10.29%, 04/20/2028 | 0.79% |
| Sigma Holdco B.V., Term Loan B-9, 8.18%, 01/03/2028 | 0.75% |
| Carnival Corp., Term Loan B, 8.00%, 10/18/2028 | 0.74% |
| Restoration Forest Products Group, LLC | 0.70% |
| Acrisure LLC, Term Loan B-6, 8.59%, 11/06/2030 | 0.65% |
| Ineos US Finance LLC, Term Loan, 8.50%, 02/18/2030 | 0.61% |
| * Excluding money market fund holdings, if any. |
(% of total investments)
| BBB- | 1.0% |
| BB+ | 1.5% |
| BB | 7.7% |
| BB- | 8.0% |
| B+ | 11.7% |
| B | 22.7% |
| B- | 19.6% |
| CCC+ | 6.3% |
| CCC | 3.6% |
| CCC- | 0.3% |
| CC | 0.2% |
| D | 1.0% |
| Non-Rated | 9.9% |
| Equity | 6.5% |
| ** Source: S&P Global Ratings. A credit rating is an assessment provided by a nationally recognized statistical rating organization of the creditworthiness of an issuer with respect to debt obligations, including specific securities, money market instruments or other debts. Ratings are measured on a scale that generally ranges from AAA (highest) to D (lowest); ratings are subject to change without notice. “Non- Rated” indicates the debtor was not rated, and should not be interpreted as indicating low quality. For more information on S&P Global Ratings’ rating methodology, please visit spglobal.com and select “Understanding Credit Ratings” under About Ratings on the homepage. |
| Fund (Class) | Costs of a $10,000 investment | Costs paid as a percentage of a $10,000 investment |
| Invesco Senior Floating Rate Fund (Class Y) | $87 | 0.83%† |
† | Reflects fee waivers and/or expense reimbursements, without which expenses would have been higher. |
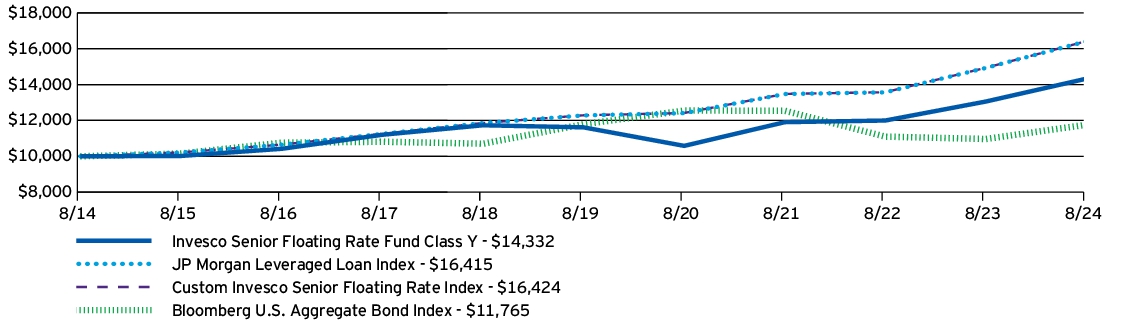
| AVERAGE ANNUAL TOTAL RETURNS | 1 Year | 5 Years | 10 Years |
| Invesco Senior Floating Rate Fund (Class Y) | 9.45% | 4.29% | 3.66% |
| JP Morgan Leveraged Loan Index | 9.95% | 5.97% | 5.08% |
| Custom Invesco Senior Floating Rate Index | 9.95% | 5.97% | 5.09% |
| Bloomberg U.S. Aggregate Bond Index | 7.30% | (0.04)% | 1.64% |
| Fund net assets | $3,032,555,705 |
| Total number of portfolio holdings | 557 |
| Total advisory fees paid | $18,596,053 |
| Portfolio turnover rate | 48% |
(% of net assets)
| My Alarm Center LLC, Class A | 1.26% |
| Monitronics International, Inc., Term Loan B, 13.01%, 06/30/2028 | 1.00% |
| ACNR Holdings, Inc. | 0.90% |
| Spin Holdco, Inc., Term Loan, 9.60%, 03/04/2028 | 0.84% |
| AAdvantage Loyality IP Ltd. (American Airlines, Inc.), Term Loan, 10.29%, 04/20/2028 | 0.79% |
| Sigma Holdco B.V., Term Loan B-9, 8.18%, 01/03/2028 | 0.75% |
| Carnival Corp., Term Loan B, 8.00%, 10/18/2028 | 0.74% |
| Restoration Forest Products Group, LLC | 0.70% |
| Acrisure LLC, Term Loan B-6, 8.59%, 11/06/2030 | 0.65% |
| Ineos US Finance LLC, Term Loan, 8.50%, 02/18/2030 | 0.61% |
| * Excluding money market fund holdings, if any. |
(% of total investments)
| BBB- | 1.0% |
| BB+ | 1.5% |
| BB | 7.7% |
| BB- | 8.0% |
| B+ | 11.7% |
| B | 22.7% |
| B- | 19.6% |
| CCC+ | 6.3% |
| CCC | 3.6% |
| CCC- | 0.3% |
| CC | 0.2% |
| D | 1.0% |
| Non-Rated | 9.9% |
| Equity | 6.5% |
| ** Source: S&P Global Ratings. A credit rating is an assessment provided by a nationally recognized statistical rating organization of the creditworthiness of an issuer with respect to debt obligations, including specific securities, money market instruments or other debts. Ratings are measured on a scale that generally ranges from AAA (highest) to D (lowest); ratings are subject to change without notice. “Non- Rated” indicates the debtor was not rated, and should not be interpreted as indicating low quality. For more information on S&P Global Ratings’ rating methodology, please visit spglobal.com and select “Understanding Credit Ratings” under About Ratings on the homepage. |
| Fund (Class) | Costs of a $10,000 investment | Costs paid as a percentage of a $10,000 investment |
| Invesco Senior Floating Rate Fund (Class R5) | $83 | 0.79% |

| AVERAGE ANNUAL TOTAL RETURNS | 1 Year | 5 Years | 10 Years |
| Invesco Senior Floating Rate Fund (Class R5) | 9.68% | 4.36% | 3.57% |
| JP Morgan Leveraged Loan Index | 9.95% | 5.97% | 5.08% |
| Custom Invesco Senior Floating Rate Index | 9.95% | 5.97% | 5.09% |
| Bloomberg U.S. Aggregate Bond Index | 7.30% | (0.04)% | 1.64% |
| Fund net assets | $3,032,555,705 |
| Total number of portfolio holdings | 557 |
| Total advisory fees paid | $18,596,053 |
| Portfolio turnover rate | 48% |
(% of net assets)
| My Alarm Center LLC, Class A | 1.26% |
| Monitronics International, Inc., Term Loan B, 13.01%, 06/30/2028 | 1.00% |
| ACNR Holdings, Inc. | 0.90% |
| Spin Holdco, Inc., Term Loan, 9.60%, 03/04/2028 | 0.84% |
| AAdvantage Loyality IP Ltd. (American Airlines, Inc.), Term Loan, 10.29%, 04/20/2028 | 0.79% |
| Sigma Holdco B.V., Term Loan B-9, 8.18%, 01/03/2028 | 0.75% |
| Carnival Corp., Term Loan B, 8.00%, 10/18/2028 | 0.74% |
| Restoration Forest Products Group, LLC | 0.70% |
| Acrisure LLC, Term Loan B-6, 8.59%, 11/06/2030 | 0.65% |
| Ineos US Finance LLC, Term Loan, 8.50%, 02/18/2030 | 0.61% |
| * Excluding money market fund holdings, if any. |
(% of total investments)
| BBB- | 1.0% |
| BB+ | 1.5% |
| BB | 7.7% |
| BB- | 8.0% |
| B+ | 11.7% |
| B | 22.7% |
| B- | 19.6% |
| CCC+ | 6.3% |
| CCC | 3.6% |
| CCC- | 0.3% |
| CC | 0.2% |
| D | 1.0% |
| Non-Rated | 9.9% |
| Equity | 6.5% |
| ** Source: S&P Global Ratings. A credit rating is an assessment provided by a nationally recognized statistical rating organization of the creditworthiness of an issuer with respect to debt obligations, including specific securities, money market instruments or other debts. Ratings are measured on a scale that generally ranges from AAA (highest) to D (lowest); ratings are subject to change without notice. “Non- Rated” indicates the debtor was not rated, and should not be interpreted as indicating low quality. For more information on S&P Global Ratings’ rating methodology, please visit spglobal.com and select “Understanding Credit Ratings” under About Ratings on the homepage. |
| Fund (Class) | Costs of a $10,000 investment | Costs paid as a percentage of a $10,000 investment |
| Invesco Senior Floating Rate Fund (Class R6) | $80 | 0.76% |
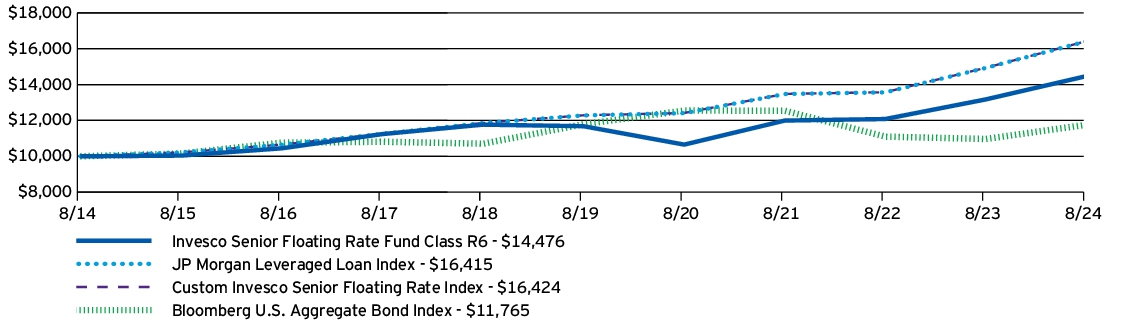
| AVERAGE ANNUAL TOTAL RETURNS | 1 Year | 5 Years | 10 Years |
| Invesco Senior Floating Rate Fund (Class R6) | 9.55% | 4.39% | 3.77% |
| JP Morgan Leveraged Loan Index | 9.95% | 5.97% | 5.08% |
| Custom Invesco Senior Floating Rate Index | 9.95% | 5.97% | 5.09% |
| Bloomberg U.S. Aggregate Bond Index | 7.30% | (0.04)% | 1.64% |
| Fund net assets | $3,032,555,705 |
| Total number of portfolio holdings | 557 |
| Total advisory fees paid | $18,596,053 |
| Portfolio turnover rate | 48% |
(% of net assets)
| My Alarm Center LLC, Class A | 1.26% |
| Monitronics International, Inc., Term Loan B, 13.01%, 06/30/2028 | 1.00% |
| ACNR Holdings, Inc. | 0.90% |
| Spin Holdco, Inc., Term Loan, 9.60%, 03/04/2028 | 0.84% |
| AAdvantage Loyality IP Ltd. (American Airlines, Inc.), Term Loan, 10.29%, 04/20/2028 | 0.79% |
| Sigma Holdco B.V., Term Loan B-9, 8.18%, 01/03/2028 | 0.75% |
| Carnival Corp., Term Loan B, 8.00%, 10/18/2028 | 0.74% |
| Restoration Forest Products Group, LLC | 0.70% |
| Acrisure LLC, Term Loan B-6, 8.59%, 11/06/2030 | 0.65% |
| Ineos US Finance LLC, Term Loan, 8.50%, 02/18/2030 | 0.61% |
| * Excluding money market fund holdings, if any. |
(% of total investments)
| BBB- | 1.0% |
| BB+ | 1.5% |
| BB | 7.7% |
| BB- | 8.0% |
| B+ | 11.7% |
| B | 22.7% |
| B- | 19.6% |
| CCC+ | 6.3% |
| CCC | 3.6% |
| CCC- | 0.3% |
| CC | 0.2% |
| D | 1.0% |
| Non-Rated | 9.9% |
| Equity | 6.5% |
| ** Source: S&P Global Ratings. A credit rating is an assessment provided by a nationally recognized statistical rating organization of the creditworthiness of an issuer with respect to debt obligations, including specific securities, money market instruments or other debts. Ratings are measured on a scale that generally ranges from AAA (highest) to D (lowest); ratings are subject to change without notice. “Non- Rated” indicates the debtor was not rated, and should not be interpreted as indicating low quality. For more information on S&P Global Ratings’ rating methodology, please visit spglobal.com and select “Understanding Credit Ratings” under About Ratings on the homepage. |
| Fund (Class) | Costs of a $10,000 investment | Costs paid as a percentage of a $10,000 investment |
| Invesco Short Duration High Yield Municipal Fund (Class A) | $94 | 0.90% |
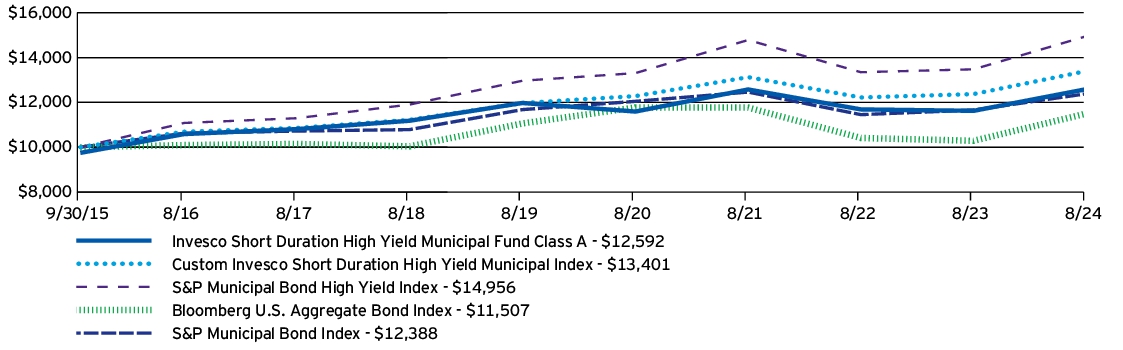
| AVERAGE ANNUAL TOTAL RETURNS | 1 Year | 5 Years | Since Inception (9/30/15) |
| Invesco Short Duration High Yield Municipal Fund (Class A) —including sales charge | 5.57% | 0.50% | 2.62% |
| Invesco Short Duration High Yield Municipal Fund (Class A) —excluding sales charge | 8.33% | 1.01% | 2.91% |
| Custom Invesco Short Duration High Yield Municipal Index | 8.33% | 2.28% | 3.34% |
| S&P Municipal Bond High Yield Index | 10.98% | 2.90% | 4.62% |
| Bloomberg U.S. Aggregate Bond Index | 7.30% | (0.04)% | 1.59% |
| S&P Municipal Bond Index | 6.25% | 1.19% | 2.43% |
| Fund net assets | $1,200,398,598 |
| Total number of portfolio holdings | 615 |
| Total advisory fees paid | $4,982,671 |
| Portfolio turnover rate | 29% |
(% of net assets)
| District of Columbia Tobacco Settlement Financing Corp., Series 2001, RB, 6.75%, 05/15/2040 | 1.76% |
| California (State of) Community Choice Financing Authority (Green Bonds), Series 2022 A-1, RB, 4.00%, 08/01/2028 | 1.35% |
| Illinois (State of) Development Finance Authority (CITGO Petroleum Corp.), Series 2002, RB, 8.00%, 06/01/2032 | 0.99% |
| Puerto Rico (Commonwealth of), Series 2021 A-1, GO Bonds, 5.63%, 07/01/2027 | 0.91% |
| Children's Trust Fund, Series 2002, RB, 5.50%, 05/15/2039 | 0.86% |
| PEFA, Inc., Series 2019, RB, 5.00%, 09/01/2026 | 0.85% |
| Broward (County of), FL, Series 2015 A, RB, 5.00%, 10/01/2045 | 0.84% |
| Illinois (State of) Finance Authority (Rush University Medical Center), Series 2015 A, Ref. RB, 5.00%, 11/15/2038 | 0.73% |
| New York Transportation Development Corp. (American Airlines, Inc.), Series 2016, Ref. RB, 5.00%, 08/01/2031 | 0.72% |
| Arkansas (State of) Development Finance Authority (Green Bonds), Series 2022, RB, 5.45%, 09/01/2052 | 0.70% |
(% of total investments)
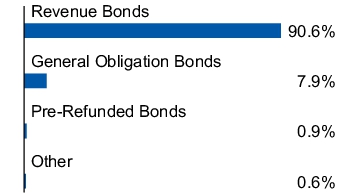
| Fund (Class) | Costs of a $10,000 investment | Costs paid as a percentage of a $10,000 investment |
| Invesco Short Duration High Yield Municipal Fund (Class C) | $171 | 1.65% |
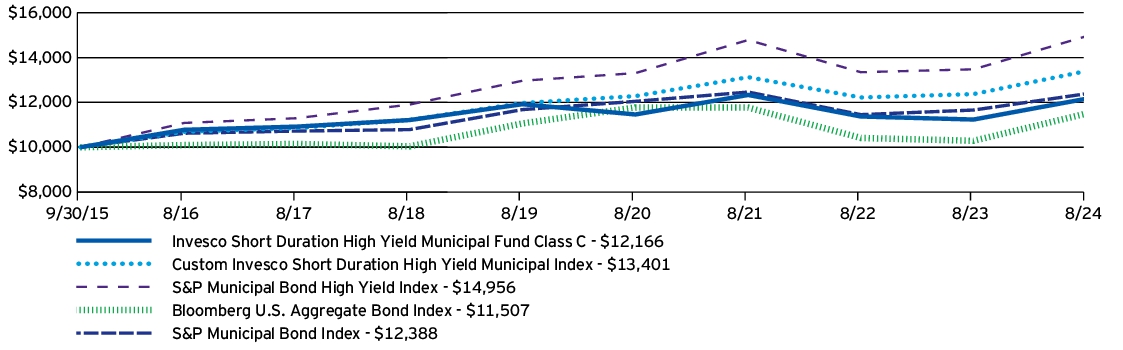
| AVERAGE ANNUAL TOTAL RETURNS | 1 Year | 5 Years | Since Inception (9/30/15) |
| Invesco Short Duration High Yield Municipal Fund (Class C) —including sales charge | 6.53% | 0.27% | 2.22% |
| Invesco Short Duration High Yield Municipal Fund (Class C) —excluding sales charge | 7.53% | 0.27% | 2.22% |
| Custom Invesco Short Duration High Yield Municipal Index | 8.33% | 2.28% | 3.34% |
| S&P Municipal Bond High Yield Index | 10.98% | 2.90% | 4.62% |
| Bloomberg U.S. Aggregate Bond Index | 7.30% | (0.04)% | 1.59% |
| S&P Municipal Bond Index | 6.25% | 1.19% | 2.43% |
| Fund net assets | $1,200,398,598 |
| Total number of portfolio holdings | 615 |
| Total advisory fees paid | $4,982,671 |
| Portfolio turnover rate | 29% |
(% of net assets)
| District of Columbia Tobacco Settlement Financing Corp., Series 2001, RB, 6.75%, 05/15/2040 | 1.76% |
| California (State of) Community Choice Financing Authority (Green Bonds), Series 2022 A-1, RB, 4.00%, 08/01/2028 | 1.35% |
| Illinois (State of) Development Finance Authority (CITGO Petroleum Corp.), Series 2002, RB, 8.00%, 06/01/2032 | 0.99% |
| Puerto Rico (Commonwealth of), Series 2021 A-1, GO Bonds, 5.63%, 07/01/2027 | 0.91% |
| Children's Trust Fund, Series 2002, RB, 5.50%, 05/15/2039 | 0.86% |
| PEFA, Inc., Series 2019, RB, 5.00%, 09/01/2026 | 0.85% |
| Broward (County of), FL, Series 2015 A, RB, 5.00%, 10/01/2045 | 0.84% |
| Illinois (State of) Finance Authority (Rush University Medical Center), Series 2015 A, Ref. RB, 5.00%, 11/15/2038 | 0.73% |
| New York Transportation Development Corp. (American Airlines, Inc.), Series 2016, Ref. RB, 5.00%, 08/01/2031 | 0.72% |
| Arkansas (State of) Development Finance Authority (Green Bonds), Series 2022, RB, 5.45%, 09/01/2052 | 0.70% |
(% of total investments)

| Fund (Class) | Costs of a $10,000 investment | Costs paid as a percentage of a $10,000 investment |
| Invesco Short Duration High Yield Municipal Fund (Class Y) | $68 | 0.65% |
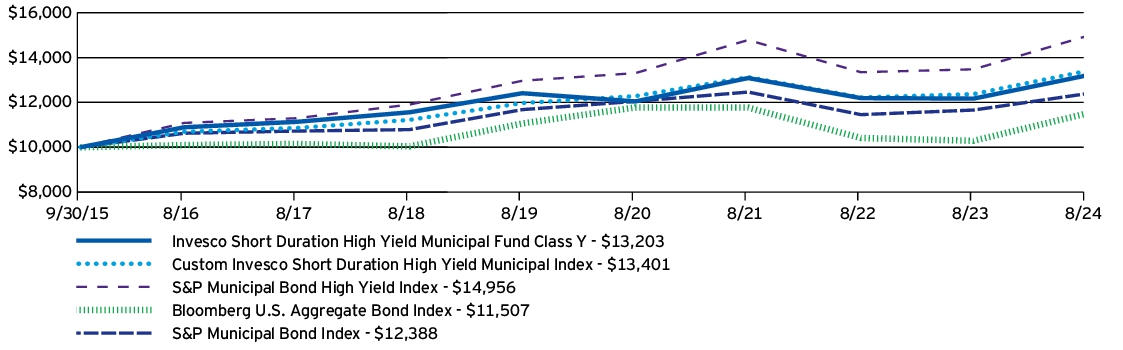
| AVERAGE ANNUAL TOTAL RETURNS | 1 Year | 5 Years | Since Inception (9/30/15) |
| Invesco Short Duration High Yield Municipal Fund (Class Y) | 8.48% | 1.25% | 3.16% |
| Custom Invesco Short Duration High Yield Municipal Index | 8.33% | 2.28% | 3.34% |
| S&P Municipal Bond High Yield Index | 10.98% | 2.90% | 4.62% |
| Bloomberg U.S. Aggregate Bond Index | 7.30% | (0.04)% | 1.59% |
| S&P Municipal Bond Index | 6.25% | 1.19% | 2.43% |
| Fund net assets | $1,200,398,598 |
| Total number of portfolio holdings | 615 |
| Total advisory fees paid | $4,982,671 |
| Portfolio turnover rate | 29% |
(% of net assets)
| District of Columbia Tobacco Settlement Financing Corp., Series 2001, RB, 6.75%, 05/15/2040 | 1.76% |
| California (State of) Community Choice Financing Authority (Green Bonds), Series 2022 A-1, RB, 4.00%, 08/01/2028 | 1.35% |
| Illinois (State of) Development Finance Authority (CITGO Petroleum Corp.), Series 2002, RB, 8.00%, 06/01/2032 | 0.99% |
| Puerto Rico (Commonwealth of), Series 2021 A-1, GO Bonds, 5.63%, 07/01/2027 | 0.91% |
| Children's Trust Fund, Series 2002, RB, 5.50%, 05/15/2039 | 0.86% |
| PEFA, Inc., Series 2019, RB, 5.00%, 09/01/2026 | 0.85% |
| Broward (County of), FL, Series 2015 A, RB, 5.00%, 10/01/2045 | 0.84% |
| Illinois (State of) Finance Authority (Rush University Medical Center), Series 2015 A, Ref. RB, 5.00%, 11/15/2038 | 0.73% |
| New York Transportation Development Corp. (American Airlines, Inc.), Series 2016, Ref. RB, 5.00%, 08/01/2031 | 0.72% |
| Arkansas (State of) Development Finance Authority (Green Bonds), Series 2022, RB, 5.45%, 09/01/2052 | 0.70% |
(% of total investments)

| Fund (Class) | Costs of a $10,000 investment | Costs paid as a percentage of a $10,000 investment |
| Invesco Short Duration High Yield Municipal Fund (Class R5) | $61 | 0.58% |
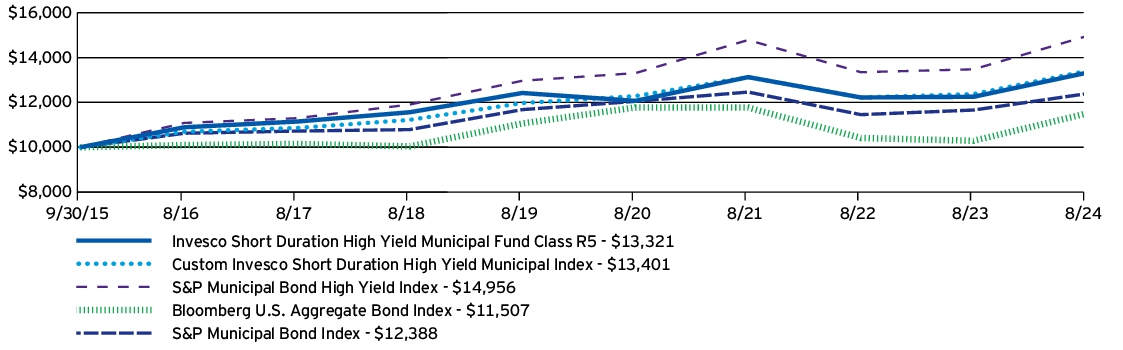
| AVERAGE ANNUAL TOTAL RETURNS | 1 Year | 5 Years | Since Inception (9/30/15) |
| Invesco Short Duration High Yield Municipal Fund (Class R5) | 8.73% | 1.41% | 3.27% |
| Custom Invesco Short Duration High Yield Municipal Index | 8.33% | 2.28% | 3.34% |
| S&P Municipal Bond High Yield Index | 10.98% | 2.90% | 4.62% |
| Bloomberg U.S. Aggregate Bond Index | 7.30% | (0.04)% | 1.59% |
| S&P Municipal Bond Index | 6.25% | 1.19% | 2.43% |
| Fund net assets | $1,200,398,598 |
| Total number of portfolio holdings | 615 |
| Total advisory fees paid | $4,982,671 |
| Portfolio turnover rate | 29% |
(% of net assets)
| District of Columbia Tobacco Settlement Financing Corp., Series 2001, RB, 6.75%, 05/15/2040 | 1.76% |
| California (State of) Community Choice Financing Authority (Green Bonds), Series 2022 A-1, RB, 4.00%, 08/01/2028 | 1.35% |
| Illinois (State of) Development Finance Authority (CITGO Petroleum Corp.), Series 2002, RB, 8.00%, 06/01/2032 | 0.99% |
| Puerto Rico (Commonwealth of), Series 2021 A-1, GO Bonds, 5.63%, 07/01/2027 | 0.91% |
| Children's Trust Fund, Series 2002, RB, 5.50%, 05/15/2039 | 0.86% |
| PEFA, Inc., Series 2019, RB, 5.00%, 09/01/2026 | 0.85% |
| Broward (County of), FL, Series 2015 A, RB, 5.00%, 10/01/2045 | 0.84% |
| Illinois (State of) Finance Authority (Rush University Medical Center), Series 2015 A, Ref. RB, 5.00%, 11/15/2038 | 0.73% |
| New York Transportation Development Corp. (American Airlines, Inc.), Series 2016, Ref. RB, 5.00%, 08/01/2031 | 0.72% |
| Arkansas (State of) Development Finance Authority (Green Bonds), Series 2022, RB, 5.45%, 09/01/2052 | 0.70% |
(% of total investments)

| Fund (Class) | Costs of a $10,000 investment | Costs paid as a percentage of a $10,000 investment |
| Invesco Short Duration High Yield Municipal Fund (Class R6) | $61 | 0.58% |

| AVERAGE ANNUAL TOTAL RETURNS | 1 Year | 5 Years | Since Inception (9/30/15) |
| Invesco Short Duration High Yield Municipal Fund (Class R6) | 8.68% | 1.31% | 3.16% |
| Custom Invesco Short Duration High Yield Municipal Index | 8.33% | 2.28% | 3.34% |
| S&P Municipal Bond High Yield Index | 10.98% | 2.90% | 4.62% |
| Bloomberg U.S. Aggregate Bond Index | 7.30% | (0.04)% | 1.59% |
| S&P Municipal Bond Index | 6.25% | 1.19% | 2.43% |
| Fund net assets | $1,200,398,598 |
| Total number of portfolio holdings | 615 |
| Total advisory fees paid | $4,982,671 |
| Portfolio turnover rate | 29% |
(% of net assets)
| District of Columbia Tobacco Settlement Financing Corp., Series 2001, RB, 6.75%, 05/15/2040 | 1.76% |
| California (State of) Community Choice Financing Authority (Green Bonds), Series 2022 A-1, RB, 4.00%, 08/01/2028 | 1.35% |
| Illinois (State of) Development Finance Authority (CITGO Petroleum Corp.), Series 2002, RB, 8.00%, 06/01/2032 | 0.99% |
| Puerto Rico (Commonwealth of), Series 2021 A-1, GO Bonds, 5.63%, 07/01/2027 | 0.91% |
| Children's Trust Fund, Series 2002, RB, 5.50%, 05/15/2039 | 0.86% |
| PEFA, Inc., Series 2019, RB, 5.00%, 09/01/2026 | 0.85% |
| Broward (County of), FL, Series 2015 A, RB, 5.00%, 10/01/2045 | 0.84% |
| Illinois (State of) Finance Authority (Rush University Medical Center), Series 2015 A, Ref. RB, 5.00%, 11/15/2038 | 0.73% |
| New York Transportation Development Corp. (American Airlines, Inc.), Series 2016, Ref. RB, 5.00%, 08/01/2031 | 0.72% |
| Arkansas (State of) Development Finance Authority (Green Bonds), Series 2022, RB, 5.45%, 09/01/2052 | 0.70% |
(% of total investments)

| Fund (Class) | Costs of a $10,000 investment | Costs paid as a percentage of a $10,000 investment |
| Invesco Short Term Municipal Fund (Class A) | $78 | 0.77% |
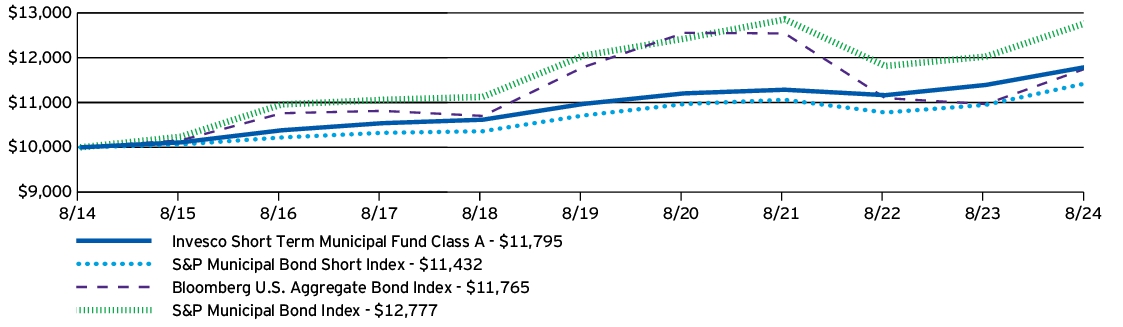
| AVERAGE ANNUAL TOTAL RETURNS | 1 Year | 5 Years | 10 Years |
| Invesco Short Term Municipal Fund (Class A) | 3.53% | 1.46% | 1.66% |
| S&P Municipal Bond Short Index | 4.43% | 1.31% | 1.35% |
| Bloomberg U.S. Aggregate Bond Index | 7.30% | (0.04)% | 1.64% |
| S&P Municipal Bond Index | 6.25% | 1.19% | 2.48% |
| Fund net assets | $1,575,219,884 |
| Total number of portfolio holdings | 584 |
| Total advisory fees paid | $6,467,115 |
| Portfolio turnover rate | 91% |
(% of net assets)
| Citizens Property Insurance, Inc., Series 2015 A-1, RB, 5.00%, 12/01/2024 | 1.30% |
| New York Transportation Development Corp. (American Airlines, Inc.), Series 2016, Ref. RB, 5.00%, 08/01/2031 | 1.28% |
| Tennessee Energy Acquisition Corp., Series 2018, RB, 4.00%, 11/01/2025 | 0.90% |
| PEFA, Inc., Series 2019, RB, 5.00%, 09/01/2026 | 0.87% |
| North Texas Tollway Authority, Series 2015 A, Ref. RB, 5.00%, 01/01/2032 | 0.84% |
| Connecticut (State of), Series 2014 E, GO Bonds, 5.00%, 11/06/2024 | 0.84% |
| New York (City of), NY, Series 2012, VRD GO Bonds, 2.55%, 04/01/2042 | 0.82% |
| New York City Housing Development Corp. (Sustainable Development Bonds), Series 2022 B-2, RB, 3.40%, 12/22/2026 | 0.82% |
| Bay Area Toll Authority (San Francisco Bay Area), Series 2024, Ref. VRD RB, 2.35%, 04/01/2059 | 0.79% |
| Black Belt Energy Gas District (The) (No. 4), Series 2019 A-1, RB, 4.00%, 12/01/2025 | 0.78% |
(% of total investments)
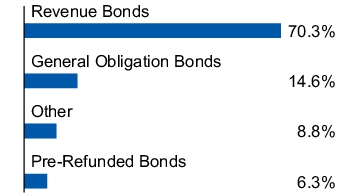
| Fund (Class) | Costs of a $10,000 investment | Costs paid as a percentage of a $10,000 investment |
| Invesco Short Term Municipal Fund (Class Y) | $53 | 0.52% |
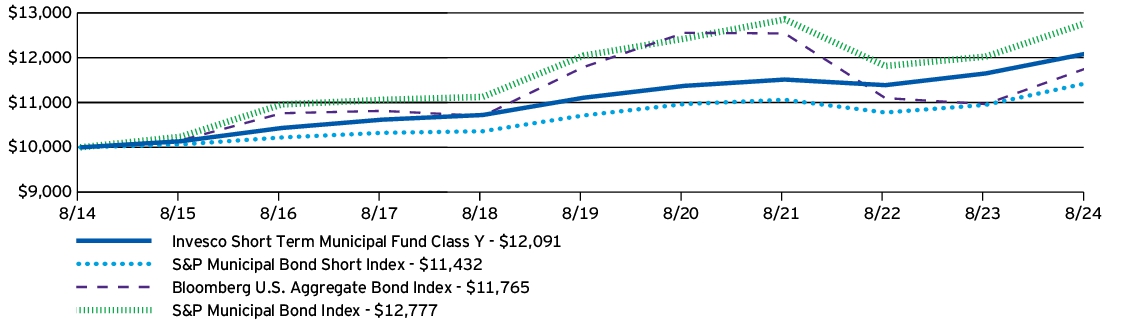
| AVERAGE ANNUAL TOTAL RETURNS | 1 Year | 5 Years | 10 Years |
| Invesco Short Term Municipal Fund (Class Y) | 3.80% | 1.71% | 1.92% |
| S&P Municipal Bond Short Index | 4.43% | 1.31% | 1.35% |
| Bloomberg U.S. Aggregate Bond Index | 7.30% | (0.04)% | 1.64% |
| S&P Municipal Bond Index | 6.25% | 1.19% | 2.48% |
| Fund net assets | $1,575,219,884 |
| Total number of portfolio holdings | 584 |
| Total advisory fees paid | $6,467,115 |
| Portfolio turnover rate | 91% |
(% of net assets)
| Citizens Property Insurance, Inc., Series 2015 A-1, RB, 5.00%, 12/01/2024 | 1.30% |
| New York Transportation Development Corp. (American Airlines, Inc.), Series 2016, Ref. RB, 5.00%, 08/01/2031 | 1.28% |
| Tennessee Energy Acquisition Corp., Series 2018, RB, 4.00%, 11/01/2025 | 0.90% |
| PEFA, Inc., Series 2019, RB, 5.00%, 09/01/2026 | 0.87% |
| North Texas Tollway Authority, Series 2015 A, Ref. RB, 5.00%, 01/01/2032 | 0.84% |
| Connecticut (State of), Series 2014 E, GO Bonds, 5.00%, 11/06/2024 | 0.84% |
| New York (City of), NY, Series 2012, VRD GO Bonds, 2.55%, 04/01/2042 | 0.82% |
| New York City Housing Development Corp. (Sustainable Development Bonds), Series 2022 B-2, RB, 3.40%, 12/22/2026 | 0.82% |
| Bay Area Toll Authority (San Francisco Bay Area), Series 2024, Ref. VRD RB, 2.35%, 04/01/2059 | 0.79% |
| Black Belt Energy Gas District (The) (No. 4), Series 2019 A-1, RB, 4.00%, 12/01/2025 | 0.78% |
(% of total investments)

| Fund (Class) | Costs of a $10,000 investment | Costs paid as a percentage of a $10,000 investment |
| Invesco Short Term Municipal Fund (Class R6) | $46 | 0.45% |
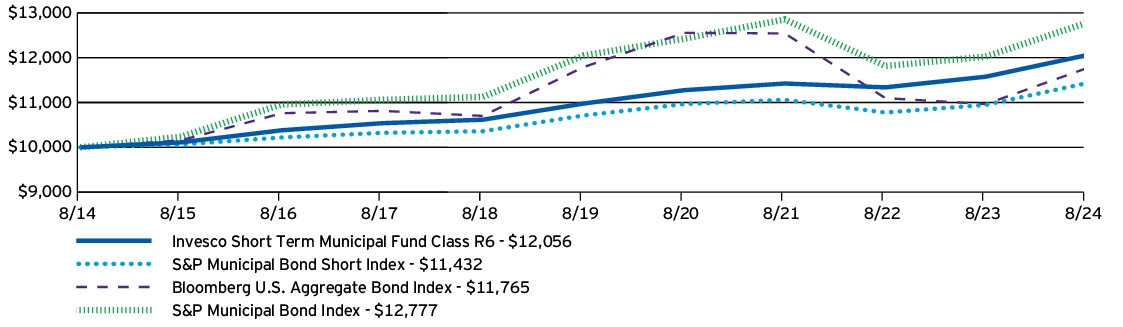
| AVERAGE ANNUAL TOTAL RETURNS | 1 Year | 5 Years | 10 Years |
| Invesco Short Term Municipal Fund (Class R6) | 4.15% | 1.90% | 1.89% |
| S&P Municipal Bond Short Index | 4.43% | 1.31% | 1.35% |
| Bloomberg U.S. Aggregate Bond Index | 7.30% | (0.04)% | 1.64% |
| S&P Municipal Bond Index | 6.25% | 1.19% | 2.48% |
| Fund net assets | $1,575,219,884 |
| Total number of portfolio holdings | 584 |
| Total advisory fees paid | $6,467,115 |
| Portfolio turnover rate | 91% |
(% of net assets)
| Citizens Property Insurance, Inc., Series 2015 A-1, RB, 5.00%, 12/01/2024 | 1.30% |
| New York Transportation Development Corp. (American Airlines, Inc.), Series 2016, Ref. RB, 5.00%, 08/01/2031 | 1.28% |
| Tennessee Energy Acquisition Corp., Series 2018, RB, 4.00%, 11/01/2025 | 0.90% |
| PEFA, Inc., Series 2019, RB, 5.00%, 09/01/2026 | 0.87% |
| North Texas Tollway Authority, Series 2015 A, Ref. RB, 5.00%, 01/01/2032 | 0.84% |
| Connecticut (State of), Series 2014 E, GO Bonds, 5.00%, 11/06/2024 | 0.84% |
| New York (City of), NY, Series 2012, VRD GO Bonds, 2.55%, 04/01/2042 | 0.82% |
| New York City Housing Development Corp. (Sustainable Development Bonds), Series 2022 B-2, RB, 3.40%, 12/22/2026 | 0.82% |
| Bay Area Toll Authority (San Francisco Bay Area), Series 2024, Ref. VRD RB, 2.35%, 04/01/2059 | 0.79% |
| Black Belt Energy Gas District (The) (No. 4), Series 2019 A-1, RB, 4.00%, 12/01/2025 | 0.78% |
(% of total investments)

| Fund | Costs of a $10,000 investment | Costs paid as a percentage of a $10,000 investment | ||
| Invesco SMA Municipal Bond Fund | $0 | 0.00%† |
† | Reflects fee waivers and/or expense reimbursements, without which expenses would have been higher. |
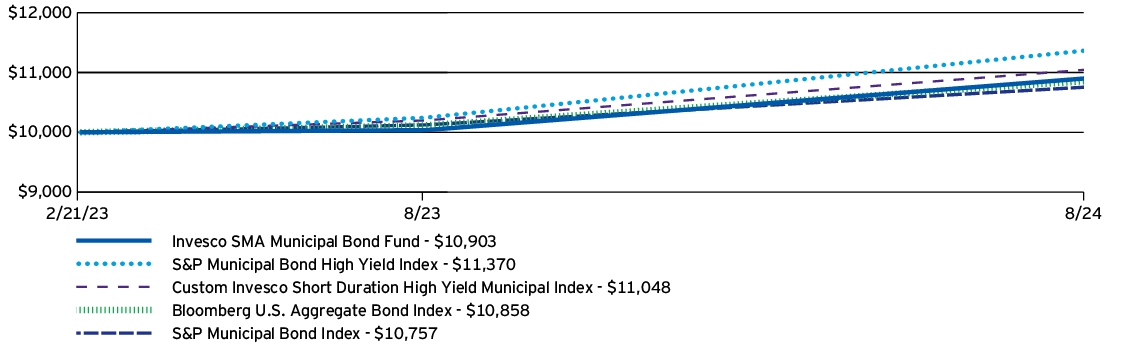
| AVERAGE ANNUAL TOTAL RETURNS | 1 Year | Since Inception (2/21/23) |
| Invesco SMA Municipal Bond Fund | 6.91% | 5.84% |
| Custom Invesco Short Duration High Yield Municipal Index | 8.33% | 6.77% |
| S&P Municipal Bond High Yield Index | 10.98% | 8.81% |
| Bloomberg U.S. Aggregate Bond Index | 7.30% | 5.56% |
| S&P Municipal Bond Index | 6.25% | 4.92% |
| Fund net assets | $11,559,775 |
| Total number of portfolio holdings | 41 |
| Total advisory fees paid | $0 |
| Portfolio turnover rate | 44% |
(% of net assets)
| Main Street Natural Gas, Inc., Series 2023 A, RB, 5.00%, 06/01/2030 | 4.37% |
| New Hope Cultural Education Facilities Finance Corp. (Presbyterian Village North), Series 2018, Ref. RB, 5.00%, 10/01/2024 | 4.32% |
| Black Belt Energy Gas District (The) (Gas), Series 2022 F, RB, 5.25%, 12/01/2027 | 4.19% |
| Bexar County Health Facilities Development Corp. (Army Retirement Residence Foundation), Series 2016, Ref. RB, 5.00%, 07/15/2025 | 3.73% |
| Iowa (State of) Finance Authority (Iowa Fertilizer Co.), Series 2022, Ref. RB, 5.00%, 12/01/2032 | 3.02% |
| Portland (Port of), OR (Green Bonds), Twenty Ninth Series 2023, RB, 5.25%, 07/01/2039 | 2.88% |
| Missouri (State of) Health & Educational Facilities Authority (Truman Medical Center, Inc.), Series 2017, RB, 5.00%, 12/01/2037 | 2.67% |
| South Carolina (State of) Jobs-Economic Development Authority (Novant Health Obligated Group), Series 2024 A, RB, 5.25%, 11/01/2044 | 2.43% |
| South Carolina (State of) Public Service Authority (Santee Cooper), Series 2024 B, Ref. RB, 5.00%, 12/01/2040 | 2.42% |
| Atlanta (City of), GA Urban Residential Finance Authority (GE Tower Apartments), Series 2023 B, RB, 5.75%, 06/01/2025 | 2.43% |
(% of total investments)
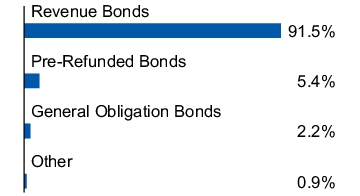
(b) Not applicable.
Item 2. Code of Ethics.
The Registrant has adopted a Code of Ethics (the "Code") that applies to the Registrant's Principal Executive Officer ("PEO") and Principal Financial Officer ("PFO"). This Code is filed as an exhibit to this report on Form N-CSR under Item 19(a)(1). No substantive amendments to this Code were made during the reporting period. The Code was revised to include PEOs and PFOs of certain Invesco exchange traded funds, previously covered by a separate code of ethics. There were no waivers for the fiscal year ended August 31, 2024.
Item 3. Audit Committee Financial Expert.
The Board of Trustees has determined that the Registrant has at least one audit committee financial expert serving on its Audit Committee. The Audit Committee financial expert is Anthony J. LaCava, Jr. Anthony J. LaCava, Jr. is "independent" within the meaning of that term as used in Form N-CSR.
Item 4. Principal Accountant Fees and Services.
(a) to (d)
Fees Billed by PwC Related to the Registrant
PricewaterhouseCoopers LLP (“PwC”), the Registrant’s independent registered public accounting firm, billed the Registrant aggregate fees for services rendered to the Registrant for the last two fiscal years as shown in the following table. The Audit Committee pre-approved all audit and non-audit services provided to the Registrant.
| Fees Billed for Services Rendered to the Registrant for fiscal year end 2024 | Fees Billed for Services Rendered to the Registrant for fiscal year end 2023 |
|
|
|
Audit Fees | $ 658,126 | $ 694,104 |
Audit-Related Fees | $ 0 | $ 0 |
Tax Fees(1) | $ 256,026 | $ 277,192 |
All Other Fees | $ 0 | $ 0 |
Total Fees | $ 914,152 | $ 971,296 |
(1) | Tax Fees for the fiscal years ended 2024 and 2023 includes fees billed for preparation of U.S. Tax Returns and Taxable Income calculations, including excise tax and year-to-date estimates for various book-to-tax differences. |
Fees Billed by PwC Related to Invesco and Affiliates
PwC billed Invesco Advisers, Inc. (“Invesco”), the Registrant’s investment adviser, and any entity controlling, controlled by or under common control with Invesco that provides ongoing services to the Registrant (“Affiliates”) aggregate fees for pre-approved non-audit services rendered to Invesco and Affiliates for the last two fiscal years as shown in the following table. The Audit Committee pre-approved all non-audit services provided to Invesco and Affiliates that were required to be pre-approved.
| Fees Billed for Non-Audit Services Rendered to Invesco and Invesco Affiliates for fiscal year end 2024 That Were Required to be Pre-Approved by the Registrant’s Audit Committee | Fees Billed for Non-Audit Services Rendered to Invesco and Invesco Affiliates for fiscal year end 2023 That Were Required to be Pre-Approved by the Registrant’s Audit Committee |
Audit-Related Fees(1) | $ 1,121,000 | $ 957,000 |
Tax Fees | $ 0 | $ 0 |
All Other Fees | $ 0 | $ 0 |
Total Fees | $ 1,121 ,000 | $ 957,000 |
(1) Audit-Related Fees for the fiscal years ended 2024 and 2023 include fees billed related to reviewing controls at a service organization.
(e)(1)
PRE-APPROVAL OF AUDIT AND NON-AUDIT SERVICES
POLICIES AND PROCEDURES
As adopted by the Audit Committees
of the Invesco Funds (the “Funds”)
Last Amended March 29, 2017
I. | Statement of Principles |
The Audit Committees (the “Audit Committee”) of the Boards of Trustees of the Funds (the “Board”) have adopted these policies and procedures (the “Procedures”) with respect to the pre-approval of audit and non-audit services to be provided by the Funds’ independent auditor (the “Auditor”) to the Funds, and to the Funds’ investment adviser(s) and any entity controlling, controlled by, or under common control with the investment adviser(s) that provides ongoing services to the Funds (collectively, “Service Affiliates”).
Under Section 202 of the Sarbanes-Oxley Act of 2002, all audit and non-audit services provided to the Funds by the Auditor must be preapproved by the Audit Committee. Rule 2-01 of Regulation S-X requires that the Audit Committee also pre-approve a Service Affiliate’s engagement of the Auditor for non-audit services if the engagement relates directly to the operations and financial reporting of the Funds (a “Service Affiliate’s Covered Engagement”).
These Procedures set forth the procedures and the conditions pursuant to which the Audit Committee may pre-approve audit and non-audit services for the Funds and a Service Affiliate’s Covered Engagement pursuant to rules and regulations of the Securities and Exchange Commission (“SEC”) and other organizations and regulatory bodies applicable to the Funds (“Applicable Rules”).1 They address both general pre-approvals without consideration of specific case-by-case services (“general pre-approvals”) and pre-approvals on a case-by-case basis (“specific pre-approvals”). Any services requiring pre-approval that are not within the scope of general pre-approvals hereunder are subject to specific pre-approval. These Procedures also address the delegation by the Audit Committee of pre-approval authority to the Audit Committee Chair or Vice Chair.
II. | Pre-Approval of Fund Audit Services |
The annual Fund audit services engagement, including terms and fees, is subject to specific pre-approval by the Audit Committee. Audit services include the annual financial statement audit and other procedures required to be performed by an independent auditor to be able to form an opinion on the Funds’ financial statements. The Audit Committee will receive, review and consider sufficient information concerning a proposed Fund audit engagement to make a reasonable evaluation of the Auditor’s qualifications and independence. The Audit Committee will oversee the Fund audit services engagement as necessary, including approving any changes in terms, audit scope, conditions and fees.
In addition to approving the Fund audit services engagement at least annually and specifically approving any changes, the Audit Committee may generally or specifically pre-approve engagements for other audit services, which are those services that only an independent auditor reasonably can provide. Other audit services may include services associated with SEC registration statements, periodic reports and other documents filed with the SEC.
III. | General and Specific Pre-Approval of Non-Audit Fund Services |
The Audit Committee will consider, at least annually, the list of General Pre-Approved Non-Audit Services which list may be terminated or modified at any time by the Audit Committee. To inform the Audit Committee’s review and approval of General Pre-Approved Non-Audit Services, the Funds’ Treasurer (or his or her designee) and Auditor shall provide such information regarding independence or other matters as the Audit Committee may request.
Any services or fee ranges that are not within the scope of General Pre-Approved Non-Audit Services have not received general pre-approval and require specific pre-approval. Each request for specific pre-approval by the Audit Committee for services to be provided by the Auditor to the Funds must be submitted to the Audit Committee by the Funds’ Treasurer (or his or her designee) and must include detailed information about the services to be provided, the fees or fee ranges to be charged, and other relevant information sufficient to allow the Audit Committee to consider whether to pre-approve such engagement, including evaluating whether the provision of such services will impair the independence of the Auditor and is otherwise consistent with Applicable Rules.
IV. | Non-Audit Service Types |
The Audit Committee may provide either general or specific pre-approval of audit-related, tax or other services, each as described in more detail below.
a. | Audit-Related Services |
“Audit-related services” are assurance and related services that are reasonably related to the performance of the audit or review of the Fund’s financial statements or that are traditionally performed by an independent auditor. Audit-related services include, among others, accounting consultations related to accounting, financial reporting or disclosure matters not classified as “Audit services”; assistance with understanding and implementing new accounting and financial reporting guidance from rulemaking authorities; services related to mergers, acquisitions or dispositions; compliance with ratings agency requirements and interfund lending activities; and assistance with internal control reporting requirements.
b. | Tax Services |
“Tax services” include, but are not limited to, the review and signing of the Funds’ federal tax returns, the review of required distributions by the Funds and consultations regarding tax matters such as the tax treatment of new investments or the impact of new regulations. The Audit Committee will not approve proposed services of the Auditor which the Audit Committee believes are to be provided in connection with a service or transaction initially recommended by the Auditor, the sole business purpose of which may be tax avoidance and the tax treatment of which may not be supported in the Internal Revenue Code and related regulations. The Audit Committee will consult with the Funds’ Treasurer (or his or her designee) and may consult with outside counsel or advisers as necessary to ensure the consistency of tax services rendered by the Auditor with the foregoing policy. The Auditor shall not represent any Fund or any Service Affiliate before a tax court, district court or federal court of claims.
Each request to provide tax services under either the general or specific pre-approval of the Audit Committee will include a description from the Auditor in writing of (i) the scope of the service, the fee structure for the engagement, and any side letter or other amendment to the engagement letter, or any other agreement (whether oral, written, or otherwise) between the Auditor and the Funds, relating to the service; and (ii) any compensation arrangement or other agreement, such as a referral agreement, a referral fee or fee-sharing arrangement, between the Auditor (or an affiliate of the Auditor) and any person (other than the Funds or Service Affiliates receiving the services) with respect to the promoting, marketing, or recommending of a transaction covered by the service. The Auditor will also discuss with the Audit Committee the potential effects of the services on the independence of the Auditor, and document the substance of its discussion with the Audit Committee.
c. | Other Services |
The Audit Committee may pre-approve other non-audit services so long as the Audit Committee believes that the service will not impair the independence of the Auditor. Appendix I includes a list of services that the Auditor is prohibited from performing by the SEC rules. Appendix I also includes a list of services that would impair the Auditor’s independence unless the Audit Committee reasonably concludes that the results of the services will not be subject to audit procedures during an audit of the Funds’ financial statements.
V. | Pre-Approval of Service Affiliate’s Covered Engagements |
Rule 2-01 of Regulation S-X requires that the Audit Committee pre-approve a Service Affiliate’s engagement of the Auditor for non-audit services if the engagement relates directly to the operations and financial reporting of the Funds, defined above as a “Service Affiliate’s Covered Engagement”.
The Audit Committee may provide either general or specific pre-approval of any Service Affiliate’s Covered Engagement, including for audit-related, tax or other services, as described above, if the Audit Committee believes that the provision of the services to a Service Affiliate will not impair the independence of the Auditor with respect to the Funds. Any Service Affiliate’s Covered Engagements that are not within the scope of General Pre-Approved Non-Audit Services have not received general pre-approval and require specific pre-approval.
Each request for specific pre-approval by the Audit Committee of a Service Affiliate’s Covered Engagement must be submitted to the Audit Committee by the Funds’ Treasurer (or his or her designee) and must include detailed information about the services to be provided, the fees or fee ranges to be charged, a description of the current status of the pre-approval process involving other audit committees in the Invesco investment company complex (as defined in Rule 2-201 of Regulation S-X) with respect to the proposed engagement, and other relevant information sufficient to allow the Audit Committee to consider whether the provision of such services will impair the independence of the Auditor from the Funds. Additionally, the Funds’ Treasurer (or his or her designee) and the Auditor will provide the Audit Committee with a statement that the proposed engagement requires pre-approval by the Audit Committee, the proposed engagement, in their view, will not impair the independence of the Auditor and is consistent with Applicable Rules, and the description of the proposed engagement provided to the Audit Committee is consistent with that presented to or approved by the Invesco audit committee.
Information about all Service Affiliate engagements of the Auditor for non-audit services, whether or not subject to pre-approval by the Audit Committee, shall be provided to the Audit Committee at least quarterly, to allow the Audit Committee to consider whether the provision of such services is compatible with maintaining the Auditor’s independence from the Funds. The Funds’ Treasurer and Auditor shall provide the Audit Committee with sufficiently detailed information about the scope of services provided and the fees for such services, to ensure that the Audit Committee can adequately consider whether the provision of such services is compatible with maintaining the Auditor’s independence from the Fund.
VI. | Pre-Approved Fee Levels or Established Amounts |
Pre-approved fee levels or ranges for audit and non-audit services to be provided by the Auditor to the Funds, and for a Service Affiliate’s Covered Engagement, under general pre-approval or specific pre-approval will be set periodically by the Audit Committee. Any proposed fees exceeding 110% of the maximum pre-approved fee levels or ranges for such services or engagements will be promptly presented to the Audit Committee and will require specific pre-approval by the Audit Committee before payment of any additional fees is made.
VII. | Delegation |
The Audit Committee hereby delegates, subject to the dollar limitations set forth below, specific authority to its Chair, or in his or her absence, Vice Chair, to pre-approve audit and non-audit services proposed to be provided by the Auditor to the Funds and/or a Service Affiliate’s Covered Engagement, between Audit Committee meetings. Such delegation does not preclude the Chair or Vice Chair from declining, on a case-by-case basis, to exercise his or her delegated authority and instead convening the Audit Committee to consider and pre-approve any proposed services or engagements.
Notwithstanding the foregoing, the Audit Committee must pre-approve: (a) any non-audit services to be provided to the Funds for which the fees are estimated to exceed $500,000; (b) any Service Affiliate’s Covered Engagement for which the fees are estimated to exceed $500,000; or (c) any cost increase to any previously approved service or engagement that exceeds the greater of $250,000 or 50% of the previously approved fees up to a maximum increase of $500,000.
VIII. | Compliance with Procedures |
Notwithstanding anything herein to the contrary, failure to pre-approve any services or engagements that are not required to be pre-approved pursuant to the de minimis exception provided for in Rule 2-01(c)(7)(i)(C) of Regulation S-X shall not constitute a violation of these Procedures. The Audit Committee has designated the Funds’ Treasurer to ensure services and engagements are pre-approved in compliance with these Procedures. The Funds’ Treasurer will immediately report to the Chair of the Audit Committee, or the Vice Chair in his or her absence, any breach of these Procedures that comes to the attention of the Funds’ Treasurer or any services or engagements that are not required to be pre-approved pursuant to the de minimis exception provided for in Rule 2-01(c)(7)(i)(C) of Regulation S-X.
On at least an annual basis, the Auditor will provide the Audit Committee with a summary of all non-audit services provided to any entity in the investment company complex (as defined in section 2-01(f)(14) of Regulation S-X, including the Funds and Service Affiliates) that were not pre-approved, including the nature of services provided and the associated fees.
IX. | Amendments to Procedures |
All material amendments to these Procedures must be approved in advance by the Audit Committee. Non-material amendments to these Procedures may be made by the Legal and Compliance Departments and will be reported to the Audit Committee at the next regularly scheduled meeting of the Audit Committee.
Appendix I
Non-Audit Services That May Impair the Auditor’s Independence
The Auditor is not independent if, at any point during the audit and professional engagement, the Auditor provides the following non-audit services:
· | Management functions; |
· | Human resources; |
· | Broker-dealer, investment adviser, or investment banking services; |
· | Legal services; |
· | Expert services unrelated to the audit; |
· | Any service or product provided for a contingent fee or a commission; |
· | Services related to marketing, planning, or opining in favor of the tax treatment of confidential transactions or aggressive tax position transactions, a significant purpose of which is tax avoidance; |
· | Tax services for persons in financial reporting oversight roles at the Fund; and |
· | Any other service that the Public Company Oversight Board determines by regulation is impermissible. |
An Auditor is not independent if, at any point during the audit and professional engagement, the Auditor provides the following non-audit services unless it is reasonable to conclude that the results of the services will not be subject to audit procedures during an audit of the Funds’ financial statements:
· | Bookkeeping or other services related to the accounting records or financial statements of the audit client; |
· | Financial information systems design and implementation; |
· | Appraisal or valuation services, fairness opinions, or contribution-in-kind reports; |
· | Actuarial services; and |
· | Internal audit outsourcing services. |
(e)(2) There were no amounts that were pre-approved by the Audit Committee pursuant to the de minimis exception under Rule 2-01 of Regulation S-X.
(f) Not applicable.
(g) In addition to the amounts shown in the tables above, PwC billed Invesco and Invesco Affiliates aggregate fees of $6,608,000 for the fiscal year ended August 31, 2024 and $6,721,000 for the fiscal year ended August 31, 2023. In total, PwC billed the Registrant, Invesco and Invesco Affiliates aggregate non-audit fees of $7,985,026 for the fiscal year ended August 31, 2024 and $7,955,192 for the fiscal year ended August 31, 2023.
PwC provided audit services to the Investment Company complex of approximately $34 million.
(h) The Audit Committee also has considered whether the provision of non-audit services that were rendered to Invesco and Invesco Affiliates that were not required to be pre-approved pursuant to SEC regulations, if any, is compatible with maintaining PwC’s independence.
(i) Not Applicable.
(j) Not Applicable.
|
1 | Applicable Rules include, for example, New York Stock Exchange (“NYSE”) rules applicable to closed-end funds managed by Invesco and listed on NYSE. |
Item 5. Audit Committee of Listed Registrants.
Not applicable.
Item 6. Investments.
(a) Investments in securities of unaffiliated issuers is filed under Item 7 of this Form N-CSR
(b) Not applicable.
Item 7. Financial Statements and Financial Highlights for Open-End Management Investment Companies.

| Annual Financial Statements and Other Information | August 31, 2024 |
| Shares | Value | ||
| Common Stocks & Other Equity Interests–99.64% | |||
| Advertising–1.29% | |||
| Trade Desk, Inc. (The), Class A(b) | 1,950,392 | $203,874,476 | |
| Aerospace & Defense–0.92% | |||
| TransDigm Group, Inc. | 105,826 | 145,321,321 | |
| Application Software–1.83% | |||
| Cadence Design Systems, Inc.(b) | 763,000 | 205,193,590 | |
| HubSpot, Inc.(b) | 166,975 | 83,332,213 | |
| 288,525,803 | |||
| Asset Management & Custody Banks–5.22% | |||
| Blackstone, Inc., Class A | 2,608,341 | 371,323,425 | |
| KKR & Co., Inc., Class A | 3,650,338 | 451,802,334 | |
| 823,125,759 | |||
| Automotive Retail–0.58% | |||
| O’Reilly Automotive, Inc.(b) | 81,548 | 92,146,794 | |
| Biotechnology–1.59% | |||
| Regeneron Pharmaceuticals, Inc.(b) | 211,987 | 251,138,879 | |
| Broadline Retail–8.16% | |||
| Amazon.com, Inc.(b) | 6,377,433 | 1,138,371,791 | |
| MercadoLibre, Inc. (Brazil)(b) | 71,829 | 148,086,976 | |
| 1,286,458,767 | |||
| Communications Equipment–2.36% | |||
| Arista Networks, Inc.(b) | 815,470 | 288,170,788 | |
| Motorola Solutions, Inc. | 189,817 | 83,906,707 | |
| 372,077,495 | |||
| Construction Machinery & Heavy Transportation Equipment– 0.88% | |||
| Wabtec Corp. | 817,726 | 138,661,798 | |
| Construction Materials–0.54% | |||
| Martin Marietta Materials, Inc. | 158,161 | 84,483,280 | |
| Consumer Staples Merchandise Retail–0.55% | |||
| Costco Wholesale Corp. | 97,268 | 86,800,018 | |
| Diversified Financial Services–0.20% | |||
| Apollo Global Management, Inc. | 271,371 | 31,405,766 | |
| Diversified Metals & Mining–0.57% | |||
| Teck Resources Ltd., Class B (Canada) | 1,864,435 | 89,306,436 | |
| Diversified Support Services–0.74% | |||
| Cintas Corp. | 144,121 | 116,034,700 | |
| Electrical Components & Equipment–2.05% | |||
| Eaton Corp. PLC | 474,668 | 145,689,849 | |
| Vertiv Holdings Co., Class A | 2,142,617 | 177,901,490 | |
| 323,591,339 | |||
| Financial Exchanges & Data–2.67% | |||
| Intercontinental Exchange, Inc. | 491,546 | 79,409,256 | |
| S&P Global, Inc. | 667,290 | 342,479,920 | |
| 421,889,176 | |||
| Shares | Value | ||
| Food Distributors–0.66% | |||
| US Foods Holding Corp.(b) | 1,749,796 | $103,605,421 | |
| Health Care Equipment–3.90% | |||
| Boston Scientific Corp.(b) | 1,817,737 | 148,672,709 | |
| DexCom, Inc.(b) | 1,174,843 | 81,463,614 | |
| Intuitive Surgical, Inc.(b) | 782,481 | 385,473,615 | |
| 615,609,938 | |||
| Home Improvement Retail–1.24% | |||
| Lowe’s Cos., Inc. | 789,543 | 196,201,435 | |
| Hotels, Resorts & Cruise Lines–1.17% | |||
| Booking Holdings, Inc. | 47,310 | 184,945,671 | |
| Industrial Machinery & Supplies & Components–0.75% | |||
| Parker-Hannifin Corp. | 196,125 | 117,714,225 | |
| Integrated Oil & Gas–1.11% | |||
| Suncor Energy, Inc. (Canada)(c) | 4,306,576 | 174,588,591 | |
| Interactive Home Entertainment–1.16% | |||
| Nintendo Co. Ltd. (Japan) | 1,412,800 | 76,833,971 | |
| Take-Two Interactive Software, Inc.(b) | 655,165 | 105,946,732 | |
| 182,780,703 | |||
| Interactive Media & Services–9.36% | |||
| Alphabet, Inc., Class A | 4,554,423 | 744,101,630 | |
| Meta Platforms, Inc., Class A | 1,404,458 | 732,158,000 | |
| 1,476,259,630 | |||
| Investment Banking & Brokerage–0.99% | |||
| Goldman Sachs Group, Inc. (The) | 307,286 | 156,792,681 | |
| Life Sciences Tools & Services–0.47% | |||
| Danaher Corp. | 273,158 | 73,564,181 | |
| Movies & Entertainment–2.71% | |||
| Netflix, Inc.(b) | 464,277 | 325,620,674 | |
| Spotify Technology S.A. (Sweden)(b) | 298,694 | 102,416,199 | |
| 428,036,873 | |||
| Passenger Ground Transportation–1.16% | |||
| Uber Technologies, Inc.(b) | 2,501,488 | 182,933,817 | |
| Pharmaceuticals–3.24% | |||
| Eli Lilly and Co. | 532,393 | 511,107,928 | |
| Semiconductor Materials & Equipment–1.29% | |||
| ASML Holding N.V., New York Shares (Netherlands) | 226,056 | 204,325,237 | |
| Semiconductors–16.05% | |||
| Advanced Micro Devices, Inc.(b) | 448,704 | 66,659,466 | |
| Broadcom, Inc. | 3,097,220 | 504,289,360 | |
| Monolithic Power Systems, Inc. | 257,012 | 240,223,976 | |
| NVIDIA Corp. | 14,408,896 | 1,719,989,916 | |
| 2,531,162,718 | |||
| Systems Software–11.52% | |||
| Microsoft Corp. | 3,620,260 | 1,510,155,256 | |
| 2 | Invesco American Franchise Fund |
| Shares | Value | ||
| Systems Software–(continued) | |||
| ServiceNow, Inc.(b) | 358,225 | $306,282,375 | |
| 1,816,437,631 | |||
| Technology Hardware, Storage & Peripherals–9.36% | |||
| Apple, Inc. | 6,444,633 | 1,475,820,957 | |
| Trading Companies & Distributors–0.60% | |||
| United Rentals, Inc. | 126,880 | 94,051,069 | |
| Transaction & Payment Processing Services–2.75% | |||
| Fiserv, Inc.(b) | 683,343 | 119,311,688 | |
| Visa, Inc., Class A(c) | 1,139,156 | 314,828,544 | |
| 434,140,232 | |||
| Total Common Stocks & Other Equity Interests (Cost $7,096,033,252) | 15,714,920,745 | ||
| Money Market Funds–0.38% | |||
| Invesco Government & Agency Portfolio, Institutional Class, 5.18%(d)(e) | 21,282,864 | 21,282,864 | |
| Invesco Treasury Portfolio, Institutional Class, 5.15%(d)(e) | 39,516,202 | 39,516,202 | |
| Total Money Market Funds (Cost $60,799,066) | 60,799,066 | ||
| TOTAL INVESTMENTS IN SECURITIES (excluding investments purchased with cash collateral from securities on loan)-100.02% (Cost $7,156,832,318) | 15,775,719,811 | ||
| Shares | Value | ||
| Investments Purchased with Cash Collateral from Securities on Loan | |||
| Money Market Funds–0.97% | |||
| Invesco Private Government Fund, 5.28%(d)(e)(f) | 42,294,645 | $42,294,645 | |
| Invesco Private Prime Fund, 5.46%(d)(e)(f) | 110,316,140 | 110,360,267 | |
| Total Investments Purchased with Cash Collateral from Securities on Loan (Cost $152,650,012) | 152,654,912 | ||
| TOTAL INVESTMENTS IN SECURITIES–100.99% (Cost $7,309,482,330) | 15,928,374,723 | ||
| OTHER ASSETS LESS LIABILITIES—(0.99)% | (156,809,720) | ||
| NET ASSETS–100.00% | $15,771,565,003 | ||
| (a) | Industry and/or sector classifications used in this report are generally according to the Global Industry Classification Standard, which was developed by and is the exclusive property and a service mark of MSCI Inc. and Standard & Poor’s. |
| (b) | Non-income producing security. |
| (c) | All or a portion of this security was out on loan at August 31, 2024. |
| (d) | Affiliated holding. Affiliated holdings are investments in entities which are under common ownership or control of Invesco Ltd. or are investments in entities in which the Fund owns 5% or more of the outstanding voting securities. The table below shows the Fund’s transactions in, and earnings from, its investments in affiliates for the fiscal year ended August 31, 2024. |
| Value August 31, 2023 | Purchases at Cost | Proceeds from Sales | Change in Unrealized Appreciation (Depreciation) | Realized Gain (Loss) | Value August 31, 2024 | Dividend Income | |
| Investments in Affiliated Money Market Funds: | |||||||
| Invesco Government & Agency Portfolio, Institutional Class | $16,193,539 | $648,676,549 | $(643,587,224) | $- | $- | $21,282,864 | $1,517,935 |
| Invesco Liquid Assets Portfolio, Institutional Class | 11,559,894 | 422,329,918 | (433,887,615) | (121) | (2,076) | - | 975,388 |
| Invesco Treasury Portfolio, Institutional Class | 18,506,902 | 795,619,189 | (774,609,889) | - | - | 39,516,202 | 1,855,327 |
| Investments Purchased with Cash Collateral from Securities on Loan: | |||||||
| Invesco Private Government Fund | 203,220,752 | 922,022,290 | (1,082,948,397) | - | - | 42,294,645 | 7,360,064* |
| Invesco Private Prime Fund | 522,567,644 | 1,994,326,829 | (2,406,751,690) | (22,592) | 240,076 | 110,360,267 | 20,017,881* |
| Total | $772,048,731 | $4,782,974,775 | $(5,341,784,815) | $(22,713) | $238,000 | $213,453,978 | $31,726,595 |
| * | Represents the income earned on the investment of cash collateral, which is included in securities lending income on the Statement of Operations. Does not include rebates and fees paid to lending agent or premiums received from borrowers, if any. |
| (e) | The rate shown is the 7-day SEC standardized yield as of August 31, 2024. |
| (f) | The security has been segregated to satisfy the commitment to return the cash collateral received in securities lending transactions upon the borrower’s return of the securities loaned. See Note 1I. |
| 3 | Invesco American Franchise Fund |
| Assets: | |
| Investments in unaffiliated securities, at value (Cost $7,096,033,252)* | $15,714,920,745 |
| Investments in affiliated money market funds, at value (Cost $213,449,078) | 213,453,978 |
| Foreign currencies, at value (Cost $1,085) | 1,112 |
| Receivable for: | |
| Fund shares sold | 1,514,335 |
| Dividends | 8,002,591 |
| Investment for trustee deferred compensation and retirement plans | 2,211,406 |
| Other assets | 163,394 |
| Total assets | 15,940,267,561 |
| Liabilities: | |
| Payable for: | |
| Fund shares reacquired | 6,446,671 |
| Collateral upon return of securities loaned | 152,650,012 |
| Accrued fees to affiliates | 6,923,680 |
| Accrued trustees’ and officers’ fees and benefits | 14,331 |
| Accrued other operating expenses | 342,237 |
| Trustee deferred compensation and retirement plans | 2,325,627 |
| Total liabilities | 168,702,558 |
| Net assets applicable to shares outstanding | $15,771,565,003 |
| Net assets consist of: | |
| Shares of beneficial interest | $6,844,328,143 |
| Distributable earnings | 8,927,236,860 |
| $15,771,565,003 |
| Net Assets: | |
| Class A | $14,820,036,338 |
| Class C | $116,625,515 |
| Class R | $100,589,127 |
| Class Y | $565,271,312 |
| Class R5 | $61,422,029 |
| Class R6 | $107,620,682 |
| Shares outstanding, no par value, with an unlimited number of shares authorized: | |
| Class A | 535,109,853 |
| Class C | 5,234,542 |
| Class R | 3,841,871 |
| Class Y | 19,262,226 |
| Class R5 | 2,080,040 |
| Class R6 | 3,588,647 |
| Class A: | |
| Net asset value per share | $27.70 |
| Maximum offering price per share (Net asset value of $27.70 ÷ 94.50%) | $29.31 |
| Class C: | |
| Net asset value and offering price per share | $22.28 |
| Class R: | |
| Net asset value and offering price per share | $26.18 |
| Class Y: | |
| Net asset value and offering price per share | $29.35 |
| Class R5: | |
| Net asset value and offering price per share | $29.53 |
| Class R6: | |
| Net asset value and offering price per share | $29.99 |
| * | At August 31, 2024, securities with an aggregate value of $148,540,195 were on loan to brokers. |
| 4 | Invesco American Franchise Fund |
| Investment income: | |
| Dividends (net of foreign withholding taxes of $1,393,523) | $74,638,325 |
| Dividends from affiliated money market funds (includes net securities lending income of $756,815) | 5,105,465 |
| Total investment income | 79,743,790 |
| Expenses: | |
| Advisory fees | 80,468,174 |
| Administrative services fees | 2,061,203 |
| Custodian fees | 125,101 |
| Distribution fees: | |
| Class A | 33,414,830 |
| Class C | 1,130,861 |
| Class R | 416,977 |
| Transfer agent fees — A, C, R and Y | 15,831,262 |
| Transfer agent fees — R5 | 49,529 |
| Transfer agent fees — R6 | 27,782 |
| Trustees’ and officers’ fees and benefits | 145,111 |
| Registration and filing fees | 144,901 |
| Reports to shareholders | 1,418,244 |
| Professional services fees | 168,722 |
| Other | 215,639 |
| Total expenses | 135,618,336 |
| Less: Fees waived and/or expense offset arrangement(s) | (394,893) |
| Net expenses | 135,223,443 |
| Net investment income (loss) | (55,479,653) |
| Realized and unrealized gain (loss) from: | |
| Net realized gain (loss) from: | |
| Unaffiliated investment securities | 950,693,503 |
| Affiliated investment securities | 238,000 |
| Foreign currencies | (33,500) |
| 950,898,003 | |
| Change in net unrealized appreciation (depreciation) of: | |
| Unaffiliated investment securities | 2,998,414,578 |
| Affiliated investment securities | (22,713) |
| Foreign currencies | 18,263 |
| 2,998,410,128 | |
| Net realized and unrealized gain | 3,949,308,131 |
| Net increase in net assets resulting from operations | $3,893,828,478 |
| 5 | Invesco American Franchise Fund |
| 2024 | 2023 | |
| Operations: | ||
| Net investment income (loss) | $(55,479,653) | $(18,851,373) |
| Net realized gain (loss) | 950,898,003 | (434,509,200) |
| Change in net unrealized appreciation | 2,998,410,128 | 2,667,427,265 |
| Net increase in net assets resulting from operations | 3,893,828,478 | 2,214,066,692 |
| Distributions to shareholders from distributable earnings: | ||
| Class A | — | (743,113,224) |
| Class C | — | (7,974,418) |
| Class R | — | (3,890,838) |
| Class Y | — | (25,919,532) |
| Class R5 | — | (2,323,344) |
| Class R6 | — | (4,321,886) |
| Total distributions from distributable earnings | — | (787,543,242) |
| Share transactions–net: | ||
| Class A | (894,603,528) | (78,588,773) |
| Class C | (19,042,514) | (2,875,398) |
| Class R | 9,016,167 | 9,323,787 |
| Class Y | 10,323,529 | (35,372,792) |
| Class R5 | 4,994,144 | 1,573,371 |
| Class R6 | 2,916,723 | 3,426,695 |
| Net increase (decrease) in net assets resulting from share transactions | (886,395,479) | (102,513,110) |
| Net increase in net assets | 3,007,432,999 | 1,324,010,340 |
| Net assets: | ||
| Beginning of year | 12,764,132,004 | 11,440,121,664 |
| End of year | $15,771,565,003 | $12,764,132,004 |
| 6 | Invesco American Franchise Fund |
| Net asset value, beginning of period | Net investment income (loss)(a) | Net gains (losses) on securities (both realized and unrealized) | Total from investment operations | Distributions from net realized gains | Net asset value, end of period | Total return(b) | Net assets, end of period (000’s omitted) | Ratio of expenses to average net assets with fee waivers and/or expenses absorbed | Ratio of expenses to average net assets without fee waivers and/or expenses absorbed | Ratio of net investment income (loss) to average net assets | Portfolio turnover (c) | |
| Class A | ||||||||||||
| Year ended 08/31/24 | $21.06 | $(0.10) | $6.74 | $6.64 | $— | $27.70 | 31.53% | $14,820,036 | 0.96% | 0.96% | (0.40)% | 51% |
| Year ended 08/31/23 | 18.84 | (0.03) | 3.58 | 3.55 | (1.33) | 21.06 | 20.96 | 12,047,012 | 0.99 | 0.99 | (0.18) | 73 |
| Year ended 08/31/22 | 32.86 | (0.07) | (7.28) | (7.35) | (6.67) | 18.84 | (26.95) | 10,777,375 | 0.95 | 0.95 | (0.29) | 97 |
| Year ended 08/31/21 | 28.90 | (0.14) | 6.62 | 6.48 | (2.52) | 32.86 | 24.04 | 16,037,060 | 0.97 | 0.97 | (0.47) | 57 |
| Year ended 08/31/20 | 21.27 | (0.03) | 9.17 | 9.14 | (1.51) | 28.90 | 45.42 | 13,733,417 | 1.00 | 1.00 | (0.15) | 52 |
| Class C | ||||||||||||
| Year ended 08/31/24 | 17.07 | (0.22) | 5.43 | 5.21 | — | 22.28 | 30.52 | 116,626 | 1.71 | 1.71 | (1.15) | 51 |
| Year ended 08/31/23 | 15.65 | (0.14) | 2.89 | 2.75 | (1.33) | 17.07 | 20.07 | 105,284 | 1.74 | 1.74 | (0.93) | 73 |
| Year ended 08/31/22 | 28.67 | (0.21) | (6.14) | (6.35) | (6.67) | 15.65 | (27.50) | 98,920 | 1.70 | 1.70 | (1.04) | 97 |
| Year ended 08/31/21 | 25.70 | (0.32) | 5.81 | 5.49 | (2.52) | 28.67 | 23.11 | 164,671 | 1.72 | 1.72 | (1.22) | 57 |
| Year ended 08/31/20 | 19.21 | (0.18) | 8.18 | 8.00 | (1.51) | 25.70 | 44.30 | 185,177 | 1.75 | 1.75 | (0.90) | 52 |
| Class R | ||||||||||||
| Year ended 08/31/24 | 19.96 | (0.15) | 6.37 | 6.22 | — | 26.18 | 31.16 | 100,589 | 1.21 | 1.21 | (0.65) | 51 |
| Year ended 08/31/23 | 17.97 | (0.07) | 3.39 | 3.32 | (1.33) | 19.96 | 20.68 | 68,815 | 1.24 | 1.24 | (0.43) | 73 |
| Year ended 08/31/22 | 31.73 | (0.12) | (6.97) | (7.09) | (6.67) | 17.97 | (27.12) | 51,531 | 1.20 | 1.20 | (0.54) | 97 |
| Year ended 08/31/21 | 28.06 | (0.21) | 6.40 | 6.19 | (2.52) | 31.73 | 23.70 | 66,494 | 1.22 | 1.22 | (0.72) | 57 |
| Year ended 08/31/20 | 20.75 | (0.09) | 8.91 | 8.82 | (1.51) | 28.06 | 45.00 | 50,219 | 1.25 | 1.25 | (0.40) | 52 |
| Class Y | ||||||||||||
| Year ended 08/31/24 | 22.26 | (0.04) | 7.13 | 7.09 | — | 29.35 | 31.85 | 565,271 | 0.71 | 0.71 | (0.15) | 51 |
| Year ended 08/31/23 | 19.79 | 0.02 | 3.78 | 3.80 | (1.33) | 22.26 | 21.24 | 421,845 | 0.74 | 0.74 | 0.07 | 73 |
| Year ended 08/31/22 | 34.08 | (0.01) | (7.61) | (7.62) | (6.67) | 19.79 | (26.75) | 410,990 | 0.70 | 0.70 | (0.04) | 97 |
| Year ended 08/31/21 | 29.81 | (0.07) | 6.86 | 6.79 | (2.52) | 34.08 | 24.36 | 624,045 | 0.72 | 0.72 | (0.22) | 57 |
| Year ended 08/31/20 | 21.85 | 0.03 | 9.44 | 9.47 | (1.51) | 29.81 | 45.74 | 496,757 | 0.75 | 0.75 | 0.10 | 52 |
| Class R5 | ||||||||||||
| Year ended 08/31/24 | 22.39 | (0.03) | 7.17 | 7.14 | — | 29.53 | 31.89 | 61,422 | 0.70 | 0.70 | (0.14) | 51 |
| Year ended 08/31/23 | 19.89 | 0.02 | 3.81 | 3.83 | (1.33) | 22.39 | 21.28 | 41,963 | 0.71 | 0.71 | 0.10 | 73 |
| Year ended 08/31/22 | 34.22 | (0.01) | (7.65) | (7.66) | (6.67) | 19.89 | (26.76) | 35,453 | 0.69 | 0.69 | (0.03) | 97 |
| Year ended 08/31/21 | 29.92 | (0.06) | 6.88 | 6.82 | (2.52) | 34.22 | 24.37 | 51,787 | 0.70 | 0.70 | (0.20) | 57 |
| Year ended 08/31/20 | 21.91 | 0.04 | 9.48 | 9.52 | (1.51) | 29.92 | 45.85 | 43,712 | 0.70 | 0.70 | 0.15 | 52 |
| Class R6 | ||||||||||||
| Year ended 08/31/24 | 22.73 | (0.02) | 7.28 | 7.26 | — | 29.99 | 31.94 | 107,621 | 0.63 | 0.63 | (0.07) | 51 |
| Year ended 08/31/23 | 20.16 | 0.03 | 3.87 | 3.90 | (1.33) | 22.73 | 21.35 | 79,212 | 0.64 | 0.64 | 0.17 | 73 |
| Year ended 08/31/22 | 34.55 | 0.01 | (7.73) | (7.72) | (6.67) | 20.16 | (26.67) | 65,853 | 0.62 | 0.62 | 0.04 | 97 |
| Year ended 08/31/21 | 30.17 | (0.04) | 6.94 | 6.90 | (2.52) | 34.55 | 24.44 | 96,722 | 0.63 | 0.63 | (0.13) | 57 |
| Year ended 08/31/20 | 22.07 | 0.05 | 9.56 | 9.61 | (1.51) | 30.17 | 45.93 | 69,977 | 0.62 | 0.62 | 0.23 | 52 |
| (a) | Calculated using average shares outstanding. |
| (b) | Includes adjustments in accordance with accounting principles generally accepted in the United States of America and as such, the net asset value for financial reporting purposes and the returns based upon those net asset values may differ from the net asset value and returns for shareholder transactions. Does not include sales charges and is not annualized for periods less than one year, if applicable. |
| (c) | Portfolio turnover is calculated at the fund level and is not annualized for periods less than one year, if applicable. |
| 7 | Invesco American Franchise Fund |
| A. | Security Valuations — Securities, including restricted securities, are valued according to the following policy. |
| 8 | Invesco American Franchise Fund |
| B. | Securities Transactions and Investment Income — Securities transactions are accounted for on a trade date basis. Realized gains or losses on sales are computed on the basis of specific identification of the securities sold. Interest income (net of withholding tax, if any) is recorded on an accrual basis from settlement date and includes coupon interest and amortization of premium and accretion of discount on debt securities as applicable. Pay-in-kind interest income and non-cash dividend income received in the form of securities in lieu of cash are recorded at the fair value of the securities received. Dividend income (net of withholding tax, if any) is recorded on the ex-dividend date. |
| C. | Country Determination — For the purposes of making investment selection decisions and presentation in the Schedule of Investments, the investment adviser may determine the country in which an issuer is located and/or credit risk exposure based on various factors. These factors include the laws of the country under which the issuer is organized, where the issuer maintains a principal office, the country in which the issuer derives 50% or more of its total revenues, the country that has the primary market for the issuer’s securities and its "country of risk" as determined by a third party service provider, as well as other criteria. Among the other criteria that may be evaluated for making this determination are the country in which the issuer maintains 50% or more of its assets, the type of security, financial guarantees and enhancements, the nature of the collateral and the sponsor organization. Country of issuer and/or credit risk exposure has been determined to be the United States of America, unless otherwise noted. |
| D. | Distributions – Distributions from net investment income and net realized capital gain, if any, are generally declared and paid annually and recorded on the ex-dividend date. The Fund may elect to treat a portion of the proceeds from redemptions as distributions for federal income tax purposes. |
| E. | Federal Income Taxes – The Fund intends to comply with the requirements of Subchapter M of the Internal Revenue Code of 1986, as amended (the “Internal Revenue Code”), necessary to qualify as a regulated investment company and to distribute substantially all of the Fund’s taxable earnings to shareholders. As such, the Fund will not be subject to federal income taxes on otherwise taxable income (including net realized capital gain) that is distributed to shareholders. Therefore, no provision for federal income taxes is recorded in the financial statements. |
| F. | Expenses – Fees provided for under the Rule 12b-1 plan of a particular class of the Fund are charged to the operations of such class. Transfer agency fees and expenses and other shareholder recordkeeping fees and expenses attributable to Class R5 and Class R6 are allocated based on relative net assets of Class R5 and Class R6. Sub-accounting fees attributable to Class R5 are charged to the operations of the class. Transfer agency fees and expenses and other shareholder recordkeeping fees and expenses relating to all other classes are allocated among those classes based on relative net assets. All other expenses are allocated among the classes based on relative net assets. |
| G. | Accounting Estimates – The preparation of financial statements in conformity with accounting principles generally accepted in the United States of America (“GAAP”) requires management to make estimates and assumptions that affect the reported amounts of assets and liabilities at the date of the financial statements and the reported amounts of revenues and expenses during the reporting period including estimates and assumptions related to taxation. Actual results could differ from those estimates by a significant amount. In addition, the Fund monitors for material events or transactions that may occur or become known after the period-end date and before the date the financial statements are released to print. |
| H. | Indemnifications – Under the Trust’s organizational documents, each Trustee, officer, employee or other agent of the Trust is indemnified against certain liabilities that may arise out of the performance of their duties to the Fund. Additionally, in the normal course of business, the Fund enters into contracts, including the Fund’s servicing agreements, that contain a variety of indemnification clauses. The Fund’s maximum exposure under these arrangements is unknown as this would involve future claims that may be made against the Fund that have not yet occurred. The risk of material loss as a result of such indemnification claims is considered remote. |
| I. | Securities Lending – The Fund may lend portfolio securities having a market value up to one-third of the Fund’s total assets. Such loans are secured by collateral equal to no less than the market value of the loaned securities determined daily by the securities lending provider. Such collateral will be cash or debt securities issued or guaranteed by the U.S. Government or any of its sponsored agencies. Cash collateral received in connection with these loans is invested in short-term money market instruments or affiliated, unregistered investment companies that comply with Rule 2a-7 under the 1940 Act and money market funds (collectively, "affiliated money market funds") and is shown as such on the Schedule of Investments. The Fund bears the risk of loss with respect to the investment of collateral. It is the Fund’s policy to obtain additional collateral from or return excess collateral to the borrower by the end of the next business day, following the valuation date of the securities loaned. Therefore, the value of the collateral held may be temporarily less than the value of the securities on loan. When loaning securities, the Fund retains certain benefits of owning the securities, including the economic equivalent of dividends or interest generated by the security. Lending securities entails a risk of loss to the Fund if, and to the extent that, the market value of the securities loaned were to increase and the borrower did not increase the collateral accordingly, and the borrower failed to return the securities. The securities loaned are subject to termination at the option of the borrower or the Fund. Upon termination, the borrower will return to the Fund the securities loaned and the Fund will return the collateral. Upon the failure of the borrower to return the securities, collateral may be liquidated and the securities may be purchased on the open market to replace the loaned securities. The Fund could experience delays and costs in gaining access to the collateral and the securities may lose value during the delay which could result in potential losses to the Fund. Some of these losses may be indemnified by the lending agent. The Fund bears the risk of any deficiency in the amount of the collateral available for return to the borrower due to any loss on the collateral invested. Dividends received on cash collateral investments for securities lending transactions, which are net of |
| 9 | Invesco American Franchise Fund |
| compensation to counterparties, are included in Dividends from affiliated money market funds on the Statement of Operations. The aggregate value of securities out on loan, if any, is shown as a footnote on the Statement of Assets and Liabilities. |
| J. | Foreign Currency Translations — Foreign currency is valued at the close of the NYSE based on quotations posted by banks and major currency dealers. Portfolio securities and other assets and liabilities denominated in foreign currencies are translated into U.S. dollar amounts at the date of valuation. Purchases and sales of portfolio securities (net of foreign taxes withheld on disposition) and income items denominated in foreign currencies are translated into U.S. dollar amounts on the respective dates of such transactions. The Fund does not separately account for the portion of the results of operations resulting from changes in foreign exchange rates on investments and the fluctuations arising from changes in market prices of securities held. The combined results of changes in foreign exchange rates and the fluctuation of market prices on investments (net of estimated foreign tax withholding) are included with the net realized and unrealized gain or loss from investments in the Statement of Operations. Reported net realized foreign currency gains or losses arise from (1) sales of foreign currencies, (2) currency gains or losses realized between the trade and settlement dates on securities transactions, and (3) the difference between the amounts of dividends, interest, and foreign withholding taxes recorded on the Fund’s books and the U.S. dollar equivalent of the amounts actually received or paid. Net unrealized foreign currency gains and losses arise from changes in the fair values of assets and liabilities, other than investments in securities at fiscal period end, resulting from changes in exchange rates. |
| K. | Forward Foreign Currency Contracts — The Fund may engage in foreign currency transactions either on a spot (i.e. for prompt delivery and settlement) basis, or through forward foreign currency contracts, to manage or minimize currency or exchange rate risk. |
| L. | Other Risks – The Fund is non-diversified and may invest in securities of fewer issuers than if it were diversified. Thus, the value of the Fund’s shares may vary more widely and the Fund may be subject to greater market and credit risk than if the Fund invested more broadly. |
| Average Daily Net Assets | Rate |
| First $250 million | 0.695% |
| Next $250 million | 0.670% |
| Next $500 million | 0.645% |
| Next $550 million | 0.620% |
| Next $3.45 billion | 0.600% |
| Next $250 million | 0.595% |
| Next $2.25 billion | 0.570% |
| Next $2.5 billion | 0.545% |
| Next $5 billion | 0.520% |
| Next $5 billion | 0.510% |
| Over $20 billion | 0.500% |
| 10 | Invesco American Franchise Fund |
| Average Daily Net Assets | Rate |
| First $250 million | 0.695% |
| Next $250 million | 0.670% |
| Next $500 million | 0.645% |
| Next $550 million | 0.620% |
| Next $3.45 billion | 0.600% |
| Next $250 million | 0.595% |
| Next $2.25 billion | 0.570% |
| Next $2.5 billion | 0.545% |
| Over $10 billion | 0.520% |
| 11 | Invesco American Franchise Fund |
| Level 1 | Level 2 | Level 3 | Total | |
| Investments in Securities | ||||
| Common Stocks & Other Equity Interests | $15,638,086,774 | $76,833,971 | $— | $15,714,920,745 |
| Money Market Funds | 60,799,066 | 152,654,912 | — | 213,453,978 |
| Total Investments | $15,698,885,840 | $229,488,883 | $— | $15,928,374,723 |
| Tax Character of Distributions to Shareholders Paid During the Fiscal Years Ended August 31, 2024 and 2023: | ||
| 2024 | 2023 | |
| Long-term capital gain | $— | $787,543,242 |
| Tax Components of Net Assets at Period-End: | |
| 2024 | |
| Undistributed long-term capital gain | $430,152,527 |
| Net unrealized appreciation — investments | 8,540,246,350 |
| Net unrealized appreciation — foreign currencies | 42,288 |
| Temporary book/tax differences | (1,358,331) |
| Late-Year ordinary loss deferral | (41,845,974) |
| Shares of beneficial interest | 6,844,328,143 |
| Total net assets | $15,771,565,003 |
| 12 | Invesco American Franchise Fund |
| Unrealized Appreciation (Depreciation) of Investments on a Tax Basis | |
| Aggregate unrealized appreciation of investments | $8,670,158,258 |
| Aggregate unrealized (depreciation) of investments | (129,911,908) |
| Net unrealized appreciation of investments | $8,540,246,350 |
| Summary of Share Activity | |||||
| Year ended August 31, 2024(a) | Year ended August 31, 2023 | ||||
| Shares | Amount | Shares | Amount | ||
| Sold: | |||||
| Class A | 18,423,749 | $444,361,079 | 16,986,519 | $312,472,522 | |
| Class C | 1,099,505 | 21,027,858 | 1,200,060 | 18,205,076 | |
| Class R | 1,059,939 | 24,449,051 | 939,588 | 16,253,420 | |
| Class Y | 4,759,033 | 122,828,021 | 3,856,890 | 73,499,009 | |
| Class R5 | 491,515 | 12,265,920 | 123,897 | 2,468,141 | |
| Class R6 | 1,081,882 | 28,104,972 | 914,776 | 17,859,766 | |
| Issued as reinvestment of dividends: | |||||
| Class A | - | - | 43,008,977 | 697,605,148 | |
| Class C | - | - | 581,058 | 7,681,585 | |
| Class R | - | - | 252,436 | 3,887,528 | |
| Class Y | - | - | 1,107,125 | 18,942,913 | |
| Class R5 | - | - | 133,788 | 2,302,493 | |
| Class R6 | - | - | 233,360 | 4,074,460 | |
| Automatic conversion of Class C shares to Class A shares: | |||||
| Class A | 664,463 | 16,147,412 | 612,680 | 11,245,269 | |
| Class C | (823,034) | (16,147,412) | (751,411) | (11,245,269) | |
| Reacquired: | |||||
| Class A | (56,073,505) | (1,355,112,019) | (60,508,444) | (1,099,911,712) | |
| Class C | (1,210,385) | (23,922,960) | (1,181,038) | (17,516,790) | |
| Class R | (666,102) | (15,432,884) | (611,104) | (10,817,161) | |
| Class Y | (4,449,984) | (112,504,492) | (6,781,586) | (127,814,714) | |
| Class R5 | (285,515) | (7,271,776) | (165,854) | (3,197,263) | |
| Class R6 | (978,673) | (25,188,249) | (929,900) | (18,507,531) | |
| Net increase (decrease) in share activity | (36,907,112) | $(886,395,479) | (978,183) | $(102,513,110) | |
| (a) | There are entities that are record owners of more than 5% of the outstanding shares of the Fund and in the aggregate own 32% of the outstanding shares of the Fund. IDI has an agreement with these entities to sell Fund shares. The Fund, Invesco and/or Invesco affiliates may make payments to these entities, which are considered to be related to the Fund, for providing services to the Fund, Invesco and/or Invesco affiliates including but not limited to services such as securities brokerage, distribution, third party record keeping and account servicing. The Fund has no knowledge as to whether all or any portion of the shares owned of record by these entities are also owned beneficially. |
| 13 | Invesco American Franchise Fund |
| 14 | Invesco American Franchise Fund |
| A. | Nature, Extent and Quality of Services Provided by Invesco Advisers and the Affiliated Sub-Advisers |
| B. | Fund Investment Performance |
| 15 | Invesco American Franchise Fund |
| C. | Advisory and Sub-Advisory Fees and Fund Expenses |
| D. | Economies of Scale and Breakpoints |
| E. | Profitability and Financial Resources |
| F. | Collateral Benefits to Invesco Advisers and its Affiliates |
| 16 | Invesco American Franchise Fund |
| 17 | Invesco American Franchise Fund |
| Federal and State Income Tax | |
| Qualified Dividend Income* | 0.00% |
| Corporate Dividends Received Deduction* | 0.00% |
| U.S. Treasury Obligations* | 0.00% |
| Qualified Business Income* | 0.00% |
| Business Interest Income* | 0.00% |
| * | The above percentages are based on ordinary income dividends paid to shareholders during the Fund’s fiscal year. |
| 18 | Invesco American Franchise Fund |
| 19 | Invesco American Franchise Fund |

| Annual Financial Statements and Other Information | August 31, 2024 |
| Shares | Value | ||
| Common Stocks & Other Equity Interests–99.23% | |||
| Advertising–1.35% | |||
| Trade Desk, Inc. (The), Class A(b) | 713,171 | $74,547,765 | |
| Aerospace & Defense–1.15% | |||
| TransDigm Group, Inc. | 45,988 | 63,151,181 | |
| Apparel Retail–1.23% | |||
| TJX Cos., Inc. (The) | 576,651 | 67,623,863 | |
| Application Software–2.81% | |||
| Cadence Design Systems, Inc.(b) | 241,966 | 65,071,916 | |
| HubSpot, Inc.(b)(c) | 108,602 | 54,200,000 | |
| Tyler Technologies, Inc.(b) | 61,142 | 35,943,548 | |
| 155,215,464 | |||
| Asset Management & Custody Banks–2.98% | |||
| Ares Management Corp., Class A | 376,100 | 55,061,040 | |
| KKR & Co., Inc., Class A | 883,948 | 109,406,244 | |
| 164,467,284 | |||
| Automobile Manufacturers–1.14% | |||
| Ferrari N.V. (Italy)(c) | 126,777 | 62,981,545 | |
| Biotechnology–1.95% | |||
| Regeneron Pharmaceuticals, Inc.(b) | 46,720 | 55,348,717 | |
| Vertex Pharmaceuticals, Inc.(b) | 105,789 | 52,459,707 | |
| 107,808,424 | |||
| Broadline Retail–7.81% | |||
| Amazon.com, Inc.(b) | 2,077,516 | 370,836,606 | |
| MercadoLibre, Inc. (Brazil)(b) | 29,006 | 59,800,510 | |
| 430,637,116 | |||
| Building Products–0.78% | |||
| Trane Technologies PLC | 119,667 | 43,278,767 | |
| Communications Equipment–2.06% | |||
| Arista Networks, Inc.(b) | 241,024 | 85,173,061 | |
| Motorola Solutions, Inc. | 63,847 | 28,222,928 | |
| 113,395,989 | |||
| Construction & Engineering–1.23% | |||
| Quanta Services, Inc. | 245,643 | 67,583,759 | |
| Consumer Finance–1.10% | |||
| American Express Co. | 235,225 | 60,840,946 | |
| Consumer Staples Merchandise Retail–1.36% | |||
| Costco Wholesale Corp. | 84,325 | 75,249,944 | |
| Diversified Support Services–0.76% | |||
| Cintas Corp. | 51,841 | 41,738,226 | |
| Electrical Components & Equipment–1.99% | |||
| Eaton Corp. PLC | 232,909 | 71,486,759 | |
| Vertiv Holdings Co., Class A | 458,616 | 38,078,887 | |
| 109,565,646 | |||
| Financial Exchanges & Data–1.19% | |||
| Moody’s Corp. | 134,323 | 65,514,700 | |
| Shares | Value | ||
| Footwear–0.50% | |||
| Deckers Outdoor Corp.(b) | 28,563 | $27,400,200 | |
| Health Care Equipment–3.20% | |||
| Boston Scientific Corp.(b) | 1,448,326 | 118,458,584 | |
| Intuitive Surgical, Inc.(b) | 117,465 | 57,866,783 | |
| 176,325,367 | |||
| Homebuilding–0.75% | |||
| D.R. Horton, Inc. | 217,911 | 41,132,880 | |
| Industrial Machinery & Supplies & Components–0.87% | |||
| Parker-Hannifin Corp. | 79,760 | 47,871,952 | |
| Interactive Media & Services–8.90% | |||
| Alphabet, Inc., Class C | 1,528,518 | 252,373,607 | |
| Meta Platforms, Inc., Class A | 457,170 | 238,327,293 | |
| 490,700,900 | |||
| Investment Banking & Brokerage–0.85% | |||
| Goldman Sachs Group, Inc. (The) | 92,194 | 47,041,989 | |
| Movies & Entertainment–3.24% | |||
| Netflix, Inc.(b) | 175,789 | 123,289,615 | |
| Spotify Technology S.A. (Sweden)(b) | 161,073 | 55,228,710 | |
| 178,518,325 | |||
| Oil & Gas Exploration & Production–0.74% | |||
| Diamondback Energy, Inc. | 208,439 | 40,668,533 | |
| Oil & Gas Storage & Transportation–0.25% | |||
| Targa Resources Corp. | 94,686 | 13,909,373 | |
| Passenger Ground Transportation–1.19% | |||
| Uber Technologies, Inc.(b) | 899,946 | 65,813,051 | |
| Pharmaceuticals–2.93% | |||
| Eli Lilly and Co. | 168,383 | 161,651,048 | |
| Property & Casualty Insurance–1.48% | |||
| Progressive Corp. (The) | 323,642 | 81,622,512 | |
| Real Estate Services–0.94% | |||
| CBRE Group, Inc., Class A(b) | 452,418 | 52,091,409 | |
| Restaurants–0.84% | |||
| Chipotle Mexican Grill, Inc.(b) | 825,393 | 46,288,039 | |
| Semiconductor Materials & Equipment–1.27% | |||
| ASML Holding N.V., New York Shares (Netherlands) | 77,792 | 70,313,855 | |
| Semiconductors–15.41% | |||
| Broadcom, Inc. | 1,065,170 | 173,430,979 | |
| Monolithic Power Systems, Inc. | 91,768 | 85,773,714 | |
| NVIDIA Corp. | 4,950,812 | 590,978,429 | |
| 850,183,122 | |||
| Systems Software–11.14% | |||
| Microsoft Corp. | 1,283,099 | 535,231,917 | |
| ServiceNow, Inc.(b) | 92,703 | 79,261,065 | |
| 614,492,982 | |||
| 2 | Invesco Capital Appreciation Fund |
| Shares | Value | ||
| Technology Hardware, Storage & Peripherals–9.24% | |||
| Apple, Inc. | 2,226,744 | $509,924,376 | |
| Trading Companies & Distributors–0.85% | |||
| United Rentals, Inc. | 63,309 | 46,928,429 | |
| Transaction & Payment Processing Services–3.75% | |||
| Fiserv, Inc.(b) | 334,226 | 58,355,860 | |
| Mastercard, Inc., Class A(c) | 152,489 | 73,704,033 | |
| Visa, Inc., Class A | 271,214 | 74,955,413 | |
| 207,015,306 | |||
| Total Common Stocks & Other Equity Interests (Cost $2,723,799,631) | 5,473,494,267 | ||
| Money Market Funds–0.82% | |||
| Invesco Government & Agency Portfolio, Institutional Class, 5.18%(d)(e) | 15,709,236 | 15,709,236 | |
| Invesco Treasury Portfolio, Institutional Class, 5.15%(d)(e) | 29,174,090 | 29,174,090 | |
| Total Money Market Funds (Cost $44,883,326) | 44,883,326 | ||
| TOTAL INVESTMENTS IN SECURITIES (excluding investments purchased with cash collateral from securities on loan)-100.05% (Cost $2,768,682,957) | 5,518,377,593 | ||
| Shares | Value | ||
| Investments Purchased with Cash Collateral from Securities on Loan | |||
| Money Market Funds–0.13% | |||
| Invesco Private Government Fund, 5.28%(d)(e)(f) | 2,023,728 | $2,023,728 | |
| Invesco Private Prime Fund, 5.46%(d)(e)(f) | 5,213,440 | 5,215,525 | |
| Total Investments Purchased with Cash Collateral from Securities on Loan (Cost $7,239,249) | 7,239,253 | ||
| TOTAL INVESTMENTS IN SECURITIES–100.18% (Cost $2,775,922,206) | 5,525,616,846 | ||
| OTHER ASSETS LESS LIABILITIES—(0.18)% | (9,774,846) | ||
| NET ASSETS–100.00% | $5,515,842,000 | ||
| (a) | Industry and/or sector classifications used in this report are generally according to the Global Industry Classification Standard, which was developed by and is the exclusive property and a service mark of MSCI Inc. and Standard & Poor’s. |
| (b) | Non-income producing security. |
| (c) | All or a portion of this security was out on loan at August 31, 2024. |
| (d) | Affiliated holding. Affiliated holdings are investments in entities which are under common ownership or control of Invesco Ltd. or are investments in entities in which the Fund owns 5% or more of the outstanding voting securities. The table below shows the Fund’s transactions in, and earnings from, its investments in affiliates for the fiscal year ended August 31, 2024. |
| Value August 31, 2023 | Purchases at Cost | Proceeds from Sales | Change in Unrealized Appreciation | Realized Gain | Value August 31, 2024 | Dividend Income | |
| Investments in Affiliated Money Market Funds: | |||||||
| Invesco Government & Agency Portfolio, Institutional Class | $12,338,397 | $306,200,891 | $(302,830,052) | $- | $- | $15,709,236 | $704,229 |
| Invesco Liquid Assets Portfolio, Institutional Class | 8,811,180 | 183,914,591 | (192,728,365) | 33 | 2,561 | - | 392,003 |
| Invesco Treasury Portfolio, Institutional Class | 14,101,025 | 391,603,731 | (376,530,666) | - | - | 29,174,090 | 928,357 |
| Investments Purchased with Cash Collateral from Securities on Loan: | |||||||
| Invesco Private Government Fund | 43,066,889 | 727,211,961 | (768,255,122) | - | - | 2,023,728 | 1,365,377* |
| Invesco Private Prime Fund | 110,743,431 | 1,341,819,902 | (1,447,398,747) | 117 | 50,822 | 5,215,525 | 3,411,108* |
| Total | $189,060,922 | $2,950,751,076 | $(3,087,742,952) | $150 | $53,383 | $52,122,579 | $6,801,074 |
| * | Represents the income earned on the investment of cash collateral, which is included in securities lending income on the Statement of Operations. Does not include rebates and fees paid to lending agent or premiums received from borrowers, if any. |
| (e) | The rate shown is the 7-day SEC standardized yield as of August 31, 2024. |
| (f) | The security has been segregated to satisfy the commitment to return the cash collateral received in securities lending transactions upon the borrower’s return of the securities loaned. See Note 1I. |
| 3 | Invesco Capital Appreciation Fund |
| Assets: | |
| Investments in unaffiliated securities, at value (Cost $2,723,799,631)* | $5,473,494,267 |
| Investments in affiliated money market funds, at value (Cost $52,122,575) | 52,122,579 |
| Cash | 5,000,000 |
| Foreign currencies, at value (Cost $289) | 274 |
| Receivable for: | |
| Fund shares sold | 904,876 |
| Dividends | 2,565,420 |
| Investment for trustee deferred compensation and retirement plans | 477,600 |
| Other assets | 81,404 |
| Total assets | 5,534,646,420 |
| Liabilities: | |
| Payable for: | |
| Investments purchased | 5,431,026 |
| Fund shares reacquired | 2,969,580 |
| Collateral upon return of securities loaned | 7,239,249 |
| Accrued fees to affiliates | 2,233,573 |
| Accrued trustees’ and officers’ fees and benefits | 350,452 |
| Accrued other operating expenses | 102,940 |
| Trustee deferred compensation and retirement plans | 477,600 |
| Total liabilities | 18,804,420 |
| Net assets applicable to shares outstanding | $5,515,842,000 |
| Net assets consist of: | |
| Shares of beneficial interest | $2,666,243,565 |
| Distributable earnings | 2,849,598,435 |
| $5,515,842,000 |
| Net Assets: | |
| Class A | $4,959,186,274 |
| Class C | $167,666,308 |
| Class R | $192,247,936 |
| Class Y | $172,732,567 |
| Class R5 | $82,229 |
| Class R6 | $23,926,686 |
| Shares outstanding, no par value, with an unlimited number of shares authorized: | |
| Class A | 62,370,780 |
| Class C | 4,095,953 |
| Class R | 2,758,723 |
| Class Y | 1,861,386 |
| Class R5 | 1,016 |
| Class R6 | 253,290 |
| Class A: | |
| Net asset value per share | $79.51 |
| Maximum offering price per share (Net asset value of $79.51 ÷ 94.50%) | $84.14 |
| Class C: | |
| Net asset value and offering price per share | $40.93 |
| Class R: | |
| Net asset value and offering price per share | $69.69 |
| Class Y: | |
| Net asset value and offering price per share | $92.80 |
| Class R5: | |
| Net asset value and offering price per share | $80.93 |
| Class R6: | |
| Net asset value and offering price per share | $94.46 |
| * | At August 31, 2024, securities with an aggregate value of $7,171,262 were on loan to brokers. |
| 4 | Invesco Capital Appreciation Fund |
| Investment income: | |
| Dividends (net of foreign withholding taxes of $90,455) | $27,189,197 |
| Dividends from affiliated money market funds (includes net securities lending income of $172,888) | 2,197,477 |
| Total investment income | 29,386,674 |
| Expenses: | |
| Advisory fees | 28,530,126 |
| Administrative services fees | 712,540 |
| Custodian fees | 27,295 |
| Distribution fees: | |
| Class A | 10,085,815 |
| Class C | 1,560,073 |
| Class R | 841,574 |
| Transfer agent fees — A, C, R and Y | 5,243,793 |
| Transfer agent fees — R5 | 72 |
| Transfer agent fees — R6 | 5,556 |
| Trustees’ and officers’ fees and benefits | 122,110 |
| Registration and filing fees | 116,044 |
| Reports to shareholders | 295,996 |
| Professional services fees | 89,411 |
| Other | 72,475 |
| Total expenses | 47,702,880 |
| Less: Fees waived and/or expense offset arrangement(s) | (289,160) |
| Net expenses | 47,413,720 |
| Net investment income (loss) | (18,027,046) |
| Realized and unrealized gain from: | |
| Net realized gain from: | |
| Unaffiliated investment securities | 331,732,504 |
| Affiliated investment securities | 53,383 |
| 331,785,887 | |
| Change in net unrealized appreciation of: | |
| Unaffiliated investment securities | 1,064,155,137 |
| Affiliated investment securities | 150 |
| Foreign currencies | 2 |
| 1,064,155,289 | |
| Net realized and unrealized gain | 1,395,941,176 |
| Net increase in net assets resulting from operations | $1,377,914,130 |
| 5 | Invesco Capital Appreciation Fund |
| 2024 | 2023 | |
| Operations: | ||
| Net investment income (loss) | $(18,027,046) | $(8,775,400) |
| Net realized gain (loss) | 331,785,887 | (211,301,583) |
| Change in net unrealized appreciation | 1,064,155,289 | 821,400,137 |
| Net increase in net assets resulting from operations | 1,377,914,130 | 601,323,154 |
| Distributions to shareholders from distributable earnings: | ||
| Class A | — | (29,171,892) |
| Class C | — | (2,131,574) |
| Class R | — | (1,132,464) |
| Class Y | — | (701,899) |
| Class R5 | — | (606) |
| Class R6 | — | (83,781) |
| Total distributions from distributable earnings | — | (33,222,216) |
| Share transactions–net: | ||
| Class A | (302,557,343) | (264,763,529) |
| Class C | (19,981,094) | (17,953,661) |
| Class R | 192,378 | (73,739) |
| Class Y | 6,579,337 | 1,348,296 |
| Class R5 | (876) | (24,187) |
| Class R6 | 3,180,990 | 659,402 |
| Net increase (decrease) in net assets resulting from share transactions | (312,586,608) | (280,807,418) |
| Net increase in net assets | 1,065,327,522 | 287,293,520 |
| Net assets: | ||
| Beginning of year | 4,450,514,478 | 4,163,220,958 |
| End of year | $5,515,842,000 | $4,450,514,478 |
| 6 | Invesco Capital Appreciation Fund |
| Net asset value, beginning of period | Net investment income (loss)(a) | Net gains (losses) on securities (both realized and unrealized) | Total from investment operations | Distributions from net realized gains | Net asset value, end of period | Total return(b) | Net assets, end of period (000’s omitted) | Ratio of expenses to average net assets with fee waivers and/or expenses absorbed | Ratio of expenses to average net assets without fee waivers and/or expenses absorbed | Ratio of net investment income (loss) to average net assets | Portfolio turnover (c) | |
| Class A | ||||||||||||
| Year ended 08/31/24 | $60.17 | $(0.23) | $19.57 | $19.34 | $— | $79.51 | 32.15%(d) | $4,959,186 | 0.94%(d) | 0.95%(d) | (0.35)%(d) | 55% |
| Year ended 08/31/23 | 52.44 | (0.10) | 8.25 | 8.15 | (0.42) | 60.17 | 15.73(d) | 4,017,461 | 0.97(d) | 0.97(d) | (0.20)(d) | 83 |
| Year ended 08/31/22 | 88.67 | (0.22) | (16.26) | (16.48) | (19.75) | 52.44 | (23.55)(d) | 3,767,413 | 0.94(d) | 0.94(d) | (0.35)(d) | 70 |
| Year ended 08/31/21 | 70.34 | (0.35) | 21.03 | 20.68 | (2.35) | 88.67 | 30.19(d) | 5,364,306 | 0.95(d) | 0.95(d) | (0.46)(d) | 78 |
| Year ended 08/31/20 | 62.38 | (0.12) | 21.17 | 21.05 | (13.09) | 70.34 | 39.41(d) | 4,478,067 | 1.00(d) | 1.00(d) | (0.22)(d) | 31 |
| Class C | ||||||||||||
| Year ended 08/31/24 | 31.22 | (0.40) | 10.11 | 9.71 | — | 40.93 | 31.10 | 167,666 | 1.71 | 1.72 | (1.12) | 55 |
| Year ended 08/31/23 | 27.63 | (0.26) | 4.27 | 4.01 | (0.42) | 31.22 | 14.86 | 145,370 | 1.74 | 1.74 | (0.97) | 83 |
| Year ended 08/31/22 | 56.55 | (0.40) | (8.77) | (9.17) | (19.75) | 27.63 | (24.16) | 146,841 | 1.71 | 1.71 | (1.12) | 70 |
| Year ended 08/31/21 | 46.01 | (0.60) | 13.49 | 12.89 | (2.35) | 56.55 | 29.17 | 221,514 | 1.73 | 1.73 | (1.24) | 78 |
| Year ended 08/31/20 | 45.21 | (0.39) | 14.28 | 13.89 | (13.09) | 46.01 | 38.34 | 230,567 | 1.78 | 1.78 | (1.00) | 31 |
| Class R | ||||||||||||
| Year ended 08/31/24 | 52.88 | (0.37) | 17.18 | 16.81 | — | 69.69 | 31.79 | 192,248 | 1.21 | 1.22 | (0.62) | 55 |
| Year ended 08/31/23 | 46.26 | (0.21) | 7.25 | 7.04 | (0.42) | 52.88 | 15.43 | 145,497 | 1.24 | 1.24 | (0.47) | 83 |
| Year ended 08/31/22 | 80.77 | (0.36) | (14.40) | (14.76) | (19.75) | 46.26 | (23.76) | 127,130 | 1.21 | 1.21 | (0.62) | 70 |
| Year ended 08/31/21 | 64.44 | (0.51) | 19.19 | 18.68 | (2.35) | 80.77 | 29.83 | 175,274 | 1.23 | 1.23 | (0.74) | 78 |
| Year ended 08/31/20 | 58.28 | (0.26) | 19.51 | 19.25 | (13.09) | 64.44 | 39.04 | 147,187 | 1.28 | 1.28 | (0.50) | 31 |
| Class Y | ||||||||||||
| Year ended 08/31/24 | 70.07 | (0.09) | 22.82 | 22.73 | — | 92.80 | 32.43 | 172,733 | 0.71 | 0.72 | (0.12) | 55 |
| Year ended 08/31/23 | 60.85 | 0.02 | 9.62 | 9.64 | (0.42) | 70.07 | 16.01 | 126,483 | 0.74 | 0.74 | 0.03 | 83 |
| Year ended 08/31/22 | 99.48 | (0.09) | (18.79) | (18.88) | (19.75) | 60.85 | (23.38) | 108,866 | 0.71 | 0.71 | (0.12) | 70 |
| Year ended 08/31/21 | 78.49 | (0.21) | 23.55 | 23.34 | (2.35) | 99.48 | 30.44 | 158,879 | 0.73 | 0.73 | (0.24) | 78 |
| Year ended 08/31/20 | 68.08 | 0.01 | 23.49 | 23.50 | (13.09) | 78.49 | 39.75 | 114,061 | 0.78 | 0.78 | 0.00 | 31 |
| Class R5 | ||||||||||||
| Year ended 08/31/24 | 61.11 | (0.08) | 19.90 | 19.82 | — | 80.93 | 32.43 | 82 | 0.71 | 0.71 | (0.12) | 55 |
| Year ended 08/31/23 | 53.11 | 0.03 | 8.39 | 8.42 | (0.42) | 61.11 | 16.04 | 62 | 0.72 | 0.72 | 0.05 | 83 |
| Year ended 08/31/22 | 89.38 | (0.06) | (16.46) | (16.52) | (19.75) | 53.11 | (23.38) | 77 | 0.70 | 0.70 | (0.11) | 70 |
| Year ended 08/31/21 | 70.69 | (0.14) | 21.18 | 21.04 | (2.35) | 89.38 | 30.55 | 46 | 0.67 | 0.69 | (0.18) | 78 |
| Year ended 08/31/20 | 62.44 | 0.07 | 21.27 | 21.34 | (13.09) | 70.69 | 39.90 | 36 | 0.67 | 0.67 | 0.11 | 31 |
| Class R6 | ||||||||||||
| Year ended 08/31/24 | 71.27 | (0.03) | 23.22 | 23.19 | — | 94.46 | 32.54 | 23,927 | 0.64 | 0.64 | (0.05) | 55 |
| Year ended 08/31/23 | 61.84 | 0.07 | 9.78 | 9.85 | (0.42) | 71.27 | 16.09 | 15,641 | 0.65 | 0.65 | 0.12 | 83 |
| Year ended 08/31/22 | 100.70 | (0.03) | (19.08) | (19.11) | (19.75) | 61.84 | (23.32) | 12,895 | 0.63 | 0.63 | (0.04) | 70 |
| Year ended 08/31/21 | 79.32 | (0.12) | 23.85 | 23.73 | (2.35) | 100.70 | 30.62 | 19,838 | 0.62 | 0.63 | (0.13) | 78 |
| Year ended 08/31/20 | 68.60 | 0.10 | 23.71 | 23.81 | (13.09) | 79.32 | 39.91 | 14,514 | 0.63 | 0.67 | 0.15 | 31 |
| (a) | Calculated using average shares outstanding. |
| (b) | Includes adjustments in accordance with accounting principles generally accepted in the United States of America and as such, the net asset value for financial reporting purposes and the returns based upon those net asset values may differ from the net asset value and returns for shareholder transactions. Not annualized for periods less than one year, if applicable. |
| (c) | Portfolio turnover is calculated at the fund level and is not annualized for periods less than one year, if applicable. |
| (d) | The total return, ratios of expenses to average net assets and ratio of net investment income to average net assets reflect actual 12b-1 fees of 0.23%, 0.23%, 0.23%, 0.22% and 0.22% for the years ended August 31, 2024, 2023, 2022, 2021 and 2020, respectively. |
| 7 | Invesco Capital Appreciation Fund |
| A. | Security Valuations — Securities, including restricted securities, are valued according to the following policy. |
| 8 | Invesco Capital Appreciation Fund |
| B. | Securities Transactions and Investment Income — Securities transactions are accounted for on a trade date basis. Realized gains or losses on sales are computed on the basis of specific identification of the securities sold. Interest income (net of withholding tax, if any) is recorded on an accrual basis from settlement date and includes coupon interest and amortization of premium and accretion of discount on debt securities as applicable. Pay-in-kind interest income and non-cash dividend income received in the form of securities in lieu of cash are recorded at the fair value of the securities received. Dividend income (net of withholding tax, if any) is recorded on the ex-dividend date. |
| C. | Country Determination — For the purposes of making investment selection decisions and presentation in the Schedule of Investments, the investment adviser may determine the country in which an issuer is located and/or credit risk exposure based on various factors. These factors include the laws of the country under which the issuer is organized, where the issuer maintains a principal office, the country in which the issuer derives 50% or more of its total revenues, the country that has the primary market for the issuer’s securities and its "country of risk" as determined by a third party service provider, as well as other criteria. Among the other criteria that may be evaluated for making this determination are the country in which the issuer maintains 50% or more of its assets, the type of security, financial guarantees and enhancements, the nature of the collateral and the sponsor organization. Country of issuer and/or credit risk exposure has been determined to be the United States of America, unless otherwise noted. |
| D. | Distributions – Distributions from net investment income and net realized capital gain, if any, are generally declared and paid annually and recorded on the ex-dividend date. The Fund may elect to treat a portion of the proceeds from redemptions as distributions for federal income tax purposes. |
| E. | Federal Income Taxes – The Fund intends to comply with the requirements of Subchapter M of the Internal Revenue Code of 1986, as amended (the “Internal Revenue Code”), necessary to qualify as a regulated investment company and to distribute substantially all of the Fund’s taxable earnings to shareholders. As such, the Fund will not be subject to federal income taxes on otherwise taxable income (including net realized capital gain) that is distributed to shareholders. Therefore, no provision for federal income taxes is recorded in the financial statements. |
| F. | Expenses – Fees provided for under the Rule 12b-1 plan of a particular class of the Fund are charged to the operations of such class. Transfer agency fees and expenses and other shareholder recordkeeping fees and expenses attributable to Class R5 and Class R6 are allocated based on relative net assets of Class R5 and Class R6. Sub-accounting fees attributable to Class R5 are charged to the operations of the class. Transfer agency fees and expenses and other shareholder recordkeeping fees and expenses relating to all other classes are allocated among those classes based on relative net assets. All other expenses are allocated among the classes based on relative net assets. |
| G. | Accounting Estimates – The preparation of financial statements in conformity with accounting principles generally accepted in the United States of America (“GAAP”) requires management to make estimates and assumptions that affect the reported amounts of assets and liabilities at the date of the financial statements and the reported amounts of revenues and expenses during the reporting period including estimates and assumptions related to taxation. Actual results could differ from those estimates by a significant amount. In addition, the Fund monitors for material events or transactions that may occur or become known after the period-end date and before the date the financial statements are released to print. |
| H. | Indemnifications – Under the Trust’s organizational documents, each Trustee, officer, employee or other agent of the Trust is indemnified against certain liabilities that may arise out of the performance of their duties to the Fund. Additionally, in the normal course of business, the Fund enters into contracts, including the Fund’s servicing agreements, that contain a variety of indemnification clauses. The Fund’s maximum exposure under these arrangements is unknown as this would involve future claims that may be made against the Fund that have not yet occurred. The risk of material loss as a result of such indemnification claims is considered remote. |
| I. | Securities Lending – The Fund may lend portfolio securities having a market value up to one-third of the Fund’s total assets. Such loans are secured by collateral equal to no less than the market value of the loaned securities determined daily by the securities lending provider. Such collateral will be cash or debt securities issued or guaranteed by the U.S. Government or any of its sponsored agencies. Cash collateral received in connection with these loans is invested in short-term money market instruments or affiliated, unregistered investment companies that comply with Rule 2a-7 under the 1940 Act and money market funds (collectively, "affiliated money market funds") and is shown as such on the Schedule of Investments. The Fund bears the risk of loss with respect to the investment of collateral. It is the Fund’s policy to obtain additional collateral from or return excess collateral to the borrower by the end of the next business day, following the valuation date of the securities loaned. Therefore, the value of the collateral held may be temporarily less than the value of the securities on loan. When loaning securities, the Fund retains certain benefits of owning the securities, including the economic equivalent of dividends or interest generated by the security. Lending securities entails a risk of loss to the Fund if, and to the extent that, the market value of the securities loaned were to increase and the borrower did not increase the collateral accordingly, and the borrower failed to return the securities. The securities loaned are subject to termination at the option of the borrower or the Fund. Upon termination, the borrower will return to the Fund the securities loaned and the Fund will return the collateral. Upon the failure of the borrower to return the securities, collateral may be liquidated and the securities may be purchased on the open market to replace the loaned securities. The Fund could experience delays and costs in gaining access to the collateral and the securities may lose value during the delay which could result in potential losses to the Fund. Some of these losses may be indemnified by the lending agent. The Fund bears the risk of any deficiency in the amount of the collateral available for return to the borrower due to any loss on the collateral invested. Dividends received on cash collateral investments for securities lending transactions, which are net of |
| 9 | Invesco Capital Appreciation Fund |
| compensation to counterparties, are included in Dividends from affiliated money market funds on the Statement of Operations. The aggregate value of securities out on loan, if any, is shown as a footnote on the Statement of Assets and Liabilities. |
| J. | Foreign Currency Translations — Foreign currency is valued at the close of the NYSE based on quotations posted by banks and major currency dealers. Portfolio securities and other assets and liabilities denominated in foreign currencies are translated into U.S. dollar amounts at the date of valuation. Purchases and sales of portfolio securities (net of foreign taxes withheld on disposition) and income items denominated in foreign currencies are translated into U.S. dollar amounts on the respective dates of such transactions. The Fund does not separately account for the portion of the results of operations resulting from changes in foreign exchange rates on investments and the fluctuations arising from changes in market prices of securities held. The combined results of changes in foreign exchange rates and the fluctuation of market prices on investments (net of estimated foreign tax withholding) are included with the net realized and unrealized gain or loss from investments in the Statement of Operations. Reported net realized foreign currency gains or losses arise from (1) sales of foreign currencies, (2) currency gains or losses realized between the trade and settlement dates on securities transactions, and (3) the difference between the amounts of dividends, interest, and foreign withholding taxes recorded on the Fund’s books and the U.S. dollar equivalent of the amounts actually received or paid. Net unrealized foreign currency gains and losses arise from changes in the fair values of assets and liabilities, other than investments in securities at fiscal period end, resulting from changes in exchange rates. |
| K. | Forward Foreign Currency Contracts — The Fund may engage in foreign currency transactions either on a spot (i.e. for prompt delivery and settlement) basis, or through forward foreign currency contracts, to manage or minimize currency or exchange rate risk. |
| L. | Other Risks – The Fund is non-diversified and may invest in securities of fewer issuers than if it were diversified. Thus, the value of the Fund’s shares may vary more widely and the Fund may be subject to greater market and credit risk than if the Fund invested more broadly. |
| Average Daily Net Assets | Rate* |
| Up to $200 million | 0.750% |
| Next $200 million | 0.720% |
| Next $200 million | 0.690% |
| Next $200 million | 0.660% |
| Next $700 million | 0.600% |
| Next $1 billion | 0.580% |
| Next $2 billion | 0.560% |
| Next $2 billion | 0.540% |
| Next $2 billion | 0.520% |
| Next $2.5 billion | 0.500% |
| Over $11 billion | 0.480% |
| * | The advisory fee paid by the Fund shall be reduced by any amounts paid by the Fund under the administrative services agreement with the Adviser. |
| 10 | Invesco Capital Appreciation Fund |
| Level 1 | Level 2 | Level 3 | Total | |
| Investments in Securities | ||||
| Common Stocks & Other Equity Interests | $5,473,494,267 | $— | $— | $5,473,494,267 |
| Money Market Funds | 44,883,326 | 7,239,253 | — | 52,122,579 |
| Total Investments | $5,518,377,593 | $7,239,253 | $— | $5,525,616,846 |
| 11 | Invesco Capital Appreciation Fund |
| Tax Character of Distributions to Shareholders Paid During the Fiscal Years Ended August 31, 2024 and 2023: | ||
| 2024 | 2023 | |
| Long-term capital gain | $— | $33,222,216 |
| Tax Components of Net Assets at Period-End: | |
| 2024 | |
| Undistributed long-term capital gain | $120,022,832 |
| Net unrealized appreciation — investments | 2,745,718,099 |
| Net unrealized appreciation (depreciation) — foreign currencies | (15) |
| Temporary book/tax differences | (804,879) |
| Late-Year ordinary loss deferral | (15,337,602) |
| Shares of beneficial interest | 2,666,243,565 |
| Total net assets | $5,515,842,000 |
| Unrealized Appreciation (Depreciation) of Investments on a Tax Basis | |
| Aggregate unrealized appreciation of investments | $2,766,009,392 |
| Aggregate unrealized (depreciation) of investments | (20,291,293) |
| Net unrealized appreciation of investments | $2,745,718,099 |
| 12 | Invesco Capital Appreciation Fund |
| Summary of Share Activity | |||||
| Year ended August 31, 2024 | Year ended August 31, 2023 | ||||
| Shares | Amount | Shares | Amount | ||
| Sold: | |||||
| Class A | 3,280,276 | $228,286,535 | 2,848,488 | $148,836,766 | |
| Class C | 734,448 | 26,429,464 | 696,702 | 18,855,076 | |
| Class R | 517,519 | 31,550,150 | 464,153 | 21,363,902 | |
| Class Y | 871,482 | 70,802,064 | 671,686 | 40,535,147 | |
| Class R5 | 415 | 23,692 | - | - | |
| Class R6 | 102,670 | 8,882,854 | 68,973 | 4,249,700 | |
| Issued as reinvestment of dividends: | |||||
| Class A | - | - | 587,370 | 28,299,452 | |
| Class C | - | - | 84,255 | 2,118,157 | |
| Class R | - | - | 26,613 | 1,129,190 | |
| Class Y | - | - | 10,602 | 593,926 | |
| Class R5 | - | - | 11 | 535 | |
| Class R6 | - | - | 1,300 | 74,042 | |
| Automatic conversion of Class C shares to Class A shares: | |||||
| Class A | 275,070 | 19,065,516 | 293,650 | 15,248,127 | |
| Class C | (532,278) | (19,065,516) | (562,734) | (15,248,127) | |
| Reacquired: | |||||
| Class A | (7,950,429) | (549,909,394) | (8,810,555) | (457,147,874) | |
| Class C | (762,687) | (27,345,042) | (875,419) | (23,678,767) | |
| Class R | (510,137) | (31,357,772) | (487,446) | (22,566,831) | |
| Class Y | (815,247) | (64,222,727) | (666,224) | (39,780,777) | |
| Class R5 | (415) | (24,568) | (452) | (24,722) | |
| Class R6 | (68,825) | (5,701,864) | (59,356) | (3,664,340) | |
| Net increase (decrease) in share activity | (4,858,138) | $(312,586,608) | (5,708,383) | $(280,807,418) | |
| 13 | Invesco Capital Appreciation Fund |
| 14 | Invesco Capital Appreciation Fund |
| A. | Nature, Extent and Quality of Services Provided by Invesco Advisers and the Affiliated Sub-Advisers |
| B. | Fund Investment Performance |
| 15 | Invesco Capital Appreciation Fund |
| C. | Advisory and Sub-Advisory Fees and Fund Expenses |
| D. | Economies of Scale and Breakpoints |
| E. | Profitability and Financial Resources |
| F. | Collateral Benefits to Invesco Advisers and its Affiliates |
| 16 | Invesco Capital Appreciation Fund |
| Federal and State Income Tax | |
| Qualified Dividend Income* | 0.00% |
| Corporate Dividends Received Deduction* | 0.00% |
| U.S. Treasury Obligations* | 0.00% |
| Qualified Business Income* | 0.00% |
| Business Interest Income* | 0.00% |
| * | The above percentages are based on ordinary income dividends paid to shareholders during the Fund’s fiscal year. |
| 17 | Invesco Capital Appreciation Fund |
| 18 | Invesco Capital Appreciation Fund |

| Annual Financial Statements and Other Information | August 31, 2024 |
| Principal Amount | Value | |||
| U.S. Dollar Denominated Bonds & Notes–42.72% | ||||
| Advertising–0.01% | ||||
| Clear Channel Outdoor Holdings, Inc., 5.13%, 08/15/2027(b) | $250,000 | $244,430 | ||
| Lamar Media Corp., 4.88%, 01/15/2029 | 250,000 | 245,763 | ||
| 490,193 | ||||
| Aerospace & Defense–0.83% | ||||
| BAE Systems PLC (United Kingdom), | ||||
| 5.13%, 03/26/2029(b) | 2,631,000 | 2,686,469 | ||
| 5.50%, 03/26/2054(b) | 1,351,000 | 1,379,140 | ||
| Boeing Co. (The), | ||||
| 6.26%, 05/01/2027(b)(c) | 1,139,000 | 1,172,087 | ||
| 6.30%, 05/01/2029(b)(c) | 1,621,000 | 1,693,606 | ||
| 6.53%, 05/01/2034(b) | 8,657,000 | 9,174,422 | ||
| 6.86%, 05/01/2054(b) | 1,490,000 | 1,605,788 | ||
| Howmet Aerospace, Inc., 4.85%, 10/15/2031 | 2,327,000 | 2,356,376 | ||
| L3Harris Technologies, Inc., 5.40%, 07/31/2033 | 485,000 | 500,237 | ||
| Lockheed Martin Corp., | ||||
| 5.10%, 11/15/2027 | 451,000 | 463,767 | ||
| 4.50%, 02/15/2029 | 2,322,000 | 2,344,668 | ||
| 4.80%, 08/15/2034(c) | 3,346,000 | 3,397,920 | ||
| 5.90%, 11/15/2063 | 311,000 | 348,524 | ||
| RTX Corp., | ||||
| 5.75%, 01/15/2029 | 1,402,000 | 1,472,928 | ||
| 6.00%, 03/15/2031 | 1,108,000 | 1,191,351 | ||
| 5.15%, 02/27/2033 | 1,357,000 | 1,391,909 | ||
| 6.40%, 03/15/2054 | 1,116,000 | 1,281,948 | ||
| TransDigm, Inc., | ||||
| 6.75%, 08/15/2028(b) | 4,170,000 | 4,292,590 | ||
| 6.38%, 03/01/2029(b) | 4,667,000 | 4,815,462 | ||
| 6.63%, 03/01/2032(b) | 4,047,000 | 4,213,817 | ||
| 45,783,009 | ||||
| Agricultural & Farm Machinery–0.14% | ||||
| AGCO Corp., | ||||
| 5.45%, 03/21/2027 | 1,135,000 | 1,152,716 | ||
| 5.80%, 03/21/2034(c) | 2,174,000 | 2,237,437 | ||
| John Deere Capital Corp., 5.10%, 04/11/2034 | 3,965,000 | 4,099,221 | ||
| 7,489,374 | ||||
| Air Freight & Logistics–0.34% | ||||
| GXO Logistics, Inc., | ||||
| 6.25%, 05/06/2029 | 4,752,000 | 4,960,235 | ||
| 6.50%, 05/06/2034 | 2,848,000 | 2,961,095 | ||
| United Parcel Service, Inc., | ||||
| 5.15%, 05/22/2034(c) | 2,847,000 | 2,953,403 | ||
| 5.50%, 05/22/2054(c) | 5,030,000 | 5,237,076 | ||
| 5.60%, 05/22/2064 | 2,604,000 | 2,720,196 | ||
| 18,832,005 | ||||
| Airport Services–0.01% | ||||
| Mexico City Airport Trust (Mexico), 5.50%, 07/31/2047(b) | 800,000 | 690,541 | ||
| Principal Amount | Value | |||
| Apparel Retail–0.00% | ||||
| Gap, Inc. (The), 3.63%, 10/01/2029(b) | $250,000 | $224,261 | ||
| Apparel, Accessories & Luxury Goods–0.02% | ||||
| Tapestry, Inc., 7.00%, 11/27/2026(c) | 1,162,000 | 1,198,881 | ||
| Application Software–0.31% | ||||
| Intuit, Inc., 5.20%, 09/15/2033(c) | 1,734,000 | 1,807,604 | ||
| Roper Technologies, Inc., | ||||
| 4.50%, 10/15/2029 | 2,829,000 | 2,824,592 | ||
| 4.75%, 02/15/2032 | 2,274,000 | 2,272,889 | ||
| 4.90%, 10/15/2034 | 7,858,000 | 7,789,463 | ||
| SS&C Technologies, Inc., | ||||
| 5.50%, 09/30/2027(b) | 500,000 | 499,916 | ||
| 6.50%, 06/01/2032(b) | 1,956,000 | 2,020,496 | ||
| 17,214,960 | ||||
| Asset Management & Custody Banks–1.11% | ||||
| Affiliated Managers Group, Inc., 5.50%, 08/20/2034 | 13,118,000 | 13,020,097 | ||
| Ameriprise Financial, Inc., | ||||
| 5.70%, 12/15/2028 | 2,349,000 | 2,470,336 | ||
| 5.15%, 05/15/2033 | 1,498,000 | 1,542,953 | ||
| Ares Capital Corp., | ||||
| 5.88%, 03/01/2029 | 69,000 | 70,183 | ||
| 5.95%, 07/15/2029 | 2,494,000 | 2,542,497 | ||
| Bank of New York Mellon Corp. (The), | ||||
| 4.89%, 07/21/2028(d) | 6,783,000 | 6,859,340 | ||
| 4.98%, 03/14/2030(d) | 871,000 | 891,564 | ||
| 5.06%, 07/22/2032(d) | 4,018,000 | 4,108,413 | ||
| 5.19%, 03/14/2035(c)(d) | 672,000 | 686,650 | ||
| 5.61%, 07/21/2039(d) | 3,339,000 | 3,462,177 | ||
| Series J, 4.97%, 04/26/2034(d) | 53,000 | 53,469 | ||
| Blackstone Secured Lending Fund, | ||||
| 2.13%, 02/15/2027 | 4,993,000 | 4,626,344 | ||
| 5.88%, 11/15/2027 | 3,013,000 | 3,047,126 | ||
| Northern Trust Corp., 6.13%, 11/02/2032 | 30,000 | 32,892 | ||
| State Street Corp., | ||||
| 5.68%, 11/21/2029(d) | 3,069,000 | 3,215,789 | ||
| 6.12%, 11/21/2034(c)(d) | 1,935,000 | 2,078,558 | ||
| Series J, 6.70%(c)(d)(e) | 11,967,000 | 12,312,104 | ||
| 61,020,492 | ||||
| Automobile Manufacturers–0.86% | ||||
| Allison Transmission, Inc., 4.75%, 10/01/2027(b) | 775,000 | 759,361 | ||
| American Honda Finance Corp., 4.90%, 01/10/2034 | 44,000 | 44,416 | ||
| Daimler Truck Finance North America LLC (Germany), | ||||
| 5.00%, 01/15/2027(b)(c) | 1,114,000 | 1,125,334 | ||
| 5.38%, 01/18/2034(b)(c) | 955,000 | 979,742 | ||
| 2 | Invesco Core Plus Bond Fund |
| Principal Amount | Value | |||
| Automobile Manufacturers–(continued) | ||||
| Ford Motor Credit Co. LLC, | ||||
| 6.95%, 06/10/2026 | $2,179,000 | $2,239,940 | ||
| 7.35%, 11/04/2027 | 198,000 | 209,486 | ||
| 6.80%, 05/12/2028 | 2,775,000 | 2,912,305 | ||
| 6.80%, 11/07/2028 | 1,835,000 | 1,934,743 | ||
| 7.20%, 06/10/2030 | 1,488,000 | 1,602,524 | ||
| 7.12%, 11/07/2033 | 1,559,000 | 1,685,444 | ||
| Hyundai Capital America, | ||||
| 5.60%, 03/30/2028(b) | 1,161,000 | 1,191,633 | ||
| 5.35%, 03/19/2029(b) | 1,068,000 | 1,091,189 | ||
| 5.80%, 04/01/2030(b)(c) | 263,000 | 275,028 | ||
| Mercedes-Benz Finance North America LLC (Germany), | ||||
| 5.10%, 08/03/2028(b)(c) | 1,702,000 | 1,740,758 | ||
| 4.85%, 01/11/2029(b)(c) | 1,959,000 | 1,987,564 | ||
| 5.00%, 01/11/2034(b)(c) | 937,000 | 942,209 | ||
| 5.13%, 08/01/2034(b) | 8,085,000 | 8,165,250 | ||
| Toyota Motor Credit Corp., | ||||
| 5.25%, 09/11/2028(c) | 1,108,000 | 1,144,868 | ||
| 4.55%, 08/09/2029(c) | 3,114,000 | 3,141,238 | ||
| 5.10%, 03/21/2031 | 1,094,000 | 1,128,183 | ||
| Volkswagen Group of America Finance LLC (Germany), | ||||
| 4.90%, 08/14/2026(b) | 2,708,000 | 2,714,690 | ||
| 5.25%, 03/22/2029(b)(c) | 3,908,000 | 3,978,181 | ||
| 4.95%, 08/15/2029(b) | 3,119,000 | 3,129,578 | ||
| 5.60%, 03/22/2034(b)(c) | 3,154,000 | 3,242,475 | ||
| 47,366,139 | ||||
| Automotive Parts & Equipment–0.52% | ||||
| Cougar JV Subsidiary LLC, 8.00%, 05/15/2032(b) | 247,000 | 260,733 | ||
| ERAC USA Finance LLC, | ||||
| 5.00%, 02/15/2029(b) | 1,802,000 | 1,848,138 | ||
| 4.90%, 05/01/2033(b) | 1,342,000 | 1,351,363 | ||
| 5.20%, 10/30/2034(b) | 2,564,000 | 2,626,353 | ||
| NESCO Holdings II, Inc., 5.50%, 04/15/2029(b) | 278,000 | 256,922 | ||
| Phinia, Inc., 6.75%, 04/15/2029(b) | 750,000 | 770,563 | ||
| ZF North America Capital, Inc. (Germany), | ||||
| 6.88%, 04/14/2028(b) | 4,605,000 | 4,761,524 | ||
| 7.13%, 04/14/2030(b)(c) | 6,851,000 | 7,186,048 | ||
| 6.75%, 04/23/2030(b) | 3,597,000 | 3,700,410 | ||
| 6.88%, 04/23/2032(b) | 5,755,000 | 5,983,784 | ||
| 28,745,838 | ||||
| Automotive Retail–0.23% | ||||
| Advance Auto Parts, Inc., 5.95%, 03/09/2028(c) | 1,880,000 | 1,903,028 | ||
| AutoZone, Inc., 5.20%, 08/01/2033 | 1,044,000 | 1,061,481 | ||
| Group 1 Automotive, Inc., | ||||
| 4.00%, 08/15/2028(b)(c) | 800,000 | 757,420 | ||
| 6.38%, 01/15/2030(b) | 118,000 | 120,338 | ||
| LCM Investments Holdings II LLC, 4.88%, 05/01/2029(b) | 800,000 | 762,714 | ||
| Lithia Motors, Inc., 4.63%, 12/15/2027(b) | 500,000 | 488,643 | ||
| O’Reilly Automotive, Inc., 5.00%, 08/19/2034 | 7,138,000 | 7,127,057 | ||
| Principal Amount | Value | |||
| Automotive Retail–(continued) | ||||
| Velocity Vehicle Group LLC, 8.00%, 06/01/2029(b) | $248,000 | $258,266 | ||
| 12,478,947 | ||||
| Biotechnology–0.38% | ||||
| AbbVie, Inc., | ||||
| 4.80%, 03/15/2029 | 3,141,000 | 3,209,780 | ||
| 5.05%, 03/15/2034(c) | 3,892,000 | 4,012,045 | ||
| 5.35%, 03/15/2044 | 2,536,000 | 2,617,835 | ||
| 5.40%, 03/15/2054 | 2,966,000 | 3,075,983 | ||
| 5.50%, 03/15/2064 | 3,032,000 | 3,150,847 | ||
| Amgen, Inc., | ||||
| 5.25%, 03/02/2025 | 919,000 | 919,391 | ||
| 5.15%, 03/02/2028 | 1,139,000 | 1,163,634 | ||
| 5.25%, 03/02/2030 | 477,000 | 494,237 | ||
| Gilead Sciences, Inc., | ||||
| 5.25%, 10/15/2033(c) | 1,049,000 | 1,093,217 | ||
| 5.55%, 10/15/2053 | 887,000 | 922,380 | ||
| 20,659,349 | ||||
| Brewers–0.01% | ||||
| Central American Bottling Corp./CBC Bottling Holdco S.L./Beliv Holdco S.L. (Guatemala), 5.25%, 04/27/2029(b) | 400,000 | 385,518 | ||
| Cia Cervecerias Unidas S.A. (Chile), 3.35%, 01/19/2032(b) | 250,000 | 220,752 | ||
| 606,270 | ||||
| Broadline Retail–0.03% | ||||
| Alibaba Group Holding Ltd. (China), 4.20%, 12/06/2047 | 600,000 | 502,985 | ||
| Falabella S.A. (Chile), 3.75%, 10/30/2027(b) | 200,000 | 190,077 | ||
| Kohl’s Corp., 4.25%, 07/17/2025 | 250,000 | 247,882 | ||
| Macy’s Retail Holdings LLC, 5.88%, 04/01/2029(b) | 250,000 | 245,332 | ||
| Prosus N.V. (China), 4.19%, 01/19/2032(b) | 200,000 | 182,052 | ||
| 1,368,328 | ||||
| Building Products–0.05% | ||||
| Carrier Global Corp., 5.90%, 03/15/2034 | 528,000 | 569,931 | ||
| Lennox International, Inc., 5.50%, 09/15/2028 | 1,472,000 | 1,520,299 | ||
| Sisecam UK PLC (Turkey), 8.63%, 05/02/2032(b) | 800,000 | 828,302 | ||
| 2,918,532 | ||||
| Cable & Satellite–0.29% | ||||
| CCO Holdings LLC/CCO Holdings Capital Corp., | ||||
| 5.13%, 05/01/2027(b)(c) | 500,000 | 490,433 | ||
| 6.38%, 09/01/2029(b)(c) | 3,948,000 | 3,902,876 | ||
| 7.38%, 03/01/2031(b)(c) | 3,880,000 | 3,951,761 | ||
| 3 | Invesco Core Plus Bond Fund |
| Principal Amount | Value | |||
| Cable & Satellite–(continued) | ||||
| Charter Communications Operating LLC/Charter Communications Operating Capital Corp., 6.65%, 02/01/2034 | $2,744,000 | $2,860,452 | ||
| Comcast Corp., 5.50%, 11/15/2032(c) | 910,000 | 961,181 | ||
| Cox Communications, Inc., | ||||
| 5.70%, 06/15/2033(b) | 420,000 | 429,252 | ||
| 5.80%, 12/15/2053(b) | 2,382,000 | 2,324,076 | ||
| Sirius XM Radio, Inc., 4.00%, 07/15/2028(b) | 250,000 | 234,411 | ||
| Virgin Media Vendor Financing Notes IV DAC (United Kingdom), 5.00%, 07/15/2028(b) | 275,000 | 261,034 | ||
| Ziggo Bond Co. B.V. (Netherlands), 6.00%, 01/15/2027(b) | 250,000 | 249,438 | ||
| 15,664,914 | ||||
| Cargo Ground Transportation–0.11% | ||||
| Penske Truck Leasing Co. L.P./PTL Finance Corp., | ||||
| 5.75%, 05/24/2026(b) | 294,000 | 298,173 | ||
| 5.35%, 01/12/2027(b) | 326,000 | 330,837 | ||
| 5.70%, 02/01/2028(b) | 466,000 | 479,195 | ||
| 5.55%, 05/01/2028(b)(c) | 978,000 | 1,004,661 | ||
| 6.05%, 08/01/2028(b) | 1,002,000 | 1,048,426 | ||
| 6.20%, 06/15/2030(b)(c) | 416,000 | 444,857 | ||
| Ryder System, Inc., 6.60%, 12/01/2033(c) | 2,090,000 | 2,310,670 | ||
| 5,916,819 | ||||
| Casinos & Gaming–0.03% | ||||
| Melco Resorts Finance Ltd. (Hong Kong), 5.25%, 04/26/2026(b)(c) | 750,000 | 733,835 | ||
| Studio City Finance Ltd. (Macau), 5.00%, 01/15/2029(b) | 250,000 | 223,529 | ||
| Wynn Macau Ltd. (Macau), | ||||
| 5.63%, 08/26/2028(b)(c) | 500,000 | 478,019 | ||
| 5.13%, 12/15/2029(b)(c) | 400,000 | 368,286 | ||
| 1,803,669 | ||||
| Coal & Consumable Fuels–0.01% | ||||
| PT Adaro Indonesia (Indonesia), 4.25%, 10/31/2024(b) | 400,000 | 399,648 | ||
| Commercial & Residential Mortgage Finance–0.15% | ||||
| Aviation Capital Group LLC, | ||||
| 6.25%, 04/15/2028(b) | 772,000 | 802,559 | ||
| 6.75%, 10/25/2028(b) | 2,104,000 | 2,230,123 | ||
| Nationstar Mortgage Holdings, Inc., 6.00%, 01/15/2027(b) | 250,000 | 249,788 | ||
| Nationwide Building Society (United Kingdom), 6.56%, 10/18/2027(b)(d) | 1,601,000 | 1,660,609 | ||
| Radian Group, Inc., 6.20%, 05/15/2029(c) | 2,604,000 | 2,713,299 | ||
| Rocket Mortgage LLC/Rocket Mortgage Co-Issuer, Inc., 2.88%, 10/15/2026(b) | 445,000 | 423,638 | ||
| 8,080,016 | ||||
| Principal Amount | Value | |||
| Commodity Chemicals–0.02% | ||||
| Mativ Holdings, Inc., 6.88%, 10/01/2026(b) | $1,000,000 | $999,381 | ||
| Communications Equipment–0.02% | ||||
| Cisco Systems, Inc., 5.30%, 02/26/2054(c) | 813,000 | 839,962 | ||
| Computer & Electronics Retail–0.01% | ||||
| Leidos, Inc., 5.75%, 03/15/2033 | 650,000 | 676,137 | ||
| Construction & Engineering–0.00% | ||||
| Bioceanico Sovereign Certificate Ltd. (Paraguay), 0.00%, 06/05/2034(b)(f) | 126,736 | 98,879 | ||
| Rutas 2 and 7 Finance Ltd. (Paraguay), 0.00%, 09/30/2036(b)(f) | 200,000 | 143,790 | ||
| 242,669 | ||||
| Construction Machinery & Heavy Transportation Equipment– 0.12% | ||||
| Caterpillar Financial Services Corp., 5.15%, 08/11/2025 | 3,132,000 | 3,148,939 | ||
| Cummins, Inc., | ||||
| 4.90%, 02/20/2029(c) | 1,028,000 | 1,053,647 | ||
| 5.45%, 02/20/2054 | 2,101,000 | 2,158,858 | ||
| 6,361,444 | ||||
| Construction Materials–0.01% | ||||
| CEMEX S.A.B. de C.V. (Mexico), 9.13%(b)(d)(e) | 600,000 | 652,653 | ||
| Consumer Electronics–0.26% | ||||
| LG Electronics, Inc. (South Korea), | ||||
| 5.63%, 04/24/2027(b) | 9,565,000 | 9,758,476 | ||
| 5.63%, 04/24/2029(b) | 4,335,000 | 4,493,889 | ||
| 14,252,365 | ||||
| Consumer Finance–0.56% | ||||
| American Express Co., | ||||
| 5.65%, 04/23/2027(d) | 5,702,000 | 5,788,227 | ||
| 5.53%, 04/25/2030(d) | 5,131,000 | 5,332,659 | ||
| 5.92%, 04/25/2035(d) | 4,676,000 | 4,925,495 | ||
| Capital One Financial Corp., | ||||
| 7.15%, 10/29/2027(d) | 1,054,000 | 1,104,991 | ||
| 6.31%, 06/08/2029(d) | 984,000 | 1,029,593 | ||
| 7.62%, 10/30/2031(d) | 64,000 | 72,274 | ||
| 6.38%, 06/08/2034(c)(d) | 925,000 | 983,288 | ||
| FirstCash, Inc., | ||||
| 4.63%, 09/01/2028(b) | 400,000 | 383,577 | ||
| 6.88%, 03/01/2032(b) | 10,102,000 | 10,390,543 | ||
| General Motors Financial Co., Inc., 5.40%, 04/06/2026 | 219,000 | 221,092 | ||
| Navient Corp., 5.00%, 03/15/2027 | 250,000 | 245,688 | ||
| OneMain Finance Corp., 3.50%, 01/15/2027 | 275,000 | 260,957 | ||
| 30,738,384 | ||||
| Consumer Staples Merchandise Retail–0.03% | ||||
| Cencosud S.A. (Chile), 5.95%, 05/28/2031(b) | 800,000 | 827,688 | ||
| 4 | Invesco Core Plus Bond Fund |
| Principal Amount | Value | |||
| Consumer Staples Merchandise Retail–(continued) | ||||
| Dollar General Corp., 5.50%, 11/01/2052 | $467,000 | $442,990 | ||
| Target Corp., 4.80%, 01/15/2053(c) | 574,000 | 550,249 | ||
| 1,820,927 | ||||
| Copper–0.01% | ||||
| First Quantum Minerals Ltd. (Zambia), 6.88%, 10/15/2027(b) | 200,000 | 198,538 | ||
| PT Freeport Indonesia (Indonesia), 4.76%, 04/14/2027(b) | 217,000 | 216,672 | ||
| 415,210 | ||||
| Distillers & Vintners–0.01% | ||||
| Constellation Brands, Inc., 4.90%, 05/01/2033 | 267,000 | 266,260 | ||
| Distributors–0.22% | ||||
| Genuine Parts Co., | ||||
| 4.95%, 08/15/2029 | 9,809,000 | 9,872,437 | ||
| 6.88%, 11/01/2033 | 2,032,000 | 2,301,754 | ||
| 12,174,191 | ||||
| Diversified Banks–6.48% | ||||
| Africa Finance Corp. (Supranational), 4.38%, 04/17/2026(b) | 20,285,000 | 19,975,983 | ||
| Australia and New Zealand Banking Group Ltd. (Australia), | ||||
| 6.74%, 12/08/2032(b)(c) | 1,228,000 | 1,346,977 | ||
| 6.75%(b)(d)(e) | 1,224,000 | 1,249,574 | ||
| Banco Bilbao Vizcaya Argentaria S.A. (Spain), | ||||
| 7.88%, 11/15/2034(d) | 2,000,000 | 2,266,537 | ||
| 9.38%(c)(d)(e) | 3,401,000 | 3,723,377 | ||
| Banco de Bogota S.A. (Colombia), 4.38%, 08/03/2027(b) | 400,000 | 387,947 | ||
| Banco de Credito e Inversiones S.A. (Chile), 8.75%(b)(d)(e) | 430,000 | 461,747 | ||
| Banco del Estado de Chile (Chile), 7.95%(b)(d)(e) | 421,000 | 445,539 | ||
| Banco do Brasil S.A. (Brazil), 6.00%, 03/18/2031(b) | 800,000 | 813,226 | ||
| Banco GNB Sudameris S.A. (Colombia), 7.50%, 04/16/2031(b)(d) | 200,000 | 190,038 | ||
| Banco Santander S.A. (Spain), | ||||
| 5.55%, 03/14/2028(d) | 3,000,000 | 3,045,576 | ||
| 5.44%, 07/15/2031(c) | 7,500,000 | 7,730,660 | ||
| 8.00%(c)(d)(e) | 666,667 | 688,597 | ||
| 9.63%(d)(e) | 4,400,000 | 4,826,406 | ||
| 9.63%(c)(d)(e) | 4,800,000 | 5,577,341 | ||
| Bangkok Bank PCL (Thailand), 5.65%, 07/05/2034(b) | 800,000 | 837,303 | ||
| Bank Gospodarstwa Krajowego (Poland), | ||||
| 6.25%, 10/31/2028(b) | 550,000 | 586,321 | ||
| 5.38%, 05/22/2033(b) | 200,000 | 204,923 | ||
| 5.75%, 07/09/2034(b) | 445,000 | 465,911 | ||
| Principal Amount | Value | ||
| Diversified Banks–(continued) | |||
| Bank of America Corp., | |||
| 6.43% (SOFR + 1.05%), 02/04/2028(c)(g) | $626,000 | $629,708 | |
| 4.95%, 07/22/2028(d) | 329,000 | 332,467 | |
| 5.20%, 04/25/2029(d) | 1,734,000 | 1,771,780 | |
| 5.43%, 08/15/2035(c)(d) | 8,525,000 | 8,546,734 | |
| Bank of Montreal (Canada), | |||
| 7.70%, 05/26/2084(c)(d) | 5,336,000 | 5,598,915 | |
| 7.30%, 11/26/2084(d) | 5,588,000 | 5,742,955 | |
| Bank of Nova Scotia (The) (Canada), | |||
| 8.63%, 10/27/2082(c)(d) | 1,410,000 | 1,513,759 | |
| 8.00%, 01/27/2084(d) | 2,266,000 | 2,408,831 | |
| Banque Federative du Credit Mutuel S.A. (France), 5.19%, 02/16/2028(b) | 7,516,000 | 7,660,012 | |
| Barclays PLC (United Kingdom), 6.69%, 09/13/2034(d) | 200,000 | 219,341 | |
| BBVA Bancomer S.A. (Mexico), | |||
| 8.45%, 06/29/2038(b)(c)(d) | 300,000 | 322,582 | |
| 8.13%, 01/08/2039(b)(c)(d) | 3,305,000 | 3,479,554 | |
| BPCE S.A. (France), | |||
| 5.20%, 01/18/2027(b)(c) | 1,526,000 | 1,546,421 | |
| 5.28%, 05/30/2029(b) | 2,278,000 | 2,328,598 | |
| 5.72%, 01/18/2030(b)(d) | 297,000 | 304,430 | |
| Citibank N.A., 5.57%, 04/30/2034 | 4,043,000 | 4,248,209 | |
| Citigroup, Inc., | |||
| 5.17%, 02/13/2030(d) | 1,728,000 | 1,761,701 | |
| 6.17%, 05/25/2034(d) | 145,000 | 153,142 | |
| 5.83%, 02/13/2035(d) | 4,704,000 | 4,836,480 | |
| Series AA, 7.63%(d)(e) | 8,532,000 | 9,067,477 | |
| Series BB, 7.20%(c)(d)(e) | 8,271,000 | 8,666,503 | |
| Series CC, 7.13%(d)(e) | 6,214,000 | 6,371,867 | |
| Series DD, 7.00%(c)(d)(e) | 10,249,000 | 10,736,545 | |
| Series Z, 7.38%(c)(d)(e) | 9,110,000 | 9,562,539 | |
| Comerica, Inc., 5.98%, 01/30/2030(d) | 23,000 | 23,407 | |
| Corp Financiera de Desarrollo S.A. (Peru), 5.95%, 04/30/2029(b) | 3,865,000 | 3,981,947 | |
| Credit Agricole S.A. (France), | |||
| 5.34%, 01/10/2030(b)(c)(d) | 2,357,000 | 2,404,839 | |
| 6.25%, 01/10/2035(b)(d) | 375,000 | 393,819 | |
| Export-Import Bank of India (India), 3.38%, 08/05/2026(b) | 200,000 | 195,273 | |
| Federation des caisses Desjardins du Quebec (Canada), | |||
| 5.28%, 01/23/2026(b)(d) | 1,344,000 | 1,344,062 | |
| 4.55%, 08/23/2027(b) | 1,358,000 | 1,355,762 | |
| Fifth Third Bancorp, | |||
| 2.38%, 01/28/2025 | 317,000 | 313,308 | |
| 1.71%, 11/01/2027(d) | 382,000 | 358,087 | |
| 6.34%, 07/27/2029(c)(d) | 257,000 | 270,291 | |
| 4.77%, 07/28/2030(d) | 920,000 | 915,020 | |
| 5.63%, 01/29/2032(d) | 509,000 | 523,141 | |
| HSBC Holdings PLC (United Kingdom), | |||
| 5.89%, 08/14/2027(d) | 1,698,000 | 1,734,363 | |
| 5.60%, 05/17/2028(d) | 4,447,000 | 4,543,641 | |
| 5.21%, 08/11/2028(d) | 1,111,000 | 1,127,038 | |
| 7.40%, 11/13/2034(d) | 200,000 | 224,231 | |
| 6.33%, 03/09/2044(d) | 1,523,000 | 1,667,471 | |
| 5 | Invesco Core Plus Bond Fund |
| Principal Amount | Value | ||
| Diversified Banks–(continued) | |||
| ING Groep N.V. (Netherlands), 5.34%, 03/19/2030(d) | $2,498,000 | $2,555,474 | |
| JPMorgan Chase & Co., | |||
| 5.57%, 04/22/2028(d) | 4,168,000 | 4,273,884 | |
| 4.85%, 07/25/2028(d) | 356,000 | 359,280 | |
| 5.30%, 07/24/2029(d) | 1,411,000 | 1,448,197 | |
| 6.09%, 10/23/2029(d) | 1,735,000 | 1,834,814 | |
| 5.01%, 01/23/2030(d) | 1,087,000 | 1,106,136 | |
| 5.58%, 04/22/2030(d) | 3,316,000 | 3,453,428 | |
| 5.00%, 07/22/2030(d) | 6,783,000 | 6,909,422 | |
| 5.72%, 09/14/2033(c)(d) | 946,000 | 990,028 | |
| 6.25%, 10/23/2034(c)(d) | 2,674,000 | 2,932,845 | |
| 5.34%, 01/23/2035(d) | 895,000 | 922,052 | |
| 5.29%, 07/22/2035(c)(d) | 4,523,000 | 4,643,399 | |
| Series W, 6.38% (3 mo. Term SOFR + 1.26%), 05/15/2047(g) | 394,000 | 359,165 | |
| Series NN, 6.88%(c)(d)(e) | 2,924,000 | 3,106,355 | |
| KeyBank N.A., | |||
| 3.30%, 06/01/2025 | 1,289,000 | 1,270,434 | |
| 4.15%, 08/08/2025(c) | 1,086,000 | 1,076,036 | |
| 5.85%, 11/15/2027(c) | 1,318,000 | 1,356,712 | |
| KeyCorp, | |||
| 6.62% (SOFR + 1.25%), 05/23/2025(g) | 664,000 | 665,828 | |
| 2.55%, 10/01/2029 | 321,000 | 287,543 | |
| Magyar Export-Import Bank Zartkoruen Mukodo Reszvenytarsasag (Hungary), 6.13%, 12/04/2027(b) | 325,000 | 331,523 | |
| Manufacturers & Traders Trust Co., | |||
| 2.90%, 02/06/2025 | 1,438,000 | 1,421,952 | |
| 4.70%, 01/27/2028(c) | 1,549,000 | 1,539,369 | |
| Mitsubishi UFJ Financial Group, Inc. (Japan), | |||
| 5.26%, 04/17/2030(d) | 4,596,000 | 4,715,219 | |
| 5.43%, 04/17/2035(d) | 4,882,000 | 5,043,682 | |
| 8.20%(c)(d)(e) | 8,024,000 | 8,808,851 | |
| Mizuho Financial Group, Inc. (Japan), | |||
| 5.78%, 07/06/2029(d) | 1,190,000 | 1,236,830 | |
| 5.38%, 07/10/2030(c)(d) | 5,285,000 | 5,435,371 | |
| 5.59%, 07/10/2035(d) | 7,314,000 | 7,587,301 | |
| Morgan Stanley Bank N.A., | |||
| 5.88%, 10/30/2026 | 2,323,000 | 2,394,142 | |
| 4.95%, 01/14/2028(d) | 1,249,000 | 1,258,881 | |
| Multibank, Inc. (Panama), 7.75%, 02/03/2028(b) | 2,607,000 | 2,703,224 | |
| National Securities Clearing Corp., | |||
| 5.10%, 11/21/2027(b) | 1,771,000 | 1,811,215 | |
| 5.00%, 05/30/2028(b) | 1,766,000 | 1,803,458 | |
| Panama Infrastructure Receivable Purchaser PLC (United Kingdom), 0.00%, 04/05/2032(b)(f) | 16,616,000 | 11,473,431 | |
| Principal Amount | Value | |||
| Diversified Banks–(continued) | ||||
| PNC Financial Services Group, Inc. (The), | ||||
| 6.62%, 10/20/2027(d) | $1,917,000 | $1,994,236 | ||
| 5.58%, 06/12/2029(d) | 1,597,000 | 1,649,967 | ||
| 6.04%, 10/28/2033(d) | 34,000 | 36,179 | ||
| 5.07%, 01/24/2034(d) | 579,000 | 579,385 | ||
| 6.88%, 10/20/2034(d) | 1,503,000 | 1,693,215 | ||
| Series V, 6.20%(c)(d)(e) | 886,000 | 892,064 | ||
| Series W, 6.25%(d)(e) | 1,344,000 | 1,341,017 | ||
| Royal Bank of Canada (Canada), | ||||
| 6.09% (SOFR + 0.71%), 01/21/2027(g) | 378,000 | 378,723 | ||
| 4.95%, 02/01/2029(c) | 761,000 | 778,756 | ||
| 7.50%, 05/02/2084(d) | 6,343,000 | 6,594,420 | ||
| Standard Chartered PLC (United Kingdom), | ||||
| 6.19%, 07/06/2027(b)(d) | 1,140,000 | 1,166,672 | ||
| 6.75%, 02/08/2028(b)(d) | 1,550,000 | 1,616,011 | ||
| 7.02%, 02/08/2030(b)(d) | 1,559,000 | 1,687,155 | ||
| 2.68%, 06/29/2032(b)(d) | 3,298,000 | 2,828,398 | ||
| 7.75%(b)(d)(e) | 7,700,000 | 7,998,336 | ||
| Sumitomo Mitsui Financial Group, Inc. (Japan), 6.60%(c)(d)(e) | 9,622,000 | 9,990,369 | ||
| Sumitomo Mitsui Trust Bank Ltd. (Japan), | ||||
| 5.65%, 03/09/2026(b) | 1,139,000 | 1,157,976 | ||
| 5.65%, 09/14/2026(b) | 1,170,000 | 1,194,144 | ||
| 5.55%, 09/14/2028(b)(c) | 1,896,000 | 1,968,356 | ||
| 5.20%, 03/07/2029(b) | 2,676,000 | 2,750,564 | ||
| 5.35%, 03/07/2034(b) | 1,868,000 | 1,937,455 | ||
| Synovus Bank, 5.63%, 02/15/2028 | 1,274,000 | 1,270,612 | ||
| Toronto-Dominion Bank (The) (Canada), | ||||
| 8.13%, 10/31/2082(c)(d) | 1,373,000 | 1,466,360 | ||
| 7.25%, 07/31/2084(d) | 6,673,000 | 6,840,412 | ||
| Turkiye Ihracat Kredi Bankasi A.S. (Turkey), 7.50%, 02/06/2028(b) | 300,000 | 307,163 | ||
| U.S. Bancorp, | ||||
| 5.78%, 06/12/2029(c)(d) | 1,224,000 | 1,271,283 | ||
| 5.38%, 01/23/2030(d) | 2,085,000 | 2,143,382 | ||
| 4.97%, 07/22/2033(d) | 299,000 | 293,764 | ||
| 4.84%, 02/01/2034(c)(d) | 1,163,000 | 1,143,837 | ||
| 5.84%, 06/12/2034(d) | 99,000 | 104,065 | ||
| UBS AG (Switzerland), | ||||
| 3.63%, 09/09/2024 | 1,384,000 | 1,383,591 | ||
| 5.65%, 09/11/2028 | 1,528,000 | 1,589,953 | ||
| Wells Fargo & Co., | ||||
| 5.71%, 04/22/2028(d) | 2,576,000 | 2,646,335 | ||
| 4.81%, 07/25/2028(d) | 213,000 | 214,279 | ||
| 5.57%, 07/25/2029(d) | 971,000 | 1,003,006 | ||
| 6.30%, 10/23/2029(d) | 1,191,000 | 1,263,814 | ||
| 5.20%, 01/23/2030(c)(d) | 1,217,000 | 1,242,568 | ||
| 5.39%, 04/24/2034(d) | 44,000 | 45,113 | ||
| 5.56%, 07/25/2034(d) | 2,555,000 | 2,638,230 | ||
| 5.50%, 01/23/2035(d) | 1,650,000 | 1,703,429 | ||
| 6.85%(d)(e) | 5,023,000 | 5,168,295 | ||
| 7.63%(c)(d)(e) | 1,108,000 | 1,193,650 | ||
| 356,292,253 | ||||
| 6 | Invesco Core Plus Bond Fund |
| Principal Amount | Value | |||
| Diversified Capital Markets–0.23% | ||||
| Credit Suisse Group AG (Switzerland), | ||||
| 4.50%(b)(d)(e)(h) | $5,650,000 | $678,000 | ||
| 5.25%(b)(d)(e)(h) | 3,522,000 | 422,640 | ||
| UBS Group AG (Switzerland), | ||||
| 5.43%, 02/08/2030(b)(c)(d) | 1,095,000 | 1,122,317 | ||
| 6.30%, 09/22/2034(b)(d) | 1,551,000 | 1,674,359 | ||
| 5.70%, 02/08/2035(b)(d) | 1,386,000 | 1,438,209 | ||
| Series 28, 9.25%(b)(d)(e) | 1,590,000 | 1,757,071 | ||
| Series 31, 7.75%(b)(c)(d)(e) | 3,582,000 | 3,779,236 | ||
| Series 33, 9.25%(b)(c)(d)(e) | 1,729,000 | 2,000,966 | ||
| 12,872,798 | ||||
| Diversified Chemicals–0.01% | ||||
| MEGlobal B.V. (Kuwait), 2.63%, 04/28/2028(b) | 200,000 | 185,000 | ||
| SABIC Capital II B.V. (Saudi Arabia), 4.50%, 10/10/2028(b) | 200,000 | 200,454 | ||
| 385,454 | ||||
| Diversified Financial Services–1.23% | ||||
| Abu Dhabi Developmental Holding Co. PJSC (United Arab Emirates), 5.50%, 05/08/2034(b) | 290,000 | 305,950 | ||
| AerCap Ireland Capital DAC/AerCap Global Aviation Trust (Ireland), 6.95%, 03/10/2055(d) | 2,704,000 | 2,791,429 | ||
| Aircastle Ltd./Aircastle Ireland DAC, 5.75%, 10/01/2031(b) | 1,633,000 | 1,658,569 | ||
| Apollo Debt Solutions BDC, 6.90%, 04/13/2029(b)(c) | 630,000 | 651,879 | ||
| Apollo Global Management, Inc., | ||||
| 6.38%, 11/15/2033 | 1,993,000 | 2,195,043 | ||
| 5.80%, 05/21/2054 | 3,045,000 | 3,135,962 | ||
| Avolon Holdings Funding Ltd. (Ireland), | ||||
| 6.38%, 05/04/2028(b)(c) | 2,086,000 | 2,169,166 | ||
| 5.75%, 03/01/2029(b) | 4,184,000 | 4,286,504 | ||
| 5.75%, 11/15/2029(b) | 3,934,000 | 4,028,678 | ||
| BlackRock Funding, Inc., | ||||
| 4.90%, 01/08/2035 | 2,263,000 | 2,302,031 | ||
| 5.35%, 01/08/2055 | 2,224,000 | 2,283,779 | ||
| Blue Owl Technology Finance Corp. II, 6.75%, 04/04/2029(b) | 5,234,000 | 5,198,440 | ||
| BOC Aviation (USA) Corp. (China), 4.88%, 05/03/2033(b) | 310,000 | 309,293 | ||
| Corebridge Financial, Inc., | ||||
| 6.05%, 09/15/2033(c) | 1,749,000 | 1,864,230 | ||
| 5.75%, 01/15/2034 | 2,495,000 | 2,603,404 | ||
| Franklin BSP Capital Corp., 7.20%, 06/15/2029(b) | 1,259,000 | 1,284,735 | ||
| Gabon Blue Bond Master Trust, Series 2, 6.10%, 08/01/2038(b) | 5,956,000 | 5,950,439 | ||
| GGAM Finance Ltd. (Ireland), 8.00%, 06/15/2028(b)(c) | 750,000 | 802,174 | ||
| LPL Holdings, Inc., 5.70%, 05/20/2027 | 3,980,000 | 4,052,729 | ||
| Principal Amount | Value | |||
| Diversified Financial Services–(continued) | ||||
| Macquarie Airfinance Holdings Ltd. (United Kingdom), | ||||
| 6.40%, 03/26/2029(b) | $2,672,000 | $2,782,450 | ||
| 6.50%, 03/26/2031(b) | 2,559,000 | 2,699,973 | ||
| Nuveen LLC, | ||||
| 5.55%, 01/15/2030(b) | 1,838,000 | 1,906,379 | ||
| 5.85%, 04/15/2034(b) | 2,886,000 | 3,023,088 | ||
| OPEC Fund for International Development (The) (Supranational), 4.50%, 01/26/2026(b) | 9,425,000 | 9,421,377 | ||
| Peru Enhanced Pass-Through Finance Ltd. (Peru), Class A-2, 0.00%, 06/02/2025(b)(f) | 17,353 | 16,658 | ||
| 67,724,359 | ||||
| Diversified Metals & Mining–0.36% | ||||
| BHP Billiton Finance (USA) Ltd. (Australia), | ||||
| 5.10%, 09/08/2028 | 2,168,000 | 2,223,276 | ||
| 5.25%, 09/08/2030 | 1,574,000 | 1,640,055 | ||
| 5.25%, 09/08/2033(c) | 2,735,000 | 2,824,161 | ||
| Corporacion Nacional del Cobre de Chile (Chile), 5.13%, 02/02/2033(b) | 3,583,000 | 3,539,272 | ||
| Glencore Funding LLC (Australia), | ||||
| 6.43% (SOFR + 1.06%), 04/04/2027(b)(g) | 2,538,000 | 2,541,427 | ||
| 5.37%, 04/04/2029(b) | 2,760,000 | 2,817,202 | ||
| 5.63%, 04/04/2034(b)(c) | 1,901,000 | 1,937,158 | ||
| 5.89%, 04/04/2054(b)(c) | 1,543,000 | 1,546,632 | ||
| Hudbay Minerals, Inc. (Canada), 6.13%, 04/01/2029(b) | 500,000 | 505,126 | ||
| 19,574,309 | ||||
| Diversified REITs–0.21% | ||||
| Trust Fibra Uno (Mexico), | ||||
| 5.25%, 01/30/2026(b) | 7,067,000 | 7,041,926 | ||
| 6.39%, 01/15/2050(b) | 3,343,000 | 2,794,379 | ||
| VICI Properties L.P., | ||||
| 5.75%, 04/01/2034(c) | 859,000 | 885,454 | ||
| 6.13%, 04/01/2054(c) | 930,000 | 949,190 | ||
| 11,670,949 | ||||
| Diversified Support Services–0.11% | ||||
| Element Fleet Management Corp. (Canada), 6.32%, 12/04/2028(b)(c) | 1,770,000 | 1,872,354 | ||
| Ritchie Bros. Holdings, Inc. (Canada), | ||||
| 6.75%, 03/15/2028(b)(c) | 1,522,000 | 1,567,765 | ||
| 7.75%, 03/15/2031(b)(c) | 2,603,000 | 2,770,133 | ||
| 6,210,252 | ||||
| Drug Retail–0.04% | ||||
| CK Hutchison International (23) Ltd. (United Kingdom), 4.88%, 04/21/2033(b) | 2,152,000 | 2,155,199 | ||
| Walgreens Boots Alliance, Inc., 3.45%, 06/01/2026 | 250,000 | 238,091 | ||
| 2,393,290 | ||||
| 7 | Invesco Core Plus Bond Fund |
| Principal Amount | Value | ||
| Electric Utilities–2.84% | |||
| Alabama Power Co., 5.85%, 11/15/2033 | $584,000 | $628,539 | |
| Alexander Funding Trust II, 7.47%, 07/31/2028(b) | 1,022,000 | 1,098,316 | |
| Alfa Desarrollo S.p.A. (Chile), 4.55%, 09/27/2051(b) | 198,588 | 155,102 | |
| American Electric Power Co., Inc., | |||
| 5.75%, 11/01/2027 | 447,000 | 463,502 | |
| 5.20%, 01/15/2029(c) | 1,813,000 | 1,858,069 | |
| CenterPoint Energy Houston Electric LLC, | |||
| 5.20%, 10/01/2028(c) | 829,000 | 851,013 | |
| Series AJ, 4.85%, 10/01/2052 | 603,000 | 559,445 | |
| Comision Federal de Electricidad (Mexico), 6.26%, 02/15/2052(b) | 600,000 | 547,467 | |
| Connecticut Light and Power Co. (The), 4.95%, 08/15/2034(c) | 1,299,000 | 1,306,147 | |
| Consolidated Edison Co. of New York, Inc., | |||
| 5.50%, 03/15/2034 | 34,000 | 35,798 | |
| 5.90%, 11/15/2053 | 1,325,000 | 1,426,048 | |
| Constellation Energy Generation LLC, | |||
| 6.13%, 01/15/2034 | 673,000 | 723,780 | |
| 6.50%, 10/01/2053 | 551,000 | 611,018 | |
| 5.75%, 03/15/2054 | 2,517,000 | 2,541,602 | |
| Dominion Energy South Carolina, Inc., 6.25%, 10/15/2053 | 698,000 | 791,575 | |
| Duke Energy Carolinas LLC, 5.35%, 01/15/2053 | 683,000 | 684,203 | |
| Duke Energy Corp., | |||
| 4.85%, 01/05/2029(c) | 1,738,000 | 1,762,570 | |
| 5.00%, 08/15/2052(c) | 540,000 | 496,245 | |
| 6.45%, 09/01/2054(c)(d) | 4,403,000 | 4,513,031 | |
| Duke Energy Indiana LLC, 5.40%, 04/01/2053 | 797,000 | 795,645 | |
| Edison International, 7.88%, 06/15/2054(c)(d) | 5,672,000 | 5,966,105 | |
| Electricidad Firme de Mexico Holdings S.A. de C.V. (Mexico), 4.90%, 11/20/2026(b) | 400,000 | 387,672 | |
| Electricite de France S.A. (France), | |||
| 5.70%, 05/23/2028(b)(c) | 1,488,000 | 1,538,965 | |
| 9.13%(b)(c)(d)(e) | 3,285,000 | 3,719,852 | |
| Enel Finance International N.V. (Italy), 6.80%, 10/14/2025(b) | 1,266,000 | 1,295,502 | |
| Entergy Corp., 7.13%, 12/01/2054(d) | 2,564,000 | 2,617,254 | |
| Entergy Louisiana LLC, 5.15%, 09/15/2034(c) | 3,191,000 | 3,221,172 | |
| Entergy Texas, Inc., 5.55%, 09/15/2054 | 2,595,000 | 2,602,666 | |
| Evergy Metro, Inc., 4.95%, 04/15/2033(c) | 484,000 | 488,672 | |
| Eversource Energy, 5.50%, 01/01/2034 | 1,486,000 | 1,517,796 | |
| Principal Amount | Value | ||
| Electric Utilities–(continued) | |||
| Exelon Corp., | |||
| 5.15%, 03/15/2029 | $1,553,000 | $1,594,754 | |
| 5.45%, 03/15/2034(c) | 1,489,000 | 1,538,502 | |
| 5.60%, 03/15/2053 | 2,047,000 | 2,075,295 | |
| FirstEnergy Pennsylvania Electric Co., 5.20%, 04/01/2028(b) | 352,000 | 358,103 | |
| Florida Power & Light Co., 4.80%, 05/15/2033(c) | 466,000 | 470,308 | |
| Georgia Power Co., 4.95%, 05/17/2033 | 559,000 | 565,400 | |
| Greenko Power II Ltd. (India), 4.30%, 12/13/2028(b) | 173,500 | 163,093 | |
| Kallpa Generacion S.A. (Peru), 4.13%, 08/16/2027(b) | 200,000 | 194,142 | |
| Mercury Chile Holdco LLC (Chile), 6.50%, 01/24/2027(b) | 2,377,000 | 2,362,441 | |
| MidAmerican Energy Co., | |||
| 5.35%, 01/15/2034(c) | 465,000 | 487,393 | |
| 5.85%, 09/15/2054(c) | 780,000 | 840,707 | |
| 5.30%, 02/01/2055 | 1,571,000 | 1,567,573 | |
| MVM Energetika Zrt (Hungary), 7.50%, 06/09/2028(b) | 200,000 | 211,659 | |
| National Rural Utilities Cooperative Finance Corp., | |||
| 4.85%, 02/07/2029(c) | 2,636,000 | 2,685,566 | |
| 5.00%, 02/07/2031(c) | 2,464,000 | 2,541,855 | |
| 5.80%, 01/15/2033(c) | 339,000 | 362,293 | |
| 5.00%, 08/15/2034 | 14,659,000 | 14,743,080 | |
| 7.13%, 09/15/2053(d) | 9,264,000 | 9,644,102 | |
| NextEra Energy Capital Holdings, Inc., | |||
| 6.05%, 03/01/2025 | 801,000 | 804,568 | |
| 4.90%, 03/15/2029(c) | 3,980,000 | 4,044,740 | |
| 5.25%, 03/15/2034(c) | 3,879,000 | 3,946,568 | |
| 5.55%, 03/15/2054(c) | 4,008,000 | 4,045,931 | |
| 6.75%, 06/15/2054(c)(d) | 2,194,000 | 2,299,536 | |
| Niagara Mohawk Power Corp., 5.29%, 01/17/2034(b) | 1,732,000 | 1,745,652 | |
| Ohio Power Co., 5.65%, 06/01/2034 | 3,000,000 | 3,120,698 | |
| Oklahoma Gas and Electric Co., 5.60%, 04/01/2053 | 9,165,000 | 9,308,771 | |
| Oncor Electric Delivery Co. LLC, 5.65%, 11/15/2033 | 1,504,000 | 1,599,025 | |
| PacifiCorp, | |||
| 5.10%, 02/15/2029 | 1,698,000 | 1,740,784 | |
| 5.30%, 02/15/2031 | 1,790,000 | 1,836,723 | |
| 5.45%, 02/15/2034(c) | 2,185,000 | 2,233,651 | |
| 5.80%, 01/15/2055(c) | 1,665,000 | 1,694,742 | |
| PPL Capital Funding, Inc., 5.25%, 09/01/2034(c) | 1,785,000 | 1,807,502 | |
| PT Perusahaan Perseroan (Persero) Perusahaan Listrik Negara (Indonesia), | |||
| 5.45%, 05/21/2028(b) | 200,000 | 204,353 | |
| 3.38%, 02/05/2030(b) | 200,000 | 185,427 | |
| Public Service Co. of Colorado, 5.25%, 04/01/2053(c) | 607,000 | 588,357 | |
| Public Service Co. of New Hampshire, 5.35%, 10/01/2033(c) | 706,000 | 737,232 | |
| 8 | Invesco Core Plus Bond Fund |
| Principal Amount | Value | |||
| Electric Utilities–(continued) | ||||
| Public Service Electric and Gas Co., 5.13%, 03/15/2053 | $394,000 | $390,016 | ||
| San Diego Gas & Electric Co., | ||||
| 5.35%, 04/01/2053 | 1,434,000 | 1,434,569 | ||
| 5.55%, 04/15/2054 | 2,888,000 | 2,972,222 | ||
| Sierra Pacific Power Co., 5.90%, 03/15/2054 | 560,000 | 594,986 | ||
| Southern Co. (The), 5.70%, 10/15/2032 | 350,000 | 370,874 | ||
| Southwestern Electric Power Co., 5.30%, 04/01/2033 | 496,000 | 503,669 | ||
| Union Electric Co., 5.20%, 04/01/2034 | 3,986,000 | 4,089,232 | ||
| Virginia Electric and Power Co., | ||||
| 5.00%, 04/01/2033 | 554,000 | 558,459 | ||
| 5.35%, 01/15/2054(c) | 1,276,000 | 1,270,961 | ||
| Vistra Operations Co. LLC, | ||||
| 5.63%, 02/15/2027(b) | 1,000,000 | 999,196 | ||
| 7.75%, 10/15/2031(b) | 3,953,000 | 4,208,976 | ||
| 6.88%, 04/15/2032(b)(c) | 5,446,000 | 5,660,262 | ||
| 6.95%, 10/15/2033(b) | 1,354,000 | 1,505,144 | ||
| 6.00%, 04/15/2034(b) | 1,975,000 | 2,065,427 | ||
| 156,179,290 | ||||
| Electrical Components & Equipment–0.03% | ||||
| EnerSys, 4.38%, 12/15/2027(b) | 250,000 | 245,060 | ||
| Regal Rexnord Corp., | ||||
| 6.05%, 04/15/2028 | 39,000 | 40,316 | ||
| 6.30%, 02/15/2030 | 450,000 | 475,426 | ||
| 6.40%, 04/15/2033(c) | 599,000 | 636,099 | ||
| Sensata Technologies B.V., 4.00%, 04/15/2029(b) | 275,000 | 259,151 | ||
| 1,656,052 | ||||
| Electronic Manufacturing Services–0.09% | ||||
| EMRLD Borrower L.P./Emerald Co-Issuer, Inc., 6.63%, 12/15/2030(b) | 4,675,000 | 4,793,203 | ||
| Environmental & Facilities Services–0.18% | ||||
| Ambipar Lux S.a.r.l. (Brazil), 9.88%, 02/06/2031(b) | 310,000 | 310,453 | ||
| GFL Environmental, Inc., 5.13%, 12/15/2026(b) | 250,000 | 249,265 | ||
| Republic Services, Inc., | ||||
| 4.88%, 04/01/2029 | 1,981,000 | 2,021,354 | ||
| 5.00%, 12/15/2033(c) | 1,725,000 | 1,756,685 | ||
| 5.00%, 04/01/2034(c) | 361,000 | 367,438 | ||
| Veralto Corp., | ||||
| 5.50%, 09/18/2026(b)(c) | 1,809,000 | 1,833,405 | ||
| 5.35%, 09/18/2028(b) | 1,963,000 | 2,024,352 | ||
| 5.45%, 09/18/2033(b) | 1,108,000 | 1,145,753 | ||
| 9,708,705 | ||||
| Financial Exchanges & Data–0.12% | ||||
| B3 S.A. - Brasil, Bolsa, Balcao (Brazil), 4.13%, 09/20/2031(b) | 268,000 | 240,894 | ||
| Intercontinental Exchange, Inc., | ||||
| 5.25%, 06/15/2031 | 2,886,000 | 3,004,729 | ||
| 4.95%, 06/15/2052(c) | 355,000 | 347,455 | ||
| 5.20%, 06/15/2062(c) | 802,000 | 803,120 | ||
| Principal Amount | Value | |||
| Financial Exchanges & Data–(continued) | ||||
| Nasdaq, Inc., | ||||
| 5.35%, 06/28/2028 | $408,000 | $421,659 | ||
| 5.55%, 02/15/2034(c) | 654,000 | 681,465 | ||
| 5.95%, 08/15/2053(c) | 279,000 | 299,398 | ||
| 6.10%, 06/28/2063(c) | 654,000 | 709,500 | ||
| 6,508,220 | ||||
| Food Retail–0.88% | ||||
| Kroger Co. (The), | ||||
| 4.70%, 08/15/2026 | 3,428,000 | 3,438,743 | ||
| 4.60%, 08/15/2027(c) | 2,133,000 | 2,138,976 | ||
| 4.65%, 09/15/2029 | 11,142,000 | 11,143,910 | ||
| 4.90%, 09/15/2031 | 7,169,000 | 7,165,935 | ||
| 5.00%, 09/15/2034(c) | 7,149,000 | 7,129,564 | ||
| 5.50%, 09/15/2054(c) | 8,571,000 | 8,407,355 | ||
| 5.65%, 09/15/2064 | 9,128,000 | 8,924,770 | ||
| 48,349,253 | ||||
| Forest Products–0.00% | ||||
| Celulosa Arauco y Constitucion S.A. (Chile), 5.15%, 01/29/2050(b) | 200,000 | 179,805 | ||
| Gas Utilities–0.08% | ||||
| Atmos Energy Corp., | ||||
| 5.90%, 11/15/2033(c) | 808,000 | 875,871 | ||
| 6.20%, 11/15/2053(c) | 595,000 | 673,450 | ||
| Infraestructura Energetica Nova, S.A.P.I. de C.V. (Mexico), 4.88%, 01/14/2048(b) | 400,000 | 316,996 | ||
| Piedmont Natural Gas Co., Inc., 5.40%, 06/15/2033 | 980,000 | 1,013,616 | ||
| Promigas S.A. ESP/Gases del Pacifico SAC (Colombia), 3.75%, 10/16/2029(b) | 400,000 | 367,937 | ||
| Southern Co. Gas Capital Corp., 5.75%, 09/15/2033 | 691,000 | 730,827 | ||
| Southwest Gas Corp., 5.45%, 03/23/2028(c) | 439,000 | 448,991 | ||
| 4,427,688 | ||||
| Gold–0.01% | ||||
| Endeavour Mining PLC (Burkina Faso), 5.00%, 10/14/2026(b) | 200,000 | 193,389 | ||
| New Gold, Inc. (Canada), 7.50%, 07/15/2027(b) | 250,000 | 252,580 | ||
| 445,969 | ||||
| Health Care Distributors–0.05% | ||||
| Cardinal Health, Inc., 5.45%, 02/15/2034 | 1,542,000 | 1,594,243 | ||
| Cencora, Inc., 5.13%, 02/15/2034(c) | 1,361,000 | 1,385,123 | ||
| 2,979,366 | ||||
| Health Care Equipment–0.11% | ||||
| Smith & Nephew PLC (United Kingdom), | ||||
| 5.15%, 03/20/2027 | 2,372,000 | 2,406,365 | ||
| 5.40%, 03/20/2034 | 3,764,000 | 3,843,038 | ||
| 6,249,403 | ||||
| 9 | Invesco Core Plus Bond Fund |
| Principal Amount | Value | |||
| Health Care Facilities–0.30% | ||||
| Adventist Health System, 5.76%, 12/01/2034 | $1,638,000 | $1,678,903 | ||
| CommonSpirit Health, | ||||
| 5.32%, 12/01/2034 | 5,069,000 | 5,186,039 | ||
| 5.55%, 12/01/2054(c) | 1,900,000 | 1,944,921 | ||
| Encompass Health Corp., 4.50%, 02/01/2028 | 250,000 | 244,612 | ||
| HCA, Inc., | ||||
| 5.45%, 09/15/2034 | 2,339,000 | 2,370,032 | ||
| 5.90%, 06/01/2053 | 1,246,000 | 1,264,511 | ||
| Providence St. Joseph Health Obligated Group, Series 21-A, 2.70%, 10/01/2051 | 2,227,000 | 1,372,632 | ||
| Tenet Healthcare Corp., 6.13%, 10/01/2028(c) | 500,000 | 501,382 | ||
| UPMC, | ||||
| 5.04%, 05/15/2033 | 1,480,000 | 1,500,641 | ||
| 5.38%, 05/15/2043 | 634,000 | 650,485 | ||
| 16,714,158 | ||||
| Health Care REITs–0.09% | ||||
| Alexandria Real Estate Equities, Inc., | ||||
| 5.25%, 05/15/2036 | 893,000 | 893,151 | ||
| 5.63%, 05/15/2054 | 3,963,000 | 3,908,196 | ||
| 4,801,347 | ||||
| Health Care Services–0.33% | ||||
| Catalent Pharma Solutions, Inc., 5.00%, 07/15/2027(b) | 250,000 | 248,871 | ||
| Community Health Systems, Inc., | ||||
| 8.00%, 12/15/2027(b) | 112,000 | 112,301 | ||
| 6.00%, 01/15/2029(b) | 150,000 | 142,643 | ||
| Concentra Escrow Issuer Corp., 6.88%, 07/15/2032(b) | 117,000 | 122,539 | ||
| CVS Health Corp., | ||||
| 5.00%, 01/30/2029(c) | 957,000 | 970,826 | ||
| 5.25%, 01/30/2031 | 125,000 | 127,141 | ||
| 5.30%, 06/01/2033(c) | 973,000 | 977,616 | ||
| DaVita, Inc., 6.88%, 09/01/2032(b) | 5,985,000 | 6,126,834 | ||
| Icon Investments Six DAC, | ||||
| 5.81%, 05/08/2027 | 2,399,000 | 2,461,071 | ||
| 5.85%, 05/08/2029 | 1,962,000 | 2,050,680 | ||
| 6.00%, 05/08/2034 | 2,556,000 | 2,693,073 | ||
| Piedmont Healthcare, Inc., 2.86%, 01/01/2052 | 1,266,000 | 858,108 | ||
| Prime Healthcare Services, Inc., 9.38%, 09/01/2029(b) | 153,000 | 154,373 | ||
| Quest Diagnostics, Inc., 6.40%, 11/30/2033 | 1,196,000 | 1,316,866 | ||
| 18,362,942 | ||||
| Health Care Supplies–0.44% | ||||
| Medline Borrower L.P./Medline Co-Issuer, Inc., 6.25%, 04/01/2029(b) | 250,000 | 258,019 | ||
| Principal Amount | Value | |||
| Health Care Supplies–(continued) | ||||
| Solventum Corp., | ||||
| 5.45%, 02/25/2027(b) | $3,035,000 | $3,078,149 | ||
| 5.40%, 03/01/2029(b) | 9,081,000 | 9,269,768 | ||
| 5.60%, 03/23/2034(b) | 5,044,000 | 5,144,646 | ||
| 5.90%, 04/30/2054(b)(c) | 2,882,000 | 2,918,010 | ||
| 6.00%, 05/15/2064(b) | 3,618,000 | 3,628,113 | ||
| 24,296,705 | ||||
| Highways & Railtracks–0.02% | ||||
| TransJamaican Highway Ltd. (Jamaica), 5.75%, 10/10/2036(b) | 1,201,872 | 1,095,957 | ||
| Home Improvement Retail–0.06% | ||||
| Home Depot, Inc. (The), 4.90%, 04/15/2029(c) | 2,024,000 | 2,080,085 | ||
| Lowe’s Cos., Inc., | ||||
| 5.75%, 07/01/2053 | 276,000 | 284,678 | ||
| 5.80%, 09/15/2062 | 291,000 | 296,949 | ||
| 5.85%, 04/01/2063 | 450,000 | 461,698 | ||
| 3,123,410 | ||||
| Homebuilding–0.08% | ||||
| D.R. Horton, Inc., 5.00%, 10/15/2034 | 4,341,000 | 4,333,622 | ||
| Taylor Morrison Communities, Inc., 5.75%, 01/15/2028(b) | 250,000 | 252,294 | ||
| 4,585,916 | ||||
| Hotel & Resort REITs–0.06% | ||||
| Phillips Edison Grocery Center Operating Partnership I L.P., 5.75%, 07/15/2034 | 1,283,000 | 1,322,112 | ||
| RHP Hotel Properties L.P./RHP Finance Corp., 4.50%, 02/15/2029(b) | 250,000 | 240,181 | ||
| RLJ Lodging Trust L.P., 3.75%, 07/01/2026(b) | 500,000 | 483,840 | ||
| Service Properties Trust, | ||||
| 4.75%, 10/01/2026 | 400,000 | 382,858 | ||
| 4.95%, 02/15/2027 | 473,000 | 439,034 | ||
| 5.50%, 12/15/2027 | 260,000 | 244,840 | ||
| 3,112,865 | ||||
| Hotels, Resorts & Cruise Lines–0.51% | ||||
| Carnival Corp., | ||||
| 6.00%, 05/01/2029(b) | 150,000 | 150,773 | ||
| 7.00%, 08/15/2029(b)(c) | 1,230,000 | 1,294,136 | ||
| Choice Hotels International, Inc., 5.85%, 08/01/2034(c) | 2,492,000 | 2,548,467 | ||
| Hilton Domestic Operating Co., Inc., | ||||
| 5.75%, 05/01/2028(b) | 275,000 | 275,677 | ||
| 5.88%, 04/01/2029(b)(c) | 1,796,000 | 1,831,500 | ||
| 6.13%, 04/01/2032(b) | 2,739,000 | 2,809,918 | ||
| Marriott International, Inc., | ||||
| 4.88%, 05/15/2029 | 870,000 | 880,760 | ||
| 4.80%, 03/15/2030 | 4,786,000 | 4,814,496 | ||
| 5.30%, 05/15/2034(c) | 1,462,000 | 1,487,337 | ||
| 5.35%, 03/15/2035 | 4,711,000 | 4,769,503 | ||
| 10 | Invesco Core Plus Bond Fund |
| Principal Amount | Value | |||
| Hotels, Resorts & Cruise Lines–(continued) | ||||
| Royal Caribbean Cruises Ltd., | ||||
| 5.50%, 04/01/2028(b)(c) | $500,000 | $504,174 | ||
| 6.25%, 03/15/2032(b)(c) | 1,719,000 | 1,776,317 | ||
| 6.00%, 02/01/2033(b) | 4,638,000 | 4,754,011 | ||
| 27,897,069 | ||||
| Housewares & Specialties–0.01% | ||||
| Newell Brands, Inc., 6.38%, 09/15/2027 | 250,000 | 251,967 | ||
| Independent Power Producers & Energy Traders–0.25% | ||||
| Clearway Energy Operating LLC, 4.75%, 03/15/2028(b) | 153,000 | 148,777 | ||
| Colbun S.A. (Chile), 3.95%, 10/11/2027(b) | 200,000 | 194,337 | ||
| Emirates SembCorp Water & Power Co. PJSC (United Arab Emirates), 4.45%, 08/01/2035(b) | 200,000 | 193,621 | ||
| EnfraGen Energia Sur S.A./EnfraGen Spain S.A./Prime Energia S.p.A. (Colombia), | ||||
| 5.38%, 12/30/2030(b) | 650,000 | 560,615 | ||
| 5.38%, 12/30/2030(b) | 3,375,000 | 2,910,884 | ||
| Vistra Corp., | ||||
| 7.00%(b)(d)(e) | 3,538,000 | 3,579,151 | ||
| Series C, 8.88%(b)(d)(e) | 5,922,000 | 6,301,476 | ||
| 13,888,861 | ||||
| Industrial Conglomerates–0.32% | ||||
| Honeywell International, Inc., | ||||
| 4.88%, 09/01/2029(c) | 3,330,000 | 3,419,347 | ||
| 4.95%, 09/01/2031 | 4,075,000 | 4,211,083 | ||
| 5.00%, 02/15/2033 | 483,000 | 497,325 | ||
| 5.00%, 03/01/2035 | 3,332,000 | 3,419,656 | ||
| 5.25%, 03/01/2054(c) | 909,000 | 923,242 | ||
| 5.35%, 03/01/2064 | 4,989,000 | 5,110,898 | ||
| Icahn Enterprises L.P./Icahn Enterprises Finance Corp., 9.00%, 06/15/2030(b) | 236,000 | 238,969 | ||
| 17,820,520 | ||||
| Industrial Machinery & Supplies & Components–0.12% | ||||
| Enpro, Inc., 5.75%, 10/15/2026 | 500,000 | 497,834 | ||
| ESAB Corp., 6.25%, 04/15/2029(b) | 500,000 | 514,271 | ||
| Ingersoll Rand, Inc., | ||||
| 5.20%, 06/15/2027 | 2,895,000 | 2,946,324 | ||
| 5.40%, 08/14/2028 | 278,000 | 286,568 | ||
| Nordson Corp., | ||||
| 5.60%, 09/15/2028 | 481,000 | 498,595 | ||
| 5.80%, 09/15/2033(c) | 802,000 | 855,423 | ||
| nVent Finance S.a.r.l. (United Kingdom), 5.65%, 05/15/2033 | 1,121,000 | 1,151,372 | ||
| 6,750,387 | ||||
| Industrial REITs–0.40% | ||||
| Cibanco S.A. Ibm/PLA Administradora Industrial S de RL de C.V. (Mexico), 4.96%, 07/18/2029(b) | 200,000 | 193,380 | ||
| Principal Amount | Value | |||
| Industrial REITs–(continued) | ||||
| LXP Industrial Trust, 6.75%, 11/15/2028 | $794,000 | $842,909 | ||
| Prologis L.P., | ||||
| 4.88%, 06/15/2028 | 873,000 | 888,742 | ||
| 5.13%, 01/15/2034 | 840,000 | 859,566 | ||
| 5.00%, 03/15/2034 | 4,956,000 | 5,013,196 | ||
| 5.00%, 01/31/2035 | 5,311,000 | 5,353,152 | ||
| 5.25%, 06/15/2053(c) | 1,878,000 | 1,863,297 | ||
| 5.25%, 03/15/2054 | 7,044,000 | 6,992,264 | ||
| 22,006,506 | ||||
| Insurance Brokers–0.08% | ||||
| Arthur J. Gallagher & Co., 6.75%, 02/15/2054 | 48,000 | 55,425 | ||
| AssuredPartners, Inc., 7.50%, 02/15/2032(b) | 1,233,000 | 1,258,670 | ||
| Marsh & McLennan Cos., Inc., | ||||
| 5.40%, 09/15/2033(c) | 1,429,000 | 1,509,416 | ||
| 5.45%, 03/15/2053 | 409,000 | 419,300 | ||
| 5.70%, 09/15/2053 | 1,278,000 | 1,359,890 | ||
| 4,602,701 | ||||
| Integrated Oil & Gas–0.91% | ||||
| BP Capital Markets America, Inc., 4.81%, 02/13/2033 | 602,000 | 602,483 | ||
| Ecopetrol S.A. (Colombia), | ||||
| 4.63%, 11/02/2031 | 136,000 | 115,136 | ||
| 8.38%, 01/19/2036 | 4,801,000 | 4,864,532 | ||
| Empresa Nacional del Petroleo (Chile), | ||||
| 6.15%, 05/10/2033(b) | 600,000 | 631,533 | ||
| 5.95%, 07/30/2034(b) | 2,578,000 | 2,681,865 | ||
| Eni S.p.A. (Italy), 5.50%, 05/15/2034(b) | 1,928,000 | 1,987,604 | ||
| Occidental Petroleum Corp., | ||||
| 5.00%, 08/01/2027 | 782,000 | 788,983 | ||
| 5.20%, 08/01/2029 | 2,445,000 | 2,480,841 | ||
| 5.38%, 01/01/2032 | 4,420,000 | 4,488,015 | ||
| 5.55%, 10/01/2034 | 2,160,000 | 2,196,189 | ||
| 6.45%, 09/15/2036 | 1,756,000 | 1,904,193 | ||
| 4.63%, 06/15/2045 | 925,000 | 763,643 | ||
| 6.05%, 10/01/2054(c) | 1,779,000 | 1,810,339 | ||
| Petroleos Mexicanos (Mexico), | ||||
| 8.75%, 06/02/2029 | 3,596,930 | 3,570,003 | ||
| 6.70%, 02/16/2032 | 4,851,000 | 4,182,917 | ||
| Saudi Arabian Oil Co. (Saudi Arabia), | ||||
| 3.50%, 04/16/2029(b) | 200,000 | 191,513 | ||
| 5.25%, 07/17/2034(b) | 3,765,000 | 3,851,421 | ||
| 5.75%, 07/17/2054(b)(c) | 5,425,000 | 5,453,481 | ||
| 5.88%, 07/17/2064(b) | 7,485,000 | 7,598,016 | ||
| 50,162,707 | ||||
| Integrated Telecommunication Services–0.39% | ||||
| AT&T, Inc., 5.40%, 02/15/2034 | 1,161,000 | 1,199,337 | ||
| British Telecommunications PLC (United Kingdom), 4.25%, 11/23/2081(b)(d) | 10,020,000 | 9,663,689 | ||
| Frontier Communications Holdings LLC, 5.88%, 10/15/2027(b) | 125,000 | 124,656 | ||
| IHS Holding Ltd. (Nigeria), 5.63%, 11/29/2026(b) | 206,000 | 200,212 | ||
| 11 | Invesco Core Plus Bond Fund |
| Principal Amount | Value | |||
| Integrated Telecommunication Services–(continued) | ||||
| Iliad Holding S.A.S. (France), | ||||
| 6.50%, 10/15/2026(b) | $500,000 | $504,810 | ||
| 7.00%, 10/15/2028(b) | 200,000 | 203,159 | ||
| 8.50%, 04/15/2031(b)(c) | 3,399,000 | 3,605,547 | ||
| Sitios Latinoamerica S.A.B. de C.V. (Brazil), 5.38%, 04/04/2032(b) | 200,000 | 191,016 | ||
| Turk Telekomunikasyon A.S. (Turkey), 7.38%, 05/20/2029(b) | 700,000 | 713,235 | ||
| Zegona Finance PLC (United Kingdom), 8.63%, 07/15/2029(b) | 5,038,000 | 5,242,984 | ||
| 21,648,645 | ||||
| Interactive Media & Services–0.82% | ||||
| Globo Comunicacao e Participacoes S.A. (Brazil), 5.50%, 01/14/2032(b) | 300,000 | 275,809 | ||
| Meta Platforms, Inc., | ||||
| 4.30%, 08/15/2029(c) | 6,466,000 | 6,511,741 | ||
| 4.55%, 08/15/2031(c) | 2,114,000 | 2,138,807 | ||
| 4.75%, 08/15/2034(c) | 9,099,000 | 9,159,636 | ||
| 5.40%, 08/15/2054 | 10,318,000 | 10,530,594 | ||
| 5.75%, 05/15/2063 | 1,269,000 | 1,353,467 | ||
| 5.55%, 08/15/2064(c) | 14,591,000 | 14,958,280 | ||
| Weibo Corp. (China), 3.38%, 07/08/2030 | 200,000 | 179,536 | ||
| 45,107,870 | ||||
| Investment Banking & Brokerage–1.38% | ||||
| Brookfield Finance, Inc. (Canada), 5.97%, 03/04/2054 | 1,498,000 | 1,579,165 | ||
| Charles Schwab Corp. (The), Series K, 5.00%(c)(d)(e) | 527,000 | 509,289 | ||
| Goldman Sachs Group, Inc. (The), | ||||
| 6.16% (SOFR + 0.79%), 12/09/2026(g) | 831,000 | 831,200 | ||
| 5.73%, 04/25/2030(d) | 3,058,000 | 3,188,165 | ||
| 5.05%, 07/23/2030(d) | 5,664,000 | 5,750,470 | ||
| 5.85%, 04/25/2035(d) | 3,573,000 | 3,775,853 | ||
| 5.33%, 07/23/2035(c)(d) | 4,533,000 | 4,619,975 | ||
| Series V, 4.13%(c)(d)(e) | 2,395,000 | 2,273,607 | ||
| Series W, 7.50%(c)(d)(e) | 12,728,000 | 13,587,306 | ||
| Series X, 7.50%(d)(e) | 14,486,000 | 15,233,347 | ||
| Morgan Stanley, | ||||
| 5.12%, 02/01/2029(d) | 321,000 | 326,700 | ||
| 5.16%, 04/20/2029(d) | 1,107,000 | 1,128,118 | ||
| 5.45%, 07/20/2029(d) | 567,000 | 584,571 | ||
| 6.41%, 11/01/2029(d) | 1,454,000 | 1,550,019 | ||
| 5.17%, 01/16/2030(d) | 1,182,000 | 1,206,572 | ||
| 5.04%, 07/19/2030(d) | 4,057,000 | 4,127,453 | ||
| 5.25%, 04/21/2034(d) | 157,000 | 159,724 | ||
| 5.42%, 07/21/2034(c)(d) | 1,126,000 | 1,157,363 | ||
| 5.47%, 01/18/2035(d) | 1,242,000 | 1,280,298 | ||
| 5.83%, 04/19/2035(d) | 3,079,000 | 3,258,103 | ||
| 5.32%, 07/19/2035(c)(d) | 6,274,000 | 6,411,328 | ||
| 5.95%, 01/19/2038(d) | 275,000 | 284,953 | ||
| 5.94%, 02/07/2039(d) | 2,937,000 | 3,032,857 | ||
| 75,856,436 | ||||
| Principal Amount | Value | ||
| Leisure Facilities–0.05% | |||
| Carnival Holdings Bermuda Ltd., 10.38%, 05/01/2028(b) | $338,000 | $365,883 | |
| NCL Corp. Ltd., | |||
| 5.88%, 02/15/2027(b) | 250,000 | 250,757 | |
| 8.13%, 01/15/2029(b) | 700,000 | 749,239 | |
| Six Flags Entertainment Corp./Six Flags Theme Parks, Inc., 6.63%, 05/01/2032(b) | 83,000 | 85,486 | |
| Viking Cruises Ltd., | |||
| 5.88%, 09/15/2027(b) | 250,000 | 249,891 | |
| 7.00%, 02/15/2029(b) | 500,000 | 506,831 | |
| Viking Ocean Cruises Ship VII Ltd., 5.63%, 02/15/2029(b) | 250,000 | 248,081 | |
| 2,456,168 | |||
| Leisure Products–0.09% | |||
| Brunswick Corp., | |||
| 5.85%, 03/18/2029(c) | 1,681,000 | 1,720,481 | |
| 5.10%, 04/01/2052(c) | 513,000 | 419,280 | |
| Polaris, Inc., 6.95%, 03/15/2029(c) | 2,388,000 | 2,562,164 | |
| 4,701,925 | |||
| Life & Health Insurance–1.84% | |||
| AIA Group Ltd. (Hong Kong), 5.38%, 04/05/2034(b)(c) | 4,177,000 | 4,246,963 | |
| Athene Global Funding, 5.58%, 01/09/2029(b) | 5,145,000 | 5,286,773 | |
| Athene Holding Ltd., 6.25%, 04/01/2054 | 2,232,000 | 2,319,869 | |
| Corebridge Global Funding, | |||
| 5.90%, 09/19/2028(b) | 1,229,000 | 1,283,050 | |
| 5.20%, 01/12/2029(b)(c) | 2,818,000 | 2,879,771 | |
| 5.20%, 06/24/2029(b) | 4,964,000 | 5,104,636 | |
| Delaware Life Global Funding, | |||
| Series 22-1, 3.31%, 03/10/2025(b) | 11,863,000 | 11,641,043 | |
| Series 21-1, 2.66%, 06/29/2026(b) | 31,380,000 | 29,795,509 | |
| F&G Annuities & Life, Inc., 7.40%, 01/13/2028 | 857,000 | 898,550 | |
| GA Global Funding Trust, 5.50%, 01/08/2029(b) | 1,373,000 | 1,409,291 | |
| MAG Mutual Holding Co., 4.75%, 04/30/2041(b)(i) | 27,101,000 | 24,236,966 | |
| MetLife, Inc., 5.25%, 01/15/2054 | 96,000 | 96,432 | |
| Metropolitan Life Global Funding I, 5.15%, 03/28/2033(b) | 1,271,000 | 1,305,594 | |
| Nippon Life Insurance Co. (Japan), 5.95%, 04/16/2054(b)(c)(d) | 4,942,000 | 5,131,012 | |
| Pacific Life Global Funding II, 6.18% (SOFR + 0.80%), 03/30/2025(b)(g) | 2,310,000 | 2,315,865 | |
| Pricoa Global Funding I, 4.65%, 08/27/2031(b)(c) | 2,984,000 | 2,982,389 | |
| Sumitomo Life Insurance Co. (Japan), 5.88%(b)(d)(e) | 204,000 | 209,857 | |
| 101,143,570 | |||
| Managed Health Care–0.13% | |||
| Humana, Inc., 5.75%, 12/01/2028 | 872,000 | 911,198 | |
| 12 | Invesco Core Plus Bond Fund |
| Principal Amount | Value | |||
| Managed Health Care–(continued) | ||||
| Kaiser Foundation Hospitals, | ||||
| Series 2021, 2.81%, 06/01/2041 | $136,000 | $102,970 | ||
| 3.00%, 06/01/2051 | 96,000 | 67,938 | ||
| UnitedHealth Group, Inc., | ||||
| 5.25%, 02/15/2028 | 663,000 | 687,411 | ||
| 5.30%, 02/15/2030 | 1,133,000 | 1,187,384 | ||
| 5.35%, 02/15/2033 | 969,000 | 1,014,568 | ||
| 5.63%, 07/15/2054 | 2,257,000 | 2,359,183 | ||
| 5.20%, 04/15/2063 | 456,000 | 442,144 | ||
| 5.75%, 07/15/2064 | 386,000 | 405,540 | ||
| 7,178,336 | ||||
| Marine Ports & Services–0.00% | ||||
| DP World Ltd. (United Arab Emirates), 6.85%, 07/02/2037(b) | 200,000 | 227,182 | ||
| Marine Transportation–0.21% | ||||
| A.P. Moller - Maersk A/S (Denmark), 5.88%, 09/14/2033(b)(c) | 992,000 | 1,050,542 | ||
| Stena International S.A. (Sweden), 7.63%, 02/15/2031(b) | 10,353,000 | 10,704,463 | ||
| 11,755,005 | ||||
| Metal, Glass & Plastic Containers–0.01% | ||||
| Ball Corp., 6.88%, 03/15/2028 | 250,000 | 259,014 | ||
| Clydesdale Acquisition Holdings, Inc., 6.63%, 04/15/2029(b) | 250,000 | 249,873 | ||
| 508,887 | ||||
| Movies & Entertainment–0.05% | ||||
| Netflix, Inc., 5.40%, 08/15/2054 | 835,000 | 870,915 | ||
| Walt Disney Co. (The), 6.55%, 03/15/2033 | 6,000 | 6,789 | ||
| Warnermedia Holdings, Inc., | ||||
| 5.05%, 03/15/2042 | 737,000 | 591,008 | ||
| 5.14%, 03/15/2052 | 488,000 | 371,449 | ||
| 5.39%, 03/15/2062 | 813,000 | 610,965 | ||
| 2,451,126 | ||||
| Multi-Family Residential REITs–0.21% | ||||
| AvalonBay Communities, Inc., 5.30%, 12/07/2033 | 1,896,000 | 1,951,234 | ||
| Essex Portfolio L.P., 5.50%, 04/01/2034 | 1,725,000 | 1,771,533 | ||
| Mid-America Apartments L.P., 5.30%, 02/15/2032 | 5,660,000 | 5,821,842 | ||
| UDR, Inc., 5.13%, 09/01/2034(c) | 1,865,000 | 1,858,591 | ||
| 11,403,200 | ||||
| Multi-Utilities–0.69% | ||||
| Abu Dhabi National Energy Co. PJSC (United Arab Emirates), 4.70%, 04/24/2033(b) | 400,000 | 404,248 | ||
| Algonquin Power & Utilities Corp. (Canada), 5.37%, 06/15/2026(c) | 1,826,000 | 1,839,893 | ||
| Principal Amount | Value | ||
| Multi-Utilities–(continued) | |||
| Ameren Illinois Co., 4.95%, 06/01/2033 | $675,000 | $684,212 | |
| Black Hills Corp., 6.15%, 05/15/2034 | 1,709,000 | 1,814,955 | |
| Dominion Energy, Inc., | |||
| 5.38%, 11/15/2032 | 920,000 | 947,961 | |
| Series B, 7.00%, 06/01/2054(d) | 3,091,000 | 3,295,729 | |
| Series A, 6.88%, 02/01/2055(d) | 2,360,000 | 2,459,715 | |
| DTE Electric Co., 5.20%, 03/01/2034 | 1,370,000 | 1,414,555 | |
| DTE Energy Co., | |||
| 4.95%, 07/01/2027 | 2,523,000 | 2,550,846 | |
| 5.85%, 06/01/2034 | 1,355,000 | 1,427,684 | |
| ENGIE S.A. (France), | |||
| 5.25%, 04/10/2029(b) | 1,934,000 | 1,985,017 | |
| 5.63%, 04/10/2034(b)(c) | 1,803,000 | 1,871,701 | |
| 5.88%, 04/10/2054(b)(c) | 1,773,000 | 1,830,813 | |
| NiSource, Inc., | |||
| 5.25%, 03/30/2028 | 306,000 | 312,931 | |
| 5.35%, 04/01/2034(c) | 2,576,000 | 2,630,891 | |
| 6.95%, 11/30/2054(d) | 4,644,000 | 4,716,688 | |
| Public Service Enterprise Group, Inc., 5.88%, 10/15/2028 | 2,244,000 | 2,348,326 | |
| Sempra, 6.88%, 10/01/2054(d) | 4,657,000 | 4,715,529 | |
| WEC Energy Group, Inc., 5.15%, 10/01/2027 | 520,000 | 530,875 | |
| 37,782,569 | |||
| Office REITs–0.51% | |||
| Boston Properties L.P., 5.75%, 01/15/2035(c) | 16,018,000 | 15,933,141 | |
| Brandywine Operating Partnership L.P., | |||
| 8.05%, 03/15/2028(c) | 2,592,000 | 2,760,189 | |
| 8.88%, 04/12/2029(c) | 3,859,000 | 4,197,230 | |
| Cousins Properties L.P., 5.88%, 10/01/2034 | 4,701,000 | 4,730,162 | |
| Office Properties Income Trust, 9.00%, 09/30/2029(b) | 309,000 | 251,764 | |
| 27,872,486 | |||
| Oil & Gas Drilling–0.05% | |||
| Delek Logistics Partners L.P./Delek Logistics Finance Corp., 7.13%, 06/01/2028(b)(c) | 500,000 | 504,244 | |
| Patterson-UTI Energy, Inc., 7.15%, 10/01/2033(c) | 839,000 | 910,055 | |
| Summit Midstream Holdings LLC, 8.63%, 10/31/2029(b) | 378,000 | 392,627 | |
| Transocean Poseidon Ltd., 6.88%, 02/01/2027(b) | 660,000 | 660,961 | |
| 2,467,887 | |||
| Oil & Gas Exploration & Production–0.94% | |||
| Aethon United BR L.P./Aethon United Finance Corp., 8.25%, 02/15/2026(b) | 488,000 | 495,107 | |
| Apache Corp., 7.75%, 12/15/2029 | 805,000 | 890,557 | |
| 13 | Invesco Core Plus Bond Fund |
| Principal Amount | Value | |||
| Oil & Gas Exploration & Production–(continued) | ||||
| Baytex Energy Corp. (Canada), 7.38%, 03/15/2032(b) | $5,099,000 | $5,285,063 | ||
| Civitas Resources, Inc., | ||||
| 8.38%, 07/01/2028(b) | 3,210,000 | 3,388,200 | ||
| 8.75%, 07/01/2031(b) | 4,017,000 | 4,340,075 | ||
| ConocoPhillips Co., | ||||
| 5.55%, 03/15/2054 | 1,498,000 | 1,540,768 | ||
| 5.70%, 09/15/2063 | 693,000 | 724,440 | ||
| Diamondback Energy, Inc., | ||||
| 5.20%, 04/18/2027(c) | 2,574,000 | 2,617,858 | ||
| 5.15%, 01/30/2030 | 2,865,000 | 2,932,329 | ||
| 5.40%, 04/18/2034 | 2,846,000 | 2,897,824 | ||
| 5.75%, 04/18/2054 | 2,273,000 | 2,275,524 | ||
| 5.90%, 04/18/2064 | 1,511,000 | 1,518,635 | ||
| Gran Tierra Energy, Inc. (Colombia), 9.50%, 10/15/2029(b) | 408,000 | 397,318 | ||
| Hilcorp Energy I L.P./Hilcorp Finance Co., | ||||
| 5.75%, 02/01/2029(b) | 500,000 | 496,493 | ||
| 6.88%, 05/15/2034(b) | 5,750,000 | 5,820,018 | ||
| Murphy Oil Corp., 6.38%, 07/15/2028(c) | 3,454,000 | 3,501,282 | ||
| SM Energy Co., 6.50%, 07/15/2028 | 500,000 | 503,188 | ||
| Southwestern Energy Co., 5.38%, 03/15/2030 | 2,002,000 | 1,985,827 | ||
| Tengizchevroil Finance Co. International Ltd. (Kazakhstan), 4.00%, 08/15/2026(b) | 200,000 | 194,068 | ||
| Transocean Titan Financing Ltd., 8.38%, 02/01/2028(b) | 3,462,000 | 3,593,293 | ||
| Uzbekneftegaz JSC (Uzbekistan), 4.75%, 11/16/2028(b) | 7,487,000 | 6,458,868 | ||
| 51,856,735 | ||||
| Oil & Gas Refining & Marketing–0.26% | ||||
| Cosan (Luxembourg) S.A. (Brazil), 7.50%, 06/27/2030(b) | 4,367,000 | 4,554,868 | ||
| CVR Energy, Inc., 8.50%, 01/15/2029(b) | 7,940,000 | 8,096,576 | ||
| Phillips 66 Co., 5.30%, 06/30/2033(c) | 1,029,000 | 1,053,599 | ||
| Puma International Financing S.A. (Singapore), 5.00%, 01/24/2026(b) | 200,000 | 196,948 | ||
| Raizen Fuels Finance S.A. (Brazil), | ||||
| 6.45%, 03/05/2034(b) | 270,000 | 284,761 | ||
| 6.95%, 03/05/2054(b) | 225,000 | 240,472 | ||
| 14,427,224 | ||||
| Oil & Gas Storage & Transportation–3.05% | ||||
| 6297782 LLC (Canada), | ||||
| 4.91%, 09/01/2027(b) | 2,017,000 | 2,021,794 | ||
| 5.03%, 10/01/2029(b) | 6,334,000 | 6,322,043 | ||
| 5.58%, 10/01/2034(b) | 6,544,000 | 6,518,199 | ||
| 6.18%, 10/01/2054(b) | 5,171,000 | 5,172,237 | ||
| Abu Dhabi Crude Oil Pipeline LLC (United Arab Emirates), 3.65%, 11/02/2029(b) | 200,000 | 193,702 | ||
| Principal Amount | Value | ||
| Oil & Gas Storage & Transportation–(continued) | |||
| Antero Midstream Partners L.P./Antero Midstream Finance Corp., 6.63%, 02/01/2032(b)(c) | $5,453,000 | $5,623,264 | |
| Blue Racer Midstream LLC/Blue Racer Finance Corp., | |||
| 7.00%, 07/15/2029(b)(c) | 1,751,000 | 1,822,416 | |
| 7.25%, 07/15/2032(b) | 1,750,000 | 1,836,674 | |
| Cheniere Energy Partners L.P., 5.95%, 06/30/2033 | 944,000 | 994,330 | |
| Columbia Pipelines Holding Co. LLC, 6.06%, 08/15/2026(b) | 457,000 | 466,764 | |
| Enbridge, Inc. (Canada), | |||
| 5.70%, 03/08/2033 | 992,000 | 1,034,846 | |
| 7.38%, 01/15/2083(d) | 742,000 | 751,822 | |
| 7.63%, 01/15/2083(c)(d) | 814,000 | 853,352 | |
| 8.50%, 01/15/2084(d) | 1,319,000 | 1,448,935 | |
| Series NC5, 8.25%, 01/15/2084(d) | 1,984,000 | 2,080,770 | |
| Energy Transfer L.P., | |||
| 6.10%, 12/01/2028 | 581,000 | 613,914 | |
| 6.40%, 12/01/2030 | 445,000 | 481,765 | |
| 6.55%, 12/01/2033 | 1,024,000 | 1,120,528 | |
| 5.55%, 05/15/2034 | 1,712,000 | 1,757,288 | |
| 5.95%, 05/15/2054(c) | 1,582,000 | 1,598,351 | |
| 8.00%, 05/15/2054(d) | 3,819,000 | 4,065,623 | |
| 6.05%, 09/01/2054 | 7,333,000 | 7,509,307 | |
| 7.13%, 10/01/2054(d) | 13,492,000 | 13,673,252 | |
| EQM Midstream Partners L.P., 4.50%, 01/15/2029(b) | 250,000 | 242,493 | |
| Genesis Energy L.P./Genesis Energy Finance Corp., 8.00%, 01/15/2027 | 750,000 | 768,487 | |
| GreenSaif Pipelines Bidco S.a.r.l. (Saudi Arabia), | |||
| 5.85%, 02/23/2036(b) | 5,540,000 | 5,715,383 | |
| 6.13%, 02/23/2038(b) | 2,540,000 | 2,655,067 | |
| 6.51%, 02/23/2042(b) | 5,385,000 | 5,734,525 | |
| 6.10%, 08/23/2042(b) | 7,240,000 | 7,429,511 | |
| Kinder Morgan, Inc., | |||
| 4.80%, 02/01/2033 | 490,000 | 479,125 | |
| 5.20%, 06/01/2033(c) | 1,068,000 | 1,071,048 | |
| Martin Midstream Partners L.P./Martin Midstream Finance Corp., 11.50%, 02/15/2028(b) | 250,000 | 273,898 | |
| MPLX L.P., 4.95%, 03/14/2052 | 429,000 | 379,914 | |
| New Fortress Energy, Inc., 6.50%, 09/30/2026(b) | 57,000 | 49,387 | |
| NGL Energy Operating LLC/NGL Energy Finance Corp., | |||
| 8.13%, 02/15/2029(b) | 375,000 | 383,821 | |
| 8.38%, 02/15/2032(b) | 5,396,000 | 5,558,161 | |
| Northern Natural Gas Co., 5.63%, 02/01/2054(b)(c) | 867,000 | 882,294 | |
| Northriver Midstream Finance L.P. (Canada), 6.75%, 07/15/2032(b) | 3,305,000 | 3,414,521 | |
| 14 | Invesco Core Plus Bond Fund |
| Principal Amount | Value | |||
| Oil & Gas Storage & Transportation–(continued) | ||||
| ONEOK, Inc., | ||||
| 5.65%, 11/01/2028(c) | $567,000 | $589,173 | ||
| 5.80%, 11/01/2030 | 792,000 | 837,060 | ||
| 6.05%, 09/01/2033(c) | 1,364,000 | 1,440,594 | ||
| 6.63%, 09/01/2053 | 1,939,000 | 2,137,593 | ||
| Sabine Pass Liquefaction LLC, 5.90%, 09/15/2037 | 762,000 | 803,811 | ||
| South Bow Canadian Infrastructure Holdings Ltd. (Canada), | ||||
| 7.50%, 03/01/2055(b)(d) | 5,311,000 | 5,475,243 | ||
| 7.63%, 03/01/2055(b)(d) | 5,262,000 | 5,375,791 | ||
| Tallgrass Energy Partners L.P./Tallgrass Energy Finance Corp., 7.38%, 02/15/2029(b) | 6,810,000 | 6,966,446 | ||
| Targa Resources Corp., | ||||
| 5.50%, 02/15/2035 | 1,857,000 | 1,886,147 | ||
| 6.25%, 07/01/2052 | 362,000 | 379,383 | ||
| TMS Issuer S.a.r.l. (Saudi Arabia), 5.78%, 08/23/2032(b) | 220,000 | 229,983 | ||
| Venture Global LNG, Inc., | ||||
| 8.13%, 06/01/2028(b) | 500,000 | 523,996 | ||
| 9.50%, 02/01/2029(b) | 5,388,000 | 6,075,315 | ||
| 7.00%, 01/15/2030(b) | 1,775,000 | 1,816,079 | ||
| 9.88%, 02/01/2032(b) | 4,267,000 | 4,743,304 | ||
| Western Midstream Operating L.P., | ||||
| 6.15%, 04/01/2033 | 944,000 | 992,650 | ||
| 5.45%, 11/15/2034 | 9,213,000 | 9,167,431 | ||
| Williams Cos., Inc. (The), | ||||
| 5.30%, 08/15/2028 | 2,570,000 | 2,639,864 | ||
| 4.80%, 11/15/2029(c) | 6,174,000 | 6,221,324 | ||
| 5.65%, 03/15/2033 | 1,019,000 | 1,058,865 | ||
| 5.15%, 03/15/2034 | 1,717,000 | 1,725,427 | ||
| 5.80%, 11/15/2054 | 3,469,000 | 3,545,149 | ||
| 167,629,439 | ||||
| Other Specialty Retail–0.01% | ||||
| PetSmart, Inc./PetSmart Finance Corp., 4.75%, 02/15/2028(b) | 250,000 | 239,412 | ||
| Tractor Supply Co., 5.25%, 05/15/2033(c) | 350,000 | 358,363 | ||
| 597,775 | ||||
| Packaged Foods & Meats–0.35% | ||||
| Campbell Soup Co., | ||||
| 5.30%, 03/20/2026(c) | 953,000 | 964,517 | ||
| 5.20%, 03/21/2029 | 1,554,000 | 1,597,639 | ||
| 5.40%, 03/21/2034 | 2,043,000 | 2,111,160 | ||
| Frigorifico Concepcion S.A. (Paraguay), 7.70%, 07/21/2028(b) | 900,000 | 594,351 | ||
| J.M. Smucker Co. (The), 6.20%, 11/15/2033(c) | 803,000 | 875,290 | ||
| Minerva (Luxembourg) S.A. (Brazil), | ||||
| 4.38%, 03/18/2031(b) | 6,665,000 | 5,793,225 | ||
| 8.88%, 09/13/2033(b) | 6,550,000 | 7,074,373 | ||
| 19,010,555 | ||||
| Principal Amount | Value | |||
| Paper & Plastic Packaging Products & Materials–0.24% | ||||
| Graphic Packaging International LLC, 6.38%, 07/15/2032(b)(c) | $5,972,000 | $6,113,411 | ||
| Sealed Air Corp., 7.25%, 02/15/2031(b)(c) | 1,516,000 | 1,595,047 | ||
| Smurfit Kappa Treasury Unlimited Co. (Ireland), | ||||
| 5.20%, 01/15/2030(b) | 1,932,000 | 1,977,120 | ||
| 5.44%, 04/03/2034(b) | 1,917,000 | 1,973,715 | ||
| 5.78%, 04/03/2054(b) | 1,661,000 | 1,748,003 | ||
| 13,407,296 | ||||
| Paper Products–0.01% | ||||
| Inversiones CMPC S.A. (Chile), 6.13%, 02/26/2034(b) | 225,000 | 237,777 | ||
| Suzano Austria GmbH (Brazil), 7.00%, 03/16/2047(b) | 205,000 | 221,966 | ||
| 459,743 | ||||
| Passenger Airlines–0.23% | ||||
| American Airlines Pass-Through Trust, Series 2021-1, Class A, 2.88%, 07/11/2034 | 169,623 | 147,215 | ||
| American Airlines, Inc./AAdvantage Loyalty IP Ltd., | ||||
| 5.50%, 04/20/2026(b) | 291,667 | 290,388 | ||
| 5.75%, 04/20/2029(b)(c) | 775,000 | 760,406 | ||
| British Airways Pass-Through Trust (United Kingdom), Series 2021-1, Class A, 2.90%, 03/15/2035(b) | 1,011,459 | 896,774 | ||
| Delta Air Lines, Inc./SkyMiles IP Ltd., | ||||
| 4.50%, 10/20/2025(b) | 192,709 | 191,987 | ||
| 4.75%, 10/20/2028(b) | 913,257 | 904,708 | ||
| United Airlines Pass-Through Trust, | ||||
| Series 2020-1, Class A, 5.88%, 10/15/2027 | 300,259 | 306,194 | ||
| Series 24-A, 5.88%, 02/15/2037 | 4,681,000 | 4,785,492 | ||
| Series AA, 5.45%, 02/15/2037 | 4,436,000 | 4,582,343 | ||
| 12,865,507 | ||||
| Passenger Ground Transportation–0.01% | ||||
| Uber Technologies, Inc., 6.25%, 01/15/2028(b) | 250,000 | 252,323 | ||
| Personal Care Products–0.09% | ||||
| Kenvue, Inc., | ||||
| 5.35%, 03/22/2026 | 237,000 | 240,506 | ||
| 5.05%, 03/22/2028(c) | 584,000 | 600,330 | ||
| 5.00%, 03/22/2030(c) | 1,998,000 | 2,068,512 | ||
| 4.90%, 03/22/2033 | 1,301,000 | 1,331,772 | ||
| 5.20%, 03/22/2063 | 575,000 | 575,797 | ||
| 4,816,917 | ||||
| Pharmaceuticals–0.41% | ||||
| AstraZeneca Finance LLC (United Kingdom), | ||||
| 4.85%, 02/26/2029 | 1,694,000 | 1,734,939 | ||
| 4.90%, 02/26/2031 | 1,924,000 | 1,978,024 | ||
| 15 | Invesco Core Plus Bond Fund |
| Principal Amount | Value | |||
| Pharmaceuticals–(continued) | ||||
| Bristol-Myers Squibb Co., | ||||
| 4.90%, 02/22/2029(c) | $961,000 | $985,689 | ||
| 5.90%, 11/15/2033 | 1,126,000 | 1,227,099 | ||
| 6.25%, 11/15/2053 | 768,000 | 867,043 | ||
| 6.40%, 11/15/2063 | 1,799,000 | 2,062,097 | ||
| Eli Lilly and Co., | ||||
| 4.70%, 02/09/2034 | 1,268,000 | 1,284,727 | ||
| 5.00%, 02/09/2054 | 40,000 | 39,864 | ||
| 5.05%, 08/14/2054(c) | 7,050,000 | 7,082,628 | ||
| 5.10%, 02/09/2064 | 2,142,000 | 2,138,804 | ||
| 5.20%, 08/14/2064(c) | 1,972,000 | 1,998,961 | ||
| Merck & Co., Inc., | ||||
| 5.00%, 05/17/2053(c) | 510,000 | 502,500 | ||
| 5.15%, 05/17/2063 | 355,000 | 353,893 | ||
| 22,256,268 | ||||
| Property & Casualty Insurance–0.23% | ||||
| Fairfax Financial Holdings Ltd. (Canada), | ||||
| 6.35%, 03/22/2054(b) | 2,427,000 | 2,536,045 | ||
| 6.10%, 03/15/2055(b) | 7,400,000 | 7,492,088 | ||
| Markel Group, Inc., 6.00%, 05/16/2054 | 1,899,000 | 1,969,731 | ||
| Travelers Cos., Inc. (The), 5.45%, 05/25/2053 | 492,000 | 515,374 | ||
| 12,513,238 | ||||
| Rail Transportation–0.10% | ||||
| Empresa de los Ferrocarriles del Estado (Chile), 3.83%, 09/14/2061(b) | 209,000 | 144,066 | ||
| Norfolk Southern Corp., | ||||
| 5.05%, 08/01/2030(c) | 934,000 | 963,601 | ||
| 5.55%, 03/15/2034 | 1,024,000 | 1,082,725 | ||
| 5.35%, 08/01/2054(c) | 651,000 | 653,960 | ||
| 5.95%, 03/15/2064 | 1,303,000 | 1,411,853 | ||
| Union Pacific Corp., 5.15%, 01/20/2063(c) | 1,109,000 | 1,082,798 | ||
| 5,339,003 | ||||
| Real Estate Development–0.31% | ||||
| Piedmont Operating Partnership L.P., | ||||
| 9.25%, 07/20/2028 | 10,542,000 | 11,661,486 | ||
| 6.88%, 07/15/2029(c) | 5,075,000 | 5,275,610 | ||
| 16,937,096 | ||||
| Regional Banks–0.22% | ||||
| Banco Internacional del Peru S.A.A. Interbank (Peru), 3.25%, 10/04/2026(b) | 200,000 | 192,523 | ||
| Citizens Financial Group, Inc., 5.64%, 05/21/2037(d) | 499,000 | 482,689 | ||
| M&T Bank Corp., 5.05%, 01/27/2034(c)(d) | 543,000 | 527,268 | ||
| Regions Financial Corp., 5.72%, 06/06/2030(d) | 4,369,000 | 4,484,751 | ||
| Principal Amount | Value | |||
| Regional Banks–(continued) | ||||
| Truist Financial Corp., | ||||
| 6.05%, 06/08/2027(c)(d) | $931,000 | $950,535 | ||
| 4.87%, 01/26/2029(d) | 564,000 | 565,492 | ||
| 7.16%, 10/30/2029(d) | 1,261,000 | 1,370,608 | ||
| 5.44%, 01/24/2030(d) | 1,066,000 | 1,093,752 | ||
| 4.92%, 07/28/2033(d) | 869,000 | 840,852 | ||
| 6.12%, 10/28/2033(d) | 534,000 | 568,202 | ||
| 5.87%, 06/08/2034(d) | 997,000 | 1,042,243 | ||
| 12,118,915 | ||||
| Reinsurance–0.36% | ||||
| Global Atlantic (Fin) Co., | ||||
| 4.70%, 10/15/2051(b)(d) | 5,724,000 | 5,380,976 | ||
| 6.75%, 03/15/2054(b) | 4,825,000 | 4,944,886 | ||
| 7.95%, 10/15/2054(b)(c)(d) | 3,506,000 | 3,595,210 | ||
| Swiss Re Subordinated Finance PLC (United Kingdom), 5.70%, 04/05/2035(b)(d) | 5,800,000 | 5,963,618 | ||
| 19,884,690 | ||||
| Renewable Electricity–0.04% | ||||
| Adani Green Energy Ltd. (India), 4.38%, 09/08/2024(b) | 200,000 | 200,243 | ||
| ENN Clean Energy International Investment Ltd. (China), 3.38%, 05/12/2026(b) | 200,000 | 193,256 | ||
| Idaho Power Co., 5.20%, 08/15/2034(c) | 1,475,000 | 1,500,602 | ||
| 1,894,101 | ||||
| Restaurants–0.12% | ||||
| Alsea S.A.B. de C.V. (Mexico), 7.75%, 12/14/2026(b) | 400,000 | 407,321 | ||
| Arcos Dorados B.V. (Brazil), 6.13%, 05/27/2029(b) | 322,000 | 322,089 | ||
| McDonald’s Corp., | ||||
| 4.80%, 08/14/2028(c) | 2,974,000 | 3,029,001 | ||
| 4.95%, 08/14/2033(c) | 2,483,000 | 2,542,083 | ||
| 5.45%, 08/14/2053 | 420,000 | 425,551 | ||
| 6,726,045 | ||||
| Retail REITs–0.28% | ||||
| Agree L.P., 5.63%, 06/15/2034 | 1,825,000 | 1,883,056 | ||
| Brixmor Operating Partnership L.P., 5.75%, 02/15/2035 | 1,504,000 | 1,557,113 | ||
| Kite Realty Group L.P., | ||||
| 4.95%, 12/15/2031 | 3,178,000 | 3,140,200 | ||
| 5.50%, 03/01/2034 | 608,000 | 616,763 | ||
| NNN REIT, Inc., | ||||
| 5.60%, 10/15/2033(c) | 624,000 | 641,999 | ||
| 5.50%, 06/15/2034 | 2,027,000 | 2,073,854 | ||
| Realty Income Corp., | ||||
| 5.63%, 10/13/2032(c) | 411,000 | 431,333 | ||
| 5.38%, 09/01/2054 | 1,555,000 | 1,534,822 | ||
| Regency Centers L.P., | ||||
| 5.25%, 01/15/2034(c) | 1,217,000 | 1,239,636 | ||
| 5.10%, 01/15/2035 | 1,975,000 | 1,982,096 | ||
| 15,100,872 | ||||
| Security & Alarm Services–0.01% | ||||
| Brink’s Co. (The), 6.50%, 06/15/2029(b)(c) | 500,000 | 517,833 | ||
| 16 | Invesco Core Plus Bond Fund |
| Principal Amount | Value | |||
| Self-Storage REITs–0.15% | ||||
| Extra Space Storage L.P., | ||||
| 5.70%, 04/01/2028 | $344,000 | $355,296 | ||
| 5.40%, 02/01/2034 | 2,246,000 | 2,287,475 | ||
| Public Storage Operating Co., | ||||
| 5.13%, 01/15/2029 | 243,000 | 250,662 | ||
| 5.10%, 08/01/2033(c) | 1,450,000 | 1,486,464 | ||
| 5.35%, 08/01/2053 | 3,591,000 | 3,626,778 | ||
| 8,006,675 | ||||
| Semiconductors–0.33% | ||||
| Foundry JV Holdco LLC, | ||||
| 5.90%, 01/25/2030(b) | 1,445,000 | 1,486,936 | ||
| 6.15%, 01/25/2032(b)(c) | 4,483,000 | 4,619,977 | ||
| 5.88%, 01/25/2034(b) | 2,094,000 | 2,104,581 | ||
| 6.25%, 01/25/2035(b) | 6,143,000 | 6,311,483 | ||
| 6.40%, 01/25/2038(b) | 1,335,000 | 1,383,495 | ||
| Micron Technology, Inc., 5.30%, 01/15/2031 | 1,438,000 | 1,474,851 | ||
| SK hynix, Inc. (South Korea), 6.38%, 01/17/2028(b) | 600,000 | 627,399 | ||
| 18,008,722 | ||||
| Single-Family Residential REITs–0.10% | ||||
| American Homes 4 Rent L.P., 5.50%, 07/15/2034 | 5,075,000 | 5,178,888 | ||
| Ashton Woods USA LLC/Ashton Woods Finance Co., 6.63%, 01/15/2028(b) | 250,000 | 252,039 | ||
| 5,430,927 | ||||
| Soft Drinks & Non-alcoholic Beverages–0.24% | ||||
| Coca-Cola Co. (The), | ||||
| 5.00%, 05/13/2034(c) | 2,867,000 | 2,981,783 | ||
| 5.30%, 05/13/2054 | 3,961,000 | 4,113,209 | ||
| 5.40%, 05/13/2064 | 6,053,000 | 6,271,240 | ||
| 13,366,232 | ||||
| Sovereign Debt–2.44% | ||||
| Abu Dhabi Government International Bond (United Arab Emirates), 5.50%, 04/30/2054(b) | 5,295,000 | 5,698,744 | ||
| Brazilian Government International Bond (Brazil), | ||||
| 6.13%, 01/22/2032 | 13,578,000 | 13,809,685 | ||
| 6.13%, 03/15/2034 | 10,613,000 | 10,747,803 | ||
| 7.13%, 05/13/2054 | 6,128,000 | 6,302,505 | ||
| Colombia Government International Bond (Colombia), | ||||
| 8.00%, 04/20/2033 | 200,000 | 213,050 | ||
| 7.50%, 02/02/2034 | 3,455,000 | 3,573,506 | ||
| Costa Rica Government International Bond (Costa Rica), 7.30%, 11/13/2054(b) | 3,624,000 | 3,928,660 | ||
| Dominican Republic International Bond (Dominican Republic), 4.50%, 01/30/2030(b) | 200,000 | 189,630 | ||
| Finance Department Government of Sharjah (United Arab Emirates), 6.13%, 03/06/2036(b) | 670,000 | 686,746 | ||
| Principal Amount | Value | ||
| Sovereign Debt–(continued) | |||
| Gabon Government International Bond (Gabon), 6.95%, 06/16/2025(b) | $800,000 | $752,410 | |
| Ghana Government International Bond (Ghana), 7.75%, 04/07/2029(b)(h) | 4,937,000 | 2,591,389 | |
| Guatemala Government Bond (Guatemala), | |||
| 6.05%, 08/06/2031(b) | 4,175,000 | 4,262,842 | |
| 7.05%, 10/04/2032(b) | 200,000 | 215,358 | |
| 6.55%, 02/06/2037(b) | 3,245,000 | 3,347,055 | |
| Israel Government International Bond (Israel), 4.50%, 01/17/2033 | 200,000 | 188,068 | |
| Mexico Government International Bond (Mexico), | |||
| 6.35%, 02/09/2035 | 3,380,000 | 3,519,356 | |
| 6.00%, 05/07/2036 | 6,890,000 | 6,956,571 | |
| 6.34%, 05/04/2053 | 5,761,000 | 5,663,351 | |
| 6.40%, 05/07/2054 | 7,564,000 | 7,491,150 | |
| Oman Government International Bond (Oman), | |||
| 6.00%, 08/01/2029(b) | 200,000 | 208,742 | |
| 6.25%, 01/25/2031(b) | 600,000 | 638,014 | |
| Peruvian Government International Bond (Peru), 5.38%, 02/08/2035 | 2,934,000 | 2,980,592 | |
| Philippine Government International Bond (Philippines), 5.18%, 09/05/2049 | 9,707,000 | 9,588,575 | |
| Republic of Poland Government International Bond (Poland), 5.50%, 03/18/2054 | 340,000 | 347,692 | |
| Republic of South Africa Government International Bond (South Africa), 5.75%, 09/30/2049 | 200,000 | 161,708 | |
| Romanian Government International Bond (Romania), | |||
| 5.25%, 11/25/2027(b) | 300,000 | 301,000 | |
| 6.63%, 02/17/2028(b) | 5,030,000 | 5,240,133 | |
| 5.88%, 01/30/2029(b) | 3,552,000 | 3,625,757 | |
| 3.63%, 03/27/2032(b) | 300,000 | 264,079 | |
| 7.13%, 01/17/2033(b) | 3,760,000 | 4,072,625 | |
| 7.63%, 01/17/2053(b) | 500,000 | 562,891 | |
| Saudi Government International Bond (Saudi Arabia), | |||
| 4.38%, 04/16/2029(b) | 415,000 | 414,796 | |
| 4.75%, 01/16/2030(b) | 5,116,000 | 5,200,445 | |
| 5.00%, 01/16/2034(b) | 4,841,000 | 4,934,649 | |
| 5.00%, 01/18/2053(b) | 200,000 | 185,903 | |
| 5.75%, 01/16/2054(b)(c) | 5,553,000 | 5,711,671 | |
| Serbia International Bond (Serbia), 6.50%, 09/26/2033(b) | 300,000 | 314,160 | |
| Trinidad & Tobago Government International Bond (Trinidad), 6.40%, 06/26/2034(b) | 8,505,000 | 8,691,047 | |
| Turkiye Government International Bond (Turkey), 7.63%, 05/15/2034 | 695,000 | 725,723 | |
| 134,308,081 | |||
| 17 | Invesco Core Plus Bond Fund |
| Principal Amount | Value | |||
| Specialized Consumer Services–0.02% | ||||
| Allwyn Entertainment Financing (UK) PLC (Czech Republic), 7.88%, 04/30/2029(b) | $350,000 | $364,679 | ||
| Carriage Services, Inc., 4.25%, 05/15/2029(b) | 800,000 | 739,475 | ||
| 1,104,154 | ||||
| Specialized Finance–0.26% | ||||
| Blackstone Private Credit Fund, 6.25%, 01/25/2031(b)(c) | 1,249,000 | 1,278,513 | ||
| Jefferson Capital Holdings LLC, 9.50%, 02/15/2029(b) | 1,987,000 | 2,121,706 | ||
| SMBC Aviation Capital Finance DAC (Ireland), | ||||
| 5.30%, 04/03/2029(b) | 3,420,000 | 3,482,756 | ||
| 5.55%, 04/03/2034(b) | 7,101,000 | 7,224,400 | ||
| 14,107,375 | ||||
| Specialty Chemicals–0.46% | ||||
| Eastman Chemical Co., 5.00%, 08/01/2029(c) | 2,350,000 | 2,385,589 | ||
| OCP S.A. (Morocco), 3.75%, 06/23/2031(b) | 200,000 | 179,218 | ||
| Sasol Financing USA LLC (South Africa), | ||||
| 4.38%, 09/18/2026(c) | 5,450,000 | 5,245,687 | ||
| 6.50%, 09/27/2028(c) | 300,000 | 294,695 | ||
| 8.75%, 05/03/2029(b)(c) | 6,740,000 | 7,043,819 | ||
| 5.50%, 03/18/2031 | 4,823,000 | 4,246,090 | ||
| Sociedad Quimica y Minera de Chile S.A. (Chile), 6.50%, 11/07/2033(b) | 5,326,000 | 5,740,826 | ||
| 25,135,924 | ||||
| Steel–0.10% | ||||
| Cleveland-Cliffs, Inc., | ||||
| 5.88%, 06/01/2027 | 250,000 | 249,830 | ||
| 4.63%, 03/01/2029(b)(c) | 500,000 | 469,443 | ||
| CSN Resources S.A. (Brazil), 8.88%, 12/05/2030(b) | 670,000 | 671,601 | ||
| Vale Overseas Ltd. (Brazil), 6.40%, 06/28/2054(c) | 4,145,000 | 4,235,676 | ||
| 5,626,550 | ||||
| Systems Software–0.06% | ||||
| Oracle Corp., | ||||
| 6.25%, 11/09/2032 | 1,191,000 | 1,298,336 | ||
| 4.90%, 02/06/2033 | 1,012,000 | 1,013,153 | ||
| 6.90%, 11/09/2052 | 843,000 | 982,653 | ||
| 3,294,142 | ||||
| Technology Hardware, Storage & Peripherals–0.01% | ||||
| Lenovo Group Ltd. (China), 6.54%, 07/27/2032(b) | 400,000 | 433,628 | ||
| Seagate HDD Cayman, 4.09%, 06/01/2029 | 275,000 | 261,979 | ||
| 695,607 | ||||
| Telecom Tower REITs–0.01% | ||||
| SBA Communications Corp., 3.13%, 02/01/2029 | 275,000 | 253,311 | ||
| Principal Amount | Value | |||
| Tobacco–0.33% | ||||
| B.A.T Capital Corp. (United Kingdom), | ||||
| 5.83%, 02/20/2031(c) | $767,000 | $805,334 | ||
| 6.00%, 02/20/2034(c) | 866,000 | 913,663 | ||
| 7.08%, 08/02/2043 | 292,000 | 325,881 | ||
| Philip Morris International, Inc., | ||||
| 5.00%, 11/17/2025 | 356,000 | 357,368 | ||
| 5.13%, 11/17/2027 | 1,092,000 | 1,116,661 | ||
| 4.88%, 02/15/2028 | 2,295,000 | 2,327,994 | ||
| 5.25%, 09/07/2028 | 1,695,000 | 1,744,951 | ||
| 4.88%, 02/13/2029(c) | 4,391,000 | 4,466,344 | ||
| 5.13%, 02/13/2031(c) | 1,175,000 | 1,205,749 | ||
| 5.75%, 11/17/2032(c) | 520,000 | 550,464 | ||
| 5.38%, 02/15/2033(c) | 2,543,000 | 2,623,703 | ||
| 5.63%, 09/07/2033 | 1,440,000 | 1,512,814 | ||
| 5.25%, 02/13/2034 | 14,000 | 14,320 | ||
| 17,965,246 | ||||
| Trading Companies & Distributors–0.38% | ||||
| AerCap Global Aviation Trust (Ireland), 6.50%, 06/15/2045(b)(d) | 5,382,000 | 5,369,514 | ||
| BlueLinx Holdings, Inc., 6.00%, 11/15/2029(b) | 526,000 | 506,319 | ||
| Fortress Transportation and Infrastructure Investors LLC, | ||||
| 5.50%, 05/01/2028(b) | 1,000,000 | 994,453 | ||
| 7.00%, 05/01/2031(b) | 3,594,000 | 3,769,668 | ||
| Mitsubishi Corp. (Japan), | ||||
| 5.00%, 07/02/2029(b) | 4,333,000 | 4,465,446 | ||
| 5.13%, 07/17/2034(b) | 5,506,000 | 5,676,273 | ||
| 20,781,673 | ||||
| Transaction & Payment Processing Services–0.18% | ||||
| Fiserv, Inc., | ||||
| 5.38%, 08/21/2028(c) | 2,327,000 | 2,401,803 | ||
| 5.63%, 08/21/2033 | 1,528,000 | 1,599,658 | ||
| 5.45%, 03/15/2034 | 4,492,000 | 4,632,696 | ||
| Mastercard, Inc., 4.85%, 03/09/2033(c) | 1,455,000 | 1,498,831 | ||
| 10,132,988 | ||||
| Wireless Telecommunication Services–0.20% | ||||
| Bharti Airtel Ltd. (India), 4.38%, 06/10/2025(b) | 200,000 | 198,884 | ||
| Liquid Telecommunications Financing PLC (South Africa), 5.50%, 09/04/2026(b) | 200,000 | 126,208 | ||
| SixSigma Networks Mexico S.A. de C.V. (Mexico), 7.50%, 05/02/2025(b) | 325,000 | 324,449 | ||
| Sprint Spectrum Co. LLC/Sprint Spectrum Co. II LLC/Sprint Spectrum Co. III LLC, | ||||
| 4.74%, 03/20/2025(b) | 270,375 | 269,640 | ||
| 5.15%, 03/20/2028(b) | 1,077,000 | 1,082,979 | ||
| T-Mobile USA, Inc., | ||||
| 5.65%, 01/15/2053 | 1,083,000 | 1,112,139 | ||
| 6.00%, 06/15/2054 | 571,000 | 617,095 | ||
| 18 | Invesco Core Plus Bond Fund |
| Principal Amount | Value | |||
| Wireless Telecommunication Services–(continued) | ||||
| Vodafone Group PLC (United Kingdom), | ||||
| 3.25%, 06/04/2081(d) | $250,000 | $239,440 | ||
| 4.13%, 06/04/2081(d) | 2,580,000 | 2,322,938 | ||
| 5.13%, 06/04/2081(d) | 6,245,000 | 4,910,859 | ||
| 11,204,631 | ||||
| Total U.S. Dollar Denominated Bonds & Notes (Cost $2,305,168,433) | 2,347,061,509 | |||
| U.S. Government Sponsored Agency Mortgage-Backed Securities–24.06% | ||||
| Collateralized Mortgage Obligations–0.65% | ||||
| Fannie Mae REMICs, | ||||
| IO, 7.00%, 05/25/2033(j) | 2,467 | 336 | ||
| 6.00%, 07/25/2033(j) | 2,114 | 293 | ||
| Freddie Mac Multifamily Structured Pass-Through Ctfs., | ||||
| Series K083, Class AM, 4.03%, 10/25/2028(k) | 4,736,000 | 4,693,266 | ||
| Series K085, Class AM, 4.06%, 10/25/2028(k) | 4,736,000 | 4,713,102 | ||
| Series K089, Class AM, 3.63%, 01/25/2029(k) | 8,018,000 | 7,851,580 | ||
| Series K088, Class AM, 3.76%, 01/25/2029(k) | 18,944,000 | 18,644,728 | ||
| 35,903,305 | ||||
| Federal Home Loan Mortgage Corp. (FHLMC)–1.87% | ||||
| 3.50%, 08/01/2026 | 57,722 | 56,774 | ||
| 7.00%, 05/01/2028 to 06/01/2032 | 208,248 | 216,379 | ||
| 6.00%, 03/01/2029 to 08/01/2053 | 59,393,397 | 61,011,115 | ||
| 7.50%, 05/01/2030 to 05/01/2035 | 206,474 | 211,546 | ||
| 8.50%, 08/01/2031 | 11,420 | 12,119 | ||
| 3.00%, 02/01/2032 | 875,218 | 845,400 | ||
| 6.50%, 08/01/2032 to 09/01/2036 | 53,486 | 55,884 | ||
| 8.00%, 08/01/2032 | 8,168 | 8,573 | ||
| 5.50%, 01/01/2034 to 07/01/2053 | 29,829,841 | 30,227,739 | ||
| 5.00%, 07/01/2034 to 06/01/2040 | 817,574 | 837,765 | ||
| 4.50%, 02/01/2040 to 10/01/2046 | 8,910,786 | 8,920,929 | ||
| ARM, 6.32% (1 yr. Refinitiv USD IBOR Consumer Cash Fallbacks + 2.06%), 12/01/2036(g) | 27,580 | 28,499 | ||
| 6.72% (1 yr. Refinitiv USD IBOR Consumer Cash Fallbacks + 2.29%), 02/01/2037(g) | 2,436 | 2,483 | ||
| 7.49% (1 yr. Refinitiv USD IBOR Consumer Cash Fallbacks + 1.88%), 05/01/2037(g) | 39,426 | 40,365 | ||
| 102,475,570 | ||||
| Principal Amount | Value | |||
| Federal National Mortgage Association (FNMA)–1.29% | ||||
| 6.50%, 07/01/2028 to 01/01/2037 | $31,333 | $32,497 | ||
| 7.50%, 02/01/2030 to 08/01/2037 | 280,083 | 290,272 | ||
| 9.50%, 04/01/2030 | 157 | 157 | ||
| 3.50%, 12/01/2030 to 05/01/2047 | 22,481,225 | 21,110,132 | ||
| 7.00%, 03/01/2032 to 02/01/2034 | 125,087 | 129,867 | ||
| 8.50%, 10/01/2032 | 18,219 | 19,055 | ||
| 5.50%, 04/01/2033 to 09/01/2053 | 32,549,414 | 32,940,562 | ||
| 8.00%, 04/01/2033 | 15,578 | 16,365 | ||
| 6.00%, 04/01/2037 to 10/01/2039 | 5,816 | 6,036 | ||
| 5.00%, 12/01/2039 | 250,920 | 256,884 | ||
| 3.00%, 08/01/2043 | 1,791,541 | 1,643,158 | ||
| 4.00%, 12/01/2048 | 14,964,241 | 14,429,117 | ||
| ARM, 6.88% (1 yr. U.S. Treasury Yield Curve Rate + 2.20%), 05/01/2035(g) | 41,852 | 43,455 | ||
| 5.98% (1 yr. Refinitiv USD IBOR Consumer Cash Fallbacks + 1.63%), 01/01/2037(g) | 24,689 | 25,545 | ||
| 6.43% (1 yr. Refinitiv USD IBOR Consumer Cash Fallbacks + 1.71%), 03/01/2038(g) | 13,165 | 13,352 | ||
| 70,956,454 | ||||
| Government National Mortgage Association (GNMA)–5.18% | ||||
| ARM, 4.63% (1 yr. U.S. Treasury Yield Curve Rate + 1.50%), 01/20/2025(g) | 474 | 472 | ||
| 5.00% (1 yr. U.S. Treasury Yield Curve Rate + 1.50%), 05/20/2025(g) | 402 | 401 | ||
| 5.50% (1 yr. U.S. Treasury Yield Curve Rate + 1.50%), 06/20/2025(g) | 509 | 507 | ||
| 8.00%, 08/15/2025 to 06/15/2026 | 961 | 962 | ||
| 6.56%, 01/15/2027 | 24,118 | 24,415 | ||
| 7.00%, 10/15/2028 to 09/15/2032 | 57,618 | 58,614 | ||
| 6.00%, 11/15/2028 to 02/15/2033 | 27,244 | 28,380 | ||
| 6.50%, 01/15/2029 to 09/15/2034 | 35,393 | 36,025 | ||
| 7.50%, 05/15/2031 to 05/15/2032 | 2,999 | 3,013 | ||
| 5.50%, 06/15/2035 | 16,781 | 17,281 | ||
| 5.00%, 07/15/2035 | 1,359 | 1,382 | ||
| 4.00%, 03/20/2048 | 2,640,332 | 2,532,468 | ||
| TBA, 4.50%, 09/01/2054(l) | 99,574,000 | 97,555,292 | ||
| 5.00%, 09/01/2054(l) | 23,000,000 | 22,961,816 | ||
| 5.50%, 09/01/2054(l) | 77,448,000 | 77,967,954 | ||
| 6.00%, 09/01/2054(l) | 82,162,000 | 83,388,039 | ||
| 284,577,021 | ||||
| 19 | Invesco Core Plus Bond Fund |
| Principal Amount | Value | |||
| Uniform Mortgage-Backed Securities–15.07% | ||||
| TBA, 2.50%, 09/01/2054(l) | $76,374,725 | $65,140,841 | ||
| 3.00%, 09/01/2054(l) | 21,000,000 | 18,633,000 | ||
| 3.50%, 09/01/2054(l) | 54,396,825 | 50,085,097 | ||
| 4.00%, 09/01/2054(l) | 49,704,000 | 47,170,020 | ||
| 4.50%, 09/01/2054(l) | 49,705,000 | 48,357,899 | ||
| 5.00%, 09/01/2054(l) | 263,998,388 | 262,139,401 | ||
| 5.50%, 09/01/2054(l) | 235,700,000 | 237,337,262 | ||
| 6.00%, 09/01/2054(l) | 97,170,520 | 98,969,380 | ||
| 827,832,900 | ||||
| Total U.S. Government Sponsored Agency Mortgage-Backed Securities (Cost $1,324,716,234) | 1,321,745,250 | |||
| Asset-Backed Securities–21.58% | ||||
| Adjustable Rate Mortgage Trust, | ||||
| Series 2004-2, Class 6A1, 0.71%, 02/25/2035(k) | 120,152 | 119,213 | ||
| Series 2005-1, Class 4A1, 5.48%, 05/25/2035(k) | 327,396 | 309,656 | ||
| AMSR Trust, Series 2021-SFR3, Class B, 1.73%, 10/17/2038(b) | 13,340,000 | 12,467,344 | ||
| Angel Oak Mortgage Trust, | ||||
| Series 2020-1, Class A1, 2.16%, 12/25/2059(b)(k) | 711,299 | 680,838 | ||
| Series 2020-3, Class A1, 1.69%, 04/25/2065(b)(k) | 2,842,141 | 2,652,305 | ||
| Series 2020-5, Class A1, 1.37%, 05/25/2065(b)(k) | 1,647,049 | 1,554,377 | ||
| Series 2021-3, Class A1, 1.07%, 05/25/2066(b)(k) | 2,477,396 | 2,122,110 | ||
| Series 2021-7, Class A1, 1.98%, 10/25/2066(b)(k) | 6,581,970 | 5,663,152 | ||
| Series 2022-1, Class A1, 2.88%, 12/25/2066(b)(k) | 12,049,683 | 11,176,531 | ||
| Series 2023-6, Class A1, 6.50%, 12/25/2067(b)(k) | 3,476,483 | 3,517,496 | ||
| Series 2024-2, Class A1, 5.99%, 01/25/2069(b)(k) | 13,986,464 | 14,096,735 | ||
| Series 2024-8, Class A1, 5.34%, 05/27/2069(b)(k) | 8,100,000 | 8,099,878 | ||
| Apidos CLO XII, Series 2013-12A, Class ARR, 6.38% (3 mo. Term SOFR + 1.08%), 04/15/2031(b)(g) | 8,114,786 | 8,114,827 | ||
| Apidos CLO XXV, Series 2016-25A, Class A1R2, 6.43% (3 mo. Term SOFR + 1.15%), 10/20/2031(b)(g) | 12,152,282 | 12,202,398 | ||
| Avis Budget Rental Car Funding (AESOP) LLC, | ||||
| Series 2022-1A, Class A, 3.83%, 08/21/2028(b) | 20,133,000 | 19,670,563 | ||
| Series 2022-1A, Class C, 4.84%, 08/21/2028(b) | 5,417,000 | 5,266,429 | ||
| Series 2023-1A, Class A, 5.25%, 04/20/2029(b) | 3,919,000 | 3,988,507 | ||
| Series 2023-2A, Class A, 5.20%, 10/20/2027(b) | 2,475,000 | 2,494,122 | ||
| Series 2023-4A, Class A, 5.49%, 06/20/2029(b) | 13,131,000 | 13,447,189 | ||
| Principal Amount | Value | ||
| Bain Capital Credit CLO Ltd., Series 2021-1A, Class A, 6.60% (3 mo. Term SOFR + 1.32%), 04/18/2034(b)(g) | $5,777,000 | $5,781,315 | |
| Banc of America Commercial Mortgage Trust, Series 2015-UBS7, Class AS, 3.99%, 09/15/2048(k) | 4,394,000 | 4,291,440 | |
| Bayview MSR Opportunity Master Fund Trust, | |||
| Series 2021-4, Class A3, 3.00%, 10/25/2051(b)(k) | 10,127,140 | 8,773,997 | |
| Series 2021-4, Class A4, 2.50%, 10/25/2051(b)(k) | 10,126,359 | 8,426,202 | |
| Series 2021-4, Class A8, 2.50%, 10/25/2051(b)(k) | 9,183,814 | 8,151,256 | |
| Series 2021-5, Class A1, 3.00%, 11/25/2051(b)(k) | 10,546,608 | 9,124,257 | |
| Series 2021-5, Class A2, 2.50%, 11/25/2051(b)(k) | 12,868,874 | 10,692,205 | |
| Bear Stearns Adjustable Rate Mortgage Trust, | |||
| Series 2003-6, Class 1A3, 7.37%, 08/25/2033(k) | 13,778 | 13,390 | |
| Series 2004-10, Class 21A1, 0.00%, 01/25/2035(f) | 216,937 | 207,534 | |
| Series 2006-1, Class A1, 0.65% (1 yr. U.S. Treasury Yield Curve Rate + 2.25%), 02/25/2036(g) | 128,164 | 121,325 | |
| Bear Stearns ALT-A Trust, Series 2004-11, Class 2A3, 5.69%, 11/25/2034(k) | 172,921 | 173,829 | |
| Benchmark Mortgage Trust, | |||
| Series 2018-B3, Class C, 4.67%, 04/10/2051(k) | 6,921,000 | 5,740,551 | |
| Series 2019-B14, Class A5, 3.05%, 12/15/2062 | 16,455,000 | 15,114,888 | |
| Series 2019-B15, Class B, 3.56%, 12/15/2072 | 12,220,000 | 10,129,896 | |
| BMO Mortgage Trust, Series 2024-5C5, Class AS, 6.36%, 02/15/2057(k) | 2,500,000 | 2,610,038 | |
| BRAVO Residential Funding Trust, Series 2021-NQM2, Class A1, 0.97%, 03/25/2060(b)(k) | 1,769,148 | 1,672,973 | |
| BX Commercial Mortgage Trust, | |||
| Series 2021-ACNT, Class A, 6.30% (1 mo. Term SOFR + 0.96%), 11/15/2038(b)(g) | 6,247,258 | 6,191,313 | |
| Series 2021-VOLT, Class C, 6.55% (1 mo. Term SOFR + 1.21%), 09/15/2036(b)(g) | 5,345,000 | 5,243,821 | |
| Series 2021-VOLT, Class D, 7.10% (1 mo. Term SOFR + 1.76%), 09/15/2036(b)(g) | 12,367,000 | 12,181,515 | |
| 20 | Invesco Core Plus Bond Fund |
| Principal Amount | Value | ||
| BX Trust, | |||
| Series 2022-CLS, Class A, 5.76%, 10/13/2027(b) | $4,640,000 | $4,662,356 | |
| Series 2022-LBA6, Class A, 6.34% (1 mo. Term SOFR + 1.00%), 01/15/2039(b)(g) | 10,965,000 | 10,874,096 | |
| Series 2022-LBA6, Class B, 6.64% (1 mo. Term SOFR + 1.30%), 01/15/2039(b)(g) | 6,790,000 | 6,691,280 | |
| Series 2022-LBA6, Class C, 6.94% (1 mo. Term SOFR + 1.60%), 01/15/2039(b)(g) | 3,630,000 | 3,582,203 | |
| Carlyle Global Market Strategies CLO Ltd. (Cayman Islands), | |||
| Series 2015-4A, Class A1RR, 6.50% (3 mo. Term SOFR + 1.22%), 07/20/2032(b)(g) | 9,113,000 | 9,131,108 | |
| Series 2015-5A, Class A1R3, 6.38% (3 mo. Term SOFR + 1.10%), 01/20/2032(b)(g) | 4,612,476 | 4,615,160 | |
| Carlyle US CLO Ltd., Series 2021-1A, Class A1, 6.70% (3 mo. Term SOFR + 1.40%), 04/15/2034(b)(g) | 9,782,000 | 9,789,698 | |
| Chase Home Lending Mortgage Trust, Series 2019-ATR2, Class A3, 3.50%, 07/25/2049(b)(k) | 3,732,973 | 3,376,560 | |
| Chase Mortgage Finance Corp., | |||
| Series 2016-SH1, Class M3, 3.75%, 04/25/2045(b)(k) | 913,237 | 830,207 | |
| Series 2016-SH2, Class M2, 3.75%, 12/25/2045(b)(k) | 3,620,100 | 3,329,804 | |
| Series 2016-SH2, Class M3, 3.75%, 12/25/2045(b)(k) | 1,795,575 | 1,630,666 | |
| CIFC Funding Ltd., Series 2016-1A, Class ARR, 6.62% (3 mo. Term SOFR + 1.34%), 10/21/2031(b)(g) | 4,761,000 | 4,766,585 | |
| Citigroup Commercial Mortgage Trust, | |||
| Series 2014-GC23, Class B, 4.18%, 07/10/2047(k) | 1,546,756 | 1,517,889 | |
| Series 2015-GC27, Class A5, 3.14%, 02/10/2048 | 1,233,335 | 1,227,632 | |
| Citigroup Mortgage Loan Trust, Inc., | |||
| Series 2004-UST1, Class A4, 7.38%, 08/25/2034(k) | 68,665 | 65,040 | |
| Series 2021-INV3, Class A3, 2.50%, 05/25/2051(b)(k) | 10,173,119 | 8,459,017 | |
| Series 2024-1, Class A3A, 6.00%, 07/25/2054(b)(k) | 11,157,096 | 11,200,330 | |
| COLT Mortgage Loan Trust, | |||
| Series 2021-5, Class A1, 1.73%, 11/26/2066(b)(k) | 4,505,916 | 3,986,781 | |
| Series 2022-1, Class A1, 2.28%, 12/27/2066(b)(k) | 6,918,453 | 6,248,508 | |
| Series 2022-2, Class A1, 2.99%, 02/25/2067(b)(k) | 6,864,380 | 6,466,664 | |
| Series 2022-3, Class A1, 3.90%, 02/25/2067(b)(k) | 9,672,678 | 9,412,658 | |
| Commercial Mortgage Trust, Series 2015-CR25, Class B, 4.67%, 08/10/2048(k) | 5,267,000 | 5,121,343 | |
| Countrywide Home Loans Mortgage Pass-Through Trust, Series 2007-13, Class A10, 6.00%, 08/25/2037 | 187,874 | 95,687 | |
| Principal Amount | Value | ||
| Credit Suisse Mortgage Capital Trust, | |||
| Series 2021-NQM1, Class A1, 0.81%, 05/25/2065(b)(k) | $1,487,435 | $1,327,857 | |
| Series 2021-NQM2, Class A1, 1.18%, 02/25/2066(b)(k) | 2,143,364 | 1,893,827 | |
| Series 2022-ATH1, Class A1A, 2.87%, 01/25/2067(b)(k) | 9,055,304 | 8,593,180 | |
| Series 2022-ATH1, Class A1B, 3.35%, 01/25/2067(b)(k) | 5,772,399 | 5,162,823 | |
| Series 2022-ATH2, Class A1, 4.55%, 05/25/2067(b)(k) | 9,819,459 | 9,744,039 | |
| Cross Mortgage Trust, Series 2024-H2, Class A1, 6.09%, 04/25/2069(b)(k) | 7,305,709 | 7,392,086 | |
| CSAIL Commercial Mortgage Trust, Series 2020-C19, Class A3, 2.56%, 03/15/2053 | 22,374,000 | 19,485,749 | |
| CSFB Mortgage-Backed Pass-Through Ctfs., Series 2004-AR5, Class 3A1, 4.77%, 06/25/2034(k) | 411,818 | 386,027 | |
| DB Master Finance LLC, | |||
| Series 2019-1A, Class A23, 4.35%, 05/20/2049(b) | 9,699,500 | 9,427,091 | |
| Series 2019-1A, Class A2II, 4.02%, 05/20/2049(b) | 10,245,750 | 10,065,104 | |
| Deutsche Mortgage Securities, Inc. Re-REMIC Trust Ctfs., Series 2007-WM1, Class A1, 4.57%, 06/27/2037(b)(k) | 3,110,137 | 2,732,224 | |
| Domino’s Pizza Master Issuer LLC, Series 2019-1A, Class A2, 3.67%, 10/25/2049(b) | 18,587,520 | 17,476,299 | |
| Dryden 93 CLO Ltd., Series 2021-93A, Class A1A, 6.64% (3 mo. Term SOFR + 1.34%), 01/15/2034(b)(g) | 3,239,313 | 3,232,925 | |
| Ellington Financial Mortgage Trust, | |||
| Series 2019-2, Class A1, 2.74%, 11/25/2059(b)(k) | 1,802,023 | 1,741,928 | |
| Series 2020-1, Class A1, 2.01%, 05/25/2065(b)(k) | 278,539 | 272,757 | |
| Series 2021-1, Class A1, 0.80%, 02/25/2066(b)(k) | 762,885 | 652,115 | |
| Series 2022-1, Class A1, 2.21%, 01/25/2067(b)(k) | 6,808,763 | 5,916,068 | |
| Series 2022-3, Class A1, 5.00%, 08/25/2067(b)(k) | 9,145,221 | 9,207,416 | |
| Empower CLO Ltd., Series 2024-1A, Class A1, 6.91% (3 mo. Term SOFR + 1.60%), 04/25/2037(b)(g) | 10,250,000 | 10,309,880 | |
| Enterprise Fleet Financing LLC, | |||
| Series 2024-2, Class A3, 5.61%, 04/20/2028(b) | 1,710,000 | 1,752,654 | |
| Series 2024-2, Class A4, 5.69%, 12/20/2030(b) | 1,991,000 | 2,059,197 | |
| Extended Stay America Trust, Series 2021-ESH, Class B, 6.83% (1 mo. Term SOFR + 1.49%), 07/15/2038(b)(g) | 4,628,504 | 4,593,556 | |
| 21 | Invesco Core Plus Bond Fund |
| Principal Amount | Value | ||
| Flagstar Mortgage Trust, | |||
| Series 2021-11IN, Class A6, 3.70%, 11/25/2051(b)(k) | $15,508,484 | $13,727,755 | |
| Series 2021-8INV, Class A6, 2.50%, 09/25/2051(b)(k) | 3,284,505 | 2,915,424 | |
| Frontier Issuer LLC, Series 2023-1, Class A2, 6.60%, 08/20/2053(b) | 11,786,710 | 12,076,095 | |
| GCAT Trust, | |||
| Series 2019-NQM3, Class A1, 3.69%, 11/25/2059(b)(k) | 1,080,027 | 1,045,590 | |
| Series 2020-NQM2, Class A1, 2.56%, 04/25/2065(b)(k) | 934,416 | 881,713 | |
| GMACM Mortgage Loan Trust, Series 2006-AR1, Class 1A1, 3.36%, 04/19/2036(k) | 367,445 | 298,183 | |
| GoldenTree Loan Management US CLO 5 Ltd., Series 2019-5A, Class ARR, 6.34% (3 mo. Term SOFR + 1.07%), 10/20/2032(b)(g) | 6,576,000 | 6,581,136 | |
| Golub Capital Partners CLO 40(B) Ltd., Series 2019-40A, Class AR, 6.64% (3 mo. Term SOFR + 1.35%), 01/25/2032(b)(g) | 12,697,661 | 12,718,676 | |
| GS Mortgage Securities Trust, | |||
| Series 2020-GC45, Class A5, 2.91%, 02/13/2053 | 8,325,000 | 7,602,374 | |
| Series 2020-GC47, Class A5, 2.38%, 05/12/2053 | 8,750,000 | 7,692,533 | |
| GS Mortgage-Backed Securities Trust, Series 2021-INV1, Class A6, 2.50%, 12/25/2051(b)(k) | 8,330,973 | 7,382,863 | |
| GSR Mortgage Loan Trust, Series 2005-AR6, Class 3A2, 4.96%, 09/25/2035(k) | 90,340 | 81,801 | |
| HarborView Mortgage Loan Trust, Series 2005-9, Class 2A1C, 6.35% (1 mo. Term SOFR + 1.01%), 06/20/2035(g) | 11,584 | 10,778 | |
| Hertz Vehicle Financing III L.P., | |||
| Series 2021-2A, Class A, 1.68%, 12/27/2027(b) | 3,927,000 | 3,674,127 | |
| Series 2021-2A, Class B, 2.12%, 12/27/2027(b) | 2,100,000 | 1,955,130 | |
| Hertz Vehicle Financing LLC, Series 2021-1A, Class B, 1.56%, 12/26/2025(b) | 859,333 | 851,168 | |
| HPEFS Equipment Trust, Series 2023-2A, Class A2, 6.04%, 01/21/2031(b) | 2,986,570 | 2,997,201 | |
| ICG US CLO Ltd., Series 2016-1A, Class A1RR, 6.78% (3 mo. Term SOFR + 1.51%), 04/29/2034(b)(g) | 11,399,000 | 11,412,485 | |
| Invitation Homes Trust, Series 2024-SFR1, Class A, 4.00%, 09/17/2029(b) | 3,485,000 | 3,363,256 | |
| IP Lending IV Ltd., Series 2022-4A, Class SNR, 6.05%, 04/28/2027(b)(i) | 12,002,000 | 11,569,928 | |
| Principal Amount | Value | ||
| IP Lending VII Ltd., Series 2022-7A, Class SNR, 8.00%, 10/11/2027(b)(i) | $15,459,000 | $15,479,097 | |
| Jimmy John’s Funding LLC, Series 2017-1A, Class A2II, 4.85%, 07/30/2047(b) | 5,487,000 | 5,405,214 | |
| JP Morgan Mortgage Trust, | |||
| Series 2005-A3, Class 1A1, 6.07%, 06/25/2035(k) | 69,411 | 70,085 | |
| Series 2005-A5, Class 1A2, 5.10%, 08/25/2035(k) | 70,788 | 67,624 | |
| Series 2007-A4, Class 3A1, 5.46%, 06/25/2037(k) | 310,156 | 241,483 | |
| Series 20153, Class B2, 3.59%, 05/25/2045(b)(k) | 3,499,648 | 3,279,762 | |
| Series 2021-LTV2, Class A1, 2.52%, 05/25/2052(b)(k) | 11,357,141 | 9,468,357 | |
| Series 2024-8, Class A3, 5.50%, 01/25/2055(b)(k) | 2,840,000 | 2,836,894 | |
| Series 2024-VIS1, Class A1, 5.99%, 07/25/2064(b)(k) | 9,117,163 | 9,257,884 | |
| JPMBB Commercial Mortgage Securities Trust, | |||
| Series 2015-C31, Class A3, 3.80%, 08/15/2048 | 888,162 | 873,403 | |
| Series 2016-C1, Class B, 4.86%, 03/17/2049(k) | 5,083,000 | 4,909,645 | |
| JPMDB Commercial Mortgage Securities Trust, Series 2020-COR7, Class A5, 2.18%, 05/13/2053 | 6,200,000 | 5,088,701 | |
| KKR CLO 15 Ltd., Series 15, Class A1R2, 6.32% (3 mo. Term SOFR + 1.10%), 01/18/2032(b)(g) | 10,233,000 | 10,237,881 | |
| Lehman Mortgage Trust, Series 2006-1, Class 3A5, 5.50%, 02/25/2036 | 90,200 | 65,964 | |
| Life Mortgage Trust, | |||
| Series 2021-BMR, Class A, 6.15% (1 mo. Term SOFR + 0.81%), 03/15/2038(b)(g) | 5,389,347 | 5,294,276 | |
| Series 2021-BMR, Class B, 6.33% (1 mo. Term SOFR + 0.99%), 03/15/2038(b)(g) | 8,744,305 | 8,539,942 | |
| Series 2021-BMR, Class C, 6.55% (1 mo. Term SOFR + 1.21%), 03/15/2038(b)(g) | 3,668,246 | 3,570,475 | |
| Madison Park Funding XXXIII Ltd., Series 2019-33A, Class AR, 6.59% (3 mo. Term SOFR + 1.29%), 10/15/2032(b)(g) | 9,247,000 | 9,255,433 | |
| Mello Mortgage Capital Acceptance Trust, | |||
| Series 2021-INV2, Class A4, 2.50%, 08/25/2051(b)(k) | 6,481,485 | 5,738,028 | |
| Series 2021-INV3, Class A4, 2.50%, 10/25/2051(b)(k) | 6,295,459 | 5,566,046 | |
| Merrill Lynch Mortgage Investors Trust, | |||
| Series 2005-3, Class 3A, 2.39%, 11/25/2035(k) | 270,101 | 253,211 | |
| Series 2005-A5, Class A9, 5.22%, 06/25/2035(k) | 352,959 | 338,455 | |
| 22 | Invesco Core Plus Bond Fund |
| Principal Amount | Value | ||
| MFA Trust, Series 2021-INV2, Class A1, 1.91%, 11/25/2056(b)(k) | $7,977,156 | $6,991,745 | |
| MHP Commercial Mortgage Trust, | |||
| Series 2021-STOR, Class A, 6.15% (1 mo. Term SOFR + 0.81%), 07/15/2038(b)(g) | 5,810,000 | 5,750,078 | |
| Series 2021-STOR, Class B, 6.35% (1 mo. Term SOFR + 1.01%), 07/15/2038(b)(g) | 4,355,000 | 4,287,865 | |
| Morgan Stanley Bank of America Merrill Lynch Trust, Series 2015-C25, Class B, 4.67%, 10/15/2048(k) | 15,769,000 | 15,032,930 | |
| Morgan Stanley Capital I Trust, | |||
| Series 2014-150E, Class C, 4.44%, 09/09/2032(b)(k) | 3,350,000 | 2,010,000 | |
| Series 2019-L2, Class A4, 4.07%, 03/15/2052 | 17,430,000 | 16,792,892 | |
| Series 2019-L3, Class AS, 3.49%, 11/15/2052 | 10,950,000 | 10,060,016 | |
| Morgan Stanley Residential Mortgage Loan Trust, Series 2024-3, Class A1, 6.00%, 07/25/2054(b)(k) | 8,882,000 | 8,927,520 | |
| Natixis Commercial Mortgage Securities Trust, Series 2018-285M, Class E, 3.92%, 11/15/2032(b)(k) | 6,250,000 | 4,795,312 | |
| Neuberger Berman Loan Advisers CLO 49 Ltd., Series 2022-49A, Class AR, 6.43% (3 mo. Term SOFR + 1.15%), 07/25/2035(b)(g) | 10,044,000 | 10,052,357 | |
| New Residential Mortgage Loan Trust, | |||
| Series 2019-NQM4, Class A1, 2.49%, 09/25/2059(b)(k) | 1,452,322 | 1,369,605 | |
| Series 2020-NQM1, Class A1, 2.46%, 01/26/2060(b)(k) | 2,390,398 | 2,231,017 | |
| Series 2022-NQM2, Class A1, 3.08%, 03/27/2062(b)(k) | 6,675,685 | 6,242,396 | |
| OBX Trust, | |||
| Series 2019-EXP1, Class 1A3, 4.00%, 01/25/2059(b)(k) | 212,166 | 206,313 | |
| Series 2021-NQM4, Class A1, 1.96%, 10/25/2061(b)(k) | 9,906,896 | 8,405,194 | |
| Series 2022-NQM1, Class A1, 2.31%, 11/25/2061(b)(k) | 8,312,246 | 7,414,639 | |
| Series 2022-NQM2, Class A1B, 3.38%, 01/25/2062(b)(k) | 7,063,333 | 6,399,144 | |
| Oceanview Mortgage Trust, Series 2021-3, Class A5, 2.50%, 07/25/2051(b)(k) | 7,176,135 | 6,374,350 | |
| Principal Amount | Value | ||
| OCP CLO Ltd. (Cayman Islands), | |||
| Series 2014-7A, Class A1RR, 6.66% (3 mo. Term SOFR + 1.38%), 07/20/2029(b)(g) | $4,249,441 | $4,254,774 | |
| Series 2017-13A, Class A1AR, 6.52% (3 mo. Term SOFR + 1.22%), 07/15/2030(b)(g) | 7,380,043 | 7,389,143 | |
| Series 2020-8RA, Class A1, 6.77% (3 mo. Term SOFR + 1.48%), 01/17/2032(b)(g) | 17,340,786 | 17,384,884 | |
| One Bryant Park Trust, Series 2019-OBP, Class A, 2.52%, 09/15/2054(b) | 21,801,000 | 19,240,957 | |
| PPM CLO 3 Ltd., Series 2019-3A, Class AR, 6.64% (3 mo. Term SOFR + 1.35%), 04/17/2034(b)(g) | 9,626,000 | 9,634,413 | |
| Progress Residential Trust, | |||
| Series 2021-SFR10, Class A, 2.39%, 12/17/2040(b) | 6,874,816 | 6,276,167 | |
| Series 2022-SFR5, Class A, 4.45%, 06/17/2039(b) | 9,469,271 | 9,390,359 | |
| Provident Home Equity Loan Trust, Series 2000-2, Class A1, 5.93% (1 mo. Term SOFR + 0.65%), 08/25/2031(g) | 89,764 | 83,885 | |
| Qdoba Funding LLC, Series 2023-1A, Class A2, 8.50%, 09/14/2053(b) | 13,584,953 | 14,455,308 | |
| Regatta XIII Funding Ltd., Series 2018-2A, Class A1R, 6.40% (3 mo. Term SOFR + 1.10%), 07/15/2031(b)(g) | 8,840,920 | 8,852,405 | |
| Residential Mortgage Loan Trust, | |||
| Series 2019-3, Class A1, 2.63%, 09/25/2059(b)(k) | 125,682 | 124,146 | |
| Series 2020-1, Class A1, 2.38%, 01/26/2060(b)(k) | 408,683 | 398,948 | |
| RUN Trust, Series 2022-NQM1, Class A1, 4.00%, 03/25/2067(b) | 5,633,609 | 5,526,812 | |
| Sequoia Mortgage Trust, | |||
| Series 2013-3, Class A1, 2.00%, 03/25/2043(k) | 333,277 | 280,829 | |
| Series 2013-7, Class A2, 3.00%, 06/25/2043(k) | 258,962 | 230,860 | |
| SG Residential Mortgage Trust, | |||
| Series 2022-1, Class A1, 3.17%, 03/27/2062(b)(k) | 12,042,998 | 11,270,309 | |
| Series 2022-1, Class A2, 3.58%, 03/27/2062(b)(k) | 5,058,394 | 4,660,801 | |
| Shellpoint Asset Funding Trust, Series 2013-1, Class A3, 3.75%, 07/25/2043(b)(k) | 334,307 | 316,739 | |
| Sonic Capital LLC, | |||
| Series 2020-1A, Class A2I, 3.85%, 01/20/2050(b) | 9,052,800 | 8,750,540 | |
| Series 2021-1A, Class A2I, 2.19%, 08/20/2051(b) | 5,407,542 | 4,826,566 | |
| Series 2021-1A, Class A2II, 2.64%, 08/20/2051(b) | 5,310,458 | 4,434,746 | |
| STAR Trust, Series 2021-1, Class A1, 1.22%, 05/25/2065(b)(k) | 3,983,355 | 3,640,876 | |
| 23 | Invesco Core Plus Bond Fund |
| Principal Amount | Value | ||
| Starwood Mortgage Residential Trust, | |||
| Series 2020-1, Class A1, 2.28%, 02/25/2050(b)(k) | $218,549 | $208,362 | |
| Series 2020-INV1, Class A1, 1.03%, 11/25/2055(b)(k) | 1,680,103 | 1,582,235 | |
| Series 2021-6, Class A1, 1.92%, 11/25/2066(b)(k) | 11,907,884 | 10,438,249 | |
| Series 2022-1, Class A1, 2.45%, 12/25/2066(b)(k) | 8,850,601 | 7,866,377 | |
| Structured Adjustable Rate Mortgage Loan Trust, | |||
| Series 2004-12, Class 3A2, 5.90%, 09/25/2034(k) | 119,544 | 116,805 | |
| Series 2004-8, Class 3A, 6.17%, 07/25/2034(k) | 534,365 | 514,933 | |
| Subway Funding LLC, | |||
| Series 2024-1A, Class A23, 6.51%, 07/30/2054(b) | 7,131,000 | 7,478,352 | |
| Series 2024-1A, Class A2I, 6.03%, 07/30/2054(b) | 7,822,000 | 8,044,816 | |
| Series 2024-1A, Class A2I, 6.27%, 07/30/2054(b) | 7,755,000 | 8,062,813 | |
| Suntrust Alternative Loan Trust, Series 2005-1F, Class 2A8, 6.00%, 12/25/2035 | 73,765 | 68,225 | |
| Symphony CLO XVI Ltd., Series 2015-16A, Class ARR, 6.50% (3 mo. Term SOFR + 1.20%), 10/15/2031(b)(g) | 5,797,674 | 5,823,683 | |
| Symphony CLO XX Ltd., Series 2018-20A, Class AR2, 6.39% (3 mo. Term SOFR + 1.10%), 01/16/2032(b)(g) | 9,616,816 | 9,622,105 | |
| Synchrony Card Funding LLC, Series 2024-A2, Class A, 4.93%, 07/15/2030 | 5,010,000 | 5,093,025 | |
| Textainer Marine Containers VII Ltd., Series 2021-2A, Class A, 2.23%, 04/20/2046(b) | 9,510,600 | 8,725,859 | |
| Thornburg Mortgage Securities Trust, | |||
| Series 2003-6, Class A2, 6.39% (1 mo. Term SOFR + 1.11%), 12/25/2033(g) | 144,953 | 138,102 | |
| Series 2005-1, Class A3, 4.66%, 04/25/2045(k) | 300,557 | 289,985 | |
| TICP CLO XV Ltd., Series 2020-15A, Class A, 6.82% (3 mo. Term SOFR + 1.54%), 04/20/2033(b)(g) | 9,701,000 | 9,705,841 | |
| TierPoint Issuer LLC, Series 2023-1A, Class A2, 6.00%, 06/25/2053(b) | 13,378,000 | 13,315,519 | |
| Tricon American Homes Trust, Series 2020-SFR2, Class A, 1.48%, 11/17/2039(b) | 11,129,301 | 10,113,186 | |
| UBS Commercial Mortgage Trust, Series 2019-C16, Class A4, 3.60%, 04/15/2052 | 16,770,000 | 15,703,213 | |
| Principal Amount | Value | |||
| Verus Securitization Trust, | ||||
| Series 2020-1, Class A1, 3.42%, 01/25/2060(b)(k) | $1,107,758 | $1,078,502 | ||
| Series 2020-1, Class A2, 3.64%, 01/25/2060(b)(k) | 1,444,147 | 1,408,115 | ||
| Series 2021-1, Class A1B, 1.32%, 01/25/2066(b)(k) | 1,894,957 | 1,697,865 | ||
| Series 2021-7, Class A1, 1.83%, 10/25/2066(b)(k) | 9,610,965 | 8,572,996 | ||
| Series 2021-R1, Class A1, 0.82%, 10/25/2063(b)(k) | 2,267,776 | 2,128,643 | ||
| Series 2022-1, Class A1, 2.72%, 01/25/2067(b)(k) | 6,764,436 | 6,287,972 | ||
| Series 2022-3, Class A1, 4.13%, 02/25/2067(b)(k) | 7,989,523 | 7,609,581 | ||
| Series 2022-7, Class A1, 5.15%, 07/25/2067(b)(k) | 3,327,100 | 3,321,085 | ||
| Series 2022-INV2, Class A1, 6.79%, 10/25/2067(b)(k) | 4,227,759 | 4,285,820 | ||
| Visio Trust, Series 2020-1R, Class A1, 1.31%, 11/25/2055(b) | 1,589,622 | 1,505,181 | ||
| WaMu Mortgage Pass-Through Ctfs. Trust, Series 2007-HY2, Class 2A2, 4.61%, 11/25/2036(k) | 149,441 | 129,757 | ||
| Wells Fargo Mortgage Backed Securities Trust, Series 2005-AR14, Class A1, 7.36%, 08/25/2035(k) | 73,576 | 71,806 | ||
| Wendy’s Funding LLC, | ||||
| Series 2018-1A, Class A2II, 3.88%, 03/15/2048(b) | 10,517,720 | 10,152,457 | ||
| Series 2019-1A, Class A2II, 4.08%, 06/15/2049(b) | 4,922,308 | 4,719,216 | ||
| WFRBS Commercial Mortgage Trust, Series 2014-C23, Class B, 4.52%, 10/15/2057(k) | 4,693,000 | 4,217,205 | ||
| Zaxby’s Funding LLC, | ||||
| Series 2021-1A, Class A2, 3.24%, 07/30/2051(b) | 21,309,445 | 19,471,797 | ||
| Series 2024-1A, Class A2I, 6.59%, 04/30/2054(b) | 4,645,000 | 4,825,640 | ||
| Ziply Fiber Issuer LLC, Series 2024-1A, Class A2, 6.64%, 04/20/2054(b) | 9,109,000 | 9,393,207 | ||
| Total Asset-Backed Securities (Cost $1,259,637,991) | 1,186,023,935 | |||
| U.S. Treasury Securities–13.41% | ||||
| U.S. Treasury Bills–0.54% | ||||
| 5.27% - 5.31%, 09/05/2024(m) | 14,925,000 | 14,916,399 | ||
| 4.78% - 4.83%, 01/30/2025(m)(n) | 15,199,000 | 14,901,843 | ||
| 29,818,242 | ||||
| U.S. Treasury Bonds–1.94% | ||||
| 4.13%, 08/15/2044 | 26,912,100 | 26,266,630 | ||
| 4.63%, 05/15/2054 | 75,235,200 | 80,431,131 | ||
| 106,697,761 | ||||
| 24 | Invesco Core Plus Bond Fund |
| Principal Amount | Value | |||
| U.S. Treasury Notes–10.93% | ||||
| 2.13%, 11/30/2024 | $5,950,000 | $5,909,261 | ||
| 4.38%, 07/31/2026 | 80,232,200 | 80,840,209 | ||
| 3.75%, 08/15/2027 | 73,235,000 | 73,157,760 | ||
| 4.00%, 07/31/2029 | 168,017,000 | 170,025,327 | ||
| 3.63%, 08/31/2029 | 40,000,000 | 39,839,063 | ||
| 4.13%, 07/31/2031 | 10,575,800 | 10,775,749 | ||
| 3.88%, 08/15/2034 | 220,743,100 | 219,967,051 | ||
| 600,514,420 | ||||
| Total U.S. Treasury Securities (Cost $735,710,776) | 737,030,423 | |||
| Shares | ||||
| Preferred Stocks–1.39% | ||||
| Diversified Banks–0.80% | ||||
| Citigroup, Inc., 6.25%, Series T, Pfd.(c)(d) | 3,037,000 | 3,070,750 | ||
| Citigroup, Inc., 5.00%, Series U, Pfd.(c)(d) | 8,003,000 | 7,990,367 | ||
| Citigroup, Inc., 4.00%, Series W, Pfd.(c)(d) | 4,184,000 | 4,078,039 | ||
| Wells Fargo & Co., 7.50%, Class A, Series L, Conv. Pfd. | 23,403 | 28,598,466 | ||
| 43,737,622 | ||||
| Diversified Financial Services–0.24% | ||||
| Apollo Global Management, Inc., 7.63%, Pfd.(d) | 508,150 | 13,410,079 | ||
| Investment Banking & Brokerage–0.18% | ||||
| Goldman Sachs Group, Inc. (The), 8.24% (3 mo. Term SOFR + 3.14%), Series P, Pfd.(c)(g) | 3,555,000 | 3,564,367 | ||
| Morgan Stanley, 6.88% (3 mo. USD LIBOR + 3.94%), Series F, Pfd. | 249,737 | 6,320,844 | ||
| 9,885,211 | ||||
| Regional Banks–0.17% | ||||
| M&T Bank Corp., 7.50%, Series J, Pfd. | 348,527 | 9,441,596 | ||
| Total Preferred Stocks (Cost $77,053,161) | 76,474,508 | |||
| Principal Amount | ||||
| Agency Credit Risk Transfer Notes–0.50% | ||||
| Fannie Mae Connecticut Avenue Securities, | ||||
| Series 2022-R03, Class 1M1, 7.45% (30 Day Average SOFR + 2.10%), 03/25/2042(b)(g) | $8,168,048 | 8,299,031 | ||
| Series 2022-R04, Class 1M1, 7.35% (30 Day Average SOFR + 2.00%), 03/25/2042(b)(g) | 4,097,302 | 4,154,764 | ||
| Series 2023-R02, Class 1M1, 7.65% (30 Day Average SOFR + 2.30%), 01/25/2043(b)(g) | 2,888,668 | 2,970,778 | ||
| Principal Amount | Value | |||
| Freddie Mac, | ||||
| Series 2022-DNA3, Class M1A, STACR®, 7.35% (30 Day Average SOFR + 2.00%), 04/25/2042(b)(g) | $5,643,450 | $5,716,893 | ||
| Series 2022-HQA3, Class M1, STACR®, 7.65% (30 Day Average SOFR + 2.30%), 08/25/2042(b)(g) | 3,854,707 | 3,947,802 | ||
| Series 2023-DNA1, Class M1, STACR®, 7.45% (30 Day Average SOFR + 2.10%), 03/25/2043(b)(g) | 2,362,854 | 2,405,194 | ||
| Total Agency Credit Risk Transfer Notes (Cost $27,015,029) | 27,494,462 | |||
| Non-U.S. Dollar Denominated Bonds & Notes–0.26%(o) | ||||
| Airport Services–0.01% | ||||
| Gatwick Airport Finance PLC (United Kingdom), 4.38%, 04/07/2026(b) | GBP | 200,000 | 256,308 | |
| Automotive Parts & Equipment–0.00% | ||||
| Schaeffler AG (Germany), 3.38%, 10/12/2028(b) | EUR | 200,000 | 217,480 | |
| Broadline Retail–0.00% | ||||
| Americanas S.A. (Brazil), 8.35%, 07/26/2029(i) | BRL | 2,176 | 0 | |
| Diversified Chemicals–0.00% | ||||
| INEOS Quattro Finance 2 PLC (United Kingdom), 8.50%, 03/15/2029(b) | EUR | 200,000 | 235,568 | |
| Diversified Support Services–0.01% | ||||
| IPD 3 B.V. (France), 8.00%, 06/15/2028(b) | EUR | 200,000 | 235,595 | |
| Environmental & Facilities Services–0.00% | ||||
| Paprec Holding (France), 6.50%, 11/17/2027(b) | EUR | 200,000 | 232,830 | |
| Homefurnishing Retail–0.00% | ||||
| Mobilux Finance S.A.S. (France), 4.25%, 07/15/2028(b) | EUR | 200,000 | 209,291 | |
| Integrated Telecommunication Services–0.06% | ||||
| AT&T, Inc., Series MPLE, 5.10%, 11/25/2048 | CAD | 3,703,000 | 2,618,921 | |
| Telecom Italia S.p.A. (Italy), 7.88%, 07/31/2028(b) | EUR | 400,000 | 495,657 | |
| 3,114,578 | ||||
| Investment Banking & Brokerage–0.04% | ||||
| Boost Newco Borrower LLC/GTCR W Dutch Finance Sub B.V. (Netherlands), 8.50%, 01/15/2031(b) | GBP | 1,650,000 | 2,348,087 | |
| Leisure Facilities–0.01% | ||||
| Deuce FinCo PLC (United Kingdom), 5.50%, 06/15/2027(b) | GBP | 200,000 | 255,110 | |
| 25 | Invesco Core Plus Bond Fund |
| Principal Amount | Value | ||
| Marine Transportation–0.01% | |||
| Stena International S.A. (Sweden), 7.25%, 02/15/2028(b) | EUR | 325,000 | $376,646 |
| Metal, Glass & Plastic Containers–0.00% | |||
| OI European Group B.V., 6.25%, 05/15/2028(b) | EUR | 200,000 | 229,849 |
| Movies & Entertainment–0.12% | |||
| Netflix, Inc., 3.88%, 11/15/2029(b) | EUR | 5,311,000 | 6,029,023 |
| WMG Acquisition Corp., 2.75%, 07/15/2028(b) | EUR | 250,000 | 267,870 |
| 6,296,893 | |||
| Total Non-U.S. Dollar Denominated Bonds & Notes (Cost $13,104,855) | 14,008,235 | ||
| Variable Rate Senior Loan Interests–0.23%(p) | |||
| Aerospace & Defense–0.01% | |||
| TransDigm, Inc., Term Loan J, 7.84% (3 mo. SOFR + 2.50%), 02/28/2031 | $250,000 | 250,564 | |
| Casinos & Gaming–0.00% | |||
| Scientific Games Lottery, Term Loan B, 8.32% (3 mo. Term SOFR + 3.00%), 04/04/2029 | 250,000 | 249,314 | |
| Gas Utilities–0.04% | |||
| NGL Energy Operating LLC, Term Loan, 9.00% (1 mo. Term SOFR + 3.75%), 02/03/2031 | 2,312,205 | 2,311,580 | |
| Health Care Supplies–0.01% | |||
| Mozart Debt Merger Sub, Inc. (Medline Industries), Term Loan B, 8.00% (1 mo. Term SOFR + 2.75%), 10/23/2028 | 249,375 | 250,276 | |
| Hotels, Resorts & Cruise Lines–0.01% | |||
| Carnival Corp., Term Loan B, 8.00% (1 mo. Term SOFR + 2.75%), 10/18/2028 | 194,401 | 195,303 | |
| IRB Holding Corp., Term Loan B, 8.10% (1 mo. Term SOFR + 2.85%), 12/15/2027 | 498,750 | 499,815 | |
| 695,118 | |||
| Leisure Products–0.05% | |||
| Amer Sports (Finland), Term Loan B, 8.35% (3 mo. Term SOFR + 3.25%), 02/10/2031 | 2,870,092 | 2,881,759 | |
| Life Sciences Tools & Services–0.00% | |||
| Syneos Health, Inc., Term Loan B, 9.08% (3 mo. Term SOFR + 3.75%), 09/27/2030 | 249,375 | 248,369 | |
| Oil & Gas Storage & Transportation–0.09% | |||
| NFE Atlantic Holdings LLC, Term Loan, 10.06% (3 mo. Term SOFR + 5.00%), 10/30/2028 | 4,987,469 | 4,695,153 | |
| Principal Amount | Value | ||
| Real Estate Development–0.01% | |||
| DTZ U.S. Borrower LLC, Term Loan B, 9.00% (1 mo. Term SOFR + 3.75%), 01/31/2030(i) | $250,000 | $251,250 | |
| Greystar Real Estate Partners LLC, Term Loan B, 8.06% (1 mo. Term SOFR + 2.75%), 08/21/2030 | 249,373 | 250,308 | |
| 501,558 | |||
| Research & Consulting Services–0.01% | |||
| Dun & Bradstreet Corp. (The), Incremental Term Loan B-2, 8.03% (1 mo. Term SOFR + 2.75%), 01/18/2029 | 249,375 | 250,076 | |
| Systems Software–0.00% | |||
| Camelot Finance L.P., Term Loan, 8.00% (1 mo. Term SOFR + 2.75%), 01/31/2031 | 249,375 | 249,874 | |
| Trading Companies & Distributors–0.00% | |||
| Jane Street Group LLC, Term Loan, 7.86% (1 mo. Term SOFR + 2.61%), 01/26/2028 | 249,354 | 249,853 | |
| Total Variable Rate Senior Loan Interests (Cost $12,731,785) | 12,833,494 | ||
| Shares | |||
| Exchange-Traded Funds–0.14% | |||
| Invesco High Yield Select ETF(q) | 10,000 | 258,498 | |
| Invesco Senior Loan ETF(c)(q) | 120,000 | 2,528,400 | |
| Invesco Short Duration Bond ETF(q) | 12,000 | 301,140 | |
| Invesco Total Return Bond ETF(c)(q) | 100,000 | 4,781,000 | |
| Total Exchange-Traded Funds (Cost $8,871,383) | 7,869,038 | ||
| Principal Amount | |||
| Municipal Obligations–0.13% | |||
| California (State of) Health Facilities Financing Authority (Social Bonds), | |||
| Series 2022, RB, 4.19%, 06/01/2037 | $4,000,000 | 3,827,116 | |
| Series 2022, RB, 4.35%, 06/01/2041 | 2,980,000 | 2,805,593 | |
| Georgia (State of) Municipal Electric Authority (Plant Vogtle Units 3 & 4), Series 2010 A, RB, 6.66%, 04/01/2057 | 514,000 | 580,923 | |
| Total Municipal Obligations (Cost $7,494,000) | 7,213,632 | ||
| Shares | |||
| Common Stocks & Other Equity Interests–0.00% | |||
| Agricultural Products & Services–0.00% | |||
| Locus Agriculture Solutions, Inc., Wts., expiring 12/31/2032(i) | 79 | 0 | |
| Broadline Retail–0.00% | |||
| Americanas S.A. (Brazil)(r) | 10,955 | 11,216 | |
| Americanas S.A., Wts., expiring 03/19/2027 (Brazil)(i)(r) | 365,159 | 0 | |
| 11,216 | |||
| 26 | Invesco Core Plus Bond Fund |
| Shares | Value | ||
| Oil & Gas Drilling–0.00% | |||
| Vantage Drilling International Ltd.(r) | 95 | $2,565 | |
| Paper & Plastic Packaging Products & Materials–0.00% | |||
| Smurfit WestRock PLC | 65 | 3,082 | |
| Specialty Chemicals–0.00% | |||
| Ingevity Corp.(r) | 10 | 395 | |
| Total Common Stocks & Other Equity Interests (Cost $4,953) | 17,258 | ||
| Money Market Funds–14.67% | |||
| Invesco Government & Agency Portfolio, Institutional Class, 5.18%(q)(s) | 282,138,685 | 282,138,685 | |
| Invesco Treasury Portfolio, Institutional Class, 5.15%(q)(s) | 523,966,898 | 523,966,898 | |
| Total Money Market Funds (Cost $806,105,583) | 806,105,583 | ||
| Options Purchased–0.02% | |||
| (Cost $827,850)(t) | 846,900 | ||
| TOTAL INVESTMENTS IN SECURITIES (excluding investments purchased with cash collateral from securities on loan)-119.11% (Cost $6,578,442,033) | 6,544,724,227 | ||
| Shares | Value | ||
| Investments Purchased with Cash Collateral from Securities on Loan | |||
| Money Market Funds–6.87% | |||
| Invesco Private Government Fund, 5.28%(q)(s)(u) | 104,150,583 | $104,150,583 | |
| Invesco Private Prime Fund, 5.46%(q)(s)(u) | 273,418,257 | 273,527,625 | |
| Total Investments Purchased with Cash Collateral from Securities on Loan (Cost $377,660,599) | 377,678,208 | ||
| TOTAL INVESTMENTS IN SECURITIES–125.98% (Cost $6,956,102,632) | 6,922,402,435 | ||
| OTHER ASSETS LESS LIABILITIES—(25.98)% | (1,427,701,804) | ||
| NET ASSETS–100.00% | $5,494,700,631 | ||
| ARM | – Adjustable Rate Mortgage |
| BRL | – Brazilian Real |
| CAD | – Canadian Dollar |
| Conv. | – Convertible |
| Ctfs. | – Certificates |
| ETF | – Exchange-Traded Fund |
| EUR | – Euro |
| GBP | – British Pound Sterling |
| IBOR | – Interbank Offered Rate |
| IO | – Interest Only |
| LIBOR | – London Interbank Offered Rate |
| Pfd. | – Preferred |
| RB | – Revenue Bonds |
| REIT | – Real Estate Investment Trust |
| REMICs | – Real Estate Mortgage Investment Conduits |
| SOFR | – Secured Overnight Financing Rate |
| STACR® | – Structured Agency Credit Risk |
| TBA | – To Be Announced |
| USD | – U.S. Dollar |
| Wts. | – Warrants |
| 27 | Invesco Core Plus Bond Fund |
| (a) | Industry and/or sector classifications used in this report are generally according to the Global Industry Classification Standard, which was developed by and is the exclusive property and a service mark of MSCI Inc. and Standard & Poor’s. |
| (b) | Security purchased or received in a transaction exempt from registration under the Securities Act of 1933, as amended (the “1933 Act”). The security may be resold pursuant to an exemption from registration under the 1933 Act, typically to qualified institutional buyers. The aggregate value of these securities at August 31, 2024 was $1,996,826,334, which represented 36.34% of the Fund’s Net Assets. |
| (c) | All or a portion of this security was out on loan at August 31, 2024. |
| (d) | Security issued at a fixed rate for a specific period of time, after which it will convert to a variable rate. |
| (e) | Perpetual bond with no specified maturity date. |
| (f) | Zero coupon bond issued at a discount. |
| (g) | Interest or dividend rate is redetermined periodically. Rate shown is the rate in effect on August 31, 2024. |
| (h) | Defaulted security. Currently, the issuer is in default with respect to principal and/or interest payments. The aggregate value of these securities at August 31, 2024 was $3,692,029, which represented less than 1% of the Fund’s Net Assets. |
| (i) | Security valued using significant unobservable inputs (Level 3). See Note 3. |
| (j) | Interest only security. Principal amount shown is the notional principal and does not reflect the maturity value of the security. |
| (k) | Interest rate is redetermined periodically based on the cash flows generated by the pool of assets backing the security, less any applicable fees. The rate shown is the rate in effect on August 31, 2024. |
| (l) | Security purchased on a forward commitment basis. This security is subject to dollar roll transactions. See Note 1P. |
| (m) | Security traded on a discount basis. The interest rate shown represents the discount rate at the time of purchase by the Fund. |
| (n) | All or a portion of the value was pledged as collateral to cover margin requirements for open futures contracts. See Note 1M. |
| (o) | Foreign denominated security. Principal amount is denominated in the currency indicated. |
| (p) | Variable rate senior loan interests are, at present, not readily marketable, not registered under the 1933 Act and may be subject to contractual and legal restrictions on sale. Variable rate senior loan interests in the Fund’s portfolio generally have variable rates which adjust to a base, such as the Secured Overnight Financing Rate ("SOFR"), on set dates, typically every 30 days, but not greater than one year, and/or have interest rates that float at margin above a widely recognized base lending rate such as the Prime Rate of a designated U.S. bank. |
| (q) | Affiliated holding. Affiliated holdings are investments in entities which are under common ownership or control of Invesco Ltd. or are investments in entities in which the Fund owns 5% or more of the outstanding voting securities. The table below shows the Fund’s transactions in, and earnings from, its investments in affiliates for the fiscal year ended August 31, 2024. |
| Value August 31, 2023 | Purchases at Cost | Proceeds from Sales | Change in Unrealized Appreciation (Depreciation) | Realized Gain (Loss) | Value August 31, 2024 | Dividend Income | |
| Invesco High Yield Select ETF | $249,082 | $- | $- | $9,416 | $- | $258,498 | $18,094 |
| Invesco Senior Loan ETF | - | 2,536,800 | - | (8,400) | - | 2,528,400 | 91,676 |
| Invesco Short Duration Bond ETF | 296,220 | 299,430 | (298,422) | 4,272 | (360) | 301,140 | 9,373 |
| Invesco Total Return Bond ETF | 4,596,000 | - | - | 185,000 | - | 4,781,000 | 203,509 |
| Investments in Affiliated Money Market Funds: | |||||||
| Invesco Government & Agency Portfolio, Institutional Class | 246,646,745 | 706,781,333 | (671,289,393) | - | - | 282,138,685 | 11,102,789 |
| Invesco Liquid Assets Portfolio, Institutional Class | 176,146,897 | 406,322,994 | (582,494,295) | 8,792 | 15,612 | - | 7,126,148 |
| Invesco Treasury Portfolio, Institutional Class | 281,881,994 | 1,079,080,734 | (836,995,830) | - | - | 523,966,898 | 13,626,259 |
| Investments Purchased with Cash Collateral from Securities on Loan: | |||||||
| Invesco Private Government Fund | 108,303,142 | 931,424,764 | (935,577,323) | - | - | 104,150,583 | 5,826,540* |
| Invesco Private Prime Fund | 275,096,423 | 1,975,821,809 | (1,977,472,832) | 17,609 | 64,616 | 273,527,625 | 15,854,884* |
| Total | $1,093,216,503 | $5,102,267,864 | $(5,004,128,095) | $216,689 | $79,868 | $1,191,652,829 | $53,859,272 |
| * | Represents the income earned on the investment of cash collateral, which is included in securities lending income on the Statement of Operations. Does not include rebates and fees paid to lending agent or premiums received from borrowers, if any. |
| (r) | Non-income producing security. |
| (s) | The rate shown is the 7-day SEC standardized yield as of August 31, 2024. |
| (t) | The table below details options purchased. |
| (u) | The security has been segregated to satisfy the commitment to return the cash collateral received in securities lending transactions upon the borrower’s return of the securities loaned. See Note 1J. |
| Open Exchange-Traded Index Options Purchased | ||||||||
| Description | Type of Contract | Expiration Date | Number of Contracts | Exercise Price | Notional Value(a) | Value | ||
| Equity Risk | ||||||||
| S&P 500 Index | Call | 01/17/2025 | 45 | USD | 5,725.00 | USD | 25,762,500 | $846,900 |
| (a) | Notional Value is calculated by multiplying the Number of Contracts by the Exercise Price by the multiplier. |
| 28 | Invesco Core Plus Bond Fund |
| Open Futures Contracts | |||||
| Long Futures Contracts | Number of Contracts | Expiration Month | Notional Value | Value | Unrealized Appreciation (Depreciation) |
| Interest Rate Risk | |||||
| U.S. Treasury 2 Year Notes | 793 | December-2024 | $164,584,673 | $(298,890) | $(298,890) |
| U.S. Treasury 10 Year Notes | 3,005 | December-2024 | 341,255,312 | (2,187,199) | (2,187,199) |
| U.S. Treasury Long Bonds | 2,344 | December-2024 | 288,605,000 | (3,741,000) | (3,741,000) |
| U.S. Treasury Ultra Bonds | 1,236 | December-2024 | 163,074,750 | (2,754,665) | (2,754,665) |
| Subtotal—Long Futures Contracts | (8,981,754) | (8,981,754) | |||
| Short Futures Contracts | |||||
| Interest Rate Risk | |||||
| U.S. Treasury 5 Year Notes | 1,235 | December-2024 | (135,107,071) | 412,153 | 412,153 |
| U.S. Treasury 10 Year Ultra Notes | 3,174 | December-2024 | (372,746,625) | 2,819,956 | 2,819,956 |
| Subtotal—Short Futures Contracts | 3,232,109 | 3,232,109 | |||
| Total Futures Contracts | $(5,749,645) | $(5,749,645) | |||
| Open Forward Foreign Currency Contracts | ||||||
| Settlement Date | Counterparty | Contract to | Unrealized Appreciation (Depreciation) | |||
| Deliver | Receive | |||||
| Currency Risk | ||||||
| 11/25/2024 | Morgan Stanley and Co. International PLC | GBP | 358,000 | USD | 459,224 | $(11,168) |
| 11/25/2024 | State Street Bank & Trust Co. | CAD | 13,003,000 | USD | 9,502,727 | (169,498) |
| 11/25/2024 | State Street Bank & Trust Co. | EUR | 14,340,000 | USD | 15,791,374 | (118,729) |
| Total Forward Foreign Currency Contracts | $(299,395) | |||||
| Abbreviations: | |
| CAD | —Canadian Dollar |
| EUR | —Euro |
| GBP | —British Pound Sterling |
| USD | —U.S. Dollar |
| 29 | Invesco Core Plus Bond Fund |
| Assets: | |
| Investments in unaffiliated securities, at value (Cost $5,763,465,067)* | $5,730,749,606 |
| Investments in affiliates, at value (Cost $1,192,637,565) | 1,191,652,829 |
| Deposits with brokers: | |
| Cash collateral — TBA commitments | 321,511 |
| Cash | 13,995 |
| Foreign currencies, at value (Cost $24,853,464) | 24,910,482 |
| Receivable for: | |
| Investments sold | 28,937,043 |
| Fund shares sold | 137,387,988 |
| Dividends | 3,912,315 |
| Interest | 41,737,221 |
| Investments matured, at value (Cost $1,148,619) | 120,452 |
| Principal paydowns | 3,019 |
| Investment for trustee deferred compensation and retirement plans | 135,461 |
| Other assets | 151,620 |
| Total assets | 7,160,033,542 |
| Liabilities: | |
| Other investments: | |
| Variation margin payable — futures contracts | 1,964,921 |
| Unrealized depreciation on forward foreign currency contracts outstanding | 299,395 |
| Payable for: | |
| Investments purchased | 166,084,263 |
| TBA sales commitment | 1,111,136,077 |
| Dividends | 2,931,082 |
| Fund shares reacquired | 3,661,385 |
| Collateral upon return of securities loaned | 377,660,599 |
| Accrued fees to affiliates | 1,255,792 |
| Accrued trustees’ and officers’ fees and benefits | 7,006 |
| Accrued other operating expenses | 175,561 |
| Trustee deferred compensation and retirement plans | 156,830 |
| Total liabilities | 1,665,332,911 |
| Net assets applicable to shares outstanding | $5,494,700,631 |
| Net assets consist of: | |
| Shares of beneficial interest | $6,339,427,637 |
| Distributable earnings (loss) | (844,727,006) |
| $5,494,700,631 | |
| Net Assets: | |
| Class A | $1,327,611,223 |
| Class C | $42,577,492 |
| Class R | $32,745,958 |
| Class Y | $1,435,650,165 |
| Class R5 | $17,505,360 |
| Class R6 | $2,638,610,433 |
| Shares outstanding, no par value, with an unlimited number of shares authorized: | |
| Class A | 141,541,602 |
| Class C | 4,540,894 |
| Class R | 3,492,107 |
| Class Y | 152,951,930 |
| Class R5 | 1,866,985 |
| Class R6 | 281,533,526 |
| Class A: | |
| Net asset value per share | $9.38 |
| Maximum offering price per share (Net asset value of $9.38 ÷ 95.75%) | $9.80 |
| Class C: | |
| Net asset value and offering price per share | $9.38 |
| Class R: | |
| Net asset value and offering price per share | $9.38 |
| Class Y: | |
| Net asset value and offering price per share | $9.39 |
| Class R5: | |
| Net asset value and offering price per share | $9.38 |
| Class R6: | |
| Net asset value and offering price per share | $9.37 |
| * | At August 31, 2024, securities with an aggregate value of $363,666,700 were on loan to brokers. |
| 30 | Invesco Core Plus Bond Fund |
| Investment income: | |
| Interest (net of foreign withholding taxes of $21,181) | $228,347,997 |
| Dividends | 3,217,472 |
| Dividends from affiliates (includes net securities lending income of $776,102) | 32,953,950 |
| Total investment income | 264,519,419 |
| Expenses: | |
| Advisory fees | 19,457,472 |
| Administrative services fees | 699,177 |
| Custodian fees | 109,506 |
| Distribution fees: | |
| Class A | 3,140,469 |
| Class C | 444,113 |
| Class R | 146,422 |
| Transfer agent fees — A, C, R and Y | 3,525,355 |
| Transfer agent fees — R5 | 15,301 |
| Transfer agent fees — R6 | 745,077 |
| Trustees’ and officers’ fees and benefits | 66,057 |
| Registration and filing fees | 281,729 |
| Reports to shareholders | 863,598 |
| Professional services fees | 114,322 |
| Other | 168,639 |
| Total expenses | 29,777,237 |
| Less: Fees waived, expenses reimbursed and/or expense offset arrangement(s) | (2,773,222) |
| Net expenses | 27,004,015 |
| Net investment income | 237,515,404 |
| Realized and unrealized gain (loss) from: | |
| Net realized gain (loss) from: | |
| Unaffiliated investment securities | (15,864,631) |
| Affiliated investment securities | 79,868 |
| Foreign currencies | 1,808,269 |
| Forward foreign currency contracts | (953,588) |
| Futures contracts | 4,440,282 |
| Option contracts written | (1,269,019) |
| (11,758,819) | |
| Change in net unrealized appreciation (depreciation) of: | |
| Unaffiliated investment securities | 237,168,013 |
| Affiliated investment securities | 216,689 |
| Foreign currencies | 89,373 |
| Forward foreign currency contracts | (530,037) |
| Futures contracts | (2,600,144) |
| 234,343,894 | |
| Net realized and unrealized gain | 222,585,075 |
| Net increase in net assets resulting from operations | $460,100,479 |
| 31 | Invesco Core Plus Bond Fund |
| 2024 | 2023 | |
| Operations: | ||
| Net investment income | $237,515,404 | $200,049,243 |
| Net realized gain (loss) | (11,758,819) | (425,402,160) |
| Change in net unrealized appreciation | 234,343,894 | 198,139,791 |
| Net increase (decrease) in net assets resulting from operations | 460,100,479 | (27,213,126) |
| Distributions to shareholders from distributable earnings: | ||
| Class A | (58,877,155) | (53,845,475) |
| Class C | (1,751,669) | (1,892,008) |
| Class R | (1,299,921) | (1,111,448) |
| Class Y | (54,146,596) | (44,669,184) |
| Class R5 | (755,058) | (665,367) |
| Class R6 | (123,278,471) | (112,518,988) |
| Total distributions from distributable earnings | (240,108,870) | (214,702,470) |
| Share transactions–net: | ||
| Class A | 56,543,645 | 72,965,788 |
| Class C | (6,620,918) | (5,633,396) |
| Class R | 3,932,569 | 2,945,593 |
| Class Y | 379,011,866 | 99,521,145 |
| Class R5 | 2,450,900 | 1,083,557 |
| Class R6 | 116,714,538 | 126,964,986 |
| Net increase in net assets resulting from share transactions | 552,032,600 | 297,847,673 |
| Net increase in net assets | 772,024,209 | 55,932,077 |
| Net assets: | ||
| Beginning of year | 4,722,676,422 | 4,666,744,345 |
| End of year | $5,494,700,631 | $4,722,676,422 |
| 32 | Invesco Core Plus Bond Fund |
| Net asset value, beginning of period | Net investment income(a) | Net gains (losses) on securities (both realized and unrealized) | Total from investment operations | Dividends from net investment income | Distributions from net realized gains | Total distributions | Net asset value, end of period | Total return(b) | Net assets, end of period (000’s omitted) | Ratio of expenses to average net assets with fee waivers and/or expenses absorbed | Ratio of expenses to average net assets without fee waivers and/or expenses absorbed | Ratio of net investment income to average net assets | Portfolio turnover (c) | |
| Class A | ||||||||||||||
| Year ended 08/31/24 | $8.98 | $0.42 | $0.40 | $0.82 | $(0.42) | $— | $(0.42) | $9.38 | 9.45% | $1,327,611 | 0.74% | 0.84% | 4.63% | 465% |
| Year ended 08/31/23 | 9.45 | 0.38 | (0.44) | (0.06) | (0.41) | — | (0.41) | 8.98 | (0.59) | 1,215,588 | 0.74 | 0.83 | 4.19 | 461 |
| Year ended 08/31/22 | 11.39 | 0.24 | (1.83) | (1.59) | (0.24) | (0.11) | (0.35) | 9.45 | (14.19) | 1,203,731 | 0.75 | 0.81 | 2.30 | 321 |
| Year ended 08/31/21 | 11.61 | 0.19 | 0.17 | 0.36 | (0.22) | (0.36) | (0.58) | 11.39 | 3.18 | 1,497,641 | 0.74 | 0.79 | 1.70 | 366 |
| Year ended 08/31/20 | 11.13 | 0.29 | 0.51 | 0.80 | (0.32) | — | (0.32) | 11.61 | 7.29 | 1,364,591 | 0.75 | 0.82 | 2.55 | 329 |
| Class C | ||||||||||||||
| Year ended 08/31/24 | 8.98 | 0.35 | 0.41 | 0.76 | (0.36) | — | (0.36) | 9.38 | 8.64 | 42,577 | 1.49 | 1.59 | 3.88 | 465 |
| Year ended 08/31/23 | 9.45 | 0.31 | (0.44) | (0.13) | (0.34) | — | (0.34) | 8.98 | (1.34) | 47,344 | 1.49 | 1.58 | 3.44 | 461 |
| Year ended 08/31/22 | 11.38 | 0.16 | (1.81) | (1.65) | (0.17) | (0.11) | (0.28) | 9.45 | (14.76) | 55,695 | 1.50 | 1.56 | 1.55 | 321 |
| Year ended 08/31/21 | 11.61 | 0.11 | 0.16 | 0.27 | (0.14) | (0.36) | (0.50) | 11.38 | 2.32 | 90,811 | 1.49 | 1.54 | 0.95 | 366 |
| Year ended 08/31/20 | 11.12 | 0.20 | 0.52 | 0.72 | (0.23) | — | (0.23) | 11.61 | 6.59 | 107,350 | 1.50 | 1.57 | 1.80 | 329 |
| Class R | ||||||||||||||
| Year ended 08/31/24 | 8.98 | 0.40 | 0.40 | 0.80 | (0.40) | — | (0.40) | 9.38 | 9.18 | 32,746 | 0.99 | 1.09 | 4.38 | 465 |
| Year ended 08/31/23 | 9.45 | 0.36 | (0.44) | (0.08) | (0.39) | — | (0.39) | 8.98 | (0.84) | 27,489 | 0.99 | 1.08 | 3.94 | 461 |
| Year ended 08/31/22 | 11.38 | 0.21 | (1.81) | (1.60) | (0.22) | (0.11) | (0.33) | 9.45 | (14.33) | 25,914 | 1.00 | 1.06 | 2.05 | 321 |
| Year ended 08/31/21 | 11.61 | 0.16 | 0.16 | 0.32 | (0.19) | (0.36) | (0.55) | 11.38 | 2.83 | 29,466 | 0.99 | 1.04 | 1.45 | 366 |
| Year ended 08/31/20 | 11.12 | 0.26 | 0.52 | 0.78 | (0.29) | — | (0.29) | 11.61 | 7.12 | 23,193 | 1.00 | 1.07 | 2.30 | 329 |
| Class Y | ||||||||||||||
| Year ended 08/31/24 | 8.99 | 0.44 | 0.41 | 0.85 | (0.45) | — | (0.45) | 9.39 | 9.72 | 1,435,650 | 0.49 | 0.59 | 4.88 | 465 |
| Year ended 08/31/23 | 9.46 | 0.41 | (0.44) | (0.03) | (0.44) | — | (0.44) | 8.99 | (0.33) | 1,007,180 | 0.49 | 0.58 | 4.44 | 461 |
| Year ended 08/31/22 | 11.40 | 0.27 | (1.83) | (1.56) | (0.27) | (0.11) | (0.38) | 9.46 | (13.95) | 961,066 | 0.50 | 0.56 | 2.55 | 321 |
| Year ended 08/31/21 | 11.62 | 0.22 | 0.17 | 0.39 | (0.25) | (0.36) | (0.61) | 11.40 | 3.43 | 1,407,185 | 0.49 | 0.54 | 1.95 | 366 |
| Year ended 08/31/20 | 11.14 | 0.31 | 0.51 | 0.82 | (0.34) | — | (0.34) | 11.62 | 7.56 | 1,170,121 | 0.50 | 0.57 | 2.80 | 329 |
| Class R5 | ||||||||||||||
| Year ended 08/31/24 | 8.98 | 0.44 | 0.41 | 0.85 | (0.45) | — | (0.45) | 9.38 | 9.72 | 17,505 | 0.49 | 0.54 | 4.88 | 465 |
| Year ended 08/31/23 | 9.45 | 0.41 | (0.45) | (0.04) | (0.43) | — | (0.43) | 8.98 | (0.34) | 14,364 | 0.49 | 0.53 | 4.44 | 461 |
| Year ended 08/31/22 | 11.38 | 0.26 | (1.81) | (1.55) | (0.27) | (0.11) | (0.38) | 9.45 | (13.89) | 14,000 | 0.50 | 0.52 | 2.55 | 321 |
| Year ended 08/31/21 | 11.61 | 0.22 | 0.16 | 0.38 | (0.25) | (0.36) | (0.61) | 11.38 | 3.35 | 13,274 | 0.49 | 0.51 | 1.95 | 366 |
| Year ended 08/31/20 | 11.12 | 0.31 | 0.52 | 0.83 | (0.34) | — | (0.34) | 11.61 | 7.65 | 11,555 | 0.50 | 0.54 | 2.80 | 329 |
| Class R6 | ||||||||||||||
| Year ended 08/31/24 | 8.97 | 0.44 | 0.41 | 0.85 | (0.45) | — | (0.45) | 9.37 | 9.77 | 2,638,610 | 0.46 | 0.47 | 4.91 | 465 |
| Year ended 08/31/23 | 9.45 | 0.41 | (0.45) | (0.04) | (0.44) | — | (0.44) | 8.97 | (0.41) | 2,410,711 | 0.45 | 0.46 | 4.48 | 461 |
| Year ended 08/31/22 | 11.38 | 0.27 | (1.81) | (1.54) | (0.28) | (0.11) | (0.39) | 9.45 | (13.85) | 2,406,339 | 0.45 | 0.45 | 2.60 | 321 |
| Year ended 08/31/21 | 11.60 | 0.23 | 0.17 | 0.40 | (0.26) | (0.36) | (0.62) | 11.38 | 3.51 | 2,948,067 | 0.41 | 0.42 | 2.03 | 366 |
| Year ended 08/31/20 | 11.12 | 0.32 | 0.51 | 0.83 | (0.35) | — | (0.35) | 11.60 | 7.62 | 2,746,570 | 0.45 | 0.45 | 2.85 | 329 |
| (a) | Calculated using average shares outstanding. |
| (b) | Includes adjustments in accordance with accounting principles generally accepted in the United States of America and as such, the net asset value for financial reporting purposes and the returns based upon those net asset values may differ from the net asset value and returns for shareholder transactions. Does not include sales charges and is not annualized for periods less than one year, if applicable. |
| (c) | Portfolio turnover is calculated at the fund level and is not annualized for periods less than one year, if applicable. |
| 33 | Invesco Core Plus Bond Fund |
| A. | Security Valuations – Securities, including restricted securities, are valued according to the following policy. |
| 34 | Invesco Core Plus Bond Fund |
| B. | Securities Transactions and Investment Income – Securities transactions are accounted for on a trade date basis. Realized gains or losses on sales are computed on the basis of specific identification of the securities sold. Interest income (net of withholding tax, if any) is recorded on an accrual basis from settlement date and includes coupon interest and amortization of premium and accretion of discount on debt securities as applicable. Pay-in-kind interest income and non-cash dividend income received in the form of securities in lieu of cash are recorded at the fair value of the securities received. Paydown gains and losses on mortgage and asset-backed securities are recorded as adjustments to interest income. Dividend income (net of withholding tax, if any) is recorded on the ex-dividend date. |
| C. | Country Determination — For the purposes of making investment selection decisions and presentation in the Schedule of Investments, the investment adviser may determine the country in which an issuer is located and/or credit risk exposure based on various factors. These factors include the laws of the country under which the issuer is organized, where the issuer maintains a principal office, the country in which the issuer derives 50% or more of its total revenues, the country that has the primary market for the issuer’s securities and its "country of risk" as determined by a third party service provider, as well as other criteria. Among the other criteria that may be evaluated for making this determination are the country in which the issuer maintains 50% or more of its assets, the type of security, financial guarantees and enhancements, the nature of the collateral and the sponsor organization. Country of issuer and/or credit risk exposure has been determined to be the United States of America, unless otherwise noted. |
| D. | Distributions – Distributions from net investment income, if any, are declared daily and paid monthly. Distributions from net realized capital gain, if any, are generally declared and paid annually and recorded on the ex-dividend date. The Fund may elect to treat a portion of the proceeds from redemptions as distributions for federal income tax purposes. |
| E. | Federal Income Taxes – The Fund intends to comply with the requirements of Subchapter M of the Internal Revenue Code of 1986, as amended (the “Internal Revenue Code”), necessary to qualify as a regulated investment company and to distribute substantially all of the Fund’s taxable earnings to shareholders. As such, the Fund will not be subject to federal income taxes on otherwise taxable income (including net realized capital gain) that is distributed to shareholders. Therefore, no provision for federal income taxes is recorded in the financial statements. |
| F. | Expenses – Fees provided for under the Rule 12b-1 plan of a particular class of the Fund are charged to the operations of such class. Transfer agency fees and expenses and other shareholder recordkeeping fees and expenses attributable to Class R5 and Class R6 are allocated based on relative net assets of Class R5 and Class R6. Sub-accounting fees attributable to Class R5 are charged to the operations of the class. Transfer agency fees and expenses and other shareholder recordkeeping fees and expenses relating to all other classes are allocated among those classes based on relative net assets. All other expenses are allocated among the classes based on the relative value of settled shares. |
| G. | Accounting Estimates – The preparation of financial statements in conformity with accounting principles generally accepted in the United States of America (“GAAP”) requires management to make estimates and assumptions that affect the reported amounts of assets and liabilities at the date of the financial statements and the reported amounts of revenues and expenses during the reporting period including estimates and assumptions related to taxation. Actual results could differ from those estimates by a significant amount. In addition, the Fund monitors for material events or transactions that may occur or become known after the period-end date and before the date the financial statements are released to print. |
| H. | Indemnifications – Under the Trust’s organizational documents, each Trustee, officer, employee or other agent of the Trust is indemnified against certain liabilities that may arise out of the performance of their duties to the Fund. Additionally, in the normal course of business, the Fund enters into contracts, including the Fund’s servicing agreements, that contain a variety of indemnification clauses. The Fund’s maximum exposure under these arrangements is unknown as this would involve future claims that may be made against the Fund that have not yet occurred. The risk of material loss as a result of such indemnification claims is considered remote. |
| I. | Securities Purchased on a When-Issued and Delayed Delivery Basis — The Fund may purchase and sell interests in corporate loans and corporate debt securities and other portfolio securities on a when-issued and delayed delivery basis, with payment and delivery scheduled for a future date. No income accrues to the Fund on such interests or securities in connection with such transactions prior to the date the Fund actually takes delivery of such interests or securities. These transactions are subject to market fluctuations and are subject to the risk that the value at delivery may be more or less than the trade date purchase price. Although the Fund will generally purchase these securities with the intention of acquiring such securities, they may sell such securities prior to the settlement date. |
| J. | Securities Lending – The Fund may lend portfolio securities having a market value up to one-third of the Fund’s total assets. Such loans are secured by collateral equal to no less than the market value of the loaned securities determined daily by the securities lending provider. Such collateral will be cash or debt securities issued or guaranteed by the U.S. Government or any of its sponsored agencies. Cash collateral received in connection with these loans is invested in short-term money market instruments or affiliated, unregistered investment companies that comply with Rule 2a-7 under the 1940 Act and money market funds (collectively, "affiliated money market funds") and is shown as such on the Schedule of Investments. The Fund bears the risk of loss with respect to the investment |
| 35 | Invesco Core Plus Bond Fund |
| of collateral. It is the Fund’s policy to obtain additional collateral from or return excess collateral to the borrower by the end of the next business day, following the valuation date of the securities loaned. Therefore, the value of the collateral held may be temporarily less than the value of the securities on loan. When loaning securities, the Fund retains certain benefits of owning the securities, including the economic equivalent of dividends or interest generated by the security. Lending securities entails a risk of loss to the Fund if, and to the extent that, the market value of the securities loaned were to increase and the borrower did not increase the collateral accordingly, and the borrower failed to return the securities. The securities loaned are subject to termination at the option of the borrower or the Fund. Upon termination, the borrower will return to the Fund the securities loaned and the Fund will return the collateral. Upon the failure of the borrower to return the securities, collateral may be liquidated and the securities may be purchased on the open market to replace the loaned securities. The Fund could experience delays and costs in gaining access to the collateral and the securities may lose value during the delay which could result in potential losses to the Fund. Some of these losses may be indemnified by the lending agent. The Fund bears the risk of any deficiency in the amount of the collateral available for return to the borrower due to any loss on the collateral invested. Dividends received on cash collateral investments for securities lending transactions, which are net of compensation to counterparties, are included in Dividends from affiliates on the Statement of Operations. The aggregate value of securities out on loan, if any, is shown as a footnote on the Statement of Assets and Liabilities. |
| K. | Foreign Currency Translations — Foreign currency is valued at the close of the NYSE based on quotations posted by banks and major currency dealers. Portfolio securities and other assets and liabilities denominated in foreign currencies are translated into U.S. dollar amounts at the date of valuation. Purchases and sales of portfolio securities (net of foreign taxes withheld on disposition) and income items denominated in foreign currencies are translated into U.S. dollar amounts on the respective dates of such transactions. The Fund does not separately account for the portion of the results of operations resulting from changes in foreign exchange rates on investments and the fluctuations arising from changes in market prices of securities held. The combined results of changes in foreign exchange rates and the fluctuation of market prices on investments (net of estimated foreign tax withholding) are included with the net realized and unrealized gain or loss from investments in the Statement of Operations. Reported net realized foreign currency gains or losses arise from (1) sales of foreign currencies, (2) currency gains or losses realized between the trade and settlement dates on securities transactions, and (3) the difference between the amounts of dividends, interest, and foreign withholding taxes recorded on the Fund’s books and the U.S. dollar equivalent of the amounts actually received or paid. Net unrealized foreign currency gains and losses arise from changes in the fair values of assets and liabilities, other than investments in securities at fiscal period end, resulting from changes in exchange rates. |
| L. | Forward Foreign Currency Contracts — The Fund may engage in foreign currency transactions either on a spot (i.e. for prompt delivery and settlement) basis, or through forward foreign currency contracts, to manage or minimize currency or exchange rate risk. |
| M. | Futures Contracts — The Fund may enter into futures contracts to manage exposure to interest rate, equity and market price movements and/or currency risks. A futures contract is an agreement between Counterparties to purchase or sell a specified underlying security, currency or commodity (or delivery of a cash settlement price, in the case of an index future) for a fixed price at a future date. The Fund currently invests only in exchange-traded futures and they are standardized as to maturity date and underlying instrument or asset. Initial margin deposits required upon entering into futures contracts are satisfied by the segregation of specific securities or cash as collateral at the futures commission merchant (broker). During the period the futures contracts are open, changes in the value of the contracts are recognized as unrealized gains or losses by recalculating the value of the contracts on a daily basis. Subsequent or variation margin payments are received or made depending upon whether unrealized gains or losses are incurred. These amounts are reflected as receivables or payables on the Statement of Assets and Liabilities. When the contracts are closed or expire, the Fund recognizes a realized gain or loss equal to the difference between the proceeds from, or cost of, the closing transaction and the Fund’s basis in the contract. The net realized gain (loss) and the change in unrealized gain (loss) on futures contracts held during the period is included on the Statement of Operations. The primary risks associated with futures contracts are market risk and the absence of a liquid secondary market. If the Fund were unable to liquidate a futures contract and/or enter into an offsetting closing transaction, the Fund would continue to be subject to market risk with respect to the value of the contracts and continue to be required to maintain the margin deposits on the futures contracts. Futures contracts have minimal Counterparty risk since the exchange’s clearinghouse, as Counterparty to all exchange-traded futures, guarantees the futures against default. Risks may exceed amounts recognized in the Statement of Assets and Liabilities. |
| N. | Call Options Purchased and Written – The Fund may write call options and/or buy call options. A covered call option gives the purchaser of such option the right to buy, and the writer the obligation to sell, the underlying security or foreign currency at the stated exercise price during the option period. An uncovered call option exists without the ownership of the underlying security. Options written by the Fund normally will have expiration dates between three and nine months |
| 36 | Invesco Core Plus Bond Fund |
| from the date written. The exercise price of a call option may be below, equal to, or above the current market value of the underlying security at the time the option is written. |
| O. | Put Options Purchased and Written – The Fund may purchase and write put options including options on securities indexes, or foreign currency and/or futures contracts. By purchasing a put option, the Fund obtains the right (but not the obligation) to sell the option’s underlying instrument at a fixed strike price. In return for this right, the Fund pays an option premium. The option’s underlying instrument may be a security, securities index, or a futures contract. |
| P. | Dollar Rolls and Forward Commitment Transactions - The Fund may enter into dollar roll transactions to enhance the Fund’s performance. The Fund executes its dollar roll transactions in the to be announced (“TBA”) market whereby the Fund makes a forward commitment to purchase a security and, instead of accepting delivery, the position is offset by the sale of the security with a simultaneous agreement to repurchase at a future date. |
| Q. | Leverage Risk — Leverage exists when the Fund can lose more than it originally invests because it purchases or sells an instrument or enters into a transaction without investing an amount equal to the full economic exposure of the instrument or transaction. |
| R. | Collateral —To the extent the Fund has designated or segregated a security as collateral and that security is subsequently sold, it is the Fund’s practice to replace such collateral no later than the next business day. This practice does not apply to securities pledged as collateral for securities lending transactions. |
| S. | Other Risks - Obligations of U.S. Government agencies and authorities receive varying levels of support and may not be backed by the full faith and credit of the U.S. Government, which could affect the Fund’s ability to recover should they default. No assurance can be given that the U.S. Government will provide financial support to its agencies and authorities if it is not obligated by law to do so. |
| Average Daily Net Assets | Rate |
| First $500 million | 0.450% |
| Next $500 million | 0.425% |
| Next $1.5 billion | 0.400% |
| Next $2.5 billion | 0.375% |
| Over $5 billion | 0.350% |
| 37 | Invesco Core Plus Bond Fund |
| 38 | Invesco Core Plus Bond Fund |
| Level 1 | Level 2 | Level 3 | Total | |
| Investments in Securities | ||||
| U.S. Dollar Denominated Bonds & Notes | $— | $2,322,824,543 | $24,236,966 | $2,347,061,509 |
| U.S. Government Sponsored Agency Mortgage-Backed Securities | — | 1,321,745,250 | — | 1,321,745,250 |
| Asset-Backed Securities | — | 1,158,974,910 | 27,049,025 | 1,186,023,935 |
| U.S. Treasury Securities | — | 737,030,423 | — | 737,030,423 |
| Preferred Stocks | 57,770,985 | 18,703,523 | — | 76,474,508 |
| Agency Credit Risk Transfer Notes | — | 27,494,462 | — | 27,494,462 |
| Non-U.S. Dollar Denominated Bonds & Notes | — | 14,008,235 | 0 | 14,008,235 |
| Variable Rate Senior Loan Interests | — | 12,582,244 | 251,250 | 12,833,494 |
| Exchange-Traded Funds | 7,869,038 | — | — | 7,869,038 |
| Municipal Obligations | — | 7,213,632 | — | 7,213,632 |
| Common Stocks & Other Equity Interests | 17,258 | — | 0 | 17,258 |
| Money Market Funds | 806,105,583 | 377,678,208 | — | 1,183,783,791 |
| Options Purchased | 846,900 | — | — | 846,900 |
| Total Investments in Securities | 872,609,764 | 5,998,255,430 | 51,537,241 | 6,922,402,435 |
| Other Investments - Assets* | ||||
| Investments Matured | — | 120,452 | 0 | 120,452 |
| Futures Contracts | 3,232,109 | — | — | 3,232,109 |
| 3,232,109 | 120,452 | 0 | 3,352,561 | |
| Other Investments - Liabilities* | ||||
| Futures Contracts | (8,981,754) | — | — | (8,981,754) |
| Forward Foreign Currency Contracts | — | (299,395) | — | (299,395) |
| (8,981,754) | (299,395) | — | (9,281,149) | |
| Total Other Investments | (5,749,645) | (178,943) | 0 | (5,928,588) |
| Total Investments | $866,860,119 | $5,998,076,487 | $51,537,241 | $6,916,473,847 |
| * | Forward foreign currency contracts and futures contracts are valued at unrealized appreciation (depreciation). Investments matured is shown at value. |
| Value | |||
| Derivative Assets | Equity Risk | Interest Rate Risk | Total |
| Unrealized appreciation on futures contracts —Exchange-Traded(a) | $— | $3,232,109 | $3,232,109 |
| Options purchased, at value — Exchange-Traded(b) | 846,900 | — | 846,900 |
| Total Derivative Assets | 846,900 | 3,232,109 | 4,079,009 |
| Derivatives not subject to master netting agreements | (846,900) | (3,232,109) | (4,079,009) |
| Total Derivative Assets subject to master netting agreements | $— | $— | $— |
| Value | |||
| Derivative Liabilities | Currency Risk | Interest Rate Risk | Total |
| Unrealized depreciation on futures contracts —Exchange-Traded(a) | $— | $(8,981,754) | $(8,981,754) |
| Unrealized depreciation on forward foreign currency contracts outstanding | (299,395) | — | (299,395) |
| Total Derivative Liabilities | (299,395) | (8,981,754) | (9,281,149) |
| Derivatives not subject to master netting agreements | — | 8,981,754 | 8,981,754 |
| Total Derivative Liabilities subject to master netting agreements | $(299,395) | $— | $(299,395) |
| (a) | The daily variation margin receivable (payable) at period end is recorded in the Statement of Assets and Liabilities. |
| (b) | Options purchased, at value as reported in the Schedule of Investments. |
| 39 | Invesco Core Plus Bond Fund |
| Financial Derivative Liabilities | Collateral (Received)/Pledged | ||||
| Counterparty | Forward Foreign Currency Contracts | Net Value of Derivatives | Non-Cash | Cash | Net Amount |
| Morgan Stanley and Co. International PLC | $(11,168) | $(11,168) | $— | $— | $(11,168) |
| State Street Bank & Trust Co. | (288,227) | (288,227) | — | — | (288,227) |
| Total | $(299,395) | $(299,395) | $— | $— | $(299,395) |
| Location of Gain (Loss) on Statement of Operations | ||||
| Currency Risk | Equity Risk | Interest Rate Risk | Total | |
| Realized Gain (Loss): | ||||
| Forward foreign currency contracts | $(953,588) | $- | $- | $(953,588) |
| Futures contracts | - | - | 4,440,282 | 4,440,282 |
| Options purchased(a) | - | 8,677,324 | - | 8,677,324 |
| Options written | - | (1,269,019) | - | (1,269,019) |
| Change in Net Unrealized Appreciation (Depreciation): | ||||
| Forward foreign currency contracts | (530,037) | - | - | (530,037) |
| Futures contracts | - | - | (2,600,144) | (2,600,144) |
| Options purchased(a) | - | 530,449 | - | 530,449 |
| Total | $(1,483,625) | $7,938,754 | $1,840,138 | $8,295,267 |
| (a) | Options purchased are included in the net realized gain (loss) from investment securities and the change in net unrealized appreciation (depreciation) of investment securities. |
| Forward Foreign Currency Contracts | Futures Contracts | Equity Options Purchased | Equity Options Written | Swaptions Written | |
| Average notional value | $24,201,437 | $1,453,734,059 | $69,079,875 | $43,837,500 | $190,141,000 |
| Average contracts | — | — | 136 | 95 | — |
| 40 | Invesco Core Plus Bond Fund |
| Tax Character of Distributions to Shareholders Paid During the Fiscal Years Ended August 31, 2024 and 2023: | ||
| 2024 | 2023 | |
| Ordinary income* | $240,108,870 | $214,702,470 |
| * | Includes short-term capital gain distributions, if any. |
| Tax Components of Net Assets at Period-End: | |
| 2024 | |
| Undistributed ordinary income | $1,802,300 |
| Net unrealized appreciation (depreciation) — investments | (38,110,360) |
| Net unrealized appreciation — foreign currencies | 69,434 |
| Temporary book/tax differences | (107,097) |
| Capital loss carryforward | (808,381,283) |
| Shares of beneficial interest | 6,339,427,637 |
| Total net assets | $5,494,700,631 |
| Capital Loss Carryforward* | |||
| Expiration | Short-Term | Long-Term | Total |
| Not subject to expiration | $423,802,842 | $384,578,441 | $808,381,283 |
| * | Capital loss carryforward is reduced for limitations, if any, to the extent required by the Internal Revenue Code and may be further limited depending upon a variety of factors, including the realization of net unrealized gains or losses as of the date of any reorganization. |
| Unrealized Appreciation (Depreciation) of Investments on a Tax Basis | |
| Aggregate unrealized appreciation of investments | $88,382,475 |
| Aggregate unrealized (depreciation) of investments | (126,492,835) |
| Net unrealized appreciation (depreciation) of investments | $(38,110,360) |
| Summary of Share Activity | |||||
| Year ended August 31, 2024(a) | Year ended August 31, 2023 | ||||
| Shares | Amount | Shares | Amount | ||
| Sold: | |||||
| Class A | 30,218,199 | $274,064,215 | 28,785,198 | $262,484,547 | |
| Class C | 1,126,682 | 10,204,462 | 1,172,591 | 10,736,154 | |
| Class R | 1,103,259 | 9,977,510 | 889,433 | 8,136,487 | |
| Class Y | 91,933,978 | 840,671,422 | 66,119,597 | 606,456,207 | |
| Class R5 | 510,984 | 4,643,618 | 244,753 | 2,245,682 | |
| Class R6 | 67,574,675 | 611,905,621 | 54,450,561 | 497,141,060 | |
| 41 | Invesco Core Plus Bond Fund |
| Summary of Share Activity | |||||
| Year ended August 31, 2024(a) | Year ended August 31, 2023 | ||||
| Shares | Amount | Shares | Amount | ||
| Issued as reinvestment of dividends: | |||||
| Class A | 5,669,628 | $51,342,454 | 5,166,836 | $47,116,744 | |
| Class C | 168,090 | 1,520,821 | 176,852 | 1,612,433 | |
| Class R | 142,379 | 1,289,554 | 121,152 | 1,104,496 | |
| Class Y | 3,950,670 | 35,823,959 | 3,201,829 | 29,212,939 | |
| Class R5 | 83,341 | 754,580 | 72,971 | 664,906 | |
| Class R6 | 13,028,169 | 117,883,151 | 11,856,400 | 107,986,171 | |
| Automatic conversion of Class C shares to Class A shares: | |||||
| Class A | 588,477 | 5,336,670 | 424,180 | 3,868,465 | |
| Class C | (588,607) | (5,336,670) | (424,224) | (3,868,465) | |
| Reacquired: | |||||
| Class A | (30,281,657) | (274,199,694) | (26,363,942) | (240,503,968) | |
| Class C | (1,438,161) | (13,009,531) | (1,545,819) | (14,113,518) | |
| Class R | (814,925) | (7,334,495) | (691,090) | (6,295,390) | |
| Class Y | (54,996,120) | (497,483,515) | (58,844,200) | (536,148,001) | |
| Class R5 | (327,420) | (2,947,298) | (199,271) | (1,827,031) | |
| Class R6 | (67,682,854) | (613,074,234) | (52,434,871) | (478,162,245) | |
| Net increase in share activity | 59,968,787 | $552,032,600 | 32,178,936 | $297,847,673 | |
| (a) | There are entities that are record owners of more than 5% of the outstanding shares of the Fund and in the aggregate own 57% of the outstanding shares of the Fund. IDI has an agreement with these entities to sell Fund shares. The Fund, Invesco and/or Invesco affiliates may make payments to these entities, which are considered to be related to the Fund, for providing services to the Fund, Invesco and/or Invesco affiliates including but not limited to services such as securities brokerage, distribution, third party record keeping and account servicing. The Fund has no knowledge as to whether all or any portion of the shares owned of record by these entities are also owned beneficially. |
| 42 | Invesco Core Plus Bond Fund |
| 43 | Invesco Core Plus Bond Fund |
| A. | Nature, Extent and Quality of Services Provided by Invesco Advisers and the Affiliated Sub-Advisers |
| B. | Fund Investment Performance |
| 44 | Invesco Core Plus Bond Fund |
| C. | Advisory and Sub-Advisory Fees and Fund Expenses |
| D. | Economies of Scale and Breakpoints |
| E. | Profitability and Financial Resources |
| F. | Collateral Benefits to Invesco Advisers and its Affiliates |
| 45 | Invesco Core Plus Bond Fund |
| Federal and State Income Tax | |
| Qualified Dividend Income* | 4.44% |
| Corporate Dividends Received Deduction* | 3.40% |
| U.S. Treasury Obligations* | 8.25% |
| Qualified Business Income* | 0.00% |
| Business Interest Income* | 82.70% |
| * | The above percentages are based on ordinary income dividends paid to shareholders during the Fund’s fiscal year. |
| 46 | Invesco Core Plus Bond Fund |
| 47 | Invesco Core Plus Bond Fund |

| Annual Financial Statements and Other Information | August 31, 2024 |
| Shares | Value | ||
| Common Stocks & Other Equity Interests–98.79% | |||
| Aerospace & Defense–1.99% | |||
| AeroVironment, Inc.(b) | 90,605 | $18,461,675 | |
| Curtiss-Wright Corp. | 204,584 | 64,619,902 | |
| Loar Holdings, Inc.(b) | 148,021 | 10,977,237 | |
| 94,058,814 | |||
| Apparel Retail–1.06% | |||
| Abercrombie & Fitch Co., Class A(b) | 144,076 | 21,261,295 | |
| Boot Barn Holdings, Inc.(b) | 214,664 | 28,801,469 | |
| 50,062,764 | |||
| Application Software–7.40% | |||
| Altair Engineering, Inc., Class A(b) | 586,487 | 52,994,965 | |
| AppFolio, Inc., Class A(b) | 241,317 | 55,983,131 | |
| Clearwater Analytics Holdings, Inc., Class A(b) | 1,419,028 | 35,163,514 | |
| Confluent, Inc., Class A(b) | 859,717 | 18,243,195 | |
| Guidewire Software, Inc.(b) | 481,461 | 71,626,953 | |
| Q2 Holdings, Inc.(b) | 837,715 | 62,166,830 | |
| SPS Commerce, Inc.(b) | 263,897 | 52,710,787 | |
| 348,889,375 | |||
| Asset Management & Custody Banks–4.13% | |||
| Cohen & Steers, Inc. | 331,290 | 29,604,074 | |
| Hamilton Lane, Inc., Class A | 722,851 | 110,480,547 | |
| StepStone Group, Inc., Class A | 996,893 | 54,530,047 | |
| 194,614,668 | |||
| Automotive Parts & Equipment–1.75% | |||
| Modine Manufacturing Co.(b) | 677,729 | 82,377,960 | |
| Biotechnology–6.54% | |||
| ADMA Biologics, Inc.(b) | 690,714 | 11,956,259 | |
| Blueprint Medicines Corp.(b) | 321,355 | 30,702,257 | |
| Cytokinetics, Inc.(b) | 231,517 | 13,214,990 | |
| Halozyme Therapeutics, Inc.(b) | 762,485 | 48,684,667 | |
| Insmed, Inc.(b) | 424,183 | 32,437,274 | |
| Krystal Biotech, Inc.(b) | 173,147 | 33,784,443 | |
| Merus N.V. (Netherlands)(b) | 328,111 | 16,730,380 | |
| SpringWorks Therapeutics, Inc.(b) | 286,073 | 11,932,105 | |
| Twist Bioscience Corp.(b) | 839,651 | 36,306,509 | |
| Ultragenyx Pharmaceutical, Inc.(b) | 377,469 | 21,432,690 | |
| Vaxcyte, Inc.(b) | 265,179 | 21,415,856 | |
| Vericel Corp.(b) | 406,803 | 21,011,375 | |
| Viking Therapeutics, Inc.(b) | 138,753 | 8,896,842 | |
| 308,505,647 | |||
| Broadline Retail–1.16% | |||
| Ollie’s Bargain Outlet Holdings, Inc.(b) | 613,145 | 54,913,266 | |
| Building Products–2.05% | |||
| AAON, Inc. | 595,368 | 56,863,598 | |
| AZEK Co., Inc. (The)(b) | 939,753 | 40,061,670 | |
| 96,925,268 | |||
| Casinos & Gaming–0.72% | |||
| Red Rock Resorts, Inc., Class A | 584,202 | 34,047,293 | |
| Shares | Value | ||
| Commercial & Residential Mortgage Finance–1.82% | |||
| Essent Group Ltd. | 388,741 | $24,992,159 | |
| Mr. Cooper Group, Inc.(b) | 646,798 | 60,676,120 | |
| 85,668,279 | |||
| Construction & Engineering–2.46% | |||
| Comfort Systems USA, Inc. | 328,177 | 116,017,133 | |
| Construction Machinery & Heavy Transportation Equipment– 1.38% | |||
| Federal Signal Corp. | 691,293 | 65,320,276 | |
| Construction Materials–0.83% | |||
| Eagle Materials, Inc. | 151,858 | 39,141,399 | |
| Education Services–1.46% | |||
| Duolingo, Inc.(b) | 324,238 | 68,923,272 | |
| Electronic Components–1.39% | |||
| Coherent Corp.(b) | 842,559 | 65,677,474 | |
| Electronic Equipment & Instruments–1.60% | |||
| Itron, Inc.(b) | 367,950 | 37,611,849 | |
| Novanta, Inc.(b) | 205,469 | 37,658,358 | |
| 75,270,207 | |||
| Electronic Manufacturing Services–1.98% | |||
| Celestica, Inc. (Canada)(b) | 955,255 | 48,641,585 | |
| Fabrinet (Thailand)(b) | 183,620 | 44,739,013 | |
| 93,380,598 | |||
| Environmental & Facilities Services–4.05% | |||
| Casella Waste Systems, Inc., Class A(b) | 616,488 | 66,494,396 | |
| Clean Harbors, Inc.(b) | 505,641 | 124,337,122 | |
| 190,831,518 | |||
| Health Care Equipment–3.81% | |||
| Glaukos Corp.(b) | 476,504 | 63,799,121 | |
| Inspire Medical Systems, Inc.(b) | 122,432 | 22,015,722 | |
| Integer Holdings Corp.(b) | 367,526 | 47,804,107 | |
| TransMedics Group, Inc.(b) | 273,254 | 45,923,067 | |
| 179,542,017 | |||
| Health Care Facilities–3.46% | |||
| Acadia Healthcare Co., Inc.(b) | 242,717 | 19,885,804 | |
| Encompass Health Corp. | 953,778 | 88,749,043 | |
| Select Medical Holdings Corp. | 847,216 | 30,559,081 | |
| Surgery Partners, Inc.(b) | 754,611 | 24,109,821 | |
| 163,303,749 | |||
| Health Care Services–1.56% | |||
| BrightSpring Health Services, Inc.(b) | 1,009,679 | 12,671,472 | |
| Guardant Health, Inc.(b) | 367,619 | 9,403,694 | |
| RadNet, Inc.(b) | 777,787 | 51,559,500 | |
| 73,634,666 | |||
| Health Care Supplies–1.98% | |||
| Lantheus Holdings, Inc.(b) | 248,086 | 26,413,716 | |
| Merit Medical Systems, Inc.(b) | 345,900 | 33,441,612 | |
| 2 | Invesco Discovery Fund |
| Shares | Value | ||
| Health Care Supplies–(continued) | |||
| RxSight, Inc.(b) | 593,868 | $33,488,217 | |
| 93,343,545 | |||
| Homebuilding–1.53% | |||
| Taylor Morrison Home Corp., Class A(b) | 723,864 | 48,737,763 | |
| TopBuild Corp.(b) | 59,227 | 23,277,396 | |
| 72,015,159 | |||
| Industrial Machinery & Supplies & Components–4.44% | |||
| Crane Co. | 410,750 | 65,054,585 | |
| ESAB Corp. | 419,435 | 44,028,092 | |
| Flowserve Corp. | 468,607 | 23,374,117 | |
| SPX Technologies, Inc.(b) | 472,670 | 77,111,384 | |
| 209,568,178 | |||
| Industrial REITs–0.89% | |||
| Terreno Realty Corp. | 609,908 | 42,108,048 | |
| Investment Banking & Brokerage–2.73% | |||
| Evercore, Inc., Class A | 414,000 | 101,736,360 | |
| Piper Sandler Cos. | 99,256 | 27,067,111 | |
| 128,803,471 | |||
| Life Sciences Tools & Services–1.02% | |||
| Medpace Holdings, Inc.(b) | 63,899 | 22,701,398 | |
| Repligen Corp.(b) | 169,568 | 25,592,898 | |
| 48,294,296 | |||
| Managed Health Care–1.14% | |||
| HealthEquity, Inc.(b) | 676,121 | 53,792,187 | |
| Marine Transportation–0.97% | |||
| Kirby Corp.(b) | 383,535 | 45,993,517 | |
| Office REITs–0.49% | |||
| Highwoods Properties, Inc. | 720,165 | 23,203,716 | |
| Oil & Gas Equipment & Services–2.93% | |||
| Archrock, Inc. | 982,376 | 19,873,467 | |
| TechnipFMC PLC (United Kingdom) | 2,138,640 | 57,401,098 | |
| Tidewater, Inc.(b) | 290,992 | 25,810,990 | |
| Weatherford International PLC | 333,928 | 35,042,404 | |
| 138,127,959 | |||
| Oil & Gas Exploration & Production–0.62% | |||
| Northern Oil and Gas, Inc. | 741,301 | 29,488,954 | |
| Packaged Foods & Meats–1.25% | |||
| Freshpet, Inc.(b) | 433,749 | 58,989,864 | |
| Personal Care Products–1.29% | |||
| BellRing Brands, Inc.(b) | 462,983 | 25,894,639 | |
| e.l.f. Beauty, Inc.(b) | 233,493 | 34,974,917 | |
| 60,869,556 | |||
| Pharmaceuticals–0.86% | |||
| Intra-Cellular Therapies, Inc.(b) | 552,587 | 40,493,575 | |
| Property & Casualty Insurance–0.41% | |||
| Kinsale Capital Group, Inc. | 39,807 | 19,548,820 | |
| Research & Consulting Services–1.18% | |||
| Parsons Corp.(b) | 580,969 | 55,459,301 | |
| Shares | Value | ||
| Restaurants–5.24% | |||
| Cava Group, Inc.(b)(c) | 325,377 | $37,105,993 | |
| Shake Shack, Inc., Class A(b) | 262,621 | 26,107,153 | |
| Sweetgreen, Inc., Class A(b) | 967,893 | 30,595,098 | |
| Texas Roadhouse, Inc. | 390,796 | 65,946,825 | |
| Wingstop, Inc. | 225,910 | 87,226,110 | |
| 246,981,179 | |||
| Semiconductor Materials & Equipment–3.38% | |||
| Nova Ltd. (Israel)(b) | 350,835 | 78,429,164 | |
| Onto Innovation, Inc.(b) | 379,347 | 80,884,368 | |
| 159,313,532 | |||
| Semiconductors–4.23% | |||
| Allegro MicroSystems, Inc. (Japan)(b) | 1,502,404 | 36,853,970 | |
| Astera Labs, Inc.(b)(c) | 182,665 | 7,865,555 | |
| Impinj, Inc.(b) | 247,683 | 41,635,512 | |
| MACOM Technology Solutions Holdings, Inc.(b) | 601,934 | 65,749,251 | |
| SiTime Corp.(b) | 326,467 | 47,226,716 | |
| 199,331,004 | |||
| Specialty Chemicals–0.96% | |||
| Element Solutions, Inc. | 1,685,867 | 45,080,084 | |
| Steel–3.28% | |||
| ATI, Inc.(b) | 1,043,520 | 66,660,057 | |
| Carpenter Technology Corp. | 607,871 | 88,001,485 | |
| 154,661,542 | |||
| Systems Software–4.11% | |||
| CyberArk Software Ltd.(b) | 284,537 | 81,588,139 | |
| JFrog Ltd. (Israel)(b) | 743,344 | 20,635,229 | |
| OneStream, Inc.(b) | 317,806 | 9,851,986 | |
| SentinelOne, Inc., Class A(b) | 934,944 | 22,027,281 | |
| Varonis Systems, Inc.(b) | 1,052,298 | 59,560,067 | |
| 193,662,702 | |||
| Trading Companies & Distributors–1.26% | |||
| Applied Industrial Technologies, Inc. | 175,144 | 35,925,537 | |
| H&E Equipment Services, Inc. | 490,860 | 23,634,909 | |
| 59,560,446 | |||
| Total Common Stocks & Other Equity Interests (Cost $3,301,622,841) | 4,659,796,278 | ||
| Money Market Funds–1.09% | |||
| Invesco Government & Agency Portfolio, Institutional Class, 5.18%(d)(e) | 17,945,665 | 17,945,665 | |
| Invesco Treasury Portfolio, Institutional Class, 5.15%(d)(e) | 33,326,481 | 33,326,481 | |
| Total Money Market Funds (Cost $51,272,146) | 51,272,146 | ||
| TOTAL INVESTMENTS IN SECURITIES (excluding investments purchased with cash collateral from securities on loan)-99.88% (Cost $3,352,894,987) | 4,711,068,424 | ||
| Investments Purchased with Cash Collateral from Securities on Loan | |||
| Money Market Funds–0.08% | |||
| Invesco Private Government Fund, 5.28%(d)(e)(f) | 742,930 | 742,930 | |
| 3 | Invesco Discovery Fund |
| Shares | Value | ||
| Money Market Funds–(continued) | |||
| Invesco Private Prime Fund, 5.46%(d)(e)(f) | 3,210,005 | $3,211,289 | |
| Total Investments Purchased with Cash Collateral from Securities on Loan (Cost $3,954,038) | 3,954,219 | ||
| TOTAL INVESTMENTS IN SECURITIES–99.96% (Cost $3,356,849,025) | 4,715,022,643 | ||
| OTHER ASSETS LESS LIABILITIES—0.04% | 1,831,511 | ||
| NET ASSETS–100.00% | $4,716,854,154 | ||
| REIT | – Real Estate Investment Trust |
| (a) | Industry and/or sector classifications used in this report are generally according to the Global Industry Classification Standard, which was developed by and is the exclusive property and a service mark of MSCI Inc. and Standard & Poor’s. |
| (b) | Non-income producing security. |
| (c) | All or a portion of this security was out on loan at August 31, 2024. |
| (d) | Affiliated holding. Affiliated holdings are investments in entities which are under common ownership or control of Invesco Ltd. or are investments in entities in which the Fund owns 5% or more of the outstanding voting securities. The table below shows the Fund’s transactions in, and earnings from, its investments in affiliates for the fiscal year ended August 31, 2024. |
| Value August 31, 2023 | Purchases at Cost | Proceeds from Sales | Change in Unrealized Appreciation (Depreciation) | Realized Gain (Loss) | Value August 31, 2024 | Dividend Income | |
| Investments in Affiliated Money Market Funds: | |||||||
| Invesco Government & Agency Portfolio, Institutional Class | $20,168,870 | $566,175,393 | $(568,398,598) | $- | $- | $17,945,665 | $1,750,521 |
| Invesco Liquid Assets Portfolio, Institutional Class | 14,395,120 | 366,875,863 | (381,281,017) | (291) | 10,325 | - | 1,156,366 |
| Invesco Treasury Portfolio, Institutional Class | 23,050,137 | 697,858,171 | (687,581,827) | - | - | 33,326,481 | 2,118,082 |
| Investments Purchased with Cash Collateral from Securities on Loan: | |||||||
| Invesco Private Government Fund | 3,676,446 | 103,151,626 | (106,085,142) | - | - | 742,930 | 149,046* |
| Invesco Private Prime Fund | 9,453,716 | 205,015,397 | (211,258,147) | 473 | (150) | 3,211,289 | 410,769* |
| Total | $70,744,289 | $1,939,076,450 | $(1,954,604,731) | $182 | $10,175 | $55,226,365 | $5,584,784 |
| * | Represents the income earned on the investment of cash collateral, which is included in securities lending income on the Statement of Operations. Does not include rebates and fees paid to lending agent or premiums received from borrowers, if any. |
| (e) | The rate shown is the 7-day SEC standardized yield as of August 31, 2024. |
| (f) | The security has been segregated to satisfy the commitment to return the cash collateral received in securities lending transactions upon the borrower’s return of the securities loaned. See Note 1I. |
| 4 | Invesco Discovery Fund |
| Assets: | |
| Investments in unaffiliated securities, at value (Cost $3,301,622,841)* | $4,659,796,278 |
| Investments in affiliated money market funds, at value (Cost $55,226,184) | 55,226,365 |
| Cash | 1,000,000 |
| Receivable for: | |
| Investments sold | 10,805,291 |
| Fund shares sold | 2,435,440 |
| Dividends | 2,279,931 |
| Investment for trustee deferred compensation and retirement plans | 155,683 |
| Other assets | 73,756 |
| Total assets | 4,731,772,744 |
| Liabilities: | |
| Payable for: | |
| Investments purchased | 6,638,700 |
| Fund shares reacquired | 2,319,163 |
| Collateral upon return of securities loaned | 3,954,038 |
| Accrued fees to affiliates | 1,656,441 |
| Accrued trustees’ and officers’ fees and benefits | 40,553 |
| Accrued other operating expenses | 111,001 |
| Trustee deferred compensation and retirement plans | 198,694 |
| Total liabilities | 14,918,590 |
| Net assets applicable to shares outstanding | $4,716,854,154 |
| Net assets consist of: | |
| Shares of beneficial interest | $3,218,733,189 |
| Distributable earnings | 1,498,120,965 |
| $4,716,854,154 |
| Net Assets: | |
| Class A | $1,551,033,997 |
| Class C | $28,689,753 |
| Class R | $42,245,253 |
| Class Y | $1,810,579,275 |
| Class R5 | $2,459,563 |
| Class R6 | $1,281,846,313 |
| Shares outstanding, no par value, with an unlimited number of shares authorized: | |
| Class A | 15,716,108 |
| Class C | 598,648 |
| Class R | 499,957 |
| Class Y | 14,819,390 |
| Class R5 | 24,420 |
| Class R6 | 10,125,510 |
| Class A: | |
| Net asset value per share | $98.69 |
| Maximum offering price per share (Net asset value of $98.69 ÷ 94.50%) | $104.43 |
| Class C: | |
| Net asset value and offering price per share | $47.92 |
| Class R: | |
| Net asset value and offering price per share | $84.50 |
| Class Y: | |
| Net asset value and offering price per share | $122.18 |
| Class R5: | |
| Net asset value and offering price per share | $100.72 |
| Class R6: | |
| Net asset value and offering price per share | $126.60 |
| * | At August 31, 2024, securities with an aggregate value of $3,458,296 were on loan to brokers. |
| 5 | Invesco Discovery Fund |
| Investment income: | |
| Dividends | $16,751,696 |
| Dividends from affiliated money market funds (includes net securities lending income of $774,659) | 5,799,628 |
| Total investment income | 22,551,324 |
| Expenses: | |
| Advisory fees | 24,237,152 |
| Administrative services fees | 588,455 |
| Custodian fees | 27,295 |
| Distribution fees: | |
| Class A | 3,356,416 |
| Class C | 283,103 |
| Class R | 199,330 |
| Transfer agent fees — A, C, R and Y | 5,110,715 |
| Transfer agent fees — R5 | 1,157 |
| Transfer agent fees — R6 | 305,942 |
| Trustees’ and officers’ fees and benefits | 68,602 |
| Registration and filing fees | 140,055 |
| Reports to shareholders | 524,833 |
| Professional services fees | 81,339 |
| Other | 64,991 |
| Total expenses | 34,989,385 |
| Less: Fees waived and/or expense offset arrangement(s) | (190,626) |
| Net expenses | 34,798,759 |
| Net investment income (loss) | (12,247,435) |
| Realized and unrealized gain from: | |
| Net realized gain from: | |
| Unaffiliated investment securities | 368,150,002 |
| Affiliated investment securities | 10,175 |
| 368,160,177 | |
| Change in net unrealized appreciation of: | |
| Unaffiliated investment securities | 496,018,601 |
| Affiliated investment securities | 182 |
| 496,018,783 | |
| Net realized and unrealized gain | 864,178,960 |
| Net increase in net assets resulting from operations | $851,931,525 |
| 6 | Invesco Discovery Fund |
| 2024 | 2023 | |
| Operations: | ||
| Net investment income (loss) | $(12,247,435) | $(11,353,865) |
| Net realized gain (loss) | 368,160,177 | (885,161) |
| Change in net unrealized appreciation | 496,018,783 | 257,794,844 |
| Net increase in net assets resulting from operations | 851,931,525 | 245,555,818 |
| Share transactions–net: | ||
| Class A | (135,455,428) | (120,045,922) |
| Class C | (5,641,457) | (5,877,866) |
| Class R | (6,485,657) | (3,108,459) |
| Class Y | (7,565,495) | (138,581,797) |
| Class R5 | 701,362 | 126,866 |
| Class R6 | 229,657,113 | 199,582,949 |
| Net increase (decrease) in net assets resulting from share transactions | 75,210,438 | (67,904,229) |
| Net increase in net assets | 927,141,963 | 177,651,589 |
| Net assets: | ||
| Beginning of year | 3,789,712,191 | 3,612,060,602 |
| End of year | $4,716,854,154 | $3,789,712,191 |
| 7 | Invesco Discovery Fund |
| Net asset value, beginning of period | Net investment income (loss)(a) | Net gains (losses) on securities (both realized and unrealized) | Total from investment operations | Distributions from net realized gains | Net asset value, end of period | Total return(b) | Net assets, end of period (000’s omitted) | Ratio of expenses to average net assets with fee waivers and/or expenses absorbed | Ratio of expenses to average net assets without fee waivers and/or expenses absorbed | Ratio of net investment income (loss) to average net assets | Portfolio turnover (c) | |
| Class A | ||||||||||||
| Year ended 08/31/24 | $80.68 | $(0.41) | $18.42 | $18.01 | $— | $98.69 | 22.33%(d) | $1,551,034 | 1.04%(d) | 1.04%(d) | (0.49)%(d) | 86% |
| Year ended 08/31/23 | 75.57 | (0.36) | 5.47 | 5.11 | — | 80.68 | 6.76(d) | 1,394,517 | 1.03(d) | 1.03(d) | (0.48)(d) | 83 |
| Year ended 08/31/22 | 124.56 | (0.49) | (27.15) | (27.64) | (21.35) | 75.57 | (26.13)(d) | 1,425,847 | 1.02(d) | 1.02(d) | (0.54)(d) | 84 |
| Year ended 08/31/21 | 101.13 | (0.85) | 36.59 | 35.74 | (12.31) | 124.56 | 37.24(d) | 2,090,984 | 1.01(d) | 1.01(d) | (0.74)(d) | 61 |
| Year ended 08/31/20 | 84.02 | (0.59) | 22.93 | 22.34 | (5.23) | 101.13 | 28.07(d) | 1,656,602 | 1.05(d) | 1.05(d) | (0.71)(d) | 76 |
| Class C | ||||||||||||
| Year ended 08/31/24 | 39.48 | (0.52) | 8.96 | 8.44 | — | 47.92 | 21.38 | 28,690 | 1.80 | 1.80 | (1.25) | 86 |
| Year ended 08/31/23 | 37.26 | (0.46) | 2.68 | 2.22 | — | 39.48 | 5.96 | 28,808 | 1.79 | 1.79 | (1.24) | 83 |
| Year ended 08/31/22 | 73.13 | (0.63) | (13.89) | (14.52) | (21.35) | 37.26 | (26.68) | 33,135 | 1.78 | 1.78 | (1.30) | 84 |
| Year ended 08/31/21 | 64.09 | (1.03) | 22.38 | 21.35 | (12.31) | 73.13 | 36.20 | 56,388 | 1.78 | 1.78 | (1.51) | 61 |
| Year ended 08/31/20 | 55.50 | (0.79) | 14.61 | 13.82 | (5.23) | 64.09 | 27.08 | 74,315 | 1.82 | 1.82 | (1.48) | 76 |
| Class R | ||||||||||||
| Year ended 08/31/24 | 69.27 | (0.55) | 15.78 | 15.23 | — | 84.50 | 21.98 | 42,245 | 1.30 | 1.30 | (0.75) | 86 |
| Year ended 08/31/23 | 65.06 | (0.48) | 4.69 | 4.21 | — | 69.27 | 6.47 | 40,864 | 1.29 | 1.29 | (0.74) | 83 |
| Year ended 08/31/22 | 110.57 | (0.64) | (23.52) | (24.16) | (21.35) | 65.06 | (26.31) | 41,445 | 1.28 | 1.28 | (0.80) | 84 |
| Year ended 08/31/21 | 91.16 | (1.03) | 32.75 | 31.72 | (12.31) | 110.57 | 36.89 | 64,908 | 1.28 | 1.28 | (1.01) | 61 |
| Year ended 08/31/20 | 76.43 | (0.74) | 20.70 | 19.96 | (5.23) | 91.16 | 27.72 | 53,981 | 1.32 | 1.32 | (0.98) | 76 |
| Class Y | ||||||||||||
| Year ended 08/31/24 | 99.65 | (0.26) | 22.79 | 22.53 | — | 122.18 | 22.61 | 1,810,579 | 0.80 | 0.80 | (0.25) | 86 |
| Year ended 08/31/23 | 93.12 | (0.22) | 6.75 | 6.53 | — | 99.65 | 7.01 | 1,490,868 | 0.79 | 0.79 | (0.24) | 83 |
| Year ended 08/31/22 | 147.99 | (0.33) | (33.19) | (33.52) | (21.35) | 93.12 | (25.94) | 1,532,285 | 0.78 | 0.78 | (0.30) | 84 |
| Year ended 08/31/21 | 117.95 | (0.69) | 43.04 | 42.35 | (12.31) | 147.99 | 37.56 | 1,769,717 | 0.78 | 0.78 | (0.51) | 61 |
| Year ended 08/31/20 | 96.93 | (0.46) | 26.71 | 26.25 | (5.23) | 117.95 | 28.37 | 1,316,860 | 0.82 | 0.82 | (0.48) | 76 |
| Class R5 | ||||||||||||
| Year ended 08/31/24 | 82.05 | (0.12) | 18.79 | 18.67 | — | 100.72 | 22.76 | 2,460 | 0.69 | 0.69 | (0.14) | 86 |
| Year ended 08/31/23 | 76.48 | (0.09) | 5.66 | 5.57 | — | 82.05 | 7.28 | 1,364 | 0.68 | 0.68 | (0.13) | 83 |
| Year ended 08/31/22 | 125.62 | (0.28) | (27.51) | (27.79) | (21.35) | 76.48 | (26.01) | 1,139 | 0.71 | 0.71 | (0.23) | 84 |
| Year ended 08/31/21 | 101.62 | (0.52) | 36.83 | 36.31 | (12.31) | 125.62 | 37.67 | 15,580 | 0.72 | 0.72 | (0.45) | 61 |
| Year ended 08/31/20 | 84.11 | (0.27) | 23.01 | 22.74 | (5.23) | 101.62 | 28.54 | 15,413 | 0.68 | 0.68 | (0.34) | 76 |
| Class R6 | ||||||||||||
| Year ended 08/31/24 | 103.11 | (0.12) | 23.61 | 23.49 | — | 126.60 | 22.78 | 1,281,846 | 0.66 | 0.66 | (0.11) | 86 |
| Year ended 08/31/23 | 96.23 | (0.10) | 6.98 | 6.88 | — | 103.11 | 7.15 | 833,290 | 0.66 | 0.66 | (0.11) | 83 |
| Year ended 08/31/22 | 152.02 | (0.19) | (34.25) | (34.44) | (21.35) | 96.23 | (25.85) | 578,210 | 0.65 | 0.65 | (0.17) | 84 |
| Year ended 08/31/21 | 120.70 | (0.50) | 44.13 | 43.63 | (12.31) | 152.02 | 37.78 | 553,738 | 0.63 | 0.63 | (0.36) | 61 |
| Year ended 08/31/20 | 98.92 | (0.30) | 27.31 | 27.01 | (5.23) | 120.70 | 28.58 | 329,915 | 0.65 | 0.65 | (0.31) | 76 |
| (a) | Calculated using average shares outstanding. |
| (b) | Includes adjustments in accordance with accounting principles generally accepted in the United States of America and as such, the net asset value for financial reporting purposes and the returns based upon those net asset values may differ from the net asset value and returns for shareholder transactions. Does not include sales charges and is not annualized for periods less than one year, if applicable. |
| (c) | Portfolio turnover is calculated at the fund level and is not annualized for periods less than one year, if applicable. |
| (d) | The total return, ratios of expenses to average net assets and ratio of net investment income to average net assets reflect actual 12b-1 fees of 0.24% for the years ended August 31, 2024, 2023 and 2022 and 0.23% for the years ended August 31, 2021 and 2020. |
| 8 | Invesco Discovery Fund |
| A. | Security Valuations — Securities, including restricted securities, are valued according to the following policy. |
| 9 | Invesco Discovery Fund |
| B. | Securities Transactions and Investment Income — Securities transactions are accounted for on a trade date basis. Realized gains or losses on sales are computed on the basis of specific identification of the securities sold. Interest income (net of withholding tax, if any) is recorded on an accrual basis from settlement date and includes coupon interest and amortization of premium and accretion of discount on debt securities as applicable. Pay-in-kind interest income and non-cash dividend income received in the form of securities in lieu of cash are recorded at the fair value of the securities received. Dividend income (net of withholding tax, if any) is recorded on the ex-dividend date. |
| C. | Country Determination — For the purposes of making investment selection decisions and presentation in the Schedule of Investments, the investment adviser may determine the country in which an issuer is located and/or credit risk exposure based on various factors. These factors include the laws of the country under which the issuer is organized, where the issuer maintains a principal office, the country in which the issuer derives 50% or more of its total revenues, the country that has the primary market for the issuer’s securities and its "country of risk" as determined by a third party service provider, as well as other criteria. Among the other criteria that may be evaluated for making this determination are the country in which the issuer maintains 50% or more of its assets, the type of security, financial guarantees and enhancements, the nature of the collateral and the sponsor organization. Country of issuer and/or credit risk exposure has been determined to be the United States of America, unless otherwise noted. |
| D. | Distributions – Distributions from net investment income and net realized capital gain, if any, are generally declared and paid annually and recorded on the ex-dividend date. The Fund may elect to treat a portion of the proceeds from redemptions as distributions for federal income tax purposes. |
| E. | Federal Income Taxes – The Fund intends to comply with the requirements of Subchapter M of the Internal Revenue Code of 1986, as amended (the “Internal Revenue Code”), necessary to qualify as a regulated investment company and to distribute substantially all of the Fund’s taxable earnings to shareholders. As such, the Fund will not be subject to federal income taxes on otherwise taxable income (including net realized capital gain) that is distributed to shareholders. Therefore, no provision for federal income taxes is recorded in the financial statements. |
| F. | Expenses – Fees provided for under the Rule 12b-1 plan of a particular class of the Fund are charged to the operations of such class. Transfer agency fees and expenses and other shareholder recordkeeping fees and expenses attributable to Class R5 and Class R6 are allocated based on relative net assets of Class R5 and Class R6. Sub-accounting fees attributable to Class R5 are charged to the operations of the class. Transfer agency fees and expenses and other shareholder recordkeeping fees and expenses relating to all other classes are allocated among those classes based on relative net assets. All other expenses are allocated among the classes based on relative net assets. |
| G. | Accounting Estimates – The preparation of financial statements in conformity with accounting principles generally accepted in the United States of America (“GAAP”) requires management to make estimates and assumptions that affect the reported amounts of assets and liabilities at the date of the financial statements and the reported amounts of revenues and expenses during the reporting period including estimates and assumptions related to taxation. Actual results could differ from those estimates by a significant amount. In addition, the Fund monitors for material events or transactions that may occur or become known after the period-end date and before the date the financial statements are released to print. |
| H. | Indemnifications – Under the Trust’s organizational documents, each Trustee, officer, employee or other agent of the Trust is indemnified against certain liabilities that may arise out of the performance of their duties to the Fund. Additionally, in the normal course of business, the Fund enters into contracts, including the Fund’s servicing agreements, that contain a variety of indemnification clauses. The Fund’s maximum exposure under these arrangements is unknown as this would involve future claims that may be made against the Fund that have not yet occurred. The risk of material loss as a result of such indemnification claims is considered remote. |
| I. | Securities Lending – The Fund may lend portfolio securities having a market value up to one-third of the Fund’s total assets. Such loans are secured by collateral equal to no less than the market value of the loaned securities determined daily by the securities lending provider. Such collateral will be cash or debt securities issued or guaranteed by the U.S. Government or any of its sponsored agencies. Cash collateral received in connection with these loans is invested in short-term money market instruments or affiliated, unregistered investment companies that comply with Rule 2a-7 under the 1940 Act and money market funds (collectively, "affiliated money market funds") and is shown as such on the Schedule of Investments. The Fund bears the risk of loss with respect to the investment of collateral. It is the Fund’s policy to obtain additional collateral from or return excess collateral to the borrower by the end of the next business day, following the valuation date of the securities loaned. Therefore, the value of the collateral held may be temporarily less than the value of the securities on loan. When loaning securities, the Fund retains certain benefits of owning the securities, including the economic equivalent of dividends or interest generated by the security. Lending securities entails a risk of loss to the Fund if, and to the extent that, the market value of the securities loaned were to increase and the borrower did not increase the collateral accordingly, and the borrower failed to return the securities. The securities loaned are subject to termination at the option of the borrower or the Fund. Upon termination, the borrower will return to the Fund the securities loaned and the Fund will return the collateral. Upon the failure of the borrower to return the securities, collateral may be liquidated and the securities may be purchased on the open market to replace the loaned securities. The Fund could experience delays and costs in gaining access to the collateral and the securities may lose value during the delay which could result in potential losses to the Fund. Some of these losses may be indemnified by the lending agent. The Fund bears the risk of any deficiency in the amount of the collateral available for return to the borrower due to any loss on the collateral invested. Dividends received on cash collateral investments for securities lending transactions, which are net of |
| 10 | Invesco Discovery Fund |
| compensation to counterparties, are included in Dividends from affiliated money market funds on the Statement of Operations. The aggregate value of securities out on loan, if any, is shown as a footnote on the Statement of Assets and Liabilities. |
| Average Daily Net Assets | Rate* |
| First $200 million | 0.750% |
| Next $200 million | 0.720% |
| Next $200 million | 0.690% |
| Next $200 million | 0.660% |
| Next $700 million | 0.600% |
| Next $3.5 billion | 0.580% |
| Over $5 billion | 0.550% |
| * | The advisory fee paid by the Fund shall be reduced by any amounts paid by the Fund under the administrative services agreement with the Adviser. |
| 11 | Invesco Discovery Fund |
| Level 1 | Level 2 | Level 3 | Total | |
| Investments in Securities | ||||
| Common Stocks & Other Equity Interests | $4,659,796,278 | $— | $— | $4,659,796,278 |
| Money Market Funds | 51,272,146 | 3,954,219 | — | 55,226,365 |
| Total Investments | $4,711,068,424 | $3,954,219 | $— | $4,715,022,643 |
| Tax Components of Net Assets at Period-End: | |
| 2024 | |
| Undistributed long-term capital gain | $166,743,490 |
| Net unrealized appreciation — investments | 1,342,519,986 |
| Temporary book/tax differences | (219,215) |
| Late-Year ordinary loss deferral | (10,923,296) |
| Shares of beneficial interest | 3,218,733,189 |
| Total net assets | $4,716,854,154 |
| 12 | Invesco Discovery Fund |
| Unrealized Appreciation (Depreciation) of Investments on a Tax Basis | |
| Aggregate unrealized appreciation of investments | $1,380,714,221 |
| Aggregate unrealized (depreciation) of investments | (38,194,235) |
| Net unrealized appreciation of investments | $1,342,519,986 |
| Summary of Share Activity | |||||
| Year ended August 31, 2024(a) | Year ended August 31, 2023 | ||||
| Shares | Amount | Shares | Amount | ||
| Sold: | |||||
| Class A | 674,807 | $58,229,263 | 820,338 | $62,017,183 | |
| Class C | 73,840 | 3,061,671 | 83,171 | 3,101,262 | |
| Class R | 47,383 | 3,537,916 | 58,327 | 3,778,805 | |
| Class Y | 4,333,225 | 464,736,642 | 4,789,861 | 445,426,604 | |
| Class R5 | 14,346 | 1,276,911 | 6,070 | 462,884 | |
| Class R6 | 3,946,720 | 440,742,504 | 3,484,168 | 336,163,469 | |
| Automatic conversion of Class C shares to Class A shares: | |||||
| Class A | 36,648 | 3,162,845 | 38,869 | 2,932,479 | |
| Class C | (75,178) | (3,162,845) | (79,150) | (2,932,479) | |
| Reacquired: | |||||
| Class A | (2,279,013) | (196,847,536) | (2,442,321) | (184,995,584) | |
| Class C | (129,721) | (5,540,283) | (163,560) | (6,046,649) | |
| Class R | (137,346) | (10,023,573) | (105,466) | (6,887,264) | |
| Class Y | (4,475,024) | (472,302,137) | (6,283,418) | (584,008,401) | |
| Class R5 | (6,554) | (575,549) | (4,332) | (336,018) | |
| Class R6 | (1,902,400) | (211,085,391) | (1,411,452) | (136,580,520) | |
| Net increase (decrease) in share activity | 121,733 | $75,210,438 | (1,208,895) | $(67,904,229) | |
| (a) | There are entities that are record owners of more than 5% of the outstanding shares of the Fund and in the aggregate own 25% of the outstanding shares of the Fund. IDI has an agreement with these entities to sell Fund shares. The Fund, Invesco and/or Invesco affiliates may make payments to these entities, which are considered to be related to the Fund, for providing services to the Fund, Invesco and/or Invesco affiliates including but not limited to services such as securities brokerage, distribution, third party record keeping and account servicing. The Fund has no knowledge as to whether all or any portion of the shares owned of record by these entities are also owned beneficially. |
| 13 | Invesco Discovery Fund |
| 14 | Invesco Discovery Fund |
| A. | Nature, Extent and Quality of Services Provided by Invesco Advisers and the Affiliated Sub-Advisers |
| B. | Fund Investment Performance |
| 15 | Invesco Discovery Fund |
| C. | Advisory and Sub-Advisory Fees and Fund Expenses |
| D. | Economies of Scale and Breakpoints |
| E. | Profitability and Financial Resources |
| F. | Collateral Benefits to Invesco Advisers and its Affiliates |
| 16 | Invesco Discovery Fund |
| 17 | Invesco Discovery Fund |
| Federal and State Income Tax | |
| Qualified Dividend Income* | 0.00% |
| Corporate Dividends Received Deduction* | 0.00% |
| U.S. Treasury Obligations* | 0.00% |
| Qualified Business Income* | 0.00% |
| Business Interest Income* | 0.00% |
| * | The above percentages are based on ordinary income dividends paid to shareholders during the Fund’s fiscal year. |
| 18 | Invesco Discovery Fund |
| 19 | Invesco Discovery Fund |

| Annual Financial Statements and Other Information | August 31, 2024 |
| Shares | Value | ||
| Common Stocks & Other Equity Interests–99.60% | |||
| Advertising–0.42% | |||
| Interpublic Group of Cos., Inc. (The)(b) | 432,252 | $14,095,738 | |
| Omnicom Group, Inc.(b) | 143,840 | 14,445,851 | |
| 28,541,589 | |||
| Aerospace & Defense–2.53% | |||
| Axon Enterprise, Inc.(c) | 43,502 | 15,876,925 | |
| Boeing Co. (The)(c) | 71,738 | 12,463,760 | |
| General Dynamics Corp. | 43,584 | 13,047,306 | |
| General Electric Co. | 81,581 | 14,245,674 | |
| Howmet Aerospace, Inc. | 161,096 | 15,571,540 | |
| Huntington Ingalls Industries, Inc. | 53,329 | 15,079,841 | |
| L3Harris Technologies, Inc. | 58,476 | 13,839,515 | |
| Lockheed Martin Corp. | 27,746 | 15,762,503 | |
| Northrop Grumman Corp. | 29,987 | 15,689,498 | |
| RTX Corp. | 122,008 | 15,048,467 | |
| Textron, Inc. | 149,171 | 13,604,395 | |
| TransDigm Group, Inc. | 9,822 | 13,487,669 | |
| 173,717,093 | |||
| Agricultural & Farm Machinery–0.19% | |||
| Deere & Co. | 33,642 | 12,977,065 | |
| Agricultural Products & Services–0.37% | |||
| Archer-Daniels-Midland Co. | 213,729 | 13,035,332 | |
| Bunge Global S.A. | 123,669 | 12,537,563 | |
| 25,572,895 | |||
| Air Freight & Logistics–0.82% | |||
| C.H. Robinson Worldwide, Inc. | 152,115 | 15,745,424 | |
| Expeditors International of Washington, Inc. | 103,064 | 12,719,128 | |
| FedEx Corp. | 51,926 | 15,513,931 | |
| United Parcel Service, Inc., Class B | 93,748 | 12,051,305 | |
| 56,029,788 | |||
| Apparel Retail–0.39% | |||
| Ross Stores, Inc. | 87,143 | 13,124,607 | |
| TJX Cos., Inc. (The) | 117,206 | 13,744,748 | |
| 26,869,355 | |||
| Apparel, Accessories & Luxury Goods–0.52% | |||
| lululemon athletica, inc.(c) | 41,558 | 10,783,054 | |
| Ralph Lauren Corp. | 70,775 | 12,120,927 | |
| Tapestry, Inc. | 304,158 | 12,461,353 | |
| 35,365,334 | |||
| Application Software–2.16% | |||
| Adobe, Inc.(c) | 24,208 | 13,905,317 | |
| ANSYS, Inc.(c) | 39,351 | 12,648,198 | |
| Autodesk, Inc.(c) | 56,302 | 14,548,437 | |
| Cadence Design Systems, Inc.(c) | 40,746 | 10,957,822 | |
| Fair Isaac Corp.(c) | 9,144 | 15,821,589 | |
| Intuit, Inc. | 21,348 | 13,454,790 | |
| PTC, Inc.(c) | 73,296 | 13,126,581 | |
| Roper Technologies, Inc. | 23,146 | 12,832,374 | |
| Salesforce, Inc. | 54,828 | 13,866,001 | |
| Synopsys, Inc.(c) | 21,546 | 11,194,871 | |
| Shares | Value | ||
| Application Software–(continued) | |||
| Tyler Technologies, Inc.(c) | 26,954 | $15,845,448 | |
| 148,201,428 | |||
| Asset Management & Custody Banks–2.05% | |||
| Ameriprise Financial, Inc. | 30,003 | 13,484,548 | |
| Bank of New York Mellon Corp. (The) | 219,180 | 14,952,460 | |
| BlackRock, Inc. | 16,531 | 14,907,821 | |
| Blackstone, Inc., Class A | 104,880 | 14,930,717 | |
| Franklin Resources, Inc. | 582,540 | 11,790,610 | |
| Invesco Ltd.(d) | 873,411 | 14,926,594 | |
| KKR & Co., Inc., Class A | 116,586 | 14,429,849 | |
| Northern Trust Corp. | 157,201 | 14,338,303 | |
| State Street Corp. | 177,564 | 15,465,824 | |
| T. Rowe Price Group, Inc. | 110,678 | 11,736,295 | |
| 140,963,021 | |||
| Automobile Manufacturers–0.60% | |||
| Ford Motor Co. | 1,085,984 | 12,152,161 | |
| General Motors Co.(e) | 271,903 | 13,535,332 | |
| Tesla, Inc.(c) | 71,438 | 15,295,590 | |
| 40,983,083 | |||
| Automotive Parts & Equipment–0.38% | |||
| Aptiv PLC(c) | 180,895 | 12,939,419 | |
| BorgWarner, Inc. | 392,981 | 13,388,863 | |
| 26,328,282 | |||
| Automotive Retail–0.64% | |||
| AutoZone, Inc.(c) | 4,484 | 14,265,756 | |
| CarMax, Inc.(b)(c) | 181,903 | 15,379,899 | |
| O’Reilly Automotive, Inc.(c) | 12,624 | 14,264,741 | |
| 43,910,396 | |||
| Biotechnology–1.51% | |||
| AbbVie, Inc. | 75,431 | 14,807,859 | |
| Amgen, Inc. | 42,584 | 14,215,817 | |
| Biogen, Inc.(c) | 54,889 | 11,239,072 | |
| Gilead Sciences, Inc. | 195,463 | 15,441,577 | |
| Incyte Corp.(c) | 204,747 | 13,443,688 | |
| Moderna, Inc.(c) | 91,081 | 7,049,669 | |
| Regeneron Pharmaceuticals, Inc.(c) | 12,269 | 14,534,962 | |
| Vertex Pharmaceuticals, Inc.(c) | 26,452 | 13,117,282 | |
| 103,849,926 | |||
| Brewers–0.20% | |||
| Molson Coors Beverage Co., Class B | 256,750 | 13,856,798 | |
| Broadcasting–0.42% | |||
| Fox Corp., Class A(b) | 250,877 | 10,378,781 | |
| Fox Corp., Class B | 143,184 | 5,502,561 | |
| Paramount Global, Class B | 1,250,429 | 13,091,992 | |
| 28,973,334 | |||
| Broadline Retail–0.56% | |||
| Amazon.com, Inc.(c) | 69,240 | 12,359,340 | |
| eBay, Inc. | 243,945 | 14,417,150 | |
| Etsy, Inc.(c) | 216,016 | 11,900,321 | |
| 38,676,811 | |||
| 2 | Invesco Equally-Weighted S&P 500 Fund |
| Shares | Value | ||
| Building Products–1.44% | |||
| A.O. Smith Corp. | 154,219 | $12,911,215 | |
| Allegion PLC | 109,288 | 15,173,546 | |
| Builders FirstSource, Inc.(c) | 85,034 | 14,795,916 | |
| Carrier Global Corp. | 197,620 | 14,382,783 | |
| Johnson Controls International PLC | 183,161 | 13,343,279 | |
| Masco Corp. | 183,930 | 14,633,471 | |
| Trane Technologies PLC | 38,578 | 13,952,119 | |
| 99,192,329 | |||
| Cable & Satellite–0.43% | |||
| Charter Communications, Inc., Class A(b)(c) | 46,033 | 15,998,309 | |
| Comcast Corp., Class A | 339,661 | 13,440,386 | |
| 29,438,695 | |||
| Cargo Ground Transportation–0.41% | |||
| J.B. Hunt Transport Services, Inc. | 80,865 | 14,005,818 | |
| Old Dominion Freight Line, Inc. | 73,617 | 14,193,358 | |
| 28,199,176 | |||
| Casinos & Gaming–0.70% | |||
| Caesars Entertainment, Inc.(b)(c) | 352,952 | 13,285,113 | |
| Las Vegas Sands Corp. | 294,032 | 11,464,308 | |
| MGM Resorts International(b)(c) | 319,120 | 11,995,721 | |
| Wynn Resorts Ltd. | 143,208 | 11,009,831 | |
| 47,754,973 | |||
| Commodity Chemicals–0.38% | |||
| Dow, Inc. | 231,131 | 12,383,999 | |
| LyondellBasell Industries N.V., Class A | 135,951 | 13,418,364 | |
| 25,802,363 | |||
| Communications Equipment–1.05% | |||
| Arista Networks, Inc.(c) | 38,712 | 13,680,046 | |
| Cisco Systems, Inc. | 278,391 | 14,069,881 | |
| F5, Inc.(c) | 75,886 | 15,416,241 | |
| Juniper Networks, Inc. | 358,626 | 13,943,379 | |
| Motorola Solutions, Inc. | 33,874 | 14,973,663 | |
| 72,083,210 | |||
| Computer & Electronics Retail–0.21% | |||
| Best Buy Co., Inc. | 145,820 | 14,640,328 | |
| Construction & Engineering–0.19% | |||
| Quanta Services, Inc.(b) | 46,534 | 12,802,899 | |
| Construction Machinery & Heavy Transportation Equipment– 0.79% | |||
| Caterpillar, Inc. | 39,558 | 14,086,604 | |
| Cummins, Inc. | 47,881 | 14,979,571 | |
| PACCAR, Inc. | 119,161 | 11,460,905 | |
| Wabtec Corp. | 79,320 | 13,450,292 | |
| 53,977,372 | |||
| Construction Materials–0.35% | |||
| Martin Marietta Materials, Inc. | 22,434 | 11,983,346 | |
| Vulcan Materials Co. | 50,334 | 12,342,400 | |
| 24,325,746 | |||
| Consumer Electronics–0.21% | |||
| Garmin Ltd. | 79,714 | 14,610,779 | |
| Shares | Value | ||
| Consumer Finance–0.85% | |||
| American Express Co. | 56,565 | $14,630,537 | |
| Capital One Financial Corp. | 95,114 | 13,975,100 | |
| Discover Financial Services | 104,237 | 14,458,714 | |
| Synchrony Financial | 305,192 | 15,338,950 | |
| 58,403,301 | |||
| Consumer Staples Merchandise Retail–0.88% | |||
| Costco Wholesale Corp. | 14,861 | 13,261,659 | |
| Dollar General Corp. | 101,097 | 8,388,018 | |
| Dollar Tree, Inc.(c) | 119,936 | 10,133,393 | |
| Target Corp. | 90,089 | 13,839,472 | |
| Walmart, Inc. | 189,748 | 14,654,238 | |
| 60,276,780 | |||
| Copper–0.17% | |||
| Freeport-McMoRan, Inc. | 264,329 | 11,704,488 | |
| Data Center REITs–0.39% | |||
| Digital Realty Trust, Inc. | 84,825 | 12,860,318 | |
| Equinix, Inc. | 16,596 | 13,847,039 | |
| 26,707,357 | |||
| Data Processing & Outsourced Services–0.20% | |||
| Broadridge Financial Solutions, Inc. | 65,171 | 13,872,299 | |
| Distillers & Vintners–0.37% | |||
| Brown-Forman Corp., Class B(b) | 291,271 | 13,279,045 | |
| Constellation Brands, Inc., Class A | 49,906 | 12,012,873 | |
| 25,291,918 | |||
| Distributors–0.58% | |||
| Genuine Parts Co. | 93,029 | 13,327,335 | |
| LKQ Corp. | 315,633 | 13,127,176 | |
| Pool Corp. | 37,259 | 13,101,010 | |
| 39,555,521 | |||
| Diversified Banks–1.70% | |||
| Bank of America Corp. | 324,080 | 13,206,260 | |
| Citigroup, Inc. | 214,342 | 13,426,383 | |
| Fifth Third Bancorp | 361,069 | 15,414,036 | |
| JPMorgan Chase & Co. | 65,625 | 14,752,500 | |
| KeyCorp | 951,860 | 16,238,732 | |
| PNC Financial Services Group, Inc. (The) | 84,169 | 15,578,840 | |
| U.S. Bancorp | 327,501 | 15,467,872 | |
| Wells Fargo & Co. | 221,549 | 12,953,970 | |
| 117,038,593 | |||
| Diversified Support Services–0.40% | |||
| Cintas Corp. | 18,279 | 14,716,789 | |
| Copart, Inc.(c) | 238,994 | 12,657,122 | |
| 27,373,911 | |||
| Drug Retail–0.11% | |||
| Walgreens Boots Alliance, Inc.(b) | 817,805 | 7,564,696 | |
| Electric Utilities–3.50% | |||
| Alliant Energy Corp. | 255,154 | 14,867,824 | |
| American Electric Power Co., Inc. | 144,509 | 14,491,363 | |
| Constellation Energy Corp. | 59,175 | 11,639,722 | |
| Duke Energy Corp. | 124,237 | 14,156,806 | |
| Edison International | 173,704 | 15,117,459 | |
| Entergy Corp. | 118,828 | 14,341,351 | |
| 3 | Invesco Equally-Weighted S&P 500 Fund |
| Shares | Value | ||
| Electric Utilities–(continued) | |||
| Evergy, Inc. | 241,124 | $14,260,073 | |
| Eversource Energy | 214,060 | 14,455,472 | |
| Exelon Corp. | 357,818 | 13,629,288 | |
| FirstEnergy Corp. | 328,009 | 14,406,155 | |
| NextEra Energy, Inc. | 174,061 | 14,013,651 | |
| NRG Energy, Inc. | 161,710 | 13,746,967 | |
| PG&E Corp. | 696,815 | 13,727,255 | |
| Pinnacle West Capital Corp.(b) | 166,255 | 14,550,638 | |
| PPL Corp. | 452,881 | 14,451,433 | |
| Southern Co. (The) | 161,689 | 13,969,930 | |
| Xcel Energy, Inc. | 236,504 | 14,481,140 | |
| 240,306,527 | |||
| Electrical Components & Equipment–1.16% | |||
| AMETEK, Inc. | 76,140 | 13,023,747 | |
| Eaton Corp. PLC | 39,863 | 12,235,151 | |
| Emerson Electric Co. | 119,451 | 12,588,941 | |
| Generac Holdings, Inc.(c) | 94,221 | 14,748,413 | |
| Hubbell, Inc. | 33,935 | 13,571,285 | |
| Rockwell Automation, Inc. | 49,990 | 13,598,780 | |
| 79,766,317 | |||
| Electronic Components–0.39% | |||
| Amphenol Corp., Class A | 186,274 | 12,564,181 | |
| Corning, Inc. | 341,393 | 14,287,297 | |
| 26,851,478 | |||
| Electronic Equipment & Instruments–0.82% | |||
| Keysight Technologies, Inc.(c) | 93,521 | 14,413,456 | |
| Teledyne Technologies, Inc.(c) | 32,641 | 14,127,025 | |
| Trimble, Inc.(c) | 232,017 | 13,153,044 | |
| Zebra Technologies Corp., Class A(c) | 42,197 | 14,574,000 | |
| 56,267,525 | |||
| Electronic Manufacturing Services–0.36% | |||
| Jabil, Inc. | 106,436 | 11,631,326 | |
| TE Connectivity Ltd. | 86,304 | 13,256,294 | |
| 24,887,620 | |||
| Environmental & Facilities Services–0.79% | |||
| Republic Services, Inc. | 67,414 | 14,036,269 | |
| Rollins, Inc. | 262,204 | 13,157,397 | |
| Veralto Corp. | 126,222 | 14,191,139 | |
| Waste Management, Inc. | 61,903 | 13,125,912 | |
| 54,510,717 | |||
| Fertilizers & Agricultural Chemicals–0.83% | |||
| CF Industries Holdings, Inc. | 173,585 | 14,423,178 | |
| Corteva, Inc. | 248,473 | 14,237,503 | |
| FMC Corp. | 232,104 | 14,989,276 | |
| Mosaic Co. (The)(e) | 468,220 | 13,377,045 | |
| 57,027,002 | |||
| Financial Exchanges & Data–1.96% | |||
| Cboe Global Markets, Inc. | 75,876 | 15,584,930 | |
| CME Group, Inc., Class A | 64,509 | 13,917,172 | |
| FactSet Research Systems, Inc. | 31,654 | 13,384,577 | |
| Intercontinental Exchange, Inc. | 93,734 | 15,142,728 | |
| MarketAxess Holdings, Inc. | 63,515 | 15,395,401 | |
| Moody’s Corp. | 31,159 | 15,197,491 | |
| MSCI, Inc. | 26,463 | 15,364,153 | |
| Shares | Value | ||
| Financial Exchanges & Data–(continued) | |||
| Nasdaq, Inc. | 217,010 | $15,642,081 | |
| S&P Global, Inc. | 29,275 | 15,025,101 | |
| 134,653,634 | |||
| Food Distributors–0.20% | |||
| Sysco Corp. | 179,896 | 14,026,491 | |
| Food Retail–0.20% | |||
| Kroger Co. (The) | 252,418 | 13,431,162 | |
| Footwear–0.34% | |||
| Deckers Outdoor Corp.(c) | 12,421 | 11,915,341 | |
| NIKE, Inc., Class B | 136,168 | 11,345,518 | |
| 23,260,859 | |||
| Gas Utilities–0.21% | |||
| Atmos Energy Corp. | 109,488 | 14,314,461 | |
| Gold–0.24% | |||
| Newmont Corp. | 311,536 | 16,632,907 | |
| Health Care Distributors–0.77% | |||
| Cardinal Health, Inc. | 126,915 | 14,305,859 | |
| Cencora, Inc. | 54,155 | 12,973,913 | |
| Henry Schein, Inc.(b)(c) | 193,266 | 13,634,916 | |
| McKesson Corp. | 21,555 | 12,094,080 | |
| 53,008,768 | |||
| Health Care Equipment–3.29% | |||
| Abbott Laboratories | 122,655 | 13,893,132 | |
| Baxter International, Inc. | 376,461 | 14,282,930 | |
| Becton, Dickinson and Co. | 54,408 | 13,189,043 | |
| Boston Scientific Corp.(c) | 165,670 | 13,550,149 | |
| DexCom, Inc.(c) | 109,676 | 7,604,934 | |
| Edwards Lifesciences Corp.(c) | 145,684 | 10,192,053 | |
| GE HealthCare Technologies, Inc. | 166,255 | 14,101,749 | |
| Hologic, Inc.(c) | 177,139 | 14,390,772 | |
| IDEXX Laboratories, Inc.(c) | 25,232 | 12,144,919 | |
| Insulet Corp.(c) | 63,442 | 12,864,134 | |
| Intuitive Surgical, Inc.(c) | 29,867 | 14,713,380 | |
| Medtronic PLC | 156,922 | 13,900,151 | |
| ResMed, Inc. | 60,239 | 14,759,760 | |
| STERIS PLC | 58,258 | 14,046,004 | |
| Stryker Corp. | 36,862 | 13,285,802 | |
| Teleflex, Inc.(b) | 61,055 | 14,968,854 | |
| Zimmer Biomet Holdings, Inc. | 118,638 | 13,697,944 | |
| 225,585,710 | |||
| Health Care Facilities–0.45% | |||
| HCA Healthcare, Inc. | 37,684 | 14,907,414 | |
| Universal Health Services, Inc., Class B | 67,699 | 16,110,331 | |
| 31,017,745 | |||
| Health Care REITs–0.84% | |||
| Alexandria Real Estate Equities, Inc. | 109,326 | 13,072,110 | |
| Healthpeak Properties, Inc. | 647,167 | 14,418,881 | |
| Ventas, Inc. | 253,830 | 15,765,381 | |
| Welltower, Inc. | 122,231 | 14,750,837 | |
| 58,007,209 | |||
| Health Care Services–1.00% | |||
| Cigna Group (The) | 38,155 | 13,804,861 | |
| 4 | Invesco Equally-Weighted S&P 500 Fund |
| Shares | Value | ||
| Health Care Services–(continued) | |||
| CVS Health Corp. | 211,174 | $12,087,600 | |
| DaVita, Inc.(c) | 90,089 | 13,596,232 | |
| Labcorp Holdings, Inc. | 63,623 | 14,626,291 | |
| Quest Diagnostics, Inc. | 92,252 | 14,480,796 | |
| 68,595,780 | |||
| Health Care Supplies–0.60% | |||
| Align Technology, Inc.(c) | 49,673 | 11,783,429 | |
| Cooper Cos., Inc. (The)(c) | 136,052 | 14,384,778 | |
| Solventum Corp.(b)(c) | 233,080 | 14,942,759 | |
| 41,110,966 | |||
| Heavy Electrical Equipment–0.22% | |||
| GE Vernova, Inc.(c) | 74,731 | 15,020,931 | |
| Home Furnishings–0.26% | |||
| Mohawk Industries, Inc.(c) | 113,524 | 17,612,113 | |
| Home Improvement Retail–0.40% | |||
| Home Depot, Inc. (The) | 36,666 | 13,511,421 | |
| Lowe’s Cos., Inc. | 56,936 | 14,148,596 | |
| 27,660,017 | |||
| Homebuilding–0.90% | |||
| D.R. Horton, Inc. | 89,066 | 16,812,098 | |
| Lennar Corp., Class A | 81,990 | 14,927,099 | |
| NVR, Inc.(c) | 1,680 | 15,409,733 | |
| PulteGroup, Inc. | 111,463 | 14,674,104 | |
| 61,823,034 | |||
| Hotel & Resort REITs–0.18% | |||
| Host Hotels & Resorts, Inc.(b) | 713,629 | 12,631,233 | |
| Hotels, Resorts & Cruise Lines–1.52% | |||
| Airbnb, Inc., Class A(c) | 87,120 | 10,220,047 | |
| Booking Holdings, Inc. | 3,295 | 12,880,913 | |
| Carnival Corp.(c) | 828,999 | 13,678,483 | |
| Expedia Group, Inc.(c) | 102,053 | 14,194,552 | |
| Hilton Worldwide Holdings, Inc. | 60,465 | 13,280,533 | |
| Marriott International, Inc., Class A | 53,108 | 12,463,917 | |
| Norwegian Cruise Line Holdings Ltd.(c) | 767,926 | 13,738,196 | |
| Royal Caribbean Cruises Ltd.(c) | 85,636 | 14,097,398 | |
| 104,554,039 | |||
| Household Products–0.99% | |||
| Church & Dwight Co., Inc. | 118,077 | 12,029,685 | |
| Clorox Co. (The) | 95,114 | 15,057,497 | |
| Colgate-Palmolive Co. | 134,399 | 14,313,494 | |
| Kimberly-Clark Corp. | 91,167 | 13,188,218 | |
| Procter & Gamble Co. (The) | 76,246 | 13,079,239 | |
| 67,668,133 | |||
| Human Resource & Employment Services–0.83% | |||
| Automatic Data Processing, Inc. | 52,415 | 14,461,823 | |
| Dayforce, Inc.(b)(c) | 251,869 | 14,399,351 | |
| Paychex, Inc. | 104,244 | 13,676,813 | |
| Paycom Software, Inc. | 89,066 | 14,498,163 | |
| 57,036,150 | |||
| Independent Power Producers & Energy Traders–0.34% | |||
| AES Corp. (The) | 657,542 | 11,263,695 | |
| Shares | Value | ||
| Independent Power Producers & Energy Traders–(continued) | |||
| Vistra Corp. | 145,187 | $12,403,325 | |
| 23,667,020 | |||
| Industrial Conglomerates–0.43% | |||
| 3M Co. | 126,034 | 16,975,519 | |
| Honeywell International, Inc. | 60,983 | 12,678,976 | |
| 29,654,495 | |||
| Industrial Gases–0.39% | |||
| Air Products and Chemicals, Inc. | 46,220 | 12,888,447 | |
| Linde PLC | 29,104 | 13,918,988 | |
| 26,807,435 | |||
| Industrial Machinery & Supplies & Components–2.40% | |||
| Dover Corp. | 71,746 | 13,346,908 | |
| Fortive Corp. | 174,851 | 13,008,914 | |
| IDEX Corp. | 64,152 | 13,246,105 | |
| Illinois Tool Works, Inc. | 54,075 | 13,690,708 | |
| Ingersoll Rand, Inc. | 139,043 | 12,715,482 | |
| Nordson Corp. | 55,601 | 14,264,993 | |
| Otis Worldwide Corp. | 131,730 | 12,473,514 | |
| Parker-Hannifin Corp. | 25,266 | 15,164,653 | |
| Pentair PLC | 164,449 | 14,584,982 | |
| Snap-on, Inc. | 48,493 | 13,759,404 | |
| Stanley Black & Decker, Inc. | 152,207 | 15,579,909 | |
| Xylem, Inc. | 92,137 | 12,671,602 | |
| 164,507,174 | |||
| Industrial REITs–0.21% | |||
| Prologis, Inc. | 113,250 | 14,475,615 | |
| Insurance Brokers–1.06% | |||
| Aon PLC, Class A | 43,051 | 14,797,490 | |
| Arthur J. Gallagher & Co. | 49,245 | 14,407,610 | |
| Brown & Brown, Inc. | 141,173 | 14,841,517 | |
| Marsh & McLennan Cos., Inc. | 60,880 | 13,850,809 | |
| Willis Towers Watson PLC | 49,815 | 14,551,459 | |
| 72,448,885 | |||
| Integrated Oil & Gas–0.56% | |||
| Chevron Corp. | 83,351 | 12,331,780 | |
| Exxon Mobil Corp. | 116,551 | 13,746,025 | |
| Occidental Petroleum Corp. | 211,527 | 12,052,809 | |
| 38,130,614 | |||
| Integrated Telecommunication Services–0.40% | |||
| AT&T, Inc. | 720,910 | 14,346,109 | |
| Verizon Communications, Inc. | 320,566 | 13,393,247 | |
| 27,739,356 | |||
| Interactive Home Entertainment–0.40% | |||
| Electronic Arts, Inc. | 93,521 | 14,198,358 | |
| Take-Two Interactive Software, Inc.(c) | 80,001 | 12,936,962 | |
| 27,135,320 | |||
| Interactive Media & Services–0.58% | |||
| Alphabet, Inc., Class A | 39,221 | 6,407,927 | |
| Alphabet, Inc., Class C | 32,631 | 5,387,704 | |
| Match Group, Inc.(b)(c) | 403,070 | 14,998,235 | |
| Meta Platforms, Inc., Class A | 25,420 | 13,251,700 | |
| 40,045,566 | |||
| 5 | Invesco Equally-Weighted S&P 500 Fund |
| Shares | Value | ||
| Internet Services & Infrastructure–0.63% | |||
| Akamai Technologies, Inc.(c) | 142,742 | $14,536,845 | |
| GoDaddy, Inc., Class A(c) | 92,828 | 15,540,336 | |
| VeriSign, Inc.(c) | 70,528 | 12,970,099 | |
| 43,047,280 | |||
| Investment Banking & Brokerage–0.77% | |||
| Charles Schwab Corp. (The) | 173,609 | 11,301,946 | |
| Goldman Sachs Group, Inc. (The) | 28,483 | 14,533,451 | |
| Morgan Stanley | 133,160 | 13,796,707 | |
| Raymond James Financial, Inc.(b) | 109,940 | 13,145,526 | |
| 52,777,630 | |||
| IT Consulting & Other Services–1.09% | |||
| Accenture PLC, Class A (Ireland) | 44,355 | 15,167,192 | |
| Cognizant Technology Solutions Corp., Class A | 197,896 | 15,390,372 | |
| EPAM Systems, Inc.(c) | 71,613 | 14,377,026 | |
| Gartner, Inc.(c) | 29,423 | 14,474,939 | |
| International Business Machines Corp. | 75,154 | 15,190,878 | |
| 74,600,407 | |||
| Leisure Products–0.21% | |||
| Hasbro, Inc. | 206,779 | 14,094,057 | |
| Life & Health Insurance–1.09% | |||
| Aflac, Inc. | 146,104 | 16,124,037 | |
| Globe Life, Inc.(b) | 163,267 | 17,151,198 | |
| MetLife, Inc. | 185,512 | 14,373,470 | |
| Principal Financial Group, Inc. | 165,887 | 13,506,520 | |
| Prudential Financial, Inc. | 112,430 | 13,622,019 | |
| 74,777,244 | |||
| Life Sciences Tools & Services–2.18% | |||
| Agilent Technologies, Inc. | 97,935 | 13,996,870 | |
| Bio-Rad Laboratories, Inc., Class A(c) | 45,054 | 15,197,615 | |
| Bio-Techne Corp. | 166,827 | 12,343,530 | |
| Charles River Laboratories International, Inc.(c) | 60,711 | 12,005,600 | |
| Danaher Corp. | 49,900 | 13,438,569 | |
| IQVIA Holdings, Inc.(c) | 59,773 | 15,035,898 | |
| Mettler-Toledo International, Inc.(c) | 8,742 | 12,580,438 | |
| Revvity, Inc. | 117,632 | 14,414,625 | |
| Thermo Fisher Scientific, Inc. | 22,230 | 13,673,006 | |
| Waters Corp.(c) | 43,117 | 14,933,573 | |
| West Pharmaceutical Services, Inc. | 38,160 | 11,968,121 | |
| 149,587,845 | |||
| Managed Health Care–1.02% | |||
| Centene Corp.(c) | 184,489 | 14,543,268 | |
| Elevance Health, Inc. | 23,778 | 13,241,730 | |
| Humana, Inc. | 35,431 | 12,559,227 | |
| Molina Healthcare, Inc.(c) | 41,417 | 14,487,253 | |
| UnitedHealth Group, Inc. | 25,581 | 15,097,906 | |
| 69,929,384 | |||
| Metal, Glass & Plastic Containers–0.18% | |||
| Ball Corp. | 192,651 | 12,293,060 | |
| Movies & Entertainment–0.77% | |||
| Live Nation Entertainment, Inc.(b)(c) | 143,288 | 13,994,939 | |
| Netflix, Inc.(c) | 18,999 | 13,324,949 | |
| Walt Disney Co. (The) | 127,206 | 11,496,878 | |
| Shares | Value | ||
| Movies & Entertainment–(continued) | |||
| Warner Bros. Discovery, Inc.(c) | 1,756,469 | $13,770,717 | |
| 52,587,483 | |||
| Multi-Family Residential REITs–1.25% | |||
| AvalonBay Communities, Inc. | 62,990 | 14,218,733 | |
| Camden Property Trust | 117,705 | 14,736,666 | |
| Equity Residential | 190,628 | 14,274,225 | |
| Essex Property Trust, Inc. | 45,661 | 13,780,033 | |
| Mid-America Apartment Communities, Inc. | 91,279 | 14,820,971 | |
| UDR, Inc.(b) | 315,712 | 14,052,341 | |
| 85,882,969 | |||
| Multi-line Insurance–0.19% | |||
| American International Group, Inc. | 172,836 | 13,317,014 | |
| Multi-Sector Holdings–0.22% | |||
| Berkshire Hathaway, Inc., Class B(c) | 31,358 | 14,923,899 | |
| Multi-Utilities–2.05% | |||
| Ameren Corp. | 181,358 | 14,963,848 | |
| CenterPoint Energy, Inc. | 412,216 | 11,253,497 | |
| CMS Energy Corp. | 213,423 | 14,482,885 | |
| Consolidated Edison, Inc. | 139,946 | 14,212,916 | |
| Dominion Energy, Inc. | 252,170 | 14,096,303 | |
| DTE Energy Co. | 113,995 | 14,251,655 | |
| NiSource, Inc. | 451,432 | 14,924,342 | |
| Public Service Enterprise Group, Inc. | 175,067 | 14,136,660 | |
| Sempra | 167,393 | 13,756,357 | |
| WEC Energy Group, Inc.(b) | 161,258 | 15,001,831 | |
| 141,080,294 | |||
| Office REITs–0.23% | |||
| BXP, Inc.(b) | 206,309 | 15,518,563 | |
| Oil & Gas Equipment & Services–0.57% | |||
| Baker Hughes Co., Class A | 409,035 | 14,385,761 | |
| Halliburton Co. | 386,295 | 12,009,911 | |
| Schlumberger N.V. | 295,741 | 13,009,647 | |
| 39,405,319 | |||
| Oil & Gas Exploration & Production–1.66% | |||
| APA Corp. | 457,112 | 13,023,121 | |
| ConocoPhillips | 116,253 | 13,228,429 | |
| Coterra Energy, Inc. | 475,753 | 11,575,070 | |
| Devon Energy Corp. | 278,613 | 12,476,290 | |
| Diamondback Energy, Inc. | 68,383 | 13,342,207 | |
| EOG Resources, Inc. | 108,328 | 13,954,813 | |
| EQT Corp. | 323,256 | 10,832,309 | |
| Hess Corp. | 88,768 | 12,255,310 | |
| Marathon Oil Corp. | 465,819 | 13,345,714 | |
| 114,033,263 | |||
| Oil & Gas Refining & Marketing–0.56% | |||
| Marathon Petroleum Corp. | 74,775 | 13,244,148 | |
| Phillips 66 | 92,988 | 13,047,147 | |
| Valero Energy Corp. | 84,740 | 12,433,900 | |
| 38,725,195 | |||
| Oil & Gas Storage & Transportation–0.86% | |||
| Kinder Morgan, Inc. | 649,151 | 14,002,187 | |
| ONEOK, Inc. | 162,829 | 15,038,886 | |
| 6 | Invesco Equally-Weighted S&P 500 Fund |
| Shares | Value | ||
| Oil & Gas Storage & Transportation–(continued) | |||
| Targa Resources Corp. | 106,865 | $15,698,469 | |
| Williams Cos., Inc. (The) | 308,886 | 14,137,712 | |
| 58,877,254 | |||
| Other Specialized REITs–0.46% | |||
| Iron Mountain, Inc. | 144,477 | 16,363,465 | |
| VICI Properties, Inc. | 449,519 | 15,049,896 | |
| 31,413,361 | |||
| Other Specialty Retail–0.48% | |||
| Bath & Body Works, Inc.(b) | 293,963 | 9,042,302 | |
| Tractor Supply Co. | 45,376 | 12,140,349 | |
| Ulta Beauty, Inc.(c) | 32,539 | 11,481,060 | |
| 32,663,711 | |||
| Packaged Foods & Meats–2.43% | |||
| Campbell Soup Co. | 289,085 | 14,373,306 | |
| Conagra Brands, Inc. | 448,725 | 14,000,220 | |
| General Mills, Inc. | 194,150 | 14,035,104 | |
| Hershey Co. (The)(b) | 68,012 | 13,130,397 | |
| Hormel Foods Corp. | 417,221 | 13,580,544 | |
| J.M. Smucker Co. (The) | 113,971 | 13,070,194 | |
| Kellanova | 221,086 | 17,821,742 | |
| Kraft Heinz Co. (The) | 392,738 | 13,914,707 | |
| Lamb Weston Holdings, Inc. | 146,576 | 9,075,986 | |
| McCormick & Co., Inc. | 187,529 | 15,007,946 | |
| Mondelez International, Inc., Class A | 193,119 | 13,867,875 | |
| Tyson Foods, Inc., Class A | 237,678 | 15,285,072 | |
| 167,163,093 | |||
| Paper & Plastic Packaging Products & Materials–0.98% | |||
| Amcor PLC | 1,276,794 | 14,606,523 | |
| Avery Dennison Corp. | 56,137 | 12,453,994 | |
| International Paper Co.(b) | 283,288 | 13,716,805 | |
| Packaging Corp. of America | 69,114 | 14,482,148 | |
| Smurfit WestRock PLC | 256,079 | 12,143,266 | |
| 67,402,736 | |||
| Passenger Airlines–0.69% | |||
| American Airlines Group, Inc.(b)(c) | 1,127,380 | 11,972,776 | |
| Delta Air Lines, Inc. | 261,019 | 11,090,697 | |
| Southwest Airlines Co. | 448,092 | 12,958,821 | |
| United Airlines Holdings, Inc.(c) | 255,924 | 11,270,893 | |
| 47,293,187 | |||
| Passenger Ground Transportation–0.19% | |||
| Uber Technologies, Inc.(c) | 181,515 | 13,274,192 | |
| Personal Care Products–0.37% | |||
| Estee Lauder Cos., Inc. (The), Class A | 111,649 | 10,233,748 | |
| Kenvue, Inc. | 703,755 | 15,447,422 | |
| 25,681,170 | |||
| Pharmaceuticals–1.62% | |||
| Bristol-Myers Squibb Co. | 308,661 | 15,417,617 | |
| Catalent, Inc.(c) | 227,583 | 13,873,460 | |
| Eli Lilly and Co. | 14,476 | 13,897,250 | |
| Johnson & Johnson | 87,377 | 14,492,349 | |
| Merck & Co., Inc. | 98,215 | 11,633,567 | |
| Pfizer, Inc. | 461,928 | 13,400,531 | |
| Viatris, Inc. | 1,250,429 | 15,105,182 | |
| Shares | Value | ||
| Pharmaceuticals–(continued) | |||
| Zoetis, Inc. | 74,564 | $13,681,748 | |
| 111,501,704 | |||
| Property & Casualty Insurance–2.15% | |||
| Allstate Corp. (The) | 80,962 | 15,296,960 | |
| Arch Capital Group Ltd.(c) | 130,751 | 14,786,631 | |
| Assurant, Inc. | 76,820 | 15,083,607 | |
| Chubb Ltd. | 49,014 | 13,928,799 | |
| Cincinnati Financial Corp. | 113,271 | 15,521,525 | |
| Hartford Financial Services Group, Inc. (The) | 127,845 | 14,842,805 | |
| Loews Corp. | 171,842 | 14,080,733 | |
| Progressive Corp. (The) | 62,363 | 15,727,949 | |
| Travelers Cos., Inc. (The) | 61,778 | 14,089,708 | |
| W.R. Berkley Corp. | 244,086 | 14,571,934 | |
| 147,930,651 | |||
| Publishing–0.20% | |||
| News Corp., Class A | 360,000 | 10,198,800 | |
| News Corp., Class B | 113,474 | 3,339,540 | |
| 13,538,340 | |||
| Rail Transportation–0.63% | |||
| CSX Corp. | 395,178 | 13,542,750 | |
| Norfolk Southern Corp. | 57,831 | 14,813,989 | |
| Union Pacific Corp. | 57,258 | 14,663,201 | |
| 43,019,940 | |||
| Real Estate Services–0.44% | |||
| CBRE Group, Inc., Class A(c) | 146,340 | 16,849,587 | |
| CoStar Group, Inc.(c) | 172,012 | 13,296,528 | |
| 30,146,115 | |||
| Regional Banks–1.15% | |||
| Citizens Financial Group, Inc. | 374,731 | 16,132,169 | |
| Huntington Bancshares, Inc. | 1,028,040 | 15,389,759 | |
| M&T Bank Corp. | 90,098 | 15,506,767 | |
| Regions Financial Corp. | 681,869 | 15,969,372 | |
| Truist Financial Corp. | 359,132 | 15,967,009 | |
| 78,965,076 | |||
| Reinsurance–0.20% | |||
| Everest Group Ltd. | 34,598 | 13,570,720 | |
| Research & Consulting Services–0.83% | |||
| Equifax, Inc. | 52,633 | 16,165,173 | |
| Jacobs Solutions, Inc. | 92,018 | 13,883,676 | |
| Leidos Holdings, Inc. | 88,495 | 14,027,342 | |
| Verisk Analytics, Inc. | 48,101 | 13,122,915 | |
| 57,199,106 | |||
| Restaurants–1.11% | |||
| Chipotle Mexican Grill, Inc.(c) | 194,356 | 10,899,485 | |
| Darden Restaurants, Inc. | 85,474 | 13,517,713 | |
| Domino’s Pizza, Inc. | 24,391 | 10,102,996 | |
| McDonald’s Corp. | 50,150 | 14,476,299 | |
| Starbucks Corp. | 159,660 | 15,099,046 | |
| Yum! Brands, Inc. | 92,152 | 12,433,148 | |
| 76,528,687 | |||
| Retail REITs–1.08% | |||
| Federal Realty Investment Trust | 125,876 | 14,475,740 | |
| 7 | Invesco Equally-Weighted S&P 500 Fund |
| Shares | Value | ||
| Retail REITs–(continued) | |||
| Kimco Realty Corp. | 678,232 | $15,775,676 | |
| Realty Income Corp. | 238,277 | 14,799,385 | |
| Regency Centers Corp. | 207,868 | 15,109,925 | |
| Simon Property Group, Inc. | 85,194 | 14,257,216 | |
| 74,417,942 | |||
| Self-Storage REITs–0.43% | |||
| Extra Space Storage, Inc. | 81,223 | 14,376,471 | |
| Public Storage | 44,897 | 15,431,997 | |
| 29,808,468 | |||
| Semiconductor Materials & Equipment–0.84% | |||
| Applied Materials, Inc. | 53,652 | 10,583,394 | |
| Enphase Energy, Inc.(c) | 102,354 | 12,388,928 | |
| KLA Corp. | 15,417 | 12,633,152 | |
| Lam Research Corp. | 12,275 | 10,077,898 | |
| Teradyne, Inc. | 87,666 | 11,986,572 | |
| 57,669,944 | |||
| Semiconductors–2.61% | |||
| Advanced Micro Devices, Inc.(c) | 79,664 | 11,834,884 | |
| Analog Devices, Inc. | 55,006 | 12,917,609 | |
| Broadcom, Inc. | 73,518 | 11,970,201 | |
| First Solar, Inc.(c) | 46,615 | 10,598,852 | |
| Intel Corp. | 417,631 | 9,204,587 | |
| Microchip Technology, Inc. | 139,210 | 11,437,494 | |
| Micron Technology, Inc. | 89,961 | 8,657,847 | |
| Monolithic Power Systems, Inc. | 15,766 | 14,736,165 | |
| NVIDIA Corp. | 96,429 | 11,510,730 | |
| NXP Semiconductors N.V. (China) | 47,300 | 12,125,828 | |
| ON Semiconductor Corp.(c) | 176,696 | 13,759,317 | |
| Qorvo, Inc.(c) | 113,160 | 13,114,112 | |
| QUALCOMM, Inc. | 59,230 | 10,383,019 | |
| Skyworks Solutions, Inc. | 120,963 | 13,256,335 | |
| Texas Instruments, Inc. | 65,585 | 14,057,489 | |
| 179,564,469 | |||
| Single-Family Residential REITs–0.19% | |||
| Invitation Homes, Inc. | 358,223 | 13,196,935 | |
| Soft Drinks & Non-alcoholic Beverages–0.79% | |||
| Coca-Cola Co. (The) | 203,308 | 14,733,731 | |
| Keurig Dr Pepper, Inc. | 373,585 | 13,676,947 | |
| Monster Beverage Corp.(c) | 264,769 | 12,478,563 | |
| PepsiCo, Inc. | 77,631 | 13,420,847 | |
| 54,310,088 | |||
| Specialty Chemicals–1.54% | |||
| Albemarle Corp.(b) | 122,856 | 11,087,754 | |
| Celanese Corp.(b) | 91,233 | 11,915,030 | |
| DuPont de Nemours, Inc. | 159,640 | 13,449,670 | |
| Eastman Chemical Co. | 127,794 | 13,082,272 | |
| Ecolab, Inc. | 52,976 | 13,412,464 | |
| International Flavors & Fragrances, Inc. | 134,513 | 13,988,007 | |
| PPG Industries, Inc. | 99,881 | 12,957,562 | |
| Sherwin-Williams Co. (The) | 42,820 | 15,816,423 | |
| 105,709,182 | |||
| Steel–0.37% | |||
| Nucor Corp. | 82,209 | 12,488,369 | |
| Shares | Value | ||
| Steel–(continued) | |||
| Steel Dynamics, Inc. | 105,368 | $12,592,530 | |
| 25,080,899 | |||
| Systems Software–1.36% | |||
| CrowdStrike Holdings, Inc., Class A(c) | 32,997 | 9,149,408 | |
| Fortinet, Inc.(c) | 209,229 | 16,049,956 | |
| Gen Digital, Inc. | 521,397 | 13,796,165 | |
| Microsoft Corp. | 28,734 | 11,986,101 | |
| Oracle Corp. | 92,065 | 13,007,864 | |
| Palo Alto Networks, Inc.(c) | 40,078 | 14,537,092 | |
| ServiceNow, Inc.(c) | 17,454 | 14,923,170 | |
| 93,449,756 | |||
| Technology Distributors–0.19% | |||
| CDW Corp. | 56,978 | 12,856,516 | |
| Technology Hardware, Storage & Peripherals–1.16% | |||
| Apple, Inc. | 59,846 | 13,704,734 | |
| Hewlett Packard Enterprise Co. | 588,745 | 11,403,991 | |
| HP, Inc. | 358,120 | 12,956,781 | |
| NetApp, Inc. | 100,791 | 12,167,489 | |
| Seagate Technology Holdings PLC | 122,443 | 12,189,201 | |
| Super Micro Computer, Inc.(c) | 15,057 | 6,590,449 | |
| Western Digital Corp.(c) | 162,786 | 10,677,134 | |
| 79,689,779 | |||
| Telecom Tower REITs–0.63% | |||
| American Tower Corp. | 64,542 | 14,461,281 | |
| Crown Castle, Inc. | 128,323 | 14,374,742 | |
| SBA Communications Corp., Class A | 64,894 | 14,708,874 | |
| 43,544,897 | |||
| Timber REITs–0.19% | |||
| Weyerhaeuser Co. | 438,512 | 13,370,231 | |
| Tobacco–0.45% | |||
| Altria Group, Inc. | 286,933 | 15,428,387 | |
| Philip Morris International, Inc. | 124,431 | 15,341,098 | |
| 30,769,485 | |||
| Trading Companies & Distributors–0.62% | |||
| Fastenal Co. | 201,695 | 13,771,734 | |
| United Rentals, Inc. | 20,637 | 15,297,383 | |
| W.W. Grainger, Inc. | 14,023 | 13,811,533 | |
| 42,880,650 | |||
| Transaction & Payment Processing Services–1.68% | |||
| Corpay, Inc.(c) | 50,937 | 16,073,170 | |
| Fidelity National Information Services, Inc. | 166,082 | 13,693,461 | |
| Fiserv, Inc.(c) | 85,035 | 14,847,111 | |
| Global Payments, Inc. | 135,042 | 14,991,013 | |
| Jack Henry & Associates, Inc. | 78,708 | 13,618,845 | |
| Mastercard, Inc., Class A | 28,600 | 13,823,524 | |
| PayPal Holdings, Inc.(c) | 209,728 | 15,190,599 | |
| Visa, Inc., Class A(b) | 46,984 | 12,984,968 | |
| 115,222,691 | |||
| Water Utilities–0.21% | |||
| American Water Works Co., Inc.(b) | 98,353 | 14,076,281 | |
| 8 | Invesco Equally-Weighted S&P 500 Fund |
| Shares | Value | ||
| Wireless Telecommunication Services–0.21% | |||
| T-Mobile US, Inc. | 72,259 | $14,359,308 | |
| Total Common Stocks & Other Equity Interests (Cost $3,250,259,949) | 6,840,040,410 | ||
| Money Market Funds–0.29% | |||
| Invesco Government & Agency Portfolio, Institutional Class, 5.18%(d)(f) | 7,036,397 | 7,036,397 | |
| Invesco Treasury Portfolio, Institutional Class, 5.15%(d)(f) | 13,067,231 | 13,067,231 | |
| Total Money Market Funds (Cost $20,103,628) | 20,103,628 | ||
| TOTAL INVESTMENTS IN SECURITIES (excluding investments purchased with cash collateral from securities on loan)-99.89% (Cost $3,270,363,577) | 6,860,144,038 | ||
| Shares | Value | ||
| Investments Purchased with Cash Collateral from Securities on Loan | |||
| Money Market Funds–3.18% | |||
| Invesco Private Government Fund, 5.28%(d)(f)(g) | 59,009,923 | $59,009,923 | |
| Invesco Private Prime Fund, 5.46%(d)(f)(g) | 159,089,017 | 159,152,653 | |
| Total Investments Purchased with Cash Collateral from Securities on Loan (Cost $218,160,724) | 218,162,576 | ||
| TOTAL INVESTMENTS IN SECURITIES–103.07% (Cost $3,488,524,301) | 7,078,306,614 | ||
| OTHER ASSETS LESS LIABILITIES—(3.07)% | (210,763,423) | ||
| NET ASSETS–100.00% | $6,867,543,191 | ||
| REIT | – Real Estate Investment Trust |
| (a) | Industry and/or sector classifications used in this report are generally according to the Global Industry Classification Standard, which was developed by and is the exclusive property and a service mark of MSCI Inc. and Standard & Poor’s. |
| (b) | All or a portion of this security was out on loan at August 31, 2024. |
| (c) | Non-income producing security. |
| (d) | Affiliated holding. Affiliated holdings are investments in entities which are under common ownership or control of Invesco Ltd. or are investments in entities in which the Fund owns 5% or more of the outstanding voting securities. The table below shows the Fund’s transactions in, and earnings from, its investments in affiliates for the fiscal year ended August 31, 2024. |
| Value August 31, 2023 | Purchases at Cost | Proceeds from Sales | Change in Unrealized Appreciation | Realized Gain (Loss) | Value August 31, 2024 | Dividend Income | |
| Invesco Ltd. | $12,024,042 | $3,011,137 | $(1,127,770) | $1,507,863 | $(488,678) | $14,926,594 | $667,567 |
| Investments in Affiliated Money Market Funds: | |||||||
| Invesco Government & Agency Portfolio, Institutional Class | 8,944,423 | 234,329,298 | (236,237,324) | - | - | 7,036,397 | 495,509 |
| Invesco Liquid Assets Portfolio, Institutional Class | 6,387,428 | 145,384,271 | (151,777,690) | - | 5,991 | - | 296,054 |
| Invesco Treasury Portfolio, Institutional Class | 10,222,198 | 289,798,712 | (286,953,679) | - | - | 13,067,231 | 629,104 |
| Investments Purchased with Cash Collateral from Securities on Loan: | |||||||
| Invesco Private Government Fund | 61,093,654 | 939,504,800 | (941,588,531) | - | - | 59,009,923 | 3,697,783* |
| Invesco Private Prime Fund | 157,097,966 | 2,179,313,957 | (2,177,321,143) | 8,904 | 52,969 | 159,152,653 | 10,106,127* |
| Total | $255,769,711 | $3,791,342,175 | $(3,795,006,137) | $1,516,767 | $(429,718) | $253,192,798 | $15,892,144 |
| * | Represents the income earned on the investment of cash collateral, which is included in securities lending income on the Statement of Operations. Does not include rebates and fees paid to lending agent or premiums received from borrowers, if any. |
| (e) | All or a portion of the value was pledged as collateral to cover margin requirements for open futures contracts. See Note 1J. |
| (f) | The rate shown is the 7-day SEC standardized yield as of August 31, 2024. |
| (g) | The security has been segregated to satisfy the commitment to return the cash collateral received in securities lending transactions upon the borrower’s return of the securities loaned. See Note 1I. |
| Open Futures Contracts | |||||
| Long Futures Contracts | Number of Contracts | Expiration Month | Notional Value | Value | Unrealized Appreciation |
| Equity Risk | |||||
| E-Mini S&P 500 Equal Weights Index | 199 | September-2024 | $28,395,310 | $643,448 | $643,448 |
| 9 | Invesco Equally-Weighted S&P 500 Fund |
| Assets: | |
| Investments in unaffiliated securities, at value (Cost $3,240,165,746)* | $6,825,113,816 |
| Investments in affiliates, at value (Cost $248,358,555) | 253,192,798 |
| Other investments: | |
| Variation margin receivable — futures contracts | 231,076 |
| Cash | 247 |
| Receivable for: | |
| Fund shares sold | 3,419,053 |
| Dividends | 10,102,432 |
| Investment for trustee deferred compensation and retirement plans | 197,453 |
| Other assets | 422,971 |
| Total assets | 7,092,679,846 |
| Liabilities: | |
| Payable for: | |
| Fund shares reacquired | 3,374,082 |
| Collateral upon return of securities loaned | 218,160,724 |
| Accrued fees to affiliates | 2,658,765 |
| Accrued trustees’ and officers’ fees and benefits | 8,163 |
| Accrued other operating expenses | 671,656 |
| Trustee deferred compensation and retirement plans | 263,265 |
| Total liabilities | 225,136,655 |
| Net assets applicable to shares outstanding | $6,867,543,191 |
| Net assets consist of: | |
| Shares of beneficial interest | $2,908,011,565 |
| Distributable earnings | 3,959,531,626 |
| $6,867,543,191 |
| Net Assets: | |
| Class A | $3,198,398,587 |
| Class C | $466,923,783 |
| Class R | $214,038,883 |
| Class Y | $2,283,521,333 |
| Class R6 | $704,660,605 |
| Shares outstanding, no par value, with an unlimited number of shares authorized: | |
| Class A | 41,290,553 |
| Class C | 6,466,927 |
| Class R | 2,792,814 |
| Class Y | 28,973,439 |
| Class R6 | 8,912,956 |
| Class A: | |
| Net asset value per share | $77.46 |
| Maximum offering price per share (Net asset value of $77.46 ÷ 94.50%) | $81.97 |
| Class C: | |
| Net asset value and offering price per share | $72.20 |
| Class R: | |
| Net asset value and offering price per share | $76.64 |
| Class Y: | |
| Net asset value and offering price per share | $78.81 |
| Class R6: | |
| Net asset value and offering price per share | $79.06 |
| * | At August 31, 2024, securities with an aggregate value of $214,450,012 were on loan to brokers. |
| 10 | Invesco Equally-Weighted S&P 500 Fund |
| Investment income: | |
| Dividends (net of foreign withholding taxes of $47,564) | $122,657,818 |
| Dividends from affiliates (includes net securities lending income of $361,749) | 2,449,983 |
| Total investment income | 125,107,801 |
| Expenses: | |
| Advisory fees | 6,809,981 |
| Administrative services fees | 922,261 |
| Custodian fees | 70,957 |
| Distribution fees: | |
| Class A | 7,312,714 |
| Class C | 4,858,937 |
| Class R | 949,467 |
| Transfer agent fees — A, C, R and Y | 7,511,516 |
| Transfer agent fees — R6 | 193,044 |
| Trustees’ and officers’ fees and benefits | 82,413 |
| Registration and filing fees | 160,514 |
| Licensing fees | 1,020,726 |
| Reports to shareholders | 727,977 |
| Professional services fees | 110,201 |
| Other | 109,240 |
| Total expenses | 30,839,948 |
| Less: Fees waived and/or expense offset arrangement(s) | (74,139) |
| Net expenses | 30,765,809 |
| Net investment income | 94,341,992 |
| Realized and unrealized gain (loss) from: | |
| Net realized gain (loss) from: | |
| Unaffiliated investment securities | 445,451,906 |
| Affiliated investment securities | (429,718) |
| Futures contracts | 7,616,849 |
| 452,639,037 | |
| Change in net unrealized appreciation of: | |
| Unaffiliated investment securities | 574,431,411 |
| Affiliated investment securities | 1,516,767 |
| Futures contracts | 811,679 |
| 576,759,857 | |
| Net realized and unrealized gain | 1,029,398,894 |
| Net increase in net assets resulting from operations | $1,123,740,886 |
| 11 | Invesco Equally-Weighted S&P 500 Fund |
| 2024 | 2023 | |
| Operations: | ||
| Net investment income | $94,341,992 | $92,740,163 |
| Net realized gain | 452,639,037 | 154,092,750 |
| Change in net unrealized appreciation | 576,759,857 | 247,178,154 |
| Net increase in net assets resulting from operations | 1,123,740,886 | 494,011,067 |
| Distributions to shareholders from distributable earnings: | ||
| Class A | (132,438,434) | (209,942,045) |
| Class C | (21,029,947) | (52,192,427) |
| Class R | (8,039,909) | (12,121,490) |
| Class Y | (102,662,759) | (178,908,251) |
| Class R6 | (30,169,212) | (43,715,271) |
| Total distributions from distributable earnings | (294,340,261) | (496,879,484) |
| Share transactions–net: | ||
| Class A | (23,435,958) | 163,416,324 |
| Class C | (130,483,656) | (140,098,319) |
| Class R | 13,234,901 | 28,083,354 |
| Class Y | (182,448,268) | (59,477,222) |
| Class R6 | 29,931,097 | 25,417,946 |
| Net increase (decrease) in net assets resulting from share transactions | (293,201,884) | 17,342,083 |
| Net increase in net assets | 536,198,741 | 14,473,666 |
| Net assets: | ||
| Beginning of year | 6,331,344,450 | 6,316,870,784 |
| End of year | $6,867,543,191 | $6,331,344,450 |
| 12 | Invesco Equally-Weighted S&P 500 Fund |
| Net asset value, beginning of period | Net investment income(a) | Net gains (losses) on securities (both realized and unrealized) | Total from investment operations | Dividends from net investment income | Distributions from net realized gains | Total distributions | Net asset value, end of period | Total return(b) | Net assets, end of period (000’s omitted) | Ratio of expenses to average net assets with fee waivers and/or expenses absorbed | Ratio of expenses to average net assets without fee waivers and/or expenses absorbed | Ratio of net investment income to average net assets | Portfolio turnover (c) | |
| Class A | ||||||||||||||
| Year ended 08/31/24 | $68.25 | $0.99 | $11.46 | $12.45 | $(1.03) | $(2.21) | $(3.24) | $77.46 | 18.88% | $3,198,399 | 0.54% | 0.54% | 1.41% | 22% |
| Year ended 08/31/23 | 68.51 | 0.96 | 4.20 | 5.16 | (0.87) | (4.55) | (5.42) | 68.25 | 8.10 | 2,838,398 | 0.52 | 0.52 | 1.44 | 20 |
| Year ended 08/31/22 | 82.72 | 0.90 | (7.40) | (6.50) | (0.93) | (6.78) | (7.71) | 68.51 | (8.85) | 2,670,328 | 0.53 | 0.53 | 1.18 | 24 |
| Year ended 08/31/21 | 62.02 | 0.82 | 24.05 | 24.87 | (0.99) | (3.18) | (4.17) | 82.72 | 41.81 | 2,971,521 | 0.52 | 0.52 | 1.13 | 23 |
| Year ended 08/31/20 | 60.01 | 0.99 | 3.88 | 4.87 | (1.03) | (1.83) | (2.86) | 62.02 | 8.08(d) | 2,182,945 | 0.53 | 0.53 | 1.67 | 26 |
| Class C | ||||||||||||||
| Year ended 08/31/24 | 63.76 | 0.44 | 10.69 | 11.13 | (0.48) | (2.21) | (2.69) | 72.20 | 18.01(e) | 466,924 | 1.28(e) | 1.28(e) | 0.67(e) | 22 |
| Year ended 08/31/23 | 64.65 | 0.43 | 3.94 | 4.37 | (0.71) | (4.55) | (5.26) | 63.76 | 7.29 | 539,237 | 1.27 | 1.27 | 0.69 | 20 |
| Year ended 08/31/22 | 78.47 | 0.31 | (7.00) | (6.69) | (0.35) | (6.78) | (7.13) | 64.65 | (9.53) | 689,583 | 1.28 | 1.28 | 0.43 | 24 |
| Year ended 08/31/21 | 58.96 | 0.30 | 22.86 | 23.16 | (0.47) | (3.18) | (3.65) | 78.47 | 40.82(e) | 945,674 | 1.21(e) | 1.21(e) | 0.44(e) | 23 |
| Year ended 08/31/20 | 57.18 | 0.52 | 3.66 | 4.18 | (0.57) | (1.83) | (2.40) | 58.96 | 7.27(d) | 879,154 | 1.28 | 1.28 | 0.92 | 26 |
| Class R | ||||||||||||||
| Year ended 08/31/24 | 67.55 | 0.81 | 11.34 | 12.15 | (0.85) | (2.21) | (3.06) | 76.64 | 18.60 | 214,039 | 0.79 | 0.79 | 1.16 | 22 |
| Year ended 08/31/23 | 67.97 | 0.78 | 4.17 | 4.95 | (0.82) | (4.55) | (5.37) | 67.55 | 7.82 | 175,270 | 0.77 | 0.77 | 1.19 | 20 |
| Year ended 08/31/22 | 82.12 | 0.70 | (7.34) | (6.64) | (0.73) | (6.78) | (7.51) | 67.97 | (9.08) | 146,993 | 0.78 | 0.78 | 0.93 | 24 |
| Year ended 08/31/21 | 61.60 | 0.63 | 23.88 | 24.51 | (0.81) | (3.18) | (3.99) | 82.12 | 41.44 | 147,581 | 0.77 | 0.77 | 0.88 | 23 |
| Year ended 08/31/20 | 59.63 | 0.83 | 3.84 | 4.67 | (0.87) | (1.83) | (2.70) | 61.60 | 7.80(d) | 127,559 | 0.78 | 0.78 | 1.42 | 26 |
| Class Y | ||||||||||||||
| Year ended 08/31/24 | 69.38 | 1.19 | 11.64 | 12.83 | (1.19) | (2.21) | (3.40) | 78.81 | 19.17 | 2,283,521 | 0.29 | 0.29 | 1.66 | 22 |
| Year ended 08/31/23 | 69.44 | 1.14 | 4.28 | 5.42 | (0.93) | (4.55) | (5.48) | 69.38 | 8.38 | 2,188,760 | 0.27 | 0.27 | 1.69 | 20 |
| Year ended 08/31/22 | 83.74 | 1.10 | (7.50) | (6.40) | (1.12) | (6.78) | (7.90) | 69.44 | (8.64) | 2,248,749 | 0.28 | 0.28 | 1.43 | 24 |
| Year ended 08/31/21 | 62.74 | 1.01 | 24.32 | 25.33 | (1.15) | (3.18) | (4.33) | 83.74 | 42.15 | 2,671,007 | 0.27 | 0.27 | 1.38 | 23 |
| Year ended 08/31/20 | 60.67 | 1.15 | 3.93 | 5.08 | (1.18) | (1.83) | (3.01) | 62.74 | 8.35(d) | 2,106,008 | 0.28 | 0.28 | 1.92 | 26 |
| Class R6 | ||||||||||||||
| Year ended 08/31/24 | 69.58 | 1.26 | 11.69 | 12.95 | (1.26) | (2.21) | (3.47) | 79.06 | 19.30 | 704,661 | 0.19 | 0.19 | 1.76 | 22 |
| Year ended 08/31/23 | 69.59 | 1.21 | 4.28 | 5.49 | (0.95) | (4.55) | (5.50) | 69.58 | 8.48 | 589,680 | 0.18 | 0.18 | 1.78 | 20 |
| Year ended 08/31/22 | 83.90 | 1.18 | (7.51) | (6.33) | (1.20) | (6.78) | (7.98) | 69.59 | (8.54) | 561,218 | 0.19 | 0.19 | 1.52 | 24 |
| Year ended 08/31/21 | 62.86 | 1.09 | 24.36 | 25.45 | (1.23) | (3.18) | (4.41) | 83.90 | 42.30 | 910,010 | 0.16 | 0.16 | 1.49 | 23 |
| Year ended 08/31/20 | 60.78 | 1.22 | 3.94 | 5.16 | (1.25) | (1.83) | (3.08) | 62.86 | 8.47(d) | 740,456 | 0.16 | 0.16 | 2.04 | 26 |
| (a) | Calculated using average shares outstanding. |
| (b) | Includes adjustments in accordance with accounting principles generally accepted in the United States of America and as such, the net asset value for financial reporting purposes and the returns based upon those net asset values may differ from the net asset value and returns for shareholder transactions. Does not include sales charges and is not annualized for periods less than one year, if applicable. |
| (c) | Portfolio turnover is calculated at the fund level and is not annualized for periods less than one year, if applicable. |
| (d) | Amount includes the effect of the Adviser pay-in for an economic loss as a result of a delay in rebalancing to the Index that occurred on April 24, 2020. Had the pay-in not been made, the total return would have been 6.49%, 5.61%, 6.21%, 6.78% and 6.90% for Class A, Class C, Class R, Class Y and Class R6 shares, respectively. |
| (e) | The total return, ratios of expenses to average net assets and ratio of net investment income (loss) to average net assets reflect actual 12b-1 fees of 0.99% and 0.93% for the years ended August 31, 2024 and 2021, respectively. |
| 13 | Invesco Equally-Weighted S&P 500 Fund |
| A. | Security Valuations — Securities, including restricted securities, are valued according to the following policy. |
| 14 | Invesco Equally-Weighted S&P 500 Fund |
| B. | Securities Transactions and Investment Income – Securities transactions are accounted for on a trade date basis. Realized gains or losses on sales are computed on the basis of specific identification of the securities sold. Interest income (net of withholding tax, if any) is recorded on an accrual basis from settlement date and includes coupon interest and amortization of premium and accretion of discount on debt securities as applicable. Pay-in-kind interest income and non-cash dividend income received in the form of securities in lieu of cash are recorded at the fair value of the securities received. Dividend income (net of withholding tax, if any) is recorded on the ex-dividend date. |
| C. | Country Determination — For the purposes of making investment selection decisions and presentation in the Schedule of Investments, the investment adviser may determine the country in which an issuer is located and/or credit risk exposure based on various factors. These factors include the laws of the country under which the issuer is organized, where the issuer maintains a principal office, the country in which the issuer derives 50% or more of its total revenues, the country that has the primary market for the issuer’s securities and its "country of risk" as determined by a third party service provider, as well as other criteria. Among the other criteria that may be evaluated for making this determination are the country in which the issuer maintains 50% or more of its assets, the type of security, financial guarantees and enhancements, the nature of the collateral and the sponsor organization. Country of issuer and/or credit risk exposure has been determined to be the United States of America, unless otherwise noted. |
| D. | Distributions – Distributions from net investment income and net realized capital gain, if any, are generally declared and paid annually and recorded on the ex-dividend date. The Fund may elect to treat a portion of the proceeds from redemptions as distributions for federal income tax purposes. |
| E. | Federal Income Taxes – The Fund intends to comply with the requirements of Subchapter M of the Internal Revenue Code of 1986, as amended (the “Internal Revenue Code”), necessary to qualify as a regulated investment company and to distribute substantially all of the Fund’s taxable earnings to shareholders. As such, the Fund will not be subject to federal income taxes on otherwise taxable income (including net realized capital gain) that is distributed to shareholders. Therefore, no provision for federal income taxes is recorded in the financial statements. |
| F. | Expenses – Fees provided for under the Rule 12b-1 plan of a particular class of the Fund are charged to the operations of such class. Transfer agency fees and expenses and other shareholder recordkeeping fees and expenses attributable to Class R6 are charged to such class. Transfer agency fees and expenses and other shareholder recordkeeping fees and expenses relating to all other classes are allocated among those classes based on relative net assets. All other expenses are allocated among the classes based on relative net assets. |
| G. | Accounting Estimates – The preparation of financial statements in conformity with accounting principles generally accepted in the United States of America (“GAAP”) requires management to make estimates and assumptions that affect the reported amounts of assets and liabilities at the date of the financial statements and the reported amounts of revenues and expenses during the reporting period including estimates and assumptions related to taxation. Actual results could differ from those estimates by a significant amount. In addition, the Fund monitors for material events or transactions that may occur or become known after the period-end date and before the date the financial statements are released to print. |
| H. | Indemnifications – Under the Trust’s organizational documents, each Trustee, officer, employee or other agent of the Trust is indemnified against certain liabilities that may arise out of the performance of their duties to the Fund. Additionally, in the normal course of business, the Fund enters into contracts, including the Fund’s servicing agreements, that contain a variety of indemnification clauses. The Fund’s maximum exposure under these arrangements is unknown as this would involve future claims that may be made against the Fund that have not yet occurred. The risk of material loss as a result of such indemnification claims is considered remote. |
| I. | Securities Lending – The Fund may lend portfolio securities having a market value up to one-third of the Fund’s total assets. Such loans are secured by collateral equal to no less than the market value of the loaned securities determined daily by the securities lending provider. Such collateral will be cash or debt securities issued or guaranteed by the U.S. Government or any of its sponsored agencies. Cash collateral received in connection with these loans is invested in short-term money market instruments or affiliated, unregistered investment companies that comply with Rule 2a-7 under the 1940 Act and money market funds (collectively, "affiliated money market funds") and is shown as such on the Schedule of Investments. The Fund bears the risk of loss with respect to the investment of collateral. It is the Fund’s policy to obtain additional collateral from or return excess collateral to the borrower by the end of the next business day, following the valuation date of the securities loaned. Therefore, the value of the collateral held may be temporarily less than the value of the securities on loan. When loaning securities, the Fund retains certain benefits of owning the securities, including the economic equivalent of dividends or interest generated by the security. Lending securities entails a risk of loss to the Fund if, and to the extent that, the market value of the securities loaned were to increase and the borrower did not increase the collateral accordingly, and the borrower failed to return the securities. The securities loaned are subject to termination at the option of the borrower or the Fund. Upon termination, the borrower will return to the Fund the securities loaned and the Fund will return the collateral. Upon the failure of the borrower to return the securities, collateral may be liquidated and the securities may be purchased on the open market to replace the loaned securities. The Fund could experience delays and costs in gaining access to the collateral and the securities may lose value during the delay which could result in potential losses to the Fund. Some of these losses may be indemnified by the lending agent. The Fund bears the risk of any deficiency in the amount of the collateral available for return to the |
| 15 | Invesco Equally-Weighted S&P 500 Fund |
| borrower due to any loss on the collateral invested. Dividends received on cash collateral investments for securities lending transactions, which are net of compensation to counterparties, are included in Dividends from affiliates on the Statement of Operations. The aggregate value of securities out on loan, if any, is shown as a footnote on the Statement of Assets and Liabilities. |
| J. | Futures Contracts — The Fund may enter into futures contracts to manage exposure to interest rate, equity and market price movements and/or currency risks. A futures contract is an agreement between two parties ("Counterparties") to purchase or sell a specified underlying security, currency or commodity (or delivery of a cash settlement price, in the case of an index future) for a fixed price at a future date. The Fund currently invests only in exchange-traded futures and they are standardized as to maturity date and underlying instrument or asset. Initial margin deposits required upon entering into futures contracts are satisfied by the segregation of specific securities or cash as collateral at the futures commission merchant (broker). During the period the futures contracts are open, changes in the value of the contracts are recognized as unrealized gains or losses by recalculating the value of the contracts on a daily basis. Subsequent or variation margin payments are received or made depending upon whether unrealized gains or losses are incurred. These amounts are reflected as receivables or payables on the Statement of Assets and Liabilities. When the contracts are closed or expire, the Fund recognizes a realized gain or loss equal to the difference between the proceeds from, or cost of, the closing transaction and the Fund’s basis in the contract. The net realized gain (loss) and the change in unrealized gain (loss) on futures contracts held during the period is included on the Statement of Operations. The primary risks associated with futures contracts are market risk and the absence of a liquid secondary market. If the Fund were unable to liquidate a futures contract and/or enter into an offsetting closing transaction, the Fund would continue to be subject to market risk with respect to the value of the contracts and continue to be required to maintain the margin deposits on the futures contracts. Futures contracts have minimal Counterparty risk since the exchange’s clearinghouse, as Counterparty to all exchange-traded futures, guarantees the futures against default. Risks may exceed amounts recognized in the Statement of Assets and Liabilities. |
| K. | Leverage Risk — Leverage exists when the Fund can lose more than it originally invests because it purchases or sells an instrument or enters into a transaction without investing an amount equal to the full economic exposure of the instrument or transaction. |
| L. | Collateral —To the extent the Fund has designated or segregated a security as collateral and that security is subsequently sold, it is the Fund’s practice to replace such collateral no later than the next business day. This practice does not apply to securities pledged as collateral for securities lending transactions. |
| Average Daily Net Assets | Rate |
| First $2 billion | 0.120% |
| Over $2 billion | 0.100% |
| 16 | Invesco Equally-Weighted S&P 500 Fund |
| Level 1 | Level 2 | Level 3 | Total | |
| Investments in Securities | ||||
| Common Stocks & Other Equity Interests | $6,840,040,410 | $— | $— | $6,840,040,410 |
| Money Market Funds | 20,103,628 | 218,162,576 | — | 238,266,204 |
| Total Investments in Securities | 6,860,144,038 | 218,162,576 | — | 7,078,306,614 |
| Other Investments - Assets* | ||||
| Futures Contracts | 643,448 | — | — | 643,448 |
| Total Investments | $6,860,787,486 | $218,162,576 | $— | $7,078,950,062 |
| * | Unrealized appreciation. |
| Value | |
| Derivative Assets | Equity Risk |
| Unrealized appreciation on futures contracts —Exchange-Traded(a) | $643,448 |
| Derivatives not subject to master netting agreements | (643,448) |
| Total Derivative Assets subject to master netting agreements | $— |
| (a) | The daily variation margin receivable (payable) at period-end is recorded in the Statement of Assets and Liabilities. |
| Location of Gain on Statement of Operations | |
| Equity Risk | |
| Realized Gain: | |
| Futures contracts | $7,616,849 |
| 17 | Invesco Equally-Weighted S&P 500 Fund |
| Location of Gain on Statement of Operations | |
| Equity Risk | |
| Change in Net Unrealized Appreciation: | |
| Futures contracts | $811,679 |
| Total | $8,428,528 |
| Futures Contracts | |
| Average notional value | $36,449,172 |
| Tax Character of Distributions to Shareholders Paid During the Fiscal Years Ended August 31, 2024 and 2023: | ||
| 2024 | 2023 | |
| Ordinary income* | $113,451,915 | $93,259,970 |
| Long-term capital gain | 180,888,346 | 403,619,514 |
| Total distributions | $294,340,261 | $496,879,484 |
| * | Includes short-term capital gain distributions, if any. |
| Tax Components of Net Assets at Period-End: | |
| 2024 | |
| Undistributed ordinary income | $113,708,650 |
| Undistributed long-term capital gain | 322,576,526 |
| Net unrealized appreciation — investments | 3,523,435,513 |
| Temporary book/tax differences | (189,063) |
| Shares of beneficial interest | 2,908,011,565 |
| Total net assets | $6,867,543,191 |
| 18 | Invesco Equally-Weighted S&P 500 Fund |
| Unrealized Appreciation (Depreciation) of Investments on a Tax Basis | |
| Aggregate unrealized appreciation of investments | $3,625,131,668 |
| Aggregate unrealized (depreciation) of investments | (101,696,155) |
| Net unrealized appreciation of investments | $3,523,435,513 |
| Summary of Share Activity | |||||
| Year ended August 31, 2024(a) | Year ended August 31, 2023 | ||||
| Shares | Amount | Shares | Amount | ||
| Sold: | |||||
| Class A | 3,463,091 | $243,514,116 | 3,550,290 | $236,640,132 | |
| Class C | 646,603 | 42,251,654 | 757,037 | 47,474,545 | |
| Class R | 745,327 | 51,566,750 | 732,338 | 48,409,714 | |
| Class Y | 5,548,343 | 395,735,094 | 7,498,069 | 509,845,358 | |
| Class R6 | 2,371,648 | 169,715,785 | 1,356,154 | 91,833,344 | |
| Issued as reinvestment of dividends: | |||||
| Class A | 1,710,056 | 116,608,697 | 2,911,314 | 185,392,475 | |
| Class C | 302,457 | 19,323,979 | 798,907 | 47,782,627 | |
| Class R | 118,409 | 8,003,269 | 190,686 | 12,039,940 | |
| Class Y | 1,122,862 | 77,769,409 | 2,129,933 | 137,636,274 | |
| Class R6 | 413,764 | 28,727,668 | 641,704 | 41,563,154 | |
| Automatic conversion of Class C shares to Class A shares: | |||||
| Class A | 1,508,142 | 104,580,647 | 2,184,788 | 145,496,726 | |
| Class C | (1,614,290) | (104,580,647) | (2,328,673) | (145,496,726) | |
| Reacquired: | |||||
| Class A | (6,977,976) | (488,139,418) | (6,039,107) | (404,113,009) | |
| Class C | (1,324,564) | (87,478,642) | (1,437,750) | (89,858,765) | |
| Class R | (665,415) | (46,335,118) | (491,237) | (32,366,300) | |
| Class Y | (9,243,958) | (655,952,771) | (10,464,322) | (706,958,854) | |
| Class R6 | (2,347,139) | (168,512,356) | (1,588,235) | (107,978,552) | |
| Net increase (decrease) in share activity | (4,222,640) | $(293,201,884) | 401,896 | $17,342,083 | |
| (a) | There are entities that are record owners of more than 5% of the outstanding shares of the Fund and in the aggregate own 53% of the outstanding shares of the Fund. IDI has an agreement with these entities to sell Fund shares. The Fund, Invesco and/or Invesco affiliates may make payments to these entities, which are considered to be related to the Fund, for providing services to the Fund, Invesco and/or Invesco affiliates including but not limited to services such as securities brokerage, distribution, third party record keeping and account servicing. The Fund has no knowledge as to whether all or any portion of the shares owned of record by these entities are also owned beneficially. |
| 19 | Invesco Equally-Weighted S&P 500 Fund |
| 20 | Invesco Equally-Weighted S&P 500 Fund |
| 21 | Invesco Equally-Weighted S&P 500 Fund |
| C. | Advisory and Sub-Advisory Fees and Fund Expenses |
| D. | Economies of Scale and Breakpoints |
| E. | Profitability and Financial Resources |
| F. | Collateral Benefits to Invesco Advisers and its Affiliates |
| 22 | Invesco Equally-Weighted S&P 500 Fund |
| 23 | Invesco Equally-Weighted S&P 500 Fund |
| Federal and State Income Tax | |
| Long-Term Capital Gain Distributions | $214,029,346 |
| Qualified Dividend Income* | 90.28% |
| Corporate Dividends Received Deduction* | 89.21% |
| U.S. Treasury Obligations* | 0.00% |
| Qualified Business Income* | 2.28% |
| Business Interest Income* | 0.00% |
| * | The above percentages are based on ordinary income dividends paid to shareholders during the Fund’s fiscal year. |
| Non-Resident Alien Shareholders | |
| Short-Term Capital Gain Distributions | $18,647,935 |
| 24 | Invesco Equally-Weighted S&P 500 Fund |
| 25 | Invesco Equally-Weighted S&P 500 Fund |

| Annual Financial Statements and Other Information | August 31, 2024 |
| Shares | Value | ||
| Common Stocks & Other Equity Interests–65.08% | |||
| Aerospace & Defense–1.71% | |||
| RTX Corp. | 1,173,898 | $144,788,579 | |
| Textron, Inc. | 772,178 | 70,422,634 | |
| 215,211,213 | |||
| Air Freight & Logistics–1.00% | |||
| FedEx Corp. | 418,878 | 125,148,180 | |
| Application Software–0.69% | |||
| Salesforce, Inc. | 343,639 | 86,906,303 | |
| Asset Management & Custody Banks–0.90% | |||
| KKR & Co., Inc., Class A | 915,143 | 113,267,249 | |
| Automobile Manufacturers–0.90% | |||
| General Motors Co. | 2,278,163 | 113,406,954 | |
| Broadline Retail–1.37% | |||
| Amazon.com, Inc.(b) | 963,895 | 172,055,257 | |
| Building Products–1.37% | |||
| Johnson Controls International PLC | 2,368,102 | 172,516,231 | |
| Cable & Satellite–0.43% | |||
| Comcast Corp., Class A | 1,372,142 | 54,295,659 | |
| Cargo Ground Transportation–0.59% | |||
| J.B. Hunt Transport Services, Inc. | 427,961 | 74,122,845 | |
| Casinos & Gaming–0.47% | |||
| Las Vegas Sands Corp. | 1,521,802 | 59,335,060 | |
| Communications Equipment–0.68% | |||
| Cisco Systems, Inc. | 1,694,196 | 85,624,666 | |
| Consumer Finance–0.63% | |||
| American Express Co. | 306,912 | 79,382,789 | |
| Distributors–0.61% | |||
| Genuine Parts Co. | 539,212 | 77,247,511 | |
| Diversified Banks–5.54% | |||
| Bank of America Corp. | 6,650,684 | 271,015,373 | |
| PNC Financial Services Group, Inc. (The) | 769,416 | 142,411,207 | |
| Wells Fargo & Co. | 4,838,850 | 282,927,560 | |
| 696,354,140 | |||
| Electric Utilities–2.15% | |||
| American Electric Power Co., Inc. | 886,637 | 88,911,959 | |
| FirstEnergy Corp. | 1,692,562 | 74,337,323 | |
| PPL Corp. | 3,357,520 | 107,138,463 | |
| 270,387,745 | |||
| Electrical Components & Equipment–0.77% | |||
| Emerson Electric Co. | 923,391 | 97,316,177 | |
| Electronic Components–0.63% | |||
| Coherent Corp.(b) | 1,011,693 | 78,861,469 | |
| Shares | Value | ||
| Electronic Equipment & Instruments–0.76% | |||
| Zebra Technologies Corp., Class A(b) | 277,925 | $95,989,736 | |
| Electronic Manufacturing Services–0.62% | |||
| TE Connectivity Ltd. | 511,322 | 78,539,059 | |
| Fertilizers & Agricultural Chemicals–0.56% | |||
| Corteva, Inc. | 1,233,427 | 70,675,367 | |
| Food Distributors–1.68% | |||
| Sysco Corp. | 1,514,350 | 118,073,869 | |
| US Foods Holding Corp.(b) | 1,568,894 | 92,894,214 | |
| 210,968,083 | |||
| Gold–0.52% | |||
| Barrick Gold Corp. (Canada) | 3,226,063 | 65,134,212 | |
| Health Care Equipment–1.61% | |||
| GE HealthCare Technologies, Inc. | 667,264 | 56,597,333 | |
| Medtronic PLC | 1,644,778 | 145,694,435 | |
| 202,291,768 | |||
| Health Care Services–1.04% | |||
| Cigna Group (The) | 183,362 | 66,342,205 | |
| CVS Health Corp. | 1,125,384 | 64,416,980 | |
| 130,759,185 | |||
| Industrial Machinery & Supplies & Components–2.03% | |||
| Parker-Hannifin Corp. | 305,557 | 183,395,312 | |
| Stanley Black & Decker, Inc. | 700,665 | 71,720,069 | |
| 255,115,381 | |||
| Insurance Brokers–1.18% | |||
| Willis Towers Watson PLC | 506,799 | 148,041,056 | |
| Integrated Oil & Gas–3.99% | |||
| Chevron Corp. | 811,203 | 120,017,484 | |
| Exxon Mobil Corp. | 1,676,018 | 197,669,563 | |
| Shell PLC (United Kingdom) | 2,330,977 | 82,594,730 | |
| Suncor Energy, Inc. (Canada)(c) | 2,508,578 | 101,746,650 | |
| 502,028,427 | |||
| Interactive Media & Services–2.19% | |||
| Alphabet, Inc., Class A | 1,081,431 | 176,684,197 | |
| Meta Platforms, Inc., Class A | 189,107 | 98,583,370 | |
| 275,267,567 | |||
| Investment Banking & Brokerage–1.85% | |||
| Charles Schwab Corp. (The) | 1,597,454 | 103,994,256 | |
| Goldman Sachs Group, Inc. (The) | 251,665 | 128,412,066 | |
| 232,406,322 | |||
| IT Consulting & Other Services–0.76% | |||
| Cognizant Technology Solutions Corp., Class A | 1,229,961 | 95,654,067 | |
| Managed Health Care–2.85% | |||
| Centene Corp.(b) | 903,221 | 71,200,912 | |
| Elevance Health, Inc. | 123,349 | 68,691,825 | |
| Humana, Inc. | 273,154 | 96,824,898 | |
| 2 | Invesco Equity and Income Fund |
| Shares | Value | ||
| Managed Health Care–(continued) | |||
| UnitedHealth Group, Inc. | 207,306 | $122,352,001 | |
| 359,069,636 | |||
| Movies & Entertainment–0.75% | |||
| Walt Disney Co. (The) | 1,039,270 | 93,929,223 | |
| Multi-line Insurance–0.83% | |||
| American International Group, Inc. | 1,349,820 | 104,003,631 | |
| Oil & Gas Exploration & Production–1.27% | |||
| ConocoPhillips | 1,403,572 | 159,712,458 | |
| Oil & Gas Refining & Marketing–0.48% | |||
| Phillips 66 | 429,771 | 60,301,169 | |
| Packaged Foods & Meats–0.69% | |||
| Kraft Heinz Co. (The) | 2,463,112 | 87,268,058 | |
| Pharmaceuticals–3.80% | |||
| Bristol-Myers Squibb Co. | 1,914,944 | 95,651,453 | |
| Johnson & Johnson | 1,068,891 | 177,286,261 | |
| Merck & Co., Inc. | 64,612 | 7,653,292 | |
| Pfizer, Inc. | 2,178,425 | 63,196,109 | |
| Sanofi S.A. | 1,196,984 | 134,347,195 | |
| 478,134,310 | |||
| Property & Casualty Insurance–0.70% | |||
| Allstate Corp. (The) | 462,375 | 87,361,133 | |
| Rail Transportation–1.73% | |||
| CSX Corp. | 2,941,996 | 100,822,203 | |
| Norfolk Southern Corp. | 455,641 | 116,716,998 | |
| 217,539,201 | |||
| Real Estate Services–1.43% | |||
| CBRE Group, Inc., Class A(b) | 1,563,525 | 180,024,268 | |
| Regional Banks–1.08% | |||
| Citizens Financial Group, Inc. | 3,162,686 | 136,153,632 | |
| Restaurants–0.56% | |||
| Starbucks Corp. | 743,433 | 70,306,459 | |
| Semiconductor Materials & Equipment–0.46% | |||
| Lam Research Corp. | 70,775 | 58,106,983 | |
| Semiconductors–2.17% | |||
| Microchip Technology, Inc. | 996,833 | 81,899,799 | |
| Micron Technology, Inc. | 1,073,584 | 103,321,724 | |
| NXP Semiconductors N.V. (China) | 340,093 | 87,186,242 | |
| 272,407,765 | |||
| Specialty Chemicals–1.14% | |||
| DuPont de Nemours, Inc. | 1,005,873 | 84,744,800 | |
| PPG Industries, Inc. | 455,222 | 59,055,950 | |
| 143,800,750 | |||
| Systems Software–1.16% | |||
| Oracle Corp. | 1,036,178 | 146,401,590 | |
| Tobacco–1.16% | |||
| Philip Morris International, Inc. | 1,185,121 | 146,113,568 | |
| Shares | Value | ||
| Trading Companies & Distributors–0.94% | |||
| Ferguson Enterprises, Inc.(c) | 575,085 | $118,300,735 | |
| Transaction & Payment Processing Services–1.79% | |||
| Fidelity National Information Services, Inc. | 921,114 | 75,945,849 | |
| Fiserv, Inc.(b) | 857,524 | 149,723,691 | |
| 225,669,540 | |||
| Wireless Telecommunication Services–0.86% | |||
| T-Mobile US, Inc. | 542,805 | 107,866,210 | |
| Total Common Stocks & Other Equity Interests (Cost $5,576,128,742) | 8,186,779,997 | ||
| Principal Amount | |||
| U.S. Dollar Denominated Bonds & Notes–19.76% | |||
| Advertising–0.04% | |||
| Omnicom Group, Inc./Omnicom Capital, Inc., 3.60%, 04/15/2026 | $5,660,000 | 5,561,287 | |
| Aerospace & Defense–0.43% | |||
| BAE Systems PLC (United Kingdom), 5.50%, 03/26/2054(c)(d) | 3,130,000 | 3,195,195 | |
| Boeing Co. (The), 5.81%, 05/01/2050 | 16,525,000 | 15,609,920 | |
| Lockheed Martin Corp., | |||
| 3.55%, 01/15/2026 | 14,804,000 | 14,630,519 | |
| 4.15%, 06/15/2053 | 5,231,000 | 4,483,735 | |
| 5.20%, 02/15/2064 | 5,558,000 | 5,605,298 | |
| RTX Corp., | |||
| 4.45%, 11/16/2038 | 3,239,000 | 3,017,464 | |
| 6.40%, 03/15/2054 | 6,223,000 | 7,148,355 | |
| 53,690,486 | |||
| Agricultural Products & Services–0.04% | |||
| Ingredion, Inc., 6.63%, 04/15/2037 | 3,940,000 | 4,403,332 | |
| Air Freight & Logistics–0.05% | |||
| FedEx Corp., 4.90%, 01/15/2034(c) | 4,310,000 | 4,357,360 | |
| United Parcel Service, Inc., 3.40%, 11/15/2046 | 2,608,000 | 2,051,646 | |
| 6,409,006 | |||
| Alternative Carriers–0.24% | |||
| Match Group Financeco 2, Inc., Conv., 0.88%, 06/15/2026(d) | 16,590,000 | 15,511,650 | |
| Match Group Financeco 3, Inc., Conv., 2.00%, 01/15/2030(d) | 16,603,000 | 14,705,277 | |
| 30,216,927 | |||
| Application Software–0.69% | |||
| Dropbox, Inc., Conv., 0.00%, 03/01/2026(e) | 51,429,000 | 49,577,556 | |
| Envestnet, Inc., Conv., 2.63%, 12/01/2027 | 23,029,000 | 24,456,798 | |
| Salesforce, Inc., 2.70%, 07/15/2041 | 10,414,000 | 7,655,227 | |
| 3 | Invesco Equity and Income Fund |
| Principal Amount | Value | ||
| Application Software–(continued) | |||
| Workday, Inc., 3.50%, 04/01/2027(c) | $5,033,000 | $4,925,082 | |
| 86,614,663 | |||
| Asset Management & Custody Banks–0.29% | |||
| BlackRock, Inc., 4.75%, 05/25/2033 | 14,671,000 | 14,865,896 | |
| Blackstone Holdings Finance Co. LLC, 5.00%, 06/15/2044(d) | 3,975,000 | 3,783,432 | |
| Brookfield Corp. (Canada), 4.00%, 01/15/2025 | 4,515,000 | 4,490,938 | |
| KKR Group Finance Co. III LLC, 5.13%, 06/01/2044(d) | 3,217,000 | 3,023,773 | |
| KKR Group Finance Co. XII LLC, 4.85%, 05/17/2032(c)(d) | 11,051,000 | 10,949,154 | |
| 37,113,193 | |||
| Automobile Manufacturers–0.08% | |||
| General Motors Co., 6.60%, 04/01/2036 | 4,317,000 | 4,676,374 | |
| Honda Motor Co. Ltd. (Japan), 2.97%, 03/10/2032(c) | 5,448,000 | 4,927,084 | |
| 9,603,458 | |||
| Biotechnology–1.46% | |||
| AbbVie, Inc., | |||
| 4.50%, 05/14/2035 | 7,233,000 | 7,113,916 | |
| 4.05%, 11/21/2039 | 13,812,000 | 12,516,934 | |
| 4.85%, 06/15/2044 | 5,815,000 | 5,603,125 | |
| Alnylam Pharmaceuticals, Inc., Conv., 1.00%, 09/15/2027 | 35,337,000 | 40,478,534 | |
| Amgen, Inc., 5.25%, 03/02/2025 | 7,947,000 | 7,950,385 | |
| Gilead Sciences, Inc., 3.65%, 03/01/2026 | 22,756,000 | 22,459,300 | |
| Halozyme Therapeutics, Inc., Conv., 0.25%, 03/01/2027 | 49,785,000 | 51,940,690 | |
| Jazz Investments I Ltd., Conv., 2.00%, 06/15/2026 | 35,890,000 | 36,150,203 | |
| 184,213,087 | |||
| Brewers–0.24% | |||
| Anheuser-Busch Cos. LLC/Anheuser-Busch InBev Worldwide, Inc. (Belgium), | |||
| 4.70%, 02/01/2036 | 10,870,000 | 10,742,402 | |
| 4.90%, 02/01/2046 | 6,301,000 | 6,053,404 | |
| Heineken N.V. (Netherlands), 3.50%, 01/29/2028(d) | 9,734,000 | 9,489,359 | |
| Molson Coors Beverage Co., 4.20%, 07/15/2046 | 4,057,000 | 3,404,393 | |
| 29,689,558 | |||
| Broadcasting–0.03% | |||
| Discovery Communications LLC, 4.90%, 03/11/2026(c) | 3,773,000 | 3,752,277 | |
| Broadline Retail–0.08% | |||
| Amazon.com, Inc., 2.88%, 05/12/2041 | 13,606,000 | 10,572,049 | |
| Building Products–0.02% | |||
| Carrier Global Corp., 6.20%, 03/15/2054 | 2,216,000 | 2,514,643 | |
| Principal Amount | Value | ||
| Cable & Satellite–1.08% | |||
| Cable One, Inc., | |||
| Conv., 0.00%, 03/15/2026(e) | $51,123,000 | $46,521,930 | |
| 1.13%, 03/15/2028 | 26,544,000 | 20,407,027 | |
| Charter Communications Operating LLC/Charter Communications Operating Capital Corp., 4.91%, 07/23/2025 | 1,305,000 | 1,301,011 | |
| Comcast Corp., | |||
| 3.15%, 03/01/2026 | 11,319,000 | 11,109,900 | |
| 4.15%, 10/15/2028 | 9,915,000 | 9,845,739 | |
| 3.90%, 03/01/2038 | 8,010,000 | 7,103,703 | |
| 2.89%, 11/01/2051 | 3,128,000 | 2,049,331 | |
| 2.94%, 11/01/2056 | 4,539,000 | 2,889,705 | |
| Cox Communications, Inc., 2.95%, 10/01/2050(d) | 2,044,000 | 1,264,988 | |
| Liberty Broadband Corp., Conv., 3.13%, 04/06/2026(d)(f) | 33,219,000 | 33,288,760 | |
| 135,782,094 | |||
| Commercial & Residential Mortgage Finance–0.06% | |||
| Aviation Capital Group LLC, 4.88%, 10/01/2025(c)(d) | 7,745,000 | 7,708,381 | |
| Commodity Chemicals–0.04% | |||
| LYB Finance Co. B.V. (Netherlands), 8.10%, 03/15/2027(d) | 4,638,000 | 4,974,975 | |
| Communications Equipment–0.03% | |||
| Cisco Systems, Inc., 5.30%, 02/26/2054(c) | 3,481,000 | 3,596,441 | |
| Computer & Electronics Retail–0.06% | |||
| Dell International LLC/EMC Corp., | |||
| 6.02%, 06/15/2026 | 7,851,000 | 8,021,733 | |
| 8.35%, 07/15/2046 | 30,000 | 40,028 | |
| 8,061,761 | |||
| Consumer Finance–0.12% | |||
| American Express Co., 3.63%, 12/05/2024 | 3,423,000 | 3,406,308 | |
| General Motors Financial Co., Inc., 5.25%, 03/01/2026 | 5,467,000 | 5,493,066 | |
| Synchrony Financial, 3.95%, 12/01/2027(c) | 5,795,000 | 5,585,802 | |
| 14,485,176 | |||
| Consumer Staples Merchandise Retail–0.15% | |||
| Dollar General Corp., 4.25%, 09/20/2024 | 18,724,000 | 18,709,721 | |
| Diversified Banks–0.94% | |||
| Bank of America Corp., | |||
| 3.25%, 10/21/2027(c) | 5,705,000 | 5,532,773 | |
| 2.57%, 10/20/2032(g) | 8,683,000 | 7,513,701 | |
| Citigroup, Inc., | |||
| 3.67%, 07/24/2028(c)(g) | 5,405,000 | 5,271,243 | |
| 6.68%, 09/13/2043(c) | 8,000,000 | 9,159,259 | |
| 5.30%, 05/06/2044(c) | 2,765,000 | 2,718,637 | |
| 4.75%, 05/18/2046 | 4,145,000 | 3,750,908 | |
| 4 | Invesco Equity and Income Fund |
| Principal Amount | Value | ||
| Diversified Banks–(continued) | |||
| HSBC Holdings PLC (United Kingdom), 2.63%, 11/07/2025(g) | $18,945,000 | $18,846,974 | |
| JPMorgan Chase & Co., | |||
| 3.20%, 06/15/2026 | 4,365,000 | 4,271,009 | |
| 3.51%, 01/23/2029(g) | 11,170,000 | 10,813,810 | |
| 4.26%, 02/22/2048(c)(g) | 5,355,000 | 4,730,198 | |
| 3.90%, 01/23/2049(g) | 11,170,000 | 9,308,285 | |
| PNC Financial Services Group, Inc. (The), | |||
| 3.45%, 04/23/2029(c) | 7,450,000 | 7,160,410 | |
| 6.88%, 10/20/2034(g) | 6,126,000 | 6,901,289 | |
| U.S. Bancorp, Series W, 3.10%, 04/27/2026(c) | 3,245,000 | 3,166,299 | |
| Wells Fargo & Co., | |||
| 3.55%, 09/29/2025 | 6,840,000 | 6,756,185 | |
| 4.10%, 06/03/2026 | 4,515,000 | 4,473,095 | |
| 4.65%, 11/04/2044(c) | 9,115,000 | 8,136,768 | |
| 118,510,843 | |||
| Diversified Financial Services–0.03% | |||
| AerCap Ireland Capital DAC/AerCap Global Aviation Trust (Ireland), 3.85%, 10/29/2041 | 4,009,000 | 3,294,366 | |
| Diversified Metals & Mining–0.02% | |||
| Rio Tinto Finance (USA) Ltd. (Australia), 7.13%, 07/15/2028 | 2,175,000 | 2,383,689 | |
| Diversified REITs–0.07% | |||
| CubeSmart L.P., 2.50%, 02/15/2032(c) | 10,561,000 | 9,017,500 | |
| Drug Retail–0.06% | |||
| CVS Pass-Through Trust, 6.04%, 12/10/2028 | 3,637,855 | 3,684,512 | |
| Walgreens Boots Alliance, Inc., 4.50%, 11/18/2034(c) | 4,519,000 | 3,533,688 | |
| 7,218,200 | |||
| Electric Utilities–1.41% | |||
| Constellation Energy Generation LLC, 6.50%, 10/01/2053 | 2,992,000 | 3,317,907 | |
| Electricite de France S.A. (France), 4.88%, 01/22/2044(d) | 9,110,000 | 8,268,153 | |
| FirstEnergy Corp., Conv., 4.00%, 05/01/2026 | 54,373,000 | 56,742,609 | |
| Georgia Power Co., Series B, 3.70%, 01/30/2050 | 3,665,000 | 2,838,508 | |
| National Rural Utilities Cooperative Finance Corp., 2.75%, 04/15/2032(c) | 9,898,000 | 8,735,638 | |
| NextEra Energy Capital Holdings, Inc., | |||
| 5.75%, 09/01/2025 | 22,708,000 | 22,900,554 | |
| 3.55%, 05/01/2027 | 5,572,000 | 5,443,945 | |
| Oglethorpe Power Corp., 4.55%, 06/01/2044 | 5,806,000 | 4,963,646 | |
| PPL Capital Funding, Inc., Conv., 2.88%, 03/15/2028 | 54,663,000 | 56,753,860 | |
| Principal Amount | Value | ||
| Electric Utilities–(continued) | |||
| PPL Electric Utilities Corp., 6.25%, 05/15/2039 | $355,000 | $401,091 | |
| Xcel Energy, Inc., 3.50%, 12/01/2049(c) | 10,280,000 | 7,381,191 | |
| 177,747,102 | |||
| Electrical Components & Equipment–0.02% | |||
| Rockwell Automation, Inc., 1.75%, 08/15/2031 | 2,729,000 | 2,290,014 | |
| Financial Exchanges & Data–0.02% | |||
| Nasdaq, Inc., 5.95%, 08/15/2053(c) | 2,575,000 | 2,763,257 | |
| Food Distributors–0.08% | |||
| Sysco Corp., 3.75%, 10/01/2025 | 9,593,000 | 9,494,857 | |
| Health Care Equipment–0.54% | |||
| Becton, Dickinson and Co., 4.88%, 05/15/2044 | 3,739,000 | 3,379,672 | |
| Boston Scientific Corp., 1.90%, 06/01/2025 | 21,840,000 | 21,378,575 | |
| Integra LifeSciences Holdings Corp., Conv., 0.50%, 08/15/2025 | 42,831,000 | 40,528,834 | |
| Medtronic, Inc., 4.38%, 03/15/2035(c) | 2,601,000 | 2,548,463 | |
| 67,835,544 | |||
| Health Care REITs–0.18% | |||
| Welltower OP LLC, Conv., 2.75%, 05/15/2028(d) | 17,592,000 | 23,098,296 | |
| Health Care Services–0.09% | |||
| Cigna Group (The), 4.80%, 08/15/2038 | 3,240,000 | 3,108,431 | |
| NXP B.V./NXP Funding LLC (China), 5.35%, 03/01/2026 | 7,660,000 | 7,708,370 | |
| 10,816,801 | |||
| Health Care Supplies–0.34% | |||
| Haemonetics Corp., Conv., 2.50%, 06/01/2029(d) | 23,748,000 | 23,023,686 | |
| Merit Medical Systems, Inc., Conv., 3.00%, 02/01/2029(d) | 15,227,000 | 19,521,014 | |
| 42,544,700 | |||
| Home Improvement Retail–0.19% | |||
| Home Depot, Inc. (The), 5.13%, 04/30/2025 | 20,528,000 | 20,592,288 | |
| Lowe’s Cos., Inc., 4.25%, 04/01/2052(c) | 4,741,000 | 3,891,613 | |
| 24,483,901 | |||
| Homebuilding–0.02% | |||
| M.D.C. Holdings, Inc., 6.00%, 01/15/2043 | 2,117,000 | 2,225,283 | |
| Hotels, Resorts & Cruise Lines–0.48% | |||
| Airbnb, Inc., Conv., 0.00%, 03/15/2026(e) | 65,983,000 | 60,935,300 | |
| 5 | Invesco Equity and Income Fund |
| Principal Amount | Value | ||
| Industrial Conglomerates–0.13% | |||
| Honeywell International, Inc., 4.50%, 01/15/2034 | $16,007,000 | $15,899,118 | |
| Industrial Machinery & Supplies & Components–0.24% | |||
| John Bean Technologies Corp., Conv., 0.25%, 05/15/2026 | 33,206,000 | 30,536,238 | |
| Integrated Oil & Gas–0.35% | |||
| BP Capital Markets America, Inc., 2.94%, 06/04/2051 | 10,062,000 | 6,756,373 | |
| Chevron Corp., 2.95%, 05/16/2026 | 9,807,000 | 9,604,620 | |
| Exxon Mobil Corp., | |||
| 2.71%, 03/06/2025 | 5,658,000 | 5,595,740 | |
| 3.04%, 03/01/2026 | 11,316,000 | 11,118,645 | |
| Shell International Finance B.V., 3.25%, 05/11/2025(c) | 11,316,000 | 11,206,588 | |
| 44,281,966 | |||
| Integrated Telecommunication Services–0.31% | |||
| AT&T, Inc., | |||
| 4.30%, 02/15/2030 | 3,526,000 | 3,491,095 | |
| 3.55%, 09/15/2055 | 4,562,000 | 3,227,988 | |
| 3.80%, 12/01/2057 | 3,619,000 | 2,654,732 | |
| Orange S.A. (France), 9.00%, 03/01/2031 | 4,443,000 | 5,460,185 | |
| Telefonica Emisiones S.A. (Spain), 5.21%, 03/08/2047(c) | 6,725,000 | 6,214,692 | |
| Verizon Communications, Inc., | |||
| 4.78%, 02/15/2035(c)(d) | 13,111,000 | 12,933,335 | |
| 3.40%, 03/22/2041 | 5,788,000 | 4,616,078 | |
| 38,598,105 | |||
| Interactive Home Entertainment–0.03% | |||
| Take-Two Interactive Software, Inc., 3.70%, 04/14/2027(c) | 3,559,000 | 3,490,488 | |
| Interactive Media & Services–0.35% | |||
| Meta Platforms, Inc., 5.60%, 05/15/2053(c) | 14,968,000 | 15,788,338 | |
| Snap, Inc., Conv., 0.50%, 05/01/2030(d) | 34,614,000 | 28,193,103 | |
| 43,981,441 | |||
| Internet Services & Infrastructure–0.24% | |||
| Shopify, Inc. (Canada), Conv., 0.13%, 11/01/2025 | 31,379,000 | 29,904,187 | |
| Investment Banking & Brokerage–1.99% | |||
| Goldman Sachs Group, Inc. (The), | |||
| 4.25%, 10/21/2025 | 5,807,000 | 5,766,700 | |
| 2.91%, 07/21/2042(g) | 3,205,000 | 2,365,398 | |
| GS Finance Corp., | |||
| Series 0003, Conv., 0.50%, 04/11/2028(d) | 62,573,000 | 80,946,391 | |
| 0.00%, 07/19/2029(d)(e) | 62,330,000 | 83,408,113 | |
| 1.00%, 07/30/2029(d) | 62,338,000 | 71,076,979 | |
| Morgan Stanley, 4.00%, 07/23/2025 | 6,870,000 | 6,825,743 | |
| 250,389,324 | |||
| Life & Health Insurance–0.59% | |||
| American National Group, Inc., 5.00%, 06/15/2027(c) | 8,671,000 | 8,664,380 | |
| Principal Amount | Value | ||
| Life & Health Insurance–(continued) | |||
| Brighthouse Financial, Inc., 3.85%, 12/22/2051 | $18,342,000 | $12,058,495 | |
| Delaware Life Global Funding, Series 21-1, 2.66%, 06/29/2026(d) | 20,728,000 | 19,681,367 | |
| GA Global Funding Trust, 5.50%, 01/08/2029(d) | 12,448,000 | 12,777,023 | |
| Nationwide Financial Services, Inc., 5.30%, 11/18/2044(d) | 4,250,000 | 4,105,209 | |
| Pacific Life Global Funding II, 5.50%, 08/28/2026(d) | 13,319,000 | 13,572,694 | |
| Prudential Financial, Inc., 3.91%, 12/07/2047 | 4,898,000 | 3,952,036 | |
| 74,811,204 | |||
| Life Sciences Tools & Services–0.17% | |||
| Thermo Fisher Scientific, Inc., 1.22%, 10/18/2024 | 21,232,000 | 21,121,186 | |
| Managed Health Care–0.04% | |||
| UnitedHealth Group, Inc., 3.50%, 08/15/2039 | 5,806,000 | 4,880,166 | |
| Movies & Entertainment–0.45% | |||
| Liberty Media Corp.-Liberty Formula One, Conv., 2.25%, 08/15/2027 | 20,617,000 | 22,769,136 | |
| TWDC Enterprises 18 Corp., 3.00%, 02/13/2026(c) | 3,773,000 | 3,693,896 | |
| Warnermedia Holdings, Inc., | |||
| 3.79%, 03/15/2025 | 16,392,000 | 16,245,369 | |
| 5.05%, 03/15/2042 | 7,965,000 | 6,387,214 | |
| 5.14%, 03/15/2052(c) | 9,886,000 | 7,524,892 | |
| 56,620,507 | |||
| Multi-line Insurance–0.05% | |||
| Liberty Mutual Group, Inc., 3.95%, 05/15/2060(d) | 9,030,000 | 6,406,842 | |
| Multi-Utilities–0.08% | |||
| NiSource, Inc., 4.38%, 05/15/2047 | 6,015,000 | 5,137,289 | |
| Sempra, 3.80%, 02/01/2038 | 5,871,000 | 5,006,409 | |
| 10,143,698 | |||
| Oil & Gas Exploration & Production–0.31% | |||
| Cameron LNG LLC, 3.70%, 01/15/2039(d) | 6,519,000 | 5,534,574 | |
| ConocoPhillips Co., 4.15%, 11/15/2034 | 2,403,000 | 2,301,749 | |
| Diamondback Energy, Inc., 5.75%, 04/18/2054 | 5,160,000 | 5,165,730 | |
| Northern Oil and Gas, Inc., Conv., 3.63%, 04/15/2029 | 21,570,000 | 26,148,232 | |
| 39,150,285 | |||
| Oil & Gas Refining & Marketing–0.03% | |||
| Valero Energy Corp., 4.00%, 06/01/2052(c) | 5,068,000 | 3,874,446 | |
| 6 | Invesco Equity and Income Fund |
| Principal Amount | Value | ||
| Oil & Gas Storage & Transportation–0.53% | |||
| Energy Transfer L.P., | |||
| 6.40%, 12/01/2030(c) | $4,861,000 | $5,262,611 | |
| 4.90%, 03/15/2035 | 3,640,000 | 3,548,195 | |
| 5.30%, 04/01/2044 | 8,165,000 | 7,635,953 | |
| 5.00%, 05/15/2050 | 7,684,000 | 6,820,626 | |
| Enterprise Products Operating LLC, | |||
| 6.45%, 09/01/2040 | 555,000 | 621,301 | |
| 4.25%, 02/15/2048 | 7,354,000 | 6,259,761 | |
| Kinder Morgan, Inc., | |||
| 4.30%, 06/01/2025(c) | 9,053,000 | 9,000,498 | |
| 5.30%, 12/01/2034 | 4,203,000 | 4,230,028 | |
| MPLX L.P., 4.50%, 04/15/2038 | 8,564,000 | 7,820,980 | |
| Spectra Energy Partners L.P., 4.50%, 03/15/2045 | 5,468,000 | 4,688,876 | |
| Texas Eastern Transmission L.P., 7.00%, 07/15/2032 | 3,835,000 | 4,283,240 | |
| Williams Cos., Inc. (The), 5.40%, 03/02/2026 | 7,016,000 | 7,086,074 | |
| 67,258,143 | |||
| Other Specialized REITs–0.14% | |||
| EPR Properties, 4.75%, 12/15/2026(c) | 17,525,000 | 17,319,922 | |
| Packaged Foods & Meats–0.01% | |||
| Mead Johnson Nutrition Co. (United Kingdom), 4.13%, 11/15/2025(c) | 648,000 | 644,311 | |
| Paper & Plastic Packaging Products & Materials–0.02% | |||
| International Paper Co., 6.00%, 11/15/2041 | 2,855,000 | 3,055,587 | |
| Passenger Airlines–0.07% | |||
| American Airlines Pass-Through Trust, Series 2014-1, Class A, 3.70%, 04/01/2028 | 2,283,161 | 2,198,543 | |
| United Airlines Pass-Through Trust, | |||
| Series 2014-2, Class A, 3.75%, 09/03/2026 | 2,870,273 | 2,797,869 | |
| Series 2018-1, Class AA, 3.50%, 03/01/2030 | 3,883,972 | 3,627,540 | |
| 8,623,952 | |||
| Personal Care Products–0.06% | |||
| Kenvue, Inc., 5.05%, 03/22/2053(c) | 7,142,000 | 7,119,874 | |
| Pharmaceuticals–0.45% | |||
| Bayer US Finance II LLC (Germany), 4.38%, 12/15/2028(d) | 9,800,000 | 9,591,776 | |
| Bayer US Finance LLC (Germany), 6.88%, 11/21/2053(d) | 4,531,000 | 4,937,270 | |
| Bristol-Myers Squibb Co., | |||
| 4.13%, 06/15/2039 | 6,435,000 | 5,831,034 | |
| 6.25%, 11/15/2053 | 8,079,000 | 9,120,884 | |
| Haleon US Capital LLC, 4.00%, 03/24/2052(c) | 2,954,000 | 2,472,207 | |
| Zoetis, Inc., | |||
| 5.40%, 11/14/2025 | 21,016,000 | 21,170,363 | |
| 4.70%, 02/01/2043 | 4,101,000 | 3,813,911 | |
| 56,937,445 | |||
| Principal Amount | Value | ||
| Property & Casualty Insurance–0.14% | |||
| Allstate Corp. (The), 3.28%, 12/15/2026(c) | $3,260,000 | $3,180,315 | |
| Markel Group, Inc., | |||
| 5.00%, 03/30/2043 | 4,185,000 | 3,889,798 | |
| 5.00%, 05/20/2049 | 5,140,000 | 4,710,356 | |
| Travelers Cos., Inc. (The), 4.60%, 08/01/2043 | 6,455,000 | 6,058,939 | |
| 17,839,408 | |||
| Rail Transportation–0.22% | |||
| Canadian Pacific Railway Co. (Canada), 3.00%, 12/02/2041(c) | 3,965,000 | 2,963,444 | |
| Norfolk Southern Corp., | |||
| 3.40%, 11/01/2049(c) | 4,879,000 | 3,597,545 | |
| 5.35%, 08/01/2054(c) | 5,099,000 | 5,122,180 | |
| Union Pacific Corp., | |||
| 3.20%, 05/20/2041 | 10,131,000 | 8,007,779 | |
| 4.15%, 01/15/2045 | 4,410,000 | 3,714,519 | |
| 3.84%, 03/20/2060 | 5,560,000 | 4,312,431 | |
| 27,717,898 | |||
| Regional Banks–0.03% | |||
| Citizens Financial Group, Inc., 6.65%, 04/25/2035(c)(g) | 3,122,000 | 3,376,012 | |
| Reinsurance–0.06% | |||
| Global Atlantic (Fin) Co., 6.75%, 03/15/2054(d) | 2,423,000 | 2,483,204 | |
| PartnerRe Finance B LLC, 3.70%, 07/02/2029(c) | 5,795,000 | 5,575,399 | |
| 8,058,603 | |||
| Restaurants–0.06% | |||
| Starbucks Corp., 3.55%, 08/15/2029(c) | 7,440,000 | 7,187,242 | |
| Retail REITs–0.25% | |||
| Brixmor Operating Partnership L.P., 5.50%, 02/15/2034 | 10,029,000 | 10,150,020 | |
| Kimco Realty OP LLC, 3.20%, 04/01/2032(c) | 12,105,000 | 10,785,010 | |
| Regency Centers L.P., | |||
| 2.95%, 09/15/2029 | 7,960,000 | 7,376,943 | |
| 4.65%, 03/15/2049 | 2,970,000 | 2,604,030 | |
| 30,916,003 | |||
| Self-Storage REITs–0.07% | |||
| Extra Space Storage L.P., | |||
| 3.50%, 07/01/2026 | 4,667,000 | 4,578,670 | |
| 5.70%, 04/01/2028 | 3,806,000 | 3,930,975 | |
| 8,509,645 | |||
| Semiconductors–0.74% | |||
| Broadcom, Inc., 3.47%, 04/15/2034(c)(d) | 6,975,000 | 6,165,704 | |
| Marvell Technology, Inc., 2.45%, 04/15/2028 | 12,029,000 | 11,122,167 | |
| Microchip Technology, Inc., Conv., 0.75%, 06/01/2027(d)(f) | 68,263,000 | 67,460,910 | |
| 7 | Invesco Equity and Income Fund |
| Principal Amount | Value | ||
| Semiconductors–(continued) | |||
| Micron Technology, Inc., | |||
| 4.66%, 02/15/2030(c) | $7,270,000 | $7,259,347 | |
| 3.37%, 11/01/2041 | 1,778,000 | 1,338,283 | |
| 93,346,411 | |||
| Specialty Chemicals–0.01% | |||
| Sherwin-Williams Co. (The), 4.50%, 06/01/2047 | 1,665,000 | 1,477,751 | |
| Systems Software–0.10% | |||
| Microsoft Corp., 3.50%, 02/12/2035(c) | 4,259,000 | 4,015,800 | |
| Oracle Corp., 3.60%, 04/01/2040 | 10,910,000 | 8,792,284 | |
| 12,808,084 | |||
| Technology Distributors–0.06% | |||
| Avnet, Inc., 4.63%, 04/15/2026(c) | 7,645,000 | 7,602,566 | |
| Technology Hardware, Storage & Peripherals–0.03% | |||
| Apple, Inc., 3.35%, 02/09/2027(c) | 3,495,000 | 3,441,912 | |
| Telecom Tower REITs–0.16% | |||
| American Tower Corp., 1.60%, 04/15/2026 | 8,541,000 | 8,117,020 | |
| Crown Castle, Inc., | |||
| 2.50%, 07/15/2031(c) | 14,073,000 | 12,050,131 | |
| 4.75%, 05/15/2047(c) | 470,000 | 416,965 | |
| 20,584,116 | |||
| Tobacco–0.26% | |||
| Altria Group, Inc., 5.80%, 02/14/2039 | 12,541,000 | 12,939,627 | |
| Philip Morris International, Inc., | |||
| 3.25%, 11/10/2024(c) | 12,062,000 | 12,008,423 | |
| 4.88%, 11/15/2043 | 8,162,000 | 7,689,872 | |
| 32,637,922 | |||
| Trading Companies & Distributors–0.16% | |||
| Air Lease Corp., | |||
| 4.25%, 09/15/2024 | 4,355,000 | 4,350,627 | |
| 2.30%, 02/01/2025 | 16,070,000 | 15,860,786 | |
| 20,211,413 | |||
| Transaction & Payment Processing Services–0.74% | |||
| Block, Inc., Conv., 0.13%, 03/01/2025 | 45,518,000 | 44,436,948 | |
| Global Payments, Inc., Conv., 1.50%, 03/01/2031(d) | 48,873,000 | 48,506,452 | |
| 92,943,400 | |||
| Wireless Telecommunication Services–0.31% | |||
| America Movil S.A.B. de C.V. (Mexico), 4.38%, 07/16/2042(c) | 6,610,000 | 5,848,937 | |
| Rogers Communications, Inc. (Canada), | |||
| 4.50%, 03/15/2043 | 6,080,000 | 5,297,583 | |
| 4.30%, 02/15/2048 | 8,020,000 | 6,601,428 | |
| Principal Amount | Value | ||
| Wireless Telecommunication Services–(continued) | |||
| Sprint Spectrum Co. LLC/Sprint Spectrum Co. II LLC/Sprint Spectrum Co. III LLC, 4.74%, 03/20/2025(d) | $3,805,688 | $3,795,343 | |
| T-Mobile USA, Inc., | |||
| 2.70%, 03/15/2032 | 10,676,000 | 9,265,835 | |
| 3.40%, 10/15/2052 | 7,422,000 | 5,288,742 | |
| 6.00%, 06/15/2054 | 3,234,000 | 3,495,072 | |
| 39,592,940 | |||
| Total U.S. Dollar Denominated Bonds & Notes (Cost $2,525,357,821) | 2,485,631,929 | ||
| U.S. Treasury Securities–9.75% | |||
| U.S. Treasury Bills–0.03% | |||
| 5.27%, 09/05/2024(h)(i) | 1,800,000 | 1,798,967 | |
| 4.78%, 01/30/2025(h)(i) | 1,425,000 | 1,397,140 | |
| 3,196,107 | |||
| U.S. Treasury Bonds–0.78% | |||
| 4.50%, 02/15/2036 | 5,525,000 | 5,856,932 | |
| 4.13%, 08/15/2044 | 59,827,900 | 58,392,965 | |
| 4.63%, 05/15/2054 | 31,887,200 | 34,089,410 | |
| 98,339,307 | |||
| U.S. Treasury Notes–8.94% | |||
| 4.38%, 07/31/2026 | 312,913,000 | 315,284,292 | |
| 3.75%, 08/15/2027 | 227,929,000 | 227,688,606 | |
| 4.00%, 07/31/2029 | 318,991,900 | 322,804,848 | |
| 4.13%, 07/31/2031 | 207,598,000 | 211,522,900 | |
| 3.88%, 08/15/2034 | 47,713,300 | 47,545,558 | |
| 1,124,846,204 | |||
| Total U.S. Treasury Securities (Cost $1,215,662,896) | 1,226,381,618 | ||
| Shares | |||
| Preferred Stocks–0.54% | |||
| Asset Management & Custody Banks–0.21% | |||
| AMG Capital Trust II, 5.15%, Conv. Pfd. | 483,000 | 26,236,560 | |
| Oil & Gas Storage & Transportation–0.33% | |||
| El Paso Energy Capital Trust I, 4.75%, Conv. Pfd. | 875,900 | 41,780,430 | |
| Total Preferred Stocks (Cost $60,254,606) | 68,016,990 | ||
| Principal Amount | |||
| U.S. Government Sponsored Agency Mortgage-Backed Securities–0.12% | |||
| Federal Home Loan Mortgage Corp. (FHLMC)–0.06% | |||
| 6.50%, 05/01/2029 | $1 | 1 | |
| 6.75%, 03/15/2031 | 7,000,000 | 8,134,912 | |
| 5.50%, 02/01/2037 | 3 | 3 | |
| 8,134,916 | |||
| Federal National Mortgage Association (FNMA)–0.06% | |||
| 6.63%, 11/15/2030 | 6,315,000 | 7,243,655 | |
| 7.00%, 07/01/2032 | 3,613 | 3,750 | |
| 7,247,405 | |||
| 8 | Invesco Equity and Income Fund |
| Principal Amount | Value | ||
| Government National Mortgage Association (GNMA)–0.00% | |||
| 8.00%, 06/15/2026 to 01/20/2031 | $2,751 | $2,784 | |
| 7.50%, 12/20/2030 | 313 | 325 | |
| 3,109 | |||
| Total U.S. Government Sponsored Agency Mortgage-Backed Securities (Cost $17,459,921) | 15,385,430 | ||
| Municipal Obligations–0.04% | |||
| Georgia (State of) Municipal Electric Authority (Plant Vogtle Units 3 & 4), Series 2010 A, RB, 6.66%, 04/01/2057 (Cost $4,661,000) | 4,661,000 | 5,267,861 | |
| Shares | |||
| Money Market Funds–4.42% | |||
| Invesco Government & Agency Portfolio, Institutional Class, 5.18%(j)(k) | 196,520,873 | 196,520,873 | |
| Invesco Treasury Portfolio, Institutional Class, 5.15%(j)(k) | 359,919,889 | 359,919,889 | |
| Total Money Market Funds (Cost $556,440,762) | 556,440,762 | ||
| TOTAL INVESTMENTS IN SECURITIES (excluding investments purchased with cash collateral from securities on loan)-99.71% (Cost $9,955,965,748) | 12,543,904,587 | ||
| Shares | Value | ||
| Investments Purchased with Cash Collateral from Securities on Loan | |||
| Money Market Funds–1.92% | |||
| Invesco Private Government Fund, 5.28%(j)(k)(l) | 66,893,923 | $66,893,923 | |
| Invesco Private Prime Fund, 5.46%(j)(k)(l) | 174,519,322 | 174,589,130 | |
| Total Investments Purchased with Cash Collateral from Securities on Loan (Cost $241,476,832) | 241,483,053 | ||
| TOTAL INVESTMENTS IN SECURITIES–101.63% (Cost $10,197,442,580) | 12,785,387,640 | ||
| OTHER ASSETS LESS LIABILITIES—(1.63)% | (204,463,036) | ||
| NET ASSETS–100.00% | $12,580,924,604 | ||
| Conv. | – Convertible |
| Pfd. | – Preferred |
| RB | – Revenue Bonds |
| REIT | – Real Estate Investment Trust |
| (a) | Industry and/or sector classifications used in this report are generally according to the Global Industry Classification Standard, which was developed by and is the exclusive property and a service mark of MSCI Inc. and Standard & Poor’s. |
| (b) | Non-income producing security. |
| (c) | All or a portion of this security was out on loan at August 31, 2024. |
| (d) | Security purchased or received in a transaction exempt from registration under the Securities Act of 1933, as amended (the “1933 Act”). The security may be resold pursuant to an exemption from registration under the 1933 Act, typically to qualified institutional buyers. The aggregate value of these securities at August 31, 2024 was $663,382,382, which represented 5.27% of the Fund’s Net Assets. |
| (e) | Zero coupon bond issued at a discount. |
| (f) | Security has an irrevocable call by the issuer or mandatory put by the holder. Maturity date reflects such call or put. |
| (g) | Security issued at a fixed rate for a specific period of time, after which it will convert to a variable rate. |
| (h) | All or a portion of the value was pledged as collateral to cover margin requirements for open futures contracts. See Note 1L. |
| (i) | Security traded on a discount basis. The interest rate shown represents the discount rate at the time of purchase by the Fund. |
| (j) | Affiliated holding. Affiliated holdings are investments in entities which are under common ownership or control of Invesco Ltd. or are investments in entities in which the Fund owns 5% or more of the outstanding voting securities. The table below shows the Fund’s transactions in, and earnings from, its investments in affiliates for the fiscal year ended August 31, 2024. |
| Value August 31, 2023 | Purchases at Cost | Proceeds from Sales | Change in Unrealized Appreciation (Depreciation) | Realized Gain | Value August 31, 2024 | Dividend Income | |
| Investments in Affiliated Money Market Funds: | |||||||
| Invesco Government & Agency Portfolio, Institutional Class | $184,477,754 | $736,717,382 | $(724,674,263) | $- | $- | $196,520,873 | $11,296,466 |
| Invesco Liquid Assets Portfolio, Institutional Class | 126,706,527 | 514,234,908 | (640,957,283) | (61,596) | 77,444 | - | 7,155,621 |
| Invesco Treasury Portfolio, Institutional Class | 210,831,719 | 1,010,509,099 | (861,420,929) | - | - | 359,919,889 | 13,670,692 |
| 9 | Invesco Equity and Income Fund |
| Value August 31, 2023 | Purchases at Cost | Proceeds from Sales | Change in Unrealized Appreciation (Depreciation) | Realized Gain | Value August 31, 2024 | Dividend Income | |
| Investments Purchased with Cash Collateral from Securities on Loan: | |||||||
| Invesco Private Government Fund | $39,668,762 | $1,018,136,181 | $(990,911,020) | $- | $- | $66,893,923 | $2,419,901* |
| Invesco Private Prime Fund | 102,005,388 | 2,147,002,823 | (2,074,461,945) | 9,891 | 32,973 | 174,589,130 | 6,719,197* |
| Total | $663,690,150 | $5,426,600,393 | $(5,292,425,440) | $(51,705) | $110,417 | $797,923,815 | $41,261,877 |
| * | Represents the income earned on the investment of cash collateral, which is included in securities lending income on the Statement of Operations. Does not include rebates and fees paid to lending agent or premiums received from borrowers, if any. |
| (k) | The rate shown is the 7-day SEC standardized yield as of August 31, 2024. |
| (l) | The security has been segregated to satisfy the commitment to return the cash collateral received in securities lending transactions upon the borrower’s return of the securities loaned. See Note 1I. |
| Open Futures Contracts | |||||
| Short Futures Contracts | Number of Contracts | Expiration Month | Notional Value | Value | Unrealized Appreciation |
| Interest Rate Risk | |||||
| U.S. Treasury 5 Year Notes | 80 | December-2024 | $(8,751,875) | $26,713 | $26,713 |
| U.S. Treasury 10 Year Notes | 196 | December-2024 | (22,258,250) | 120,544 | 120,544 |
| U.S. Treasury 10 Year Ultra Notes | 296 | December-2024 | (34,761,500) | 262,983 | 262,983 |
| Total Futures Contracts | $410,240 | $410,240 | |||
| Open Forward Foreign Currency Contracts | ||||||
| Settlement Date | Counterparty | Contract to | Unrealized Appreciation (Depreciation) | |||
| Deliver | Receive | |||||
| Currency Risk | ||||||
| 09/06/2024 | State Street Bank & Trust Co. | CAD | 2,577,565 | USD | 1,916,816 | $3,984 |
| 09/06/2024 | State Street Bank & Trust Co. | EUR | 2,908,670 | USD | 3,238,267 | 22,727 |
| 09/06/2024 | State Street Bank & Trust Co. | USD | 7,647,288 | CAD | 10,498,401 | 143,658 |
| 09/06/2024 | State Street Bank & Trust Co. | USD | 3,166,078 | EUR | 2,908,671 | 49,464 |
| 09/06/2024 | State Street Bank & Trust Co. | USD | 5,090,991 | GBP | 3,959,747 | 109,477 |
| Subtotal—Appreciation | 329,310 | |||||
| Currency Risk | ||||||
| 09/06/2024 | Bank of New York Mellon (The) | CAD | 99,960,562 | USD | 72,466,960 | (1,714,568) |
| 09/06/2024 | State Street Bank & Trust Co. | CAD | 13,809,723 | USD | 10,055,857 | (192,448) |
| 09/06/2024 | State Street Bank & Trust Co. | EUR | 90,079,031 | USD | 98,037,322 | (1,545,214) |
| 09/06/2024 | State Street Bank & Trust Co. | GBP | 51,738,949 | USD | 66,549,467 | (1,401,022) |
| 09/06/2024 | State Street Bank & Trust Co. | USD | 1,899,422 | CAD | 2,558,749 | (554) |
| 09/06/2024 | State Street Bank & Trust Co. | USD | 852,144 | GBP | 646,847 | (2,618) |
| Subtotal—Depreciation | (4,856,424) | |||||
| Total Forward Foreign Currency Contracts | $(4,527,114) | |||||
| Abbreviations: | |
| CAD | —Canadian Dollar |
| EUR | —Euro |
| GBP | —British Pound Sterling |
| USD | —U.S. Dollar |
| 10 | Invesco Equity and Income Fund |
| Assets: | |
| Investments in unaffiliated securities, at value (Cost $9,399,524,986)* | $11,987,463,825 |
| Investments in affiliated money market funds, at value (Cost $797,917,594) | 797,923,815 |
| Other investments: | |
| Variation margin receivable — futures contracts | 206,990 |
| Unrealized appreciation on forward foreign currency contracts outstanding | 329,310 |
| Foreign currencies, at value (Cost $1,355) | 1,367 |
| Receivable for: | |
| Investments sold | 64,163,391 |
| Fund shares sold | 2,690,596 |
| Dividends | 21,057,973 |
| Interest | 25,438,030 |
| Investment for trustee deferred compensation and retirement plans | 1,237,789 |
| Other assets | 114,679 |
| Total assets | 12,900,627,765 |
| Liabilities: | |
| Other investments: | |
| Unrealized depreciation on forward foreign currency contracts outstanding | 4,856,424 |
| Payable for: | |
| Investments purchased | 59,487,913 |
| Fund shares reacquired | 6,322,964 |
| Collateral upon return of securities loaned | 241,476,832 |
| Accrued fees to affiliates | 5,827,694 |
| Accrued trustees’ and officers’ fees and benefits | 13,350 |
| Accrued other operating expenses | 395,310 |
| Trustee deferred compensation and retirement plans | 1,322,674 |
| Total liabilities | 319,703,161 |
| Net assets applicable to shares outstanding | $12,580,924,604 |
| Net assets consist of: | |
| Shares of beneficial interest | $9,538,092,439 |
| Distributable earnings | 3,042,832,165 |
| $12,580,924,604 |
| Net Assets: | |
| Class A | $10,359,368,491 |
| Class C | $200,569,238 |
| Class R | $123,727,101 |
| Class Y | $731,530,799 |
| Class R5 | $208,167,628 |
| Class R6 | $957,561,347 |
| Shares outstanding, no par value, with an unlimited number of shares authorized: | |
| Class A | 938,016,439 |
| Class C | 18,634,773 |
| Class R | 11,115,714 |
| Class Y | 66,238,595 |
| Class R5 | 18,845,647 |
| Class R6 | 86,720,070 |
| Class A: | |
| Net asset value per share | $11.04 |
| Maximum offering price per share (Net asset value of $11.04 ÷ 94.50%) | $11.68 |
| Class C: | |
| Net asset value and offering price per share | $10.76 |
| Class R: | |
| Net asset value and offering price per share | $11.13 |
| Class Y: | |
| Net asset value and offering price per share | $11.04 |
| Class R5: | |
| Net asset value and offering price per share | $11.05 |
| Class R6: | |
| Net asset value and offering price per share | $11.04 |
| * | At August 31, 2024, securities with an aggregate value of $231,666,024 were on loan to brokers. |
| 11 | Invesco Equity and Income Fund |
| Investment income: | |
| Interest | $132,223,549 |
| Dividends (net of foreign withholding taxes of $821,723) | 167,398,390 |
| Dividends from affiliated money market funds (includes net securities lending income of $284,991) | 32,407,770 |
| Total investment income | 332,029,709 |
| Expenses: | |
| Advisory fees | 42,267,839 |
| Administrative services fees | 1,721,654 |
| Custodian fees | 74,247 |
| Distribution fees: | |
| Class A | 24,534,678 |
| Class C | 2,104,492 |
| Class R | 563,555 |
| Transfer agent fees — A, C, R and Y | 15,700,849 |
| Transfer agent fees — R5 | 205,608 |
| Transfer agent fees — R6 | 275,283 |
| Trustees’ and officers’ fees and benefits | 131,152 |
| Registration and filing fees | 229,136 |
| Reports to shareholders | 1,937,534 |
| Professional services fees | 173,268 |
| Other | 227,100 |
| Total expenses | 90,146,395 |
| Less: Fees waived and/or expense offset arrangement(s) | (755,133) |
| Net expenses | 89,391,262 |
| Net investment income | 242,638,447 |
| Realized and unrealized gain (loss) from: | |
| Net realized gain (loss) from: | |
| Unaffiliated investment securities | 639,404,252 |
| Affiliated investment securities | 110,417 |
| Foreign currencies | 140,303 |
| Forward foreign currency contracts | 5,348,404 |
| Futures contracts | (1,512,310) |
| 643,491,066 | |
| Change in net unrealized appreciation (depreciation) of: | |
| Unaffiliated investment securities | 1,013,247,985 |
| Affiliated investment securities | (51,705) |
| Foreign currencies | 17,692 |
| Forward foreign currency contracts | (5,517,666) |
| Futures contracts | 1,358,958 |
| 1,009,055,264 | |
| Net realized and unrealized gain | 1,652,546,330 |
| Net increase in net assets resulting from operations | $1,895,184,777 |
| 12 | Invesco Equity and Income Fund |
| 2024 | 2023 | |
| Operations: | ||
| Net investment income | $242,638,447 | $236,786,259 |
| Net realized gain | 643,491,066 | 516,790,517 |
| Change in net unrealized appreciation (depreciation) | 1,009,055,264 | (157,636,098) |
| Net increase in net assets resulting from operations | 1,895,184,777 | 595,940,678 |
| Distributions to shareholders from distributable earnings: | ||
| Class A | (652,576,382) | (636,317,908) |
| Class C | (13,268,232) | (15,955,994) |
| Class R | (6,997,102) | (6,375,594) |
| Class Y | (49,081,574) | (50,369,784) |
| Class R5 | (14,404,901) | (14,865,104) |
| Class R6 | (64,165,301) | (59,659,126) |
| Total distributions from distributable earnings | (800,493,492) | (783,543,510) |
| Share transactions–net: | ||
| Class A | (105,318,528) | 61,650,542 |
| Class C | (48,214,079) | (39,351,727) |
| Class R | 9,806,792 | 7,760,427 |
| Class Y | (37,999,287) | 15,704,564 |
| Class R5 | (11,737,453) | (12,905,500) |
| Class R6 | (21,470,462) | 63,488,724 |
| Net increase (decrease) in net assets resulting from share transactions | (214,933,017) | 96,347,030 |
| Net increase (decrease) in net assets | 879,758,268 | (91,255,802) |
| Net assets: | ||
| Beginning of year | 11,701,166,336 | 11,792,422,138 |
| End of year | $12,580,924,604 | $11,701,166,336 |
| 13 | Invesco Equity and Income Fund |
| Net asset value, beginning of period | Net investment income(a) | Net gains (losses) on securities (both realized and unrealized) | Total from investment operations | Dividends from net investment income | Distributions from net realized gains | Total distributions | Net asset value, end of period | Total return(b) | Net assets, end of period (000’s omitted) | Ratio of expenses to average net assets with fee waivers and/or expenses absorbed | Ratio of expenses to average net assets without fee waivers and/or expenses absorbed | Ratio of net investment income to average net assets | Portfolio turnover (c) | |
| Class A | ||||||||||||||
| Year ended 08/31/24 | $10.11 | $0.21 | $1.41 | $1.62 | $(0.20) | $(0.49) | $(0.69) | $11.04 | 16.93% | $10,359,368 | 0.77% | 0.78% | 2.00% | 139% |
| Year ended 08/31/23 | 10.27 | 0.20 | 0.33 | 0.53 | (0.22) | (0.47) | (0.69) | 10.11 | 5.26 | 9,563,997 | 0.77 | 0.78 | 1.99 | 142 |
| Year ended 08/31/22 | 12.52 | 0.14 | (0.83) | (0.69) | (0.16) | (1.40) | (1.56) | 10.27 | (6.36) | 9,654,157 | 0.78 | 0.78 | 1.25 | 152 |
| Year ended 08/31/21 | 9.83 | 0.13 | 2.87 | 3.00 | (0.17) | (0.14) | (0.31) | 12.52 | 31.02 | 10,841,867 | 0.78 | 0.78 | 1.10 | 127 |
| Year ended 08/31/20 | 10.12 | 0.17 | 0.18 | 0.35 | (0.19) | (0.45) | (0.64) | 9.83 | 3.53 | 9,034,006 | 0.78 | 0.79 | 1.75 | 133 |
| Class C | ||||||||||||||
| Year ended 08/31/24 | 9.86 | 0.13 | 1.38 | 1.51 | (0.12) | (0.49) | (0.61) | 10.76 | 16.13(d) | 200,569 | 1.51(d) | 1.52(d) | 1.26(d) | 139 |
| Year ended 08/31/23 | 10.03 | 0.12 | 0.32 | 0.44 | (0.14) | (0.47) | (0.61) | 9.86 | 4.43(d) | 230,928 | 1.50(d) | 1.51(d) | 1.26(d) | 142 |
| Year ended 08/31/22 | 12.25 | 0.06 | (0.81) | (0.75) | (0.07) | (1.40) | (1.47) | 10.03 | (7.01) | 275,540 | 1.53 | 1.53 | 0.50 | 152 |
| Year ended 08/31/21 | 9.63 | 0.04 | 2.81 | 2.85 | (0.09) | (0.14) | (0.23) | 12.25 | 29.94 | 362,829 | 1.53 | 1.53 | 0.35 | 127 |
| Year ended 08/31/20 | 9.91 | 0.10 | 0.19 | 0.29 | (0.12) | (0.45) | (0.57) | 9.63 | 2.87 | 402,761 | 1.53 | 1.54 | 1.00 | 133 |
| Class R | ||||||||||||||
| Year ended 08/31/24 | 10.18 | 0.18 | 1.44 | 1.62 | (0.18) | (0.49) | (0.67) | 11.13 | 16.74 | 123,727 | 1.02 | 1.03 | 1.75 | 139 |
| Year ended 08/31/23 | 10.35 | 0.18 | 0.31 | 0.49 | (0.19) | (0.47) | (0.66) | 10.18 | 4.87 | 103,247 | 1.02 | 1.03 | 1.74 | 142 |
| Year ended 08/31/22 | 12.59 | 0.11 | (0.82) | (0.71) | (0.13) | (1.40) | (1.53) | 10.35 | (6.48) | 96,887 | 1.03 | 1.03 | 1.00 | 152 |
| Year ended 08/31/21 | 9.89 | 0.10 | 2.88 | 2.98 | (0.14) | (0.14) | (0.28) | 12.59 | 30.61 | 114,169 | 1.03 | 1.03 | 0.85 | 127 |
| Year ended 08/31/20 | 10.17 | 0.15 | 0.19 | 0.34 | (0.17) | (0.45) | (0.62) | 9.89 | 3.35 | 118,249 | 1.03 | 1.04 | 1.50 | 133 |
| Class Y | ||||||||||||||
| Year ended 08/31/24 | 10.11 | 0.23 | 1.42 | 1.65 | (0.23) | (0.49) | (0.72) | 11.04 | 17.23 | 731,531 | 0.52 | 0.53 | 2.25 | 139 |
| Year ended 08/31/23 | 10.27 | 0.22 | 0.33 | 0.55 | (0.24) | (0.47) | (0.71) | 10.11 | 5.54 | 706,187 | 0.52 | 0.53 | 2.24 | 142 |
| Year ended 08/31/22 | 12.52 | 0.17 | (0.83) | (0.66) | (0.19) | (1.40) | (1.59) | 10.27 | (6.12) | 702,847 | 0.53 | 0.53 | 1.50 | 152 |
| Year ended 08/31/21 | 9.84 | 0.15 | 2.87 | 3.02 | (0.20) | (0.14) | (0.34) | 12.52 | 31.22 | 778,769 | 0.53 | 0.53 | 1.35 | 127 |
| Year ended 08/31/20 | 10.12 | 0.19 | 0.20 | 0.39 | (0.22) | (0.45) | (0.67) | 9.84 | 3.91 | 749,507 | 0.53 | 0.54 | 2.00 | 133 |
| Class R5 | ||||||||||||||
| Year ended 08/31/24 | 10.11 | 0.24 | 1.42 | 1.66 | (0.23) | (0.49) | (0.72) | 11.05 | 17.39 | 208,168 | 0.48 | 0.49 | 2.29 | 139 |
| Year ended 08/31/23 | 10.28 | 0.23 | 0.32 | 0.55 | (0.25) | (0.47) | (0.72) | 10.11 | 5.48 | 201,310 | 0.47 | 0.48 | 2.29 | 142 |
| Year ended 08/31/22 | 12.52 | 0.18 | (0.82) | (0.64) | (0.20) | (1.40) | (1.60) | 10.28 | (5.98) | 218,033 | 0.48 | 0.48 | 1.55 | 152 |
| Year ended 08/31/21 | 9.84 | 0.16 | 2.86 | 3.02 | (0.20) | (0.14) | (0.34) | 12.52 | 31.28 | 242,934 | 0.46 | 0.46 | 1.42 | 127 |
| Year ended 08/31/20 | 10.12 | 0.20 | 0.19 | 0.39 | (0.22) | (0.45) | (0.67) | 9.84 | 3.98 | 235,461 | 0.47 | 0.48 | 2.06 | 133 |
| Class R6 | ||||||||||||||
| Year ended 08/31/24 | 10.10 | 0.24 | 1.43 | 1.67 | (0.24) | (0.49) | (0.73) | 11.04 | 17.48 | 957,561 | 0.41 | 0.42 | 2.36 | 139 |
| Year ended 08/31/23 | 10.27 | 0.24 | 0.31 | 0.55 | (0.25) | (0.47) | (0.72) | 10.10 | 5.56 | 895,499 | 0.40 | 0.41 | 2.36 | 142 |
| Year ended 08/31/22 | 12.52 | 0.18 | (0.83) | (0.65) | (0.20) | (1.40) | (1.60) | 10.27 | (6.01) | 844,958 | 0.41 | 0.41 | 1.62 | 152 |
| Year ended 08/31/21 | 9.83 | 0.17 | 2.87 | 3.04 | (0.21) | (0.14) | (0.35) | 12.52 | 31.50 | 913,379 | 0.39 | 0.39 | 1.49 | 127 |
| Year ended 08/31/20 | 10.12 | 0.21 | 0.18 | 0.39 | (0.23) | (0.45) | (0.68) | 9.83 | 3.97 | 1,001,337 | 0.38 | 0.39 | 2.15 | 133 |
| (a) | Calculated using average shares outstanding. |
| (b) | Includes adjustments in accordance with accounting principles generally accepted in the United States of America and as such, the net asset value for financial reporting purposes and the returns based upon those net asset values may differ from the net asset value and returns for shareholder transactions. Does not include sales charges and is not annualized for periods less than one year, if applicable. |
| (c) | Portfolio turnover is calculated at the fund level and is not annualized for periods less than one year, if applicable. |
| (d) | The total return, ratios of expenses to average net assets and ratio of net investment income to average net assets reflect actual 12b-1 fees of 0.99% and 0.98% for the years ended August 31, 2024 and August 31, 2023, respectively. |
| 14 | Invesco Equity and Income Fund |
| A. | Security Valuations – Securities, including restricted securities, are valued according to the following policy. |
| 15 | Invesco Equity and Income Fund |
| B. | Securities Transactions and Investment Income – Securities transactions are accounted for on a trade date basis. Realized gains or losses on sales are computed on the basis of specific identification of the securities sold. Interest income (net of withholding tax, if any) is recorded on an accrual basis from settlement date and includes coupon interest and amortization of premium and accretion of discount on debt securities as applicable. Pay-in-kind interest income and non-cash dividend income received in the form of securities in lieu of cash are recorded at the fair value of the securities received. Paydown gains and losses on mortgage and asset-backed securities are recorded as adjustments to interest income. Dividend income (net of withholding tax, if any) is recorded on the ex-dividend date. |
| C. | Country Determination — For the purposes of making investment selection decisions and presentation in the Schedule of Investments, the investment adviser may determine the country in which an issuer is located and/or credit risk exposure based on various factors. These factors include the laws of the country under which the issuer is organized, where the issuer maintains a principal office, the country in which the issuer derives 50% or more of its total revenues, the country that has the primary market for the issuer’s securities and its "country of risk" as determined by a third party service provider, as well as other criteria. Among the other criteria that may be evaluated for making this determination are the country in which the issuer maintains 50% or more of its assets, the type of security, financial guarantees and enhancements, the nature of the collateral and the sponsor organization. Country of issuer and/or credit risk exposure has been determined to be the United States of America, unless otherwise noted. |
| D. | Distributions - Distributions from net investment income, if any, are declared and paid quarterly and are recorded on the ex-dividend date. Distributions from net realized capital gain, if any, are generally declared and paid annually and recorded on the ex-dividend date. The Fund may elect to treat a portion of the proceeds from redemptions as distributions for federal income tax purposes. |
| E. | Federal Income Taxes – The Fund intends to comply with the requirements of Subchapter M of the Internal Revenue Code of 1986, as amended (the “Internal Revenue Code”), necessary to qualify as a regulated investment company and to distribute substantially all of the Fund’s taxable earnings to shareholders. As such, the Fund will not be subject to federal income taxes on otherwise taxable income (including net realized capital gain) that is distributed to shareholders. Therefore, no provision for federal income taxes is recorded in the financial statements. |
| F. | Expenses – Fees provided for under the Rule 12b-1 plan of a particular class of the Fund are charged to the operations of such class. Transfer agency fees and expenses and other shareholder recordkeeping fees and expenses attributable to Class R5 and Class R6 are allocated based on relative net assets of Class R5 and Class R6. Sub-accounting fees attributable to Class R5 are charged to the operations of the class. Transfer agency fees and expenses and other shareholder recordkeeping fees and expenses relating to all other classes are allocated among those classes based on relative net assets. All other expenses are allocated among the classes based on relative net assets. |
| G. | Accounting Estimates – The preparation of financial statements in conformity with accounting principles generally accepted in the United States of America (“GAAP”) requires management to make estimates and assumptions that affect the reported amounts of assets and liabilities at the date of the financial statements and the reported amounts of revenues and expenses during the reporting period including estimates and assumptions related to taxation. Actual results could differ from those estimates by a significant amount. In addition, the Fund monitors for material events or transactions that may occur or become known after the period-end date and before the date the financial statements are released to print. |
| H. | Indemnifications – Under the Trust’s organizational documents, each Trustee, officer, employee or other agent of the Trust is indemnified against certain liabilities that may arise out of the performance of their duties to the Fund. Additionally, in the normal course of business, the Fund enters into contracts, including the Fund’s servicing agreements, that contain a variety of indemnification clauses. The Fund’s maximum exposure under these arrangements is unknown as this would involve future claims that may be made against the Fund that have not yet occurred. The risk of material loss as a result of such indemnification claims is considered remote. |
| I. | Securities Lending – The Fund may lend portfolio securities having a market value up to one-third of the Fund’s total assets. Such loans are secured by collateral equal to no less than the market value of the loaned securities determined daily by the securities lending provider. Such collateral will be cash or debt securities issued or guaranteed by the U.S. Government or any of its sponsored agencies. Cash collateral received in connection with these loans is invested in short-term money market instruments or affiliated, unregistered investment companies that comply with Rule 2a-7 under the 1940 Act and money market funds (collectively, "affiliated money market funds") and is shown as such on the Schedule of Investments. The Fund bears the risk of loss with respect to the investment of collateral. It is the Fund’s policy to obtain additional collateral from or return excess collateral to the borrower by the end of the next business day, following the valuation date of the securities loaned. Therefore, the value of the collateral held may be temporarily less than the value of the securities on loan. When loaning securities, the Fund retains certain benefits of owning the securities, including the economic equivalent of dividends or interest generated by the security. Lending securities entails a risk of loss to the Fund if, and to the extent that, the market value of the securities loaned were to increase and the borrower did not |
| 16 | Invesco Equity and Income Fund |
| increase the collateral accordingly, and the borrower failed to return the securities. The securities loaned are subject to termination at the option of the borrower or the Fund. Upon termination, the borrower will return to the Fund the securities loaned and the Fund will return the collateral. Upon the failure of the borrower to return the securities, collateral may be liquidated and the securities may be purchased on the open market to replace the loaned securities. The Fund could experience delays and costs in gaining access to the collateral and the securities may lose value during the delay which could result in potential losses to the Fund. Some of these losses may be indemnified by the lending agent. The Fund bears the risk of any deficiency in the amount of the collateral available for return to the borrower due to any loss on the collateral invested. Dividends received on cash collateral investments for securities lending transactions, which are net of compensation to counterparties, are included in Dividends from affiliated money market funds on the Statement of Operations. The aggregate value of securities out on loan, if any, is shown as a footnote on the Statement of Assets and Liabilities. |
| J. | Foreign Currency Translations — Foreign currency is valued at the close of the NYSE based on quotations posted by banks and major currency dealers. Portfolio securities and other assets and liabilities denominated in foreign currencies are translated into U.S. dollar amounts at the date of valuation. Purchases and sales of portfolio securities (net of foreign taxes withheld on disposition) and income items denominated in foreign currencies are translated into U.S. dollar amounts on the respective dates of such transactions. The Fund does not separately account for the portion of the results of operations resulting from changes in foreign exchange rates on investments and the fluctuations arising from changes in market prices of securities held. The combined results of changes in foreign exchange rates and the fluctuation of market prices on investments (net of estimated foreign tax withholding) are included with the net realized and unrealized gain or loss from investments in the Statement of Operations. Reported net realized foreign currency gains or losses arise from (1) sales of foreign currencies, (2) currency gains or losses realized between the trade and settlement dates on securities transactions, and (3) the difference between the amounts of dividends, interest, and foreign withholding taxes recorded on the Fund’s books and the U.S. dollar equivalent of the amounts actually received or paid. Net unrealized foreign currency gains and losses arise from changes in the fair values of assets and liabilities, other than investments in securities at fiscal period end, resulting from changes in exchange rates. |
| K. | Forward Foreign Currency Contracts — The Fund may engage in foreign currency transactions either on a spot (i.e. for prompt delivery and settlement) basis, or through forward foreign currency contracts, to manage or minimize currency or exchange rate risk. |
| L. | Futures Contracts — The Fund may enter into futures contracts to manage exposure to interest rate, equity and market price movements and/or currency risks. A futures contract is an agreement between Counterparties to purchase or sell a specified underlying security, currency or commodity (or delivery of a cash settlement price, in the case of an index future) for a fixed price at a future date. The Fund currently invests only in exchange-traded futures and they are standardized as to maturity date and underlying instrument or asset. Initial margin deposits required upon entering into futures contracts are satisfied by the segregation of specific securities or cash as collateral at the futures commission merchant (broker). During the period the futures contracts are open, changes in the value of the contracts are recognized as unrealized gains or losses by recalculating the value of the contracts on a daily basis. Subsequent or variation margin payments are received or made depending upon whether unrealized gains or losses are incurred. These amounts are reflected as receivables or payables on the Statement of Assets and Liabilities. When the contracts are closed or expire, the Fund recognizes a realized gain or loss equal to the difference between the proceeds from, or cost of, the closing transaction and the Fund’s basis in the contract. The net realized gain (loss) and the change in unrealized gain (loss) on futures contracts held during the period is included on the Statement of Operations. The primary risks associated with futures contracts are market risk and the absence of a liquid secondary market. If the Fund were unable to liquidate a futures contract and/or enter into an offsetting closing transaction, the Fund would continue to be subject to market risk with respect to the value of the contracts and continue to be required to maintain the margin deposits on the futures contracts. Futures contracts have minimal Counterparty risk since the exchange’s clearinghouse, as Counterparty to all exchange-traded futures, guarantees the futures against default. Risks may exceed amounts recognized in the Statement of Assets and Liabilities. |
| M. | Leverage Risk — Leverage exists when the Fund can lose more than it originally invests because it purchases or sells an instrument or enters into a transaction without investing an amount equal to the full economic exposure of the instrument or transaction. |
| N. | Collateral —To the extent the Fund has designated or segregated a security as collateral and that security is subsequently sold, it is the Fund’s practice to replace such collateral no later than the next business day. This practice does not apply to securities pledged as collateral for securities lending transactions. |
| O. | Other Risks - Active trading of portfolio securities may result in added expenses, a lower return and increased tax liability. |
| 17 | Invesco Equity and Income Fund |
| Average Daily Net Assets | Rate |
| First $150 million | 0.500% |
| Next $100 million | 0.450% |
| Next $100 million | 0.400% |
| Over $350 million | 0.350% |
| 18 | Invesco Equity and Income Fund |
| Level 1 | Level 2 | Level 3 | Total | |
| Investments in Securities | ||||
| Common Stocks & Other Equity Interests | $7,969,838,072 | $216,941,925 | $— | $8,186,779,997 |
| U.S. Dollar Denominated Bonds & Notes | — | 2,485,631,929 | — | 2,485,631,929 |
| U.S. Treasury Securities | — | 1,226,381,618 | — | 1,226,381,618 |
| Preferred Stocks | 68,016,990 | — | — | 68,016,990 |
| U.S. Government Sponsored Agency Mortgage-Backed Securities | — | 15,385,430 | — | 15,385,430 |
| Municipal Obligations | — | 5,267,861 | — | 5,267,861 |
| Money Market Funds | 556,440,762 | 241,483,053 | — | 797,923,815 |
| Total Investments in Securities | 8,594,295,824 | 4,191,091,816 | — | 12,785,387,640 |
| Other Investments - Assets* | ||||
| Futures Contracts | 410,240 | — | — | 410,240 |
| Forward Foreign Currency Contracts | — | 329,310 | — | 329,310 |
| 410,240 | 329,310 | — | 739,550 | |
| Other Investments - Liabilities* | ||||
| Forward Foreign Currency Contracts | — | (4,856,424) | — | (4,856,424) |
| Total Other Investments | 410,240 | (4,527,114) | — | (4,116,874) |
| Total Investments | $8,594,706,064 | $4,186,564,702 | $— | $12,781,270,766 |
| * | Unrealized appreciation (depreciation). |
| Value | |||
| Derivative Assets | Currency Risk | Interest Rate Risk | Total |
| Unrealized appreciation on futures contracts —Exchange-Traded(a) | $— | $410,240 | $410,240 |
| Unrealized appreciation on forward foreign currency contracts outstanding | 329,310 | — | 329,310 |
| Total Derivative Assets | 329,310 | 410,240 | 739,550 |
| Derivatives not subject to master netting agreements | — | (410,240) | (410,240) |
| Total Derivative Assets subject to master netting agreements | $329,310 | $— | $329,310 |
| Value | |
| Derivative Liabilities | Currency Risk |
| Unrealized depreciation on forward foreign currency contracts outstanding | $(4,856,424) |
| Derivatives not subject to master netting agreements | — |
| Total Derivative Liabilities subject to master netting agreements | $(4,856,424) |
| (a) | The daily variation margin receivable (payable) at period-end is recorded in the Statement of Assets and Liabilities. |
| 19 | Invesco Equity and Income Fund |
| Financial Derivative Assets | Financial Derivative Liabilities | Collateral (Received)/Pledged | |||||
| Counterparty | Forward Foreign Currency Contracts | Forward Foreign Currency Contracts | Net Value of Derivatives | Non-Cash | Cash | Net Amount | |
| Bank of New York Mellon (The) | $− | $(1,714,568) | $(1,714,568) | $— | $— | $(1,714,568) | |
| State Street Bank & Trust Co. | 329,310 | (3,141,856) | (2,812,546) | — | — | (2,812,546) | |
| Total | $329,310 | $(4,856,424) | $(4,527,114) | $— | $— | $(4,527,114) | |
| Location of Gain (Loss) on Statement of Operations | |||
| Currency Risk | Interest Rate Risk | Total | |
| Realized Gain (Loss): | |||
| Forward foreign currency contracts | $5,348,404 | $- | $5,348,404 |
| Futures contracts | - | (1,512,310) | (1,512,310) |
| Change in Net Unrealized Appreciation (Depreciation): | |||
| Forward foreign currency contracts | (5,517,666) | - | (5,517,666) |
| Futures contracts | - | 1,358,958 | 1,358,958 |
| Total | $(169,262) | $(153,352) | $(322,614) |
| Forward Foreign Currency Contracts | Futures Contracts | |
| Average notional value | $627,272,864 | $67,793,427 |
| Tax Character of Distributions to Shareholders Paid During the Fiscal Years Ended August 31, 2024 and 2023: | ||
| 2024 | 2023 | |
| Ordinary income* | $238,588,313 | $253,597,806 |
| Long-term capital gain | 561,905,179 | 529,945,704 |
| Total distributions | $800,493,492 | $783,543,510 |
| * | Includes short-term capital gain distributions, if any. |
| 20 | Invesco Equity and Income Fund |
| Tax Components of Net Assets at Period-End: | |
| 2024 | |
| Undistributed ordinary income | $92,248,270 |
| Undistributed long-term capital gain | 449,196,209 |
| Net unrealized appreciation — investments | 2,502,137,882 |
| Net unrealized appreciation — foreign currencies | 39,160 |
| Temporary book/tax differences | (789,356) |
| Shares of beneficial interest | 9,538,092,439 |
| Total net assets | $12,580,924,604 |
| Unrealized Appreciation (Depreciation) of Investments on a Tax Basis | |
| Aggregate unrealized appreciation of investments | $2,753,334,791 |
| Aggregate unrealized (depreciation) of investments | (251,196,909) |
| Net unrealized appreciation of investments | $2,502,137,882 |
| Summary of Share Activity | |||||
| Year ended August 31, 2024(a) | Year ended August 31, 2023 | ||||
| Shares | Amount | Shares | Amount | ||
| Sold: | |||||
| Class A | 59,038,389 | $608,530,045 | 69,900,060 | $701,533,346 | |
| Class C | 2,297,221 | 23,119,429 | 3,088,954 | 30,306,026 | |
| Class R | 2,361,594 | 24,519,467 | 2,677,098 | 27,058,482 | |
| Class Y | 10,597,765 | 109,348,855 | 17,421,501 | 174,851,176 | |
| Class R5 | 1,248,965 | 12,891,281 | 1,871,792 | 18,765,212 | |
| Class R6 | 11,923,160 | 122,871,786 | 17,191,072 | 172,216,566 | |
| Issued as reinvestment of dividends: | |||||
| Class A | 62,947,600 | 628,152,650 | 59,396,151 | 591,080,593 | |
| Class C | 1,310,211 | 12,713,774 | 1,530,995 | 14,912,252 | |
| Class R | 694,023 | 6,981,473 | 634,222 | 6,363,235 | |
| Class Y | 4,145,562 | 41,344,542 | 4,083,765 | 40,588,620 | |
| Class R5 | 1,442,590 | 14,404,887 | 1,495,679 | 14,865,104 | |
| Class R6 | 6,343,445 | 63,332,081 | 5,839,481 | 58,009,168 | |
| Automatic conversion of Class C shares to Class A shares: | |||||
| Class A | 3,440,654 | 35,411,295 | 3,791,352 | 37,881,665 | |
| Class C | (3,528,247) | (35,411,295) | (3,881,540) | (37,881,665) | |
| 21 | Invesco Equity and Income Fund |
| Summary of Share Activity | |||||
| Year ended August 31, 2024(a) | Year ended August 31, 2023 | ||||
| Shares | Amount | Shares | Amount | ||
| Reacquired: | |||||
| Class A | (133,794,663) | $(1,377,412,518) | (126,443,474) | $(1,268,845,062) | |
| Class C | (4,862,347) | (48,635,987) | (4,786,675) | (46,688,340) | |
| Class R | (2,080,944) | (21,694,148) | (2,535,199) | (25,661,290) | |
| Class Y | (18,381,906) | (188,692,684) | (20,034,981) | (199,735,232) | |
| Class R5 | (3,761,316) | (39,033,621) | (4,667,747) | (46,535,816) | |
| Class R6 | (20,170,855) | (207,674,329) | (16,656,810) | (166,737,010) | |
| Net increase (decrease) in share activity | (18,789,099) | $(214,933,017) | 9,915,696 | $96,347,030 | |
| (a) | There are entities that are record owners of more than 5% of the outstanding shares of the Fund and in the aggregate own 51% of the outstanding shares of the Fund. IDI has an agreement with these entities to sell Fund shares. The Fund, Invesco and/or Invesco affiliates may make payments to these entities, which are considered to be related to the Fund, for providing services to the Fund, Invesco and/or Invesco affiliates including but not limited to services such as securities brokerage, distribution, third party record keeping and account servicing. The Fund has no knowledge as to whether all or any portion of the shares owned of record by these entities are also owned beneficially. |
| 22 | Invesco Equity and Income Fund |
| 23 | Invesco Equity and Income Fund |
| 24 | Invesco Equity and Income Fund |
| 25 | Invesco Equity and Income Fund |
| 26 | Invesco Equity and Income Fund |
| Federal and State Income Tax | |
| Long-Term Capital Gain Distributions | $584,267,179 |
| Qualified Dividend Income* | 59.90% |
| Corporate Dividends Received Deduction* | 51.03% |
| U.S. Treasury Obligations* | 19.32% |
| Qualified Business Income* | 0.00% |
| Business Interest Income* | 36.51% |
| * | The above percentages are based on ordinary income dividends paid to shareholders during the Fund’s fiscal year. |
| 27 | Invesco Equity and Income Fund |
| 28 | Invesco Equity and Income Fund |

| Annual Financial Statements and Other Information | August 31, 2024 | |
Invesco Floating Rate ESG Fund
Nasdaq:
A: AFRAX ∎ C: AFRCX ∎ R: AFRRX ∎ Y: AFRYX ∎ R5: AFRIX ∎ R6: AFRFX
Consolidated Schedule of Investments
August 31, 2024
| Interest Rate | Maturity Date | Principal Amount (000)(a) | Value | |||||||||||||
Variable Rate Senior Loan Interests–87.53%(b)(c) | ||||||||||||||||
Aerospace & Defense–2.39% | ||||||||||||||||
ADB Safegate (ADBAS/CEP IV) (Luxembourg), Term Loan B (6 mo. EURIBOR + 4.75%) | 8.51% | 10/05/2026 | EUR | 7,531 | $ 8,181,166 | |||||||||||
Aernnova Aerospace S.A.U (Spain), Term Loan B (3 mo. EURIBOR + 4.00%) | 7.71% | 02/26/2030 | EUR | 549 | 608,245 | |||||||||||
Brown Group Holding LLC (Signature Aviation US Holdings, Inc.) | ||||||||||||||||
Incremental Term Loan B-2 (1 mo. Term SOFR + 2.75%) | 8.00% | 07/01/2031 | $ | 797 | 797,727 | |||||||||||
Term Loan (1 mo. Term SOFR + 3.69%) | 8.00% | 07/01/2031 | 5,186 | 5,191,969 | ||||||||||||
Castlelake Aviation Ltd. | ||||||||||||||||
Incremental Term Loan (3 mo. Term SOFR + 2.75%) | 8.09% | 10/22/2027 | 4,621 | 4,640,588 | ||||||||||||
Term Loan (3 mo. Term SOFR + 2.50%) | 7.84% | 10/22/2026 | 4,892 | 4,912,215 | ||||||||||||
Dynasty Acquisition Co., Inc. | ||||||||||||||||
Term Loan B-1 (1 mo. Term SOFR + 3.50%) | 8.75% | 08/24/2028 | 791 | 794,972 | ||||||||||||
Term Loan B-2 (1 mo. Term SOFR + 3.50%) | 8.75% | 08/24/2028 | 305 | 306,521 | ||||||||||||
KKR Apple Bidco LLC, First Lien Term Loan (1 mo. Term SOFR + 2.86%) | 8.11% | 09/22/2028 | 8,854 | 8,880,448 | ||||||||||||
Ovation Parent, Inc. (Kaman), Term Loan B (3 mo. Term SOFR + 3.50%) | 8.83% | 04/21/2031 | 4,245 | 4,264,872 | ||||||||||||
Peraton Corp. | ||||||||||||||||
First Lien Term Loan B (1 mo. Term SOFR + 3.75%) | 9.10% | 02/01/2028 | 3,306 | 3,242,692 | ||||||||||||
Second Lien Term Loan B-1 (3 mo. Term SOFR + 7.85%) | 12.97% | 02/01/2029 | 8,082 | 7,890,271 | ||||||||||||
Propulsion (BC) Newco LLC (Spain), Term Loan (3 mo. Term SOFR + 3.75%) | 9.08% | 09/14/2029 | 4,863 | 4,884,384 | ||||||||||||
Rand Parent LLC (Atlas Air), First Lien Term Loan B (3 mo. Term SOFR + 3.75%) | 9.07% | 03/17/2030 | 7,758 | 7,769,995 | ||||||||||||
Titan Acquisition Holdings L.P., Term loan B (1 mo. Term SOFR + 3.50%) | 8.81% | 06/14/2030 | 1,212 | 1,210,432 | ||||||||||||
| 63,576,497 | ||||||||||||||||
Air Transport–1.84% | ||||||||||||||||
AAdvantage Loyality IP Ltd. (American Airlines, Inc.), Term Loan (3 mo. Term SOFR + 5.01%) | 10.29% | 04/20/2028 | 15,476 | 16,033,491 | ||||||||||||
Air Canada (Canada), Term Loan B (3 mo. Term SOFR + 2.50%) | 7.85% | 03/21/2031 | 1,646 | 1,648,366 | ||||||||||||
American Airlines, Inc. | ||||||||||||||||
Term Loan (1 mo. Term SOFR + 2.86%) | 8.20% | 02/15/2028 | 9,467 | 9,464,081 | ||||||||||||
Term Loan (6 mo. Term SOFR + 2.50%) | 8.77% | 06/04/2029 | 4,293 | 4,276,120 | ||||||||||||
eTraveli Group Holding AB (Sweden), Term loan B (3 mo. EURIBOR + 4.50%) | 8.22% | 11/02/2028 | EUR | 2,314 | 2,567,892 | |||||||||||
United AirLines, Inc., Term Loan B (3 mo. Term SOFR + 2.75%) | 8.03% | 02/22/2031 | 11,357 | 11,409,784 | ||||||||||||
WestJet Airlines Ltd. (Canada), Term Loan (3 mo. Term SOFR + 3.75%) | 9.08% | 02/14/2031 | 3,745 | 3,736,129 | ||||||||||||
| 49,135,863 | ||||||||||||||||
Automotive–4.34% | ||||||||||||||||
Adient PLC, Term Loan B-2 (1 mo. Term SOFR + 2.75%) | 8.03% | 01/31/2031 | 1,961 | 1,968,727 | ||||||||||||
Autokiniton US Holdings, Inc., Term Loan B (1 mo. Term SOFR + 4.11%) | 9.36% | 04/06/2028 | 6,864 | 6,893,422 | ||||||||||||
Constellation Auto (CONSTE/BCA) (United Kingdom) | ||||||||||||||||
First Lien Term Loan B-2 (6 mo. SONIA + 4.75%) | 9.95% | 07/28/2028 | GBP | 759 | 918,954 | |||||||||||
Second Lien Term Loan (6 mo. SONIA + 7.50%) | 12.45% | 07/27/2029 | GBP | 4,072 | 3,850,316 | |||||||||||
DexKo Global, Inc., Incremental First Lien Term Loan (3 mo. Term SOFR + 4.25%) | 9.58% | 10/04/2028 | 4,715 | 4,656,977 | ||||||||||||
Driven Holdings LLC, Term Loan (1 mo. Term SOFR + 3.11%) | 8.36% | 12/17/2028 | 5,150 | 5,120,401 | ||||||||||||
Engineered Components & Systems LLC, Term Loan (1 mo. Term SOFR + 6.00%) | 11.25% | 08/30/2030 | 5,442 | 5,360,287 | ||||||||||||
First Brands Group LLC | ||||||||||||||||
First Lien Incremental Term Loan (3 mo. EURIBOR + 5.00%)(d) | 8.64% | 03/30/2027 | EUR | 2,869 | 3,187,096 | |||||||||||
First Lien Incremental Term Loan (3 mo. Term SOFR + 5.26%) | 10.51% | 03/30/2027 | 15,429 | 15,274,649 | ||||||||||||
First Lien Term Loan (3 mo. Term SOFR + 5.26%) | 10.25% | 03/30/2027 | 10,445 | 10,340,381 | ||||||||||||
Second Lien Term Loan (3 mo. Term SOFR + 8.76%)(d) | 14.01% | 03/30/2028 | 2,732 | 2,609,485 | ||||||||||||
Highline Aftermarket Acquisition LLC, First Lien Term Loan (1 mo. USD LIBOR + 4.00%) | 9.25% | 11/09/2027 | 13,265 | 13,360,231 | ||||||||||||
LS Group OpCo Acquisition (Les Schwab Tire Centers), Term Loan B (1 mo. Term SOFR + 3.00%) | 8.25% | 04/23/2031 | 9,249 | 9,267,838 | ||||||||||||
Mavis Tire Express Services TopCo Corp., Term Loan (1 mo. Term SOFR + 3.50%) | 8.75% | 05/04/2028 | 12,381 | 12,410,381 | ||||||||||||
Panther BF Aggregator 2 L.P. (Power Solutions, Clarios POWSOL) (Canada), Term Loan B (1 mo. Term SOFR + 2.50%) | 7.75% | 05/06/2030 | 2,383 | 2,393,703 | ||||||||||||
PowerStop LLC, Term Loan B (3 mo. Term SOFR + 4.75%) | 9.91% | 01/24/2029 | 7,936 | 7,677,635 | ||||||||||||
Project Boost Purchaser LLC, Term Loan (3 mo. Term SOFR + 3.50%) | 8.79% | 07/16/2031 | 3,047 | 3,059,304 | ||||||||||||
See accompanying Notes to Consolidated Financial Statements which are an integral part of the financial statements.
| 2 | Invesco Floating Rate ESG Fund |
| Interest Rate | Maturity Date | Principal Amount (000)(a) | Value | |||||||||||||
Automotive–(continued) | ||||||||||||||||
Wand Newco 3, Inc., First Lien Term Loan (1 mo. Term SOFR + 3.25%) | 8.50% | 01/30/2031 | $ | 7,336 | $ 7,355,119 | |||||||||||
| 115,704,906 | ||||||||||||||||
Beverage & Tobacco–0.61% | ||||||||||||||||
AI Aqua Merger Sub, Inc., Term Loan B (1 mo. Term SOFR + 3.50%) | 8.84% | 07/31/2028 | 16,308 | 16,345,895 | ||||||||||||
Building & Development–3.89% | ||||||||||||||||
Arcosa, Inc., Term Loan B (d)(e) | – | 08/13/2031 | 2,038 | 2,048,286 | ||||||||||||
BME Holding B.V. (CRHEUD) (Netherlands), Term Loan B-2 (3 mo. EURIBOR + 4.75%) | 8.39% | 12/31/2029 | EUR | 2,000 | 2,098,193 | |||||||||||
Brookfield Retail Holdings VII Sub 3 LLC, Term Loan B (1 mo. Term SOFR + 2.60%) | 7.85% | 08/27/2025 | 1,192 | 1,189,961 | ||||||||||||
Chariot Buyer LLC | ||||||||||||||||
First Lien Term Loan (1 mo. Term SOFR + 3.35%) | 8.60% | 11/03/2028 | 1,039 | 1,038,885 | ||||||||||||
First Lien Term Loan (1 mo. Term SOFR + 3.50%) | 8.75% | 11/03/2028 | 4,402 | 4,405,292 | ||||||||||||
Core & Main L.P., Term Loan D (3 mo. Term SOFR + 2.00%) | 7.34% | 07/27/2028 | 7,983 | 7,992,569 | ||||||||||||
Empire Today LLC, Term Loan B (3 mo. Term SOFR + 5.26%) | 10.51% | 04/01/2028 | 18,833 | 13,781,545 | ||||||||||||
Flakt Woods (Fusilli Holdco) (France), Term Loan B (6 mo. EURIBOR + 5.00%) | 8.85% | 04/12/2026 | EUR | 1,815 | 1,981,467 | |||||||||||
Gulfside Supply, Inc., Term Loan B(d) | 0.00% | 06/17/2031 | 3,015 | 3,020,910 | ||||||||||||
Icebox Holdco III, Inc. | ||||||||||||||||
First Lien Term Loan (3 mo. Term SOFR + 4.01%) | 9.35% | 12/22/2028 | 6,672 | 6,714,881 | ||||||||||||
Second Lien Term Loan (3 mo. Term SOFR + 7.01%)(d) | 12.35% | 12/21/2029 | 1,544 | 1,563,186 | ||||||||||||
Interior Logic Group, Inc. (Signal Parent), Term Loan B (1 mo. Term SOFR + 3.60%) | 8.85% | 04/01/2028 | 6,300 | 5,557,568 | ||||||||||||
IPS Corp./CP Iris Holdco, First Lien Term Loan (1 mo. Term SOFR + 3.50%) | 8.75% | 10/02/2028 | 3,777 | 3,781,060 | ||||||||||||
Janus International Group LLC, Term Loan (1 mo. Term SOFR + 2.50%) | 7.75% | 08/03/2030 | 1,869 | 1,871,920 | ||||||||||||
LHS Borrow LLC (Leaf Home Solutions), Term Loan (1 mo. Term SOFR + 4.85%) | 10.10% | 02/16/2029 | 13,447 | 12,653,773 | ||||||||||||
MI Windows and Doors LLC, Incremental Term Loan B (1 mo. Term SOFR + 3.50%) | 8.75% | 03/28/2031 | 4,131 | 4,156,336 | ||||||||||||
Oldcastle BuildingEnvelope, Inc., Term Loan B (3 mo. Term SOFR + 4.25%) | 9.58% | 04/29/2029 | 10,807 | 10,736,109 | ||||||||||||
Quikrete Holdings, Inc. | ||||||||||||||||
Term Loan B (1 mo. Term SOFR + 2.25%) | 7.50% | 03/19/2029 | 11,182 | 11,218,690 | ||||||||||||
Term Loan B (1 mo. Term SOFR + 2.50%) | 7.75% | 04/14/2031 | 7,002 | 7,024,785 | ||||||||||||
Xella (Luxembourg), Term Loan B-4 (3 mo. EURIBOR + 4.18%) | 7.90% | 04/12/2028 | EUR | 723 | 756,431 | |||||||||||
| 103,591,847 | ||||||||||||||||
Business Equipment & Services–9.97% | ||||||||||||||||
Allied Universal Holdco LLC (USAGM Holdco LLC/UNSEAM), Term Loan (1 mo. Term SOFR + 3.75%) | 9.10% | 05/12/2028 | 10,861 | 10,809,220 | ||||||||||||
Alter Domus (Chrysaor Bidco S.a.r.l.) | ||||||||||||||||
Delayed Draw Term Loan(f) | 0.00% | 05/14/2031 | 125 | 125,274 | ||||||||||||
Term Loan B | 0.00% | 07/14/2031 | 1,686 | 1,693,926 | ||||||||||||
Azuria Water Solutions, Inc., Term Loan B (1 mo. Term SOFR + 3.75%) | 9.00% | 05/17/2028 | 916 | 920,140 | ||||||||||||
Boost Newco Borrower LLC (WorldPay), Term Loan B (3 mo. Term SOFR + 2.50%) | 7.75% | 01/31/2031 | 11,693 | 11,739,929 | ||||||||||||
Checkout Holding Corp. (Catalina Marketing), Term Loan (3 mo. Term SOFR + 9.50%) | 14.83% | 05/10/2027 | 411 | 402,777 | ||||||||||||
Cimpress USA, Inc., Term Loan B (1 mo. Term SOFR + 3.00%) | 8.25% | 05/17/2028 | 11,114 | 11,150,741 | ||||||||||||
Cloud Software Group, Inc. | ||||||||||||||||
First Lien Term Loan (3 mo. Term SOFR + 4.50%) | 9.83% | 03/21/2031 | 3,152 | 3,170,679 | ||||||||||||
Term Loan B (3 mo. Term SOFR + 4.00%) | 9.33% | 03/30/2029 | 7,633 | 7,640,112 | ||||||||||||
Constant Contact, Inc. | ||||||||||||||||
Second Lien Term Loan (3 mo. Term SOFR + 7.76%) | 13.07% | 02/12/2029 | 1,329 | 1,236,923 | ||||||||||||
Term Loan (3 mo. Term SOFR + 4.26%) | 9.57% | 02/10/2028 | 7,770 | 7,520,846 | ||||||||||||
Corporation Service Co., Term Loan B (1 mo. Term SOFR + 2.50%)(d) | 7.75% | 11/02/2029 | 8,821 | 8,848,645 | ||||||||||||
Deerfield Dakota Holding Corp. | ||||||||||||||||
First Lien Term Loan (3 mo. Term SOFR + 3.75%) | 9.08% | 04/09/2027 | 11,594 | 11,526,917 | ||||||||||||
Second Lien Term Loan (3 mo. Term SOFR + 7.01%) | 12.35% | 04/07/2028 | 3,245 | 3,257,027 | ||||||||||||
DTI HoldCo, Inc., Incremental Term Loan B (1 mo. Term SOFR + 4.75%) | 10.00% | 04/26/2029 | 2,195 | 2,206,127 | ||||||||||||
Dun & Bradstreet Corp. (The), Incremental Term Loan B-2 (1 mo. Term SOFR + 2.75%) | 8.03% | 01/18/2029 | 17,540 | 17,588,925 | ||||||||||||
Garda World Security Corp. (Canada), Term Loan B (1 mo. Term SOFR + 3.48%) | 8.83% | 02/01/2029 | 12,708 | 12,741,537 | ||||||||||||
GI Revelation Acquisition LLC, First Lien Term Loan (1 mo. Term SOFR + 4.11%) | 9.36% | 05/12/2028 | 14,141 | 14,151,148 | ||||||||||||
I-Logic Tech Bidco Ltd. (Acuris) (United Kingdom), Term Loan (3 mo. Term SOFR + 4.15%) | 9.48% | 02/16/2028 | 5,053 | 5,054,174 | ||||||||||||
See accompanying Notes to Consolidated Financial Statements which are an integral part of the financial statements.
| 3 | Invesco Floating Rate ESG Fund |
| Interest Rate | Maturity Date | Principal Amount (000)(a) | Value | |||||||||||||
Business Equipment & Services–(continued) | ||||||||||||||||
ION Trading Technologies S.a.r.l. (Luxembourg) | ||||||||||||||||
Term Loan (3 mo. EURIBOR + 4.25%) | 7.97% | 04/01/2028 | EUR | 9,438 | $ 10,013,070 | |||||||||||
Term Loan (3 mo. Term SOFR + 4.00%) | 9.35% | 04/01/2028 | $ | 3,527 | 3,541,521 | |||||||||||
KronosNet CX Bidco (Comspa Konecta) (Spain), Term Loan B (6 mo. EURIBOR + 5.75%) | 9.60% | 10/25/2029 | EUR | 12,220 | 9,607,196 | |||||||||||
Learning Care Group (US) No. 2, Inc., Term Loan B (3 mo. Term SOFR + 4.00%) | 9.33% | 08/11/2028 | 3,264 | 3,281,767 | ||||||||||||
Monitronics International, Inc., Term Loan B (3 mo. Term SOFR + 7.76%) (Acquired 06/30/2023-02/16/2024; Cost $26,745,271)(g) | 13.01% | 06/30/2028 | 26,716 | 26,582,466 | ||||||||||||
Neon Maple Purchaser, Inc., Term Loan B(e) | – | 07/18/2031 | 11,700 | 11,678,345 | ||||||||||||
OCM System One Buyer CTB LLC, Term Loan B (3 mo. Term SOFR + 3.75%)(d) | 9.23% | 03/02/2028 | 3,150 | 3,150,451 | ||||||||||||
Orchid Merger Sub II LLC, Term Loan (1 mo. Term SOFR + 4.85%) | 10.10% | 07/27/2027 | 8,701 | 5,307,776 | ||||||||||||
Plano HoldCo, Inc. (aka Perficient), Term Loan B(d)(e) | – | 08/15/2031 | 4,802 | 4,826,019 | ||||||||||||
Prometric Holdings, Inc., Term Loan B (1 mo. Term SOFR + 4.86%) | 10.11% | 01/31/2028 | 5,318 | 5,351,287 | ||||||||||||
Ryan LLC (Ryan Tax) | ||||||||||||||||
Delayed Draw Term Loan(f) | 0.00% | 11/14/2030 | 177 | 177,879 | ||||||||||||
Term Loan (1 mo. Term SOFR + 3.50%) | 8.75% | 11/14/2030 | 2,374 | 2,384,528 | ||||||||||||
Sitel Worldwide Corp., Term Loan (1 mo. Term SOFR + 3.86%) | 9.11% | 08/28/2028 | 6,303 | 4,316,569 | ||||||||||||
Skillsoft Corp., Term Loan (1 mo. Term SOFR + 5.36%) | 10.64% | 07/14/2028 | 2,006 | 1,619,693 | ||||||||||||
Spin Holdco, Inc., Term Loan (3 mo. Term SOFR + 4.26%) | 9.60% | 03/04/2028 | 29,257 | 25,021,666 | ||||||||||||
Tempo Acquisition LLC, Term Loan B-1 (1 mo. Term SOFR + 2.25%) | 7.50% | 08/31/2028 | 2,223 | 2,231,800 | ||||||||||||
Thermostat Purchaser III, Inc., Term Loan B (1 mo. Term SOFR + 4.35%)(d) | 9.60% | 08/31/2028 | 870 | 869,253 | ||||||||||||
Trans Union LLC, Term Loan B-7 (1 mo. Term SOFR + 2.00%) | 7.25% | 12/01/2028 | 2,242 | 2,247,625 | ||||||||||||
UnitedLex Corp., Term Loan (3 mo. Term SOFR + 5.90%)(d) | 11.23% | 03/20/2027 | 1,443 | 1,262,466 | ||||||||||||
Verra Mobility Corp., First Lien Term Loan B-2 (1 mo. Term SOFR + 2.75%) | 8.00% | 03/24/2028 | 10,319 | 10,396,569 | ||||||||||||
| 265,653,013 | ||||||||||||||||
Cable & Satellite Television–3.46% | ||||||||||||||||
Altice Financing S.A. (Altice-Int’l) (Luxembourg) | ||||||||||||||||
Term Loan (3 mo. USD LIBOR + 2.75%) | 8.31% | 07/15/2025 | 1,359 | 1,331,922 | ||||||||||||
Term Loan B (3 mo. EURIBOR + 5.00%) | 8.66% | 10/31/2027 | EUR | 929 | 928,694 | |||||||||||
Atlantic Broadband Finance LLC (Cogeco) | ||||||||||||||||
Incremental Term Loan B (1 mo. Term SOFR + 2.61%) | 7.86% | 09/01/2028 | 7,052 | 6,854,110 | ||||||||||||
Term Loan B-1 (1 mo. Term SOFR + 3.25%) | 8.50% | 09/18/2030 | 4,135 | 4,000,163 | ||||||||||||
Numericable-SFR S.A. (France) | ||||||||||||||||
Incremental Term Loan B-13 (3 mo. USD LIBOR + 4.00%) | 9.38% | 08/14/2026 | 10,563 | 8,476,515 | ||||||||||||
Term Loan B-11 (3 mo. USD LIBOR + 2.75%) | 8.26% | 07/31/2025 | 6,386 | 5,684,908 | ||||||||||||
Term Loan B-12 (3 mo. USD LIBOR + 3.69%) | 9.25% | 01/31/2026 | 4,827 | 3,951,650 | ||||||||||||
Term Loan B-14 (3 mo. EURIBOR + 5.50%) | 9.19% | 08/15/2028 | EUR | 3,745 | 3,135,957 | |||||||||||
Telenet - LG, Term Loan AR (1 mo. Term SOFR + 2.11%) | 7.45% | 04/30/2028 | 5,590 | 5,453,428 | ||||||||||||
UPC - LG (Sunrise) | ||||||||||||||||
Term Loan AT (1 mo. Term SOFR + 2.36%) | 7.70% | 04/30/2028 | 116 | 115,219 | ||||||||||||
Term Loan AX (1 mo. Term SOFR + 3.04%) | 8.44% | 01/31/2029 | 19,005 | 18,922,270 | ||||||||||||
Virgin Media 02 - LG (United Kingdom) | ||||||||||||||||
Term Loan N (1 mo. Term SOFR + 2.61%) | 7.94% | 01/31/2028 | 7,875 | 7,624,423 | ||||||||||||
Term Loan Q (1 mo. Term SOFR + 3.36%) | 8.70% | 01/31/2029 | 20,909 | 20,171,490 | ||||||||||||
Term Loan Y (6 mo. Term SOFR + 3.35%) | 8.66% | 03/31/2031 | 5,726 | 5,503,460 | ||||||||||||
| 92,154,209 | ||||||||||||||||
Chemicals & Plastics–10.01% | ||||||||||||||||
A&R Logistics Holdings, Inc. (Quantix), Incremental Term Loan (3 mo. Term SOFR + 6.90%)(d) | 12.22% | 08/03/2026 | 14,591 | 14,182,841 | ||||||||||||
A-Gas Finco, Inc., Term Loan (3 mo. Term SOFR + 5.25%) | 10.58% | 12/14/2029 | 7,119 | 6,882,803 | ||||||||||||
AkzoNoble Chemicals | ||||||||||||||||
Term Loan B (3 mo. Term SOFR + 3.50%) | 8.63% | 04/03/2028 | 15,510 | 15,597,106 | ||||||||||||
Term Loan B (3 mo. Term SOFR + 3.50%) | 8.82% | 04/03/2028 | 4,356 | 4,388,687 | ||||||||||||
Aruba Investments, Inc. | ||||||||||||||||
First Lien Term Loan (1 mo. Term SOFR + 4.10%) | 9.35% | 11/24/2027 | 904 | 899,252 | ||||||||||||
Second Lien Term Loan (1 mo. Term SOFR + 7.85%) | 13.10% | 11/24/2028 | 1,711 | 1,645,420 | ||||||||||||
Ascend Performance Materials Operations LLC, Term Loan (6 mo. Term SOFR + 4.85%) | 10.07% | 08/27/2026 | 12,694 | 12,371,468 | ||||||||||||
Austin Powder (A-AP Buyer, Inc.), First Lien Term Loan(d)(e) | – | 08/01/2031 | 3,200 | 3,216,299 | ||||||||||||
See accompanying Notes to Consolidated Financial Statements which are an integral part of the financial statements.
| 4 | Invesco Floating Rate ESG Fund |
| Interest Rate | Maturity Date | Principal Amount (000)(a) | Value | |||||||||||||
Chemicals & Plastics–(continued) | ||||||||||||||||
Caldic (Pearls BidCo) (Netherlands), Term Loan B (3 mo. Term SOFR + 4.00%) | 9.25% | 02/26/2029 | $ | 4,681 | $ 4,707,493 | |||||||||||
Charter NEX US, Inc., First Lien Term Loan (1 mo. Term SOFR + 3.25%) | 8.50% | 12/01/2027 | 9,259 | 9,292,376 | ||||||||||||
Composite Resins Holding B.V. (AOC), Term Loan B (1 mo. Term SOFR + 3.61%) | 8.86% | 10/15/2028 | 6,610 | 6,614,492 | ||||||||||||
Derby Buyer LLC (Delrin), Term Loan B (1 mo. Term SOFR + 3.50%) | 8.84% | 11/01/2030 | 4,028 | 4,041,162 | ||||||||||||
Discovery Purchaser Corp. (BES) | ||||||||||||||||
First Lien Term Loan (3 mo. Term SOFR + 4.38%) | 9.69% | 10/04/2029 | 9,321 | 9,331,876 | ||||||||||||
Second Lien Term Loan (3 mo. Term SOFR + 7.00%) | 12.32% | 10/04/2030 | 3,644 | 3,564,798 | ||||||||||||
Eastman Tire Additives (River Buyer, Inc.), First Lien Term Loan (3 mo. Term SOFR + 5.51%) | 10.85% | 11/01/2028 | 11,300 | 9,039,943 | ||||||||||||
Flint Group (ColourOz Inv) (Germany), PIK Term Loan B, 6.90% PIK Rate, 5.64% Cash Rate(h) | 6.90% | 12/31/2027 | 44 | 8,834 | ||||||||||||
Fusion (Fusion UK Holding Ltd. & US HoldCo VAD, Inc.), Term Loan B (3 mo. Term SOFR + 3.50%) | 8.83% | 05/29/2029 | 2,594 | 2,610,020 | ||||||||||||
ICP Group Holdings LLC (CPC Acquisition), First Lien Term Loan (3 mo. Term SOFR + 4.01%) | 9.35% | 12/29/2027 | 5,589 | 4,664,106 | ||||||||||||
INEOS Enterprises Holdings US Finco LLC (United Kingdom), Term Loan B (3 mo. Term SOFR + 3.85%) | 8.91% | 07/08/2030 | 6,694 | 6,719,380 | ||||||||||||
Ineos Quattro (STYRO) (United Kingdom) | ||||||||||||||||
Term Loan B (1 mo. Term SOFR + 4.35%) | 9.60% | 04/02/2029 | 10,267 | 10,305,723 | ||||||||||||
Term Loan B (1 mo. Term SOFR + 3.85%) | 9.10% | 03/14/2030 | 2,353 | 2,359,409 | ||||||||||||
Ineos US Finance LLC | ||||||||||||||||
Term Loan (1 mo. Term SOFR + 2.60%) | 7.85% | 11/08/2028 | 4,384 | 4,378,706 | ||||||||||||
Term Loan (1 mo. Term SOFR + 3.25%) | 8.50% | 02/18/2030 | 16,053 | 16,051,081 | ||||||||||||
Term Loan (1 mo. Term SOFR + 3.75%) | 9.00% | 02/07/2031 | 5,413 | 5,426,664 | ||||||||||||
Lummus Technology Holdings V LLC (Illuminate Buyer LLC), Term Loan B (1 mo. Term SOFR + 3.61%) | 8.86% | 12/31/2029 | 2,802 | 2,816,840 | ||||||||||||
Oxea Corp. (OQ Chemicals) | ||||||||||||||||
Term Loan 3 mo. Term SOFR + 8.00%) | 13.35% | 06/22/2025 | 2,803 | 2,905,053 | ||||||||||||
Term Loan B-2 (3 mo. USD LIBOR + 3.25%) | 8.92% | 10/14/2024 | 6,886 | 6,177,039 | ||||||||||||
Potters Industries, Term Loan B (3 mo. Term SOFR + 3.75%) | 9.08% | 12/14/2027 | 1,947 | 1,962,228 | ||||||||||||
Proampac PG Borrower LLC, Term Loan B (3 mo. Term SOFR + 4.00%) | 9.30% | 09/15/2028 | 10,170 | 10,216,324 | ||||||||||||
Trinseo Materials Operating S.C.A. | ||||||||||||||||
Incremental Term Loan (1 mo. Term SOFR + 2.61%) | 7.82% | 05/03/2028 | 9,506 | 7,619,329 | ||||||||||||
Term Loan A (3 mo. Term SOFR + 8.50%) | 13.80% | 05/03/2028 | 1,415 | 1,496,309 | ||||||||||||
Term Loan B (3 mo. Term SOFR + 8.50%) | 13.80% | 05/03/2028 | 10,413 | 10,988,196 | ||||||||||||
Tronox Finance LLC, Term Loan B (1 mo. Term SOFR + 2.75%) | 8.00% | 04/04/2029 | 13,555 | 13,615,401 | ||||||||||||
Univar, Inc., Term Loan B (1 mo. Term SOFR + 4.00%) | 9.31% | 08/01/2030 | 10,616 | 10,686,889 | ||||||||||||
V Global Holdings LLC | ||||||||||||||||
Revolver Loan (1 mo. Term SOFR + 5.85%)(d) | 0.50% | 12/22/2025 | 2,359 | 2,193,646 | ||||||||||||
Revolver Loan(d)(f) | 0.00% | 12/22/2025 | 460 | 427,692 | ||||||||||||
Term Loan (3 mo. Term SOFR + 5.90%)(d) | 10.96% | 12/22/2027 | 22,651 | 21,065,076 | ||||||||||||
W. R. Grace Holdings LLC, Term Loan (3 mo. Term SOFR + 3.44%) | 8.50% | 09/22/2028 | 16,134 | 16,206,722 | ||||||||||||
| 266,676,683 | ||||||||||||||||
Clothing & Textiles–0.76% | ||||||||||||||||
ABG Intermediate Holdings 2 LLC | ||||||||||||||||
Delayed Draw Term Loan(f) | 0.00% | 12/21/2028 | 1,934 | 1,944,626 | ||||||||||||
Term Loan (1 mo. Term SOFR + 2.75%) | 8.00% | 12/21/2028 | 10,059 | 10,101,437 | ||||||||||||
Varsity Brands Holding Co., Inc., Term Loan B | 8.82% | 07/25/2031 | 8,284 | 8,259,467 | ||||||||||||
| 20,305,530 | ||||||||||||||||
Conglomerates–0.25% | ||||||||||||||||
APi Group DE, Inc., Term Loan B (1 mo. Term SOFR + 2.00%) | 7.25% | 01/03/2029 | 6,735 | 6,755,112 | ||||||||||||
Containers & Glass Products–2.58% | ||||||||||||||||
Berlin Packaging LLC, Term Loan B-7 (3 mo. Term SOFR + 3.75%) | 8.95% | 06/07/2031 | 10,867 | 10,877,705 | ||||||||||||
Duran Group (Blitz/DWK) (Germany), Term loan C-2 (3 mo. USD LIBOR + 5.65%)(d) | 10.98% | 05/31/2026 | 7,291 | 6,963,189 | ||||||||||||
See accompanying Notes to Consolidated Financial Statements which are an integral part of the financial statements.
| 5 | Invesco Floating Rate ESG Fund |
| Interest Rate | Maturity Date | Principal Amount (000)(a) | Value | |||||||||||||
Containers & Glass Products–(continued) | ||||||||||||||||
Keter Group B.V. (Netherlands) | ||||||||||||||||
Term Loan (3 mo. EURIBOR + 4.75%) (Acquired 04/29/2024; Cost $8,614,781)(g) | 8.39% | 12/28/2029 | EUR | 8,480 | $ 8,971,641 | |||||||||||
Term Loan (3 mo. EURIBOR + 0.00%) (Acquired 04/29/2024-07/29/2024; Cost $9,503,553)(g) | 5.00% | 12/31/2029 | EUR | 11,672 | 10,869,827 | |||||||||||
Libbey Glass LLC, Incremental Term Loan (3 mo. Term SOFR + 6.65%) | 11.93% | 11/22/2027 | $ | 13,376 | 13,303,449 | |||||||||||
Logoplaste (Mar Bidco S.a.r.l.) (Portugal), Term Loan B (3 mo. Term SOFR + 4.46%) | 9.51% | 07/07/2028 | 6,384 | 6,196,025 | ||||||||||||
Mold-Rite Plastics LLC (Valcour Packaging LLC), Term Loan A-2 (1 mo. Term SOFR + 1.74%) | 7.08% | 10/10/2028 | 5,729 | 4,915,677 | ||||||||||||
Mold-Rite Plastics, LLC (Valcour Packaging LLC), Term Loan A-1 (1 mo. Term SOFR + 5.23%) | 10.56% | 10/10/2028 | 4,770 | 4,826,633 | ||||||||||||
Refresco (Pegasus Bidco BV) (Netherlands), Term Loan (3 mo. Term SOFR + 3.75%) | 8.87% | 07/12/2029 | 1,803 | 1,809,739 | ||||||||||||
| 68,733,885 | ||||||||||||||||
Cosmetics & Toiletries–0.22% | ||||||||||||||||
Rodenstock (Germany), Term Loan B (3 mo. EURIBOR + 5.00%) | 8.64% | 06/29/2028 | EUR | 5,399 | 5,748,021 | |||||||||||
Drugs–0.26% | ||||||||||||||||
Grifols Worldwide Operations USA, Inc., Term Loan B (3 mo. Term SOFR + 2.15%) | 7.40% | 11/15/2027 | 7,140 | 7,036,911 | ||||||||||||
Ecological Services & Equipment–1.27% | ||||||||||||||||
Anticimex Global AB (Sweden) | ||||||||||||||||
Term Loan B-1(e) | – | 11/16/2028 | 659 | 661,501 | ||||||||||||
Term Loan B-6(e) | – | 11/16/2028 | 3,547 | 3,572,158 | ||||||||||||
EnergySolutions LLC, Term Loan (1 mo. Term SOFR + 3.75%) | 9.00% | 09/20/2030 | 7,090 | 7,151,767 | ||||||||||||
Groundworks LLC | ||||||||||||||||
Delayed Draw Term Loan (1 mo. Term SOFR + 3.50%) | 8.84% | 03/14/2031 | 200 | 200,449 | ||||||||||||
Delayed Draw Term Loan(f) | 0.00% | 03/14/2031 | 1,052 | 1,052,358 | ||||||||||||
Term Loan (1 mo. Term SOFR + 3.50%) | 8.84% | 03/14/2031 | 6,801 | 6,806,919 | ||||||||||||
MIP V Waste LLC (GreenWaste), Term Loan (3 mo. Term SOFR + 3.00%) | 8.35% | 12/08/2028 | 2,176 | 2,177,021 | ||||||||||||
OGF (VESCAP/Obol France 3/PHM) (France) | ||||||||||||||||
Term Loan B (3 mo. EURIBOR + 5.00%) | 0.00% | 12/29/2028 | EUR | 2,000 | 2,123,893 | |||||||||||
Term Loan B-2 (6 mo. EURIBOR + 4.75%) | 8.58% | 12/31/2025 | EUR | 848 | 900,687 | |||||||||||
Patriot Container Corp., First Lien Term Loan (1 mo. Term SOFR + 3.85%) | 9.10% | 03/20/2025 | 9,433 | 9,260,242 | ||||||||||||
| 33,906,995 | ||||||||||||||||
Electronics & Electrical–8.65% | ||||||||||||||||
Applied Systems, Inc., Term Loan B-1 (3 mo. Term SOFR + 3.20%) | 8.29% | 02/24/2031 | 475 | 477,773 | ||||||||||||
AppLovin Corp., Term Loan (1 mo. Term SOFR + 2.50%) | 7.75% | 10/25/2028 | 5,026 | 5,040,238 | ||||||||||||
Boxer Parent Co., Inc., Term Loan (3 mo. Term SOFR + 3.75%) | 9.01% | 07/30/2031 | 7,340 | 7,332,339 | ||||||||||||
Central Parent LLC, Term Loan (3 mo. Term SOFR + 3.25%) | 8.58% | 07/06/2029 | 620 | 615,214 | ||||||||||||
ConnectWise LLC, Term Loan (1 mo. Term SOFR + 3.75%) | 9.10% | 10/01/2028 | 4 | 4,312 | ||||||||||||
Diebold Nixdorf, Inc., Term Loan (1 mo. Term SOFR + 7.50%) | 12.83% | 08/11/2028 | 5,240 | 5,385,560 | ||||||||||||
E2Open LLC, Term Loan (1 mo. Term SOFR + 3.61%) | 8.86% | 02/04/2028 | 7,220 | 7,249,837 | ||||||||||||
Epicor Software Corp. | ||||||||||||||||
Delayed Draw Term Loan B(f) | 0.00% | 05/30/2031 | 297 | 298,487 | ||||||||||||
Term Loan B | 8.50% | 05/30/2031 | 2,531 | 2,544,030 | ||||||||||||
EverCommerce, Term Loan B (1 mo. Term SOFR + 3.11%) | 8.36% | 07/06/2028 | 4,118 | 4,133,863 | ||||||||||||
GoTo Group, Inc. (LogMeIn) | ||||||||||||||||
First Lien Term Loan (1 mo. Term SOFR + 4.85%) | 10.14% | 04/30/2028 | 18,241 | 15,562,003 | ||||||||||||
Second Lien Term Loan (1 mo. Term SOFR + 4.85%) | 10.14% | 04/30/2028 | 11,209 | 4,531,444 | ||||||||||||
Idemia Group S.A.S. (Oberthur Tech/Morpho/OBETEC), Term Loan B-5 (3 mo. Term SOFR + 4.25%) | 9.58% | 09/30/2028 | 6,484 | 6,512,353 | ||||||||||||
Infinite Electronics | ||||||||||||||||
First Lien Incremental Term Loan (3 mo. Term SOFR + 6.51%)(d) | 11.64% | 03/02/2028 | 1,321 | 1,317,492 | ||||||||||||
First Lien Term Loan (3 mo. Term SOFR + 3.75%) | 9.26% | 03/02/2028 | 8,787 | 8,523,398 | ||||||||||||
Second Lien Term Loan (3 mo. Term SOFR + 7.00%) | 12.51% | 03/02/2029 | 749 | 634,580 | ||||||||||||
Informatica Corp., Term Loan B (1 mo. Term SOFR + 2.25%) | 7.50% | 10/27/2028 | 6,784 | 6,812,409 | ||||||||||||
ION Corp (Helios Software), Term Loan (3 mo. Term SOFR + 3.75%) | 9.08% | 07/18/2030 | 4,214 | 4,224,309 | ||||||||||||
See accompanying Notes to Consolidated Financial Statements which are an integral part of the financial statements.
| 6 | Invesco Floating Rate ESG Fund |
| Interest Rate | Maturity Date | Principal Amount (000)(a) | Value | |||||||||||||
Electronics & Electrical–(continued) | ||||||||||||||||
Learning Pool (Brook Bidco Ltd.) (United Kingdom) | ||||||||||||||||
Term Loan (3 mo. SONIA + 6.87%)(d) | 12.07% | 08/17/2028 | GBP | 1,839 | $ 2,333,603 | |||||||||||
Term Loan (3 mo. SONIA + 6.87%)(d) | 12.07% | 08/17/2028 | GBP | 466 | 591,070 | |||||||||||
Term Loan (3 mo. Term SOFR + 7.11%)(d) | 12.34% | 08/17/2028 | $ | 5,803 | 5,542,049 | |||||||||||
Term Loan (3 mo. Term SOFR + 7.02%)(d) | 12.34% | 08/17/2028 | 2,211 | 2,111,188 | ||||||||||||
Mavenir Systems, Inc., Term Loan B (3 mo. Term SOFR + 5.01%) | 10.07% | 08/18/2028 | 11,761 | 8,347,145 | ||||||||||||
McAfee Enterprise, Term Loan (3 mo. Term SOFR + 6.25%) | 11.37% | 07/27/2028 | 4,574 | 4,619,468 | ||||||||||||
McAfee LLC, Term Loan B (1 mo. Term SOFR + 3.25%) | 8.59% | 03/01/2029 | 9,683 | 9,669,116 | ||||||||||||
Mirion Technologies, Inc., Term Loan B (3 mo. Term SOFR + 2.25%) | 7.58% | 10/20/2028 | 6,775 | 6,781,654 | ||||||||||||
Natel Engineering Co., Inc., Term Loan (1 mo. Term SOFR + 6.36%) | 11.61% | 04/30/2026 | 15,253 | 13,365,844 | ||||||||||||
Native Instruments (Music Creation Group GmbH/APTUS) (Germany), Term Loan B (3 mo. EURIBOR + 6.00%)(d) | 9.75% | 03/03/2028 | EUR | 3,955 | 3,869,327 | |||||||||||
Open Text Corp. (Canada), Term Loan (1 mo. Term SOFR + 2.25%) | 7.50% | 01/31/2030 | 5,309 | 5,341,770 | ||||||||||||
Particle Luxembourg S.a.r.l. (WebPros), Term Loan B (1 mo. Term SOFR + 4.00%) | 9.25% | 03/28/2031 | 5,808 | 5,837,321 | ||||||||||||
Proofpoint, Inc., Term Loan (1 mo. Term SOFR + 3.00%) | 8.25% | 08/31/2028 | 16,068 | 16,101,957 | ||||||||||||
Quest Software US Holdings, Inc., First Lien Term Loan (3 mo. Term SOFR + 4.40%) (Acquired 01/20/2022-02/02/2022; Cost $13,917,156)(g) | 9.65% | 02/01/2029 | 14,006 | 10,366,154 | ||||||||||||
Renaissance Holding Corp., Term Loan B (1 mo. Term SOFR + 4.25%) | 9.50% | 04/05/2030 | 7,932 | 7,943,109 | ||||||||||||
SonicWall U.S. Holdings, Inc. | ||||||||||||||||
First Lien Term Loan (3 mo. Term SOFR + 5.00%) | 10.33% | 05/18/2028 | 7,919 | 7,788,682 | ||||||||||||
Second Lien Term Loan (3 mo. Term SOFR + 7.65%) | 12.98% | 05/18/2026 | 1,834 | 1,709,219 | ||||||||||||
Ultimate Software Group, Inc., Term Loan B (3 mo. Term SOFR + 3.25%) | 8.55% | 02/10/2031 | 14,350 | 14,399,632 | ||||||||||||
UST Holdings Ltd., Term Loan B (1 mo. Term SOFR + 3.61%) | 8.90% | 11/20/2028 | 8,671 | 8,698,047 | ||||||||||||
Utimaco (SGT Ultimate BidCo GmbH) (Germany) | ||||||||||||||||
Term Loan B-1 (6 mo. EURIBOR + 6.25%)(d) | 10.00% | 05/31/2029 | EUR | 9,126 | 9,230,406 | |||||||||||
Term Loan B-2(d)(e) | – | 05/31/2029 | 5,122 | 4,727,523 | ||||||||||||
| 230,573,925 | ||||||||||||||||
Farming/Agriculture–0.03% | ||||||||||||||||
Rovensa (Root Bidco Sarl), Term Loan B (6 mo. EURIBOR + 5.25%) | 8.84% | 09/29/2027 | EUR | 859 | 936,198 | |||||||||||
Financial Intermediaries–2.71% | ||||||||||||||||
AssetMark Financial Holdings, Inc., Term Loan B (e) | – | 06/03/2031 | 3,959 | 3,942,245 | ||||||||||||
AssuredPartners, Inc., Term Loan (1 mo. Term SOFR + 3.50%) | 8.75% | 02/14/2031 | 8,858 | 8,884,546 | ||||||||||||
AVS (Ramudden Global), Term Loan (3 mo. EURIBOR + 4.25%) | 7.88% | 12/12/2029 | EUR | 2,000 | 2,208,821 | |||||||||||
Broadstreet Partners, Inc., Term Loan B | 0.00% | 06/13/2031 | 8,799 | 8,806,556 | ||||||||||||
Edelman Financial Center LLC (The) | ||||||||||||||||
Term Loan (1 mo. Term SOFR + 5.25%) | 10.50% | 10/06/2028 | 610 | 609,770 | ||||||||||||
Term Loan B (1 mo. Term SOFR + 3.25%) | 8.50% | 04/07/2028 | 8,565 | 8,584,194 | ||||||||||||
Eisner Advisory Group LLC, Incremental Term Loan (1 mo. Term SOFR + 4.00%) | 9.25% | 02/28/2031 | 6,126 | 6,152,097 | ||||||||||||
Grant Thornton Advisors LLC, Term Loan B | 0.00% | 06/02/2031 | 6,450 | 6,479,219 | ||||||||||||
LendingTree, Inc., Term Loan B (1 mo. Term SOFR + 4.11%) | 9.36% | 09/15/2028 | 10,838 | 10,783,350 | ||||||||||||
Tegra118 Wealth Solutions, Inc., Term Loan (3 mo. Term SOFR + 4.00%) | 9.13% | 02/18/2027 | 6,562 | 6,318,594 | ||||||||||||
Tricor (Thevelia / Vistra-Virtue), Term Loan (3 mo. Term SOFR + 3.25%) | 8.51% | 06/18/2029 | 9,483 | 9,556,102 | ||||||||||||
| 72,325,494 | ||||||||||||||||
Food Products–2.58% | ||||||||||||||||
Arnott’s (Snacking Investments US LLC), Term Loan (1 mo. Term SOFR + 4.00%) | 9.25% | 12/18/2026 | 6,714 | 6,758,197 | ||||||||||||
Biscuit Holding S.A.S. (BISPOU/Cookie Acq) (France), Term Loan B (6 mo. EURIBOR + 4.00%) | 7.86% | 02/12/2027 | EUR | 6,666 | 6,942,733 | |||||||||||
Florida Food Products LLC | ||||||||||||||||
First Lien Term Loan (1 mo. Term SOFR + 5.00%) | 10.25% | 10/18/2028 | 3,520 | 3,097,618 | ||||||||||||
First Lien Term Loan (1 mo. Term SOFR + 5.11%) | 10.36% | 10/18/2028 | 14,777 | 13,102,636 | ||||||||||||
Second Lien Term Loan (1 mo. Term SOFR + 8.11%)(d) | 13.36% | 10/18/2029 | 2,864 | 1,932,958 | ||||||||||||
Mosel Bidco SE (Alphia) (Germany), Term Loan B (3 mo. Term SOFR + 5.19%) | 10.25% | 10/02/2030 | 3,786 | 3,564,667 | ||||||||||||
Nomad Foods Ltd. (United Kingdom), Term Loan B-4 (6 mo. Term SOFR + 2.51%) | 7.81% | 11/13/2029 | 4,871 | 4,880,205 | ||||||||||||
Shearer’s Foods LLC, Term Loan (1 mo. Term SOFR + 4.00%) | 9.25% | 02/12/2031 | 6,653 | 6,700,678 | ||||||||||||
Sigma Holdco B.V. (Netherlands) | ||||||||||||||||
Term Loan B-10 (6 mo. Term SOFR + 4.41%) | 9.77% | 01/03/2028 | 9,780 | 9,777,483 | ||||||||||||
Term Loan B-9 (3 mo. EURIBOR + 4.50%) | 8.18% | 01/03/2028 | EUR | 8,800 | 9,733,112 | |||||||||||
See accompanying Notes to Consolidated Financial Statements which are an integral part of the financial statements.
| 7 | Invesco Floating Rate ESG Fund |
| Interest Rate | Maturity Date | Principal Amount (000)(a) | Value | |||||||||||||
Food Products–(continued) | ||||||||||||||||
Solina Group Services (Powder Bidco) (France), Term Loan (3 mo. Term SOFR + 3.75%) | 9.09% | 03/07/2029 | $ | 2,250 | $ 2,259,931 | |||||||||||
| 68,750,218 | ||||||||||||||||
Food Service–0.54% | ||||||||||||||||
Areas (Pax Midco Spain) | ||||||||||||||||
Term Loan B-2 (3 mo. EURIBOR + 5.00%) | 0.00% | 12/31/2029 | EUR | 3,906 | 4,312,802 | |||||||||||
Term Loan B-2 (3 mo. EURIBOR + 5.00%) | 8.74% | 12/31/2029 | EUR | 7,572 | 8,360,282 | |||||||||||
Euro Garages (Netherlands), Term Loan (3 mo. Term SOFR + 4.51%) | 0.00% | 03/31/2026 | 406 | 405,978 | ||||||||||||
IRB Holding Corp., Term Loan B (1 mo. Term SOFR + 2.85%) | 8.10% | 12/15/2027 | 1,278 | 1,280,231 | ||||||||||||
| 14,359,293 | ||||||||||||||||
Forest Products–0.16% | ||||||||||||||||
NewLife Forest Restoration LLC, Term Loan | – | 04/10/2029 | 4,272 | 4,271,645 | ||||||||||||
Health Care–3.91% | ||||||||||||||||
Acacium (Impala Bidco Ltd.) (United Kingdom), Incremental Term Loan B (1 mo. Term SOFR + 4.85%)(d) | 10.18% | 06/08/2028 | 2,922 | 2,790,734 | ||||||||||||
Ascend Learning LLC, First Lien Term Loan (1 mo. Term SOFR + 3.60%) | 8.85% | 12/11/2028 | 10,816 | 10,813,449 | ||||||||||||
Bracket Intermediate Holding Corp. (Signant), First Lien Term Loan (3 mo. Term SOFR + 5.10%) | 10.43% | 05/08/2028 | 3,431 | 3,450,229 | ||||||||||||
Cerba (Chrome Bidco) (France) | ||||||||||||||||
Incremental Term Loan C (1 mo. EURIBOR + 3.95%) | 7.29% | 02/16/2029 | EUR | 1,681 | 1,705,816 | |||||||||||
Term Loan B (1 mo. EURIBOR + 3.70%) | 7.29% | 06/30/2028 | EUR | 6,000 | 6,065,860 | |||||||||||
Certara Holdco, Inc., Term Loan B (1 mo. Term SOFR + 3.00%)(d) | 8.25% | 06/26/2031 | 450 | 450,069 | ||||||||||||
Curium BidCo S.a.r.l. (Luxembourg), Term Loan (3 mo. Term SOFR + 4.00%) | 9.33% | 07/31/2029 | 573 | 576,245 | ||||||||||||
Ethypharm (Financiere Verdi, Orphea Ltd.) (France), Term Loan B (3 mo. SONIA + 4.50%) | 9.70% | 04/17/2028 | GBP | 1,119 | 1,362,924 | |||||||||||
Explorer Holdings, Inc., Term Loan (1 mo. Term SOFR + 4.00%) | 9.25% | 02/04/2027 | 12,728 | 12,814,079 | ||||||||||||
Global Medical Response, Inc., Term Loan (3 mo. Term SOFR + 5.50%) | 10.84% | 10/31/2028 | 13,981 | 13,927,254 | ||||||||||||
ICU Medical, Inc., Term Loan B (3 mo. Term SOFR + 2.65%) | 7.98% | 01/08/2029 | 622 | 622,244 | ||||||||||||
International SOS L.P. (AEA International), Term Loan B (3 mo. Term SOFR + 2.75%) | 8.03% | 09/07/2028 | 6,982 | 7,003,333 | ||||||||||||
IVC Evidensia (Indep Vetcare Group) (United Kingdom), Term Loan B (3 mo. Term SOFR + 4.75%) | 10.08% | 12/12/2028 | 566 | 566,780 | ||||||||||||
MB2 Dental Solutions LLC, Revolver Loan(d)(f) | 0.00% | 02/15/2031 | 134 | 134,264 | ||||||||||||
MB2 Dental Solutions LLC | ||||||||||||||||
Delayed Draw Term Loan(d)(f) | 0.00% | 02/15/2031 | 1,428 | 1,429,771 | ||||||||||||
Delayed Draw Term Loan(d)(f) | 0.00% | 02/15/2031 | 857 | 857,862 | ||||||||||||
Revolver Loan (3 mo. Term SOFR + 6.33%)(d) | 11.25% | 02/15/2031 | 151 | 151,404 | ||||||||||||
Term Loan (1 mo. Term SOFR + 6.00%)(d) | 11.25% | 02/15/2031 | 4,115 | 4,118,854 | ||||||||||||
MedAssets Software Intermediate Holdings, Inc. (nThrive TSG) | ||||||||||||||||
First Lien Term Loan (1 mo. Term SOFR + 4.11%) (Acquired 01/07/2022-06/26/2024; Cost $7,437,016)(g) | 9.36% | 12/18/2028 | 7,904 | 5,488,393 | ||||||||||||
Second Lien Term Loan (1 mo. Term SOFR + 6.75%) (Acquired 11/19/2021-12/16/2021; Cost $1,974,215)(g) | 12.11% | 12/17/2029 | 1,991 | 874,569 | ||||||||||||
Organon & Co., Term Loan B (1 mo. Term SOFR + 2.50%) | 7.84% | 05/19/2031 | 9,866 | 9,934,018 | ||||||||||||
PAREXEL International Corp., Term Loan B (1 mo. Term SOFR + 3.00%) | 8.25% | 11/15/2028 | 1,120 | 1,125,924 | ||||||||||||
Sharp Services LLC, Term Loan (3 mo. Term SOFR + 3.75%)(d) | 9.08% | 12/31/2028 | 590 | 591,634 | ||||||||||||
Summit Behavioral Healthcare LLC, Term Loan B (3 mo. Term SOFR + 4.25%)(d) | 9.31% | 11/24/2028 | 1,332 | 1,292,480 | ||||||||||||
TEAM Services Group, LLC, Term Loan B (1 mo. Term SOFR + 5.31%) | 10.65% | 12/20/2027 | 5,159 | 5,090,861 | ||||||||||||
TTF Holdings, LLC (Soliant), Term Loan B (1 mo. Term SOFR + 3.75%) | 9.00% | 07/18/2031 | 9,304 | 9,327,026 | ||||||||||||
Veonet Lense GmbH (BLIVEO) (Germany), Incremental Term Loan B (3 mo. EURIBOR + 4.50%) | 7.97% | 03/14/2029 | EUR | 282 | 313,342 | |||||||||||
Waystar (fka Navicure, Inc.), Term Loan B (1 mo. Term SOFR + 2.75%) | 8.00% | 10/22/2029 | 202 | 203,439 | ||||||||||||
Zelis Cost Management Buyer, Inc., Term Loan B-2 (1 mo. Term SOFR + 2.75%) | 8.00% | 09/28/2029 | 984 | 986,796 | ||||||||||||
| 104,069,653 | ||||||||||||||||
See accompanying Notes to Consolidated Financial Statements which are an integral part of the financial statements.
| 8 | Invesco Floating Rate ESG Fund |
| Interest Rate | Maturity Date | Principal Amount (000)(a) | Value | |||||||||||||
Home Furnishings–1.41% | ||||||||||||||||
Hilding Anders AB (Sweden) | ||||||||||||||||
Term Loan (6 mo. EURIBOR + 10.00%) (Acquired 04/27/2023-07/17/2023; Cost $100,141)(d)(g) | 13.83% | 12/31/2026 | EUR | 96 | $ 105,769 | |||||||||||
Term Loan (6 mo. EURIBOR + 10.00%) (Acquired 09/26/2023-10/30/2023; Cost $139,414)(d)(g) | 13.84% | 12/31/2026 | EUR | 132 | 145,753 | |||||||||||
Homeserve USA Holding Corp., Term Loan B (1 mo. Term SOFR + 2.50%) | 7.84% | 10/21/2030 | $ | 4,382 | 4,394,267 | |||||||||||
Mattress Holding Corp., Term Loan (3 mo. Term SOFR + 4.51%) | 9.85% | 09/25/2028 | 10,818 | 10,835,439 | ||||||||||||
Serta Simmons Bedding LLC | ||||||||||||||||
First Lien Term Loan (3 mo. Term SOFR + 7.66%)(d) | 12.89% | 06/29/2028 | 703 | 701,594 | ||||||||||||
Term Loan (3 mo. Term SOFR + 7.61%) | 12.95% | 06/29/2028 | 9,641 | 7,895,621 | ||||||||||||
SIWF Holdings, Inc., Term Loan B (1 mo. Term SOFR + 4.11%) | 9.36% | 10/06/2028 | 8,507 | 6,481,514 | ||||||||||||
Weber-Stephen Products LLC | ||||||||||||||||
Incremental Term Loan B (1 mo. Term SOFR + 4.35%) | 9.60% | 10/30/2027 | 1,706 | 1,601,225 | ||||||||||||
Term Loan B (1 mo. Term SOFR + 3.36%) | 8.61% | 10/30/2027 | 5,757 | 5,407,809 | ||||||||||||
| 37,568,991 | ||||||||||||||||
Industrial Equipment–5.09% | ||||||||||||||||
Alliance Laundry Systems LLC, Term Loan B (1 mo. Term SOFR + 3.50%) | 8.81% | 08/09/2031 | 12,937 | 12,990,961 | ||||||||||||
Chart Industries, Inc., Term Loan B (3 mo. Term SOFR + 2.50%) | 7.82% | 03/15/2030 | 3,563 | 3,577,784 | ||||||||||||
Crosby US Acquisition Corp., Term Loan (1 mo. Term SOFR + 4.00%) | 9.25% | 08/16/2029 | 2,906 | 2,923,484 | ||||||||||||
Deliver Buyer, Inc. (MHS Holdings), Term Loan (3 mo. Term SOFR + 5.50%) | 10.83% | 06/01/2029 | 9,757 | 8,861,687 | ||||||||||||
DXP Enterprises, Inc., Incremental Term Loan (6 mo. Term SOFR + 4.85%) | 10.16% | 10/11/2030 | 5,360 | 5,398,063 | ||||||||||||
EMRLD Borrower L.P. (Copeland) | ||||||||||||||||
Incremental Term Loan B (3 mo. Term SOFR + 2.50%) | 7.56% | 08/04/2031 | 5,469 | 5,475,799 | ||||||||||||
Term Loan B (3 mo. Term SOFR + 2.50%) | 7.56% | 05/31/2030 | 6,305 | 6,311,011 | ||||||||||||
Kantar (Summer BC Bidco/KANGRP) (United Kingdom) | ||||||||||||||||
Revolver Loan (3 mo. Term SOFR + 1.05%)(d) | 0.00% | 06/04/2026 | 458 | 423,735 | ||||||||||||
Revolver Loan(d)(f) | 0.00% | 06/04/2026 | 6,542 | 6,051,265 | ||||||||||||
Term Loan B (3 mo. Term SOFR + 5.26%) | 10.59% | 02/05/2029 | 9,363 | 9,432,712 | ||||||||||||
Madison IAQ LLC, Term Loan (6 mo. Term SOFR + 2.75%) | 7.89% | 06/21/2028 | 83 | 83,547 | ||||||||||||
Minimax (-Viking GmbH, -MX Holdings US, Inc.), Term Loan B-1D (1 mo. Term SOFR + 2.86%) | 8.11% | 07/31/2028 | 490 | 493,575 | ||||||||||||
Robertshaw US Holding Corp. | ||||||||||||||||
First Lien Term Loan (Acquired 05/10/2023-10/17/2023; Cost $18,718,230)(d)(g)(i)(j)(k) | 0.00% | 02/28/2027 | 18,854 | 17,892,550 | ||||||||||||
Second Lien Term Loan (Acquired 05/09/2023-07/14/2023; Cost $12,849,389)(d)(g)(i)(j)(k) | 0.00% | 02/28/2027 | 21,293 | 13,499,541 | ||||||||||||
Third Lien Term Loan (Acquired 05/09/2023; Cost $1,306,662)(d)(g)(i)(j)(k) | 0.00% | 02/28/2027 | 4,778 | 2,436,774 | ||||||||||||
STS Operating, Inc. (Sunsource), Term Loan (1 mo. Term SOFR + 4.01%) | 9.35% | 03/25/2031 | 6,999 | 6,975,793 | ||||||||||||
Tank Holding Corp. | ||||||||||||||||
Revolver Loan (1 mo. Term SOFR + 5.85%)(d) | 11.10% | 03/31/2028 | 851 | 825,830 | ||||||||||||
Revolver Loan(d)(f) | 0.00% | 03/31/2028 | 851 | 825,831 | ||||||||||||
Term Loan (1 mo. Term SOFR + 5.85%) | 11.10% | 03/31/2028 | 14,767 | 14,598,891 | ||||||||||||
Thyssenkrupp Elevators (Vertical Midco GmbH) (Germany), Term Loan B-2 (6 mo. Term SOFR + 3.50%) | 8.59% | 04/30/2030 | 6,697 | 6,728,379 | ||||||||||||
Victory Buyer LLC (Vantage Elevator) | ||||||||||||||||
First Lien Term Loan (1 mo. Term SOFR + 3.86%) | 9.14% | 11/19/2028 | 9,481 | 9,141,095 | ||||||||||||
Second Lien Term Loan (1 mo. Term SOFR + 7.11%)(d) | 12.37% | 11/19/2029 | 789 | 680,584 | ||||||||||||
| 135,628,891 | ||||||||||||||||
Insurance–2.94% | ||||||||||||||||
Acrisure LLC, Term Loan B-6 (3 mo. Term SOFR + 3.25%) | 8.59% | 11/06/2030 | 16,417 | 16,341,105 | ||||||||||||
Alliant Holdings Intermediate LLC, Term Loan B-6 (1 mo. Term SOFR + 3.50%) | 8.81% | 11/06/2030 | 9,584 | 9,624,452 | ||||||||||||
AmWINS Group LLC, Term Loan (1 mo. Term SOFR + 2.36%) | 7.61% | 02/19/2028 | 1,190 | 1,193,783 | ||||||||||||
Hub International Ltd., Term Loan (3 mo. Term SOFR + 3.00%) | 8.23% | 06/20/2030 | 4,923 | 4,931,007 | ||||||||||||
Ryan Specialty Group LLC, Term Loan (1 mo. Term SOFR + 2.75%) | 8.00% | 09/01/2027 | 7,526 | 7,572,408 | ||||||||||||
Sedgwick Claims Management Services, Inc., Term Loan (3 mo. Term SOFR + 3.00%) | 8.25% | 07/31/2031 | 15,184 | 15,221,510 | ||||||||||||
Truist Insurance Holdings, Term Loan B (3 mo. Term SOFR + 3.25%) | 8.58% | 05/06/2031 | 7,818 | 7,838,328 | ||||||||||||
See accompanying Notes to Consolidated Financial Statements which are an integral part of the financial statements.
| 9 | Invesco Floating Rate ESG Fund |
| Interest Rate | Maturity Date | Principal Amount (000)(a) | Value | |||||||||||||
Insurance–(continued) | ||||||||||||||||
USI, Inc. | ||||||||||||||||
Term Loan (1 mo. Term SOFR + 2.75%) | 8.08% | 09/27/2030 | $ | 4,250 | $ 4,255,583 | |||||||||||
Term Loan B (3 mo. USD LIBOR + 2.75%) | 8.08% | 11/22/2029 | 11,231 | 11,247,491 | ||||||||||||
| 78,225,667 | ||||||||||||||||
Leisure Goods, Activities & Movies–3.12% | ||||||||||||||||
Carnival Corp. | ||||||||||||||||
Term Loan B (1 mo. Term SOFR + 2.75%) | 8.00% | 08/08/2027 | 1,981 | 1,992,342 | ||||||||||||
Term Loan B (1 mo. Term SOFR + 2.75%) | 8.00% | 10/18/2028 | 14,390 | 14,456,741 | ||||||||||||
Crown Finance US, Inc., Term Loan (1 mo. Term SOFR + 1.61%) | 6.86% | 07/31/2028 | 10,680 | 10,871,737 | ||||||||||||
Fitness International LLC, Term Loan B (3 mo. Term SOFR + 5.25%)(d) | 10.53% | 02/05/2029 | 6,434 | 6,425,828 | ||||||||||||
GBT Group Servicers B.V. (United Kingdom), Term Loan B (3 mo. Term SOFR + 3.00%) | 8.28% | 07/25/2031 | 5,026 | 5,035,826 | ||||||||||||
Lakeland Tours LLC, Term Loan (6 mo. Term SOFR + 8.00%)(d) | 8.00% | 09/25/2027 | 1,123 | 224,497 | ||||||||||||
LC Ahab US Bidco LLC, Term Loan B (1 mo. Term SOFR + 3.50%) | 8.75% | 05/01/2031 | 2,402 | 2,414,016 | ||||||||||||
Nord Anglia Education | ||||||||||||||||
Term Loan (3 mo. Term SOFR + 4.00%) | 9.06% | 01/31/2028 | 4,004 | 4,036,843 | ||||||||||||
Term Loan B-2 (3 mo. Term SOFR + 3.75%) | 8.81% | 02/26/2031 | 2,205 | 2,225,453 | ||||||||||||
Parques Reunidos (Piolin Bidco S.A.U.) (Spain) | ||||||||||||||||
Revolver Loan(d)(e) | – | 03/16/2026 | EUR | 1,494 | 1,638,242 | |||||||||||
Revolver Loan(d)(f) | 0.00% | 03/16/2026 | EUR | 4,106 | 4,503,355 | |||||||||||
Scenic (Columbus Capital B.V.) (Australia), Term Loan (3 mo. EURIBOR + 3.75%) | 7.47% | 03/05/2027 | EUR | 11,390 | 11,961,345 | |||||||||||
Seaworld Parks & Entertainment, Inc., Term Loan B-2 (1 mo. Term SOFR + 2.50%) | 7.75% | 08/25/2028 | 2,567 | 2,571,692 | ||||||||||||
Vue International Bidco PLC (United Kingdom) | ||||||||||||||||
Second Lien Term Loan (Acquired 02/20/2024-08/13/2024; Cost $3,034,093)(g) | 0.00% | 12/31/2027 | EUR | 4,701 | 2,832,161 | |||||||||||
Term Loan (6 mo. EURIBOR + 8.00%) (Acquired 09/22/2022-02/20/2024; Cost $2,281,497)(g) | 0.00% | 06/30/2027 | EUR | 2,229 | 2,443,248 | |||||||||||
Term Loan (1 mo. EURIBOR + 8.00%) (Acquired 02/20/2024-04/08/2024; Cost $1,348,340)(g) | 11.84% | 06/30/2027 | EUR | 1,301 | 1,505,475 | |||||||||||
Term Loan (Acquired 02/20/2024-08/13/2024; Cost $3,046,660)(g) | 0.00% | 12/31/2027 | EUR | 2,899 | 3,035,945 | |||||||||||
World Choice Investments, Term Loan B (3 mo. Term SOFR + 4.75%) (Acquired 08/13/2024; Cost $4,874,394)(g) | 9.87% | 08/13/2031 | 4,948 | 4,939,153 | ||||||||||||
| 83,113,899 | ||||||||||||||||
Lodging & Casinos–0.70% | ||||||||||||||||
Aimbridge Acquisition Co., Inc. | ||||||||||||||||
First Lien Term Loan (1 mo. Term SOFR + 3.86%) | 9.11% | 02/02/2026 | 6,421 | 6,283,550 | ||||||||||||
First Lien Term Loan (1 mo. Term SOFR + 4.86%) | 10.11% | 02/02/2026 | 1,389 | 1,366,121 | ||||||||||||
Hilton Grand Vacations Borrower LLC, Term Loan (1 mo. Term SOFR + 2.50%) | 7.75% | 08/02/2028 | 6,373 | 6,377,224 | ||||||||||||
Travel + Leisure Co., Incremental Term Loan (1 mo. Term SOFR + 3.35%) | 8.66% | 12/14/2029 | 4,528 | 4,543,749 | ||||||||||||
| 18,570,644 | ||||||||||||||||
Nonferrous Metals & Minerals–0.85% | ||||||||||||||||
AZZ, Inc., Term Loan (1 mo. Term SOFR + 3.25%) | 8.50% | 05/14/2029 | 6,792 | 6,849,551 | ||||||||||||
Covia Holdings Corp., Term Loan (3 mo. Term SOFR + 4.26%) | 9.58% | 07/31/2026 | 13,411 | 13,350,045 | ||||||||||||
Form Technologies LLC, First Lien Term Loan (3 mo. Term SOFR + 9.35%) | 14.41% | 10/22/2025 | 2,073 | 1,658,677 | ||||||||||||
SCIH Salt Holdings, Inc. (Kissner Group), First Lien Incremental Term Loan B-1 (3 mo. Term SOFR + 3.50%) | 8.76% | 03/16/2027 | 751 | 752,712 | ||||||||||||
| 22,610,985 | ||||||||||||||||
Oil & Gas–1.60% | ||||||||||||||||
Brazos Delaware II LLC, Term Loan B (6 mo. Term SOFR + 3.50%) | 8.25% | 02/11/2030 | 3,564 | 3,592,469 | ||||||||||||
GIP Pilot Acquisition Partners, L.P. (Global Infrastructure), Term Loan (3 mo. Term SOFR + 2.50%) | 7.82% | 10/04/2030 | 3,493 | 3,510,028 | ||||||||||||
ITT Holdings LLC (IMTT), Term Loan B (1 mo. Term SOFR + 3.00%) | 8.35% | 10/11/2030 | 3,804 | 3,818,689 | ||||||||||||
See accompanying Notes to Consolidated Financial Statements which are an integral part of the financial statements.
| 10 | Invesco Floating Rate ESG Fund |
| Interest Rate | Maturity Date | Principal Amount (000)(a) | Value | |||||||||||||
Oil & Gas–(continued) | ||||||||||||||||
McDermott International Ltd. | ||||||||||||||||
LOC(d)(f) | 0.00% | 12/31/2026 | $ | 2,256 | $ 2,064,526 | |||||||||||
LOC (3 mo. Term SOFR + 5.01%)(d) | 0.50% | 12/31/2026 | 525 | 480,224 | ||||||||||||
LOC (3 mo. Term SOFR)(d) | 0.50% | 06/30/2027 | 4,210 | 2,841,992 | ||||||||||||
LOC (3 mo. Term SOFR + 4.26%)(d) | 4.15% | 06/30/2027 | 2,275 | 1,239,689 | ||||||||||||
PIK Term Loan B, 3.00% PIK Rate, 6.36% Cash Rate(h) | 6.46% | 12/31/2027 | 1,872 | 724,016 | ||||||||||||
Term Loan (3 mo. Term SOFR + 7.76%)(d) | 13.10% | 12/31/2026 | 1,740 | 1,774,473 | ||||||||||||
Term Loan (1 mo. Term SOFR + 3.11%) | 8.36% | 06/30/2027 | 550 | 295,606 | ||||||||||||
PG Investment Co. 59 S.a.r.l./URSA Minor US Bidco LLC (Rosen), Term Loan B (3 mo. Term SOFR + 3.50%) | 8.83% | 03/26/2031 | 5,602 | 5,626,939 | ||||||||||||
Planet US Buyer LLC (Wood Mackenzie), Term Loan (3 mo. Term SOFR + 3.50%) | 8.60% | 02/07/2031 | 4,902 | 4,938,327 | ||||||||||||
Rockwood Service Corp., Term loan B (3 mo. Term SOFR + 3.69%) | 8.75% | 07/23/2031 | 1,305 | 1,311,692 | ||||||||||||
TransMontaigne Partners LLC, Term Loan B (1 mo. Term SOFR + 3.61%) | 8.86% | 11/17/2028 | 10,260 | 10,326,792 | ||||||||||||
| 42,545,462 | ||||||||||||||||
Publishing–2.32% | ||||||||||||||||
Cengage Learning, Inc., Term Loan B (6 mo. Term SOFR + 4.25%) | 9.54% | 03/22/2031 | 13,921 | 13,985,174 | ||||||||||||
Century DE Buyer LLC (Simon & Schuster), Term Loan (1 mo. Term SOFR + 4.01%) | 9.26% | 10/30/2030 | 3,653 | 3,668,931 | ||||||||||||
Dotdash Meredith, Inc., Term Loan B (1 mo. Term SOFR + 4.10%) | 9.44% | 12/01/2028 | 12,668 | 12,691,347 | ||||||||||||
Harbor Purchaser, Inc. (Houghton Mifflin Harcourt) | ||||||||||||||||
First Lien Term Loan B (1 mo. Term SOFR + 5.35%) | 10.60% | 04/09/2029 | 10,663 | 10,135,082 | ||||||||||||
Second Lien Term Loan B (1 mo. Term SOFR + 8.50%) | 13.75% | 04/08/2030 | 8,460 | 8,001,356 | ||||||||||||
McGraw-Hill Education, Inc., Term Loan B (3 mo. Term SOFR + 4.00%) | 9.23% | 08/01/2031 | 11,042 | 11,096,987 | ||||||||||||
Micro Holding L.P., Term Loan (1 mo. Term SOFR + 4.25%) | 9.50% | 05/03/2028 | 2,200 | 2,197,119 | ||||||||||||
| 61,775,996 | ||||||||||||||||
Radio & Television–0.45% | ||||||||||||||||
iHeartCommunications, Inc. | ||||||||||||||||
Incremental Term Loan (1 mo. Term SOFR + 3.36%) | 8.61% | 05/01/2026 | 1,115 | 936,421 | ||||||||||||
Term Loan (1 mo. Term SOFR + 3.11%) | 8.36% | 05/01/2026 | 4,455 | 3,728,653 | ||||||||||||
Nexstar Broadcasting, Inc., Term Loan B (1 mo. Term SOFR + 2.61%) | 7.96% | 06/02/2028 | 2,406 | 2,397,418 | ||||||||||||
Sinclair Television Group, Inc. | ||||||||||||||||
Term Loan B-3 (3 mo. Term SOFR + 3.26%) | 8.51% | 04/01/2028 | 338 | 242,672 | ||||||||||||
Term Loan B-4 (1 mo. Term SOFR + 3.85%) | 9.10% | 04/21/2029 | 55 | 38,414 | ||||||||||||
Univision Communications, Inc., Incremental Term Loan B (1 mo. Term SOFR + 3.50%) | 8.86% | 01/23/2029 | 4,698 | 4,570,010 | ||||||||||||
| 11,913,588 | ||||||||||||||||
Retailers (except Food & Drug)–1.03% | ||||||||||||||||
Action Holding B.V. (Netherlands), Term Loan B-4 (3 mo. Term SOFR + 3.25%) | 8.58% | 10/28/2030 | 6,998 | 7,033,277 | ||||||||||||
Action Holding B.V. (Peer Holdings) (Netherlands), Term Loan B-5 (3 mo. Term SOFR + 3.00%) | 8.33% | 06/20/2031 | 5,136 | 5,159,612 | ||||||||||||
CNT Holdings I Corp. (1-800 Contacts), First Lien Term Loan (3 mo. Term SOFR + 3.50%) | 8.75% | 11/08/2027 | 8,469 | 8,503,862 | ||||||||||||
Savers, Inc., Term Loan (3 mo. Term SOFR + 3.75%) | 9.08% | 04/26/2028 | 6,875 | 6,891,878 | ||||||||||||
| 27,588,629 | ||||||||||||||||
Surface Transport–1.16% | ||||||||||||||||
First Student Bidco, Inc. | ||||||||||||||||
Incremental Term Loan B (3 mo. Term SOFR + 3.10%) | 8.43% | 11/01/2030 | 12,850 | 12,901,118 | ||||||||||||
Term Loan B (3 mo. Term SOFR + 3.26%) | 8.60% | 07/21/2028 | 4,218 | 4,233,440 | ||||||||||||
Term Loan C (3 mo. Term SOFR + 3.26%) | 8.60% | 07/21/2028 | 1,286 | 1,291,001 | ||||||||||||
Hurtigruten Group A/S (Explorer II AS) (Norway) | ||||||||||||||||
Term Loan A (3 mo. Term SOFR +8.50%) (Acquired 02/23/2024-08/23/2024; Cost $6,535,565)(g) | 12.41% | 02/22/2029 | EUR | 13,789 | 1,567,113 | |||||||||||
Term Loan B-2 (3 mo. EURIBOR +7.00%) (Acquired 02/23/2024-08/23/2024; Cost $3,322,731)(g) | 10.54% | 09/30/2027 | EUR | 3,284 | 2,704,559 | |||||||||||
PODS LLC, Incremental Term Loan (3 mo. Term SOFR + 4.26%) | 8.50% | 03/31/2028 | 4,283 | 4,053,157 | ||||||||||||
Reception Purchaser LLC (STG - XPOI Opportunity), Term Loan (3 mo. Term SOFR + 6.15%) | 11.48% | 03/24/2028 | 8,309 | 4,043,808 | ||||||||||||
See accompanying Notes to Consolidated Financial Statements which are an integral part of the financial statements.
| 11 | Invesco Floating Rate ESG Fund |
| Interest Rate | Maturity Date | Principal Amount (000)(a) | Value | |||||||||||||
Surface Transport–(continued) | ||||||||||||||||
Reception Purchaser, LLC (STG - XPOI Opportunity), Incremental Term Loan (3 mo. Term SOFR + 6.15%) | 13.50% | 03/24/2028 | $ | 51 | $ 24,758 | |||||||||||
| 30,818,954 | ||||||||||||||||
Telecommunications–3.90% | ||||||||||||||||
Avaya, Inc., Term Loan (1 mo. Term SOFR + 7.50%) | 12.75% | 08/01/2028 | 8,805 | 7,863,282 | ||||||||||||
Cablevision Lightpath LLC, Term Loan (1 mo. Term SOFR + 3.36%) | 8.70% | 11/30/2027 | 4,884 | 4,868,920 | ||||||||||||
CCI Buyer, Inc. (Consumer Cellular), First Lien Term Loan (3 mo. Term SOFR + 4.00%) | 9.33% | 12/17/2027 | 8,735 | 8,762,042 | ||||||||||||
Crown Subsea Communications Holding, Inc., Term Loan B (3 mo. Term SOFR + 4.00%) | 9.25% | 01/30/2031 | 11,796 | 11,895,269 | ||||||||||||
Eagle Broadband Investments LLC (Mega Broadband), Term Loan (3 mo. Term SOFR + 3.26%) | 8.60% | 11/12/2027 | 757 | 755,409 | ||||||||||||
Genesys Cloud Services Holdings I LLC | ||||||||||||||||
Incremental Term Loan (1 mo. Term SOFR + 3.86%) | 9.11% | 12/01/2027 | 1,746 | 1,757,048 | ||||||||||||
Term Loan B (1 mo. Term SOFR + 3.50%) | 8.75% | 12/01/2027 | 232 | 233,427 | ||||||||||||
II-VI, Inc., Term Loan B-1 (1 mo. Term SOFR + 2.50%) | 7.75% | 07/02/2029 | 3,759 | 3,777,788 | ||||||||||||
Inmarsat Finance PLC (United Kingdom), Term Loan B (1 mo. Term SOFR + 4.50%) | 9.75% | 09/27/2029 | 10,425 | 10,167,374 | ||||||||||||
Iridium Satellite LLC, Term Loan B (1 mo. Term SOFR + 2.25%) | 7.50% | 09/20/2030 | 2,717 | 2,711,107 | ||||||||||||
Lumen Technologies, Inc. | ||||||||||||||||
Term Loan B-1 (1 mo. Term SOFR + 2.46%) | 7.74% | 04/15/2030 | 641 | 519,549 | ||||||||||||
Term Loan B-2 (1 mo. Term SOFR + 2.46%) | 7.74% | 04/15/2029 | 1,265 | 999,996 | ||||||||||||
Midcontinent Communications, Term Loan B(d)(e) | – | 08/13/2031 | 4,848 | 4,853,854 | ||||||||||||
MLN US HoldCo LLC (dba Mitel) | ||||||||||||||||
First Lien Term Loan B (3 mo. Term SOFR + 4.60%) | 0.00% | 11/30/2025 | 328 | 20,471 | ||||||||||||
Second Lien Term Loan B (3 mo. Term SOFR + 8.85%) | 0.00% | 11/30/2026 | 215 | 16,135 | ||||||||||||
Second Lien Term Loan B-1 (3 mo. Term SOFR + 6.80%) | 12.08% | 10/18/2027 | 32,765 | 3,604,109 | ||||||||||||
Term Loan (3 mo. Term SOFR + 6.54%) | 11.82% | 10/18/2027 | 14,256 | 8,571,362 | ||||||||||||
Third Lien Term Loan (3 mo. Term SOFR + 9.35%) | 14.63% | 10/18/2027 | 8,144 | 542,087 | ||||||||||||
Telesat LLC, Term Loan B-5 (3 mo. Term SOFR + 3.01%) | 8.07% | 12/07/2026 | 10,390 | 5,006,908 | ||||||||||||
ViaSat, Inc. | ||||||||||||||||
Term Loan (1 mo. Term SOFR + 4.50%) | 9.75% | 03/02/2029 | 8,147 | 7,636,536 | ||||||||||||
Term Loan B (1 mo. Term SOFR + 4.61%) | 9.94% | 05/30/2030 | 5,483 | 5,119,084 | ||||||||||||
Voyage Digital (NC) Ltd., Term Loan (3 mo. Term SOFR + 3.25%)(d) | 8.35% | 05/11/2029 | 7,331 | 7,358,483 | ||||||||||||
Windstream Services LLC, Term Loan (1 mo. Term SOFR + 6.35%) | 11.60% | 09/21/2027 | 6,832 | 6,896,287 | ||||||||||||
| 103,936,527 | ||||||||||||||||
Utilities–2.53% | ||||||||||||||||
Brookfield WEC Holdings, Inc., First Lien Term Loan (1 mo. Term SOFR + 2.75%) | 8.00% | 01/27/2031 | 13,599 | 13,625,827 | ||||||||||||
Covanta Holding Corp. | ||||||||||||||||
Incremental Term Loan B (1 mo. Term SOFR + 2.75%) | 8.09% | 11/30/2028 | 3,555 | 3,565,613 | ||||||||||||
Incremental Term Loan C (1 mo. Term SOFR + 2.75%) | 8.09% | 11/30/2028 | 194 | 194,842 | ||||||||||||
Eastern Power LLC, Term Loan (1 mo. USD LIBOR + 3.75%) | 10.50% | 04/03/2028 | 4,630 | 4,643,033 | ||||||||||||
Edgewater Generation, Term Loan (1 mo. Term SOFR + 4.25%) | 9.50% | 08/01/2030 | 5,225 | 5,278,321 | ||||||||||||
Generation Bridge Northeast LLC, Term Loan B (1 mo. Term SOFR + 3.50%) | 8.75% | 08/22/2029 | 4,054 | 4,092,994 | ||||||||||||
Hamilton Projects Acquiror LLC, Term Loan B | 0.00% | 05/22/2031 | 2,217 | 2,238,476 | ||||||||||||
KAMC Holdings, Inc. (Franklin Energy Group), First Lien Term Loan B (1 mo. Term SOFR + 3.75%) | 9.32% | 08/14/2026 | 5,356 | 5,321,763 | ||||||||||||
Lightning Power, LLC, Term Loan B (3 mo. Term SOFR + 3.25%) | 8.35% | 08/07/2031 | 10,479 | 10,527,713 | ||||||||||||
Talen Energy Supply LLC | ||||||||||||||||
Term Loan B (3 mo. Term SOFR + 3.50%) | 8.60% | 05/17/2030 | 7,055 | 7,105,985 | ||||||||||||
Term Loan C (3 mo. Term SOFR + 3.50%) | 8.60% | 05/17/2030 | 5,091 | 5,126,970 | ||||||||||||
Vistra Zero Operating Co. LLC, Term Loan B (1 mo. Term SOFR + 2.75%) | 8.00% | 04/30/2031 | 5,643 | 5,680,615 | ||||||||||||
| 67,402,152 | ||||||||||||||||
Total Variable Rate Senior Loan Interests (Cost $2,450,235,782) | 2,332,312,178 | |||||||||||||||
U.S. Dollar Denominated Bonds & Notes–6.00% | ||||||||||||||||
Aerospace & Defense–0.31% | ||||||||||||||||
Rand Parent LLC (l) | 8.50% | 02/15/2030 | 8,332 | 8,339,799 | ||||||||||||
See accompanying Notes to Consolidated Financial Statements which are an integral part of the financial statements.
| 12 | Invesco Floating Rate ESG Fund |
| Interest Rate | Maturity Date | Principal Amount (000)(a) | Value | |||||||||||||
Air Transport–0.07% | ||||||||||||||||
American Airlines, Inc. (l) | 8.50% | 05/15/2029 | $ | 1,902 | $ 1,978,624 | |||||||||||
Automotive–0.19% | ||||||||||||||||
Panther Escrow Issuer LLC (l) | 7.13% | 06/01/2031 | 4,874 | 5,080,667 | ||||||||||||
Building & Development–0.55% | ||||||||||||||||
Brookfield Property REIT, Inc./BPR Cumulus LLC/BPR Nimbus LLC/GGSI Sellco LLC (l) | 5.75% | 05/15/2026 | 2,305 | 2,301,360 | ||||||||||||
Brookfield Property REIT, Inc./BPR Cumulus LLC/BPR Nimbus LLC/GGSI Sellco LLC(l) | 4.50% | 04/01/2027 | 9,543 | 9,209,439 | ||||||||||||
Miter Brands Acquisition Holdco, Inc./MIWD Borrower LLC(l) | 6.75% | 04/01/2032 | 805 | 827,762 | ||||||||||||
Signal Parent, Inc.(l) | 6.13% | 04/01/2029 | 3,431 | 2,354,142 | ||||||||||||
| 14,692,703 | ||||||||||||||||
Business Equipment & Services–1.01% | ||||||||||||||||
Acuris Finance US, Inc./Acuris Finance S.a.r.l. (l) | 9.00% | 08/01/2029 | 7,713 | 7,741,924 | ||||||||||||
ADT Security Corp. (The)(l) | 4.13% | 08/01/2029 | 5,396 | 5,129,459 | ||||||||||||
Allied Universal Holdco LLC(l) | 7.88% | 02/15/2031 | 5,976 | 6,072,444 | ||||||||||||
Boost Newco Borrower LLC(l) | 7.50% | 01/15/2031 | 7,243 | 7,729,621 | ||||||||||||
Cloud Software Group, Inc.(l) | 8.25% | 06/30/2032 | 256 | 268,200 | ||||||||||||
| 26,941,648 | ||||||||||||||||
Cable & Satellite Television–0.89% | ||||||||||||||||
Altice Financing S.A. (Luxembourg) (l) | 5.75% | 08/15/2029 | 2,188 | 1,687,965 | ||||||||||||
Altice Financing S.A. (Luxembourg)(l) | 5.00% | 01/15/2028 | 11,665 | 9,383,676 | ||||||||||||
Altice France S.A. (France)(l) | 5.50% | 01/15/2028 | 4,994 | 3,560,040 | ||||||||||||
Altice France S.A. (France)(l) | 5.50% | 10/15/2029 | 4,322 | 3,003,857 | ||||||||||||
Virgin Media Secured Finance PLC (United Kingdom)(l) | 4.50% | 08/15/2030 | 6,819 | 6,027,805 | ||||||||||||
| 23,663,343 | ||||||||||||||||
Chemicals & Plastics–0.84% | ||||||||||||||||
INEOS Finance PLC (Luxembourg) (l) | 7.50% | 04/15/2029 | 3,151 | 3,265,161 | ||||||||||||
INEOS Quattro Finance 2 PLC (United Kingdom)(l) | 9.63% | 03/15/2029 | 1,626 | 1,755,841 | ||||||||||||
SK Invictus Intermediate II S.a.r.l.(l) | 5.00% | 10/30/2029 | 12,249 | 11,569,732 | ||||||||||||
Windsor Holdings III LLC(l) | 8.50% | 06/15/2030 | 5,420 | 5,812,500 | ||||||||||||
| 22,403,234 | ||||||||||||||||
Ecological Services & Equipment–0.02% | ||||||||||||||||
GFL Environmental, Inc. (l) | 6.75% | 01/15/2031 | 563 | 588,801 | ||||||||||||
Food Products–0.01% | ||||||||||||||||
Sigma Holdco B.V. (Netherlands) (l) | 7.88% | 05/15/2026 | 200 | 197,507 | ||||||||||||
Health Care–0.20% | ||||||||||||||||
Global Medical Response, Inc. (h)(l) | 10.00% | 10/31/2028 | 2,858 | 2,855,274 | ||||||||||||
Organon & Co./Organon Foreign Debt Co-Issuer B.V.(l) | 6.75% | 05/15/2034 | 2,455 | 2,547,269 | ||||||||||||
| 5,402,543 | ||||||||||||||||
Industrial Equipment–0.56% | ||||||||||||||||
Chart Industries, Inc. (l) | 7.50% | 01/01/2030 | 5,405 | 5,686,006 | ||||||||||||
EMRLD Borrower L.P./Emerald Co-Issuer, Inc.(l) | 6.63% | 12/15/2030 | 8,922 | 9,147,584 | ||||||||||||
| 14,833,590 | ||||||||||||||||
Insurance–0.37% | ||||||||||||||||
Acrisure LLC/Acrisure Finance, Inc. (l) | 7.50% | 11/06/2030 | 3,549 | 3,645,593 | ||||||||||||
Alliant Holdings Intermediate LLC/Alliant Holdings Co-Issuer(l) | 7.00% | 01/15/2031 | 4,244 | 4,390,422 | ||||||||||||
HUB International Ltd.(l) | 7.25% | 06/15/2030 | 1,606 | 1,678,530 | ||||||||||||
| 9,714,545 | ||||||||||||||||
Lodging & Casinos–0.07% | ||||||||||||||||
Hilton Grand Vacations Borrower Escrow LLC/Hilton Grand Vacations Borrower Escrow, Inc. (l) | 6.63% | 01/15/2032 | 1,890 | 1,914,177 | ||||||||||||
See accompanying Notes to Consolidated Financial Statements which are an integral part of the financial statements.
| 13 | Invesco Floating Rate ESG Fund |
| Interest Rate | Maturity Date | Principal Amount (000)(a) | Value | |||||||||||||
Publishing–0.02% | ||||||||||||||||
McGraw-Hill Education, Inc. (l) | 7.38% | 09/01/2031 | $ | 585 | $ 604,601 | |||||||||||
Retailers (except Food & Drug)–0.11% | ||||||||||||||||
Evergreen Acqco 1 L.P./TVI, Inc. (l) | 9.75% | 04/26/2028 | 2,660 | 2,808,479 | ||||||||||||
Surface Transport–0.05% | ||||||||||||||||
First Student Bidco, Inc./First Transit Parent, Inc. (l) | 4.00% | 07/31/2029 | 1,407 | 1,310,963 | ||||||||||||
Telecommunications–0.66% | ||||||||||||||||
Connect Finco S.a.r.l./Connect US Finco LLC (United Kingdom) (l) | 6.75% | 10/01/2026 | 9,568 | 9,499,485 | ||||||||||||
Windstream Escrow LLC/Windstream Escrow Finance Corp.(l) | 7.75% | 08/15/2028 | 8,184 | 7,997,250 | ||||||||||||
| 17,496,735 | ||||||||||||||||
Utilities–0.07% | ||||||||||||||||
Calpine Corp. (l) | 4.50% | 02/15/2028 | 1,928 | 1,871,490 | ||||||||||||
Total U.S. Dollar Denominated Bonds & Notes (Cost $159,759,787) | 159,843,449 | |||||||||||||||
Shares | ||||||||||||||||
Common Stocks & Other Equity Interests–2.80%(m) | ||||||||||||||||
Aerospace & Defense–0.02% | ||||||||||||||||
IAP Worldwide Services(d)(n) | 838,949 | 453,032 | ||||||||||||||
IAP Worldwide Services(d)(n) | 134,338 | 134,338 | ||||||||||||||
IAP Worldwide Services, Inc. (Acquired 07/18/2014-08/18/2014; | 134 | 0 | ||||||||||||||
| 587,370 | ||||||||||||||||
Automotive–0.02% | ||||||||||||||||
Cabonline (Acquired 10/30/2023; Cost $10) (Sweden)(d)(g) | 10,996,102 | 1,076 | ||||||||||||||
Cabonline (Acquired 10/31/2023; Cost $8) (Sweden)(d)(g) | 9,384,746 | 462 | ||||||||||||||
Cabonline (Acquired 10/30/2023; Cost $280,511) (Sweden)(d)(g) | 312,441,524 | 410,779 | ||||||||||||||
Dayco Products LLC (Acquired 06/16/2006-05/29/2008; | 3,261 | 0 | ||||||||||||||
Dayco Products LLC (Acquired 06/16/2006-02/18/2014; | 3,266 | 0 | ||||||||||||||
| 412,317 | ||||||||||||||||
Building & Development–0.00% | ||||||||||||||||
Fagus Holdco PLC (Spain)(d) | 7,135 | 0 | ||||||||||||||
Lake at Las Vegas Joint Venture LLC, Class A (Acquired 04/28/2010-07/15/2010; | 518 | 0 | ||||||||||||||
Lake at Las Vegas Joint Venture LLC, Class B (Acquired 06/30/2010; | 4 | 0 | ||||||||||||||
| 0 | ||||||||||||||||
Business Equipment & Services–0.93% | ||||||||||||||||
Monitronics International, Inc. (Acquired 06/30/2023; Cost $8,220,186)(g) | 408,355 | 8,677,544 | ||||||||||||||
My Alarm Center LLC, Class A (Acquired 03/09/2021-05/17/2024; | 68,686 | 16,204,447 | ||||||||||||||
| 24,881,991 | ||||||||||||||||
Chemicals & Plastics–0.00% | ||||||||||||||||
Flint Group (ColourOz Inv) (Acquired 09/19/2023; Cost $0) (Germany)(d)(g) | 35,089 | 0 | ||||||||||||||
Containers & Glass Products–0.02% | ||||||||||||||||
Keter Group B.V. (Acquired 04/29/2024; Cost $0) (Netherlands)(d)(g) | 1,010,592,985 | 1,117 | ||||||||||||||
Libbey Glass LLC (Acquired 11/13/2020-02/10/2022; Cost $146,927)(d)(g) | 36,078 | 544,417 | ||||||||||||||
| 545,534 | ||||||||||||||||
Electronics & Electrical–0.21% | ||||||||||||||||
Diebold Nixdorf, Inc.(p) | 124,443 | 5,577,535 | ||||||||||||||
Forest Products–0.69% | ||||||||||||||||
Restoration Forest Products Group, LLC (Acquired 02/22/2022-08/27/2024; | 132,319 | 18,458,510 | ||||||||||||||
See accompanying Notes to Consolidated Financial Statements which are an integral part of the financial statements.
| 14 | Invesco Floating Rate ESG Fund |
| Shares | Value | |||||||||||||||
Home Furnishings–0.10% | ||||||||||||||||
Serta Simmons Bedding LLC (Acquired 06/29/2023; Cost $56,360)(g) | 363,612 | $ 2,708,909 | ||||||||||||||
Industrial Equipment–0.00% | ||||||||||||||||
North American Lifting Holdings, Inc. | 7,347 | 11,939 | ||||||||||||||
Leisure Goods, Activities & Movies–0.46% | ||||||||||||||||
Crown Finance US, Inc. | 588,117 | 12,221,955 | ||||||||||||||
Crown Finance US, Inc. | 3,058 | 63,550 | ||||||||||||||
Vue International Bidco PLC (Acquired 02/20/2024; Cost $0) (United Kingdom)(d)(g) | 13,004 | 0 | ||||||||||||||
Vue International Bidco PLC (Acquired 02/20/2024; Cost $0) (United Kingdom)(d)(g) | 6,404,275 | 7 | ||||||||||||||
Vue International Bidco PLC (United Kingdom)(d) | 3,986,481 | 4 | ||||||||||||||
Vue International Bidco PLC, Class A4 (United Kingdom)(d) | 2,779,140 | 3 | ||||||||||||||
| 12,285,519 | ||||||||||||||||
Lodging & Casinos–0.03% | ||||||||||||||||
Caesars Entertainment, Inc.(p) | 19,983 | 752,160 | ||||||||||||||
Oil & Gas–0.09% | ||||||||||||||||
McDermott International Ltd.(p) | 629,763 | 157,441 | ||||||||||||||
McDermott International Ltd.(d) | 2,314,309 | 549,649 | ||||||||||||||
Samson Investment Co., Class A (Acquired 03/01/2017; | 261,209 | 28,733 | ||||||||||||||
Southcross Energy Partners L.P. (Acquired 08/05/2014-10/29/2020; | 145,102 | 0 | ||||||||||||||
Talos Energy, Inc.(p) | 132,605 | 1,520,979 | ||||||||||||||
| 2,256,802 | ||||||||||||||||
Radio & Television–0.02% | ||||||||||||||||
iHeartMedia, Inc., Class A(p) | 306,089 | 477,499 | ||||||||||||||
iHeartMedia, Inc., Class B(d)(p) | 29 | 46 | ||||||||||||||
| 477,545 | ||||||||||||||||
Retailers (except Food & Drug)–0.00% | ||||||||||||||||
Claire’s Stores, Inc. (Acquired 10/12/2018; Cost $1,111,774)(d)(g) | 692 | 10,380 | ||||||||||||||
Toys ’R’ Us-Delaware, Inc.(d) | 11 | 0 | ||||||||||||||
Vivarte S.A.S.U. (France)(d) | 241,195 | 47,991 | ||||||||||||||
| 58,371 | ||||||||||||||||
Surface Transport–0.11% | ||||||||||||||||
Commercial Barge Line Co. (Acquired 02/15/2018-02/06/2020; | 14,574 | 1,376,369 | ||||||||||||||
Commercial Barge Line Co., Series B, Wts., expiring 04/30/2045 | 144,357 | 90,223 | ||||||||||||||
Commercial Barge Line Co., Wts., expiring 04/27/2045 | 15,321 | 1,446,915 | ||||||||||||||
Hurtigruten (Explorer II AS), Wts. (Acquired 02/23/2024; Cost $0) | 808,820 | 1 | ||||||||||||||
| 2,913,508 | ||||||||||||||||
Telecommunications–0.10% | ||||||||||||||||
Avaya Holdings Corp. | 293,075 | 2,222,534 | ||||||||||||||
Avaya, Inc. (Acquired 05/01/2023; Cost $797,295)(g) | 53,153 | 403,086 | ||||||||||||||
| 2,625,620 | ||||||||||||||||
Total Common Stocks & Other Equity Interests (Cost $105,183,718) | 74,553,630 | |||||||||||||||
| Interest Rate | Maturity Date | Principal Amount (000)(a) | ||||||||||||||
Non-U.S. Dollar Denominated Bonds & Notes–2.54%(q) | ||||||||||||||||
Air Transport–0.15% | ||||||||||||||||
SGL Group ApS (Denmark) (3 mo. EURIBOR + 4.75%)(r) | 8.44% | 04/22/2030 | EUR | 3,688 | 4,107,290 | |||||||||||
Automotive–0.26% | ||||||||||||||||
Cabonline Group Holding AB (Sweden) (Acquired 10/13/2023; Cost $816,937)(g)(l) | 14.00% | 03/19/2026 | SEK | 9,385 | 934,526 | |||||||||||
Cabonline Group Holding AB (Sweden) (3 mo. STIBOR + 9.50%) (Acquired 03/24/2022; Cost $3,855,248)(g)(k)(l)(r) | 13.16% | 04/19/2026 | SEK | 36,287 | 3,260,054 | |||||||||||
See accompanying Notes to Consolidated Financial Statements which are an integral part of the financial statements.
| 15 | Invesco Floating Rate ESG Fund |
| Interest Rate | Maturity Date | Principal Amount (000)(a) | Value | |||||||||||||
Automotive–(continued) | ||||||||||||||||
Cabonline Group Holding AB (Sweden) (Acquired 10/12/2023; Cost $1,706,620)(g)(l) | 14.00 | % | 03/19/2026 | SEK | 18,769 | $ 1,850,773 | ||||||||||
Conceria Pasubio S.p.A. (Italy) (3 mo. EURIBOR + 4.50%)(l)(r) | 8.20 | % | 09/30/2028 | EUR | 917 | 950,968 | ||||||||||
| 6,996,321 | ||||||||||||||||
Building & Development–0.01% | ||||||||||||||||
Fagus Holdco PLC (United Kingdom) (Acquired 09/05/2023; Cost $0)(d)(g)(s) | 0.00 | % | 09/05/2029 | EUR | 118 | 130,070 | ||||||||||
Business Equipment & Services–0.04% | ||||||||||||||||
Pachelbel Bidco S.p.A. (Italy) (3 mo. EURIBOR + 4.25%)(l)(r) | 8.07 | % | 05/17/2031 | EUR | 1,001 | 1,114,843 | ||||||||||
Cable & Satellite Television–0.11% | ||||||||||||||||
Altice Finco S.A. (Luxembourg)(l) | 4.75 | % | 01/15/2028 | EUR | 3,712 | 2,791,386 | ||||||||||
Electronics & Electrical–0.16% | ||||||||||||||||
Castor S.p.A. (Italy) (3 mo. EURIBOR + 5.25%)(l)(r) | 8.97 | % | 02/15/2029 | EUR | 4,000 | 4,361,632 | ||||||||||
Financial Intermediaries–1.47% | ||||||||||||||||
AnaCap (AFE S.A. SICAV-RAIF) (Italy) (3 mo. EURIBOR + 7.50%)(l)(r) | 11.13 | % | 07/15/2030 | EUR | 7,201 | 4,245,060 | ||||||||||
Garfunkelux Holdco 3 S.A. (Luxembourg) (3 mo. EURIBOR + 6.25%) (Acquired | 9.88 | % | 05/01/2026 | EUR | 1,945 | 1,495,968 | ||||||||||
Garfunkelux Holdco 3 S.A. (Luxembourg) (Acquired 06/30/2022-12/08/2022; | 6.75 | % | 11/01/2025 | EUR | 6,615 | 5,086,563 | ||||||||||
Sherwood Financing PLC (United Kingdom)(l) | 6.00 | % | 11/15/2026 | GBP | 937 | 1,120,631 | ||||||||||
Sherwood Financing PLC (United Kingdom)(l) | 4.50 | % | 11/15/2026 | EUR | 968 | 998,616 | ||||||||||
Sherwood Financing PLC (United Kingdom) (3 mo. EURIBOR + 4.63%)(l)(r) | 8.17 | % | 11/15/2027 | EUR | 6,242 | 6,448,031 | ||||||||||
Sherwood Financing PLC (United Kingdom) (3 mo. EURIBOR + 4.63%)(l)(r) | 8.17 | % | 11/15/2027 | EUR | 7,750 | 8,005,806 | ||||||||||
Very Group Funding PLC (The) (United Kingdom)(l) | 6.50 | % | 08/01/2026 | GBP | 3,150 | 3,627,538 | ||||||||||
Very Group Funding PLC (The) (United Kingdom)(l) | 6.50 | % | 08/01/2026 | GBP | 7,141 | 8,223,571 | ||||||||||
| 39,251,784 | ||||||||||||||||
Industrial Equipment–0.09% | ||||||||||||||||
Summer (BC) Holdco A S.a.r.l. (Luxembourg)(l) | 9.25 | % | 10/31/2027 | EUR | 2,231 | 2,427,620 | ||||||||||
Leisure Goods, Activities & Movies–0.04% | ||||||||||||||||
Deuce Finco PLC (United Kingdom)(l) | 5.50 | % | 06/15/2027 | GBP | 807 | 1,029,370 | ||||||||||
Surface Transport–0.21% | ||||||||||||||||
Zenith Finco PLC (United Kingdom)(l) | 6.50 | % | 06/30/2027 | GBP | 4,906 | 4,695,370 | ||||||||||
Zenith Finco PLC (United Kingdom)(l) | 6.50 | % | 06/30/2027 | GBP | 846 | 809,679 | ||||||||||
| 5,505,049 | ||||||||||||||||
Total Non-U.S. Dollar Denominated Bonds & Notes (Cost $76,631,319) | 67,715,365 | |||||||||||||||
Shares | ||||||||||||||||
Preferred Stocks–0.44%(m) | ||||||||||||||||
Oil & Gas–0.02% | ||||||||||||||||
McDermott International Ltd., Pfd.(d) | 1,787 | 446,851 | ||||||||||||||
Southcross Energy Partners L.P., Series A, Pfd. (Acquired 05/07/2019-08/23/2019; | 577,315 | 3,406 | ||||||||||||||
| 450,257 | ||||||||||||||||
Surface Transport–0.42% | ||||||||||||||||
Commercial Barge Line Co., Series B, Pfd. (Acquired 02/05/2020-10/27/2020; | 68,517 | 6,671,500 | ||||||||||||||
Commercial Barge Line Co., Series B, Pfd., Wts., expiring 04/27/2045 (Acquired | 48,119 | 4,685,347 | ||||||||||||||
| 11,356,847 | ||||||||||||||||
Total Preferred Stocks (Cost $3,267,836) | 11,807,104 | |||||||||||||||
Money Market Funds–1.70% | ||||||||||||||||
Invesco Government & Agency Portfolio, Institutional Class, 5.18%(o)(t) | 15,885,119 | 15,885,119 | ||||||||||||||
See accompanying Notes to Consolidated Financial Statements which are an integral part of the financial statements.
| 16 | Invesco Floating Rate ESG Fund |
| Shares | Value | |||||||||||||||
Invesco Treasury Portfolio, Institutional Class, 5.15%(o)(t) | 29,505,352 | $ | 29,505,352 | |||||||||||||
| ||||||||||||||||
Total Money Market Funds (Cost $45,390,471) | 45,390,471 | |||||||||||||||
| ||||||||||||||||
TOTAL INVESTMENTS IN SECURITIES-101.01% (Cost $2,840,468,913) | 2,691,622,197 | |||||||||||||||
| ||||||||||||||||
OTHER ASSETS LESS LIABILITIES-(1.01)% | (26,969,956 | ) | ||||||||||||||
| ||||||||||||||||
NET ASSETS-100.00% | $ | 2,664,652,241 | ||||||||||||||
| ||||||||||||||||
Investment Abbreviations:
| EUR | – Euro | |
| EURIBOR | – Euro Interbank Offered Rate | |
| GBP | – British Pound Sterling | |
| LIBOR | – London Interbank Offered Rate | |
| LOC | – Letter of Credit | |
| Pfd. | – Preferred | |
| PIK | – Pay-in-Kind | |
| SEK | – Swedish Krona | |
| SOFR | – Secured Overnight Financing Rate | |
| SONIA | – Sterling Overnight Index Average | |
| STIBOR | – Stockholm Interbank Offered Rate | |
| USD | – U.S. Dollar | |
| Wts. | – Warrants |
Notes to Consolidated Schedule of Investments:
| (a) | Principal amounts are denominated in U.S. dollars unless otherwise noted. |
| (b) | Variable rate senior loan interests often require prepayments from excess cash flow or permit the borrower to repay at its election. The degree to which borrowers repay, whether as a contractual requirement or at their election, cannot be predicted with any accuracy. As a result, the actual remaining maturity may be substantially less than the stated maturities shown. However, it is anticipated that the variable rate senior loan interests will have an expected average life of three to five years. |
| (c) | Variable rate senior loan interests are, at present, not readily marketable, not registered under the Securities Act of 1933, as amended (the “1933 Act”) and may be subject to contractual and legal restrictions on sale. Variable rate senior loan interests in the Fund’s portfolio generally have variable rates which adjust to a base, such as the Secured Overnight Financing Rate (“SOFR”), on set dates, typically every 30 days, but not greater than one year, and/or have interest rates that float at margin above a widely recognized base lending rate such as the Prime Rate of a designated U.S. bank. |
| (d) | Security valued using significant unobservable inputs (Level 3). See Note 3. |
| (e) | This variable rate interest will settle after August 31, 2024, at which time the interest rate will be determined. |
| (f) | All or a portion of this holding is subject to unfunded loan commitments. Interest rate will be determined at the time of funding. See Note 8. |
| (g) | Restricted security. The aggregate value of these securities at August 31, 2024 was $229,496,986, which represented 8.61% of the Fund’s Net Assets. |
| (h) | All or a portion of this security is Pay-in-Kind. Pay-in-Kind securities pay interest income in the form of securities. |
| (i) | Acquired as part of a bankruptcy restructuring. |
| (j) | The borrower has filed for protection in federal bankruptcy court. Subsequent to period-end, a valuation adjustment was made to the Fund’s term loan positions in Robertshaw to reflect the consummation of the borrower’s Chapter 11 plan. |
| (k) | Defaulted security. Currently, the issuer is in default with respect to principal and/or interest payments. The aggregate value of these securities at August 31, 2024 was $37,088,919, which represented 1.39% of the Fund’s Net Assets. |
| (l) | Security purchased or received in a transaction exempt from registration under the 1933 Act. The security may be resold pursuant to an exemption from registration under the 1933 Act, typically to qualified institutional buyers. The aggregate value of these securities at August 31, 2024 was $223,321,454, which represented 8.38% of the Fund’s Net Assets. |
| (m) | Securities acquired through the restructuring of senior loans. |
| (n) | Acquired through direct lending. Direct loans may be subject to liquidity and interest rate risk and certain direct loans may be deemed illiquid. |
| (o) | Affiliated holding. Affiliated holdings are investments in entities which are under common ownership or control of Invesco Ltd. or are investments in entities in which the Fund owns 5% or more of the outstanding voting securities. The table below shows the Fund’s transactions in, and earnings from, its investments in affiliates for the fiscal year ended August 31, 2024. |
| Value August 31, 2023 | Purchases at Cost | Proceeds from Sales | Change in Unrealized Appreciation (Depreciation) | Realized Gain | Value August 31, 2024 | Dividend Income | |||||||||||||||||||||||||||||||||||||||||||||||||||||||||||
| Investments in Affiliated Money Market Funds: | |||||||||||||||||||||||||||||||||||||||||||||||||||||||||||||||||
Invesco Government & Agency Portfolio, Institutional Class | $ | 39,229,510 | $ | 288,960,495 | $ | (312,304,886 | ) | $ | - | $ | - | $ | 15,885,119 | $ | 1,518,966 | ||||||||||||||||||||||||||||||||||||||||||||||||||
Invesco Liquid Assets Portfolio, Institutional Class | 28,018,843 | 185,785,680 | (213,816,602 | ) | 189 | 11,890 | - | 1,102,640 | |||||||||||||||||||||||||||||||||||||||||||||||||||||||||
Invesco Treasury Portfolio, Institutional Class | 44,833,726 | 368,945,238 | (384,273,612 | ) | - | - | 29,505,352 | 1,956,693 | |||||||||||||||||||||||||||||||||||||||||||||||||||||||||
| Investments in Other Affiliates: | |||||||||||||||||||||||||||||||||||||||||||||||||||||||||||||||||
My Alarm Center LLC, Class A | 16,635,703 | - | (3,086,924 | ) | 2,655,668 | - | 16,204,447 | - | |||||||||||||||||||||||||||||||||||||||||||||||||||||||||
Restoration Forest Products Group, LLC | - | 24,375,800 | - | (5,917,290 | ) | - | 18,458,510 | - | |||||||||||||||||||||||||||||||||||||||||||||||||||||||||
Total | $ | 128,717,782 | $ | 868,067,213 | $ | (913,482,024 | ) | $ | (3,261,433 | ) | $ | 11,890 | $ | 80,053,428 | $ | 4,578,299 | |||||||||||||||||||||||||||||||||||||||||||||||||
| (p) | Non-income producing security. |
| (q) | Foreign denominated security. Principal amount is denominated in the currency indicated. |
| (r) | Interest or dividend rate is redetermined periodically. Rate shown is the rate in effect on August 31, 2024. |
See accompanying Notes to Consolidated Financial Statements which are an integral part of the financial statements.
| 17 | Invesco Floating Rate ESG Fund |
| (s) | Zero coupon bond issued at a discount. |
| (t) | The rate shown is the 7-day SEC standardized yield as of August 31, 2024. |
| Open Forward Foreign Currency Contracts | ||||||||||||||||||||||||||||||
| ||||||||||||||||||||||||||||||
| Settlement | Contract to | Unrealized Appreciation | ||||||||||||||||||||||||||||
| Date | Counterparty | Deliver | Receive | (Depreciation) | ||||||||||||||||||||||||||
| ||||||||||||||||||||||||||||||
Currency Risk | ||||||||||||||||||||||||||||||
| ||||||||||||||||||||||||||||||
09/27/2024 | Barclays Bank PLC | USD | 206,786 | SEK | 2,217,826 | $ 9,467 | ||||||||||||||||||||||||
| ||||||||||||||||||||||||||||||
10/31/2024 | Barclays Bank PLC | EUR | 62,942,341 | USD | 70,221,695 | 459,575 | ||||||||||||||||||||||||
| ||||||||||||||||||||||||||||||
09/27/2024 | BNP Paribas S.A. | USD | 9,846,634 | EUR | 9,000,000 | 112,451 | ||||||||||||||||||||||||
| ||||||||||||||||||||||||||||||
09/27/2024 | BNP Paribas S.A. | USD | 10,014,427 | GBP | 7,682,868 | 77,725 | ||||||||||||||||||||||||
| ||||||||||||||||||||||||||||||
10/31/2024 | BNP Paribas S.A. | EUR | 62,511,130 | USD | 69,746,381 | 462,195 | ||||||||||||||||||||||||
| ||||||||||||||||||||||||||||||
10/31/2024 | BNP Paribas S.A. | SEK | 65,906,954 | USD | 6,475,529 | 36,659 | ||||||||||||||||||||||||
| ||||||||||||||||||||||||||||||
09/27/2024 | Canadian Imperial Bank of Commerce | USD | 10,012,416 | GBP | 7,682,869 | 79,735 | ||||||||||||||||||||||||
| ||||||||||||||||||||||||||||||
09/27/2024 | State Street Bank & Trust Co. | USD | 1,713,394 | EUR | 1,572,884 | 27,104 | ||||||||||||||||||||||||
| ||||||||||||||||||||||||||||||
09/27/2024 | State Street Bank & Trust Co. | USD | 9,877,377 | GBP | 7,576,858 | 75,519 | ||||||||||||||||||||||||
| ||||||||||||||||||||||||||||||
10/31/2024 | State Street Bank & Trust Co. | EUR | 3,500,000 | USD | 3,926,218 | 46,994 | ||||||||||||||||||||||||
| ||||||||||||||||||||||||||||||
10/31/2024 | State Street Bank & Trust Co. | SEK | 620,235 | USD | 60,901 | 307 | ||||||||||||||||||||||||
| ||||||||||||||||||||||||||||||
09/27/2024 | Toronto-Dominion Bank (The) | USD | 10,837,440 | EUR | 10,000,000 | 228,210 | ||||||||||||||||||||||||
| ||||||||||||||||||||||||||||||
10/31/2024 | Toronto-Dominion Bank (The) | EUR | 62,780,148 | USD | 70,059,556 | 477,204 | ||||||||||||||||||||||||
| ||||||||||||||||||||||||||||||
Subtotal-Appreciation | 2,093,145 | |||||||||||||||||||||||||||||
| ||||||||||||||||||||||||||||||
Currency Risk | ||||||||||||||||||||||||||||||
| ||||||||||||||||||||||||||||||
09/27/2024 | Bank of New York Mellon (The) | EUR | 69,023,434 | USD | 75,113,371 | (1,265,542 | ) | |||||||||||||||||||||||
| ||||||||||||||||||||||||||||||
09/27/2024 | Barclays Bank PLC | GBP | 286,315 | USD | 370,178 | (5,923 | ) | |||||||||||||||||||||||
| ||||||||||||||||||||||||||||||
09/27/2024 | Barclays Bank PLC | USD | 69,506,258 | EUR | 62,399,559 | (457,091 | ) | |||||||||||||||||||||||
| ||||||||||||||||||||||||||||||
10/31/2024 | Barclays Bank PLC | GBP | 107,130 | USD | 139,583 | (1,170 | ) | |||||||||||||||||||||||
| ||||||||||||||||||||||||||||||
09/27/2024 | BNP Paribas S.A. | GBP | 7,446,676 | USD | 9,628,794 | (153,097 | ) | |||||||||||||||||||||||
| ||||||||||||||||||||||||||||||
09/27/2024 | BNP Paribas S.A. | SEK | 68,041,950 | USD | 6,358,454 | (276,095 | ) | |||||||||||||||||||||||
| ||||||||||||||||||||||||||||||
09/27/2024 | BNP Paribas S.A. | USD | 69,511,754 | EUR | 62,399,559 | (462,588 | ) | |||||||||||||||||||||||
| ||||||||||||||||||||||||||||||
09/27/2024 | BNP Paribas S.A. | USD | 6,455,473 | SEK | 65,824,123 | (37,177 | ) | |||||||||||||||||||||||
| ||||||||||||||||||||||||||||||
10/31/2024 | BNP Paribas S.A. | GBP | 7,667,345 | USD | 9,996,083 | (77,674 | ) | |||||||||||||||||||||||
| ||||||||||||||||||||||||||||||
09/27/2024 | Canadian Imperial Bank of Commerce | GBP | 7,559,505 | USD | 9,766,606 | (163,495 | ) | |||||||||||||||||||||||
| ||||||||||||||||||||||||||||||
10/31/2024 | Canadian Imperial Bank of Commerce | GBP | 7,667,345 | USD | 9,994,160 | (79,597 | ) | |||||||||||||||||||||||
| ||||||||||||||||||||||||||||||
10/31/2024 | Canadian Imperial Bank of Commerce | USD | 16,837,132 | EUR | 15,000,000 | (211,889 | ) | |||||||||||||||||||||||
| ||||||||||||||||||||||||||||||
09/27/2024 | Goldman Sachs International | GBP | 90,594 | USD | 117,043 | (1,961 | ) | |||||||||||||||||||||||
| ||||||||||||||||||||||||||||||
09/27/2024 | Morgan Stanley and Co. International PLC | EUR | 67,993,233 | USD | 74,080,633 | (1,158,297 | ) | |||||||||||||||||||||||
| ||||||||||||||||||||||||||||||
09/27/2024 | State Street Bank & Trust Co. | EUR | 71,023,433 | USD | 77,222,064 | (1,369,980 | ) | |||||||||||||||||||||||
| ||||||||||||||||||||||||||||||
09/27/2024 | State Street Bank & Trust Co. | GBP | 7,559,505 | USD | 9,772,457 | (157,644 | ) | |||||||||||||||||||||||
| ||||||||||||||||||||||||||||||
10/31/2024 | State Street Bank & Trust Co. | GBP | 7,561,549 | USD | 9,859,359 | (75,398 | ) | |||||||||||||||||||||||
| ||||||||||||||||||||||||||||||
09/27/2024 | Toronto-Dominion Bank (The) | USD | 69,824,575 | EUR | 62,668,098 | (478,254 | ) | |||||||||||||||||||||||
| ||||||||||||||||||||||||||||||
Subtotal-Depreciation | (6,432,872 | ) | ||||||||||||||||||||||||||||
| ||||||||||||||||||||||||||||||
Total Forward Foreign Currency Contracts | $(4,339,727 | ) | ||||||||||||||||||||||||||||
| ||||||||||||||||||||||||||||||
| Abbreviations: | ||
| EUR – Euro | ||
| GBP – British Pound Sterling | ||
| SEK – Swedish Krona | ||
| USD – U.S. Dollar | ||
See accompanying Notes to Consolidated Financial Statements which are an integral part of the financial statements.
| 18 | Invesco Floating Rate ESG Fund |
Consolidated Statement of Assets and Liabilities
August 31, 2024
Assets: | ||||
Investments in unaffiliated securities, at value | $ | 2,611,568,769 | ||
| ||||
Investments in affiliates, at value | 80,053,428 | |||
| ||||
Other investments: | ||||
Unrealized appreciation on forward foreign currency contracts outstanding | 2,093,145 | |||
| ||||
Cash | 27,536,018 | |||
| ||||
Restricted cash | 24,769,396 | |||
| ||||
Foreign currencies, at value (Cost $2,122,742) | 2,124,242 | |||
| ||||
Due from broker | 295,131 | |||
| ||||
Receivable for: | ||||
Investments sold | 66,920,992 | |||
| ||||
Fund shares sold | 2,309,111 | |||
| ||||
Dividends | 378,785 | |||
| ||||
Interest | 25,981,873 | |||
| ||||
Investments matured, at value (Cost $30,307) | 12,426 | |||
| ||||
Investment for trustee deferred compensation and retirement plans | 167,027 | |||
| ||||
Other assets | 475,989 | |||
| ||||
Total assets | 2,844,686,332 | |||
| ||||
Liabilities: | ||||
Other investments: | ||||
Unrealized depreciation on forward foreign currency contracts outstanding | 6,432,872 | |||
| ||||
Payable for: | ||||
Investments purchased | 114,884,698 | |||
| ||||
Dividends | 6,317,156 | |||
| ||||
Proceeds received in connection with pending litigation | 24,769,396 | |||
| ||||
Fund shares reacquired | 4,104,640 | |||
| ||||
Due to broker | 1,767,819 | |||
| ||||
Accrued fees to affiliates | 903,819 | |||
| ||||
Accrued trustees’ and officers’ fees and benefits | 4,962 | |||
| ||||
Accrued other operating expenses | 318,915 | |||
| ||||
Trustee deferred compensation and retirement plans | 178,184 | |||
| ||||
Unfunded loan commitments | 20,351,630 | |||
| ||||
Total liabilities | 180,034,091 | |||
| ||||
Net assets applicable to shares outstanding | $ | 2,664,652,241 | ||
| ||||
Net assets consist of: | ||||
Shares of beneficial interest | $ | 3,249,582,138 | ||
| ||||
Distributable earnings (loss) | (584,929,897 | ) | ||
| ||||
| $ | 2,664,652,241 | |||
| ||||
Net Assets: |
| |||
Class A | $ | 777,351,090 | ||
| ||||
Class C | $ | 74,532,834 | ||
| ||||
Class R | $ | 8,545,052 | ||
| ||||
Class Y | $ | 1,237,621,506 | ||
| ||||
Class R5 | $ | 5,942,227 | ||
| ||||
Class R6 | $ | 560,659,532 | ||
| ||||
Shares outstanding, no par value, with an unlimited number of shares authorized: |
| |||
Class A | 115,455,107 | |||
| ||||
Class C | 11,118,512 | |||
| ||||
Class R | 1,266,374 | |||
| ||||
Class Y | 184,046,977 | |||
| ||||
Class R5 | 882,419 | |||
| ||||
Class R6 | 83,452,482 | |||
| ||||
Class A: | ||||
Net asset value per share | $ | 6.73 | ||
| ||||
Maximum offering price per share | $ | 6.90 | ||
| ||||
Class C: | ||||
Net asset value and offering price per share | $ | 6.70 | ||
| ||||
Class R: | ||||
Net asset value and offering price per share | $ | 6.75 | ||
| ||||
Class Y: | ||||
Net asset value and offering price per share | $ | 6.72 | ||
| ||||
Class R5: | ||||
Net asset value and offering price per share | $ | 6.73 | ||
| ||||
Class R6: | ||||
Net asset value and offering price per share | $ | 6.72 | ||
| ||||
See accompanying Notes to Consolidated Financial Statements which are an integral part of the financial statements.
| 19 | Invesco Floating Rate ESG Fund |
Consolidated Statement of Operations
For the year ended August 31, 2024
Investment income: | ||||
Interest | $ | 271,433,211 | ||
| ||||
Dividends | 373,991 | |||
| ||||
Dividends from affiliated money market funds | 4,578,299 | |||
| ||||
Total investment income | 276,385,501 | |||
| ||||
Expenses: | ||||
Advisory fees | 16,714,444 | |||
| ||||
Administrative services fees | 391,481 | |||
| ||||
Custodian fees | 294,256 | |||
| ||||
Distribution fees: | ||||
Class A | 1,825,874 | |||
| ||||
Class C | 585,914 | |||
| ||||
Class R | 41,784 | |||
| ||||
Interest, facilities and maintenance fees | 1,396,086 | |||
| ||||
Transfer agent fees – A, C, R & Y | 2,276,003 | |||
| ||||
Transfer agent fees – R5 | 5,895 | |||
| ||||
Transfer agent fees – R6 | 169,971 | |||
| ||||
Trustees’ and officers’ fees and benefits | 47,393 | |||
| ||||
Registration and filing fees | 172,905 | |||
| ||||
Reports to shareholders | 353,011 | |||
| ||||
Professional services fees | 920,431 | |||
| ||||
Other | 110,544 | |||
| ||||
Total expenses | 25,305,992 | |||
| ||||
Less: Fees waived and/or expense offset arrangement(s) | (105,361 | ) | ||
| ||||
Net expenses | 25,200,631 | |||
| ||||
Net investment income | 251,184,870 | |||
| ||||
Realized and unrealized gain (loss) from: | ||||
Net realized gain (loss) from: | ||||
Unaffiliated investment securities | (24,365,032 | ) | ||
| ||||
Affiliated investment securities | 11,890 | |||
| ||||
Foreign currencies | (754,336 | ) | ||
| ||||
Forward foreign currency contracts | 8,282,407 | |||
| ||||
| (16,825,071 | ) | |||
| ||||
Change in net unrealized appreciation (depreciation) of: | ||||
Unaffiliated investment securities | (1,711,268 | ) | ||
| ||||
Affiliated investment securities | (3,261,433 | ) | ||
| ||||
Foreign currencies | 407,509 | |||
| ||||
Forward foreign currency contracts | (10,464,872 | ) | ||
| ||||
| (15,030,064 | ) | |||
| ||||
Net realized and unrealized gain (loss) | (31,855,135 | ) | ||
| ||||
Net increase in net assets resulting from operations | $ | 219,329,735 | ||
| ||||
See accompanying Notes to Consolidated Financial Statements which are an integral part of the financial statements.
| 20 | Invesco Floating Rate ESG Fund |
Consolidated Statement of Changes in Net Assets
For the years ended August 31, 2024 and 2023
| 2024 | 2023 | |||||||
| ||||||||
Operations: | ||||||||
Net investment income | $ | 251,184,870 | $ | 276,085,800 | ||||
| ||||||||
Net realized gain (loss) | (16,825,071 | ) | (167,175,027 | ) | ||||
| ||||||||
Change in net unrealized appreciation (depreciation) | (15,030,064 | ) | 115,255,269 | |||||
| ||||||||
Net increase in net assets resulting from operations | 219,329,735 | 224,166,042 | ||||||
| ||||||||
Distributions to shareholders from distributable earnings: | ||||||||
Class A | (64,753,252 | ) | (63,774,464 | ) | ||||
| ||||||||
Class C | (6,553,394 | ) | (8,150,210 | ) | ||||
| ||||||||
Class R | (721,090 | ) | (758,648 | ) | ||||
| ||||||||
Class Y | (123,456,965 | ) | (185,426,658 | ) | ||||
| ||||||||
Class R5 | (537,076 | ) | (460,233 | ) | ||||
| ||||||||
Class R6 | (51,999,886 | ) | (47,750,970 | ) | ||||
| ||||||||
Total distributions from distributable earnings | (248,021,663 | ) | (306,321,183 | ) | ||||
| ||||||||
Return of capital: | ||||||||
Class A | (2,630,307 | ) | (951,906 | ) | ||||
| ||||||||
Class C | (266,202 | ) | (121,651 | ) | ||||
| ||||||||
Class R | (29,291 | ) | (11,324 | ) | ||||
| ||||||||
Class Y | (5,014,879 | ) | (2,767,703 | ) | ||||
| ||||||||
Class R5 | (21,816 | ) | (6,869 | ) | ||||
| ||||||||
Class R6 | (2,112,259 | ) | (712,737 | ) | ||||
| ||||||||
Total return of capital | (10,074,754 | ) | (4,572,190 | ) | ||||
| ||||||||
Total distributions | (258,096,417 | ) | (310,893,373 | ) | ||||
| ||||||||
Share transactions–net: | ||||||||
Class A | 119,395,433 | (69,943,883 | ) | |||||
| ||||||||
Class C | (5,628,929 | ) | (20,512,197 | ) | ||||
| ||||||||
Class R | 432,286 | 181,202 | ||||||
| ||||||||
Class Y | (234,950,304 | ) | (1,143,228,885 | ) | ||||
| ||||||||
Class R5 | 1,184,349 | 156,668 | ||||||
| ||||||||
Class R6 | 15,955,935 | 14,039,460 | ||||||
| ||||||||
Net increase (decrease) in net assets resulting from share transactions | (103,611,230 | ) | (1,219,307,635 | ) | ||||
| ||||||||
Net increase (decrease) in net assets | (142,377,912 | ) | (1,306,034,966 | ) | ||||
| ||||||||
Net assets: | ||||||||
Beginning of year | 2,807,030,153 | 4,113,065,119 | ||||||
| ||||||||
End of year | $ | 2,664,652,241 | $ | 2,807,030,153 | ||||
| ||||||||
See accompanying Notes to Consolidated Financial Statements which are an integral part of the financial statements.
| 21 | Invesco Floating Rate ESG Fund |
Consolidated Financial Highlights
The following schedule presents financial highlights for a share of the Fund outstanding throughout the periods indicated.
Net asset value, beginning of period | Net investment income(a) | Net gains (losses) on securities (both realized and unrealized) | Total from investment operations | Dividends from net investment income | Return of capital | Total distributions | Net asset value, end of period | Total return (b) | Net assets, end of period (000’s omitted) | Ratio of expenses to average net assets with fee waivers and/or expenses absorbed | Ratio of expenses to average net fee waivers and/or expenses absorbed | Supplemental ratio of expenses to average net assets with fee waivers (excluding interest, facilities and maintenance fees) | Ratio of net investment income to average net assets | Portfolio turnover (c) | |||||||||||||||||||||||||||||||||||||||||||||||||||||||||||||
Class A | |||||||||||||||||||||||||||||||||||||||||||||||||||||||||||||||||||||||||||
Year ended 08/31/24 | $6.83 | $0.61 | $(0.08 | ) | $0.53 | $(0.61 | ) | $(0.02 | ) | $(0.63 | ) | $6.73 | 8.03 | % | $ 777,351 | 1.09 | %(d) | 1.09 | %(d) | 1.04 | % | 8.98 | % | 46 | % | ||||||||||||||||||||||||||||||||||||||||||||||||||
Year ended 08/31/23 | 6.95 | 0.58 | (0.05 | ) | 0.53 | (0.64 | ) | (0.01 | ) | (0.65 | ) | 6.83 | 8.20 | 668,557 | 1.10 | (d) | 1.10 | (d) | 1.05 | 8.57 | 29 | ||||||||||||||||||||||||||||||||||||||||||||||||||||||
Year ended 08/31/22 | 7.35 | 0.29 | (0.39 | ) | (0.10 | ) | (0.30 | ) | – | (0.30 | ) | 6.95 | (1.44 | ) | 751,871 | 1.04 | (d) | 1.05 | (d) | 1.01 | 4.13 | 43 | |||||||||||||||||||||||||||||||||||||||||||||||||||||
Year ended 08/31/21 | 6.94 | 0.25 | 0.43 | 0.68 | (0.27 | ) | – | (0.27 | ) | 7.35 | 9.89 | 585,690 | 1.05 | (d) | 1.05 | (d) | 1.00 | 3.45 | 76 | ||||||||||||||||||||||||||||||||||||||||||||||||||||||||
Year ended 08/31/20 | 7.40 | 0.30 | (0.40 | ) | (0.10 | ) | (0.32 | ) | (0.04 | ) | (0.36 | ) | 6.94 | (1.33 | ) | 428,277 | 1.07 | (d) | 1.08 | (d) | 1.00 | 4.33 | 55 | ||||||||||||||||||||||||||||||||||||||||||||||||||||
Class C | |||||||||||||||||||||||||||||||||||||||||||||||||||||||||||||||||||||||||||
Year ended 08/31/24 | 6.80 | 0.57 | (0.08 | ) | 0.49 | (0.57 | ) | (0.02 | ) | (0.59 | ) | 6.70 | 7.49 | 74,533 | 1.59 | (d) | 1.59 | (d) | 1.54 | 8.48 | 46 | ||||||||||||||||||||||||||||||||||||||||||||||||||||||
Year ended 08/31/23 | 6.92 | 0.54 | (0.04 | ) | 0.50 | (0.61 | ) | (0.01 | ) | (0.62 | ) | 6.80 | 7.66 | 81,271 | 1.60 | (d) | 1.60 | (d) | 1.55 | 8.07 | 29 | ||||||||||||||||||||||||||||||||||||||||||||||||||||||
Year ended 08/31/22 | 7.32 | 0.26 | (0.40 | ) | (0.14 | ) | (0.26 | ) | – | (0.26 | ) | 6.92 | (1.96 | ) | 103,807 | 1.54 | (d) | 1.55 | (d) | 1.51 | 3.63 | 43 | |||||||||||||||||||||||||||||||||||||||||||||||||||||
Year ended 08/31/21 | 6.91 | 0.21 | 0.43 | 0.64 | (0.23 | ) | – | (0.23 | ) | 7.32 | 9.37 | 91,555 | 1.55 | (d) | 1.55 | (d) | 1.50 | 2.95 | 76 | ||||||||||||||||||||||||||||||||||||||||||||||||||||||||
Year ended 08/31/20 | 7.37 | 0.27 | (0.41 | ) | (0.14 | ) | (0.28 | ) | (0.04 | ) | (0.32 | ) | 6.91 | (1.84 | ) | 111,318 | 1.57 | (d) | 1.58 | (d) | 1.50 | 3.83 | 55 | ||||||||||||||||||||||||||||||||||||||||||||||||||||
Class R | |||||||||||||||||||||||||||||||||||||||||||||||||||||||||||||||||||||||||||
Year ended 08/31/24 | 6.84 | 0.59 | (0.07 | ) | 0.52 | (0.59 | ) | (0.02 | ) | (0.61 | ) | 6.75 | 7.93 | 8,545 | 1.34 | (d) | 1.34 | (d) | 1.29 | 8.73 | 46 | ||||||||||||||||||||||||||||||||||||||||||||||||||||||
Year ended 08/31/23 | 6.98 | 0.56 | (0.06 | ) | 0.50 | (0.63 | ) | (0.01 | ) | (0.64 | ) | 6.84 | 7.63 | 8,225 | 1.35 | (d) | 1.35 | (d) | 1.30 | 8.32 | 29 | ||||||||||||||||||||||||||||||||||||||||||||||||||||||
Year ended 08/31/22 | 7.36 | 0.28 | (0.38 | ) | (0.10 | ) | (0.28 | ) | – | (0.28 | ) | 6.98 | (1.40 | ) | 8,208 | 1.29 | (d) | 1.30 | (d) | 1.26 | 3.88 | 43 | |||||||||||||||||||||||||||||||||||||||||||||||||||||
Year ended 08/31/21 | 6.95 | 0.23 | 0.43 | 0.66 | (0.25 | ) | – | (0.25 | ) | 7.36 | 9.61 | 6,076 | 1.30 | (d) | 1.30 | (d) | 1.25 | 3.20 | 76 | ||||||||||||||||||||||||||||||||||||||||||||||||||||||||
Year ended 08/31/20 | 7.41 | 0.29 | (0.41 | ) | (0.12 | ) | (0.30 | ) | (0.04 | ) | (0.34 | ) | 6.95 | (1.57 | ) | 4,874 | 1.32 | (d) | 1.33 | (d) | 1.25 | 4.08 | 55 | ||||||||||||||||||||||||||||||||||||||||||||||||||||
Class Y | |||||||||||||||||||||||||||||||||||||||||||||||||||||||||||||||||||||||||||
Year ended 08/31/24 | 6.82 | 0.63 | (0.09 | ) | 0.54 | (0.62 | ) | (0.02 | ) | (0.64 | ) | 6.72 | 8.30 | 1,237,622 | 0.84 | (d) | 0.84 | (d) | 0.79 | 9.23 | 46 | ||||||||||||||||||||||||||||||||||||||||||||||||||||||
Year ended 08/31/23 | 6.94 | 0.60 | (0.05 | ) | 0.55 | (0.66 | ) | (0.01 | ) | (0.67 | ) | 6.82 | 8.46 | 1,491,738 | 0.85 | (d) | 0.85 | (d) | 0.80 | 8.82 | 29 | ||||||||||||||||||||||||||||||||||||||||||||||||||||||
Year ended 08/31/22 | 7.34 | 0.31 | (0.40 | ) | (0.09 | ) | (0.31 | ) | – | (0.31 | ) | 6.94 | (1.20 | ) | 2,696,320 | 0.79 | (d) | 0.80 | (d) | 0.76 | 4.38 | 43 | |||||||||||||||||||||||||||||||||||||||||||||||||||||
Year ended 08/31/21 | 6.93 | 0.27 | 0.42 | 0.69 | (0.28 | ) | – | (0.28 | ) | 7.34 | 10.18 | 1,232,463 | 0.80 | (d) | 0.80 | (d) | 0.75 | 3.70 | 76 | ||||||||||||||||||||||||||||||||||||||||||||||||||||||||
Year ended 08/31/20 | 7.39 | 0.32 | (0.40 | ) | (0.08 | ) | (0.34 | ) | (0.04 | ) | (0.38 | ) | 6.93 | (1.09 | ) | 350,943 | 0.82 | (d) | 0.83 | (d) | 0.75 | 4.58 | 55 | ||||||||||||||||||||||||||||||||||||||||||||||||||||
Class R5 | |||||||||||||||||||||||||||||||||||||||||||||||||||||||||||||||||||||||||||
Year ended 08/31/24 | 6.83 | 0.63 | (0.09 | ) | 0.54 | (0.62 | ) | (0.02 | ) | (0.64 | ) | 6.73 | 8.31 | 5,942 | 0.84 | (d) | 0.84 | (d) | 0.79 | 9.23 | 46 | ||||||||||||||||||||||||||||||||||||||||||||||||||||||
Year ended 08/31/23 | 6.95 | 0.60 | (0.05 | ) | 0.55 | (0.66 | ) | (0.01 | ) | (0.67 | ) | 6.83 | 8.50 | 4,846 | 0.82 | (d) | 0.82 | (d) | 0.77 | 8.85 | 29 | ||||||||||||||||||||||||||||||||||||||||||||||||||||||
Year ended 08/31/22 | 7.35 | 0.31 | (0.39 | ) | (0.08 | ) | (0.32 | ) | – | (0.32 | ) | 6.95 | (1.18 | ) | 4,762 | 0.77 | (d) | 0.78 | (d) | 0.74 | 4.40 | 43 | |||||||||||||||||||||||||||||||||||||||||||||||||||||
Year ended 08/31/21 | 6.94 | 0.27 | 0.43 | 0.70 | (0.29 | ) | – | (0.29 | ) | 7.35 | 10.23 | 3,631 | 0.77 | (d) | 0.77 | (d) | 0.72 | 3.73 | 76 | ||||||||||||||||||||||||||||||||||||||||||||||||||||||||
Year ended 08/31/20 | 7.41 | 0.32 | (0.41 | ) | (0.09 | ) | (0.34 | ) | (0.04 | ) | (0.38 | ) | 6.94 | (1.21 | ) | 5,515 | 0.81 | (d) | 0.82 | (d) | 0.74 | 4.59 | 55 | ||||||||||||||||||||||||||||||||||||||||||||||||||||
Class R6 | |||||||||||||||||||||||||||||||||||||||||||||||||||||||||||||||||||||||||||
Year ended 08/31/24 | 6.81 | 0.63 | (0.07 | ) | 0.56 | (0.62 | ) | (0.03 | ) | (0.65 | ) | 6.72 | 8.54 | 560,660 | 0.77 | (d) | 0.77 | (d) | 0.72 | 9.30 | 46 | ||||||||||||||||||||||||||||||||||||||||||||||||||||||
Year ended 08/31/23 | 6.93 | 0.60 | (0.05 | ) | 0.55 | (0.66 | ) | (0.01 | ) | (0.67 | ) | 6.81 | 8.57 | 552,394 | 0.75 | (d) | 0.75 | (d) | 0.70 | 8.92 | 29 | ||||||||||||||||||||||||||||||||||||||||||||||||||||||
Year ended 08/31/22 | 7.33 | 0.32 | (0.40 | ) | (0.08 | ) | (0.32 | ) | – | (0.32 | ) | 6.93 | (1.13 | ) | 548,097 | 0.70 | (d) | 0.71 | (d) | 0.67 | 4.47 | 43 | |||||||||||||||||||||||||||||||||||||||||||||||||||||
Year ended 08/31/21 | 6.93 | 0.27 | 0.42 | 0.69 | (0.29 | ) | – | (0.29 | ) | 7.33 | 10.10 | 484,494 | 0.73 | (d) | 0.73 | (d) | 0.68 | 3.77 | 76 | ||||||||||||||||||||||||||||||||||||||||||||||||||||||||
Year ended 08/31/20 | 7.39 | 0.33 | (0.41 | ) | (0.08 | ) | (0.34 | ) | (0.04 | ) | (0.38 | ) | 6.93 | (0.99 | ) | 652,453 | 0.71 | (d) | 0.72 | (d) | 0.64 | 4.69 | 55 | ||||||||||||||||||||||||||||||||||||||||||||||||||||
| (a) | Calculated using average shares outstanding. |
| (b) | Includes adjustments in accordance with accounting principles generally accepted in the United States of America and as such, the net asset value for financial reporting purposes and the returns based upon those net asset values may differ from the net asset value and returns for shareholder transactions. Does not include sales charges and is not annualized for periods less than one year, if applicable. |
| (c) | Portfolio turnover is calculated at the fund level and is not annualized for periods less than one year, if applicable. |
| (d) | Ratio includes line of credit expense of 0.05%, 0.05%, 0.03%, 0.05% and 0.07% for the years ended August 31, 2024, 2023, 2022, 2021 and 2020 respectively. |
See accompanying Notes to Consolidated Financial Statements which are an integral part of the financial statements.
| 22 | Invesco Floating Rate ESG Fund |
Notes to Consolidated Financial Statements
August 31, 2024
NOTE 1–Significant Accounting Policies
Invesco Floating Rate ESG Fund (the “Fund”) is a series portfolio of AIM Counselor Series Trust (Invesco Counselor Series Trust) (the “Trust”). The Trust is a Delaware statutory trust registered under the Investment Company Act of 1940, as amended (the “1940 Act”), as an open-end series management investment company authorized to issue an unlimited number of shares of beneficial interest. Matters affecting the Fund or each class will be voted on exclusively by the shareholders of the Fund or each class.
The Fund may also invest a portion of its assets indirectly through a wholly-owned subsidiary, Invesco Floating Rate ESG TB, LLC, a Delaware limited liability series company (the “Subsidiary”), which formed a separate series. The Fund owns all beneficial and economic interests in the Subsidiary and the Subsidiary’s series. The accompanying consolidated financial statements reflect the financial position of the Fund, the Subsidiary and the Subsidiary’s series and the results of operations on a consolidated basis.
The Fund’s investment objective is total return, comprised of current income and capital appreciation.
The Fund currently consists of six different classes of shares: Class A, Class C, Class R, Class Y, Class R5 and Class R6. Class Y shares are available only to certain investors. Class A shares are sold with a front-end sales charge unless certain waiver criteria are met. Under certain circumstances, load waived shares may be subject to contingent deferred sales charges (“CDSC”). Class C shares are sold with a CDSC. Class R, Class Y, Class R5 and Class R6 shares are sold at net asset value. Class C shares held for eight years after purchase are eligible for automatic conversion into Class A shares of the same Fund (the “Conversion Feature”). The automatic conversion pursuant to the Conversion Feature will generally occur at the end of the month following the eighth anniversary after a purchase of Class C shares.
Effective after the close of business on September 30, 2024, Class R5 shares are closed to new investors.
The Fund is an investment company and accordingly follows the investment company accounting and reporting guidance in accordance with Financial Accounting Standards Board Accounting Standards Codification Topic 946, Financial Services – Investment Companies.
The following is a summary of the significant accounting policies followed by the Fund in the preparation of its consolidated financial statements.
| A. | Security Valuations – Variable rate senior loan interests are fair valued using quotes provided by an independent pricing service. Quotes provided by the pricing service may reflect appropriate factors such as ratings, tranche type, industry, company performance, spread, individual trading characteristics, institution-size trading in similar groups of securities and other market data. |
Securities, including restricted securities, are valued according to the following policy. A security listed or traded on an exchange is generally valued at its trade price or official closing price that day as of the close of the exchange where the security is principally traded, or lacking any trades or official closing price on a particular day, the security may be valued at the closing bid or ask price on that day. Securities traded in the over-the-counter market (but not securities reported on the NASDAQ Stock Exchange) are valued based on the prices furnished by independent pricing services, in which case the securities may be considered fair valued, or by market makers. Each security reported on the NASDAQ Stock Exchange is valued at the NASDAQ Official Closing Price (“NOCP”) as of the close of the customary trading session on the valuation date or absent a NOCP, at the closing bid price.
Futures contracts are valued at the daily settlement price set by an exchange on which they are principally traded. Where a final settlement price exists, exchange-traded options are valued at the final settlement price from the exchange where the option principally trades. Where a final settlement price does not exist, exchange-traded options are valued at the mean between the last bid and ask price generally from the exchange where the option principally trades.
Securities of investment companies that are not exchange-traded (e.g., open-end mutual funds) are valued using such company’s end-of-business-day net asset value per share.
Fixed income securities (including convertible debt securities) generally are valued on the basis of prices provided by independent pricing services. Prices provided by the pricing service may be determined without exclusive reliance on quoted prices, and may reflect appropriate factors such as institution-size trading in similar groups of securities, developments related to specific securities, dividend rate (for unlisted equities), yield (for debt obligations), quality, type of issue, coupon rate (for debt obligations), maturity (for debt obligations), individual trading characteristics and other market data. Pricing services generally value debt obligations assuming orderly transactions of institutional round lot size, but a fund may hold or transact in the same securities in smaller, odd lot sizes. Odd lots often trade at lower prices than institutional round lots, and their value may be adjusted accordingly. Debt obligations are subject to interest rate and credit risks. In addition, all debt obligations involve some risk of default with respect to interest and/or principal payments.
Swap agreements are fair valued using an evaluated quote, if available, provided by an independent pricing service. Evaluated quotes provided by the pricing service are valued based on a model which may include end-of-day net present values, spreads, ratings, industry, company performance and returns of referenced assets. Centrally cleared swap agreements are valued at the daily settlement price determined by the relevant exchange or clearinghouse.
Deposits, other obligations of U.S. and non-U.S. banks and financial institutions are valued at their daily account value.
Foreign securities’ (including foreign exchange contracts) prices are converted into U.S. dollar amounts using the applicable exchange rates as of the close of the New York Stock Exchange (“NYSE”). If market quotations are available and reliable for foreign exchange-traded equity securities, the securities will be valued at the market quotations. Invesco Advisers, Inc. (the “Adviser” or “Invesco”) may use various pricing services to obtain market quotations as well as fair value prices. Because trading hours for certain foreign securities end before the close of the NYSE, closing market quotations may become not representative of market value in the Adviser’s judgment (“unreliable”). If, between the time trading ends on a particular security and the close of the customary trading session on the NYSE, a significant event occurs that makes the closing price of the security unreliable, the Adviser may fair value the security. If the event is likely to have affected the closing price of the security, the security will be valued at fair value in good faith in accordance with Board- approved policies and related Adviser procedures (“Valuation Procedures”). Adjustments to closing prices to reflect fair value may also be based on a screening process of an independent pricing service to indicate the degree of certainty, based on historical data, that the closing price in the principal market where a foreign security trades is not the current value as of the close of the NYSE. Foreign securities’ prices meeting the degree of certainty that the price is not reflective of current value will be priced at the indication of fair value from the independent pricing service. Multiple factors may be considered by the independent pricing service in determining adjustments to reflect fair value and may include information relating to sector indices, American Depositary Receipts and domestic and foreign index futures. Foreign securities may have additional risks including exchange rate changes, potential for sharply devalued currencies and high inflation, political and economic upheaval, the relative lack of issuer information, relatively low market liquidity and the potential lack of strict financial and accounting controls and standards.
Unlisted securities will be valued using prices provided by independent pricing services or by another method that the Adviser, in its judgment, believes better reflects the security’s fair value in accordance with the Valuation Procedures.
Non-traded rights and warrants shall be valued at intrinsic value if the terms of the rights and warrants are available, specifically the subscription or exercise price and the ratio. Intrinsic value is calculated as the daily market closing price of the security to be received less the subscription price, which is then adjusted by the exercise ratio. In the case of warrants, an option pricing model supplied by an independent pricing service may be used based on market data such as volatility, stock price and interest rate from the independent pricing service and strike price and exercise period from verified terms.
Securities for which market prices are not provided by any of the above methods may be valued based upon quotes furnished by independent sources. The mean between the last bid and ask prices may be used to value debt obligations, including corporate loans.
| 23 | Invesco Floating Rate ESG Fund |
Securities for which market quotations are not readily available are fair valued by the Adviser in accordance with the Valuation Procedures. If a fair value price provided by a pricing service is unreliable, the Adviser will fair value the security using the Valuation Procedures. Issuer specific events, market trends, bid/ask quotes of brokers and information providers and other market data may be reviewed in the course of making a good faith determination of a security’s fair value.
The Fund may invest in securities that are subject to interest rate risk, meaning the risk that the prices will generally fall as interest rates rise and, conversely, the prices will generally rise as interest rates fall. Specific securities differ in their sensitivity to changes in interest rates depending on their individual characteristics. Changes in interest rates may result in increased market volatility, which may affect the value and/or liquidity of certain Fund investments.
Valuations change in response to many factors including the historical and prospective earnings of the issuer, the value of the issuer’s assets, general market conditions which are not specifically related to the particular issuer, such as real or perceived adverse economic conditions, changes in the general outlook for revenues or corporate earnings, changes in interest or currency rates, regional or global instability, natural or environmental disasters, widespread disease or other public health issues, war, acts of terrorism, significant governmental actions or adverse investor sentiment generally and market liquidity. Because of the inherent uncertainties of valuation, the values reflected in the consolidated financial statements may materially differ from the value received upon actual sale of those investments.
The price the Fund could receive upon the sale of any investment may differ from the Adviser’s valuation of the investment, particularly for securities that are valued using a fair valuation technique. When fair valuation techniques are applied, the Adviser uses available information, including both observable and unobservable inputs and assumptions, to determine a methodology that will result in a valuation that the Adviser believes approximates market value. Fund securities that are fair valued may be subject to greater fluctuation in their value from one day to the next than would be the case if market quotations were used. Because of the inherent uncertainties of valuation, and the degree of subjectivity in such decisions, the Fund could realize a greater or lesser than expected gain or loss upon the sale of the investment.
| B. | Securities Transactions and Investment Income – Securities transactions are accounted for on a trade date basis. Realized gains or losses on sales are computed on the basis of specific identification of the securities sold. Interest income (net of withholding tax, if any) is recorded on an accrual basis from settlement date and includes coupon interest and amortization of premium and accretion of discount on debt securities as applicable. Pay-in-kind interest income and non-cash dividend income received in the form of securities in lieu of cash are recorded at the fair value of the securities received. Facility fees received may be amortized over the life of the loan. Dividend income (net of withholding tax, if any) is recorded on the ex-dividend date. |
The Fund may periodically participate in litigation related to Fund investments. As such, the Fund may receive proceeds from litigation settlements. Any proceeds received are included in the Consolidated Statement of Operations as realized gain (loss) for investments no longer held and as unrealized gain (loss) for investments still held.
The Fund is plaintiff to legal proceedings in connection with certain of its portfolio investments. The outcome and financial effect, if any, of these legal proceedings cannot be determined at this time because the proceedings are ongoing and have not been fully adjudicated. The Fund received a cash payment of $24,750,688 from the issuer of one of its portfolio investments (Robertshaw US Holding Corp.), the status of which is subject to such ongoing litigation. Consequently, the Fund continues to recognize its investments in the various Robertshaw Term Loans in the Consolidated Schedule of Investments and has recorded the cash received as restricted cash and an offsetting liability proceeds received in connection with pending litigation for such cash proceeds received in the Consolidated Statement of Assets and Liabilities.
Other income is comprised primarily of amendment fees which are recorded when received. Amendment fees are received in return for changes in the terms of the loan or note.
Brokerage commissions and mark ups are considered transaction costs and are recorded as an increase to the cost basis of securities purchased and/or a reduction of proceeds on a sale of securities. Such transaction costs are included in the determination of net realized and unrealized gain (loss) from investment securities reported in the Consolidated Statement of Operations and the Consolidated Statement of Changes in Net Assets and the net realized and unrealized gains (losses) on securities per share in the Consolidated Financial Highlights. Transaction costs are included in the calculation of the Fund’s net asset value and, accordingly, they reduce the Fund’s total returns. These transaction costs are not considered operating expenses and are not reflected in net investment income reported in the Consolidated Statement of Operations and the Consolidated Statement of Changes in Net Assets, or the net investment income per share and the ratios of expenses and net investment income reported in the Consolidated Financial Highlights, nor are they limited by any expense limitation arrangements between the Fund and the investment adviser.
The Fund allocates realized and unrealized capital gains and losses to a class based on the relative net assets of each class. The Fund allocates income to a class based on the relative value of the settled shares of each class.
| C. | Country Determination – For the purposes of making investment selection decisions and presentation in the Consolidated Schedule of Investments, the investment adviser may determine the country in which an issuer is located and/or credit risk exposure based on various factors. These factors include the laws of the country under which the issuer is organized, where the issuer maintains a principal office, the country in which the issuer derives 50% or more of its total revenues, the country that has the primary market for the issuer’s securities and its “country of risk” as determined by a third party service provider, as well as other criteria. Among the other criteria that may be evaluated for making this determination are the country in which the issuer maintains 50% or more of its assets, the type of security, financial guarantees and enhancements, the nature of the collateral and the sponsor organization. Country of issuer and/or credit risk exposure has been determined to be the United States of America, unless otherwise noted. |
| D. | Distributions – Distributions from net investment income, if any, are declared daily and paid monthly. Distributions from net realized capital gain, if any, are generally declared and paid annually and recorded on the ex-dividend date. The Fund may elect to treat a portion of the proceeds from redemptions as distributions for federal income tax purposes. |
| E. | Federal Income Taxes – The Fund intends to comply with the requirements of Subchapter M of the Internal Revenue Code of 1986, as amended (the “Internal Revenue Code”), necessary to qualify as a regulated investment company and to distribute substantially all of the Fund’s taxable earnings to shareholders. As such, the Fund will not be subject to federal income taxes on otherwise taxable income (including net realized capital gain) that is distributed to shareholders. The Subsidiary is treated as a corporation for U.S. federal income tax purposes and generally is subject to U.S. federal and state income tax on its taxable income. |
The Fund recognizes the tax benefits of uncertain tax positions only when the position is more likely than not to be sustained. Management has analyzed the Fund’s uncertain tax positions and concluded that no liability for unrecognized tax benefits should be recorded related to uncertain tax positions. Management is not aware of any tax positions for which it is reasonably possible that the total amounts of unrecognized tax benefits will change materially in the next 12 months.
The Fund files tax returns in the U.S. Federal jurisdiction and certain other jurisdictions. Generally, the Fund is subject to examinations by such taxing authorities for up to three years after the filing of the return for the tax period.
| F. | Expenses – Fees provided for under the Rule 12b-1 plan of a particular class of the Fund are charged to the operations of such class. Transfer agency fees and expenses and other shareholder recordkeeping fees and expenses attributable to Class R5 and Class R6 are allocated based on relative net assets of Class R5 and Class R6. Sub-accounting fees attributable to Class R5 are charged to the operations of the class. Transfer agency fees and expenses and other shareholder recordkeeping fees and expenses relating to all other classes are allocated among those classes based on relative net assets. All other expenses are allocated among the classes based on the relative value of settled shares. |
| G. | Interest, Facilities and Maintenance Fees – Interest, Facilities and Maintenance Fees include interest and related borrowing costs such as commitment fees, administrative expenses, negative or overdrawn balances on margin accounts and other expenses associated with establishing and maintaining a line of credit. |
| H. | Accounting Estimates – The preparation of financial statements in conformity with accounting principles generally accepted in the United States of America |
| 24 | Invesco Floating Rate ESG Fund |
(“GAAP”) requires management to make estimates and assumptions that affect the reported amounts of assets and liabilities at the date of the financial statements and the reported amounts of revenues and expenses during the reporting period including estimates and assumptions related to taxation. Actual results could differ from those estimates by a significant amount. In addition, the Fund monitors for material events or transactions that may occur or become known after the period-end date and before the date the consolidated financial statements are released to print.
| I. | Indemnifications – Under the Trust’s organizational documents, each Trustee, officer, employee or other agent of the Trust is indemnified against certain liabilities that may arise out of the performance of their duties to the Fund. Additionally, in the normal course of business, the Fund enters into contracts, including the Fund’s servicing agreements, that contain a variety of indemnification clauses. The Fund’s maximum exposure under these arrangements is unknown as this would involve future claims that may be made against the Fund that have not yet occurred. The risk of material loss as a result of such indemnification claims is considered remote. |
| J. | Securities Purchased on a When-Issued and Delayed Delivery Basis – The Fund may purchase and sell interests in corporate loans and corporate debt securities and other portfolio securities on a when-issued and delayed delivery basis, with payment and delivery scheduled for a future date. No income accrues to the Fund on such interests or securities in connection with such transactions prior to the date the Fund actually takes delivery of such interests or securities. These transactions are subject to market fluctuations and are subject to the risk that the value at delivery may be more or less than the trade date purchase price. Although the Fund will generally purchase these securities with the intention of acquiring such securities, they may sell such securities prior to the settlement date. |
| K. | Foreign Currency Translations – Foreign currency is valued at the close of the NYSE based on quotations posted by banks and major currency dealers. Portfolio securities and other assets and liabilities denominated in foreign currencies are translated into U.S. dollar amounts at the date of valuation. Purchases and sales of portfolio securities (net of foreign taxes withheld on disposition) and income items denominated in foreign currencies are translated into U.S. dollar amounts on the respective dates of such transactions. The Fund does not separately account for the portion of the results of operations resulting from changes in foreign exchange rates on investments and the fluctuations arising from changes in market prices of securities held. The combined results of changes in foreign exchange rates and the fluctuation of market prices on investments (net of estimated foreign tax withholding) are included with the net realized and unrealized gain or loss from investments in the Consolidated Statement of Operations. Reported net realized foreign currency gains or losses arise from (1) sales of foreign currencies, (2) currency gains or losses realized between the trade and settlement dates on securities transactions, and (3) the difference between the amounts of dividends, interest, and foreign withholding taxes recorded on the Fund’s books and the U.S. dollar equivalent of the amounts actually received or paid. Net unrealized foreign currency gains and losses arise from changes in the fair values of assets and liabilities, other than investments in securities at fiscal period end, resulting from changes in exchange rates. |
The Fund may invest in foreign securities, which may be subject to foreign taxes on income, gains on investments or currency repatriation, a portion of which may be recoverable. Foreign taxes, if any, are recorded based on the tax regulations and rates that exist in the foreign markets in which the Fund invests and are shown in the Consolidated Statement of Operations.
The performance of the Fund may be materially affected positively or negatively by foreign currency strength or weakness relative to the U.S. dollar. Currency rates in foreign countries may fluctuate for a number of reasons, including changes in interest rates, political, economic, or social instability and development, and imposition of currency controls. Currency controls in certain foreign jurisdictions may cause the Fund to experience significant delays in its ability to repatriate its assets in U.S. dollars at quoted spot rates, and it is possible that the Fund’s ability to convert certain foreign currencies into U.S. dollars may be limited and may occur at discounts to quoted rates. As a result, the value of the Fund’s assets and liabilities denominated in such currencies that would ultimately be realized could differ from those reported on the Consolidated Statement of Assets and Liabilities. Certain foreign companies may be subject to sanctions, embargoes, or other governmental actions that may limit the ability to invest in, receive, hold, or sell the securities of such companies, all of which affect the market and/or credit risk of the investments. Because of the inherent uncertainties of valuation, the values reflected in the consolidated financial statements may materially differ from the value received upon actual sale of those investments.
| L. | Forward Foreign Currency Contracts – The Fund may engage in foreign currency transactions either on a spot (i.e. for prompt delivery and settlement) basis, or through forward foreign currency contracts, to manage or minimize currency or exchange rate risk. |
The Fund may also enter into forward foreign currency contracts for the purchase or sale of a security denominated in a foreign currency in order to “lock in” the U.S. dollar price of that security, or the Fund may also enter into forward foreign currency contracts that do not provide for physical exchange of the two currencies on the settlement date, but instead are settled by a single cash payment calculated as the difference between the agreed upon exchange rate and the spot rate at settlement based upon an agreed upon notional amount (non-deliverable forwards).
A forward foreign currency contract is an obligation between two parties (“Counterparties”) to purchase or sell a specific currency for an agreed-upon price at a future date. The use of forward foreign currency contracts for hedging does not eliminate fluctuations in the price of the underlying securities the Fund owns or intends to acquire but establishes a rate of exchange in advance. Fluctuations in the value of these contracts are measured by the difference in the contract date and reporting date exchange rates and are recorded as unrealized appreciation (depreciation) until the contracts are closed. When the contracts are closed, realized gains (losses) are recorded. Realized and unrealized gains (losses) on the contracts are included in the Consolidated Statement of Operations. The primary risks associated with forward foreign currency contracts include failure of the Counterparty to meet the terms of the contract and the value of the foreign currency changing unfavorably. These risks may be in excess of the amounts reflected in the Consolidated Statement of Assets and Liabilities.
| M. | Industry Focus – To the extent that the Fund invests a greater amount of its assets in securities of issuers in the banking and financial services industries, the Fund’s performance will depend to a greater extent on the overall condition of those industries. The value of these securities can be sensitive to changes in government regulation, interest rates and economic downturns in the U.S. and abroad. |
| N. | Bank Loan Risk – Although the resale, or secondary market for floating rate loans has grown substantially over the past decade, both in overall size and number of market participants, there is no organized exchange or board of trade on which floating rate loans are traded. Instead, the secondary market for floating rate loans is a private, unregulated interdealer or interbank resale market. Such a market may therefore be subject to irregular trading activity, wide bid/ask spreads, and extended trade settlement periods, which may impair the Fund’s ability to sell bank loans within its desired time frame or at an acceptable price and its ability to accurately value existing and prospective investments. Extended trade settlement periods may result in cash not being immediately available to the Fund. As a result, the Fund may have to sell other investments or engage in borrowing transactions to raise cash to meet its obligations. Similar to other asset classes, bank loan funds may be exposed to counterparty credit risk, or the risk than an entity with which the Fund has unsettled or open transactions may fail to or be unable to perform on its commitments. The Fund seeks to manage counterparty credit risk by entering into transactions only with counterparties that it believes have the financial resources to honor their obligations and by monitoring the financial stability of those counterparties. |
| O. | LIBOR Transition Risk –The Fund may have investments in financial instruments that recently transitioned from, or continue to be tied to, the London Interbank Offered Rate (“LIBOR”) as the reference or benchmark rate for variable interest rate calculations. LIBOR was a common benchmark interest rate index historically used to make adjustments to variable-rate debt instruments, to determine interest rates for a variety of financial instruments and borrowing arrangements and as a reference rate in derivative contracts. |
The UK Financial Conduct Authority (“FCA”), the regulator that oversees LIBOR, has ceased publishing the majority of LIBOR rates. In April 2023, the FCA announced that some USD LIBOR settings will continue to be published under a synthetic methodology until September 30, 2024 for certain legacy contracts, but any such rates are considered non-representative of the underlying market. Regulators and financial industry working groups have worked to identify alternative reference rates (“ARRs”) to replace LIBOR and to assist with the transition to the new ARRs. Under U.S. regulations that implement a statutory fallback mechanism
| 25 | Invesco Floating Rate ESG Fund |
to replace LIBOR, benchmark rates based on the Secured Overnight Financing Rate (“SOFR”) have replaced LIBOR in certain financial contracts. SOFR is a broad measure of the cost of overnight borrowing of cash through repurchase agreements collateralized by U.S. Treasury securities.
While the transition process away from LIBOR has become increasingly well-defined, there remains uncertainty and risks relating to converting certain longer-term securities and transactions to a new ARR. There can be no assurance that the composition or characteristics of any ARRs or financial instruments in which the Fund invests that utilize ARRs will be similar to or produce the same value or economic equivalence as LIBOR or that these instruments will have the same volume or liquidity. Additionally, while some legacy USD LIBOR instruments may provide for an alternative or fallback rate-setting methodology, there may be significant uncertainty regarding the effectiveness of such methodologies to replicate USD LIBOR; other legacy USD LIBOR instruments may not include such fallback rate-setting provisions at all or may not be able to rely on the statutory fallback mechanism, the effectiveness of which is also uncertain. While it is expected that the market participants will amend legacy financial instruments referencing LIBOR to include such fallback provisions to ARRs, there remains uncertainty regarding the willingness and ability of parties to add or amend such fallback provisions in legacy instruments. Moreover, certain aspects of the transition from LIBOR will rely on the actions of third-party market participants, such as clearing houses, trustees, administrative agents, asset servicers and certain service providers; the Adviser cannot guarantee the performance of such market participants and any failure on the part of such market participants to manage their part of the LIBOR transition could impact the Fund. The Fund may have instruments linked to other interbank offered rates that may also cease to be published in the future. All of the foregoing may adversely affect the Fund’s performance or NAV.
| P. | Leverage Risk – The Fund may utilize leverage to seek to enhance the yield of the Fund by borrowing. There are risks associated with borrowing in an effort to increase the yield and distributions on the common shares, including that the costs of the financial leverage may exceed the income from investments purchased with such leverage proceeds, the higher volatility of the net asset value of the shares, and that fluctuations in the interest rates on the borrowing may affect the yield and distributions to the common shareholders. There can be no assurance that the Fund’s leverage strategy will be successful. |
| Q. | Other Risks – The Fund may invest all or substantially all of its assets in senior secured floating rate loans and senior secured debt securities that are determined to be rated below investment grade. These securities are generally considered to have speculative characteristics and are subject to greater risk of loss of principal and interest than higher rated securities. The value of lower quality debt securities and floating rate loans can be more volatile due to increased sensitivity to adverse issuer, political, regulatory, market or economic developments. |
The Fund invests in corporate loans from U.S. or non-U.S. companies (the “Borrowers”). The investment of the Fund in a corporate loan may take the form of participation interests or assignments. If the Fund purchases a participation interest from a syndicate of lenders (“Lenders”) or one of the participants in the syndicate (“Participant”), one or more of which administers the loan on behalf of all the Lenders (the “Agent Bank”), the Fund would be required to rely on the Lender that sold the participation interest not only for the enforcement of the Fund’s rights against the Borrower but also for the receipt and processing of payments due to the Fund under the corporate loans. As such, the Fund is subject to the credit risk of the Borrower and the Participant. Lenders and Participants interposed between the Fund and a Borrower, together with Agent Banks, are referred to as “Intermediate Participants”.
Because the Fund evaluates environmental, social and governance (“ESG”) factors to assess and exclude certain investments for non-financial reasons, it may forego some market opportunities available to funds that do not use these factors. The securities of issuers that score favorably under the Fund’s ESG scoring methodology may underperform similar issuers that do not score as well or may underperform the market as a whole. As a result, the Fund may underperform funds that do not screen or score issuers based on ESG factors or funds that use a different ESG methodology. Information used by the Fund to evaluate such factors may not be readily available, complete or accurate, which could negatively impact the Fund’s ability to apply its methodology, which in turn could negatively impact the Fund’s performance. In addition, the Fund’s assessment of an issuer, based on the issuer’s level of involvement in a particular industry or the issuer’s ESG score, may differ from that of other funds or an investor. As a result, the issuers deemed eligible for inclusion in the Fund’s portfolio may not reflect the beliefs or values of any particular investor and may not be deemed to exhibit positive or favorable ESG characteristics if different metrics were used to evaluate them.
Increases in the federal funds and equivalent foreign rates or other changes to monetary policy or regulatory actions may expose fixed income markets to heightened volatility, perhaps suddenly and to a significant degree, and to reduced liquidity for certain fixed income investments, particularly those with longer maturities. Such changes and resulting increased volatility may adversely impact the Fund, including its operations, universe of potential investment options, and return potential. It is difficult to predict the impact of interest rate changes on various markets. In addition, decreases in fixed income dealer market-making capacity may also potentially lead to heightened volatility and reduced liquidity in the fixed income markets. As a result, the value of the Fund’s investments and share price may decline. Changes in central bank policies and other governmental actions and political events within the U.S. and abroad may also, among other things, affect investor and consumer expectations and confidence in the financial markets. This could result in higher than normal redemptions by shareholders, which could potentially increase the Fund’s portfolio turnover rate and transaction costs.
NOTE 2–Advisory Fees and Other Fees Paid to Affiliates
The Trust has entered into a master investment advisory agreement with the Adviser. Under the terms of the investment advisory agreement, the Fund accrues daily and pays monthly an advisory fee to the Adviser based on the annual rate of the Fund’s average daily net assets as follows:
| Average Daily Net Assets | Rate | |||
First $500 million | 0.650% | |||
Next $4.5 billion | 0.600% | |||
Next $5 billion | 0.575% | |||
Over $10 billion | 0.550% | |||
For the year ended August 31, 2024, the effective advisory fee rate incurred by the Fund was 0.61%.
Under the terms of a master sub-advisory agreement between the Adviser and each of Invesco Asset Management Deutschland GmbH, Invesco Asset Management Limited, Invesco Asset Management (Japan) Limited, Invesco Hong Kong Limited, Invesco Senior Secured Management, Inc. and Invesco Canada Ltd. and separate sub-advisory agreements with Invesco Capital Management LLC and Invesco Asset Management (India) Private Limited (collectively, the “Affiliated Sub-Advisers”) the Adviser, not the Fund, will pay 40% of the fees paid to the Adviser to any such Affiliated Sub-Adviser(s) that provide(s) discretionary investment management services to the Fund based on the percentage of assets allocated to such Affiliated Sub-Adviser(s).
The Adviser has agreed, for an indefinite period, to waive advisory fees and/or reimburse expenses of all shares to the extent necessary to limit total annual fund operating expenses after fee waiver and/or expense reimbursement (excluding certain items discussed below) of Class A, Class C, Class R, Class Y, Class R5 and Class R6 shares to 1.50%, 2.00%, 1.75%, 1.25%, 1.25% and 1.25%, respectively, of the Fund’s average daily net assets (the “boundary limits”). In determining the Adviser’s obligation to waive advisory fees and/or reimburse expenses, the following expenses are not taken into account, and could cause the total annual fund operating expenses after fee waiver and/or expense reimbursement to exceed the numbers reflected above: (1) interest, facilities and maintenance fees; (2) taxes; (3) dividend expense on short sales; (4) extraordinary or non-routine items, including litigation expenses; and (5) expenses that the Fund has incurred but did not actually pay because of an expense offset arrangement. Invesco may amend and/or terminate these boundary limits at any time in its sole discretion and will inform the Board of Trustees of any such changes. The Adviser did not waive fees and/or reimburse expenses during the period under these boundary limits.
| 26 | Invesco Floating Rate ESG Fund |
Further, the Adviser has contractually agreed, through at least June 30, 2026, to waive the advisory fee payable by the Fund in an amount equal to 100% of the net advisory fees the Adviser receives from the affiliated money market funds on investments by the Fund of uninvested cash in such affiliated money market funds.
For the year ended August 31, 2024, the Adviser waived advisory fees of $94,054.
The Trust has entered into a master administrative services agreement with Invesco pursuant to which the Fund has agreed to pay Invesco for certain administrative costs incurred in providing accounting services to the Fund. For the year ended August 31, 2024, expenses incurred under the agreement are shown in the Consolidated Statement of Operations as Administrative services fees. Invesco has entered into a sub-administration agreement whereby State Street Bank and Trust Company (“SSB”) serves as fund accountant and provides certain administrative services to the Fund. Pursuant to a custody agreement with the Fund, SSB also serves as the Fund’s custodian.
The Trust has entered into a transfer agency and service agreement with Invesco Investment Services, Inc. (“IIS”) pursuant to which the Fund has agreed to pay IIS a fee for providing transfer agency and shareholder services to the Fund and reimburse IIS for certain expenses incurred by IIS in the course of providing such services. IIS may make payments to intermediaries that provide omnibus account services, sub-accounting services and/or networking services. All fees payable by IIS to intermediaries that provide omnibus account services or sub-accounting services are charged back to the Fund, subject to certain limitations approved by the Trust’s Board of Trustees. For the year ended August 31, 2024, expenses incurred under the agreement are shown in the Consolidated Statement of Operations as Transfer agent fees.
The Trust has entered into master distribution agreements with Invesco Distributors, Inc. (“IDI”) to serve as the distributor for the Class A, Class C, Class R, Class Y, Class R5 and Class R6 shares of the Fund. The Trust has adopted plans pursuant to Rule 12b-1 under the 1940 Act with respect to the Fund’s Class A, Class C and Class R shares (collectively, the “Plans”). The Fund, pursuant to the Plans, pays IDI compensation at the annual rate of 0.25% of the Fund’s average daily net assets of Class A shares, 0.75% of the average daily net assets of Class C shares and 0.50% of the average daily net assets of Class R shares. The fees are accrued daily and paid monthly. Of the Plans payments, up to 0.25% of the average daily net assets of each class of shares may be paid to furnish continuing personal shareholder services to customers who purchase and own shares of such classes. Any amounts not paid as a service fee under the Plans would constitute an asset-based sales charge. Rules of the Financial Industry Regulatory Authority (“FINRA”) impose a cap on the total sales charges, including asset-based sales charges, that may be paid by any class of shares of the Fund. For the year ended August 31, 2024, expenses incurred under the Plans are shown in the Consolidated Statement of Operations as Distribution fees.
Front-end sales commissions and CDSC (collectively, the “sales charges”) are not recorded as expenses of the Fund. Front-end sales commissions are deducted from proceeds from the sales of Fund shares prior to investment in Class A shares of the Fund. CDSC are deducted from redemption proceeds prior to remittance to the shareholder. During the year ended August 31, 2024, IDI advised the Fund that IDI retained $117,378 in front-end sales commissions from the sale of Class A shares and $51,833 and $3,612 from Class A and Class C shares, respectively, for CDSC imposed upon redemptions by shareholders.
Certain officers and trustees of the Trust are officers and directors of the Adviser, IIS and/or IDI.
NOTE 3–Additional Valuation Information
GAAP defines fair value as the price that would be received to sell an asset or paid to transfer a liability in an orderly transaction between market participants at the measurement date, under current market conditions. GAAP establishes a hierarchy that prioritizes the inputs to valuation methods, giving the highest priority to readily available unadjusted quoted prices in an active market for identical assets (Level 1) and the lowest priority to significant unobservable inputs (Level 3), generally when market prices are not readily available. Based on the valuation inputs, the securities or other investments are tiered into one of three levels. Changes in valuation methods may result in transfers in or out of an investment’s assigned level:
| Level 1 – | Prices are determined using quoted prices in an active market for identical assets. | |
| Level 2 – | Prices are determined using other significant observable inputs. Observable inputs are inputs that other market participants may use in pricing a security. These may include quoted prices for similar securities, interest rates, prepayment speeds, credit risk, yield curves, loss severities, default rates, discount rates, volatilities and others. When significant events due to market movements occur, foreign securities may be fair valued utilizing an independent pricing service. | |
| Level 3 – | Prices are determined using significant unobservable inputs. In situations where quoted prices or observable inputs are unavailable (for example, when there is little or no market activity for an investment at the end of the period), unobservable inputs may be used. Unobservable inputs reflect the Adviser’s assumptions about the factors market participants would use in determining fair value of the securities or instruments and would be based on the best available information. |
The following is a summary of the tiered valuation input levels, as of August 31, 2024. The level assigned to the securities valuations may not be an indication of the risk or liquidity associated with investing in those securities. Because of the inherent uncertainties of valuation, the values reflected in the consolidated financial statements may materially differ from the value received upon actual sale of those investments.
| Level 1 | Level 2 | Level 3 | Total | |||||||||||||||||||||||||
| ||||||||||||||||||||||||||||
Investments in Securities | ||||||||||||||||||||||||||||
| ||||||||||||||||||||||||||||
Variable Rate Senior Loan Interests | $ | – | $ | 2,128,138,916 | $ | 204,173,262 | $ | 2,332,312,178 | ||||||||||||||||||||
| ||||||||||||||||||||||||||||
U.S. Dollar Denominated Bonds & Notes | – | 159,843,449 | – | 159,843,449 | ||||||||||||||||||||||||
| ||||||||||||||||||||||||||||
Common Stocks & Other Equity Interests | 8,485,614 | 26,309,517 | 39,758,499 | 74,553,630 | ||||||||||||||||||||||||
| ||||||||||||||||||||||||||||
Non-U.S. Dollar Denominated Bonds & Notes | – | 67,585,295 | 130,070 | 67,715,365 | ||||||||||||||||||||||||
| ||||||||||||||||||||||||||||
Preferred Stocks | – | – | 11,807,104 | 11,807,104 | ||||||||||||||||||||||||
| ||||||||||||||||||||||||||||
Money Market Funds | 45,390,471 | – | – | 45,390,471 | ||||||||||||||||||||||||
| ||||||||||||||||||||||||||||
Total Investments in Securities | 53,876,085 | 2,381,877,177 | 255,868,935 | 2,691,622,197 | ||||||||||||||||||||||||
| ||||||||||||||||||||||||||||
Other Investments – Assets* | ||||||||||||||||||||||||||||
| ||||||||||||||||||||||||||||
Investments Matured | – | – | 12,426 | 12,426 | ||||||||||||||||||||||||
| ||||||||||||||||||||||||||||
Forward Foreign Currency Contracts | – | 2,093,145 | – | 2,093,145 | ||||||||||||||||||||||||
| ||||||||||||||||||||||||||||
| – | 2,093,145 | 12,426 | 2,105,571 | |||||||||||||||||||||||||
| ||||||||||||||||||||||||||||
Other Investments – Liabilities* | ||||||||||||||||||||||||||||
| ||||||||||||||||||||||||||||
Forward Foreign Currency Contracts | – | (6,432,872 | ) | – | (6,432,872 | ) | ||||||||||||||||||||||
| ||||||||||||||||||||||||||||
Total Other Investments | – | (4,339,727 | ) | 12,426 | (4,327,301 | ) | ||||||||||||||||||||||
| ||||||||||||||||||||||||||||
Total Investments | $ | 53,876,085 | $ | 2,377,537,450 | $ | 255,881,361 | $ | 2,687,294,896 | ||||||||||||||||||||
| ||||||||||||||||||||||||||||
| * | Forward foreign currency contracts are valued at unrealized appreciation (depreciation). Investments matured are shown at value. |
| 27 | Invesco Floating Rate ESG Fund |
A reconciliation of Level 3 investments is presented when the Fund had a significant amount of Level 3 investments at the beginning and/or end of the reporting period in relation to net assets.
The following is a reconciliation of the fair valuations using significant unobservable inputs (Level 3) during the year ended August 31, 2024:
Value 08/31/23 | Purchases at Cost | Proceeds from Sales | Accrued Discounts/ Premiums | Realized Gain (Loss) | Change in Unrealized Appreciation (Depreciation) | Transfers into Level 3* | Transfers out of Level 3* | Value 08/31/24 | ||||||||||||||||||||||||||||
| Variable Rate Senior Loan Interests | $ | 242,049,841 | $ | 82,924,183 | $ | (89,829,620 | ) | $ | 1,794,519 | $ | (366,957 | ) | $ | (9,803,485 | ) | $ | 26,648,378 | $ | (49,243,597 | ) | $ | 204,173,262 | ||||||||||||||
| Common Stocks & Other Equity Interests | 50,740,230 | 26,510,294 | (29,300,627 | ) | – | 11,654,938 | (12,491,555 | ) | 1,220,674 | (8,575,455 | ) | 39,758,499 | ||||||||||||||||||||||||
| Preferred Stocks | 1,065,869 | – | – | – | – | 4,326,255 | 6,414,980 | – | 11,807,104 | |||||||||||||||||||||||||||
| Non-U.S. Dollar Denominated Bonds & Notes | 431,324 | – | (455,898 | ) | 15,433 | (13,538 | ) | 152,749 | – | – | 130,070 | |||||||||||||||||||||||||
| Investments Matured | 1,009,460 | – | (723,423 | ) | (3,512 | ) | (499,593 | ) | 229,494 | – | – | 12,426 | ||||||||||||||||||||||||
| U.S. Dollar Denominated Bonds & Notes | 217,908 | – | (222,061 | ) | – | – | 4,153 | – | – | – | ||||||||||||||||||||||||||
Total | $ | 295,514,632 | $ | 109,434,477 | $ | (120,531,629 | ) | $ | 1,806,440 | $ | 10,774,850 | $ | (17,582,389 | ) | $ | 34,284,032 | $ | (57,819,052 | ) | $ | 255,881,361 | |||||||||||||||
* Transfers into and out of Level 3 are due to increases or decreases in market activity impacting the available market inputs to determine the price.
Securities determined to be Level 3 at the end of the reporting period were valued primarily by utilizing evaluated prices from a third-party vendor pricing service. A significant change in third-party pricing information could result in a lower or higher value in Level 3 investments.
NOTE 4–Derivative Investments
The Fund may enter into an International Swaps and Derivatives Association Master Agreement (“ISDA Master Agreement”) under which a fund may trade OTC derivatives. An OTC transaction entered into under an ISDA Master Agreement typically involves a collateral posting arrangement, payment netting provisions and close-out netting provisions. These netting provisions allow for reduction of credit risk through netting of contractual obligations. The enforceability of the netting provisions of the ISDA Master Agreement depends on the governing law of the ISDA Master Agreement, among other factors.
For financial reporting purposes, the Fund does not offset OTC derivative assets or liabilities that are subject to ISDA Master Agreements in the Consolidated Statement of Assets and Liabilities.
Value of Derivative Investments at Period-End
The table below summarizes the value of the Fund’s derivative investments, detailed by primary risk exposure, held as of August 31, 2024:
| Value | ||||
| Currency | ||||
| Derivative Assets | Risk | |||
Unrealized appreciation on forward foreign currency contracts outstanding | $ | 2,093,145 | ||
Derivatives not subject to master netting agreements | – | |||
Total Derivative Assets subject to master netting agreements | $ | 2,093,145 | ||
| Value | ||||
| Currency | ||||
| Derivative Liabilities | Risk | |||
| ||||
Unrealized depreciation on forward foreign currency contracts outstanding | $ | (6,432,872 | ) | |
| ||||
Derivatives not subject to master netting agreements | – | |||
| ||||
Total Derivative Liabilities subject to master netting agreements | $ | (6,432,872 | ) | |
| ||||
The table below reflects the Fund’s exposure to Counterparties subject to either an ISDA Master Agreement or other agreement for OTC derivative transactions as of August 31, 2024.
| Financial Derivative Assets | Financial Derivative Liabilities | Collateral (Received)/Pledged | ||||||||||||||||||||||||||||||||||
| Counterparty | Forward Foreign Currency Contracts | Forward Foreign Currency Contracts | Net Value of Derivatives | Non-Cash | Cash | Net Amount | ||||||||||||||||||||||||||||||
| ||||||||||||||||||||||||||||||||||||
| Bank of New York Mellon (The) | $ – | $(1,265,542 | ) | $(1,265,542 | ) | $– | $– | $(1,265,542 | ) | |||||||||||||||||||||||||||
| ||||||||||||||||||||||||||||||||||||
| Barclays Bank PLC | 469,042 | (464,184 | ) | 4,858 | – | – | 4,858 | |||||||||||||||||||||||||||||
| ||||||||||||||||||||||||||||||||||||
| BNP Paribas S.A. | 689,030 | (1,006,631 | ) | (317,601 | ) | – | – | (317,601 | ) | |||||||||||||||||||||||||||
| ||||||||||||||||||||||||||||||||||||
| Canadian Imperial Bank of Commerce | 79,735 | (454,981 | ) | (375,246 | ) | – | – | (375,246 | ) | |||||||||||||||||||||||||||
| ||||||||||||||||||||||||||||||||||||
| Goldman Sachs International | – | (1,961 | ) | (1,961 | ) | – | – | (1,961 | ) | |||||||||||||||||||||||||||
| ||||||||||||||||||||||||||||||||||||
| Morgan Stanley and Co. International PLC | – | (1,158,297 | ) | (1,158,297 | ) | – | – | (1,158,297 | ) | |||||||||||||||||||||||||||
| ||||||||||||||||||||||||||||||||||||
| State Street Bank & Trust Co. | 149,924 | (1,603,022 | ) | (1,453,098 | ) | – | – | (1,453,098 | ) | |||||||||||||||||||||||||||
| ||||||||||||||||||||||||||||||||||||
| Toronto-Dominion Bank (The) | 705,414 | (478,254 | ) | 227,160 | – | – | 227,160 | |||||||||||||||||||||||||||||
| ||||||||||||||||||||||||||||||||||||
Total | $2,093,145 | $(6,432,872 | ) | $(4,339,727 | ) | $– | $– | $(4,339,727 | ) | |||||||||||||||||||||||||||
| ||||||||||||||||||||||||||||||||||||
| 28 | Invesco Floating Rate ESG Fund |
Effect of Derivative Investments for the year ended August 31, 2024
The table below summarizes the gains (losses) on derivative investments, detailed by primary risk exposure, recognized in earnings during the period:
| Location of Gain (Loss) on | |||||
| Consolidated Statement of Operations | |||||
| Currency | |||||
| Risk | |||||
Realized Gain: | |||||
Forward foreign currency contracts | $ | 8,282,407 | |||
Change in Net Unrealized Appreciation (Depreciation): | |||||
Forward foreign currency contracts | (10,464,872 | ) | |||
Total | $ | (2,182,465 | ) | ||
The table below summarizes the average notional value of derivatives held during the period.
| Forward | ||||
| Foreign Currency | ||||
| Contracts | ||||
Average notional value | $791,668,572 | |||
NOTE 5–Expense Offset Arrangement(s)
The expense offset arrangement is comprised of transfer agency credits which result from balances in demand deposit accounts used by the transfer agent for clearing shareholder transactions. For the year ended August 31, 2024, the Fund received credits from this arrangement, which resulted in the reduction of the Fund’s total expenses of $11,307.
NOTE 6–Trustees’ and Officers’ Fees and Benefits
Trustees’ and Officers’ Fees and Benefits include amounts accrued by the Fund to pay remuneration to certain Trustees and Officers of the Fund. Trustees have the option to defer compensation payable by the Fund, and Trustees’ and Officers’ Fees and Benefits also include amounts accrued by the Fund to fund such deferred compensation amounts. Those Trustees who defer compensation have the option to select various Invesco Funds in which their deferral accounts shall be deemed to be invested. Finally, certain current Trustees were eligible to participate in a retirement plan that provided for benefits to be paid upon retirement to Trustees over a period of time based on the number of years of service. The Fund may have certain former Trustees who also participate in a retirement plan and receive benefits under such plan. Trustees’ and Officers’ Fees and Benefits include amounts accrued by the Fund to fund such retirement benefits. Obligations under the deferred compensation and retirement plans represent unsecured claims against the general assets of the Fund.
NOTE 7–Cash Balances and Borrowings
Effective February 16, 2024, the Fund has entered into a credit agreement, which enables the Fund to participate with another Invesco Fund in a committed secured borrowing facility that permits borrowings up to $1,027,500,000, collectively by certain Invesco Funds, and which will expire on February 14, 2025. Prior to February 16, 2024, the credit agreement permitted borrowings up to $1.07 billion. The credit agreement is secured by the assets of the Fund. The Fund is subject to certain covenants relating to the credit agreement. Failure to comply with these restrictions could cause the acceleration of the repayment of the amount outstanding under the credit agreement. During the year ended August 31, 2024, the Fund did not borrow under this agreement.
Additionally, the Fund is permitted to temporarily carry a negative or overdrawn balance in its account with SSB, the custodian bank. Such balances, if any at period-end, are shown in the Consolidated Statement of Assets and Liabilities under the payable caption Amount due custodian. To compensate the custodian bank for such overdrafts, the overdrawn Fund may either (1) leave funds as a compensating balance in the account so the custodian bank can be compensated by earning the additional interest; or (2) compensate by paying the custodian bank at a rate agreed upon by the custodian bank and Invesco, not to exceed the contractually agreed upon rate.
| 29 | Invesco Floating Rate ESG Fund |
NOTE 8–Unfunded Loan Commitments
Pursuant to the terms of certain Senior Loan agreements, the Fund held the following unfunded loan commitments as of August 31, 2024. The Fund intends to reserve against such contingent obligations by designating cash, liquid securities and liquid Senior Loans as a reserve. Unfunded loan commitments are reflected as a liability on the Consolidated Statement of Assets and Liabilities.
| Borrower | Type | Unfunded Loan Commitment | Unrealized Appreciation (Depreciation) | |||||||
| ||||||||||
ABG Intermediate Holdings 2 LLC | Delayed Draw Term Loan | $ 1,933,749 | $ 10,877 | |||||||
| ||||||||||
Alter Domus (Chrysaor Bidco S.a.r.l.) | Delayed Draw Term Loan | 124,689 | 585 | |||||||
| ||||||||||
Epicor Software Corp. | Delayed Draw Term Loan B | 296,600 | 1,887 | |||||||
| ||||||||||
Groundworks LLC | Delayed Draw Term Loan | 1,047,978 | 4,380 | |||||||
| ||||||||||
Kantar (Summer BC Bidco/KANGRP) | Revolver Loan | 6,253,825 | (202,560 | ) | ||||||
| ||||||||||
MB2 Dental Solutions LLC | Revolver Loan | 133,007 | 1,257 | |||||||
| ||||||||||
MB2 Dental Solutions LLC | Delayed Draw Term Loan | 1,428,342 | 1,429 | |||||||
| ||||||||||
MB2 Dental Solutions LLC | Delayed Draw Term Loan | 857,005 | 857 | |||||||
| ||||||||||
McDermott International Ltd. | LOC | 2,256,312 | (191,786 | ) | ||||||
| ||||||||||
Parques Reunidos (Piolin Bidco S.A.U.) | Revolver Loan | 4,547,190 | (43,835 | ) | ||||||
| ||||||||||
Ryan LLC (Ryan Tax) | Delayed Draw Term Loan | 177,115 | 764 | |||||||
| ||||||||||
Tank Holding Corp. | Revolver Loan | 839,656 | (13,825 | ) | ||||||
| ||||||||||
V Global Holdings LLC | Revolver Loan | 456,162 | (28,470 | ) | ||||||
| ||||||||||
| $20,351,630 | $(458,440 | ) | ||||||||
| ||||||||||
NOTE 9–Distributions to Shareholders and Tax Components of Net Assets
Tax Character of Distributions to Shareholders Paid During the Fiscal Years Ended August 31, 2024 and 2023:
| 2024 | 2023 | |||||||
Ordinary income* | $ | 248,021,663 | $306,321,183 | |||||
Return of capital | 10,074,754 | 4,572,190 | ||||||
Total distributions | $ | 258,096,417 | $310,893,373 | |||||
| * | Includes short-term capital gain distributions, if any. |
Tax Components of Net Assets at Period-End:
| 2024 | ||||
| ||||
Net unrealized appreciation (depreciation) – investments | $ | (158,496,094 | ) | |
| ||||
Net unrealized appreciation (depreciation) – foreign currencies | (433,502 | ) | ||
| ||||
Temporary book/tax differences | (110,031 | ) | ||
| ||||
Capital loss carryforward | (425,890,270 | ) | ||
| ||||
Shares of beneficial interest | 3,249,582,138 | |||
| ||||
Total net assets | $ | 2,664,652,241 | ||
| ||||
The difference between book-basis and tax-basis unrealized appreciation (depreciation) is due to differences in the timing of recognition of gains and losses on investments for tax and book purposes. The Fund’s net unrealized appreciation (depreciation) difference is attributable primarily to wash sales, amortization and accretion on debt securities, derivative instruments and debt modification.
The temporary book/tax differences are a result of timing differences between book and tax recognition of income and/or expenses. The Fund’s temporary book/tax differences are the result of the trustee deferral of compensation and retirement plan benefits.
For the year ended August 31, 2024, the Subsidiary did not incur any current or deferred federal income tax expense.
Capital loss carryforward is calculated and reported as of a specific date. Results of transactions and other activity after that date may affect the amount of capital loss carryforward actually available for the Fund to utilize. The ability to utilize capital loss carryforward in the future may be limited under the Internal Revenue Code and related regulations based on the results of future transactions.
The Fund has a capital loss carryforward as of August 31, 2024, as follows:
| Capital Loss Carryforward* | ||||||||||||||||||||
| ||||||||||||||||||||
| Expiration | Short-Term | Long-Term | Total | |||||||||||||||||
| ||||||||||||||||||||
Not subject to expiration | $ | 90,519,363 | $ | 335,370,907 | $ | 425,890,270 | ||||||||||||||
| ||||||||||||||||||||
| * | Capital loss carryforward is reduced for limitations, if any, to the extent required by the Internal Revenue Code and may be further limited depending upon a variety of factors, including the realization of net unrealized gains or losses as of the date of any reorganization. |
NOTE 10–Investment Transactions
The aggregate amount of investment securities (other than short-term securities, U.S. Government obligations and money market funds, if any) purchased and sold by the Fund during the year ended August 31, 2024 was $1,230,063,549 and $1,287,396,732, respectively. As of August 31, 2024, the aggregate cost of
| 30 | Invesco Floating Rate ESG Fund |
investments, including any derivatives, on a tax basis listed below includes the adjustments for financial reporting purposes as of the most recently completed federal income tax reporting period-end:
| Unrealized Appreciation (Depreciation) of Investments on a Tax Basis | ||||
| ||||
Aggregate unrealized appreciation of investments | $ | 64,743,274 | ||
| ||||
Aggregate unrealized (depreciation) of investments | (223,239,368 | ) | ||
| ||||
Net unrealized appreciation (depreciation) of investments | $ | (158,496,094 | ) | |
| ||||
Cost of investments for tax purposes is $2,845,790,990.
NOTE 11–Reclassification of Permanent Differences
Primarily as a result of differing book/tax treatment of foreign currency transactions and return of capital distributions, on August 31, 2024, undistributed net investment income was increased by $17,583,898, undistributed net realized gain (loss) was decreased by $7,509,142 and shares of beneficial interest was decreased by $10,074,756. This reclassification had no effect on the net assets of the Fund.
NOTE 12–Senior Loan Participation Commitments
The Fund invests in participations, assignments, or acts as a party to the primary lending syndicate of a Senior Loan interest to corporations, partnerships, and other entities. When the Fund purchases a participation of a Senior Loan interest, the Fund typically enters into a contractual agreement with the lender or other third party selling the participation, but not with the borrower directly. As such, the Fund assumes the credit risk of the borrower, selling participant or other persons interpositioned between the Fund and the borrower.
At the year ended August 31, 2024, the following sets forth the selling participants with respect to interest in Senior Loans purchased by the Fund on a participation basis.
| Selling Participant | Principal Amount | Value | ||||||||||
| ||||||||||||
Barclays Bank PLC | $ | 6,466,671 | $ | 4,906,518 | ||||||||
| ||||||||||||
JPMorgan Europe Ltd. | 5,395,436 | 4,119,367 | ||||||||||
| ||||||||||||
NOTE 13–Share Information
| Summary of Share Activity | ||||||||||||||||||||||||||||
| ||||||||||||||||||||||||||||
| Year ended August 31, 2024(a) | Year ended August 31, 2023 | |||||||||||||||||||||||||||
| Shares | Amount | Shares | Amount | |||||||||||||||||||||||||
| ||||||||||||||||||||||||||||
Sold: | ||||||||||||||||||||||||||||
Class A | 39,038,491 | $ | 265,297,043 | 24,740,287 | $ | 167,143,126 | ||||||||||||||||||||||
| ||||||||||||||||||||||||||||
Class C | 2,858,957 | 19,335,031 | 1,657,010 | 11,168,875 | ||||||||||||||||||||||||
| ||||||||||||||||||||||||||||
Class R | 276,855 | 1,886,032 | 259,559 | 1,755,006 | ||||||||||||||||||||||||
| ||||||||||||||||||||||||||||
Class Y | 68,844,788 | 466,948,520 | 122,766,037 | 829,675,105 | ||||||||||||||||||||||||
| ||||||||||||||||||||||||||||
Class R5 | 562,326 | 3,828,693 | 154,057 | 1,039,674 | ||||||||||||||||||||||||
| ||||||||||||||||||||||||||||
Class R6 | 27,742,873 | 188,247,400 | 36,935,311 | 249,790,827 | ||||||||||||||||||||||||
| ||||||||||||||||||||||||||||
Issued as reinvestment of dividends: | ||||||||||||||||||||||||||||
Class A | 7,699,619 | 52,236,350 | 7,144,382 | 48,135,446 | ||||||||||||||||||||||||
| ||||||||||||||||||||||||||||
Class C | 678,993 | 4,587,348 | 884,584 | 5,930,520 | ||||||||||||||||||||||||
| ||||||||||||||||||||||||||||
Class R | 106,676 | 725,373 | 108,537 | 732,627 | ||||||||||||||||||||||||
| ||||||||||||||||||||||||||||
Class Y | 11,271,396 | 76,396,915 | 16,953,732 | 114,003,113 | ||||||||||||||||||||||||
| ||||||||||||||||||||||||||||
Class R5 | 82,245 | 558,141 | 69,248 | 466,625 | ||||||||||||||||||||||||
| ||||||||||||||||||||||||||||
Class R6 | 6,458,434 | 43,730,464 | 6,085,864 | 40,903,230 | ||||||||||||||||||||||||
| ||||||||||||||||||||||||||||
Automatic conversion of Class C shares to Class A shares: |
| |||||||||||||||||||||||||||
Class A | 1,086,792 | 7,329,663 | 1,304,992 | 8,819,967 | ||||||||||||||||||||||||
| ||||||||||||||||||||||||||||
Class C | (1,091,617 | ) | (7,329,663 | ) | (1,310,811 | ) | (8,819,967 | ) | ||||||||||||||||||||
| ||||||||||||||||||||||||||||
| 31 | Invesco Floating Rate ESG Fund |
| Summary of Share Activity | ||||||||||||||||||||||||||||
| ||||||||||||||||||||||||||||
| Year ended August 31, 2024(a) | Year ended August 31, 2023 | |||||||||||||||||||||||||||
| Shares | Amount | Shares | Amount | |||||||||||||||||||||||||
| ||||||||||||||||||||||||||||
Reacquired: | ||||||||||||||||||||||||||||
Class A | (30,277,736 | ) | $ | (205,467,623 | ) | (43,493,816 | ) | $ | (294,042,422 | ) | ||||||||||||||||||
| ||||||||||||||||||||||||||||
Class C | (3,282,290 | ) | (22,221,645 | ) | (4,282,558 | ) | (28,791,625 | ) | ||||||||||||||||||||
| ||||||||||||||||||||||||||||
Class R | (320,022 | ) | (2,179,119 | ) | (341,385 | ) | (2,306,431 | ) | ||||||||||||||||||||
| ||||||||||||||||||||||||||||
Class Y | (114,823,980 | ) | (778,295,739 | ) | (309,560,685 | ) | (2,086,907,103 | ) | ||||||||||||||||||||
| ||||||||||||||||||||||||||||
Class R5 | (471,620 | ) | (3,202,485 | ) | (199,142 | ) | (1,349,631 | ) | ||||||||||||||||||||
| ||||||||||||||||||||||||||||
Class R6 | (31,819,316 | ) | (216,021,929 | ) | (41,024,647 | ) | (276,654,597 | ) | ||||||||||||||||||||
| ||||||||||||||||||||||||||||
Net increase (decrease) in share activity | (15,378,136 | ) | $ | (103,611,230 | ) | (181,149,444 | ) | $ | (1,219,307,635 | ) | ||||||||||||||||||
| ||||||||||||||||||||||||||||
| (a) | There are entities that are record owners of more than 5% of the outstanding shares of the Fund and in the aggregate own 52% of the outstanding shares of the Fund. IDI has an agreement with these entities to sell Fund shares. The Fund, Invesco and/or Invesco affiliates may make payments to these entities, which are considered to be related to the Fund, for providing services to the Fund, Invesco and/or Invesco affiliates including but not limited to services such as securities brokerage, distribution, third party record keeping and account servicing. The Fund has no knowledge as to whether all or any portion of the shares owned of record by these entities are also owned beneficially. |
| 32 | Invesco Floating Rate ESG Fund |
Report of Independent Registered Public Accounting Firm
To the Board of Trustees of AIM Counselor Series Trust (Invesco Counselor Series Trust) and Shareholders of Invesco Floating Rate ESG Fund
Opinion on the Consolidated Financial Statements
We have audited the accompanying consolidated statement of assets and liabilities, including the consolidated schedule of investments, of Invesco Floating Rate ESG Fund and its subsidiary (one of the funds constituting AIM Counselor Series Trust (Invesco Counselor Series Trust), referred to hereafter as the “Fund”) as of August 31, 2024, the related consolidated statement of operations for the year ended August 31, 2024, the consolidated statement of changes in net assets for each of the two years in the period ended August 31, 2024, including the related notes, and the consolidated financial highlights for each of the five years in the period ended August 31, 2024 (collectively referred to as the “consolidated financial statements”). In our opinion, the consolidated financial statements present fairly, in all material respects, the financial position of the Fund as of August 31, 2024, the results of its operations for the year then ended, the changes in its net assets for each of the two years in the period ended August 31, 2024 and the financial highlights for each of the five years in the period ended August 31, 2024 in conformity with accounting principles generally accepted in the United States of America.
Basis for Opinion
These consolidated financial statements are the responsibility of the Fund’s management. Our responsibility is to express an opinion on the Fund’s consolidated financial statements based on our audits. We are a public accounting firm registered with the Public Company Accounting Oversight Board (United States) (PCAOB) and are required to be independent with respect to the Fund in accordance with the U.S. federal securities laws and the applicable rules and regulations of the Securities and Exchange Commission and the PCAOB.
We conducted our audits of these consolidated financial statements in accordance with the standards of the PCAOB. Those standards require that we plan and perform the audit to obtain reasonable assurance about whether the consolidated financial statements are free of material misstatement, whether due to error or fraud.
Our audits included performing procedures to assess the risks of material misstatement of the consolidated financial statements, whether due to error or fraud, and performing procedures that respond to those risks. Such procedures included examining, on a test basis, evidence regarding the amounts and disclosures in the consolidated financial statements. Our audits also included evaluating the accounting principles used and significant estimates made by management, as well as evaluating the overall presentation of the consolidated financial statements. Our procedures included confirmation of securities owned as of August 31, 2024 by correspondence with the custodian, transfer agent, portfolio company investees, brokers and agent banks; when replies were not received from portfolio company investees, brokers or agent banks, we performed other auditing procedures. We believe that our audits provide a reasonable basis for our opinion.
/s/PricewaterhouseCoopers LLP
Houston, Texas
October 23, 2024
We have served as the auditor of one or more of the investment companies in the Invesco group of investment companies since at least 1995. We have not been able to determine the specific year we began serving as auditor.
| 33 | Invesco Floating Rate ESG Fund |
Approval of Investment Advisory and Sub-Advisory Contracts
At meetings held on June 12, 2024, the Board of Trustees (the Board or the Trustees) of AIM Counselor Series Trust (Invesco Counselor Series Trust) as a whole, and the independent Trustees, who comprise over 75% of the Board, voting separately, approved the continuance of the Invesco Floating Rate ESG Fund’s (the Fund) Master Investment Advisory Agreement with Invesco Advisers, Inc. (Invesco Advisers and the investment advisory agreement) and the Master Intergroup Sub-Advisory Contract for Mutual Funds with Invesco Asset Management Deutschland GmbH, Invesco Asset Management Limited, Invesco Asset Management (Japan) Limited, Invesco Hong Kong Limited, Invesco Senior Secured Management, Inc. and Invesco Canada Ltd. and separate sub-advisory contracts with Invesco Capital Management LLC and Invesco Asset Management (India) Private Limited (collectively, the Affiliated Sub-Advisers and the sub-advisory contracts) for another year, effective July 1, 2024. After evaluating the factors discussed below, among others, the Board approved the renewal of the Fund’s investment advisory agreement and the sub-advisory contracts and determined that the compensation payable thereunder by the Fund to Invesco Advisers and by Invesco Advisers to the Affiliated Sub-Advisers is fair and reasonable.
The Board’s Evaluation Process
The Board has established an Investments Committee, which in turn has established Sub-Committees, that meet throughout the year to review the performance of funds advised by Invesco Advisers (the Invesco Funds). The Sub-Committees meet regularly with portfolio managers for their assigned Invesco Funds and other members of management to review information about investment performance and portfolio attributes of these funds. The Board has established additional standing and ad hoc committees that meet regularly throughout the year to review matters within their purview, including a working group focused on opportunities to make ongoing and continuous improvements to the annual review process for the Invesco Funds’ investment advisory and sub-advisory contracts. The Board took into account evaluations and reports that it received from its committees and sub-committees, as well as the information provided to the Board and its committees and sub-committees throughout the year, in considering whether to approve each Invesco Fund’s investment advisory agreement and sub-advisory contracts.
As part of the contract renewal process, the Board reviews and considers information provided in response to requests for information submitted to management by the independent Trustees with assistance from legal counsel to the independent Trustees and the Senior Officer, an officer of the Invesco Funds who reports directly to the independent Trustees. The Board receives comparative investment performance and fee and expense data regarding the Invesco Funds prepared by Broadridge Financial Solutions, Inc. (Broadridge), an independent mutual fund data provider, as well as information on the composition of the peer groups provided by Broadridge and its methodology for determining peer groups. The Board also receives an independent written evaluation from the Senior
Officer. The Senior Officer’s evaluation is prepared as part of his responsibility to manage the process by which the Invesco Funds’ proposed management fees are negotiated during the annual contract renewal process to ensure they are negotiated in a manner that is at arms’ length and reasonable in accordance with certain negotiated regulatory requirements. In addition to meetings with Invesco Advisers and fund counsel throughout the year and as part of meetings convened on May 7, 2024 and June 12, 2024, the independent Trustees also discussed the continuance of the investment advisory agreement and sub-advisory contracts in separate sessions with the Senior Officer and with independent legal counsel. Also, as part of the contract renewal process, the independent Trustees reviewed and considered information provided in response to follow-up requests for information submitted by the independent Trustees to management. The independent Trustees met and discussed those follow-up responses with legal counsel to the independent Trustees and the Senior Officer.
The discussion below is a summary of the Senior Officer’s independent written evaluation with respect to the Fund’s investment advisory agreement and sub-advisory contracts, as well as a discussion of the material factors and related conclusions that formed the basis for the Board’s approval of the Fund’s investment advisory agreement and sub-advisory contracts. The Trustees’ review and conclusions are based on the comprehensive consideration of all information presented to them during the course of the year and in prior years and are not the result of any single determinative factor. Moreover, one Trustee may have weighed a particular piece of information or factor differently than another Trustee. The information received and considered by the Board was current as of various dates prior to the Board’s approval on June 12, 2024.
Factors and Conclusions and Summary of Independent Written Fee Evaluation
| A. | Nature, Extent and Quality of Services Provided by Invesco Advisers and the Affiliated Sub-Advisers |
The Board reviewed the nature, extent and quality of the advisory services provided to the Fund by Invesco Advisers under the Fund’s investment advisory agreement, and the credentials and experience of the officers and employees of Invesco Advisers who provide these services, including the Fund’s portfolio manager(s). The Board’s review included consideration of Invesco Advisers’ investment process and oversight, credit analysis, and research capabilities. The Board considered information regarding Invesco Advisers’ programs for and resources devoted to risk management, including management of investment, enterprise, operational, liquidity, derivatives, valuation and compliance risks, and technology used to manage such risks. The Board received information regarding Invesco’s methodology for compensating its investment professionals and the incentives and accountability it creates, as well as how it impacts Invesco’s ability to attract and retain talent. The Board received a description of, and reports related to, Invesco Advisers’ global security program and business continuity plans and of its approach to data privacy and cybersecurity, including related testing. The
Board also considered non-advisory services that Invesco Advisers and its affiliates provide to the Invesco Funds, such as various middle office and back office support functions, third party oversight, internal audit, valuation, portfolio trading and legal and compliance. The Board observed that Invesco Advisers’ systems preparedness and ongoing investment enabled Invesco Advisers to manage, operate and oversee the Invesco Funds with minimal impact or disruption through challenging environments. The Board reviewed and considered the benefits to shareholders of investing in a Fund that is part of the family of funds under the umbrella of Invesco Ltd., Invesco Advisers’ parent company, and noted Invesco Ltd.’s depth and experience in running an investment management business, as well as its commitment of financial and other resources to such business. The Board concluded that the nature, extent and quality of the services provided to the Fund by Invesco Advisers are appropriate and satisfactory.
The Board reviewed the services that may be provided to the Fund by the Affiliated Sub-Advisers under the sub-advisory contracts and the credentials and experience of the officers and employees of the Affiliated Sub-Advisers who provide these services. The Board noted the Affiliated Sub-Advisers’ expertise with respect to certain asset classes and that the Affiliated Sub-Advisers have offices and personnel that are located in financial centers around the world. As a result, the Board noted that the Affiliated Sub-Advisers can provide research and investment analysis on the markets and economies of various countries and territories in which the Fund may invest, make recommendations regarding securities and assist with portfolio trading. The Board concluded that the sub-advisory contracts may benefit the Fund and its shareholders by permitting Invesco Advisers to use the resources and talents of the Affiliated Sub-Advisers in managing the Fund. The Board concluded that the nature, extent and quality of the services that may be provided to the Fund by the Affiliated Sub-Advisers are appropriate and satisfactory.
| B. | Fund Investment Performance |
The Board considered Fund investment performance as a relevant factor in considering whether to approve the investment advisory agreement as well as the sub-advisory contracts for the Fund, as Invesco Senior Secured Management, Inc. currently manages assets of the Fund.
The Board compared the Fund’s investment performance over multiple time periods ending December 31, 2023 to the performance of funds in the Broadridge performance universe and against the Credit Suisse Leveraged Loan Index (Index). The Board noted that performance of Class A shares of the Fund was in the third quintile of its performance universe for the one year period and the second quintile for the three and five year periods (the first quintile being the best performing funds and the fifth quintile being the worst performing funds). The Board noted that performance of Class A shares of the Fund was below the performance of the Index for the one, three and five year periods. The Board acknowledged limitations regarding the Broadridge data, in particular that differences may exist between the Fund’s investment objective, principal investment
| 34 | Invesco Floating Rate ESG Fund |
strategies and/or investment restrictions and those of the funds in its performance universe and specifically that, unlike the Fund, many of the peer funds do not incorporate ESG criteria into the investment process. The Board recognized that the performance data reflects a snapshot in time as of a particular date and that selecting a different performance period could produce different results. The Board also reviewed more recent Fund performance as well as other performance metrics, which did not change its conclusions.
| C. | Advisory and Sub-Advisory Fees and Fund Expenses |
The Board compared the Fund’s contractual management fee rate to the contractual management fee rates of funds in the Fund’s Broadridge expense group. The Board noted that the contractual management and actual management fee rates for Class A shares of the Fund were reasonably comparable to and above, respectively, the median contractual management and actual management fee rates of funds in its expense group. The Board noted that the term “contractual management fee” and “actual management fee” for funds in the expense group may include both advisory and certain non-portfolio management administrative services fees, but that Broadridge is not able to provide information on a fund-by-fund basis as to what is included. The Board also reviewed the methodology used by Broadridge in calculating expense group information, which includes using each fund’s contractual management fee schedule (including any applicable breakpoints) as reported in the most recent prospectus or statement of additional information for each fund in the expense group. The Board also considered comparative information regarding the Fund’s total expense ratio and its various components. The Board noted that the Fund’s actual management fees and total expense ratio were in the fifth and fourth quintile, respectively, of its expense group and discussed with management reasons for such relative actual management fees and total expenses. As previously noted, the independent Trustees reviewed and considered additional information provided by management, which highlighted the additional complexity, infrastructure, resources and time required in managing an ESG-thematic fund, where the peers in the expense group may not incorporate ESG factors in their investment strategies, and the Fund’s leveraging of Invesco’s private credit platform. The independent Trustees met and discussed those responses with legal counsel to the independent Trustees and the Senior Officer, and subsequently with representatives of management.
The Board noted that Invesco Advisers has voluntarily agreed to waive fees and/or limit expenses of the Fund for an indefinite period until further notice to the Board in an amount necessary to limit total annual operating expenses to a specified percentage of average daily net assets for each class of the Fund.
The Board also considered the fees charged by Invesco Advisers and its affiliates to other client accounts that are similarly managed. Invesco Advisers reviewed with the Board differences in the scope of services it provides to the Invesco Funds relative to that provided by Invesco Advisers and its affiliates to certain other types of client accounts, including, among others: management of cash flows as a result of redemptions and purchases; necessary infrastructure such as officers, office space,
technology, legal and distribution; oversight of service providers; costs and business risks associated with launching new funds and sponsoring and maintaining the product line; and compliance with federal and state laws and regulations. Invesco Advisers also advised the Board that many of the similarly managed client accounts have all-inclusive fee structures, which are not easily un-bundled.
The Board also considered the services that may be provided by the Affiliated Sub-Advisers pursuant to the sub-advisory contracts, as well as the fees payable by Invesco Advisers to the Affiliated Sub-Advisers pursuant to the sub-advisory contracts. The Board noted that Invesco Advisers retains overall responsibility for, and provides services to, sub-advised Invesco Funds, including oversight of the Affiliated Sub-Advisers as well as the additional services described herein other than day-to-day portfolio management.
| D. | Economies of Scale and Breakpoints |
The Board considered the extent to which there may be economies of scale in the provision of advisory services to the Fund and the Invesco Funds, and the extent to which such economies of scale are shared with the Fund and the Invesco Funds. The Board acknowledged the difficulty in calculating and measuring economies of scale at the individual fund level; noting that only indicative and estimated measures are available at the individual fund level and that such measures are subject to uncertainty. The Board considered that the Fund benefits from economies of scale through contractual breakpoints in the Fund’s advisory fee schedule, which generally operate to reduce the Fund’s expense ratio as it grows in size. The Board noted that the Fund also shares in economies of scale through Invesco Advisers’ ability to negotiate lower fee arrangements with third party service providers. The Board noted that the Fund may also benefit from economies of scale through initial fee setting, fee waivers and expense reimbursements, as well as Invesco Advisers’ investment in its business, including investments in business infrastructure, technology and cybersecurity.
| E. | Profitability and Financial Resources |
The Board reviewed information from Invesco Advisers concerning the costs of the advisory and other services that Invesco Advisers and its affiliates provide to the Fund and the Invesco Funds and the profitability of Invesco Advisers and its affiliates in providing these services in the aggregate and on an individual fund-by-fund basis. The Board considered the methodology used for calculating profitability and the periodic review and enhancement of such methodology. The Board noted that Invesco Advisers continues to operate at a net profit from services Invesco Advisers and its affiliates provide to the Invesco Funds in the aggregate and to most Invesco Funds individually. The Board considered that profits to Invesco Advisers can vary significantly depending on the particular Invesco Fund, with some Invesco Funds showing indicative losses to Invesco Advisers and others showing indicative profits at healthy levels, and that Invesco Advisers’ support for and commitment to an Invesco Fund are not, however, solely dependent on the profits attributed to such Fund. The Board did not deem the level of profits realized by Invesco Advisers and its affiliates from providing such services to be excessive, given the nature, extent and quality of the services provided. The Board noted that Invesco Advisers provided information demonstrating that Invesco Advisers is
financially sound and has the resources necessary to perform its obligations under the investment advisory agreement, and provided representations indicating that the Affiliated Sub-Advisers are financially sound and have the resources necessary to perform their obligations under the sub-advisory contracts. The Board noted the cyclical and competitive nature of the global asset management industry.
| F. | Collateral Benefits to Invesco Advisers and its Affiliates |
The Board considered various other benefits received by Invesco Advisers and its affiliates from the relationship with the Fund, including the fees received for providing administrative, transfer agency and distribution services to the Fund. The Board received comparative information regarding fees charged for these services, including information provided by Broadridge and other independent sources. The Board reviewed the performance of Invesco Advisers and its affiliates in providing these services and the organizational structure employed to provide these services. The Board noted that these services are provided to the Fund pursuant to written contracts that are reviewed and subject to approval on an annual basis by the Board based on its determination that the services are required for the operation of the Fund.
The Board considered the benefits realized by Invesco Advisers and the Affiliated Sub-Advisers as a result of portfolio brokerage transactions executed through “soft dollar” arrangements. Invesco Advisers noted that the Fund does not execute brokerage transactions through “soft dollar” arrangements to any significant degree.
The Board considered that the Fund’s uninvested cash and cash collateral from any securities lending arrangements may be invested in registered money market funds or, with regard to securities lending cash collateral, unregistered funds that comply with Rule 2a-7 under the Investment Company Act of 1940 (collectively referred to as “affiliated money market funds”) advised by Invesco Advisers. The Board considered information regarding the returns of the affiliated money market funds relative to comparable overnight investments, as well as the fees paid by the affiliated money market funds to Invesco Advisers and its affiliates. In this regard, the Board noted that Invesco Advisers receives advisory fees from these affiliated money market funds attributable to the Fund’s investments. The Board also noted that Invesco Advisers has contractually agreed to waive through varying periods an amount equal to 100% of the net advisory fee Invesco Advisers receives from the affiliated money market funds with respect to the Fund’s investment in the affiliated money market funds of uninvested cash, but not cash collateral. The Board concluded that the advisory fees payable to Invesco Advisers from the Fund’s investment of cash collateral from any securities lending arrangements in the affiliated money market funds are for services that are not duplicative of services provided by Invesco Advisers to the Fund.
The Board considered that Invesco Advisers may serve as the Fund’s affiliated securities lending agent and evaluated the benefits realized by Invesco Advisers when serving in such role, including the compensation received. The Board considered Invesco Advisers’ securities lending platform and corporate governance structure for securities lending, including Invesco Advisers’ Securities Lending Governance Committee and its related
| 35 | Invesco Floating Rate ESG Fund |
responsibilities. The Board noted that to the extent the Fund utilizes Invesco Advisers as an affiliated securities lending agent, the Fund conducts its securities lending in accordance with, and in reliance upon, no-action letters issued by the SEC staff that provide guidance on how an affiliate may act as a direct agent lender and receive compensation for those services without obtaining exemptive relief. The Board considered information provided by Invesco Advisers related to the performance of Invesco Advisers as securities lending agent, including a summary of the securities lending services provided to the Fund by Invesco Advisers and the compensation paid to Invesco Advisers for such services, as well as any revenues generated for the Fund in connection with such securities lending activity and the allocation of such revenue between the Fund and Invesco Advisers.
The Board also received information about commissions that an affiliated broker may receive for executing certain trades for the Fund. Invesco Advisers and the Affiliated Sub-Advisers advised the Board of the benefits to the Fund of executing trades through the affiliated broker and that such trades were executed in compliance with rules under the federal securities laws and consistent with best execution obligations.
| 36 | Invesco Floating Rate ESG Fund |
Tax Information
Form 1099-DIV, Form 1042-S and other year–end tax information provide shareholders with actual calendar year amounts that should be included in their tax returns. Shareholders should consult their tax advisers.
The following distribution information is being provided as required by the Internal Revenue Code or to meet a specific state’s requirement.
The Fund designates the following amounts or, if subsequently determined to be different, the maximum amount allowable for its fiscal year ended August 31, 2024:
Federal and State Income Tax | ||||||
Qualified Dividend Income* | 0.00 | % | ||||
Corporate Dividends Received Deduction* | 0.00 | % | ||||
U.S. Treasury Obligations* | 0.00 | % | ||||
Qualified Business Income* | 0.00 | % | ||||
Business Interest Income* | 99.42 | % | ||||
* The above percentages are based on ordinary income dividends paid to shareholders during the Fund’s fiscal year. | ||||||
| 37 | Invesco Floating Rate ESG Fund |
Other Information Required in Form N-CSR (Items 8-11)
Changes in and Disagreements with Accountants for Open-End Management Investment Companies
Not applicable.
Proxy Disclosures for Open-End Management Investment Companies
Not applicable.
Remuneration Paid to Directors, Officers, and Others of Open-End Management Investment Companies
The aggregate remuneration paid to directors, officers and others is disclosed within the financial statements.
Statement Regarding Basis for Approval of Investment Advisory Contracts
The statement regarding basis for approval of investment advisory contracts can be found in the Approval of Investment Advisory and Sub-Advisory Contracts section of this report.
| 38 | Invesco Floating Rate ESG Fund |
(This page intentionally left blank)
| SEC file number(s): 811-09913 and 333-36074 | Invesco Distributors, Inc. | FLR-NCSR |

| Annual Financial Statements and Other Information | August 31, 2024 |
| Shares | Value | ||
| Common Stocks & Other Equity Interests–71.31% | |||
| Belgium–0.99% | |||
| Cofinimmo S.A. | 88,830 | $6,065,805 | |
| Canada–3.14% | |||
| Allied Properties REIT | 192,800 | 2,487,880 | |
| Canadian Apartment Properties REIT | 135,100 | 5,251,021 | |
| RioCan REIT | 220,100 | 3,045,943 | |
| StorageVault Canada, Inc. | 2,320,955 | 8,335,564 | |
| 19,120,408 | |||
| France–2.52% | |||
| Gecina S.A. | 43,554 | 4,786,118 | |
| Unibail-Rodamco-Westfield SE | 132,627 | 10,605,395 | |
| 15,391,513 | |||
| Germany–3.56% | |||
| LEG Immobilien SE | 120,578 | 11,644,200 | |
| Sirius Real Estate Ltd. | 7,792,084 | 10,034,526 | |
| 21,678,726 | |||
| Hong Kong–2.68% | |||
| Link REIT | 1,966,300 | 9,240,662 | |
| Sun Hung Kai Properties Ltd. | 730,000 | 7,092,263 | |
| 16,332,925 | |||
| Japan–6.52% | |||
| GLP J-Reit | 12,657 | 11,576,893 | |
| Mitsui Fudosan Co. Ltd. | 1,668,900 | 18,077,518 | |
| Mitsui Fudosan Logistics Park, Inc. | 1,085 | 3,264,849 | |
| Nippon Prologis REIT, Inc. | 3,867 | 6,812,206 | |
| 39,731,466 | |||
| Singapore–0.89% | |||
| CapitaLand Investment Ltd. | 2,599,200 | 5,399,381 | |
| Spain–0.96% | |||
| Cellnex Telecom S.A.(a) | 151,915 | 5,866,206 | |
| Sweden–0.81% | |||
| Castellum AB(b) | 361,135 | 4,938,365 | |
| United Kingdom–4.71% | |||
| Land Securities Group PLC | 818,384 | 6,794,243 | |
| LondonMetric Property PLC | 2,337,971 | 6,305,307 | |
| Safestore Holdings PLC | 372,228 | 4,256,195 | |
| Segro PLC | 665,809 | 7,665,479 | |
| Tritax Big Box REIT PLC | 1,705,499 | 3,664,162 | |
| 28,685,386 | |||
| United States–44.53% | |||
| Alexandria Real Estate Equities, Inc. | 141,236 | 16,887,589 | |
| American Homes 4 Rent, Class A | 116,866 | 4,647,761 | |
| American Tower Corp. | 41,669 | 9,336,356 | |
| Americold Realty Trust, Inc.(c) | 232,111 | 6,731,219 | |
| Digital Realty Trust, Inc. | 77,342 | 11,725,821 | |
| Equinix, Inc. | 29,013 | 24,207,287 | |
| Extra Space Storage, Inc. | 19,273 | 3,411,321 | |
| Healthpeak Properties, Inc. | 221,440 | 4,933,683 | |
| Shares | Value | ||
| United States–(continued) | |||
| Host Hotels & Resorts, Inc.(c) | 271,797 | $4,810,807 | |
| Invitation Homes, Inc. | 334,681 | 12,329,648 | |
| Kimco Realty Corp. | 376,464 | 8,756,553 | |
| Lineage, Inc.(b) | 48,431 | 4,063,361 | |
| Outfront Media, Inc. | 460,179 | 7,846,052 | |
| Prologis, Inc. | 337,387 | 43,124,806 | |
| Public Storage | 70,187 | 24,124,676 | |
| Realty Income Corp. | 287,663 | 17,866,749 | |
| Rexford Industrial Realty, Inc.(c) | 383,012 | 19,502,971 | |
| Simon Property Group, Inc. | 104,341 | 17,461,466 | |
| Sun Communities, Inc.(c) | 64,583 | 8,734,205 | |
| Terreno Realty Corp.(c) | 181,186 | 12,509,081 | |
| Ventas, Inc. | 133,767 | 8,308,268 | |
| 271,319,680 | |||
| Total Common Stocks & Other Equity Interests (Cost $392,841,408) | 434,529,861 | ||
| Principal Amount | |||
| Asset-Backed Securities–17.72% | |||
| BPR Trust, Series 2022-OANA, Class D, 9.03% (1 mo. Term SOFR + 3.70%), 04/15/2037(a)(d) | $875,000 | 876,383 | |
| BX Commercial Mortgage Trust, | |||
| Series 2021-VOLT, Class D, 7.10% (1 mo. Term SOFR + 1.76%), 09/15/2036(a)(d) | 6,000,000 | 5,910,010 | |
| Series 2021-VOLT, Class E, 7.45% (1 mo. Term SOFR + 2.11%), 09/15/2036(a)(d) | 6,495,000 | 6,392,603 | |
| Series 2022-CSMO, Class C, 9.23% (1 mo. Term SOFR + 3.89%), 06/15/2027(a)(d) | 600,000 | 603,957 | |
| Series 2022-CSMO, Class D, 9.67% (1 mo. Term SOFR + 4.34%), 06/15/2027(a)(d) | 2,380,000 | 2,398,130 | |
| BX Trust, | |||
| Series 2021-MFM1, Class E, 7.70% (1 mo. Term SOFR + 2.36%), 01/15/2034(a)(d) | 7,350,000 | 7,188,738 | |
| Series 2019-OC11, Class E, 4.08%, 12/09/2041(a)(e) | 4,000,000 | 3,540,082 | |
| CEDR Commercial Mortgage Trust, Series 2022-SNAI, Class E, 8.36% (1 mo. Term SOFR + 3.02%), 02/15/2039(a)(d) | 500,000 | 438,554 | |
| CFK Trust, Series 2019-FAX, Class E, 4.79%, 01/15/2039(a)(e) | 1,000,000 | 880,575 | |
| Citigroup Commercial Mortgage Trust, | |||
| Series 2020-420K, Class E, 3.42%, 11/10/2042(a)(e) | 4,586,000 | 3,737,410 | |
| Series 2020-555, Class F, 3.62%, 12/10/2041(a)(e) | 800,000 | 624,337 | |
| Series 2020-555, Class E, 3.62%, 12/10/2041(a)(e) | 427,000 | 341,480 | |
| 2 | Invesco Global Real Estate Income Fund |
| Principal Amount | Value | ||
| Commercial Mortgage Trust, | |||
| Series 2019-GC44, Class 180B, 3.51%, 08/15/2057(a)(e) | $1,500,000 | $1,466,479 | |
| Series 2020-SBX, Class D, 2.40%, 01/10/2038(a)(e) | 6,200,000 | 4,953,967 | |
| Series 2019-GC44, Class 180C, 3.51%, 08/15/2057(a)(e) | 5,500,000 | 5,339,125 | |
| CONE Trust, Series 2024-DFW1, Class D, 8.38% (1 mo. Term SOFR + 3.04%), 08/15/2041(a)(d) | 1,200,000 | 1,202,255 | |
| Credit Suisse Mortgage Capital Trust, Series 2021-BHAR, Class E, 8.95% (1 mo. Term SOFR + 3.61%), 11/15/2038(a)(d) | 3,000,000 | 2,962,285 | |
| CSMC, Series 2021-BHAR, Class C, 7.45% (1 mo. Term SOFR + 2.11%), 11/15/2038(a)(d) | 170,000 | 168,316 | |
| GS Mortgage Securities Corp. Trust, Series 2022-GTWY, Class A, 8.74% (1 mo. Term SOFR + 3.40%), 08/15/2039(a)(d) | 10,050,000 | 10,032,431 | |
| Hawaii Hotel Trust, Series 2019-MAUI, Class E, 7.79% (1 mo. Term SOFR + 2.46%), 05/15/2038(a)(d) | 200,000 | 198,751 | |
| Hilton USA Trust, Series 2016-HHV, Class E, 4.33%, 11/05/2038(a)(e) | 5,281,000 | 5,028,449 | |
| Independence Plaza Trust, Series 2018-INDP, Class E, 5.00%, 07/10/2035(a) | 7,000,000 | 6,447,892 | |
| JP Morgan Chase Commercial Mortgage Securities Trust, | |||
| Series 2019-UES, Class F, 4.60%, 05/05/2032(a)(e) | 558,000 | 514,460 | |
| Series 2019-UES, Class B, 4.14%, 05/05/2032(a) | 1,084,000 | 1,046,523 | |
| Series 2019-UES, Class C, 4.34%, 05/05/2032(a) | 116,000 | 112,068 | |
| Series 2019-UES, Class D, 4.60%, 05/05/2032(a)(e) | 119,000 | 114,223 | |
| Series 2019-UES, Class E, 4.60%, 05/05/2032(a)(e) | 138,000 | 131,635 | |
| Series 2019-UES, Class G, 4.60%, 05/05/2032(a)(e) | 158,000 | 142,526 | |
| MHC Commercial Mortgage Trust, Series 2021-MHC, Class F, 8.05% (1 mo. Term SOFR + 2.72%), 04/15/2038(a)(d) | 8,724,318 | 8,541,258 | |
| Natixis Commercial Mortgage Securities Trust, | |||
| Series 2020-2PAC, Class AMZ3, 3.62%, 01/15/2037(a)(e) | 5,326,000 | 2,836,889 | |
| Series 2020-2PAC, Class AMZ2, 3.62%, 01/15/2037(a)(e) | 800,000 | 506,061 | |
| Series 2018-SOX, Class E, 4.93%, 06/17/2038(a)(e) | 922,000 | 857,970 | |
| SREIT Trust, Series 2021-PALM, Class E, 7.36% (1 mo. Term SOFR + 2.02%), 10/15/2034(a)(d) | 1,240,000 | 1,206,065 | |
| STWD Trust, | |||
| Series 2021-FLWR, Class E, 7.38% (1 mo. Term SOFR + 2.04%), 07/15/2036(a)(d) | 4,950,000 | 4,885,889 | |
| Series 2021-FLWR, Class F, 8.12% (1 mo. Term SOFR + 2.79%), 07/15/2036(a)(d) | 3,400,000 | 3,356,929 | |
| Principal Amount | Value | ||
| Prima Capital CRE Securitization Ltd., Series 2019-RK1, Class BT, 4.45%, 04/15/2038(a) | $14,154,000 | $12,982,028 | |
| Total Asset-Backed Securities (Cost $111,955,000) | 107,966,733 | ||
| Shares | |||
| Preferred Stocks–7.25% | |||
| United States–7.25% | |||
| American Homes 4 Rent, 5.88%, Series G, Pfd. | 84,200 | 1,989,646 | |
| American Homes 4 Rent, 6.25%, Series H, Pfd. | 200,100 | 4,998,498 | |
| DiamondRock Hospitality Co., 8.25%, Pfd. | 168,578 | 4,281,881 | |
| National Storage Affiliates Trust, 6.00%, Series A, Pfd. | 243,300 | 5,566,704 | |
| Pebblebrook Hotel Trust, 6.38%, Series E, Pfd.(f) | 223,861 | 5,025,679 | |
| Pebblebrook Hotel Trust, 6.30%, Series F, Pfd. | 173,676 | 3,793,084 | |
| SITE Centers Corp., 6.38%, Series A, Pfd. | 214,100 | 5,052,760 | |
| UMH Properties, Inc., 6.38%, Series D, Pfd.(f) | 566,800 | 13,461,500 | |
| Total Preferred Stocks (Cost $45,137,560) | 44,169,752 | ||
| Principal Amount | |||
| Municipal Obligations–1.26% | |||
| United States–1.26% | |||
| New York City Housing Development Corp. (8 Spruce Street), Series 2014, Ref. RB, 3.71%, 02/15/2048 (Cost $7,333,747) | $7,735,000 | 7,710,000 | |
| Shares | |||
| Money Market Funds–2.14% | |||
| Invesco Government & Agency Portfolio, Institutional Class, 5.18%(f)(g) | 4,566,512 | 4,566,512 | |
| Invesco Treasury Portfolio, Institutional Class, 5.15%(f)(g) | 8,480,393 | 8,480,393 | |
| Total Money Market Funds (Cost $13,046,905) | 13,046,905 | ||
| TOTAL INVESTMENTS IN SECURITIES (excluding Investments purchased with cash collateral from securities on loan)-99.68% (Cost $570,314,620) | 607,423,251 | ||
| Investments Purchased with Cash Collateral from Securities on Loan | |||
| Money Market Funds–3.25% | |||
| Invesco Private Government Fund, 5.28%(f)(g)(h) | 5,460,184 | 5,460,184 | |
| Invesco Private Prime Fund, 5.46%(f)(g)(h) | 14,332,846 | 14,338,579 | |
| Total Investments Purchased with Cash Collateral from Securities on Loan (Cost $19,798,341) | 19,798,763 | ||
| TOTAL INVESTMENTS IN SECURITIES—102.93% (Cost $590,112,961) | 627,222,014 | ||
| OTHER ASSETS LESS LIABILITIES–(2.93)% | (17,882,674) | ||
| NET ASSETS–100.00% | $609,339,340 | ||
| 3 | Invesco Global Real Estate Income Fund |
| Pfd. | – Preferred |
| RB | – Revenue Bonds |
| Ref. | – Refunding |
| REIT | – Real Estate Investment Trust |
| SOFR | – Secured Overnight Financing Rate |
| (a) | Security purchased or received in a transaction exempt from registration under the Securities Act of 1933, as amended (the “1933 Act”). The security may be resold pursuant to an exemption from registration under the 1933 Act, typically to qualified institutional buyers. The aggregate value of these securities at August 31, 2024 was $113,832,939, which represented 18.68% of the Fund’s Net Assets. |
| (b) | Non-income producing security. |
| (c) | All or a portion of this security was out on loan at August 31, 2024. |
| (d) | Interest or dividend rate is redetermined periodically. Rate shown is the rate in effect on August 31, 2024. |
| (e) | Interest rate is redetermined periodically based on the cash flows generated by the pool of assets backing the security, less any applicable fees. The rate shown is the rate in effect on August 31, 2024. |
| (f) | Affiliated holding. Affiliated holdings are investments in entities which are under common ownership or control of Invesco Ltd. or are investments in entities in which the Fund owns 5% or more of the outstanding voting securities. The table below shows the Fund’s transactions in, and earnings from, its investments in affiliates for the fiscal year ended August 31, 2024. |
| Value August 31, 2023 | Purchases at Cost | Proceeds from Sales | Change in Unrealized Appreciation (Depreciation) | Realized Gain | Value August 31, 2024 | Dividend Income | |
| Investments in Affiliated Money Market Funds: | |||||||
| Invesco Government & Agency Portfolio, Institutional Class | $9,655,129 | $53,306,140 | $(58,394,757) | $- | $- | $4,566,512 | $402,781 |
| Invesco Liquid Assets Portfolio, Institutional Class | 6,895,829 | 32,645,226 | (39,545,514) | (4) | 4,463 | - | 272,468 |
| Invesco Treasury Portfolio, Institutional Class | 11,034,434 | 70,859,639 | (73,413,680) | - | - | 8,480,393 | 480,674 |
| Investments Purchased with Cash Collateral from Securities on Loan: | |||||||
| Invesco Private Government Fund | 728,598 | 73,976,583 | (69,244,997) | - | - | 5,460,184 | 142,208* |
| Invesco Private Prime Fund | 1,873,540 | 160,278,789 | (147,816,122) | 422 | 1,950 | 14,338,579 | 379,140* |
| Investments in Other Affiliates: | |||||||
| Pebblebrook Hotel Trust, Series E, Pfd.** | 4,539,901 | - | - | 485,778 | - | 5,025,679 | 356,781 |
| UMH Properties, Inc., Series D, Pfd.** | 12,390,248 | - | (137,254) | 1,208,506 | - | 13,461,500 | 903,338 |
| Total | $47,117,679 | $391,066,377 | $(388,552,324) | $1,694,702 | $6,413 | $51,332,847 | $2,937,390 |
| * | Represents the income earned on the investment of cash collateral, which is included in securities lending income on the Statement of Operations. Does not include rebates and fees paid to lending agent or premiums received from borrowers, if any. |
| ** | As of August 31, 2023, this security was not considered as an affiliate of the Fund. |
| (g) | The rate shown is the 7-day SEC standardized yield as of August 31, 2024. |
| (h) | The security has been segregated to satisfy the commitment to return the cash collateral received in securities lending transactions upon the borrower’s return of the securities loaned. See Note 1I. |
| 4 | Invesco Global Real Estate Income Fund |
| Assets: | |
| Investments in unaffiliated securities, at value (Cost $538,104,182)* | $575,889,167 |
| Investments in affiliates, at value (Cost $52,008,779) | 51,332,847 |
| Foreign currencies, at value (Cost $1,417,471) | 1,420,459 |
| Receivable for: | |
| Fund shares sold | 103,460 |
| Dividends | 1,121,253 |
| Interest | 445,878 |
| Investment for trustee deferred compensation and retirement plans | 118,433 |
| Other assets | 123,732 |
| Total assets | 630,555,229 |
| Liabilities: | |
| Payable for: | |
| Investments purchased | 834,307 |
| Fund shares reacquired | 149,369 |
| Collateral upon return of securities loaned | 19,798,341 |
| Accrued fees to affiliates | 232,861 |
| Accrued trustees’ and officers’ fees and benefits | 2,955 |
| Accrued other operating expenses | 73,507 |
| Trustee deferred compensation and retirement plans | 124,549 |
| Total liabilities | 21,215,889 |
| Net assets applicable to shares outstanding | $609,339,340 |
| Net assets consist of: | |
| Shares of beneficial interest | $607,956,959 |
| Distributable earnings | 1,382,381 |
| $609,339,340 |
| Net Assets: | |
| Class A | $87,525,967 |
| Class C | $2,197,475 |
| Class Y | $327,309,645 |
| Class R5 | $1,395,628 |
| Class R6 | $190,910,625 |
| Shares outstanding, no par value, with an unlimited number of shares authorized: | |
| Class A | 10,114,383 |
| Class C | 254,218 |
| Class Y | 37,951,357 |
| Class R5 | 161,671 |
| Class R6 | 22,083,174 |
| Class A: | |
| Net asset value per share | $8.65 |
| Maximum offering price per share (Net asset value of $8.65 ÷ 94.50%) | $9.15 |
| Class C: | |
| Net asset value and offering price per share | $8.64 |
| Class Y: | |
| Net asset value and offering price per share | $8.62 |
| Class R5: | |
| Net asset value and offering price per share | $8.63 |
| Class R6: | |
| Net asset value and offering price per share | $8.65 |
| * | At August 31, 2024, securities with an aggregate value of $19,597,399 were on loan to brokers. |
| 5 | Invesco Global Real Estate Income Fund |
| Investment income: | |
| Interest | $10,992,289 |
| Dividends (net of foreign withholding taxes of $661,210) | 15,142,953 |
| Dividends from affiliates (includes net securities lending income of $12,568) | 2,428,610 |
| Total investment income | 28,563,852 |
| Expenses: | |
| Advisory fees | 4,360,949 |
| Administrative services fees | 83,368 |
| Custodian fees | 18,613 |
| Distribution fees: | |
| Class A | 219,616 |
| Class C | 27,635 |
| Transfer agent fees — A, C and Y | 767,838 |
| Transfer agent fees — R5 | 1,276 |
| Transfer agent fees — R6 | 58,179 |
| Trustees’ and officers’ fees and benefits | 26,716 |
| Registration and filing fees | 77,535 |
| Reports to shareholders | 112,205 |
| Professional services fees | 70,917 |
| Other | 33,602 |
| Total expenses | 5,858,449 |
| Less: Fees waived and/or expense offset arrangement(s) | (27,889) |
| Net expenses | 5,830,560 |
| Net investment income | 22,733,292 |
| Realized and unrealized gain (loss) from: | |
| Net realized gain (loss) from: | |
| Unaffiliated investment securities | (11,187,508) |
| Affiliated investment securities | 6,413 |
| Foreign currencies | (6,912) |
| (11,188,007) | |
| Change in net unrealized appreciation of: | |
| Unaffiliated investment securities | 62,489,624 |
| Affiliated investment securities | 1,694,702 |
| Foreign currencies | 37,040 |
| 64,221,366 | |
| Net realized and unrealized gain | 53,033,359 |
| Net increase in net assets resulting from operations | $75,766,651 |
| 6 | Invesco Global Real Estate Income Fund |
| 2024 | 2023 | |
| Operations: | ||
| Net investment income | $22,733,292 | $21,760,949 |
| Net realized gain (loss) | (11,188,007) | (9,204,985) |
| Change in net unrealized appreciation (depreciation) | 64,221,366 | (30,840,314) |
| Net increase (decrease) in net assets resulting from operations | 75,766,651 | (18,284,350) |
| Distributions to shareholders from distributable earnings: | ||
| Class A | (3,093,803) | (2,443,875) |
| Class C | (78,316) | (74,239) |
| Class Y | (11,493,555) | (7,676,883) |
| Class R5 | (49,275) | (35,932) |
| Class R6 | (7,643,317) | (5,605,758) |
| Total distributions from distributable earnings | (22,358,266) | (15,836,687) |
| Share transactions–net: | ||
| Class A | (13,335,143) | (16,568,731) |
| Class C | (1,322,934) | (2,180,572) |
| Class Y | (3,139,543) | 13,177,665 |
| Class R5 | (19,771) | (43,646) |
| Class R6 | (22,551,930) | (5,560,973) |
| Net increase (decrease) in net assets resulting from share transactions | (40,369,321) | (11,176,257) |
| Net increase (decrease) in net assets | 13,039,064 | (45,297,294) |
| Net assets: | ||
| Beginning of year | 596,300,276 | 641,597,570 |
| End of year | $609,339,340 | $596,300,276 |
| 7 | Invesco Global Real Estate Income Fund |
| Net asset value, beginning of period | Net investment income(a) | Net gains (losses) on securities (both realized and unrealized) | Total from investment operations | Dividends from net investment income | Distributions from net realized gains | Return of capital | Total distributions | Net asset value, end of period | Total return(b) | Net assets, end of period (000’s omitted) | Ratio of expenses to average net assets with fee waivers and/or expenses absorbed | Ratio of expenses to average net assets without fee waivers and/or expenses absorbed | Ratio of net investment income to average net assets | Portfolio turnover (c) | |
| Class A | |||||||||||||||
| Year ended 08/31/24 | $7.93 | $0.29 | $0.71 | $1.00 | $(0.28) | $— | $— | $(0.28) | $8.65 | 12.96% | $87,526 | 1.26% | 1.26% | 3.61% | 49% |
| Year ended 08/31/23 | 8.35 | 0.27 | (0.50) | (0.23) | (0.19) | — | — | (0.19) | 7.93 | (2.69) | 93,512 | 1.21 | 1.21 | 3.39 | 78 |
| Year ended 08/31/22 | 9.88 | 0.16 | (1.48) | (1.32) | (0.12) | — | (0.09) | (0.21) | 8.35 | (13.56) | 116,084 | 1.20 | 1.20 | 1.69 | 39 |
| Year ended 08/31/21 | 8.06 | 0.14 | 1.84 | 1.98 | (0.16) | — | — | (0.16) | 9.88 | 24.81(d) | 149,008 | 1.19(d) | 1.19(d) | 1.63(d) | 41 |
| Year ended 08/31/20 | 9.57 | 0.21 | (0.99) | (0.78) | (0.48) | (0.25) | — | (0.73) | 8.06 | (8.55) | 135,022 | 1.22 | 1.22 | 2.48 | 72 |
| Class C | |||||||||||||||
| Year ended 08/31/24 | 7.92 | 0.23 | 0.71 | 0.94 | (0.22) | — | — | (0.22) | 8.64 | 12.13 | 2,197 | 2.01 | 2.01 | 2.86 | 49 |
| Year ended 08/31/23 | 8.34 | 0.21 | (0.50) | (0.29) | (0.13) | — | — | (0.13) | 7.92 | (3.45) | 3,304 | 1.96 | 1.96 | 2.64 | 78 |
| Year ended 08/31/22 | 9.86 | 0.09 | (1.47) | (1.38) | (0.08) | — | (0.06) | (0.14) | 8.34 | (14.15) | 5,782 | 1.95 | 1.95 | 0.94 | 39 |
| Year ended 08/31/21 | 8.05 | 0.08 | 1.82 | 1.90 | (0.09) | — | — | (0.09) | 9.86 | 23.79 | 9,722 | 1.95 | 1.95 | 0.87 | 41 |
| Year ended 08/31/20 | 9.55 | 0.15 | (0.99) | (0.84) | (0.41) | (0.25) | — | (0.66) | 8.05 | (9.22) | 21,394 | 1.97 | 1.97 | 1.73 | 72 |
| Class Y | |||||||||||||||
| Year ended 08/31/24 | 7.90 | 0.31 | 0.71 | 1.02 | (0.30) | — | — | (0.30) | 8.62 | 13.29 | 327,310 | 1.01 | 1.01 | 3.86 | 49 |
| Year ended 08/31/23 | 8.33 | 0.29 | (0.51) | (0.22) | (0.21) | — | — | (0.21) | 7.90 | (2.57) | 301,210 | 0.96 | 0.96 | 3.64 | 78 |
| Year ended 08/31/22 | 9.84 | 0.18 | (1.46) | (1.28) | (0.13) | — | (0.10) | (0.23) | 8.33 | (13.20) | 305,110 | 0.95 | 0.95 | 1.94 | 39 |
| Year ended 08/31/21 | 8.03 | 0.17 | 1.82 | 1.99 | (0.18) | — | — | (0.18) | 9.84 | 25.08 | 347,456 | 0.95 | 0.95 | 1.87 | 41 |
| Year ended 08/31/20 | 9.54 | 0.23 | (0.99) | (0.76) | (0.50) | (0.25) | — | (0.75) | 8.03 | (8.34) | 296,997 | 0.97 | 0.97 | 2.73 | 72 |
| Class R5 | |||||||||||||||
| Year ended 08/31/24 | 7.91 | 0.31 | 0.72 | 1.03 | (0.31) | — | — | (0.31) | 8.63 | 13.38 | 1,396 | 0.91 | 0.91 | 3.96 | 49 |
| Year ended 08/31/23 | 8.33 | 0.29 | (0.49) | (0.20) | (0.22) | — | — | (0.22) | 7.91 | (2.38) | 1,303 | 0.89 | 0.89 | 3.71 | 78 |
| Year ended 08/31/22 | 9.87 | 0.19 | (1.49) | (1.30) | (0.13) | — | (0.11) | (0.24) | 8.33 | (13.41) | 1,424 | 0.89 | 0.89 | 2.00 | 39 |
| Year ended 08/31/21 | 8.05 | 0.17 | 1.83 | 2.00 | (0.18) | — | — | (0.18) | 9.87 | 25.21 | 3,504 | 0.89 | 0.89 | 1.93 | 41 |
| Year ended 08/31/20 | 9.56 | 0.24 | (1.00) | (0.76) | (0.50) | (0.25) | — | (0.75) | 8.05 | (8.27) | 2,940 | 0.91 | 0.91 | 2.79 | 72 |
| Class R6 | |||||||||||||||
| Year ended 08/31/24 | 7.92 | 0.32 | 0.72 | 1.04 | (0.31) | — | — | (0.31) | 8.65 | 13.58 | 190,911 | 0.84 | 0.84 | 4.03 | 49 |
| Year ended 08/31/23 | 8.35 | 0.30 | (0.51) | (0.21) | (0.22) | — | — | (0.22) | 7.92 | (2.42) | 196,972 | 0.82 | 0.82 | 3.78 | 78 |
| Year ended 08/31/22 | 9.87 | 0.19 | (1.47) | (1.28) | (0.13) | — | (0.11) | (0.24) | 8.35 | (13.14) | 213,197 | 0.82 | 0.82 | 2.07 | 39 |
| Year ended 08/31/21 | 8.05 | 0.18 | 1.83 | 2.01 | (0.19) | — | — | (0.19) | 9.87 | 25.33 | 243,338 | 0.80 | 0.80 | 2.02 | 41 |
| Year ended 08/31/20 | 9.56 | 0.24 | (0.99) | (0.75) | (0.51) | (0.25) | — | (0.76) | 8.05 | (8.17) | 205,791 | 0.82 | 0.82 | 2.88 | 72 |
| (a) | Calculated using average shares outstanding. |
| (b) | Includes adjustments in accordance with accounting principles generally accepted in the United States of America and as such, the net asset value for financial reporting purposes and the returns based upon those net asset values may differ from the net asset value and returns for shareholder transactions. Not annualized for periods less than one year, if applicable. |
| (c) | Portfolio turnover is calculated at the fund level and is not annualized for periods less than one year, if applicable. |
| (d) | The total return, ratios of expenses to average net assets and ratio of net investment income to average net assets reflect actual 12b-1 fees of 0.24% for the year ended August 31, 2021. |
| 8 | Invesco Global Real Estate Income Fund |
| A. | Security Valuations — Securities, including restricted securities, are valued according to the following policy. |
| 9 | Invesco Global Real Estate Income Fund |
| B. | Securities Transactions and Investment Income – Securities transactions are accounted for on a trade date basis. Realized gains or losses on sales are computed on the basis of specific identification of the securities sold. Interest income (net of withholding tax, if any) is recorded on an accrual basis from settlement date and includes coupon interest and amortization of premium and accretion of discount on debt securities as applicable. Pay-in-kind interest income and non-cash dividend income received in the form of securities in lieu of cash are recorded at the fair value of the securities received. Paydown gains and losses on mortgage and asset-backed securities are recorded as adjustments to interest income. Dividend income (net of withholding tax, if any) is recorded on the ex-dividend date. |
| C. | Country Determination — For the purposes of making investment selection decisions and presentation in the Schedule of Investments, the investment adviser may determine the country in which an issuer is located and/or credit risk exposure based on various factors. These factors include the laws of the country under which the issuer is organized, where the issuer maintains a principal office, the country in which the issuer derives 50% or more of its total revenues, the country that has the primary market for the issuer’s securities and its "country of risk" as determined by a third party service provider, as well as other criteria. Among the other criteria that may be evaluated for making this determination are the country in which the issuer maintains 50% or more of its assets, the type of security, financial guarantees and enhancements, the nature of the collateral and the sponsor organization. Country of issuer and/or credit risk exposure has been determined to be the United States of America, unless otherwise noted. |
| D. | Distributions - Distributions from net investment income, if any, are declared and paid quarterly and are recorded on the ex-dividend date. Distributions from net realized capital gain, if any, are generally declared and paid annually and recorded on the ex-dividend date. The Fund may elect to treat a portion of the proceeds from redemptions as distributions for federal income tax purposes. |
| E. | Federal Income Taxes – The Fund intends to comply with the requirements of Subchapter M of the Internal Revenue Code of 1986, as amended (the “Internal Revenue Code”), necessary to qualify as a regulated investment company and to distribute substantially all of the Fund’s taxable earnings to shareholders. As such, the Fund will not be subject to federal income taxes on otherwise taxable income (including net realized capital gain) that is distributed to shareholders. Therefore, no provision for federal income taxes is recorded in the financial statements. |
| F. | Expenses – Fees provided for under the Rule 12b-1 plan of a particular class of the Fund are charged to the operations of such class. Transfer agency fees and expenses and other shareholder recordkeeping fees and expenses attributable to Class R5 and Class R6 are allocated based on relative net assets of Class R5 and Class R6. Sub-accounting fees attributable to Class R5 are charged to the operations of the class. Transfer agency fees and expenses and other shareholder recordkeeping fees and expenses relating to all other classes are allocated among those classes based on relative net assets. All other expenses are allocated among the classes based on relative net assets. |
| G. | Accounting Estimates – The preparation of financial statements in conformity with accounting principles generally accepted in the United States of America (“GAAP”) requires management to make estimates and assumptions that affect the reported amounts of assets and liabilities at the date of the financial statements and the reported amounts of revenues and expenses during the reporting period including estimates and assumptions related to taxation. Actual results could differ from those estimates by a significant amount. In addition, the Fund monitors for material events or transactions that may occur or become known after the period-end date and before the date the financial statements are released to print. |
| H. | Indemnifications – Under the Trust’s organizational documents, each Trustee, officer, employee or other agent of the Trust is indemnified against certain liabilities that may arise out of the performance of their duties to the Fund. Additionally, in the normal course of business, the Fund enters into contracts, including the Fund’s servicing agreements, that contain a variety of indemnification clauses. The Fund’s maximum exposure under these arrangements is unknown as this would involve future claims that may be made against the Fund that have not yet occurred. The risk of material loss as a result of such indemnification claims is considered remote. |
| I. | Securities Lending – The Fund may lend portfolio securities having a market value up to one-third of the Fund’s total assets. Such loans are secured by collateral equal to no less than the market value of the loaned securities determined daily by the securities lending provider. Such collateral will be cash or debt securities issued or guaranteed by the U.S. Government or any of its sponsored agencies. Cash collateral received in connection with these loans is invested in short-term money market instruments or affiliated, unregistered investment companies that comply with Rule 2a-7 under the 1940 Act and money market funds (collectively, "affiliated money market funds") and is shown as such on the Schedule of Investments. The Fund bears the risk of loss with respect to the investment of collateral. It is the Fund’s policy to obtain additional collateral from or return excess collateral to the borrower by the end of the next business day, following the valuation date of the securities loaned. Therefore, the value of the collateral held may be temporarily less than the value of the securities on loan. When loaning securities, the Fund retains certain benefits of owning the securities, including the economic equivalent of dividends or interest generated by the security. Lending securities entails a risk of loss to the Fund if, and to the extent that, the market value of the securities loaned were to increase and the borrower did not |
| 10 | Invesco Global Real Estate Income Fund |
| increase the collateral accordingly, and the borrower failed to return the securities. The securities loaned are subject to termination at the option of the borrower or the Fund. Upon termination, the borrower will return to the Fund the securities loaned and the Fund will return the collateral. Upon the failure of the borrower to return the securities, collateral may be liquidated and the securities may be purchased on the open market to replace the loaned securities. The Fund could experience delays and costs in gaining access to the collateral and the securities may lose value during the delay which could result in potential losses to the Fund. Some of these losses may be indemnified by the lending agent. The Fund bears the risk of any deficiency in the amount of the collateral available for return to the borrower due to any loss on the collateral invested. Dividends received on cash collateral investments for securities lending transactions, which are net of compensation to counterparties, are included in Dividends from affiliates on the Statement of Operations. The aggregate value of securities out on loan, if any, is shown as a footnote on the Statement of Assets and Liabilities. |
| J. | Foreign Currency Translations — Foreign currency is valued at the close of the NYSE based on quotations posted by banks and major currency dealers. Portfolio securities and other assets and liabilities denominated in foreign currencies are translated into U.S. dollar amounts at the date of valuation. Purchases and sales of portfolio securities (net of foreign taxes withheld on disposition) and income items denominated in foreign currencies are translated into U.S. dollar amounts on the respective dates of such transactions. The Fund does not separately account for the portion of the results of operations resulting from changes in foreign exchange rates on investments and the fluctuations arising from changes in market prices of securities held. The combined results of changes in foreign exchange rates and the fluctuation of market prices on investments (net of estimated foreign tax withholding) are included with the net realized and unrealized gain or loss from investments in the Statement of Operations. Reported net realized foreign currency gains or losses arise from (1) sales of foreign currencies, (2) currency gains or losses realized between the trade and settlement dates on securities transactions, and (3) the difference between the amounts of dividends, interest, and foreign withholding taxes recorded on the Fund’s books and the U.S. dollar equivalent of the amounts actually received or paid. Net unrealized foreign currency gains and losses arise from changes in the fair values of assets and liabilities, other than investments in securities at fiscal period end, resulting from changes in exchange rates. |
| K. | Forward Foreign Currency Contracts — The Fund may engage in foreign currency transactions either on a spot (i.e. for prompt delivery and settlement) basis, or through forward foreign currency contracts, to manage or minimize currency or exchange rate risk. |
| L. | Other Risks - The Fund’s investments are concentrated in a comparatively narrow segment of the economy. Consequently, the Fund may tend to be more volatile than other mutual funds, and the value of the Fund’s investments may tend to rise and fall more rapidly. |
| Average Daily Net Assets | Rate |
| First $250 million | 0.750% |
| Next $250 million | 0.740% |
| Next $500 million | 0.730% |
| Next $1.5 billion | 0.720% |
| Next $2.5 billion | 0.710% |
| Next $2.5 billion | 0.700% |
| Next $2.5 billion | 0.690% |
| Over $10 billion | 0.680% |
| 11 | Invesco Global Real Estate Income Fund |
| 12 | Invesco Global Real Estate Income Fund |
| Level 1 | Level 2 | Level 3 | Total | |
| Investments in Securities | ||||
| Belgium | $— | $6,065,805 | $— | $6,065,805 |
| Canada | 19,120,408 | — | — | 19,120,408 |
| Cayman Islands | — | 12,982,028 | — | 12,982,028 |
| France | — | 15,391,513 | — | 15,391,513 |
| Germany | — | 21,678,726 | — | 21,678,726 |
| Hong Kong | — | 16,332,925 | — | 16,332,925 |
| Japan | — | 39,731,466 | — | 39,731,466 |
| Singapore | — | 5,399,381 | — | 5,399,381 |
| Spain | — | 5,866,206 | — | 5,866,206 |
| Sweden | — | 4,938,365 | — | 4,938,365 |
| United Kingdom | — | 28,685,386 | — | 28,685,386 |
| United States | 315,489,432 | 102,694,705 | — | 418,184,137 |
| Money Market Funds | 13,046,905 | 19,798,763 | — | 32,845,668 |
| Total Investments | $347,656,745 | $279,565,269 | $— | $627,222,014 |
| Tax Character of Distributions to Shareholders Paid During the Fiscal Years Ended August 31, 2024 and 2023: | ||
| 2024 | 2023 | |
| Ordinary income* | $22,358,266 | $15,836,687 |
| * | Includes short-term capital gain distributions, if any. |
| Tax Components of Net Assets at Period-End: | |
| 2024 | |
| Undistributed ordinary income | $4,437,781 |
| Net unrealized appreciation — investments | 37,183,464 |
| Net unrealized appreciation — foreign currencies | 12,421 |
| Temporary book/tax differences | (75,079) |
| Capital loss carryforward | (40,176,206) |
| Shares of beneficial interest | 607,956,959 |
| Total net assets | $609,339,340 |
| 13 | Invesco Global Real Estate Income Fund |
| Capital Loss Carryforward* | |||
| Expiration | Short-Term | Long-Term | Total |
| Not subject to expiration | $7,240,660 | $32,935,546 | $40,176,206 |
| * | Capital loss carryforward is reduced for limitations, if any, to the extent required by the Internal Revenue Code and may be further limited depending upon a variety of factors, including the realization of net unrealized gains or losses as of the date of any reorganization. |
| Unrealized Appreciation (Depreciation) of Investments on a Tax Basis | |
| Aggregate unrealized appreciation of investments | $62,483,556 |
| Aggregate unrealized (depreciation) of investments | (25,300,092) |
| Net unrealized appreciation of investments | $37,183,464 |
| Summary of Share Activity | |||||
| Year ended August 31, 2024(a) | Year ended August 31, 2023 | ||||
| Shares | Amount | Shares | Amount | ||
| Sold: | |||||
| Class A | 521,813 | $4,170,131 | 784,402 | $6,219,838 | |
| Class C | 19,084 | 150,144 | 28,186 | 220,521 | |
| Class Y | 12,201,971 | 96,496,879 | 12,424,655 | 98,941,273 | |
| Class R5 | 41,555 | 335,394 | 16,810 | 134,803 | |
| Class R6 | 648,425 | 5,201,153 | 2,029,257 | 15,881,336 | |
| Issued as reinvestment of dividends: | |||||
| Class A | 313,791 | 2,505,532 | 235,482 | 1,838,951 | |
| Class C | 7,143 | 57,108 | 6,984 | 54,587 | |
| Class Y | 1,236,851 | 9,830,045 | 804,678 | 6,254,788 | |
| Class R5 | 6,056 | 48,121 | 4,302 | 33,482 | |
| Class R6 | 943,902 | 7,513,696 | 705,982 | 5,503,062 | |
| Automatic conversion of Class C shares to Class A shares: | |||||
| Class A | 82,757 | 667,406 | 145,994 | 1,139,001 | |
| Class C | (82,844) | (667,406) | (146,042) | (1,139,001) | |
| Reacquired: | |||||
| Class A | (2,596,969) | (20,678,212) | (3,269,658) | (25,766,521) | |
| Class C | (106,262) | (862,780) | (165,030) | (1,316,679) | |
| Class Y | (13,602,099) | (109,466,467) | (11,761,099) | (92,018,396) | |
| Class R5 | (50,606) | (403,286) | (27,254) | (211,931) | |
| Class R6 | (4,373,917) | (35,266,779) | (3,414,415) | (26,945,371) | |
| Net increase (decrease) in share activity | (4,789,349) | $(40,369,321) | (1,596,766) | $(11,176,257) | |
| (a) | There are entities that are record owners of more than 5% of the outstanding shares of the Fund and in the aggregate own 46% of the outstanding shares of the Fund. IDI has an agreement with these entities to sell Fund shares. The Fund, Invesco and/or Invesco affiliates may make payments to these entities, which are considered to be related to the Fund, for providing services to the Fund, Invesco and/or Invesco affiliates including but not limited to services such as securities brokerage, distribution, third party record keeping and account servicing. The Fund has no knowledge as to whether all or any portion of the shares owned of record by these entities are also owned beneficially. |
| In addition, 23% of the outstanding shares of the Fund are owned by the Adviser or an affiliate of the Adviser. |
| 14 | Invesco Global Real Estate Income Fund |
| 15 | Invesco Global Real Estate Income Fund |
| A. | Nature, Extent and Quality of Services Provided by Invesco Advisers and the Affiliated Sub-Advisers |
| 16 | Invesco Global Real Estate Income Fund |
| C. | Advisory and Sub-Advisory Fees and Fund Expenses |
| D. | Economies of Scale and Breakpoints |
| E. | Profitability and Financial Resources |
| F. | Collateral Benefits to Invesco Advisers and its Affiliates |
| 17 | Invesco Global Real Estate Income Fund |
| 18 | Invesco Global Real Estate Income Fund |
| Federal and State Income Tax | |
| Qualified Dividend Income* | 17.32% |
| Corporate Dividends Received Deduction* | 0.00% |
| U.S. Treasury Obligations* | 0.00% |
| Qualified Business Income* | 34.72% |
| Business Interest Income* | 37.26% |
| * | The above percentages are based on ordinary income dividends paid to shareholders during the Fund’s fiscal year. |
| 19 | Invesco Global Real Estate Income Fund |
| 20 | Invesco Global Real Estate Income Fund |

| Annual Financial Statements and Other Information | August 31, 2024 |
| Shares | Value | ||
| Common Stocks & Other Equity Interests–98.21% | |||
| Aerospace & Defense–2.58% | |||
| RTX Corp. | 593,978 | $73,261,247 | |
| Textron, Inc. | 385,450 | 35,153,040 | |
| 108,414,287 | |||
| Air Freight & Logistics–1.44% | |||
| FedEx Corp. | 202,883 | 60,615,354 | |
| Application Software–1.05% | |||
| Salesforce, Inc. | 175,205 | 44,309,345 | |
| Asset Management & Custody Banks–1.36% | |||
| KKR & Co., Inc., Class A | 462,145 | 57,199,687 | |
| Automobile Manufacturers–1.36% | |||
| General Motors Co. | 1,151,598 | 57,326,548 | |
| Broadline Retail–2.02% | |||
| Amazon.com, Inc.(b) | 476,682 | 85,087,737 | |
| Building Products–2.09% | |||
| Johnson Controls International PLC | 1,203,949 | 87,707,685 | |
| Cable & Satellite–0.65% | |||
| Comcast Corp., Class A | 695,641 | 27,526,514 | |
| Cargo Ground Transportation–0.85% | |||
| J.B. Hunt Transport Services, Inc. | 207,438 | 35,928,262 | |
| Casinos & Gaming–0.73% | |||
| Las Vegas Sands Corp. | 786,071 | 30,648,908 | |
| Communications Equipment–1.05% | |||
| Cisco Systems, Inc. | 871,126 | 44,026,708 | |
| Consumer Finance–0.96% | |||
| American Express Co. | 155,779 | 40,292,238 | |
| Distributors–0.90% | |||
| Genuine Parts Co. | 262,809 | 37,650,017 | |
| Diversified Banks–8.18% | |||
| Bank of America Corp. | 3,332,664 | 135,806,058 | |
| PNC Financial Services Group, Inc. (The) | 384,738 | 71,211,156 | |
| Wells Fargo & Co. | 2,347,138 | 137,237,159 | |
| 344,254,373 | |||
| Electric Utilities–3.30% | |||
| American Electric Power Co., Inc. | 468,368 | 46,967,943 | |
| FirstEnergy Corp. | 871,775 | 38,288,358 | |
| PPL Corp. | 1,673,803 | 53,411,054 | |
| 138,667,355 | |||
| Electrical Components & Equipment–1.16% | |||
| Emerson Electric Co. | 461,761 | 48,664,992 | |
| Electronic Components–0.92% | |||
| Coherent Corp.(b) | 498,057 | 38,823,543 | |
| Electronic Equipment & Instruments–1.11% | |||
| Zebra Technologies Corp., Class A(b) | 135,325 | 46,738,548 | |
| Shares | Value | ||
| Electronic Manufacturing Services–0.99% | |||
| TE Connectivity Ltd. | 269,986 | $41,469,850 | |
| Fertilizers & Agricultural Chemicals–0.83% | |||
| Corteva, Inc. | 605,991 | 34,723,284 | |
| Food Distributors–2.50% | |||
| Sysco Corp. | 747,299 | 58,266,903 | |
| US Foods Holding Corp.(b) | 792,225 | 46,907,642 | |
| 105,174,545 | |||
| Gold–0.79% | |||
| Barrick Gold Corp. (Canada) | 1,644,053 | 33,193,430 | |
| Health Care Equipment–2.47% | |||
| GE HealthCare Technologies, Inc. | 347,641 | 29,486,910 | |
| Medtronic PLC | 840,381 | 74,440,949 | |
| 103,927,859 | |||
| Health Care Services–1.57% | |||
| Cigna Group (The) | 93,270 | 33,746,019 | |
| CVS Health Corp. | 560,460 | 32,080,730 | |
| 65,826,749 | |||
| Industrial Machinery & Supplies & Components–3.04% | |||
| Parker-Hannifin Corp. | 152,278 | 91,397,256 | |
| Stanley Black & Decker, Inc. | 355,542 | 36,393,279 | |
| 127,790,535 | |||
| Insurance Brokers–1.78% | |||
| Willis Towers Watson PLC | 256,702 | 74,985,221 | |
| Integrated Oil & Gas–5.89% | |||
| Chevron Corp. | 404,014 | 59,773,871 | |
| Exxon Mobil Corp. | 824,948 | 97,294,367 | |
| Shell PLC (United Kingdom) | 1,158,651 | 41,055,088 | |
| Suncor Energy, Inc. (Canada)(c) | 1,228,377 | 49,822,348 | |
| 247,945,674 | |||
| Interactive Media & Services–3.29% | |||
| Alphabet, Inc., Class A | 545,669 | 89,151,401 | |
| Meta Platforms, Inc., Class A | 94,234 | 49,125,127 | |
| 138,276,528 | |||
| Investment Banking & Brokerage–2.81% | |||
| Charles Schwab Corp. (The) | 815,977 | 53,120,103 | |
| Goldman Sachs Group, Inc. (The) | 127,740 | 65,179,335 | |
| 118,299,438 | |||
| IT Consulting & Other Services–1.27% | |||
| Cognizant Technology Solutions Corp., Class A | 684,651 | 53,245,308 | |
| Managed Health Care–4.32% | |||
| Centene Corp.(b) | 482,986 | 38,073,786 | |
| Elevance Health, Inc. | 65,387 | 36,413,367 | |
| Humana, Inc. | 134,756 | 47,766,959 | |
| UnitedHealth Group, Inc. | 100,759 | 59,467,962 | |
| 181,722,074 | |||
| 2 | Invesco Growth and Income Fund |
| Shares | Value | ||
| Movies & Entertainment–1.20% | |||
| Walt Disney Co. (The) | 560,419 | $50,650,669 | |
| Multi-line Insurance–1.26% | |||
| American International Group, Inc. | 685,350 | 52,806,217 | |
| Oil & Gas Exploration & Production–1.93% | |||
| ConocoPhillips | 713,807 | 81,224,099 | |
| Oil & Gas Refining & Marketing–0.72% | |||
| Phillips 66 | 215,416 | 30,225,019 | |
| Packaged Foods & Meats–1.02% | |||
| Kraft Heinz Co. (The) | 1,216,848 | 43,112,925 | |
| Pharmaceuticals–5.79% | |||
| Bristol-Myers Squibb Co. | 986,484 | 49,274,876 | |
| Johnson & Johnson | 546,640 | 90,665,710 | |
| Merck & Co., Inc. | 32,179 | 3,811,602 | |
| Pfizer, Inc. | 1,084,895 | 31,472,804 | |
| Sanofi S.A. | 609,761 | 68,438,409 | |
| 243,663,401 | |||
| Property & Casualty Insurance–1.06% | |||
| Allstate Corp. (The) | 235,051 | 44,410,536 | |
| Rail Transportation–2.57% | |||
| CSX Corp. | 1,473,145 | 50,484,679 | |
| Norfolk Southern Corp. | 225,485 | 57,760,238 | |
| 108,244,917 | |||
| Real Estate Services–2.29% | |||
| CBRE Group, Inc., Class A(b) | 835,928 | 96,248,750 | |
| Regional Banks–1.61% | |||
| Citizens Financial Group, Inc. | 1,575,911 | 67,842,969 | |
| Restaurants–0.82% | |||
| Starbucks Corp. | 363,560 | 34,381,869 | |
| Semiconductor Materials & Equipment–0.69% | |||
| Lam Research Corp. | 35,175 | 28,879,027 | |
| Semiconductors–3.26% | |||
| Microchip Technology, Inc. | 485,033 | 39,850,311 | |
| Micron Technology, Inc. | 541,805 | 52,143,313 | |
| NXP Semiconductors N.V. (China) | 175,321 | 44,945,292 | |
| 136,938,916 | |||
| Specialty Chemicals–1.77% | |||
| DuPont de Nemours, Inc. | 531,380 | 44,768,765 | |
| Shares | Value | ||
| Specialty Chemicals–(continued) | |||
| PPG Industries, Inc. | 228,407 | $29,631,240 | |
| 74,400,005 | |||
| Systems Software–1.78% | |||
| Oracle Corp. | 531,097 | 75,038,695 | |
| Tobacco–1.73% | |||
| Philip Morris International, Inc. | 591,618 | 72,940,583 | |
| Trading Companies & Distributors–1.40% | |||
| Ferguson Enterprises, Inc. | 286,524 | 58,940,852 | |
| Transaction & Payment Processing Services–2.77% | |||
| Fidelity National Information Services, Inc. | 448,911 | 37,012,712 | |
| Fiserv, Inc.(b) | 455,863 | 79,593,680 | |
| 116,606,392 | |||
| Wireless Telecommunication Services–1.28% | |||
| T-Mobile US, Inc. | 270,093 | 53,672,881 | |
| Total Common Stocks & Other Equity Interests (Cost $2,809,010,037) | 4,130,691,318 | ||
| Money Market Funds–1.69% | |||
| Invesco Government & Agency Portfolio, Institutional Class, 5.18%(d)(e) | 24,923,577 | 24,923,577 | |
| Invesco Treasury Portfolio, Institutional Class, 5.15%(d)(e) | 46,287,402 | 46,287,402 | |
| Total Money Market Funds (Cost $71,210,979) | 71,210,979 | ||
| TOTAL INVESTMENTS IN SECURITIES (excluding investments purchased with cash collateral from securities on loan)-99.90% (Cost $2,880,221,016) | 4,201,902,297 | ||
| Investments Purchased with Cash Collateral from Securities on Loan | |||
| Money Market Funds–1.25% | |||
| Invesco Private Government Fund, 5.28%(d)(e)(f) | 14,526,116 | 14,526,116 | |
| Invesco Private Prime Fund, 5.46%(d)(e)(f) | 37,829,904 | 37,845,036 | |
| Total Investments Purchased with Cash Collateral from Securities on Loan (Cost $52,371,152) | 52,371,152 | ||
| TOTAL INVESTMENTS IN SECURITIES–101.15% (Cost $2,932,592,168) | 4,254,273,449 | ||
| OTHER ASSETS LESS LIABILITIES—(1.15)% | (48,190,387) | ||
| NET ASSETS–100.00% | $4,206,083,062 | ||
| 3 | Invesco Growth and Income Fund |
| (a) | Industry and/or sector classifications used in this report are generally according to the Global Industry Classification Standard, which was developed by and is the exclusive property and a service mark of MSCI Inc. and Standard & Poor’s. |
| (b) | Non-income producing security. |
| (c) | All or a portion of this security was out on loan at August 31, 2024. |
| (d) | Affiliated holding. Affiliated holdings are investments in entities which are under common ownership or control of Invesco Ltd. or are investments in entities in which the Fund owns 5% or more of the outstanding voting securities. The table below shows the Fund’s transactions in, and earnings from, its investments in affiliates for the fiscal year ended August 31, 2024. |
| Value August 31, 2023 | Purchases at Cost | Proceeds from Sales | Change in Unrealized Appreciation | Realized Gain | Value August 31, 2024 | Dividend Income | |
| Investments in Affiliated Money Market Funds: | |||||||
| Invesco Government & Agency Portfolio, Institutional Class | $25,782,759 | $183,498,591 | $(184,357,773) | $- | $- | $24,923,577 | $1,335,613 |
| Invesco Liquid Assets Portfolio, Institutional Class | 18,413,442 | 120,599,979 | (139,016,994) | - | 3,573 | - | 881,252 |
| Invesco Treasury Portfolio, Institutional Class | 29,466,010 | 239,661,641 | (222,840,249) | - | - | 46,287,402 | 1,616,171 |
| Investments Purchased with Cash Collateral from Securities on Loan: | |||||||
| Invesco Private Government Fund | 1,200,912 | 342,685,168 | (329,359,964) | - | - | 14,526,116 | 373,475* |
| Invesco Private Prime Fund | 3,088,061 | 837,662,126 | (802,920,473) | - | 15,322 | 37,845,036 | 1,018,078* |
| Total | $77,951,184 | $1,724,107,505 | $(1,678,495,453) | $- | $18,895 | $123,582,131 | $5,224,589 |
| * | Represents the income earned on the investment of cash collateral, which is included in securities lending income on the Statement of Operations. Does not include rebates and fees paid to lending agent or premiums received from borrowers, if any. |
| (e) | The rate shown is the 7-day SEC standardized yield as of August 31, 2024. |
| (f) | The security has been segregated to satisfy the commitment to return the cash collateral received in securities lending transactions upon the borrower’s return of the securities loaned. See Note 1I. |
| Open Forward Foreign Currency Contracts | ||||||
| Settlement Date | Counterparty | Contract to | Unrealized Appreciation (Depreciation) | |||
| Deliver | Receive | |||||
| Currency Risk | ||||||
| 09/06/2024 | State Street Bank & Trust Co. | CAD | 1,262,158 | USD | 938,608 | $1,951 |
| 09/06/2024 | State Street Bank & Trust Co. | EUR | 1,444,015 | USD | 1,608,871 | 12,510 |
| 09/06/2024 | State Street Bank & Trust Co. | USD | 3,995,151 | CAD | 5,483,697 | 74,344 |
| 09/06/2024 | State Street Bank & Trust Co. | USD | 2,386,710 | EUR | 2,189,007 | 33,241 |
| 09/06/2024 | State Street Bank & Trust Co. | USD | 2,735,057 | GBP | 2,125,656 | 56,638 |
| Subtotal—Appreciation | 178,684 | |||||
| Currency Risk | ||||||
| 09/06/2024 | Bank of New York Mellon (The) | CAD | 48,947,820 | USD | 35,484,992 | (839,575) |
| 09/06/2024 | State Street Bank & Trust Co. | CAD | 7,105,087 | USD | 5,170,955 | (101,785) |
| 09/06/2024 | State Street Bank & Trust Co. | EUR | 46,852,070 | USD | 50,994,598 | (800,453) |
| 09/06/2024 | State Street Bank & Trust Co. | GBP | 25,875,105 | USD | 33,279,749 | (702,891) |
| 09/06/2024 | State Street Bank & Trust Co. | USD | 930,092 | CAD | 1,252,945 | (271) |
| 09/06/2024 | State Street Bank & Trust Co. | USD | 423,571 | GBP | 321,525 | (1,301) |
| Subtotal—Depreciation | (2,446,276) | |||||
| Total Forward Foreign Currency Contracts | $(2,267,592) | |||||
| Abbreviations: | |
| CAD | —Canadian Dollar |
| EUR | —Euro |
| GBP | —British Pound Sterling |
| USD | —U.S. Dollar |
| 4 | Invesco Growth and Income Fund |
| Assets: | |
| Investments in unaffiliated securities, at value (Cost $2,809,010,037)* | $4,130,691,318 |
| Investments in affiliated money market funds, at value (Cost $123,582,131) | 123,582,131 |
| Other investments: | |
| Unrealized appreciation on forward foreign currency contracts outstanding | 178,684 |
| Foreign currencies, at value (Cost $997) | 985 |
| Receivable for: | |
| Fund shares sold | 706,982 |
| Dividends | 9,395,646 |
| Investment for trustee deferred compensation and retirement plans | 645,237 |
| Other assets | 78,370 |
| Total assets | 4,265,279,353 |
| Liabilities: | |
| Other investments: | |
| Unrealized depreciation on forward foreign currency contracts outstanding | 2,446,276 |
| Payable for: | |
| Fund shares reacquired | 1,905,521 |
| Collateral upon return of securities loaned | 52,371,152 |
| Accrued fees to affiliates | 1,635,511 |
| Accrued trustees’ and officers’ fees and benefits | 6,001 |
| Accrued other operating expenses | 143,701 |
| Trustee deferred compensation and retirement plans | 688,129 |
| Total liabilities | 59,196,291 |
| Net assets applicable to shares outstanding | $4,206,083,062 |
| Net assets consist of: | |
| Shares of beneficial interest | $2,665,586,277 |
| Distributable earnings | 1,540,496,785 |
| $4,206,083,062 |
| Net Assets: | |
| Class A | $2,652,125,650 |
| Class C | $28,957,986 |
| Class R | $52,197,933 |
| Class Y | $367,897,544 |
| Class R5 | $250,612,866 |
| Class R6 | $854,291,083 |
| Shares outstanding, no par value, with an unlimited number of shares authorized: | |
| Class A | 115,270,118 |
| Class C | 1,288,871 |
| Class R | 2,264,333 |
| Class Y | 15,975,972 |
| Class R5 | 10,863,418 |
| Class R6 | 37,028,393 |
| Class A: | |
| Net asset value per share | $23.01 |
| Maximum offering price per share (Net asset value of $23.01 ÷ 94.50%) | $24.35 |
| Class C: | |
| Net asset value and offering price per share | $22.47 |
| Class R: | |
| Net asset value and offering price per share | $23.05 |
| Class Y: | |
| Net asset value and offering price per share | $23.03 |
| Class R5: | |
| Net asset value and offering price per share | $23.07 |
| Class R6: | |
| Net asset value and offering price per share | $23.07 |
| * | At August 31, 2024, securities with an aggregate value of $49,302,405 were on loan to brokers. |
| 5 | Invesco Growth and Income Fund |
| Investment income: | |
| Dividends (net of foreign withholding taxes of $413,702) | $83,398,545 |
| Dividends from affiliated money market funds (includes net securities lending income of $84,034) | 3,917,070 |
| Total investment income | 87,315,615 |
| Expenses: | |
| Advisory fees | 14,327,353 |
| Administrative services fees | 573,321 |
| Custodian fees | 30,606 |
| Distribution fees: | |
| Class A | 6,237,714 |
| Class C | 292,285 |
| Class R | 270,346 |
| Transfer agent fees — A, C, R and Y | 4,140,044 |
| Transfer agent fees — R5 | 235,562 |
| Transfer agent fees — R6 | 246,444 |
| Trustees’ and officers’ fees and benefits | 58,313 |
| Registration and filing fees | 131,362 |
| Reports to shareholders | 621,536 |
| Professional services fees | 96,990 |
| Other | 84,886 |
| Total expenses | 27,346,762 |
| Less: Fees waived and/or expense offset arrangement(s) | (111,506) |
| Net expenses | 27,235,256 |
| Net investment income | 60,080,359 |
| Realized and unrealized gain (loss) from: | |
| Net realized gain from: | |
| Unaffiliated investment securities | 345,120,620 |
| Affiliated investment securities | 18,895 |
| Foreign currencies | 75,595 |
| Forward foreign currency contracts | 2,705,268 |
| 347,920,378 | |
| Change in net unrealized appreciation (depreciation) of: | |
| Unaffiliated investment securities | 406,212,287 |
| Foreign currencies | 11,682 |
| Forward foreign currency contracts | (2,779,517) |
| 403,444,452 | |
| Net realized and unrealized gain | 751,364,830 |
| Net increase in net assets resulting from operations | $811,445,189 |
| 6 | Invesco Growth and Income Fund |
| 2024 | 2023 | |
| Operations: | ||
| Net investment income | $60,080,359 | $70,305,122 |
| Net realized gain | 347,920,378 | 413,678,602 |
| Change in net unrealized appreciation (depreciation) | 403,444,452 | (156,674,314) |
| Net increase in net assets resulting from operations | 811,445,189 | 327,309,410 |
| Distributions to shareholders from distributable earnings: | ||
| Class A | (300,185,564) | (278,048,140) |
| Class C | (3,460,670) | (3,399,405) |
| Class R | (6,532,451) | (5,572,665) |
| Class Y | (43,157,093) | (47,847,695) |
| Class R5 | (28,332,007) | (46,057,592) |
| Class R6 | (103,212,723) | (92,701,026) |
| Total distributions from distributable earnings | (484,880,508) | (473,626,523) |
| Share transactions–net: | ||
| Class A | 7,428,976 | 25,839,646 |
| Class C | (3,154,855) | (1,406,441) |
| Class R | (5,373,337) | 3,617,666 |
| Class Y | (10,026,423) | (59,848,236) |
| Class R5 | (98,768,283) | (52,597,046) |
| Class R6 | (14,825,913) | (104,881,583) |
| Net increase (decrease) in net assets resulting from share transactions | (124,719,835) | (189,275,994) |
| Net increase (decrease) in net assets | 201,844,846 | (335,593,107) |
| Net assets: | ||
| Beginning of year | 4,004,238,216 | 4,339,831,323 |
| End of year | $4,206,083,062 | $4,004,238,216 |
| 7 | Invesco Growth and Income Fund |
| Net asset value, beginning of period | Net investment income(a) | Net gains (losses) on securities (both realized and unrealized) | Total from investment operations | Dividends from net investment income | Distributions from net realized gains | Total distributions | Net asset value, end of period | Total return(b) | Net assets, end of period (000’s omitted) | Ratio of expenses to average net assets with fee waivers and/or expenses absorbed | Ratio of expenses to average net assets without fee waivers and/or expenses absorbed | Ratio of net investment income to average net assets | Portfolio turnover (c) | |
| Class A | ||||||||||||||
| Year ended 08/31/24 | $21.37 | $0.30 | $4.04 | $4.34 | $(0.32) | $(2.38) | $(2.70) | $23.01 | 22.39% | $2,652,126 | 0.79% | 0.79% | 1.40% | 25% |
| Year ended 08/31/23 | 22.20 | 0.33 | 1.36 | 1.69 | (0.38) | (2.14) | (2.52) | 21.37 | 8.00 | 2,438,756 | 0.79 | 0.79 | 1.57 | 21 |
| Year ended 08/31/22 | 28.10 | 0.32 | (1.13) | (0.81) | (0.29) | (4.80) | (5.09) | 22.20 | (3.90) | 2,499,911 | 0.78 | 0.78 | 1.28 | 23 |
| Year ended 08/31/21 | 20.01 | 0.30 | 8.63 | 8.93 | (0.35) | (0.49) | (0.84) | 28.10 | 45.62 | 2,844,145 | 0.80 | 0.80 | 1.22 | 33 |
| Year ended 08/31/20 | 22.89 | 0.41 | (1.24) | (0.83) | (0.44) | (1.61) | (2.05) | 20.01 | (4.39) | 2,609,002 | 0.81 | 0.81 | 1.97 | 26 |
| Class C | ||||||||||||||
| Year ended 08/31/24 | 20.93 | 0.14 | 3.94 | 4.08 | (0.16) | (2.38) | (2.54) | 22.47 | 21.44(d) | 28,958 | 1.53(d) | 1.53(d) | 0.66(d) | 25 |
| Year ended 08/31/23 | 21.77 | 0.18 | 1.33 | 1.51 | (0.21) | (2.14) | (2.35) | 20.93 | 7.25(d) | 29,875 | 1.52(d) | 1.52(d) | 0.84(d) | 21 |
| Year ended 08/31/22 | 27.69 | 0.13 | (1.09) | (0.96) | (0.16) | (4.80) | (4.96) | 21.77 | (4.58)(d) | 32,497 | 1.52(d) | 1.52(d) | 0.54(d) | 23 |
| Year ended 08/31/21 | 19.73 | 0.12 | 8.51 | 8.63 | (0.18) | (0.49) | (0.67) | 27.69 | 44.53(d) | 39,357 | 1.50(d) | 1.50(d) | 0.52(d) | 33 |
| Year ended 08/31/20 | 22.57 | 0.25 | (1.20) | (0.95) | (0.28) | (1.61) | (1.89) | 19.73 | (5.05) | 38,808 | 1.56 | 1.56 | 1.22 | 26 |
| Class R | ||||||||||||||
| Year ended 08/31/24 | 21.41 | 0.25 | 4.03 | 4.28 | (0.26) | (2.38) | (2.64) | 23.05 | 22.03 | 52,198 | 1.04 | 1.04 | 1.15 | 25 |
| Year ended 08/31/23 | 22.23 | 0.28 | 1.36 | 1.64 | (0.32) | (2.14) | (2.46) | 21.41 | 7.75 | 53,250 | 1.04 | 1.04 | 1.32 | 21 |
| Year ended 08/31/22 | 28.13 | 0.25 | (1.13) | (0.88) | (0.22) | (4.80) | (5.02) | 22.23 | (4.14) | 51,354 | 1.03 | 1.03 | 1.03 | 23 |
| Year ended 08/31/21 | 20.03 | 0.24 | 8.64 | 8.88 | (0.29) | (0.49) | (0.78) | 28.13 | 45.26 | 60,808 | 1.05 | 1.05 | 0.97 | 33 |
| Year ended 08/31/20 | 22.90 | 0.36 | (1.23) | (0.87) | (0.39) | (1.61) | (2.00) | 20.03 | (4.60) | 61,342 | 1.06 | 1.06 | 1.72 | 26 |
| Class Y | ||||||||||||||
| Year ended 08/31/24 | 21.39 | 0.35 | 4.04 | 4.39 | (0.37) | (2.38) | (2.75) | 23.03 | 22.67 | 367,898 | 0.54 | 0.54 | 1.65 | 25 |
| Year ended 08/31/23 | 22.22 | 0.39 | 1.35 | 1.74 | (0.43) | (2.14) | (2.57) | 21.39 | 8.28 | 349,894 | 0.54 | 0.54 | 1.82 | 21 |
| Year ended 08/31/22 | 28.12 | 0.38 | (1.12) | (0.74) | (0.36) | (4.80) | (5.16) | 22.22 | (3.63) | 427,166 | 0.53 | 0.53 | 1.53 | 23 |
| Year ended 08/31/21 | 20.03 | 0.36 | 8.63 | 8.99 | (0.41) | (0.49) | (0.90) | 28.12 | 45.94 | 517,664 | 0.55 | 0.55 | 1.47 | 33 |
| Year ended 08/31/20 | 22.91 | 0.47 | (1.24) | (0.77) | (0.50) | (1.61) | (2.11) | 20.03 | (4.12) | 477,858 | 0.56 | 0.56 | 2.22 | 26 |
| Class R5 | ||||||||||||||
| Year ended 08/31/24 | 21.43 | 0.36 | 4.04 | 4.40 | (0.38) | (2.38) | (2.76) | 23.07 | 22.69 | 250,613 | 0.50 | 0.50 | 1.69 | 25 |
| Year ended 08/31/23 | 22.25 | 0.40 | 1.36 | 1.76 | (0.44) | (2.14) | (2.58) | 21.43 | 8.36 | 329,238 | 0.49 | 0.49 | 1.87 | 21 |
| Year ended 08/31/22 | 28.16 | 0.39 | (1.13) | (0.74) | (0.37) | (4.80) | (5.17) | 22.25 | (3.62) | 397,345 | 0.48 | 0.48 | 1.58 | 23 |
| Year ended 08/31/21 | 20.06 | 0.38 | 8.64 | 9.02 | (0.43) | (0.49) | (0.92) | 28.16 | 46.04 | 438,989 | 0.47 | 0.47 | 1.55 | 33 |
| Year ended 08/31/20 | 22.94 | 0.49 | (1.24) | (0.75) | (0.52) | (1.61) | (2.13) | 20.06 | (4.03) | 443,315 | 0.48 | 0.48 | 2.30 | 26 |
| Class R6 | ||||||||||||||
| Year ended 08/31/24 | 21.43 | 0.38 | 4.03 | 4.41 | (0.39) | (2.38) | (2.77) | 23.07 | 22.77 | 854,291 | 0.43 | 0.43 | 1.76 | 25 |
| Year ended 08/31/23 | 22.25 | 0.41 | 1.37 | 1.78 | (0.46) | (2.14) | (2.60) | 21.43 | 8.45 | 803,225 | 0.42 | 0.42 | 1.94 | 21 |
| Year ended 08/31/22 | 28.16 | 0.41 | (1.13) | (0.72) | (0.39) | (4.80) | (5.19) | 22.25 | (3.55) | 931,558 | 0.41 | 0.41 | 1.65 | 23 |
| Year ended 08/31/21 | 20.06 | 0.39 | 8.65 | 9.04 | (0.45) | (0.49) | (0.94) | 28.16 | 46.16 | 1,102,312 | 0.40 | 0.40 | 1.62 | 33 |
| Year ended 08/31/20 | 22.94 | 0.50 | (1.23) | (0.73) | (0.54) | (1.61) | (2.15) | 20.06 | (3.93) | 1,147,101 | 0.39 | 0.39 | 2.39 | 26 |
| (a) | Calculated using average shares outstanding. |
| (b) | Includes adjustments in accordance with accounting principles generally accepted in the United States of America and as such, the net asset value for financial reporting purposes and the returns based upon those net asset values may differ from the net asset value and returns for shareholder transactions. Does not include sales charges and is not annualized for periods less than one year, if applicable. |
| (c) | Portfolio turnover is calculated at the fund level and is not annualized for periods less than one year, if applicable. |
| (d) | The total return, ratios of expenses to average net assets and ratio of net investment income to average net assets reflect actual 12b-1 fees of 0.99%, 0.98%, 0.99% and 0.95% for the years ended August 31, 2024, 2023, 2022 and 2021, respectively. |
| 8 | Invesco Growth and Income Fund |
| A. | Security Valuations – Securities, including restricted securities, are valued according to the following policy. |
| 9 | Invesco Growth and Income Fund |
| B. | Securities Transactions and Investment Income — Securities transactions are accounted for on a trade date basis. Realized gains or losses on sales are computed on the basis of specific identification of the securities sold. Interest income (net of withholding tax, if any) is recorded on an accrual basis from settlement date and includes coupon interest and amortization of premium and accretion of discount on debt securities as applicable. Pay-in-kind interest income and non-cash dividend income received in the form of securities in lieu of cash are recorded at the fair value of the securities received. Dividend income (net of withholding tax, if any) is recorded on the ex-dividend date. |
| C. | Country Determination — For the purposes of making investment selection decisions and presentation in the Schedule of Investments, the investment adviser may determine the country in which an issuer is located and/or credit risk exposure based on various factors. These factors include the laws of the country under which the issuer is organized, where the issuer maintains a principal office, the country in which the issuer derives 50% or more of its total revenues, the country that has the primary market for the issuer’s securities and its "country of risk" as determined by a third party service provider, as well as other criteria. Among the other criteria that may be evaluated for making this determination are the country in which the issuer maintains 50% or more of its assets, the type of security, financial guarantees and enhancements, the nature of the collateral and the sponsor organization. Country of issuer and/or credit risk exposure has been determined to be the United States of America, unless otherwise noted. |
| D. | Distributions - Distributions from net investment income, if any, are declared and paid quarterly and are recorded on the ex-dividend date. Distributions from net realized capital gain, if any, are generally declared and paid annually and recorded on the ex-dividend date. The Fund may elect to treat a portion of the proceeds from redemptions as distributions for federal income tax purposes. |
| E. | Federal Income Taxes – The Fund intends to comply with the requirements of Subchapter M of the Internal Revenue Code of 1986, as amended (the “Internal Revenue Code”), necessary to qualify as a regulated investment company and to distribute substantially all of the Fund’s taxable earnings to shareholders. As such, the Fund will not be subject to federal income taxes on otherwise taxable income (including net realized capital gain) that is distributed to shareholders. Therefore, no provision for federal income taxes is recorded in the financial statements. |
| F. | Expenses – Fees provided for under the Rule 12b-1 plan of a particular class of the Fund are charged to the operations of such class. Transfer agency fees and expenses and other shareholder recordkeeping fees and expenses attributable to Class R5 and Class R6 are allocated based on relative net assets of Class R5 and Class R6. Sub-accounting fees attributable to Class R5 are charged to the operations of the class. Transfer agency fees and expenses and other shareholder recordkeeping fees and expenses relating to all other classes are allocated among those classes based on relative net assets. All other expenses are allocated among the classes based on relative net assets. |
| G. | Accounting Estimates – The preparation of financial statements in conformity with accounting principles generally accepted in the United States of America (“GAAP”) requires management to make estimates and assumptions that affect the reported amounts of assets and liabilities at the date of the financial statements and the reported amounts of revenues and expenses during the reporting period including estimates and assumptions related to taxation. Actual results could differ from those estimates by a significant amount. In addition, the Fund monitors for material events or transactions that may occur or become known after the period-end date and before the date the financial statements are released to print. |
| H. | Indemnifications – Under the Trust’s organizational documents, each Trustee, officer, employee or other agent of the Trust is indemnified against certain liabilities that may arise out of the performance of their duties to the Fund. Additionally, in the normal course of business, the Fund enters into contracts, including the Fund’s servicing agreements, that contain a variety of indemnification clauses. The Fund’s maximum exposure under these arrangements is unknown as this would involve future claims that may be made against the Fund that have not yet occurred. The risk of material loss as a result of such indemnification claims is considered remote. |
| I. | Securities Lending – The Fund may lend portfolio securities having a market value up to one-third of the Fund’s total assets. Such loans are secured by collateral equal to no less than the market value of the loaned securities determined daily by the securities lending provider. Such collateral will be cash or debt securities issued or guaranteed by the U.S. Government or any of its sponsored agencies. Cash collateral received in connection with these loans is invested in short-term money market instruments or affiliated, unregistered investment companies that comply with Rule 2a-7 under the 1940 Act and money market funds (collectively, "affiliated money market funds") and is shown as such on the Schedule of Investments. The Fund bears the risk of loss with respect to the investment of collateral. It is the Fund’s policy to obtain additional collateral from or return excess collateral to the borrower by the end of the next business day, following the valuation date of the securities loaned. Therefore, the value of the collateral held may be temporarily less than the value of the securities on loan. When loaning securities, the Fund retains certain benefits of owning the securities, including the economic equivalent of dividends or interest generated by the security. Lending securities entails a risk of loss to the Fund if, and to the extent that, the market value of the securities loaned were to increase and the borrower did not increase the collateral accordingly, and the borrower failed to return the securities. The securities loaned are subject to termination at the option of the borrower or the Fund. Upon termination, the borrower will return to the Fund the securities loaned and the Fund will return the collateral. Upon the failure of the borrower to return the securities, collateral may be liquidated and the securities may be purchased on the open market to replace the loaned securities. The Fund could experience delays and costs in gaining access to the collateral and the securities may lose value during the delay which could result in potential losses to the Fund. Some of these losses may be indemnified by the lending agent. The Fund bears the risk of any deficiency in the amount of the collateral available for return to the borrower due to any loss on the collateral invested. Dividends received on cash collateral investments for securities lending transactions, which are net of |
| 10 | Invesco Growth and Income Fund |
| compensation to counterparties, are included in Dividends from affiliated money market funds on the Statement of Operations. The aggregate value of securities out on loan, if any, is shown as a footnote on the Statement of Assets and Liabilities. |
| J. | Foreign Currency Translations — Foreign currency is valued at the close of the NYSE based on quotations posted by banks and major currency dealers. Portfolio securities and other assets and liabilities denominated in foreign currencies are translated into U.S. dollar amounts at the date of valuation. Purchases and sales of portfolio securities (net of foreign taxes withheld on disposition) and income items denominated in foreign currencies are translated into U.S. dollar amounts on the respective dates of such transactions. The Fund does not separately account for the portion of the results of operations resulting from changes in foreign exchange rates on investments and the fluctuations arising from changes in market prices of securities held. The combined results of changes in foreign exchange rates and the fluctuation of market prices on investments (net of estimated foreign tax withholding) are included with the net realized and unrealized gain or loss from investments in the Statement of Operations. Reported net realized foreign currency gains or losses arise from (1) sales of foreign currencies, (2) currency gains or losses realized between the trade and settlement dates on securities transactions, and (3) the difference between the amounts of dividends, interest, and foreign withholding taxes recorded on the Fund’s books and the U.S. dollar equivalent of the amounts actually received or paid. Net unrealized foreign currency gains and losses arise from changes in the fair values of assets and liabilities, other than investments in securities at fiscal period end, resulting from changes in exchange rates. |
| K. | Forward Foreign Currency Contracts — The Fund may engage in foreign currency transactions either on a spot (i.e. for prompt delivery and settlement) basis, or through forward foreign currency contracts, to manage or minimize currency or exchange rate risk. |
| Average Daily Net Assets | Rate |
| First $150 million | 0.500% |
| Next $100 million | 0.450% |
| Next $100 million | 0.400% |
| Over $350 million | 0.350% |
| 11 | Invesco Growth and Income Fund |
| Level 1 | Level 2 | Level 3 | Total | |
| Investments in Securities | ||||
| Common Stocks & Other Equity Interests | $4,021,197,821 | $109,493,497 | $— | $4,130,691,318 |
| Money Market Funds | 71,210,979 | 52,371,152 | — | 123,582,131 |
| Total Investments in Securities | 4,092,408,800 | 161,864,649 | — | 4,254,273,449 |
| Other Investments - Assets* | ||||
| Forward Foreign Currency Contracts | — | 178,684 | — | 178,684 |
| Other Investments - Liabilities* | ||||
| Forward Foreign Currency Contracts | — | (2,446,276) | — | (2,446,276) |
| Total Other Investments | — | (2,267,592) | — | (2,267,592) |
| Total Investments | $4,092,408,800 | $159,597,057 | $— | $4,252,005,857 |
| * | Unrealized appreciation (depreciation). |
| 12 | Invesco Growth and Income Fund |
| Value | |
| Derivative Assets | Currency Risk |
| Unrealized appreciation on forward foreign currency contracts outstanding | $178,684 |
| Derivatives not subject to master netting agreements | — |
| Total Derivative Assets subject to master netting agreements | $178,684 |
| Value | |
| Derivative Liabilities | Currency Risk |
| Unrealized depreciation on forward foreign currency contracts outstanding | $(2,446,276) |
| Derivatives not subject to master netting agreements | — |
| Total Derivative Liabilities subject to master netting agreements | $(2,446,276) |
| Financial Derivative Assets | Financial Derivative Liabilities | Collateral (Received)/Pledged | |||||
| Counterparty | Forward Foreign Currency Contracts | Forward Foreign Currency Contracts | Net Value of Derivatives | Non-Cash | Cash | Net Amount | |
| Bank of New York Mellon (The) | $− | $(839,575) | $(839,575) | $— | $— | $(839,575) | |
| State Street Bank & Trust Co. | 178,684 | (1,606,701) | (1,428,017) | — | — | (1,428,017) | |
| Total | $178,684 | $(2,446,276) | $(2,267,592) | $— | $— | $(2,267,592) | |
| Location of Gain (Loss) on Statement of Operations | |
| Currency Risk | |
| Realized Gain: | |
| Forward foreign currency contracts | $2,705,268 |
| Change in Net Unrealized Appreciation (Depreciation): | |
| Forward foreign currency contracts | (2,779,517) |
| Total | $(74,249) |
| Forward Foreign Currency Contracts | |
| Average notional value | $318,459,573 |
| 13 | Invesco Growth and Income Fund |
| Tax Character of Distributions to Shareholders Paid During the Fiscal Years Ended August 31, 2024 and 2023: | ||
| 2024 | 2023 | |
| Ordinary income* | $67,622,111 | $77,568,879 |
| Long-term capital gain | 417,258,397 | 396,057,644 |
| Total distributions | $484,880,508 | $473,626,523 |
| * | Includes short-term capital gain distributions, if any. |
| Tax Components of Net Assets at Period-End: | |
| 2024 | |
| Undistributed ordinary income | $15,891,406 |
| Undistributed long-term capital gain | 230,584,756 |
| Net unrealized appreciation — investments | 1,294,401,668 |
| Net unrealized appreciation — foreign currencies | 25,204 |
| Temporary book/tax differences | (406,249) |
| Shares of beneficial interest | 2,665,586,277 |
| Total net assets | $4,206,083,062 |
| Unrealized Appreciation (Depreciation) of Investments on a Tax Basis | |
| Aggregate unrealized appreciation of investments | $1,349,024,017 |
| Aggregate unrealized (depreciation) of investments | (54,622,349) |
| Net unrealized appreciation of investments | $1,294,401,668 |
| Summary of Share Activity | |||||
| Year ended August 31, 2024(a) | Year ended August 31, 2023 | ||||
| Shares | Amount | Shares | Amount | ||
| Sold: | |||||
| Class A | 5,659,928 | $120,499,912 | 6,512,241 | $137,726,084 | |
| Class C | 188,636 | 3,908,242 | 202,980 | 4,219,088 | |
| Class R | 396,500 | 8,471,919 | 435,161 | 9,229,043 | |
| Class Y | 2,328,622 | 49,659,891 | 1,926,465 | 41,000,744 | |
| Class R5 | 1,246,983 | 26,754,719 | 2,647,866 | 56,189,087 | |
| Class R6 | 5,635,348 | 119,311,443 | 5,583,013 | 118,227,446 | |
| 14 | Invesco Growth and Income Fund |
| Summary of Share Activity | |||||
| Year ended August 31, 2024(a) | Year ended August 31, 2023 | ||||
| Shares | Amount | Shares | Amount | ||
| Issued as reinvestment of dividends: | |||||
| Class A | 14,517,410 | $289,238,470 | 12,265,034 | $255,845,495 | |
| Class C | 172,443 | 3,349,737 | 155,470 | 3,182,844 | |
| Class R | 327,364 | 6,532,394 | 266,590 | 5,572,630 | |
| Class Y | 1,955,458 | 38,988,158 | 1,866,983 | 38,941,820 | |
| Class R5 | 1,411,786 | 28,241,376 | 2,201,109 | 45,983,255 | |
| Class R6 | 5,146,729 | 102,918,903 | 4,382,001 | 91,494,780 | |
| Automatic conversion of Class C shares to Class A shares: | |||||
| Class A | 210,733 | 4,533,644 | 122,711 | 2,600,775 | |
| Class C | (215,605) | (4,533,644) | (125,190) | (2,600,775) | |
| Reacquired: | |||||
| Class A | (19,220,930) | (406,843,050) | (17,416,247) | (370,332,708) | |
| Class C | (284,306) | (5,879,190) | (298,550) | (6,207,598) | |
| Class R | (946,794) | (20,377,650) | (524,669) | (11,184,007) | |
| Class Y | (4,665,561) | (98,674,472) | (6,662,982) | (139,790,800) | |
| Class R5 | (7,160,491) | (153,764,378) | (7,340,237) | (154,769,388) | |
| Class R6 | (11,240,954) | (237,056,259) | (14,341,749) | (314,603,809) | |
| Net increase (decrease) in share activity | (4,536,701) | $(124,719,835) | (8,142,000) | $(189,275,994) | |
| (a) | There are entities that are record owners of more than 5% of the outstanding shares of the Fund and in the aggregate own 42% of the outstanding shares of the Fund. IDI has an agreement with these entities to sell Fund shares. The Fund, Invesco and/or Invesco affiliates may make payments to these entities, which are considered to be related to the Fund, for providing services to the Fund, Invesco and/or Invesco affiliates including but not limited to services such as securities brokerage, distribution, third party record keeping and account servicing. The Fund has no knowledge as to whether all or any portion of the shares owned of record by these entities are also owned beneficially. |
| 15 | Invesco Growth and Income Fund |
| 16 | Invesco Growth and Income Fund |
| A. | Nature, Extent and Quality of Services Provided by Invesco Advisers and the Affiliated Sub-Advisers |
| B. | Fund Investment Performance |
| 17 | Invesco Growth and Income Fund |
| C. | Advisory and Sub-Advisory Fees and Fund Expenses |
| D. | Economies of Scale and Breakpoints |
| E. | Profitability and Financial Resources |
| F. | Collateral Benefits to Invesco Advisers and its Affiliates |
| 18 | Invesco Growth and Income Fund |
| 19 | Invesco Growth and Income Fund |
| Federal and State Income Tax | |
| Long-Term Capital Gain Distributions | $435,065,397 |
| Qualified Dividend Income* | 100.00% |
| Corporate Dividends Received Deduction* | 94.24% |
| U.S. Treasury Obligations* | 0.00% |
| Qualified Business Income* | 0.00% |
| Business Interest Income* | 0.00% |
| * | The above percentages are based on ordinary income dividends paid to shareholders during the Fund’s fiscal year. |
| Non-Resident Alien Shareholders | |
| Short-Term Capital Gain Distributions | $5,760,453 |
| 20 | Invesco Growth and Income Fund |
| 21 | Invesco Growth and Income Fund |

| Annual Financial Statements and Other Information | August 31, 2024 |
| Shares | Value | ||
| Common Stocks & Other Equity Interests–77.55% | |||
| Advertising–0.09% | |||
| Omnicom Group, Inc.(b) | 1,175 | $118,005 | |
| Trade Desk, Inc. (The), Class A(c) | 761 | 79,548 | |
| 197,553 | |||
| Aerospace & Defense–2.01% | |||
| Boeing Co. (The)(c) | 714 | 124,050 | |
| General Dynamics Corp. | 1,398 | 418,505 | |
| General Electric Co. | 5,099 | 890,388 | |
| L3Harris Technologies, Inc. | 841 | 199,040 | |
| Lockheed Martin Corp. | 1,522 | 864,648 | |
| Northrop Grumman Corp. | 634 | 331,715 | |
| RTX Corp. | 10,850 | 1,338,239 | |
| TransDigm Group, Inc. | 220 | 302,106 | |
| 4,468,691 | |||
| Agricultural & Farm Machinery–0.23% | |||
| Deere & Co. | 1,319 | 508,791 | |
| Agricultural Products & Services–0.14% | |||
| Archer-Daniels-Midland Co. | 5,155 | 314,403 | |
| Air Freight & Logistics–0.27% | |||
| FedEx Corp. | 1,178 | 351,951 | |
| United Parcel Service, Inc., Class B | 1,954 | 251,187 | |
| 603,138 | |||
| Apparel Retail–0.21% | |||
| Ross Stores, Inc. | 667 | 100,457 | |
| TJX Cos., Inc. (The) | 3,059 | 358,729 | |
| 459,186 | |||
| Apparel, Accessories & Luxury Goods–0.04% | |||
| lululemon athletica, inc.(c) | 320 | 83,030 | |
| Application Software–1.62% | |||
| Adobe, Inc.(c) | 1,111 | 638,170 | |
| ANSYS, Inc.(c) | 101 | 32,463 | |
| Autodesk, Inc.(c) | 443 | 114,471 | |
| Cadence Design Systems, Inc.(c) | 895 | 240,692 | |
| Datadog, Inc., Class A(c) | 958 | 111,377 | |
| Fair Isaac Corp.(c) | 95 | 164,376 | |
| HubSpot, Inc.(c) | 140 | 69,870 | |
| Intuit, Inc. | 733 | 461,981 | |
| Palantir Technologies, Inc., Class A(b)(c) | 4,827 | 151,954 | |
| Roper Technologies, Inc. | 810 | 449,072 | |
| Salesforce, Inc. | 3,383 | 855,561 | |
| Synopsys, Inc.(c) | 284 | 147,561 | |
| Workday, Inc., Class A(c) | 650 | 171,073 | |
| 3,608,621 | |||
| Asset Management & Custody Banks–0.64% | |||
| Ameriprise Financial, Inc. | 347 | 155,956 | |
| Bank of New York Mellon Corp. (The) | 2,386 | 162,773 | |
| BlackRock, Inc. | 287 | 258,820 | |
| Blackstone, Inc., Class A | 2,520 | 358,747 | |
| KKR & Co., Inc., Class A | 2,394 | 296,305 | |
| Shares | Value | ||
| Asset Management & Custody Banks–(continued) | |||
| Northern Trust Corp. | 235 | $21,434 | |
| State Street Corp. | 1,215 | 105,827 | |
| T. Rowe Price Group, Inc. | 579 | 61,397 | |
| 1,421,259 | |||
| Automobile Manufacturers–0.87% | |||
| Ford Motor Co. | 27,688 | 309,829 | |
| General Motors Co. | 18,749 | 933,325 | |
| Tesla, Inc.(c) | 3,241 | 693,930 | |
| 1,937,084 | |||
| Automotive Parts & Equipment–0.04% | |||
| Aptiv PLC(c) | 1,385 | 99,069 | |
| Automotive Retail–0.28% | |||
| AutoZone, Inc.(c) | 92 | 292,696 | |
| O’Reilly Automotive, Inc.(c) | 301 | 340,121 | |
| 632,817 | |||
| Biotechnology–1.70% | |||
| AbbVie, Inc. | 7,441 | 1,460,743 | |
| Amgen, Inc. | 1,647 | 549,818 | |
| Biogen, Inc.(c) | 456 | 93,370 | |
| BioNTech SE, ADR (Germany)(c) | 1,459 | 128,713 | |
| Gilead Sciences, Inc. | 6,628 | 523,612 | |
| GRAIL, Inc.(b)(c) | 32 | 451 | |
| Moderna, Inc.(b)(c) | 392 | 30,341 | |
| Regeneron Pharmaceuticals, Inc.(c) | 378 | 447,813 | |
| Vertex Pharmaceuticals, Inc.(c) | 1,092 | 541,512 | |
| 3,776,373 | |||
| Broadline Retail–2.33% | |||
| Amazon.com, Inc.(c) | 25,984 | 4,638,144 | |
| Coupang, Inc. (South Korea)(c) | 2,616 | 57,944 | |
| eBay, Inc. | 3,157 | 186,579 | |
| MercadoLibre, Inc. (Brazil)(c) | 150 | 309,249 | |
| 5,191,916 | |||
| Building Products–0.23% | |||
| Carrier Global Corp. | 978 | 71,179 | |
| Johnson Controls International PLC | 1,659 | 120,858 | |
| Trane Technologies PLC | 913 | 330,196 | |
| 522,233 | |||
| Cable & Satellite–0.66% | |||
| Charter Communications, Inc., Class A(c) | 892 | 310,006 | |
| Comcast Corp., Class A | 29,087 | 1,150,972 | |
| 1,460,978 | |||
| Cargo Ground Transportation–0.05% | |||
| Old Dominion Freight Line, Inc. | 520 | 100,256 | |
| Casinos & Gaming–0.05% | |||
| Las Vegas Sands Corp. | 3,104 | 121,025 | |
| Commodity Chemicals–0.14% | |||
| Dow, Inc. | 3,488 | 186,887 | |
| 2 | Invesco Income Advantage U.S. Fund |
| Shares | Value | ||
| Commodity Chemicals–(continued) | |||
| LyondellBasell Industries N.V., Class A | 1,369 | $135,120 | |
| 322,007 | |||
| Communications Equipment–1.04% | |||
| Arista Networks, Inc.(c) | 582 | 205,667 | |
| Cisco Systems, Inc. | 32,004 | 1,617,482 | |
| Motorola Solutions, Inc. | 1,122 | 495,969 | |
| 2,319,118 | |||
| Construction & Engineering–0.04% | |||
| Quanta Services, Inc. | 312 | 85,841 | |
| Construction Machinery & Heavy Transportation Equipment– 0.70% | |||
| Caterpillar, Inc. | 2,756 | 981,412 | |
| Cummins, Inc. | 810 | 253,408 | |
| PACCAR, Inc. | 3,324 | 319,702 | |
| 1,554,522 | |||
| Construction Materials–0.10% | |||
| Martin Marietta Materials, Inc. | 233 | 124,459 | |
| Vulcan Materials Co. | 399 | 97,839 | |
| 222,298 | |||
| Consumer Electronics–0.10% | |||
| Garmin Ltd. | 1,192 | 218,482 | |
| Consumer Finance–0.57% | |||
| American Express Co. | 3,100 | 801,815 | |
| Capital One Financial Corp. | 2,155 | 316,634 | |
| Discover Financial Services | 1,025 | 142,178 | |
| 1,260,627 | |||
| Consumer Staples Merchandise Retail–1.43% | |||
| Costco Wholesale Corp. | 1,578 | 1,408,176 | |
| Dollar General Corp.(b) | 624 | 51,773 | |
| Dollar Tree, Inc.(c) | 505 | 42,667 | |
| Target Corp. | 2,146 | 329,669 | |
| Walmart, Inc. | 17,503 | 1,351,757 | |
| 3,184,042 | |||
| Copper–0.12% | |||
| Freeport-McMoRan, Inc. | 5,042 | 223,260 | |
| Southern Copper Corp. (Mexico)(b) | 351 | 35,699 | |
| 258,959 | |||
| Data Center REITs–0.12% | |||
| Digital Realty Trust, Inc. | 638 | 96,727 | |
| Equinix, Inc. | 198 | 165,203 | |
| 261,930 | |||
| Distillers & Vintners–0.07% | |||
| Brown-Forman Corp., Class B(b) | 403 | 18,373 | |
| Constellation Brands, Inc., Class A | 549 | 132,150 | |
| 150,523 | |||
| Distributors–0.04% | |||
| Genuine Parts Co. | 642 | 91,973 | |
| Diversified Banks–3.07% | |||
| Bank of America Corp. | 32,544 | 1,326,168 | |
| Citigroup, Inc. | 11,359 | 711,528 | |
| Shares | Value | ||
| Diversified Banks–(continued) | |||
| Fifth Third Bancorp | 2,829 | $120,770 | |
| JPMorgan Chase & Co. | 12,737 | 2,863,277 | |
| NU Holdings Ltd., Class A (Brazil)(c) | 12,130 | 181,586 | |
| PNC Financial Services Group, Inc. (The) | 1,443 | 267,085 | |
| U.S. Bancorp | 4,154 | 196,193 | |
| Wells Fargo & Co. | 19,842 | 1,160,162 | |
| 6,826,769 | |||
| Diversified Financial Services–0.06% | |||
| Apollo Global Management, Inc. | 1,131 | 130,891 | |
| Diversified Support Services–0.20% | |||
| Cintas Corp. | 456 | 367,135 | |
| Copart, Inc.(c) | 1,647 | 87,225 | |
| 454,360 | |||
| Electric Utilities–1.45% | |||
| American Electric Power Co., Inc. | 2,568 | 257,519 | |
| Constellation Energy Corp. | 1,908 | 375,304 | |
| Duke Energy Corp. | 5,764 | 656,808 | |
| Edison International | 1,686 | 146,733 | |
| Entergy Corp. | 1,412 | 170,414 | |
| Eversource Energy | 1,972 | 133,169 | |
| Exelon Corp. | 6,093 | 232,082 | |
| FirstEnergy Corp. | 2,275 | 99,918 | |
| NextEra Energy, Inc. | 4,359 | 350,943 | |
| PG&E Corp. | 6,657 | 131,143 | |
| PPL Corp. | 4,003 | 127,736 | |
| Southern Co. (The) | 3,626 | 313,286 | |
| Xcel Energy, Inc. | 3,608 | 220,918 | |
| 3,215,973 | |||
| Electrical Components & Equipment–0.53% | |||
| AMETEK, Inc. | 1,099 | 187,984 | |
| Eaton Corp. PLC | 1,539 | 472,365 | |
| Emerson Electric Co. | 1,130 | 119,091 | |
| Rockwell Automation, Inc. | 256 | 69,640 | |
| Vertiv Holdings Co., Class A | 3,844 | 319,167 | |
| 1,168,247 | |||
| Electronic Components–0.29% | |||
| Amphenol Corp., Class A | 6,929 | 467,361 | |
| Corning, Inc. | 4,394 | 183,889 | |
| 651,250 | |||
| Electronic Equipment & Instruments–0.03% | |||
| Keysight Technologies, Inc.(c) | 463 | 71,358 | |
| Electronic Manufacturing Services–0.10% | |||
| TE Connectivity Ltd. | 1,461 | 224,410 | |
| Environmental & Facilities Services–0.45% | |||
| Republic Services, Inc. | 1,136 | 236,526 | |
| Waste Connections, Inc. | 1,196 | 223,054 | |
| Waste Management, Inc. | 2,546 | 539,854 | |
| 999,434 | |||
| Fertilizers & Agricultural Chemicals–0.08% | |||
| Corteva, Inc. | 3,244 | 185,881 | |
| 3 | Invesco Income Advantage U.S. Fund |
| Shares | Value | ||
| Financial Exchanges & Data–0.62% | |||
| CME Group, Inc., Class A | 1,677 | $361,796 | |
| Coinbase Global, Inc., Class A(b)(c) | 1,016 | 186,294 | |
| Intercontinental Exchange, Inc. | 1,743 | 281,582 | |
| Moody’s Corp. | 359 | 175,099 | |
| MSCI, Inc. | 165 | 95,797 | |
| Nasdaq, Inc. | 1,138 | 82,027 | |
| S&P Global, Inc. | 364 | 186,819 | |
| 1,369,414 | |||
| Food Distributors–0.07% | |||
| Sysco Corp. | 1,888 | 147,207 | |
| Food Retail–0.10% | |||
| Kroger Co. (The) | 4,315 | 229,601 | |
| Footwear–0.05% | |||
| NIKE, Inc., Class B | 1,362 | 113,482 | |
| Gold–0.03% | |||
| Newmont Corp. | 1,340 | 71,543 | |
| Health Care Distributors–0.33% | |||
| Cardinal Health, Inc. | 1,061 | 119,596 | |
| Cencora, Inc. | 886 | 212,259 | |
| McKesson Corp. | 718 | 402,855 | |
| 734,710 | |||
| Health Care Equipment–1.63% | |||
| Abbott Laboratories | 6,140 | 695,478 | |
| Baxter International, Inc. | 1,657 | 62,867 | |
| Becton, Dickinson and Co. | 1,362 | 330,162 | |
| Boston Scientific Corp.(c) | 6,189 | 506,198 | |
| DexCom, Inc.(c) | 986 | 68,369 | |
| Edwards Lifesciences Corp.(c) | 1,286 | 89,969 | |
| GE HealthCare Technologies, Inc. | 1,836 | 155,729 | |
| IDEXX Laboratories, Inc.(c) | 196 | 94,341 | |
| Intuitive Surgical, Inc.(c) | 936 | 461,102 | |
| Medtronic PLC | 6,658 | 589,766 | |
| ResMed, Inc.(b) | 170 | 41,653 | |
| STERIS PLC | 115 | 27,726 | |
| Stryker Corp. | 1,112 | 400,787 | |
| Zimmer Biomet Holdings, Inc. | 821 | 94,793 | |
| 3,618,940 | |||
| Health Care Facilities–0.21% | |||
| HCA Healthcare, Inc. | 1,207 | 477,477 | |
| Health Care REITs–0.16% | |||
| Alexandria Real Estate Equities, Inc. | 964 | 115,265 | |
| Ventas, Inc. | 1,142 | 70,930 | |
| Welltower, Inc. | 1,327 | 160,142 | |
| 346,337 | |||
| Health Care Services–0.69% | |||
| Cigna Group (The) | 1,924 | 696,122 | |
| CVS Health Corp. | 13,202 | 755,683 | |
| Labcorp Holdings, Inc. | 398 | 91,496 | |
| 1,543,301 | |||
| Health Care Supplies–0.01% | |||
| Align Technology, Inc.(c) | 82 | 19,452 | |
| Shares | Value | ||
| Health Care Technology–0.02% | |||
| Veeva Systems, Inc., Class A(c) | 172 | $37,228 | |
| Heavy Electrical Equipment–0.06% | |||
| GE Vernova, Inc.(c) | 661 | 132,861 | |
| Home Improvement Retail–0.86% | |||
| Home Depot, Inc. (The) | 3,573 | 1,316,650 | |
| Lowe’s Cos., Inc. | 2,444 | 607,334 | |
| 1,923,984 | |||
| Homebuilding–0.27% | |||
| D.R. Horton, Inc. | 1,518 | 286,538 | |
| Lennar Corp., Class A | 1,718 | 312,779 | |
| 599,317 | |||
| Hotels, Resorts & Cruise Lines–0.52% | |||
| Airbnb, Inc., Class A(c) | 1,826 | 214,208 | |
| Booking Holdings, Inc. | 140 | 547,292 | |
| Hilton Worldwide Holdings, Inc. | 904 | 198,554 | |
| Marriott International, Inc., Class A | 485 | 113,825 | |
| Royal Caribbean Cruises Ltd.(c) | 543 | 89,389 | |
| 1,163,268 | |||
| Household Products–0.98% | |||
| Church & Dwight Co., Inc. | 678 | 69,075 | |
| Colgate-Palmolive Co. | 5,874 | 625,581 | |
| Kimberly-Clark Corp. | 1,116 | 161,440 | |
| Procter & Gamble Co. (The) | 7,691 | 1,319,314 | |
| 2,175,410 | |||
| Human Resource & Employment Services–0.31% | |||
| Automatic Data Processing, Inc. | 2,135 | 589,068 | |
| Paychex, Inc. | 764 | 100,237 | |
| 689,305 | |||
| Industrial Conglomerates–0.29% | |||
| 3M Co. | 1,896 | 255,372 | |
| Honeywell International, Inc. | 1,824 | 379,228 | |
| 634,600 | |||
| Industrial Gases–0.54% | |||
| Air Products and Chemicals, Inc.(b) | 257 | 71,664 | |
| Linde PLC | 2,370 | 1,133,453 | |
| 1,205,117 | |||
| Industrial Machinery & Supplies & Components–0.50% | |||
| Dover Corp. | 648 | 120,547 | |
| Fortive Corp. | 1,423 | 105,871 | |
| Illinois Tool Works, Inc. | 1,015 | 256,978 | |
| Ingersoll Rand, Inc. | 1,005 | 91,907 | |
| Otis Worldwide Corp. | 1,695 | 160,500 | |
| Parker-Hannifin Corp. | 488 | 292,898 | |
| Xylem, Inc. | 557 | 76,604 | |
| 1,105,305 | |||
| Industrial REITs–0.16% | |||
| Prologis, Inc. | 2,765 | 353,422 | |
| Insurance Brokers–0.51% | |||
| Aon PLC, Class A | 834 | 286,663 | |
| Arthur J. Gallagher & Co. | 625 | 182,856 | |
| Marsh & McLennan Cos., Inc. | 2,241 | 509,850 | |
| 4 | Invesco Income Advantage U.S. Fund |
| Shares | Value | ||
| Insurance Brokers–(continued) | |||
| Willis Towers Watson PLC | 528 | $154,234 | |
| 1,133,603 | |||
| Integrated Oil & Gas–0.67% | |||
| Chevron Corp. | 4,738 | 700,987 | |
| Exxon Mobil Corp. | 5,234 | 617,298 | |
| Occidental Petroleum Corp. | 2,937 | 167,350 | |
| 1,485,635 | |||
| Integrated Telecommunication Services–1.97% | |||
| AT&T, Inc. | 107,465 | 2,138,553 | |
| Verizon Communications, Inc. | 53,441 | 2,232,765 | |
| 4,371,318 | |||
| Interactive Home Entertainment–0.16% | |||
| Electronic Arts, Inc.(b) | 2,158 | 327,628 | |
| Roblox Corp., Class A(b)(c) | 579 | 25,470 | |
| 353,098 | |||
| Interactive Media & Services–5.35% | |||
| Alphabet, Inc., Class A | 36,244 | 5,921,545 | |
| Meta Platforms, Inc., Class A | 11,461 | 5,974,734 | |
| 11,896,279 | |||
| Internet Services & Infrastructure–0.02% | |||
| Snowflake, Inc., Class A(c) | 359 | 41,009 | |
| Investment Banking & Brokerage–0.60% | |||
| Charles Schwab Corp. (The) | 3,602 | 234,490 | |
| Goldman Sachs Group, Inc. (The) | 1,504 | 767,416 | |
| Morgan Stanley | 3,297 | 341,602 | |
| 1,343,508 | |||
| IT Consulting & Other Services–1.31% | |||
| Accenture PLC, Class A (Ireland) | 2,413 | 825,125 | |
| Cognizant Technology Solutions Corp., Class A | 3,852 | 299,570 | |
| Gartner, Inc.(c) | 163 | 80,190 | |
| International Business Machines Corp. | 8,448 | 1,707,594 | |
| 2,912,479 | |||
| Life & Health Insurance–0.37% | |||
| Aflac, Inc. | 2,182 | 240,806 | |
| MetLife, Inc. | 4,434 | 343,546 | |
| Principal Financial Group, Inc. | 627 | 51,050 | |
| Prudential Financial, Inc. | 1,625 | 196,885 | |
| 832,287 | |||
| Life Sciences Tools & Services–0.54% | |||
| Agilent Technologies, Inc. | 656 | 93,756 | |
| Danaher Corp. | 1,233 | 332,059 | |
| Illumina, Inc.(c) | 187 | 24,572 | |
| IQVIA Holdings, Inc.(c) | 440 | 110,682 | |
| Mettler-Toledo International, Inc.(c) | 67 | 96,418 | |
| Thermo Fisher Scientific, Inc. | 788 | 484,675 | |
| Waters Corp.(c) | 69 | 23,898 | |
| West Pharmaceutical Services, Inc. | 84 | 26,345 | |
| 1,192,405 | |||
| Managed Health Care–1.07% | |||
| Centene Corp.(c) | 3,335 | 262,898 | |
| Shares | Value | ||
| Managed Health Care–(continued) | |||
| Elevance Health, Inc. | 1,116 | $621,489 | |
| Humana, Inc. | 140 | 49,626 | |
| UnitedHealth Group, Inc. | 2,449 | 1,445,400 | |
| 2,379,413 | |||
| Metal, Glass & Plastic Containers–0.01% | |||
| Ball Corp. | 360 | 22,972 | |
| Movies & Entertainment–0.69% | |||
| Liberty Media Corp.-Liberty Formula One(b)(c) | 855 | 66,733 | |
| Netflix, Inc.(c) | 1,117 | 783,408 | |
| Walt Disney Co. (The) | 6,413 | 579,607 | |
| Warner Bros. Discovery, Inc.(c) | 13,342 | 104,601 | |
| 1,534,349 | |||
| Multi-Family Residential REITs–0.11% | |||
| AvalonBay Communities, Inc. | 443 | 99,999 | |
| Equity Residential | 1,806 | 135,233 | |
| 235,232 | |||
| Multi-line Insurance–0.15% | |||
| American International Group, Inc. | 4,291 | 330,622 | |
| Multi-Sector Holdings–1.76% | |||
| Berkshire Hathaway, Inc., Class B(c) | 8,225 | 3,914,442 | |
| Multi-Utilities–0.63% | |||
| Ameren Corp. | 1,434 | 118,319 | |
| CMS Energy Corp. | 1,634 | 110,883 | |
| Consolidated Edison, Inc. | 1,853 | 188,191 | |
| Dominion Energy, Inc. | 2,051 | 114,651 | |
| DTE Energy Co. | 931 | 116,394 | |
| Public Service Enterprise Group, Inc. | 3,642 | 294,091 | |
| Sempra | 2,790 | 229,282 | |
| WEC Energy Group, Inc.(b) | 2,461 | 228,947 | |
| 1,400,758 | |||
| Oil & Gas Equipment & Services–0.09% | |||
| Baker Hughes Co., Class A | 1,159 | 40,762 | |
| Halliburton Co. | 2,745 | 85,342 | |
| Schlumberger N.V. | 1,660 | 73,023 | |
| 199,127 | |||
| Oil & Gas Exploration & Production–0.47% | |||
| ConocoPhillips | 3,212 | 365,494 | |
| Coterra Energy, Inc. | 852 | 20,729 | |
| Devon Energy Corp. | 2,990 | 133,892 | |
| Diamondback Energy, Inc. | 885 | 172,672 | |
| EOG Resources, Inc. | 2,113 | 272,197 | |
| Hess Corp. | 656 | 90,567 | |
| 1,055,551 | |||
| Oil & Gas Refining & Marketing–0.40% | |||
| Marathon Petroleum Corp. | 2,655 | 470,254 | |
| Phillips 66 | 1,087 | 152,517 | |
| Valero Energy Corp. | 1,763 | 258,685 | |
| 881,456 | |||
| Oil & Gas Storage & Transportation–0.33% | |||
| Cheniere Energy, Inc. | 1,211 | 224,350 | |
| Kinder Morgan, Inc. | 10,726 | 231,360 | |
| 5 | Invesco Income Advantage U.S. Fund |
| Shares | Value | ||
| Oil & Gas Storage & Transportation–(continued) | |||
| ONEOK, Inc. | 1,245 | $114,988 | |
| Williams Cos., Inc. (The) | 3,726 | 170,539 | |
| 741,237 | |||
| Other Specialized REITs–0.13% | |||
| VICI Properties, Inc.(b) | 8,368 | 280,161 | |
| Other Specialty Retail–0.03% | |||
| Ulta Beauty, Inc.(c) | 214 | 75,508 | |
| Packaged Foods & Meats–0.60% | |||
| General Mills, Inc.(b) | 3,865 | 279,401 | |
| Hershey Co. (The)(b) | 744 | 143,637 | |
| Hormel Foods Corp. | 1,730 | 56,311 | |
| Kellanova | 1,252 | 100,924 | |
| Kraft Heinz Co. (The) | 9,363 | 331,731 | |
| McCormick & Co., Inc. | 293 | 23,449 | |
| Mondelez International, Inc., Class A | 4,830 | 346,842 | |
| Tyson Foods, Inc., Class A | 781 | 50,226 | |
| 1,332,521 | |||
| Passenger Airlines–0.02% | |||
| Delta Air Lines, Inc. | 855 | 36,329 | |
| Passenger Ground Transportation–0.20% | |||
| Uber Technologies, Inc.(c) | 6,124 | 447,848 | |
| Personal Care Products–0.07% | |||
| Estee Lauder Cos., Inc. (The), Class A | 530 | 48,580 | |
| Kenvue, Inc. | 4,455 | 97,787 | |
| 146,367 | |||
| Pharmaceuticals–4.16% | |||
| Bristol-Myers Squibb Co. | 12,869 | 642,807 | |
| Eli Lilly and Co. | 2,927 | 2,809,978 | |
| Johnson & Johnson | 19,408 | 3,219,011 | |
| Merck & Co., Inc. | 18,589 | 2,201,867 | |
| Pfizer, Inc. | 10,053 | 291,637 | |
| Zoetis, Inc. | 532 | 97,617 | |
| 9,262,917 | |||
| Property & Casualty Insurance–1.40% | |||
| Allstate Corp. (The) | 1,623 | 306,650 | |
| Arch Capital Group Ltd.(c) | 2,673 | 302,290 | |
| Chubb Ltd. | 2,657 | 755,066 | |
| Hartford Financial Services Group, Inc. (The) | 2,425 | 281,543 | |
| Markel Group, Inc.(c) | 80 | 128,054 | |
| Progressive Corp. (The) | 4,006 | 1,010,313 | |
| Travelers Cos., Inc. (The) | 1,487 | 339,140 | |
| 3,123,056 | |||
| Rail Transportation–0.45% | |||
| CSX Corp. | 9,882 | 338,656 | |
| Norfolk Southern Corp. | 705 | 180,593 | |
| Union Pacific Corp. | 1,901 | 486,827 | |
| 1,006,076 | |||
| Real Estate Services–0.07% | |||
| CBRE Group, Inc., Class A(c) | 1,057 | 121,703 | |
| CoStar Group, Inc.(c) | 470 | 36,331 | |
| 158,034 | |||
| Shares | Value | ||
| Regional Banks–0.16% | |||
| M&T Bank Corp. | 875 | $150,596 | |
| Regions Financial Corp. | 3,432 | 80,377 | |
| Truist Financial Corp. | 3,012 | 133,914 | |
| 364,887 | |||
| Research & Consulting Services–0.14% | |||
| Equifax, Inc. | 243 | 74,632 | |
| Verisk Analytics, Inc. | 830 | 226,441 | |
| 301,073 | |||
| Restaurants–0.80% | |||
| Chipotle Mexican Grill, Inc.(c) | 4,801 | 269,240 | |
| DoorDash, Inc., Class A(c) | 995 | 128,067 | |
| McDonald’s Corp. | 3,135 | 904,949 | |
| Starbucks Corp. | 3,416 | 323,051 | |
| Yum! Brands, Inc. | 1,199 | 161,769 | |
| 1,787,076 | |||
| Retail REITs–0.20% | |||
| Realty Income Corp. | 4,195 | 260,552 | |
| Simon Property Group, Inc. | 1,067 | 178,562 | |
| 439,114 | |||
| Self-Storage REITs–0.16% | |||
| Extra Space Storage, Inc. | 512 | 90,624 | |
| Public Storage | 777 | 267,070 | |
| 357,694 | |||
| Semiconductor Materials & Equipment–0.73% | |||
| Applied Materials, Inc. | 4,222 | 832,832 | |
| KLA Corp. | 489 | 400,701 | |
| Lam Research Corp. | 462 | 379,307 | |
| 1,612,840 | |||
| Semiconductors–5.84% | |||
| Advanced Micro Devices, Inc.(c) | 4,042 | 600,479 | |
| Analog Devices, Inc. | 1,293 | 303,648 | |
| Broadcom, Inc. | 12,327 | 2,007,082 | |
| GLOBALFOUNDRIES, Inc.(b)(c) | 92 | 4,295 | |
| Intel Corp. | 4,952 | 109,142 | |
| Marvell Technology, Inc. | 1,475 | 112,454 | |
| Microchip Technology, Inc. | 2,056 | 168,921 | |
| Micron Technology, Inc. | 4,270 | 410,945 | |
| Monolithic Power Systems, Inc. | 93 | 86,925 | |
| NVIDIA Corp. | 58,940 | 7,035,668 | |
| ON Semiconductor Corp.(c) | 1,341 | 104,424 | |
| QUALCOMM, Inc. | 6,290 | 1,102,637 | |
| Texas Instruments, Inc. | 4,446 | 952,956 | |
| 12,999,576 | |||
| Soft Drinks & Non-alcoholic Beverages–0.89% | |||
| Coca-Cola Co. (The) | 13,160 | 953,705 | |
| Keurig Dr Pepper, Inc. | 2,464 | 90,207 | |
| Monster Beverage Corp.(c) | 1,368 | 64,474 | |
| PepsiCo, Inc. | 5,075 | 877,366 | |
| 1,985,752 | |||
| Specialty Chemicals–0.45% | |||
| DuPont de Nemours, Inc. | 3,499 | 294,791 | |
| Ecolab, Inc. | 844 | 213,684 | |
| 6 | Invesco Income Advantage U.S. Fund |
| Shares | Value | ||
| Specialty Chemicals–(continued) | |||
| International Flavors & Fragrances, Inc. | 587 | $61,042 | |
| PPG Industries, Inc. | 884 | 114,681 | |
| Sherwin-Williams Co. (The) | 847 | 312,856 | |
| 997,054 | |||
| Steel–0.19% | |||
| Nucor Corp. | 2,775 | 421,550 | |
| Systems Software–4.89% | |||
| CrowdStrike Holdings, Inc., Class A(c) | 1,532 | 424,793 | |
| Fortinet, Inc.(c) | 1,559 | 119,591 | |
| Microsoft Corp. | 22,691 | 9,465,324 | |
| Oracle Corp. | 1,859 | 262,658 | |
| Palo Alto Networks, Inc.(c) | 681 | 247,012 | |
| ServiceNow, Inc.(c) | 431 | 368,505 | |
| 10,887,883 | |||
| Technology Distributors–0.09% | |||
| CDW Corp. | 877 | 197,886 | |
| Technology Hardware, Storage & Peripherals–3.25% | |||
| Apple, Inc. | 27,751 | 6,354,979 | |
| Dell Technologies, Inc., Class C | 2,177 | 251,530 | |
| Hewlett Packard Enterprise Co. | 12,462 | 241,389 | |
| HP, Inc. | 3,616 | 130,827 | |
| NetApp, Inc. | 1,069 | 129,050 | |
| Super Micro Computer, Inc.(c) | 293 | 128,246 | |
| 7,236,021 | |||
| Telecom Tower REITs–0.19% | |||
| American Tower Corp. | 1,006 | 225,404 | |
| Crown Castle, Inc. | 1,027 | 115,044 | |
| SBA Communications Corp., Class A | 410 | 92,931 | |
| 433,379 | |||
| Timber REITs–0.04% | |||
| Weyerhaeuser Co. | 2,804 | 85,494 | |
| Tobacco–0.41% | |||
| Altria Group, Inc. | 10,343 | 556,143 | |
| Philip Morris International, Inc. | 2,926 | 360,747 | |
| 916,890 | |||
| Trading Companies & Distributors–0.32% | |||
| Fastenal Co. | 2,962 | 202,245 | |
| United Rentals, Inc. | 417 | 309,106 | |
| W.W. Grainger, Inc. | 201 | 197,969 | |
| 709,320 | |||
| Transaction & Payment Processing Services–3.37% | |||
| Block, Inc., Class A(c) | 1,258 | 83,129 | |
| Corpay, Inc.(c) | 451 | 142,313 | |
| Fidelity National Information Services, Inc. | 3,516 | 289,894 | |
| Fiserv, Inc.(c) | 3,331 | 581,593 | |
| Global Payments, Inc. | 1,275 | 141,538 | |
| Mastercard, Inc., Class A | 5,510 | 2,663,203 | |
| PayPal Holdings, Inc.(c) | 6,081 | 440,447 | |
| Visa, Inc., Class A | 11,412 | 3,153,934 | |
| 7,496,051 | |||
| Shares | Value | ||
| Water Utilities–0.03% | |||
| American Water Works Co., Inc. | 470 | $67,266 | |
| Wireless Telecommunication Services–0.46% | |||
| T-Mobile US, Inc. | 5,168 | 1,026,985 | |
| Total Common Stocks & Other Equity Interests (Cost $129,910,662) | 172,505,987 | ||
| Principal Amount | |||
| Equity Linked Notes–4.74% | |||
| Diversified Banks–3.63% | |||
| Bank of Montreal (S&P 500® Index) (Canada), 140.00%, 10/02/2024(d) | $714,000 | 714,000 | |
| Barclays Bank PLC (S&P 500® Index) (United Kingdom), 110.00%, 09/09/2024(d) | 1,059,000 | 787,848 | |
| Canadian Imperial Bank of Commerce (S&P 500® Index) (Canada), | |||
| 138.00%, 09/06/2024(d) | 1,229,000 | 946,024 | |
| 116.00%, 09/11/2024(d) | 1,389,000 | 1,256,358 | |
| Citigroup Global Markets Holdings, Inc. (S&P 500® Index), 129.46%, 09/18/2024(d) | 627,000 | 613,150 | |
| Citigroup, Inc. (S&P 500® Index), | |||
| 149.24%, 09/25/2024(d) | 579,000 | 580,763 | |
| 137.99%, 09/30/2024(d) | 809,000 | 785,779 | |
| HSBC Holdings PLC (S&P 500® Index) (United Kingdom), 125.54%, 09/03/2024(d) | 761,000 | 767,991 | |
| Societe Generale S.A (S&P 500® Index) (France), 175.90%, 09/05/2024(d) | 759,000 | 663,686 | |
| Toronto-Dominion Bank (The) (S&P 500® Index) (Canada), 121.90%, 09/16/2024(d) | 1,012,000 | 952,160 | |
| 8,067,759 | |||
| Diversified Capital Markets–1.11% | |||
| UBS AG (S&P 500® Index) (Switzerland), 122.80%, 09/12/2024(d) | 714,000 | 619,294 | |
| UBS Group AG (S&P 500® Index) (Switzerland), | |||
| 130.00%, 09/19/2024(d) | 628,000 | 619,775 | |
| 138.75%, 09/23/2024(d) | 682,000 | 681,975 | |
| 155.50%, 09/26/2024(d) | 567,000 | 561,035 | |
| 2,482,079 | |||
| Total Equity Linked Notes (Cost $11,529,000) | 10,549,838 | ||
| Shares | |||
| Money Market Funds–18.42% | |||
| Invesco Government & Agency Portfolio, Institutional Class, 5.18%(e)(f) | 14,402,682 | 14,402,682 | |
| Invesco Treasury Portfolio, Institutional Class, 5.15%(e)(f) | 26,574,675 | 26,574,675 | |
| Total Money Market Funds (Cost $40,977,357) | 40,977,357 | ||
| TOTAL INVESTMENTS IN SECURITIES (excluding investments purchased with cash collateral from securities on loan)-100.71% (Cost $182,417,019) | 224,033,182 | ||
| 7 | Invesco Income Advantage U.S. Fund |
| Shares | Value | ||
| Investments Purchased with Cash Collateral from Securities on Loan | |||
| Money Market Funds–0.91% | |||
| Invesco Private Government Fund, 5.28%(e)(f)(g) | 557,137 | $557,137 | |
| Invesco Private Prime Fund, 5.46%(e)(f)(g) | 1,450,804 | 1,451,384 | |
| Total Investments Purchased with Cash Collateral from Securities on Loan (Cost $2,008,452) | 2,008,521 | ||
| TOTAL INVESTMENTS IN SECURITIES–101.62% (Cost $184,425,471) | 226,041,703 | ||
| OTHER ASSETS LESS LIABILITIES—(1.62)% | (3,593,558) | ||
| NET ASSETS–100.00% | $222,448,145 | ||
| ADR | – American Depositary Receipt |
| REIT | – Real Estate Investment Trust |
| (a) | Industry and/or sector classifications used in this report are generally according to the Global Industry Classification Standard, which was developed by and is the exclusive property and a service mark of MSCI Inc. and Standard & Poor’s. |
| (b) | All or a portion of this security was out on loan at August 31, 2024. |
| (c) | Non-income producing security. |
| (d) | Security purchased or received in a transaction exempt from registration under the Securities Act of 1933, as amended (the “1933 Act”). The security may be resold pursuant to an exemption from registration under the 1933 Act, typically to qualified institutional buyers. The aggregate value of these securities at August 31, 2024 was $10,549,838, which represented 4.74% of the Fund’s Net Assets. |
| (e) | Affiliated holding. Affiliated holdings are investments in entities which are under common ownership or control of Invesco Ltd. or are investments in entities in which the Fund owns 5% or more of the outstanding voting securities. The table below shows the Fund’s transactions in, and earnings from, its investments in affiliates for the fiscal year ended August 31, 2024. |
| Value August 31, 2023 | Purchases at Cost | Proceeds from Sales | Change in Unrealized Appreciation (Depreciation) | Realized Gain | Value August 31, 2024 | Dividend Income | |
| Investments in Affiliated Money Market Funds: | |||||||
| Invesco Government & Agency Portfolio, Institutional Class | $13,538,323 | $62,108,921 | $(61,244,562) | $- | $- | $14,402,682 | $725,050 |
| Invesco Liquid Assets Portfolio, Institutional Class | 9,495,073 | 42,226,514 | (51,723,580) | (1,607) | 3,600 | - | 462,359 |
| Invesco Treasury Portfolio, Institutional Class | 15,472,369 | 83,344,408 | (72,242,102) | - | - | 26,574,675 | 882,692 |
| Investments Purchased with Cash Collateral from Securities on Loan: | |||||||
| Invesco Private Government Fund | 683,311 | 29,563,507 | (29,689,681) | - | - | 557,137 | 49,537* |
| Invesco Private Prime Fund | 1,757,085 | 66,161,822 | (66,469,578) | 155 | 1,900 | 1,451,384 | 129,711* |
| Total | $40,946,161 | $283,405,172 | $(281,369,503) | $(1,452) | $5,500 | $42,985,878 | $2,249,349 |
| * | Represents the income earned on the investment of cash collateral, which is included in securities lending income on the Statement of Operations. Does not include rebates and fees paid to lending agent or premiums received from borrowers, if any. |
| (f) | The rate shown is the 7-day SEC standardized yield as of August 31, 2024. |
| (g) | The security has been segregated to satisfy the commitment to return the cash collateral received in securities lending transactions upon the borrower’s return of the securities loaned. See Note 1J. |
| 8 | Invesco Income Advantage U.S. Fund |
| Assets: | |
| Investments in unaffiliated securities, at value (Cost $141,439,662)* | $183,055,825 |
| Investments in affiliated money market funds, at value (Cost $42,985,809) | 42,985,878 |
| Receivable for: | |
| Fund shares sold | 13,935 |
| Dividends | 403,813 |
| Interest | 468,827 |
| Investment for trustee deferred compensation and retirement plans | 129,492 |
| Other assets | 54,819 |
| Total assets | 227,112,589 |
| Liabilities: | |
| Payable for: | |
| Investments purchased | 2,090,000 |
| Fund shares reacquired | 294,151 |
| Collateral upon return of securities loaned | 2,008,452 |
| Accrued fees to affiliates | 88,925 |
| Accrued trustees’ and officers’ fees and benefits | 2,471 |
| Accrued other operating expenses | 45,989 |
| Trustee deferred compensation and retirement plans | 134,456 |
| Total liabilities | 4,664,444 |
| Net assets applicable to shares outstanding | $222,448,145 |
| Net assets consist of: | |
| Shares of beneficial interest | $215,964,668 |
| Distributable earnings | 6,483,477 |
| $222,448,145 |
| Net Assets: | |
| Class A | $139,696,395 |
| Class C | $2,598,504 |
| Class R | $972,400 |
| Class Y | $9,774,819 |
| Investor Class | $34,157,500 |
| Class R5 | $105,820 |
| Class R6 | $35,142,707 |
| Shares outstanding, no par value, with an unlimited number of shares authorized: | |
| Class A | 12,737,607 |
| Class C | 241,331 |
| Class R | 89,123 |
| Class Y | 887,139 |
| Investor Class | 3,102,454 |
| Class R5 | 9,599 |
| Class R6 | 3,190,763 |
| Class A: | |
| Net asset value per share | $10.97 |
| Maximum offering price per share (Net asset value of $10.97 ÷ 94.50%) | $11.61 |
| Class C: | |
| Net asset value and offering price per share | $10.77 |
| Class R: | |
| Net asset value and offering price per share | $10.91 |
| Class Y: | |
| Net asset value and offering price per share | $11.02 |
| Investor Class: | |
| Net asset value and offering price per share | $11.01 |
| Class R5: | |
| Net asset value and offering price per share | $11.02 |
| Class R6: | |
| Net asset value and offering price per share | $11.01 |
| * | At August 31, 2024, securities with an aggregate value of $1,977,618 were on loan to brokers. |
| 9 | Invesco Income Advantage U.S. Fund |
| Investment income: | |
| Interest | $10,316,026 |
| Dividends (net of foreign withholding taxes of $207) | 2,375,747 |
| Dividends from affiliated money market funds (includes net securities lending income of $42,950) | 2,113,051 |
| Total investment income | 14,804,824 |
| Expenses: | |
| Advisory fees | 1,171,527 |
| Administrative services fees | 27,226 |
| Custodian fees | 27,573 |
| Distribution fees: | |
| Class A | 332,974 |
| Class C | 26,828 |
| Class R | 3,816 |
| Investor Class | 82,383 |
| Transfer agent fees — A, C, R, Y and Investor | 244,409 |
| Transfer agent fees — R5 | 1,266 |
| Transfer agent fees — R6 | 3,883 |
| Trustees’ and officers’ fees and benefits | 22,837 |
| Registration and filing fees | 93,291 |
| Reports to shareholders | 43,975 |
| Professional services fees | 58,231 |
| Other | 19,454 |
| Total expenses | 2,159,673 |
| Less: Fees waived, expenses reimbursed and/or expense offset arrangement(s) | (82,451) |
| Net expenses | 2,077,222 |
| Net investment income | 12,727,602 |
| Realized and unrealized gain (loss) from: | |
| Net realized gain (loss) from: | |
| Unaffiliated investment securities | (10,224,637) |
| Affiliated investment securities | 5,500 |
| Foreign currencies | (587) |
| Futures contracts | 243,458 |
| (9,976,266) | |
| Change in net unrealized appreciation (depreciation) of: | |
| Unaffiliated investment securities | 30,947,808 |
| Affiliated investment securities | (1,452) |
| Foreign currencies | 8 |
| 30,946,364 | |
| Net realized and unrealized gain | 20,970,098 |
| Net increase in net assets resulting from operations | $33,697,700 |
| 10 | Invesco Income Advantage U.S. Fund |
| 2024 | 2023 | |
| Operations: | ||
| Net investment income | $12,727,602 | $12,337,964 |
| Net realized gain (loss) | (9,976,266) | (7,979,585) |
| Change in net unrealized appreciation | 30,946,364 | 15,939,420 |
| Net increase in net assets resulting from operations | 33,697,700 | 20,297,799 |
| Distributions to shareholders from distributable earnings: | ||
| Class A | (8,904,189) | (8,487,191) |
| Class C | (159,667) | (163,948) |
| Class R | (48,612) | (35,395) |
| Class Y | (593,843) | (597,025) |
| Investor Class | (2,205,943) | (2,109,098) |
| Class R5 | (282,091) | (762,769) |
| Class R6 | (1,018,749) | (2,707) |
| Total distributions from distributable earnings | (13,213,094) | (12,158,133) |
| Share transactions–net: | ||
| Class A | (3,289,275) | (1,600,712) |
| Class C | (384,945) | (350,757) |
| Class R | 235,233 | 136,942 |
| Class Y | 18,650 | 176,230 |
| Investor Class | (2,414,760) | 1,591,244 |
| Class R5 | (11,667,460) | 649,033 |
| Class R6 | 33,331,690 | 17,741 |
| Net increase in net assets resulting from share transactions | 15,829,133 | 619,721 |
| Net increase in net assets | 36,313,739 | 8,759,387 |
| Net assets: | ||
| Beginning of year | 186,134,406 | 177,375,019 |
| End of year | $222,448,145 | $186,134,406 |
| 11 | Invesco Income Advantage U.S. Fund |
| Net asset value, beginning of period | Net investment income(a) | Net gains (losses) on securities (both realized and unrealized) | Total from investment operations | Dividends from net investment income | Distributions from net realized gains | Total distributions | Net asset value, end of period | Total return(b) | Net assets, end of period (000’s omitted) | Ratio of expenses to average net assets with fee waivers and/or expenses absorbed | Ratio of expenses to average net assets without fee waivers and/or expenses absorbed | Ratio of net investment income to average net assets | Portfolio turnover (c) | |
| Class A | ||||||||||||||
| Year ended 08/31/24 | $9.90 | $0.67 | $1.09 | $1.76 | $(0.69) | $— | $(0.69) | $10.97 | 18.49% | $139,696 | 1.09% | 1.14% | 6.49% | 54% |
| Year ended 08/31/23 | 9.46 | 0.65 | 0.44 | 1.09 | (0.65) | — | (0.65) | 9.90 | 12.08 | 129,132 | 1.04 | 1.14 | 6.93 | 46 |
| Year ended 08/31/22 | 12.29 | 0.59 | (1.64) | (1.05) | (0.59) | (1.19) | (1.78) | 9.46 | (9.88) | 125,096 | 1.05 | 1.14 | 5.52 | 44 |
| Year ended 08/31/21 | 10.24 | 0.13 | 2.07 | 2.20 | (0.15) | — | (0.15) | 12.29 | 21.70 | 150,436 | 1.16 | 1.17 | 1.15 | 143 |
| Year ended 08/31/20 | 10.43 | 0.17 | (0.20) | (0.03) | (0.16) | — | (0.16) | 10.24 | (0.15) | 136,770 | 1.18 | 1.18 | 1.63 | 122 |
| Class C | ||||||||||||||
| Year ended 08/31/24 | 9.72 | 0.58 | 1.07 | 1.65 | (0.60) | — | (0.60) | 10.77 | 17.61 | 2,599 | 1.84 | 1.89 | 5.74 | 54 |
| Year ended 08/31/23 | 9.29 | 0.57 | 0.43 | 1.00 | (0.57) | — | (0.57) | 9.72 | 11.22 | 2,704 | 1.79 | 1.89 | 6.18 | 46 |
| Year ended 08/31/22 | 12.07 | 0.51 | (1.61) | (1.10) | (0.49) | (1.19) | (1.68) | 9.29 | (10.51) | 2,942 | 1.80 | 1.89 | 4.77 | 44 |
| Year ended 08/31/21 | 10.06 | 0.04 | 2.04 | 2.08 | (0.07) | — | (0.07) | 12.07 | 20.74 | 3,748 | 1.91 | 1.92 | 0.40 | 143 |
| Year ended 08/31/20 | 10.24 | 0.09 | (0.19) | (0.10) | (0.08) | — | (0.08) | 10.06 | (0.87) | 4,001 | 1.93 | 1.93 | 0.88 | 122 |
| Class R | ||||||||||||||
| Year ended 08/31/24 | 9.85 | 0.64 | 1.08 | 1.72 | (0.66) | — | (0.66) | 10.91 | 18.15 | 972 | 1.34 | 1.39 | 6.24 | 54 |
| Year ended 08/31/23 | 9.41 | 0.63 | 0.43 | 1.06 | (0.62) | — | (0.62) | 9.85 | 11.83 | 656 | 1.29 | 1.39 | 6.68 | 46 |
| Year ended 08/31/22 | 12.23 | 0.57 | (1.64) | (1.07) | (0.56) | (1.19) | (1.75) | 9.41 | (10.13) | 492 | 1.30 | 1.39 | 5.27 | 44 |
| Year ended 08/31/21 | 10.19 | 0.10 | 2.06 | 2.16 | (0.12) | — | (0.12) | 12.23 | 21.39 | 691 | 1.41 | 1.42 | 0.90 | 143 |
| Year ended 08/31/20 | 10.38 | 0.14 | (0.19) | (0.05) | (0.14) | — | (0.14) | 10.19 | (0.42) | 565 | 1.43 | 1.43 | 1.38 | 122 |
| Class Y | ||||||||||||||
| Year ended 08/31/24 | 9.94 | 0.70 | 1.10 | 1.80 | (0.72) | — | (0.72) | 11.02 | 18.85 | 9,775 | 0.84 | 0.89 | 6.74 | 54 |
| Year ended 08/31/23 | 9.51 | 0.68 | 0.42 | 1.10 | (0.67) | — | (0.67) | 9.94 | 12.22 | 8,856 | 0.79 | 0.89 | 7.18 | 46 |
| Year ended 08/31/22 | 12.35 | 0.62 | (1.64) | (1.02) | (0.63) | (1.19) | (1.82) | 9.51 | (9.61) | 8,271 | 0.80 | 0.89 | 5.77 | 44 |
| Year ended 08/31/21 | 10.29 | 0.15 | 2.08 | 2.23 | (0.17) | — | (0.17) | 12.35 | 22.00 | 8,370 | 0.91 | 0.92 | 1.40 | 143 |
| Year ended 08/31/20 | 10.48 | 0.19 | (0.19) | 0.00 | (0.19) | — | (0.19) | 10.29 | 0.12 | 7,344 | 0.93 | 0.93 | 1.88 | 122 |
| Investor Class | ||||||||||||||
| Year ended 08/31/24 | 9.93 | 0.67 | 1.10 | 1.77 | (0.69) | — | (0.69) | 11.01 | 18.56 | 34,158 | 1.09 | 1.14 | 6.49 | 54 |
| Year ended 08/31/23 | 9.50 | 0.66 | 0.42 | 1.08 | (0.65) | — | (0.65) | 9.93 | 11.95 | 33,187 | 1.04 | 1.14 | 6.93 | 46 |
| Year ended 08/31/22 | 12.33 | 0.60 | (1.64) | (1.04) | (0.60) | (1.19) | (1.79) | 9.50 | (9.82) | 30,152 | 1.05 | 1.14 | 5.52 | 44 |
| Year ended 08/31/21 | 10.28 | 0.13 | 2.07 | 2.20 | (0.15) | — | (0.15) | 12.33 | 21.61 | 36,982 | 1.16 | 1.17 | 1.15 | 143 |
| Year ended 08/31/20 | 10.47 | 0.17 | (0.20) | (0.03) | (0.16) | — | (0.16) | 10.28 | (0.14) | 33,343 | 1.18 | 1.18 | 1.63 | 122 |
| Class R5 | ||||||||||||||
| Year ended 08/31/24 | 9.95 | 0.67 | 1.13 | 1.80 | (0.73) | — | (0.73) | 11.02 | 18.83 | 106 | 0.76 | 0.78 | 6.82 | 54 |
| Year ended 08/31/23 | 9.52 | 0.69 | 0.42 | 1.11 | (0.68) | — | (0.68) | 9.95 | 12.27 | 11,550 | 0.75 | 0.77 | 7.22 | 46 |
| Year ended 08/31/22 | 12.36 | 0.63 | (1.64) | (1.01) | (0.64) | (1.19) | (1.83) | 9.52 | (9.55) | 10,393 | 0.76 | 0.77 | 5.81 | 44 |
| Year ended 08/31/21 | 10.30 | 0.18 | 2.08 | 2.26 | (0.20) | — | (0.20) | 12.36 | 22.23 | 11,702 | 0.72 | 0.72 | 1.59 | 143 |
| Year ended 08/31/20 | 10.50 | 0.21 | (0.20) | 0.01 | (0.21) | — | (0.21) | 10.30 | 0.26 | 9,498 | 0.74 | 0.74 | 2.07 | 122 |
| Class R6 | ||||||||||||||
| Year ended 08/31/24 | 9.95 | 0.73 | 1.06 | 1.79 | (0.73) | — | (0.73) | 11.01 | 18.72 | 35,143 | 0.76 | 0.78 | 6.82 | 54 |
| Year ended 08/31/23 | 9.51 | 0.69 | 0.43 | 1.12 | (0.68) | — | (0.68) | 9.95 | 12.39 | 49 | 0.75 | 0.77 | 7.22 | 46 |
| Year ended 08/31/22 | 12.36 | 0.63 | (1.65) | (1.02) | (0.64) | (1.19) | (1.83) | 9.51 | (9.64) | 29 | 0.75 | 0.77 | 5.82 | 44 |
| Year ended 08/31/21 | 10.30 | 0.17 | 2.09 | 2.26 | (0.20) | — | (0.20) | 12.36 | 22.23 | 37 | 0.72 | 0.72 | 1.59 | 143 |
| Year ended 08/31/20 | 10.49 | 0.21 | (0.19) | 0.02 | (0.21) | — | (0.21) | 10.30 | 0.35 | 107 | 0.73 | 0.73 | 2.08 | 122 |
| (a) | Calculated using average shares outstanding. |
| (b) | Includes adjustments in accordance with accounting principles generally accepted in the United States of America and as such, the net asset value for financial reporting purposes and the returns based upon those net asset values may differ from the net asset value and returns for shareholder transactions. Does not include sales charges and is not annualized for periods less than one year, if applicable. |
| (c) | Portfolio turnover is calculated at the fund level and is not annualized for periods less than one year, if applicable. |
| 12 | Invesco Income Advantage U.S. Fund |
| A. | Security Valuations — Securities, including restricted securities, are valued according to the following policy. |
| 13 | Invesco Income Advantage U.S. Fund |
| B. | Securities Transactions and Investment Income – Securities transactions are accounted for on a trade date basis. Realized gains or losses on sales are computed on the basis of specific identification of the securities sold. Interest income (net of withholding tax, if any) is recorded on an accrual basis from settlement date and includes coupon interest and amortization of premium and accretion of discount on debt securities as applicable. Pay-in-kind interest income and non-cash dividend income received in the form of securities in lieu of cash are recorded at the fair value of the securities received. Dividend income (net of withholding tax, if any) is recorded on the ex-dividend date. |
| C. | Country Determination — For the purposes of making investment selection decisions and presentation in the Schedule of Investments, the investment adviser may determine the country in which an issuer is located and/or credit risk exposure based on various factors. These factors include the laws of the country under which the issuer is organized, where the issuer maintains a principal office, the country in which the issuer derives 50% or more of its total revenues, the country that has the primary market for the issuer’s securities and its "country of risk" as determined by a third party service provider, as well as other criteria. Among the other criteria that may be evaluated for making this determination are the country in which the issuer maintains 50% or more of its assets, the type of security, financial guarantees and enhancements, the nature of the collateral and the sponsor organization. Country of issuer and/or credit risk exposure has been determined to be the United States of America, unless otherwise noted. |
| D. | Distributions – Distributions from net investment income, if any, are declared and paid monthly. Distributions from net realized capital gain, if any, are generally declared and paid annually and recorded on the ex-dividend date. The Fund may elect to treat a portion of the proceeds from redemptions as distributions for federal income tax purposes. |
| E. | Federal Income Taxes – The Fund intends to comply with the requirements of Subchapter M of the Internal Revenue Code of 1986, as amended (the “Internal Revenue Code”), necessary to qualify as a regulated investment company and to distribute substantially all of the Fund’s taxable earnings to shareholders. As such, the Fund will not be subject to federal income taxes on otherwise taxable income (including net realized capital gain) that is distributed to shareholders. Therefore, no provision for federal income taxes is recorded in the financial statements. |
| F. | Expenses – Fees provided for under the Rule 12b-1 plan of a particular class of the Fund are charged to the operations of such class. Transfer agency fees and expenses and other shareholder recordkeeping fees and expenses attributable to Class R5 and Class R6 are allocated based on relative net assets of Class R5 and Class R6. Sub-accounting fees attributable to Class R5 are charged to the operations of the class. Transfer agency fees and expenses and other shareholder recordkeeping fees and expenses relating to all other classes are allocated among those classes based on relative net assets. All other expenses are allocated among the classes based on relative net assets. |
| G. | Accounting Estimates – The preparation of financial statements in conformity with accounting principles generally accepted in the United States of America (“GAAP”) requires management to make estimates and assumptions that affect the reported amounts of assets and liabilities at the date of the financial statements and the reported amounts of revenues and expenses during the reporting period including estimates and assumptions related to taxation. Actual results could differ from those estimates by a significant amount. In addition, the Fund monitors for material events or transactions that may occur or become known after the period-end date and before the date the financial statements are released to print. |
| H. | Indemnifications – Under the Trust’s organizational documents, each Trustee, officer, employee or other agent of the Trust is indemnified against certain liabilities that may arise out of the performance of their duties to the Fund. Additionally, in the normal course of business, the Fund enters into contracts, including the Fund’s servicing agreements, that contain a variety of indemnification clauses. The Fund’s maximum exposure under these arrangements is unknown as this would involve future claims that may be made against the Fund that have not yet occurred. The risk of material loss as a result of such indemnification claims is considered remote. |
| I. | Equity-Linked Notes – The Fund may invest in Equity-Linked Notes (ELNs). ELNs are hybrid derivative-type instruments, in a single note form, that are specially designed to combine the characteristics of one or more reference securities (such as a single stock, an exchange traded fund, exchange-traded note, or an index or basket of securities (underlying securities)) and a related equity derivative(s), such as put or call options, or a combination thereof. Generally, when purchasing an ELN, the Fund pays the counterparty the current value of the underlying securities plus a commission. Upon the maturity of the note, the Fund generally receives the par value of the note plus a return based on the appreciation of the underlying securities. If the underlying securities have depreciated in value or if their price fluctuates outside of a preset range, depending on the type of ELN, the Fund may receive only the principal amount of the note, or may lose the entire principal invested in the ELN. ELNs in which the Fund invests have the following features: stated rate of interest expressed as a coupon and limitations on participation in the appreciation (depreciation) of the underlying securities. Investments in ELNs possess the risks associated with the underlying securities, such as management risk, market risk and, as applicable, foreign securities and currency risks. In addition, as a note, ELNs are also subject to certain debt securities risks, such as interest rate and credit risk. An investment in an ELN also bears the risk that the ELN issuer will default or become bankrupt. In such an event, the Fund may have difficulty being repaid, or fail to be repaid, the principal amount of, or income from, its investment. As the holder of an ELN, the Fund generally has no rights to the underlying securities, including no voting rights or rights to receive dividends. Should the prices of the underlying securities move in an unexpected manner, the Fund may not achieve the anticipated benefits of its ELN investments, and it may realize losses, which could be significant and could include the Fund’s entire principal investment. |
| J. | Securities Lending – The Fund may lend portfolio securities having a market value up to one-third of the Fund’s total assets. Such loans are secured by collateral equal to no less than the market value of the loaned securities determined daily by the securities lending provider. Such collateral will be cash or debt |
| 14 | Invesco Income Advantage U.S. Fund |
| securities issued or guaranteed by the U.S. Government or any of its sponsored agencies. Cash collateral received in connection with these loans is invested in short-term money market instruments or affiliated, unregistered investment companies that comply with Rule 2a-7 under the 1940 Act and money market funds (collectively, "affiliated money market funds") and is shown as such on the Schedule of Investments. The Fund bears the risk of loss with respect to the investment of collateral. It is the Fund’s policy to obtain additional collateral from or return excess collateral to the borrower by the end of the next business day, following the valuation date of the securities loaned. Therefore, the value of the collateral held may be temporarily less than the value of the securities on loan. When loaning securities, the Fund retains certain benefits of owning the securities, including the economic equivalent of dividends or interest generated by the security. Lending securities entails a risk of loss to the Fund if, and to the extent that, the market value of the securities loaned were to increase and the borrower did not increase the collateral accordingly, and the borrower failed to return the securities. The securities loaned are subject to termination at the option of the borrower or the Fund. Upon termination, the borrower will return to the Fund the securities loaned and the Fund will return the collateral. Upon the failure of the borrower to return the securities, collateral may be liquidated and the securities may be purchased on the open market to replace the loaned securities. The Fund could experience delays and costs in gaining access to the collateral and the securities may lose value during the delay which could result in potential losses to the Fund. Some of these losses may be indemnified by the lending agent. The Fund bears the risk of any deficiency in the amount of the collateral available for return to the borrower due to any loss on the collateral invested. Dividends received on cash collateral investments for securities lending transactions, which are net of compensation to counterparties, are included in Dividends from affiliated money market funds on the Statement of Operations. The aggregate value of securities out on loan, if any, is shown as a footnote on the Statement of Assets and Liabilities. |
| K. | Futures Contracts — The Fund may enter into futures contracts to manage exposure to interest rate, equity and market price movements and/or currency risks. A futures contract is an agreement between two parties ("Counterparties") to purchase or sell a specified underlying security, currency or commodity (or delivery of a cash settlement price, in the case of an index future) for a fixed price at a future date. The Fund currently invests only in exchange-traded futures and they are standardized as to maturity date and underlying instrument or asset. Initial margin deposits required upon entering into futures contracts are satisfied by the segregation of specific securities or cash as collateral at the futures commission merchant (broker). During the period the futures contracts are open, changes in the value of the contracts are recognized as unrealized gains or losses by recalculating the value of the contracts on a daily basis. Subsequent or variation margin payments are received or made depending upon whether unrealized gains or losses are incurred. These amounts are reflected as receivables or payables on the Statement of Assets and Liabilities. When the contracts are closed or expire, the Fund recognizes a realized gain or loss equal to the difference between the proceeds from, or cost of, the closing transaction and the Fund’s basis in the contract. The net realized gain (loss) and the change in unrealized gain (loss) on futures contracts held during the period is included on the Statement of Operations. The primary risks associated with futures contracts are market risk and the absence of a liquid secondary market. If the Fund were unable to liquidate a futures contract and/or enter into an offsetting closing transaction, the Fund would continue to be subject to market risk with respect to the value of the contracts and continue to be required to maintain the margin deposits on the futures contracts. Futures contracts have minimal Counterparty risk since the exchange’s clearinghouse, as Counterparty to all exchange-traded futures, guarantees the futures against default. Risks may exceed amounts recognized in the Statement of Assets and Liabilities. |
| L. | Leverage Risk — Leverage exists when the Fund can lose more than it originally invests because it purchases or sells an instrument or enters into a transaction without investing an amount equal to the full economic exposure of the instrument or transaction. |
| M. | Other Risks - Active trading of portfolio securities may result in added expenses, a lower return and increased tax liability. |
| Average Daily Net Assets | Rate |
| First $250 million | 0.600% |
| Next $250 million | 0.575% |
| Next $500 million | 0.550% |
| Next $1.5 billion | 0.525% |
| Next $2.5 billion | 0.500% |
| Next $2.5 billion | 0.475% |
| Next $2.5 billion | 0.450% |
| Over $10 billion | 0.425% |
| 15 | Invesco Income Advantage U.S. Fund |
| Level 1 | Level 2 | Level 3 | Total | |
| Investments in Securities | ||||
| Common Stocks & Other Equity Interests | $172,505,987 | $— | $— | $172,505,987 |
| Equity Linked Notes | — | 10,549,838 | — | 10,549,838 |
| Money Market Funds | 40,977,357 | 2,008,521 | — | 42,985,878 |
| Total Investments | $213,483,344 | $12,558,359 | $— | $226,041,703 |
| 16 | Invesco Income Advantage U.S. Fund |
| Location of Gain on Statement of Operations | |
| Equity Risk | |
| Realized Gain: | |
| Futures contracts | $243,458 |
| Futures Contracts | |
| Average notional value | $6,958,650 |
| Tax Character of Distributions to Shareholders Paid During the Fiscal Years Ended August 31, 2024 and 2023: | ||
| 2024 | 2023 | |
| Ordinary income* | $13,213,094 | $12,158,133 |
| * | Includes short-term capital gain distributions, if any. |
| Tax Components of Net Assets at Period-End: | |
| 2024 | |
| Undistributed ordinary income | $410,119 |
| Net unrealized appreciation — investments | 39,731,756 |
| Temporary book/tax differences | (79,964) |
| Capital loss carryforward | (33,578,434) |
| Shares of beneficial interest | 215,964,668 |
| Total net assets | $222,448,145 |
| Capital Loss Carryforward* | |||
| Expiration | Short-Term | Long-Term | Total |
| Not subject to expiration | $30,660,014 | $2,918,420 | $33,578,434 |
| * | Capital loss carryforward is reduced for limitations, if any, to the extent required by the Internal Revenue Code and may be further limited depending upon a variety of factors, including the realization of net unrealized gains or losses as of the date of any reorganization. |
| 17 | Invesco Income Advantage U.S. Fund |
| Unrealized Appreciation (Depreciation) of Investments on a Tax Basis | |
| Aggregate unrealized appreciation of investments | $42,298,551 |
| Aggregate unrealized (depreciation) of investments | (2,566,795) |
| Net unrealized appreciation of investments | $39,731,756 |
| Summary of Share Activity | |||||
| Year ended August 31, 2024(a) | Year ended August 31, 2023 | ||||
| Shares | Amount | Shares | Amount | ||
| Sold: | |||||
| Class A | 491,082 | $5,031,635 | 416,231 | $3,968,443 | |
| Class C | 25,839 | 257,215 | 62,905 | 588,275 | |
| Class R | 39,431 | 415,414 | 18,148 | 174,210 | |
| Class Y | 617,981 | 6,586,043 | 151,473 | 1,424,849 | |
| Investor Class | 62,801 | 672,496 | 337,047 | 3,209,757 | |
| Class R5 | 7,243 | 72,940 | 48 | 471 | |
| Class R6 | 3,319,155 | 34,786,077 | 1,684 | 15,688 | |
| Issued as reinvestment of dividends: | |||||
| Class A | 784,302 | 8,048,665 | 814,482 | 7,657,487 | |
| Class C | 15,204 | 152,958 | 16,585 | 152,956 | |
| Class R | 4,748 | 48,593 | 3,717 | 34,825 | |
| Class Y | 47,342 | 487,874 | 51,321 | 484,830 | |
| Investor Class | 206,920 | 2,129,596 | 214,758 | 2,028,154 | |
| Class R5 | 28,486 | 277,256 | 80,145 | 758,155 | |
| Class R6 | 94,930 | 1,018,060 | 217 | 2,065 | |
| Automatic conversion of Class C shares to Class A shares: | |||||
| Class A | 32,080 | 332,690 | 25,301 | 237,587 | |
| Class C | (32,673) | (332,690) | (25,763) | (237,587) | |
| Reacquired: | |||||
| Class A | (1,619,333) | (16,702,265) | (1,427,536) | (13,464,229) | |
| Class C | (45,351) | (462,428) | (92,055) | (854,401) | |
| Class R | (21,647) | (228,774) | (7,558) | (72,093) | |
| Class Y | (669,092) | (7,055,267) | (181,981) | (1,733,449) | |
| Investor Class | (507,957) | (5,216,852) | (385,314) | (3,646,667) | |
| Class R5 | (1,186,804) | (12,017,656) | (11,670) | (109,593) | |
| Class R6 | (228,270) | (2,472,447) | (1) | (12) | |
| Net increase in share activity | 1,466,417 | $15,829,133 | 62,184 | $619,721 | |
| (a) | 16% of the outstanding shares of the Fund are owned by the Adviser. |
| 18 | Invesco Income Advantage U.S. Fund |
| 19 | Invesco Income Advantage U.S. Fund |
| 20 | Invesco Income Advantage U.S. Fund |
| C. | Advisory and Sub-Advisory Fees and Fund Expenses |
| D. | Economies of Scale and Breakpoints |
| E. | Profitability and Financial Resources |
| F. | Collateral Benefits to Invesco Advisers and its Affiliates |
| 21 | Invesco Income Advantage U.S. Fund |
| Federal and State Income Tax | |
| Qualified Dividend Income* | 17.69% |
| Corporate Dividends Received Deduction* | 17.16% |
| U.S. Treasury Obligations* | 0.00% |
| Qualified Business Income* | 0.00% |
| Business Interest Income* | 6.61% |
| * | The above percentages are based on ordinary income dividends paid to shareholders during the Fund’s fiscal year. |
| 22 | Invesco Income Advantage U.S. Fund |
| 23 | Invesco Income Advantage U.S. Fund |

| Annual Financial Statements and Other Information | August 31, 2024 |
| Shares | Value | ||
| Common Stocks & Other Equity Interests–97.16% | |||
| Advertising–0.30% | |||
| Trade Desk, Inc. (The), Class A(b) | 2,870 | $300,001 | |
| Apparel Retail–0.33% | |||
| Ross Stores, Inc. | 2,161 | 325,468 | |
| Apparel, Accessories & Luxury Goods–0.21% | |||
| lululemon athletica, inc.(b) | 779 | 202,127 | |
| Application Software–5.55% | |||
| Adobe, Inc.(b) | 2,888 | 1,658,896 | |
| ANSYS, Inc.(b) | 563 | 180,959 | |
| Atlassian Corp., Class A(b) | 1,027 | 170,071 | |
| Autodesk, Inc.(b) | 1,389 | 358,918 | |
| Cadence Design Systems, Inc.(b) | 1,754 | 471,703 | |
| Datadog, Inc., Class A(b) | 1,988 | 231,125 | |
| Intuit, Inc. | 1,802 | 1,135,729 | |
| Roper Technologies, Inc. | 690 | 382,543 | |
| Synopsys, Inc.(b) | 988 | 513,345 | |
| Workday, Inc., Class A(b) | 1,367 | 359,781 | |
| 5,463,070 | |||
| Automobile Manufacturers–2.62% | |||
| Tesla, Inc.(b) | 12,048 | 2,579,597 | |
| Automotive Retail–0.44% | |||
| O’Reilly Automotive, Inc.(b) | 380 | 429,389 | |
| Biotechnology–3.89% | |||
| Amgen, Inc. | 3,458 | 1,154,384 | |
| Biogen, Inc.(b) | 939 | 192,270 | |
| Gilead Sciences, Inc. | 8,031 | 634,449 | |
| Moderna, Inc.(b)(c) | 2,470 | 191,178 | |
| Regeneron Pharmaceuticals, Inc.(b) | 699 | 828,098 | |
| Vertex Pharmaceuticals, Inc.(b) | 1,663 | 824,665 | |
| 3,825,044 | |||
| Broadline Retail–5.82% | |||
| Amazon.com, Inc.(b) | 25,973 | 4,636,180 | |
| MercadoLibre, Inc. (Brazil)(b) | 327 | 674,163 | |
| PDD Holdings, Inc., ADR (China)(b) | 4,306 | 413,850 | |
| 5,724,193 | |||
| Cable & Satellite–1.34% | |||
| Charter Communications, Inc., Class A(b)(c) | 928 | 322,518 | |
| Comcast Corp., Class A | 25,232 | 998,430 | |
| 1,320,948 | |||
| Cargo Ground Transportation–0.27% | |||
| Old Dominion Freight Line, Inc. | 1,401 | 270,113 | |
| Communications Equipment–1.33% | |||
| Cisco Systems, Inc. | 25,971 | 1,312,574 | |
| Construction Machinery & Heavy Transportation Equipment– 0.33% | |||
| PACCAR, Inc. | 3,379 | 324,992 | |
| Shares | Value | ||
| Consumer Staples Merchandise Retail–2.71% | |||
| Costco Wholesale Corp. | 2,859 | $2,551,314 | |
| Dollar Tree, Inc.(b) | 1,406 | 118,793 | |
| 2,670,107 | |||
| Diversified Support Services–0.87% | |||
| Cintas Corp. | 654 | 526,548 | |
| Copart, Inc.(b) | 6,203 | 328,511 | |
| 855,059 | |||
| Electric Utilities–1.22% | |||
| American Electric Power Co., Inc. | 3,398 | 340,752 | |
| Constellation Energy Corp. | 2,032 | 399,694 | |
| Exelon Corp. | 6,446 | 245,528 | |
| Xcel Energy, Inc. | 3,582 | 219,326 | |
| 1,205,300 | |||
| Health Care Equipment–1.84% | |||
| DexCom, Inc.(b) | 2,564 | 177,788 | |
| GE HealthCare Technologies, Inc. | 2,942 | 249,540 | |
| IDEXX Laboratories, Inc.(b) | 532 | 256,068 | |
| Intuitive Surgical, Inc.(b) | 2,287 | 1,126,645 | |
| 1,810,041 | |||
| Hotels, Resorts & Cruise Lines–1.65% | |||
| Airbnb, Inc., Class A(b) | 2,846 | 333,864 | |
| Booking Holdings, Inc. | 219 | 856,122 | |
| Marriott International, Inc., Class A | 1,841 | 432,064 | |
| 1,622,050 | |||
| Human Resource & Employment Services–1.05% | |||
| Automatic Data Processing, Inc. | 2,638 | 727,851 | |
| Paychex, Inc. | 2,320 | 304,384 | |
| 1,032,235 | |||
| Industrial Conglomerates–0.89% | |||
| Honeywell International, Inc. | 4,198 | 872,806 | |
| Industrial Gases–1.51% | |||
| Linde PLC | 3,099 | 1,482,097 | |
| Interactive Home Entertainment–0.45% | |||
| Electronic Arts, Inc.(c) | 1,717 | 260,675 | |
| Take-Two Interactive Software, Inc.(b) | 1,105 | 178,689 | |
| 439,364 | |||
| Interactive Media & Services–9.39% | |||
| Alphabet, Inc., Class A | 14,660 | 2,395,151 | |
| Alphabet, Inc., Class C | 14,019 | 2,314,677 | |
| Meta Platforms, Inc., Class A | 8,701 | 4,535,918 | |
| 9,245,746 | |||
| Internet Services & Infrastructure–0.14% | |||
| MongoDB, Inc.(b) | 473 | 137,544 | |
| IT Consulting & Other Services–0.25% | |||
| Cognizant Technology Solutions Corp., Class A | 3,205 | 249,253 | |
| Life Sciences Tools & Services–0.14% | |||
| Illumina, Inc.(b) | 1,027 | 134,948 | |
| 2 | Invesco NASDAQ 100 Index Fund |
| Shares | Value | ||
| Movies & Entertainment–2.11% | |||
| Netflix, Inc.(b) | 2,778 | $1,948,350 | |
| Warner Bros. Discovery, Inc.(b) | 15,795 | 123,833 | |
| 2,072,183 | |||
| Oil & Gas Equipment & Services–0.23% | |||
| Baker Hughes Co., Class A | 6,433 | 226,249 | |
| Oil & Gas Exploration & Production–0.23% | |||
| Diamondback Energy, Inc. | 1,150 | 224,377 | |
| Packaged Foods & Meats–0.91% | |||
| Kraft Heinz Co. (The) | 7,828 | 277,346 | |
| Mondelez International, Inc., Class A | 8,647 | 620,941 | |
| 898,287 | |||
| Pharmaceuticals–0.33% | |||
| AstraZeneca PLC, ADR (United Kingdom) | 3,754 | 328,925 | |
| Rail Transportation–0.44% | |||
| CSX Corp. | 12,602 | 431,871 | |
| Real Estate Services–0.21% | |||
| CoStar Group, Inc.(b) | 2,633 | 203,531 | |
| Research & Consulting Services–0.25% | |||
| Verisk Analytics, Inc. | 920 | 250,994 | |
| Restaurants–1.02% | |||
| DoorDash, Inc., Class A(b)(c) | 2,460 | 316,627 | |
| Starbucks Corp. | 7,302 | 690,550 | |
| 1,007,177 | |||
| Semiconductor Materials & Equipment–3.03% | |||
| Applied Materials, Inc. | 5,337 | 1,052,777 | |
| ASML Holding N.V., New York Shares (Netherlands)(c) | 587 | 530,572 | |
| KLA Corp. | 868 | 711,265 | |
| Lam Research Corp. | 843 | 692,111 | |
| 2,986,725 | |||
| Semiconductors–20.24% | |||
| Advanced Micro Devices, Inc.(b) | 10,419 | 1,547,847 | |
| Analog Devices, Inc. | 3,199 | 751,253 | |
| ARM Holdings PLC, ADR(b)(c) | 762 | 101,255 | |
| Broadcom, Inc. | 29,873 | 4,863,922 | |
| GLOBALFOUNDRIES, Inc.(b)(c) | 3,556 | 165,994 | |
| Intel Corp. | 27,442 | 604,822 | |
| Marvell Technology, Inc. | 5,580 | 425,419 | |
| Microchip Technology, Inc. | 3,461 | 284,356 | |
| Micron Technology, Inc. | 7,138 | 686,961 | |
| NVIDIA Corp. | 61,392 | 7,328,363 | |
| NXP Semiconductors N.V. (China) | 1,648 | 422,481 | |
| ON Semiconductor Corp.(b) | 2,773 | 215,934 | |
| QUALCOMM, Inc. | 7,194 | 1,261,108 | |
| Texas Instruments, Inc. | 5,869 | 1,257,961 | |
| 19,917,676 | |||
| Soft Drinks & Non-alcoholic Beverages–2.44% | |||
| Coca-Cola Europacific Partners PLC (United Kingdom) | 2,960 | 238,250 | |
| Shares | Value | ||
| Soft Drinks & Non-alcoholic Beverages–(continued) | |||
| Keurig Dr Pepper, Inc. | 8,738 | $319,898 | |
| Monster Beverage Corp.(b) | 6,715 | 316,478 | |
| PepsiCo, Inc. | 8,862 | 1,532,063 | |
| 2,406,689 | |||
| Systems Software–9.63% | |||
| CrowdStrike Holdings, Inc., Class A(b) | 1,487 | 412,315 | |
| Fortinet, Inc.(b) | 4,925 | 377,797 | |
| Microsoft Corp. | 18,549 | 7,737,530 | |
| Palo Alto Networks, Inc.(b) | 2,087 | 756,996 | |
| Zscaler, Inc.(b)(c) | 966 | 193,181 | |
| 9,477,819 | |||
| Technology Distributors–0.20% | |||
| CDW Corp. | 866 | 195,404 | |
| Technology Hardware, Storage & Peripherals–9.07% | |||
| Apple, Inc.(d) | 38,270 | 8,763,830 | |
| Super Micro Computer, Inc.(b) | 377 | 165,013 | |
| 8,928,843 | |||
| Trading Companies & Distributors–0.26% | |||
| Fastenal Co. | 3,691 | 252,021 | |
| Transaction & Payment Processing Services–0.50% | |||
| PayPal Holdings, Inc.(b) | 6,743 | 488,395 | |
| Wireless Telecommunication Services–1.52% | |||
| T-Mobile US, Inc. | 7,554 | 1,501,131 | |
| Total Common Stocks & Other Equity Interests (Cost $78,685,924) | 95,632,363 | ||
| Money Market Funds–2.78% | |||
| Invesco Government & Agency Portfolio, Institutional Class, 5.18%(e)(f) | 958,513 | 958,513 | |
| Invesco Treasury Portfolio, Institutional Class, 5.15%(e)(f) | 1,780,075 | 1,780,075 | |
| Total Money Market Funds (Cost $2,738,588) | 2,738,588 | ||
| TOTAL INVESTMENTS IN SECURITIES (excluding investments purchased with cash collateral from securities on loan)-99.94% (Cost $81,424,512) | 98,370,951 | ||
| Investments Purchased with Cash Collateral from Securities on Loan | |||
| Money Market Funds–1.04% | |||
| Invesco Private Government Fund, 5.28%(e)(f)(g) | 282,641 | 282,641 | |
| Invesco Private Prime Fund, 5.46%(e)(f)(g) | 738,786 | 739,081 | |
| Total Investments Purchased with Cash Collateral from Securities on Loan (Cost $1,021,698) | 1,021,722 | ||
| TOTAL INVESTMENTS IN SECURITIES–100.98% (Cost $82,446,210) | 99,392,673 | ||
| OTHER ASSETS LESS LIABILITIES—(0.98)% | (966,068) | ||
| NET ASSETS–100.00% | $98,426,605 | ||
| ADR | – American Depositary Receipt |
| 3 | Invesco NASDAQ 100 Index Fund |
| (a) | Industry and/or sector classifications used in this report are generally according to the Global Industry Classification Standard, which was developed by and is the exclusive property and a service mark of MSCI Inc. and Standard & Poor’s. |
| (b) | Non-income producing security. |
| (c) | All or a portion of this security was out on loan at August 31, 2024. |
| (d) | All or a portion of the value was pledged as collateral to cover margin requirements for open futures contracts. See Note 1I. |
| (e) | Affiliated holding. Affiliated holdings are investments in entities which are under common ownership or control of Invesco Ltd. or are investments in entities in which the Fund owns 5% or more of the outstanding voting securities. The table below shows the Fund’s transactions in, and earnings from, its investments in affiliates for the fiscal year ended August 31, 2024. |
| Value August 31, 2023 | Purchases at Cost | Proceeds from Sales | Change in Unrealized Appreciation | Realized Gain (Loss) | Value August 31, 2024 | Dividend Income | |
| Investments in Affiliated Money Market Funds: | |||||||
| Invesco Government & Agency Portfolio, Institutional Class | $85,299 | $18,708,057 | $(17,834,843) | $- | $- | $958,513 | $29,248 |
| Invesco Liquid Assets Portfolio, Institutional Class | 60,943 | 12,334,971 | (12,395,879) | - | (35) | - | 18,355 |
| Invesco Treasury Portfolio, Institutional Class | 97,484 | 22,915,034 | (21,232,443) | - | - | 1,780,075 | 36,266 |
| Investments Purchased with Cash Collateral from Securities on Loan: | |||||||
| Invesco Private Government Fund | 209,007 | 12,261,679 | (12,188,045) | - | - | 282,641 | 19,465* |
| Invesco Private Prime Fund | 537,469 | 29,188,558 | (28,987,453) | 24 | 483 | 739,081 | 52,087* |
| Total | $990,202 | $95,408,299 | $(92,638,663) | $24 | $448 | $3,760,310 | $155,421 |
| * | Represents the income earned on the investment of cash collateral, which is included in securities lending income on the Statement of Operations. Does not include rebates and fees paid to lending agent or premiums received from borrowers, if any. |
| (f) | The rate shown is the 7-day SEC standardized yield as of August 31, 2024. |
| (g) | The security has been segregated to satisfy the commitment to return the cash collateral received in securities lending transactions upon the borrower’s return of the securities loaned. See Note 1H. |
| Open Futures Contracts | |||||
| Long Futures Contracts | Number of Contracts | Expiration Month | Notional Value | Value | Unrealized Appreciation |
| Equity Risk | |||||
| Micro E-Mini Nasdaq 100 Index | 71 | September-2024 | $2,786,466 | $53,229 | $53,229 |
| 4 | Invesco NASDAQ 100 Index Fund |
| Assets: | |
| Investments in unaffiliated securities, at value (Cost $78,685,924)* | $95,632,363 |
| Investments in affiliated money market funds, at value (Cost $3,760,286) | 3,760,310 |
| Other investments: | |
| Variation margin receivable — futures contracts | 33,110 |
| Cash | 325 |
| Receivable for: | |
| Fund shares sold | 47,306 |
| Fund expenses absorbed | 348 |
| Dividends | 64,493 |
| Investment for trustee deferred compensation and retirement plans | 16,506 |
| Other assets | 7,025 |
| Total assets | 99,561,786 |
| Liabilities: | |
| Payable for: | |
| Fund shares reacquired | 34,068 |
| Collateral upon return of securities loaned | 1,021,698 |
| Accrued fees to affiliates | 1,153 |
| Accrued trustees’ and officers’ fees and benefits | 2,362 |
| Accrued other operating expenses | 59,394 |
| Trustee deferred compensation and retirement plans | 16,506 |
| Total liabilities | 1,135,181 |
| Net assets applicable to shares outstanding | $98,426,605 |
| Net assets consist of: | |
| Shares of beneficial interest | $82,259,137 |
| Distributable earnings | 16,167,468 |
| $98,426,605 | |
| Net Assets: | |
| Class R6 | $98,426,605 |
| Shares outstanding, no par value, with an unlimited number of shares authorized: | |
| Class R6 | 2,435,308 |
| Class R6: | |
| Net asset value and offering price per share | $40.42 |
| * | At August 31, 2024, securities with an aggregate value of $1,010,362 were on loan to brokers. |
| 5 | Invesco NASDAQ 100 Index Fund |
| Investment income: | |
| Dividends (net of foreign withholding taxes of $952) | $468,090 |
| Dividends from affiliated money market funds (includes net securities lending income of $13,858) | 97,727 |
| Total investment income | 565,817 |
| Expenses: | |
| Advisory fees | 83,970 |
| Administrative services fees | 7,157 |
| Custodian fees | 11,032 |
| Transfer agent fees | 13,572 |
| Trustees’ and officers’ fees and benefits | 20,686 |
| Registration and filing fees | 22,701 |
| Licensing fees | 26,269 |
| Reports to shareholders | 12,656 |
| Professional services fees | 65,376 |
| Other | 3,410 |
| Total expenses | 266,829 |
| Less: Fees waived and/or expenses reimbursed | (105,225) |
| Net expenses | 161,604 |
| Net investment income | 404,213 |
| Realized and unrealized gain (loss) from: | |
| Net realized gain (loss) from: | |
| Unaffiliated investment securities | (225,105) |
| Affiliated investment securities | 448 |
| Futures contracts | 292,332 |
| 67,675 | |
| Change in net unrealized appreciation of: | |
| Unaffiliated investment securities | 12,496,105 |
| Affiliated investment securities | 24 |
| Futures contracts | 54,255 |
| 12,550,384 | |
| Net realized and unrealized gain | 12,618,059 |
| Net increase in net assets resulting from operations | $13,022,272 |
| 6 | Invesco NASDAQ 100 Index Fund |
| 2024 | 2023 | |
| Operations: | ||
| Net investment income | $404,213 | $103,101 |
| Net realized gain (loss) | 67,675 | (578,432) |
| Change in net unrealized appreciation | 12,550,384 | 4,986,242 |
| Net increase in net assets resulting from operations | 13,022,272 | 4,510,911 |
| Distributions to shareholders from distributable earnings: | ||
| Class R6 | (306,272) | (93,393) |
| Share transactions–net: | ||
| Class R6 | 61,180,151 | 11,317,009 |
| Net increase in net assets | 73,896,151 | 15,734,527 |
| Net assets: | ||
| Beginning of year | 24,530,454 | 8,795,927 |
| End of year | $98,426,605 | $24,530,454 |
| Net asset value, beginning of period | Net investment income(a) | Net gains (losses) on securities (both realized and unrealized) | Total from investment operations | Dividends from net investment income | Distributions from net realized gains | Total distributions | Net asset value, end of period | Total return(b) | Net assets, end of period (000’s omitted) | Ratio of expenses to average net assets with fee waivers and/or expenses absorbed | Ratio of expenses to average net assets without fee waivers and/or expenses absorbed | Ratio of net investment income to average net assets | Portfolio turnover (c) | |
| Class R6 | ||||||||||||||
| Year ended 08/31/24 | $32.04 | $0.27 | $8.32 | $8.59 | $(0.21) | $— | $(0.21) | $40.42 | 26.89% | $98,427 | 0.29% | 0.48% | 0.72% | 7% |
| Year ended 08/31/23 | 25.23 | 0.19 | 6.80 | 6.99 | (0.18) | — | (0.18) | 32.04 | 27.88 | 24,530 | 0.29 | 1.12 | 0.69 | 46 |
| Year ended 08/31/22 | 32.18 | 0.15 | (6.81) | (6.66) | (0.14) | (0.15) | (0.29) | 25.23 | (20.86) | 8,796 | 0.29 | 1.71 | 0.52 | 21 |
| Period ended 08/31/21(d) | 25.00 | 0.11 | 7.18 | 7.29 | (0.11) | — | (0.11) | 32.18 | 29.24 | 4,396 | 0.29(e) | 5.30(e) | 0.46(e) | 6 |
| (a) | Calculated using average shares outstanding. |
| (b) | Includes adjustments in accordance with accounting principles generally accepted in the United States of America and as such, the net asset value for financial reporting purposes and the returns based upon those net asset values may differ from the net asset value and returns for shareholder transactions. Not annualized for periods less than one year, if applicable. |
| (c) | Portfolio turnover is not annualized for periods less than one year, if applicable. |
| (d) | Commencement date of October 13, 2020. |
| (e) | Annualized. |
| A. | Security Valuations — Securities, including restricted securities, are valued according to the following policy. |
| 9 | Invesco NASDAQ 100 Index Fund |
| B. | Securities Transactions and Investment Income – Securities transactions are accounted for on a trade date basis. Realized gains or losses on sales are computed on the basis of specific identification of the securities sold. Interest income (net of withholding tax, if any) is recorded on an accrual basis from settlement date and includes coupon interest and amortization of premium and accretion of discount on debt securities as applicable. Pay-in-kind interest income and non-cash dividend income received in the form of securities in lieu of cash are recorded at the fair value of the securities received. Dividend income (net of withholding tax, if any) is recorded on the ex-dividend date. |
| C. | Country Determination — For the purposes of making investment selection decisions and presentation in the Schedule of Investments, the investment adviser may determine the country in which an issuer is located and/or credit risk exposure based on various factors. These factors include the laws of the country under which the issuer is organized, where the issuer maintains a principal office, the country in which the issuer derives 50% or more of its total revenues, the country that has the primary market for the issuer’s securities and its "country of risk" as determined by a third party service provider, as well as other criteria. Among the other criteria that may be evaluated for making this determination are the country in which the issuer maintains 50% or more of its assets, the type of security, financial guarantees and enhancements, the nature of the collateral and the sponsor organization. Country of issuer and/or credit risk exposure has been determined to be the United States of America, unless otherwise noted. |
| D. | Distributions - Distributions from net investment income, if any, are declared and paid quarterly and are recorded on the ex-dividend date. Distributions from net realized capital gain, if any, are generally declared and paid annually and recorded on the ex-dividend date. The Fund may elect to treat a portion of the proceeds from redemptions as distributions for federal income tax purposes. |
| E. | Federal Income Taxes – The Fund intends to comply with the requirements of Subchapter M of the Internal Revenue Code of 1986, as amended (the “Internal Revenue Code”), necessary to qualify as a regulated investment company and to distribute substantially all of the Fund’s taxable earnings to shareholders. As such, the Fund will not be subject to federal income taxes on otherwise taxable income (including net realized capital gain) that is distributed to shareholders. Therefore, no provision for federal income taxes is recorded in the financial statements. |
| F. | Accounting Estimates – The preparation of financial statements in conformity with accounting principles generally accepted in the United States of America (“GAAP”) requires management to make estimates and assumptions that affect the reported amounts of assets and liabilities at the date of the financial statements and the reported amounts of revenues and expenses during the reporting period including estimates and assumptions related to taxation. Actual results could differ from those estimates by a significant amount. In addition, the Fund monitors for material events or transactions that may occur or become known after the period-end date and before the date the financial statements are released to print. |
| G. | Indemnifications – Under the Trust’s organizational documents, each Trustee, officer, employee or other agent of the Trust is indemnified against certain liabilities that may arise out of the performance of their duties to the Fund. Additionally, in the normal course of business, the Fund enters into contracts, including the Fund’s servicing agreements, that contain a variety of indemnification clauses. The Fund’s maximum exposure under these arrangements is unknown as this would involve future claims that may be made against the Fund that have not yet occurred. The risk of material loss as a result of such indemnification claims is considered remote. |
| H. | Securities Lending – The Fund may lend portfolio securities having a market value up to one-third of the Fund’s total assets. Such loans are secured by collateral equal to no less than the market value of the loaned securities determined daily by the securities lending provider. Such collateral will be cash or debt securities issued or guaranteed by the U.S. Government or any of its sponsored agencies. Cash collateral received in connection with these loans is invested in short-term money market instruments or affiliated, unregistered investment companies that comply with Rule 2a-7 under the 1940 Act and money market funds (collectively, "affiliated money market funds") and is shown as such on the Schedule of Investments. The Fund bears the risk of loss with respect to the investment of collateral. It is the Fund’s policy to obtain additional collateral from or return excess collateral to the borrower by the end of the next business day, following the valuation date of the securities loaned. Therefore, the value of the collateral held may be temporarily less than the value of the securities on loan. When loaning securities, the Fund retains certain benefits of owning the securities, including the economic equivalent of dividends or interest generated by the security. Lending securities entails a risk of loss to the Fund if, and to the extent that, the market value of the securities loaned were to increase and the borrower did not increase the collateral accordingly, and the borrower failed to return the securities. The securities loaned are subject to termination at the option of the borrower or the Fund. Upon termination, the borrower will return to the Fund the securities loaned and the Fund will return the collateral. Upon the failure of the borrower to return the securities, collateral may be liquidated and the securities may be purchased on the open market to replace the loaned securities. The Fund could experience delays and costs in gaining access to the collateral and the securities may lose value during the delay which could result in potential losses to the Fund. Some of these losses may be indemnified by the lending agent. The Fund bears the risk of any deficiency in the amount of the collateral available for return to the borrower due to any loss on the collateral invested. Dividends received on cash collateral investments for securities lending transactions, which are net of compensation to counterparties, are included in Dividends from affiliated money market funds on the Statement of Operations. The aggregate value of securities out on loan, if any, is shown as a footnote on the Statement of Assets and Liabilities. |
| I. | Futures Contracts — The Fund may enter into futures contracts to manage exposure to interest rate, equity and market price movements and/or currency risks. A futures contract is an agreement between two parties ("Counterparties") to purchase or sell a specified underlying security, currency or commodity (or delivery of a cash settlement price, in the case of an index future) for a fixed price at a future date. The Fund currently invests only in exchange-traded futures and they are standardized as to maturity date and underlying instrument or asset. Initial margin deposits required upon entering into futures contracts are satisfied by the segregation of specific securities or cash as collateral at the futures commission merchant (broker). During the period the futures contracts are open, changes in the value of the contracts are recognized as unrealized gains or losses by recalculating the value of the contracts on a daily basis. Subsequent or variation |
| 10 | Invesco NASDAQ 100 Index Fund |
| margin payments are received or made depending upon whether unrealized gains or losses are incurred. These amounts are reflected as receivables or payables on the Statement of Assets and Liabilities. When the contracts are closed or expire, the Fund recognizes a realized gain or loss equal to the difference between the proceeds from, or cost of, the closing transaction and the Fund’s basis in the contract. The net realized gain (loss) and the change in unrealized gain (loss) on futures contracts held during the period is included on the Statement of Operations. The primary risks associated with futures contracts are market risk and the absence of a liquid secondary market. If the Fund were unable to liquidate a futures contract and/or enter into an offsetting closing transaction, the Fund would continue to be subject to market risk with respect to the value of the contracts and continue to be required to maintain the margin deposits on the futures contracts. Futures contracts have minimal Counterparty risk since the exchange’s clearinghouse, as Counterparty to all exchange-traded futures, guarantees the futures against default. Risks may exceed amounts recognized in the Statement of Assets and Liabilities. |
| J. | Leverage Risk — Leverage exists when the Fund can lose more than it originally invests because it purchases or sells an instrument or enters into a transaction without investing an amount equal to the full economic exposure of the instrument or transaction. |
| K. | Collateral —To the extent the Fund has designated or segregated a security as collateral and that security is subsequently sold, it is the Fund’s practice to replace such collateral no later than the next business day. This practice does not apply to securities pledged as collateral for securities lending transactions. |
| L. | Other Risks - The Fund intends to be diversified in approximately the same proportion as the Underlying Index is diversified. The Fund may be “non-diversified,” as defined in the 1940 Act, solely as a result of a change in relative market capitalization or index weighting of one or more constituents of the Underlying Index. To the extent the Fund becomes non-diversified, the Fund may invest a greater portion of its assets in the obligations or securities of a small number of issuers or any single issuer than a diversified fund can. In such circumstances, a change in the value of one or a few issuers’ securities will therefore affect the value of the Fund more than if it was a diversified fund. |
| Average Daily Net Assets | Rate |
| First $2 billion | 0.150% |
| Over $2 billion | 0.140% |
| 11 | Invesco NASDAQ 100 Index Fund |
| Level 1 | Level 2 | Level 3 | Total | |
| Investments in Securities | ||||
| Common Stocks & Other Equity Interests | $95,632,363 | $— | $— | $95,632,363 |
| Money Market Funds | 2,738,588 | 1,021,722 | — | 3,760,310 |
| Total Investments in Securities | 98,370,951 | 1,021,722 | — | 99,392,673 |
| Other Investments - Assets* | ||||
| Futures Contracts | 53,229 | — | — | 53,229 |
| Total Investments | $98,424,180 | $1,021,722 | $— | $99,445,902 |
| * | Unrealized appreciation. |
| Value | |
| Derivative Assets | Equity Risk |
| Unrealized appreciation on futures contracts —Exchange-Traded(a) | $53,229 |
| Derivatives not subject to master netting agreements | (53,229) |
| Total Derivative Assets subject to master netting agreements | $— |
| (a) | The daily variation margin receivable (payable) at period-end is recorded in the Statement of Assets and Liabilities. |
| Location of Gain on Statement of Operations | |
| Equity Risk | |
| Realized Gain: | |
| Futures contracts | $292,332 |
| Change in Net Unrealized Appreciation: | |
| Futures contracts | 54,255 |
| Total | $346,587 |
| Futures Contracts | |
| Average notional value | $1,411,949 |
| 12 | Invesco NASDAQ 100 Index Fund |
| Tax Character of Distributions to Shareholders Paid During the Fiscal Years Ended August 31, 2024 and 2023: | ||
| 2024 | 2023 | |
| Ordinary income* | $306,272 | $93,393 |
| * | Includes short-term capital gain distributions, if any. |
| Tax Components of Net Assets at Period-End: | |
| 2024 | |
| Undistributed ordinary income | $247,065 |
| Undistributed long-term capital gain | 37,553 |
| Net unrealized appreciation — investments | 15,894,440 |
| Temporary book/tax differences | (11,590) |
| Shares of beneficial interest | 82,259,137 |
| Total net assets | $98,426,605 |
| Unrealized Appreciation (Depreciation) of Investments on a Tax Basis | |
| Aggregate unrealized appreciation of investments | $17,146,723 |
| Aggregate unrealized (depreciation) of investments | (1,252,283) |
| Net unrealized appreciation of investments | $15,894,440 |
| Summary of Share Activity | |||||
| Year ended August 31, 2024(a) | Year ended August 31, 2023 | ||||
| Shares | Amount | Shares | Amount | ||
| Sold: | |||||
| Class R6 | 1,974,416 | $72,504,046 | 567,499 | $15,478,776 | |
| Issued as reinvestment of dividends: | |||||
| Class R6 | 8,222 | 304,823 | 3,140 | 83,080 | |
| 13 | Invesco NASDAQ 100 Index Fund |
| Summary of Share Activity | |||||
| Year ended August 31, 2024(a) | Year ended August 31, 2023 | ||||
| Shares | Amount | Shares | Amount | ||
| Reacquired: | |||||
| Class R6 | (312,882) | $(11,628,718) | (153,652) | $(4,244,847) | |
| Net increase in share activity | 1,669,756 | $61,180,151 | 416,987 | $11,317,009 | |
| (a) | There are entities that are record owners of more than 5% of the outstanding shares of the Fund and in the aggregate own 75% of the outstanding shares of the Fund. IDI has an agreement with these entities to sell Fund shares. The Fund, Invesco and/or Invesco affiliates may make payments to these entities, which are considered to be related to the Fund, for providing services to the Fund, Invesco and/or Invesco affiliates including but not limited to services such as securities brokerage, distribution, third party record keeping and account servicing. The Fund has no knowledge as to whether all or any portion of the shares owned of record by these entities are also owned beneficially. |
| 14 | Invesco NASDAQ 100 Index Fund |
| 15 | Invesco NASDAQ 100 Index Fund |
| A. | Nature, Extent and Quality of Services Provided by Invesco Advisers and the Affiliated Sub-Advisers |
| B. | Fund Investment Performance |
| 16 | Invesco NASDAQ 100 Index Fund |
| C. | Advisory and Sub-Advisory Fees and Fund Expenses |
| 17 | Invesco NASDAQ 100 Index Fund |
| 18 | Invesco NASDAQ 100 Index Fund |
| Federal and State Income Tax | |
| Qualified Dividend Income* | 90.49% |
| Corporate Dividends Received Deduction* | 88.32% |
| U.S. Treasury Obligations* | 0.00% |
| Qualified Business Income* | 0.00% |
| Business Interest Income* | 0.00% |
| * | The above percentages are based on ordinary income dividends paid to shareholders during the Fund’s fiscal year. |
| 19 | Invesco NASDAQ 100 Index Fund |
| 20 | Invesco NASDAQ 100 Index Fund |

| Annual Financial Statements and Other Information | August 31, 2024 |
| Shares | Value | ||
| Common Stocks & Other Equity Interests–97.92% | |||
| Advertising–0.07% | |||
| Interpublic Group of Cos., Inc. (The)(b) | 25,985 | $847,371 | |
| Omnicom Group, Inc.(b) | 13,483 | 1,354,098 | |
| 2,201,469 | |||
| Aerospace & Defense–1.92% | |||
| Axon Enterprise, Inc.(c) | 4,884 | 1,782,513 | |
| Boeing Co. (The)(c) | 39,729 | 6,902,516 | |
| General Dynamics Corp. | 15,653 | 4,685,882 | |
| General Electric Co. | 75,362 | 13,159,712 | |
| Howmet Aerospace, Inc. | 26,697 | 2,580,532 | |
| Huntington Ingalls Industries, Inc. | 2,715 | 767,721 | |
| L3Harris Technologies, Inc. | 13,059 | 3,090,674 | |
| Lockheed Martin Corp. | 14,702 | 8,352,206 | |
| Northrop Grumman Corp. | 9,577 | 5,010,782 | |
| RTX Corp. | 91,534 | 11,289,804 | |
| Textron, Inc. | 13,129 | 1,197,365 | |
| TransDigm Group, Inc. | 3,853 | 5,290,978 | |
| 64,110,685 | |||
| Agricultural & Farm Machinery–0.21% | |||
| Deere & Co. | 17,823 | 6,875,044 | |
| Agricultural Products & Services–0.09% | |||
| Archer-Daniels-Midland Co. | 34,041 | 2,076,160 | |
| Bunge Global S.A. | 9,749 | 988,354 | |
| 3,064,514 | |||
| Air Freight & Logistics–0.39% | |||
| C.H. Robinson Worldwide, Inc. | 8,062 | 834,498 | |
| Expeditors International of Washington, Inc. | 9,725 | 1,200,162 | |
| FedEx Corp. | 15,587 | 4,656,928 | |
| United Parcel Service, Inc., Class B | 50,218 | 6,455,524 | |
| 13,147,112 | |||
| Apparel Retail–0.38% | |||
| Ross Stores, Inc. | 23,085 | 3,476,832 | |
| TJX Cos., Inc. (The) | 77,971 | 9,143,659 | |
| 12,620,491 | |||
| Apparel, Accessories & Luxury Goods–0.09% | |||
| lululemon athletica, inc.(c) | 7,889 | 2,046,959 | |
| Ralph Lauren Corp. | 2,688 | 460,347 | |
| Tapestry, Inc. | 15,819 | 648,104 | |
| 3,155,410 | |||
| Application Software–2.20% | |||
| Adobe, Inc.(c) | 30,844 | 17,717,102 | |
| ANSYS, Inc.(c) | 6,010 | 1,931,734 | |
| Autodesk, Inc.(c) | 14,728 | 3,805,715 | |
| Cadence Design Systems, Inc.(c) | 18,736 | 5,038,673 | |
| Fair Isaac Corp.(c) | 1,701 | 2,943,189 | |
| Intuit, Inc. | 19,276 | 12,148,892 | |
| PTC, Inc.(b)(c) | 8,244 | 1,476,418 | |
| Roper Technologies, Inc. | 7,370 | 4,086,002 | |
| Salesforce, Inc. | 66,869 | 16,911,170 | |
| Synopsys, Inc.(c) | 10,502 | 5,456,629 | |
| Shares | Value | ||
| Application Software–(continued) | |||
| Tyler Technologies, Inc.(c) | 2,923 | $1,718,344 | |
| 73,233,868 | |||
| Asset Management & Custody Banks–1.01% | |||
| Ameriprise Financial, Inc. | 6,838 | 3,073,271 | |
| Bank of New York Mellon Corp. (The) | 51,486 | 3,512,375 | |
| BlackRock, Inc. | 9,617 | 8,672,707 | |
| Blackstone, Inc., Class A | 49,202 | 7,004,397 | |
| Franklin Resources, Inc.(b) | 20,646 | 417,875 | |
| Invesco Ltd.(d) | 30,970 | 529,277 | |
| KKR & Co., Inc., Class A | 45,822 | 5,671,389 | |
| Northern Trust Corp. | 14,086 | 1,284,784 | |
| State Street Corp. | 20,741 | 1,806,541 | |
| T. Rowe Price Group, Inc. | 15,374 | 1,630,259 | |
| 33,602,875 | |||
| Automobile Manufacturers–1.43% | |||
| Ford Motor Co. | 269,986 | 3,021,143 | |
| General Motors Co. | 78,553 | 3,910,369 | |
| Tesla, Inc.(c) | 191,026 | 40,900,577 | |
| 47,832,089 | |||
| Automotive Parts & Equipment–0.06% | |||
| Aptiv PLC(c) | 18,731 | 1,339,828 | |
| BorgWarner, Inc. | 15,686 | 534,422 | |
| 1,874,250 | |||
| Automotive Retail–0.27% | |||
| AutoZone, Inc.(c) | 1,154 | 3,671,428 | |
| CarMax, Inc.(c) | 10,836 | 916,184 | |
| O’Reilly Automotive, Inc.(c) | 4,055 | 4,582,028 | |
| 9,169,640 | |||
| Biotechnology–1.95% | |||
| AbbVie, Inc. | 121,577 | 23,866,781 | |
| Amgen, Inc. | 36,932 | 12,329,009 | |
| Biogen, Inc.(c) | 10,024 | 2,052,514 | |
| Gilead Sciences, Inc. | 85,775 | 6,776,225 | |
| Incyte Corp.(c) | 9,571 | 628,432 | |
| Moderna, Inc.(b)(c) | 22,955 | 1,776,717 | |
| Regeneron Pharmaceuticals, Inc.(c) | 7,303 | 8,651,791 | |
| Vertex Pharmaceuticals, Inc.(c) | 17,766 | 8,809,982 | |
| 64,891,451 | |||
| Brewers–0.02% | |||
| Molson Coors Beverage Co., Class B | 12,519 | 675,650 | |
| Broadcasting–0.04% | |||
| Fox Corp., Class A(b) | 15,914 | 658,362 | |
| Fox Corp., Class B | 9,083 | 349,060 | |
| Paramount Global, Class B | 34,036 | 356,357 | |
| 1,363,779 | |||
| Broadline Retail–3.45% | |||
| Amazon.com, Inc.(c) | 629,868 | 112,431,438 | |
| eBay, Inc. | 34,837 | 2,058,867 | |
| Etsy, Inc.(b)(c) | 8,051 | 443,529 | |
| 114,933,834 | |||
| 2 | Invesco S&P 500 Index Fund |
| Shares | Value | ||
| Building Products–0.52% | |||
| A.O. Smith Corp.(b) | 8,316 | $696,216 | |
| Allegion PLC | 6,020 | 835,817 | |
| Builders FirstSource, Inc.(c) | 8,403 | 1,462,122 | |
| Carrier Global Corp. | 57,691 | 4,198,751 | |
| Johnson Controls International PLC | 46,381 | 3,378,856 | |
| Masco Corp. | 15,163 | 1,206,368 | |
| Trane Technologies PLC | 15,584 | 5,636,109 | |
| 17,414,239 | |||
| Cable & Satellite–0.39% | |||
| Charter Communications, Inc., Class A(b)(c) | 6,743 | 2,343,462 | |
| Comcast Corp., Class A | 269,484 | 10,663,482 | |
| 13,006,944 | |||
| Cargo Ground Transportation–0.10% | |||
| J.B. Hunt Transport Services, Inc. | 5,613 | 972,172 | |
| Old Dominion Freight Line, Inc. | 12,267 | 2,365,077 | |
| 3,337,249 | |||
| Casinos & Gaming–0.08% | |||
| Caesars Entertainment, Inc.(b)(c) | 14,900 | 560,836 | |
| Las Vegas Sands Corp. | 25,134 | 979,975 | |
| MGM Resorts International(b)(c) | 17,277 | 649,442 | |
| Wynn Resorts Ltd. | 6,501 | 499,797 | |
| 2,690,050 | |||
| Commodity Chemicals–0.13% | |||
| Dow, Inc. | 48,414 | 2,594,022 | |
| LyondellBasell Industries N.V., Class A | 17,711 | 1,748,076 | |
| 4,342,098 | |||
| Communications Equipment–0.81% | |||
| Arista Networks, Inc.(c) | 17,475 | 6,175,316 | |
| Cisco Systems, Inc. | 278,779 | 14,089,491 | |
| F5, Inc.(c) | 4,035 | 819,710 | |
| Juniper Networks, Inc. | 22,375 | 869,940 | |
| Motorola Solutions, Inc. | 11,483 | 5,075,945 | |
| 27,030,402 | |||
| Computer & Electronics Retail–0.04% | |||
| Best Buy Co., Inc. | 13,257 | 1,331,003 | |
| Construction & Engineering–0.08% | |||
| Quanta Services, Inc.(b) | 10,079 | 2,773,035 | |
| Construction Machinery & Heavy Transportation Equipment– 0.61% | |||
| Caterpillar, Inc. | 33,670 | 11,989,887 | |
| Cummins, Inc. | 9,417 | 2,946,108 | |
| PACCAR, Inc. | 36,086 | 3,470,752 | |
| Wabtec Corp. | 12,144 | 2,059,258 | |
| 20,466,005 | |||
| Construction Materials–0.13% | |||
| Martin Marietta Materials, Inc. | 4,244 | 2,266,975 | |
| Vulcan Materials Co.(b) | 9,105 | 2,232,637 | |
| 4,499,612 | |||
| Consumer Electronics–0.06% | |||
| Garmin Ltd. | 10,579 | 1,939,025 | |
| Consumer Finance–0.53% | |||
| American Express Co. | 39,123 | 10,119,164 | |
| Shares | Value | ||
| Consumer Finance–(continued) | |||
| Capital One Financial Corp. | 26,307 | $3,865,287 | |
| Discover Financial Services | 17,253 | 2,393,164 | |
| Synchrony Financial | 27,646 | 1,389,488 | |
| 17,767,103 | |||
| Consumer Staples Merchandise Retail–1.72% | |||
| Costco Wholesale Corp. | 30,534 | 27,247,931 | |
| Dollar General Corp.(b) | 15,124 | 1,254,838 | |
| Dollar Tree, Inc.(c) | 14,267 | 1,205,419 | |
| Target Corp. | 31,851 | 4,892,951 | |
| Walmart, Inc. | 294,097 | 22,713,111 | |
| 57,314,250 | |||
| Copper–0.13% | |||
| Freeport-McMoRan, Inc. | 98,899 | 4,379,248 | |
| Data Center REITs–0.26% | |||
| Digital Realty Trust, Inc. | 22,341 | 3,387,119 | |
| Equinix, Inc. | 6,534 | 5,451,708 | |
| 8,838,827 | |||
| Data Processing & Outsourced Services–0.05% | |||
| Broadridge Financial Solutions, Inc. | 8,136 | 1,731,829 | |
| Distillers & Vintners–0.10% | |||
| Brown-Forman Corp., Class B(b) | 12,325 | 561,897 | |
| Constellation Brands, Inc., Class A | 11,084 | 2,668,029 | |
| 3,229,926 | |||
| Distributors–0.09% | |||
| Genuine Parts Co. | 9,590 | 1,373,863 | |
| LKQ Corp. | 18,367 | 763,884 | |
| Pool Corp.(b) | 2,639 | 927,925 | |
| 3,065,672 | |||
| Diversified Banks–2.97% | |||
| Bank of America Corp. | 468,423 | 19,088,237 | |
| Citigroup, Inc. | 131,323 | 8,226,073 | |
| Fifth Third Bancorp | 47,095 | 2,010,486 | |
| JPMorgan Chase & Co. | 197,709 | 44,444,983 | |
| KeyCorp | 64,914 | 1,107,433 | |
| PNC Financial Services Group, Inc. (The) | 27,395 | 5,070,540 | |
| U.S. Bancorp | 107,435 | 5,074,155 | |
| Wells Fargo & Co. | 240,026 | 14,034,320 | |
| 99,056,227 | |||
| Diversified Support Services–0.24% | |||
| Cintas Corp. | 5,938 | 4,780,803 | |
| Copart, Inc.(c) | 60,237 | 3,190,151 | |
| 7,970,954 | |||
| Drug Retail–0.01% | |||
| Walgreens Boots Alliance, Inc.(b) | 49,299 | 456,016 | |
| Electric Utilities–1.57% | |||
| Alliant Energy Corp. | 17,651 | 1,028,524 | |
| American Electric Power Co., Inc. | 36,291 | 3,639,261 | |
| Constellation Energy Corp. | 21,703 | 4,268,980 | |
| Duke Energy Corp. | 53,135 | 6,054,733 | |
| Edison International | 26,489 | 2,305,338 | |
| Entergy Corp. | 14,702 | 1,774,384 | |
| Evergy, Inc. | 15,830 | 936,186 | |
| 3 | Invesco S&P 500 Index Fund |
| Shares | Value | ||
| Electric Utilities–(continued) | |||
| Eversource Energy | 24,252 | $1,637,738 | |
| Exelon Corp. | 68,850 | 2,622,496 | |
| FirstEnergy Corp. | 35,661 | 1,566,231 | |
| NextEra Energy, Inc. | 141,451 | 11,388,220 | |
| NRG Energy, Inc. | 14,353 | 1,220,149 | |
| PG&E Corp. | 147,130 | 2,898,461 | |
| Pinnacle West Capital Corp.(b) | 7,818 | 684,231 | |
| PPL Corp. | 50,792 | 1,620,773 | |
| Southern Co. (The) | 75,280 | 6,504,192 | |
| Xcel Energy, Inc. | 38,255 | 2,342,354 | |
| 52,492,251 | |||
| Electrical Components & Equipment–0.59% | |||
| AMETEK, Inc. | 15,936 | 2,725,853 | |
| Eaton Corp. PLC | 27,525 | 8,448,248 | |
| Emerson Electric Co. | 39,388 | 4,151,101 | |
| Generac Holdings, Inc.(c) | 4,173 | 653,200 | |
| Hubbell, Inc. | 3,696 | 1,478,104 | |
| Rockwell Automation, Inc. | 7,849 | 2,135,164 | |
| 19,591,670 | |||
| Electronic Components–0.23% | |||
| Amphenol Corp., Class A | 82,701 | 5,578,183 | |
| Corning, Inc. | 53,079 | 2,221,356 | |
| 7,799,539 | |||
| Electronic Equipment & Instruments–0.16% | |||
| Keysight Technologies, Inc.(c) | 12,018 | 1,852,214 | |
| Teledyne Technologies, Inc.(c) | 3,265 | 1,413,092 | |
| Trimble, Inc.(c) | 16,813 | 953,129 | |
| Zebra Technologies Corp., Class A(c) | 3,540 | 1,222,645 | |
| 5,441,080 | |||
| Electronic Manufacturing Services–0.12% | |||
| Jabil, Inc. | 8,303 | 907,352 | |
| TE Connectivity Ltd. | 21,083 | 3,238,349 | |
| 4,145,701 | |||
| Environmental & Facilities Services–0.33% | |||
| Republic Services, Inc. | 14,094 | 2,934,512 | |
| Rollins, Inc. | 19,336 | 970,280 | |
| Veralto Corp. | 15,125 | 1,700,504 | |
| Waste Management, Inc. | 25,129 | 5,328,353 | |
| 10,933,649 | |||
| Fertilizers & Agricultural Chemicals–0.15% | |||
| CF Industries Holdings, Inc. | 12,584 | 1,045,605 | |
| Corteva, Inc. | 47,985 | 2,749,540 | |
| FMC Corp. | 8,593 | 554,936 | |
| Mosaic Co. (The) | 22,127 | 632,168 | |
| 4,982,249 | |||
| Financial Exchanges & Data–1.10% | |||
| Cboe Global Markets, Inc. | 7,240 | 1,487,096 | |
| CME Group, Inc., Class A | 24,790 | 5,348,195 | |
| FactSet Research Systems, Inc. | 2,624 | 1,109,532 | |
| Intercontinental Exchange, Inc. | 39,490 | 6,379,609 | |
| MarketAxess Holdings, Inc. | 2,609 | 632,395 | |
| Moody’s Corp. | 10,812 | 5,273,445 | |
| MSCI, Inc. | 5,454 | 3,166,538 | |
| Nasdaq, Inc. | 26,197 | 1,888,280 | |
| Shares | Value | ||
| Financial Exchanges & Data–(continued) | |||
| S&P Global, Inc. | 22,038 | $11,310,783 | |
| 36,595,873 | |||
| Food Distributors–0.08% | |||
| Sysco Corp. | 34,285 | 2,673,201 | |
| Food Retail–0.07% | |||
| Kroger Co. (The) | 46,086 | 2,452,236 | |
| Footwear–0.26% | |||
| Deckers Outdoor Corp.(c) | 1,767 | 1,695,066 | |
| NIKE, Inc., Class B | 83,407 | 6,949,471 | |
| 8,644,537 | |||
| Gas Utilities–0.04% | |||
| Atmos Energy Corp. | 10,388 | 1,358,127 | |
| Gold–0.13% | |||
| Newmont Corp. | 79,391 | 4,238,686 | |
| Health Care Distributors–0.31% | |||
| Cardinal Health, Inc. | 16,769 | 1,890,202 | |
| Cencora, Inc. | 11,397 | 2,730,379 | |
| Henry Schein, Inc.(c) | 8,816 | 621,969 | |
| McKesson Corp. | 8,949 | 5,021,105 | |
| 10,263,655 | |||
| Health Care Equipment–2.26% | |||
| Abbott Laboratories | 119,770 | 13,566,348 | |
| Baxter International, Inc. | 35,084 | 1,331,087 | |
| Becton, Dickinson and Co. | 19,897 | 4,823,232 | |
| Boston Scientific Corp.(c) | 101,219 | 8,278,702 | |
| DexCom, Inc.(c) | 27,380 | 1,898,529 | |
| Edwards Lifesciences Corp.(c) | 41,488 | 2,902,501 | |
| GE HealthCare Technologies, Inc. | 29,227 | 2,479,034 | |
| Hologic, Inc.(c) | 16,068 | 1,305,364 | |
| IDEXX Laboratories, Inc.(c) | 5,686 | 2,736,842 | |
| Insulet Corp.(c) | 4,822 | 977,757 | |
| Intuitive Surgical, Inc.(c) | 24,421 | 12,030,517 | |
| Medtronic PLC | 91,418 | 8,097,807 | |
| ResMed, Inc.(b) | 10,114 | 2,478,132 | |
| STERIS PLC | 6,803 | 1,640,203 | |
| Stryker Corp. | 23,343 | 8,413,284 | |
| Teleflex, Inc. | 3,243 | 795,086 | |
| Zimmer Biomet Holdings, Inc. | 14,164 | 1,635,376 | |
| 75,389,801 | |||
| Health Care Facilities–0.19% | |||
| HCA Healthcare, Inc. | 13,344 | 5,278,753 | |
| Universal Health Services, Inc., Class B | 4,109 | 977,819 | |
| 6,256,572 | |||
| Health Care REITs–0.27% | |||
| Alexandria Real Estate Equities, Inc. | 10,836 | 1,295,661 | |
| Healthpeak Properties, Inc. | 48,454 | 1,079,555 | |
| Ventas, Inc. | 27,868 | 1,730,881 | |
| Welltower, Inc. | 41,165 | 4,967,792 | |
| 9,073,889 | |||
| Health Care Services–0.45% | |||
| Cigna Group (The) | 19,558 | 7,076,280 | |
| CVS Health Corp. | 86,430 | 4,947,253 | |
| 4 | Invesco S&P 500 Index Fund |
| Shares | Value | ||
| Health Care Services–(continued) | |||
| DaVita, Inc.(b)(c) | 3,562 | $537,577 | |
| Labcorp Holdings, Inc. | 5,803 | 1,334,052 | |
| Quest Diagnostics, Inc. | 7,648 | 1,200,506 | |
| 15,095,668 | |||
| Health Care Supplies–0.10% | |||
| Align Technology, Inc.(c) | 4,820 | 1,143,400 | |
| Cooper Cos., Inc. (The)(c) | 13,684 | 1,446,809 | |
| Solventum Corp.(c) | 9,513 | 609,879 | |
| 3,200,088 | |||
| Heavy Electrical Equipment–0.11% | |||
| GE Vernova, Inc.(c) | 18,870 | 3,792,870 | |
| Home Furnishings–0.02% | |||
| Mohawk Industries, Inc.(c) | 3,649 | 566,106 | |
| Home Improvement Retail–1.05% | |||
| Home Depot, Inc. (The) | 68,231 | 25,143,124 | |
| Lowe’s Cos., Inc. | 39,394 | 9,789,409 | |
| 34,932,533 | |||
| Homebuilding–0.32% | |||
| D.R. Horton, Inc. | 20,405 | 3,851,648 | |
| Lennar Corp., Class A | 16,858 | 3,069,168 | |
| NVR, Inc.(c) | 216 | 1,981,251 | |
| PulteGroup, Inc. | 14,482 | 1,906,555 | |
| 10,808,622 | |||
| Hotel & Resort REITs–0.03% | |||
| Host Hotels & Resorts, Inc. | 48,541 | 859,176 | |
| Hotels, Resorts & Cruise Lines–0.78% | |||
| Airbnb, Inc., Class A(c) | 30,396 | 3,565,755 | |
| Booking Holdings, Inc. | 2,336 | 9,131,961 | |
| Carnival Corp.(c) | 69,543 | 1,147,459 | |
| Expedia Group, Inc.(c) | 8,740 | 1,215,647 | |
| Hilton Worldwide Holdings, Inc. | 17,215 | 3,781,103 | |
| Marriott International, Inc., Class A | 16,518 | 3,876,609 | |
| Norwegian Cruise Line Holdings Ltd.(c) | 29,539 | 528,453 | |
| Royal Caribbean Cruises Ltd.(c) | 16,301 | 2,683,471 | |
| 25,930,458 | |||
| Household Products–1.21% | |||
| Church & Dwight Co., Inc. | 16,835 | 1,715,150 | |
| Clorox Co. (The) | 8,550 | 1,353,551 | |
| Colgate-Palmolive Co. | 56,486 | 6,015,759 | |
| Kimberly-Clark Corp. | 23,182 | 3,353,508 | |
| Procter & Gamble Co. (The) | 162,491 | 27,873,706 | |
| 40,311,674 | |||
| Human Resource & Employment Services–0.35% | |||
| Automatic Data Processing, Inc. | 28,179 | 7,774,868 | |
| Dayforce, Inc.(b)(c) | 10,871 | 621,495 | |
| Paychex, Inc. | 22,057 | 2,893,878 | |
| Paycom Software, Inc. | 3,310 | 538,802 | |
| 11,829,043 | |||
| Independent Power Producers & Energy Traders–0.08% | |||
| AES Corp. (The) | 48,928 | 838,137 | |
| Vistra Corp. | 22,487 | 1,921,064 | |
| 2,759,201 | |||
| Shares | Value | ||
| Industrial Conglomerates–0.43% | |||
| 3M Co. | 38,098 | $5,131,420 | |
| Honeywell International, Inc. | 44,833 | 9,321,229 | |
| 14,452,649 | |||
| Industrial Gases–0.60% | |||
| Air Products and Chemicals, Inc.(b) | 15,305 | 4,267,799 | |
| Linde PLC | 33,096 | 15,828,162 | |
| 20,095,961 | |||
| Industrial Machinery & Supplies & Components–0.79% | |||
| Dover Corp. | 9,462 | 1,760,216 | |
| Fortive Corp. | 24,237 | 1,803,233 | |
| IDEX Corp. | 5,211 | 1,075,967 | |
| Illinois Tool Works, Inc. | 18,695 | 4,733,200 | |
| Ingersoll Rand, Inc. | 27,775 | 2,540,024 | |
| Nordson Corp. | 3,741 | 959,791 | |
| Otis Worldwide Corp. | 27,837 | 2,635,885 | |
| Parker-Hannifin Corp. | 8,850 | 5,311,770 | |
| Pentair PLC | 11,430 | 1,013,727 | |
| Snap-on, Inc. | 3,630 | 1,029,976 | |
| Stanley Black & Decker, Inc. | 10,594 | 1,084,402 | |
| Xylem, Inc. | 16,692 | 2,295,651 | |
| 26,243,842 | |||
| Industrial REITs–0.24% | |||
| Prologis, Inc. | 63,743 | 8,147,630 | |
| Insurance Brokers–0.63% | |||
| Aon PLC, Class A | 14,970 | 5,145,488 | |
| Arthur J. Gallagher & Co. | 15,043 | 4,401,131 | |
| Brown & Brown, Inc. | 16,300 | 1,713,619 | |
| Marsh & McLennan Cos., Inc. | 33,923 | 7,717,822 | |
| Willis Towers Watson PLC | 7,039 | 2,056,162 | |
| 21,034,222 | |||
| Integrated Oil & Gas–1.69% | |||
| Chevron Corp. | 118,003 | 17,458,544 | |
| Exxon Mobil Corp.(e) | 308,847 | 36,425,415 | |
| Occidental Petroleum Corp. | 45,782 | 2,608,658 | |
| 56,492,617 | |||
| Integrated Telecommunication Services–0.66% | |||
| AT&T, Inc. | 493,652 | 9,823,675 | |
| Verizon Communications, Inc. | 289,799 | 12,107,802 | |
| 21,931,477 | |||
| Interactive Home Entertainment–0.13% | |||
| Electronic Arts, Inc.(b) | 16,750 | 2,542,985 | |
| Take-Two Interactive Software, Inc.(c) | 10,933 | 1,767,975 | |
| 4,310,960 | |||
| Interactive Media & Services–6.03% | |||
| Alphabet, Inc., Class A | 404,413 | 66,072,996 | |
| Alphabet, Inc., Class C | 336,446 | 55,550,599 | |
| Match Group, Inc.(b)(c) | 18,291 | 680,608 | |
| Meta Platforms, Inc., Class A | 150,877 | 78,653,689 | |
| 200,957,892 | |||
| Internet Services & Infrastructure–0.11% | |||
| Akamai Technologies, Inc.(c) | 10,487 | 1,067,996 | |
| GoDaddy, Inc., Class A(c) | 9,704 | 1,624,547 | |
| 5 | Invesco S&P 500 Index Fund |
| Shares | Value | ||
| Internet Services & Infrastructure–(continued) | |||
| VeriSign, Inc.(c) | 5,966 | $1,097,147 | |
| 3,789,690 | |||
| Investment Banking & Brokerage–0.85% | |||
| Charles Schwab Corp. (The) | 102,784 | 6,691,238 | |
| Goldman Sachs Group, Inc. (The) | 22,201 | 11,328,060 | |
| Morgan Stanley | 86,155 | 8,926,520 | |
| Raymond James Financial, Inc.(b) | 12,844 | 1,535,757 | |
| 28,481,575 | |||
| IT Consulting & Other Services–1.01% | |||
| Accenture PLC, Class A (Ireland) | 43,287 | 14,801,990 | |
| Cognizant Technology Solutions Corp., Class A | 34,231 | 2,662,145 | |
| EPAM Systems, Inc.(c) | 3,991 | 801,233 | |
| Gartner, Inc.(c) | 5,345 | 2,629,526 | |
| International Business Machines Corp. | 63,244 | 12,783,510 | |
| 33,678,404 | |||
| Leisure Products–0.02% | |||
| Hasbro, Inc. | 9,010 | 614,122 | |
| Life & Health Insurance–0.36% | |||
| Aflac, Inc. | 35,600 | 3,928,816 | |
| Globe Life, Inc. | 5,781 | 607,294 | |
| MetLife, Inc. | 41,126 | 3,186,442 | |
| Principal Financial Group, Inc. | 14,846 | 1,208,761 | |
| Prudential Financial, Inc. | 24,716 | 2,994,591 | |
| 11,925,904 | |||
| Life Sciences Tools & Services–1.28% | |||
| Agilent Technologies, Inc. | 20,176 | 2,883,554 | |
| Bio-Rad Laboratories, Inc., Class A(b)(c) | 1,404 | 473,597 | |
| Bio-Techne Corp. | 10,849 | 802,718 | |
| Charles River Laboratories International, Inc.(c) | 3,546 | 701,222 | |
| Danaher Corp. | 45,385 | 12,222,634 | |
| IQVIA Holdings, Inc.(c) | 12,544 | 3,155,443 | |
| Mettler-Toledo International, Inc.(c) | 1,470 | 2,115,448 | |
| Revvity, Inc. | 8,495 | 1,040,977 | |
| Thermo Fisher Scientific, Inc. | 26,280 | 16,164,040 | |
| Waters Corp.(c) | 4,084 | 1,414,493 | |
| West Pharmaceutical Services, Inc. | 5,015 | 1,572,854 | |
| 42,546,980 | |||
| Managed Health Care–1.61% | |||
| Centene Corp.(c) | 36,741 | 2,896,293 | |
| Elevance Health, Inc. | 16,002 | 8,911,354 | |
| Humana, Inc. | 8,296 | 2,940,683 | |
| Molina Healthcare, Inc.(c) | 4,034 | 1,411,053 | |
| UnitedHealth Group, Inc. | 63,367 | 37,399,203 | |
| 53,558,586 | |||
| Metal, Glass & Plastic Containers–0.04% | |||
| Ball Corp. | 21,369 | 1,363,556 | |
| Movies & Entertainment–1.03% | |||
| Live Nation Entertainment, Inc.(c) | 9,807 | 957,850 | |
| Netflix, Inc.(c) | 29,667 | 20,806,951 | |
| Walt Disney Co. (The) | 125,513 | 11,343,865 | |
| Warner Bros. Discovery, Inc.(c) | 153,516 | 1,203,565 | |
| 34,312,231 | |||
| Shares | Value | ||
| Multi-Family Residential REITs–0.25% | |||
| AvalonBay Communities, Inc. | 9,776 | $2,206,736 | |
| Camden Property Trust | 7,335 | 918,342 | |
| Equity Residential | 23,743 | 1,777,876 | |
| Essex Property Trust, Inc. | 4,421 | 1,334,214 | |
| Mid-America Apartment Communities, Inc. | 8,043 | 1,305,942 | |
| UDR, Inc. | 20,858 | 928,389 | |
| 8,471,499 | |||
| Multi-line Insurance–0.11% | |||
| American International Group, Inc. | 45,692 | 3,520,569 | |
| Multi-Sector Holdings–1.78% | |||
| Berkshire Hathaway, Inc., Class B(c) | 124,640 | 59,318,669 | |
| Multi-Utilities–0.63% | |||
| Ameren Corp. | 18,360 | 1,514,884 | |
| CenterPoint Energy, Inc. | 44,044 | 1,202,401 | |
| CMS Energy Corp. | 20,560 | 1,395,202 | |
| Consolidated Edison, Inc. | 23,810 | 2,418,144 | |
| Dominion Energy, Inc. | 57,709 | 3,225,933 | |
| DTE Energy Co. | 14,247 | 1,781,160 | |
| NiSource, Inc. | 30,865 | 1,020,397 | |
| Public Service Enterprise Group, Inc. | 34,292 | 2,769,079 | |
| Sempra | 43,570 | 3,580,582 | |
| WEC Energy Group, Inc.(b) | 21,744 | 2,022,844 | |
| 20,930,626 | |||
| Office REITs–0.02% | |||
| BXP, Inc. | 9,948 | 748,289 | |
| Oil & Gas Equipment & Services–0.26% | |||
| Baker Hughes Co., Class A | 68,710 | 2,416,531 | |
| Halliburton Co. | 60,951 | 1,894,966 | |
| Schlumberger N.V. | 98,407 | 4,328,924 | |
| 8,640,421 | |||
| Oil & Gas Exploration & Production–0.77% | |||
| APA Corp. | 24,789 | 706,238 | |
| ConocoPhillips | 80,520 | 9,162,371 | |
| Coterra Energy, Inc. | 51,239 | 1,246,645 | |
| Devon Energy Corp. | 43,512 | 1,948,467 | |
| Diamondback Energy, Inc. | 12,279 | 2,395,756 | |
| EOG Resources, Inc. | 39,568 | 5,097,150 | |
| EQT Corp. | 41,957 | 1,405,979 | |
| Hess Corp. | 19,028 | 2,627,006 | |
| Marathon Oil Corp. | 38,833 | 1,112,565 | |
| 25,702,177 | |||
| Oil & Gas Refining & Marketing–0.35% | |||
| Marathon Petroleum Corp. | 24,257 | 4,296,400 | |
| Phillips 66 | 29,188 | 4,095,368 | |
| Valero Energy Corp. | 22,513 | 3,303,333 | |
| 11,695,101 | |||
| Oil & Gas Storage & Transportation–0.38% | |||
| Kinder Morgan, Inc. | 132,936 | 2,867,430 | |
| ONEOK, Inc. | 40,183 | 3,711,302 | |
| Targa Resources Corp. | 15,265 | 2,242,428 | |
| Williams Cos., Inc. (The) | 83,909 | 3,840,515 | |
| 12,661,675 | |||
| 6 | Invesco S&P 500 Index Fund |
| Shares | Value | ||
| Other Specialized REITs–0.14% | |||
| Iron Mountain, Inc. | 20,182 | $2,285,813 | |
| VICI Properties, Inc.(b) | 71,821 | 2,404,567 | |
| 4,690,380 | |||
| Other Specialty Retail–0.11% | |||
| Bath & Body Works, Inc.(b) | 15,399 | 473,673 | |
| Tractor Supply Co.(b) | 7,423 | 1,986,024 | |
| Ulta Beauty, Inc.(c) | 3,300 | 1,164,372 | |
| 3,624,069 | |||
| Packaged Foods & Meats–0.64% | |||
| Campbell Soup Co. | 13,546 | 673,507 | |
| Conagra Brands, Inc. | 32,914 | 1,026,917 | |
| General Mills, Inc.(b) | 38,868 | 2,809,768 | |
| Hershey Co. (The)(b) | 10,163 | 1,962,069 | |
| Hormel Foods Corp. | 19,985 | 650,512 | |
| J.M. Smucker Co. (The) | 7,310 | 838,311 | |
| Kellanova | 18,124 | 1,460,976 | |
| Kraft Heinz Co. (The) | 54,341 | 1,925,301 | |
| Lamb Weston Holdings, Inc. | 9,941 | 615,547 | |
| McCormick & Co., Inc. | 17,332 | 1,387,080 | |
| Mondelez International, Inc., Class A | 92,350 | 6,631,653 | |
| Tyson Foods, Inc., Class A | 19,692 | 1,266,392 | |
| 21,248,033 | |||
| Paper & Plastic Packaging Products & Materials–0.20% | |||
| Amcor PLC | 99,509 | 1,138,383 | |
| Avery Dennison Corp. | 5,546 | 1,230,380 | |
| International Paper Co.(b) | 23,913 | 1,157,868 | |
| Packaging Corp. of America | 6,137 | 1,285,947 | |
| Smurfit WestRock PLC | 36,700 | 1,740,314 | |
| 6,552,892 | |||
| Passenger Airlines–0.14% | |||
| American Airlines Group, Inc.(b)(c) | 45,171 | 479,716 | |
| Delta Air Lines, Inc. | 44,428 | 1,887,746 | |
| Southwest Airlines Co. | 41,203 | 1,191,591 | |
| United Airlines Holdings, Inc.(c) | 22,637 | 996,933 | |
| 4,555,986 | |||
| Passenger Ground Transportation–0.32% | |||
| Uber Technologies, Inc.(c) | 143,859 | 10,520,409 | |
| Personal Care Products–0.13% | |||
| Estee Lauder Cos., Inc. (The), Class A | 16,043 | 1,470,501 | |
| Kenvue, Inc. | 131,831 | 2,893,691 | |
| 4,364,192 | |||
| Pharmaceuticals–3.80% | |||
| Bristol-Myers Squibb Co. | 139,562 | 6,971,122 | |
| Catalent, Inc.(c) | 12,460 | 759,562 | |
| Eli Lilly and Co. | 54,964 | 52,766,539 | |
| Johnson & Johnson | 165,695 | 27,482,173 | |
| Merck & Co., Inc. | 174,379 | 20,655,193 | |
| Pfizer, Inc. | 390,134 | 11,317,787 | |
| Viatris, Inc. | 81,976 | 990,270 | |
| Zoetis, Inc. | 31,415 | 5,764,338 | |
| 126,706,984 | |||
| Property & Casualty Insurance–1.05% | |||
| Allstate Corp. (The) | 18,170 | 3,433,040 | |
| Shares | Value | ||
| Property & Casualty Insurance–(continued) | |||
| Arch Capital Group Ltd.(c) | 25,747 | $2,911,728 | |
| Assurant, Inc. | 3,579 | 702,737 | |
| Chubb Ltd. | 27,956 | 7,944,536 | |
| Cincinnati Financial Corp. | 10,779 | 1,477,046 | |
| Hartford Financial Services Group, Inc. (The) | 20,362 | 2,364,028 | |
| Loews Corp. | 12,500 | 1,024,250 | |
| Progressive Corp. (The) | 40,324 | 10,169,713 | |
| Travelers Cos., Inc. (The) | 15,766 | 3,595,752 | |
| W.R. Berkley Corp. | 20,857 | 1,245,163 | |
| 34,867,993 | |||
| Publishing–0.03% | |||
| News Corp., Class A | 26,108 | 739,640 | |
| News Corp., Class B | 7,877 | 231,820 | |
| 971,460 | |||
| Rail Transportation–0.58% | |||
| CSX Corp. | 134,593 | 4,612,502 | |
| Norfolk Southern Corp. | 15,554 | 3,984,313 | |
| Union Pacific Corp. | 42,006 | 10,757,316 | |
| 19,354,131 | |||
| Real Estate Services–0.14% | |||
| CBRE Group, Inc., Class A(c) | 20,765 | 2,390,882 | |
| CoStar Group, Inc.(c) | 28,114 | 2,173,212 | |
| 4,564,094 | |||
| Regional Banks–0.31% | |||
| Citizens Financial Group, Inc. | 31,327 | 1,348,627 | |
| Huntington Bancshares, Inc. | 99,778 | 1,493,677 | |
| M&T Bank Corp. | 11,488 | 1,977,200 | |
| Regions Financial Corp. | 63,053 | 1,476,701 | |
| Truist Financial Corp. | 92,125 | 4,095,877 | |
| 10,392,082 | |||
| Reinsurance–0.03% | |||
| Everest Group Ltd. | 2,992 | 1,173,582 | |
| Research & Consulting Services–0.24% | |||
| Equifax, Inc. | 8,510 | 2,613,676 | |
| Jacobs Solutions, Inc. | 8,621 | 1,300,736 | |
| Leidos Holdings, Inc. | 9,309 | 1,475,570 | |
| Verisk Analytics, Inc. | 9,823 | 2,679,911 | |
| 8,069,893 | |||
| Restaurants–0.96% | |||
| Chipotle Mexican Grill, Inc.(c) | 94,550 | 5,302,364 | |
| Darden Restaurants, Inc.(b) | 8,218 | 1,299,677 | |
| Domino’s Pizza, Inc. | 2,401 | 994,518 | |
| McDonald’s Corp. | 49,618 | 14,322,732 | |
| Starbucks Corp. | 77,984 | 7,374,947 | |
| Yum! Brands, Inc. | 19,390 | 2,616,099 | |
| 31,910,337 | |||
| Retail REITs–0.30% | |||
| Federal Realty Investment Trust | 5,140 | 591,100 | |
| Kimco Realty Corp. | 45,947 | 1,068,727 | |
| Realty Income Corp. | 59,951 | 3,723,557 | |
| Regency Centers Corp. | 11,322 | 822,996 | |
| 7 | Invesco S&P 500 Index Fund |
| Shares | Value | ||
| Retail REITs–(continued) | |||
| Simon Property Group, Inc. | 22,440 | $3,755,334 | |
| 9,961,714 | |||
| Self-Storage REITs–0.19% | |||
| Extra Space Storage, Inc. | 14,577 | 2,580,129 | |
| Public Storage | 10,888 | 3,742,423 | |
| 6,322,552 | |||
| Semiconductor Materials & Equipment–0.87% | |||
| Applied Materials, Inc. | 57,206 | 11,284,455 | |
| Enphase Energy, Inc.(c) | 9,368 | 1,133,903 | |
| KLA Corp. | 9,270 | 7,596,116 | |
| Lam Research Corp. | 9,001 | 7,389,911 | |
| Teradyne, Inc. | 10,748 | 1,469,574 | |
| 28,873,959 | |||
| Semiconductors–9.98% | |||
| Advanced Micro Devices, Inc.(c) | 111,280 | 16,531,757 | |
| Analog Devices, Inc. | 34,142 | 8,017,907 | |
| Broadcom, Inc. | 299,910 | 48,831,346 | |
| First Solar, Inc.(c) | 7,370 | 1,675,717 | |
| Intel Corp. | 293,086 | 6,459,615 | |
| Microchip Technology, Inc. | 37,205 | 3,056,763 | |
| Micron Technology, Inc. | 76,240 | 7,337,338 | |
| Monolithic Power Systems, Inc. | 3,351 | 3,132,113 | |
| NVIDIA Corp. | 1,692,340 | 202,014,626 | |
| NXP Semiconductors N.V. (China) | 17,603 | 4,512,705 | |
| ON Semiconductor Corp.(c) | 29,621 | 2,306,587 | |
| Qorvo, Inc.(c) | 6,647 | 770,321 | |
| QUALCOMM, Inc. | 76,972 | 13,493,191 | |
| Skyworks Solutions, Inc. | 11,046 | 1,210,531 | |
| Texas Instruments, Inc. | 62,685 | 13,435,903 | |
| 332,786,420 | |||
| Single-Family Residential REITs–0.04% | |||
| Invitation Homes, Inc. | 39,642 | 1,460,411 | |
| Soft Drinks & Non-alcoholic Beverages–1.22% | |||
| Coca-Cola Co. (The) | 266,935 | 19,344,780 | |
| Keurig Dr Pepper, Inc. | 71,863 | 2,630,904 | |
| Monster Beverage Corp.(c) | 48,833 | 2,301,499 | |
| PepsiCo, Inc. | 94,651 | 16,363,265 | |
| 40,640,448 | |||
| Specialty Chemicals–0.58% | |||
| Albemarle Corp.(b) | 8,092 | 730,303 | |
| Celanese Corp. | 6,918 | 903,491 | |
| DuPont de Nemours, Inc. | 28,786 | 2,425,220 | |
| Eastman Chemical Co. | 8,100 | 829,197 | |
| Ecolab, Inc. | 17,498 | 4,430,144 | |
| International Flavors & Fragrances, Inc. | 17,580 | 1,828,144 | |
| PPG Industries, Inc. | 16,204 | 2,102,145 | |
| Sherwin-Williams Co. (The) | 16,060 | 5,932,082 | |
| 19,180,726 | |||
| Steel–0.11% | |||
| Nucor Corp. | 16,507 | 2,507,579 | |
| Steel Dynamics, Inc. | 10,169 | 1,215,297 | |
| 3,722,876 | |||
| Shares | Value | ||
| Systems Software–7.73% | |||
| CrowdStrike Holdings, Inc., Class A(c) | 15,881 | $4,403,484 | |
| Fortinet, Inc.(c) | 43,654 | 3,348,698 | |
| Gen Digital, Inc. | 37,936 | 1,003,787 | |
| Microsoft Corp. | 511,345 | 213,302,453 | |
| Oracle Corp. | 109,753 | 15,507,001 | |
| Palo Alto Networks, Inc.(c) | 22,245 | 8,068,707 | |
| ServiceNow, Inc.(c) | 14,114 | 12,067,470 | |
| 257,701,600 | |||
| Technology Distributors–0.06% | |||
| CDW Corp. | 9,253 | 2,087,847 | |
| Technology Hardware, Storage & Peripherals–7.11% | |||
| Apple, Inc. | 991,666 | 227,091,514 | |
| Hewlett Packard Enterprise Co. | 89,502 | 1,733,654 | |
| HP, Inc. | 59,419 | 2,149,779 | |
| NetApp, Inc. | 14,209 | 1,715,310 | |
| Seagate Technology Holdings PLC | 13,445 | 1,338,450 | |
| Super Micro Computer, Inc.(c) | 3,467 | 1,517,506 | |
| Western Digital Corp.(c) | 22,481 | 1,474,529 | |
| 237,020,742 | |||
| Telecom Tower REITs–0.37% | |||
| American Tower Corp. | 32,150 | 7,203,529 | |
| Crown Castle, Inc. | 29,916 | 3,351,190 | |
| SBA Communications Corp., Class A | 7,397 | 1,676,604 | |
| 12,231,323 | |||
| Timber REITs–0.05% | |||
| Weyerhaeuser Co. | 50,191 | 1,530,324 | |
| Tobacco–0.59% | |||
| Altria Group, Inc. | 118,255 | 6,358,571 | |
| Philip Morris International, Inc. | 107,028 | 13,195,482 | |
| 19,554,053 | |||
| Trading Companies & Distributors–0.27% | |||
| Fastenal Co. | 39,419 | 2,691,530 | |
| United Rentals, Inc. | 4,585 | 3,398,677 | |
| W.W. Grainger, Inc. | 3,011 | 2,965,594 | |
| 9,055,801 | |||
| Transaction & Payment Processing Services–2.31% | |||
| Corpay, Inc.(c) | 4,838 | 1,526,631 | |
| Fidelity National Information Services, Inc. | 38,297 | 3,157,588 | |
| Fiserv, Inc.(c) | 40,283 | 7,033,412 | |
| Global Payments, Inc. | 17,573 | 1,950,779 | |
| Jack Henry & Associates, Inc. | 5,019 | 868,437 | |
| Mastercard, Inc., Class A | 56,524 | 27,320,310 | |
| PayPal Holdings, Inc.(c) | 72,018 | 5,216,264 | |
| Visa, Inc., Class A | 108,377 | 29,952,151 | |
| 77,025,572 | |||
| Water Utilities–0.06% | |||
| American Water Works Co., Inc. | 13,413 | 1,919,669 | |
| Wireless Telecommunication Services–0.21% | |||
| T-Mobile US, Inc. | 35,499 | 7,054,361 | |
| Total Common Stocks & Other Equity Interests (Cost $1,158,406,900) | 3,265,134,269 | ||
| 8 | Invesco S&P 500 Index Fund |
| Shares | Value | ||
| Money Market Funds–2.02% | |||
| Invesco Government & Agency Portfolio, Institutional Class, 5.18%(d)(f) | 24,278,577 | $24,278,577 | |
| Invesco Treasury Portfolio, Institutional Class, 5.15%(d)(f) | 43,163,953 | 43,163,953 | |
| Total Money Market Funds (Cost $67,442,530) | 67,442,530 | ||
| TOTAL INVESTMENTS IN SECURITIES (excluding investments purchased with cash collateral from securities on loan)-99.94% (Cost $1,225,849,430) | 3,332,576,799 | ||
| Investments Purchased with Cash Collateral from Securities on Loan | |||
| Money Market Funds–1.19% | |||
| Invesco Private Government Fund, 5.28%(d)(f)(g) | 10,996,870 | 10,996,870 | |
| Shares | Value | ||
| Money Market Funds–(continued) | |||
| Invesco Private Prime Fund, 5.46%(d)(f)(g) | 28,730,046 | $28,741,538 | |
| Total Investments Purchased with Cash Collateral from Securities on Loan (Cost $39,737,146) | 39,738,408 | ||
| TOTAL INVESTMENTS IN SECURITIES–101.13% (Cost $1,265,586,576) | 3,372,315,207 | ||
| OTHER ASSETS LESS LIABILITIES—(1.13)% | (37,724,038) | ||
| NET ASSETS–100.00% | $3,334,591,169 | ||
| REIT | – Real Estate Investment Trust |
| (a) | Industry and/or sector classifications used in this report are generally according to the Global Industry Classification Standard, which was developed by and is the exclusive property and a service mark of MSCI Inc. and Standard & Poor’s. |
| (b) | All or a portion of this security was out on loan at August 31, 2024. |
| (c) | Non-income producing security. |
| (d) | Affiliated holding. Affiliated holdings are investments in entities which are under common ownership or control of Invesco Ltd. or are investments in entities in which the Fund owns 5% or more of the outstanding voting securities. The table below shows the Fund’s transactions in, and earnings from, its investments in affiliates for the fiscal year ended August 31, 2024. |
| Value August 31, 2023 | Purchases at Cost | Proceeds from Sales | Change in Unrealized Appreciation (Depreciation) | Realized Gain | Value August 31, 2024 | Dividend Income | |
| Invesco Ltd. | $455,471 | $35,118 | $- | $38,688 | $- | $529,277 | $23,804 |
| Investments in Affiliated Money Market Funds: | |||||||
| Invesco Government & Agency Portfolio, Institutional Class | 28,598,847 | 102,616,318 | (106,936,588) | - | - | 24,278,577 | 1,286,781 |
| Invesco Liquid Assets Portfolio, Institutional Class | 18,499,332 | 68,878,196 | (87,381,111) | (2,393) | 5,976 | - | 756,070 |
| Invesco Treasury Portfolio, Institutional Class | 32,684,397 | 136,748,006 | (126,268,450) | - | - | 43,163,953 | 1,550,257 |
| Investments Purchased with Cash Collateral from Securities on Loan: | |||||||
| Invesco Private Government Fund | 14,324,601 | 208,354,426 | (211,682,157) | - | - | 10,996,870 | 727,281* |
| Invesco Private Prime Fund | 36,834,686 | 484,579,570 | (492,683,184) | 1,440 | 9,026 | 28,741,538 | 1,978,825* |
| Total | $131,397,334 | $1,001,211,634 | $(1,024,951,490) | $37,735 | $15,002 | $107,710,215 | $6,323,018 |
| * | Represents the income earned on the investment of cash collateral, which is included in securities lending income on the Statement of Operations. Does not include rebates and fees paid to lending agent or premiums received from borrowers, if any. |
| (e) | All or a portion of the value was pledged as collateral to cover margin requirements for open futures contracts. See Note 1J. |
| (f) | The rate shown is the 7-day SEC standardized yield as of August 31, 2024. |
| (g) | The security has been segregated to satisfy the commitment to return the cash collateral received in securities lending transactions upon the borrower’s return of the securities loaned. See Note 1I. |
| Open Futures Contracts | |||||
| Long Futures Contracts | Number of Contracts | Expiration Month | Notional Value | Value | Unrealized Appreciation |
| Equity Risk | |||||
| E-Mini S&P 500 Index | 252 | September-2024 | $71,328,600 | $1,638,672 | $1,638,672 |
| 9 | Invesco S&P 500 Index Fund |
| Assets: | |
| Investments in unaffiliated securities, at value (Cost $1,157,780,647)* | $3,264,604,992 |
| Investments in affiliates, at value (Cost $107,805,929) | 107,710,215 |
| Other investments: | |
| Variation margin receivable — futures contracts | 644,336 |
| Receivable for: | |
| Fund shares sold | 1,240,816 |
| Dividends | 4,059,630 |
| Investment for trustee deferred compensation and retirement plans | 87,837 |
| Other assets | 75,348 |
| Total assets | 3,378,423,174 |
| Liabilities: | |
| Payable for: | |
| Fund shares reacquired | 2,306,245 |
| Collateral upon return of securities loaned | 39,737,146 |
| Accrued fees to affiliates | 1,445,547 |
| Accrued trustees’ and officers’ fees and benefits | 4,617 |
| Accrued other operating expenses | 242,404 |
| Trustee deferred compensation and retirement plans | 96,046 |
| Total liabilities | 43,832,005 |
| Net assets applicable to shares outstanding | $3,334,591,169 |
| Net assets consist of: | |
| Shares of beneficial interest | $1,217,388,955 |
| Distributable earnings | 2,117,202,214 |
| $3,334,591,169 |
| Net Assets: | |
| Class A | $2,328,664,538 |
| Class C | $394,607,612 |
| Class Y | $542,736,380 |
| Class R6 | $68,582,639 |
| Shares outstanding, no par value, with an unlimited number of shares authorized: | |
| Class A | 38,883,673 |
| Class C | 6,922,826 |
| Class Y | 8,907,195 |
| Class R6 | 1,123,512 |
| Class A: | |
| Net asset value per share | $59.89 |
| Maximum offering price per share (Net asset value of $59.89 ÷ 94.50%) | $63.38 |
| Class C: | |
| Net asset value and offering price per share | $57.00 |
| Class Y: | |
| Net asset value and offering price per share | $60.93 |
| Class R6: | |
| Net asset value and offering price per share | $61.04 |
| * | At August 31, 2024, securities with an aggregate value of $39,083,142 were on loan to brokers. |
| 10 | Invesco S&P 500 Index Fund |
| Investment income: | |
| Dividends (net of foreign withholding taxes of $11,396) | $40,258,922 |
| Dividends from affiliates (includes net securities lending income of $74,575) | 3,691,487 |
| Total investment income | 43,950,409 |
| Expenses: | |
| Advisory fees | 3,251,201 |
| Administrative services fees | 408,932 |
| Custodian fees | 24,262 |
| Distribution fees: | |
| Class A | 4,862,875 |
| Class C | 3,581,218 |
| Transfer agent fees — A, C and Y | 3,535,194 |
| Transfer agent fees — R6 | 13,945 |
| Trustees’ and officers’ fees and benefits | 45,374 |
| Registration and filing fees | 122,648 |
| Licensing fees | 453,552 |
| Reports to shareholders | 196,181 |
| Professional services fees | 76,147 |
| Other | 43,508 |
| Total expenses | 16,615,037 |
| Less: Fees waived and/or expense offset arrangement(s) | (125,274) |
| Net expenses | 16,489,763 |
| Net investment income | 27,460,646 |
| Realized and unrealized gain (loss) from: | |
| Net realized gain (loss) from: | |
| Unaffiliated investment securities | (563,741) |
| Affiliated investment securities | 15,002 |
| Futures contracts | 14,753,572 |
| 14,204,833 | |
| Change in net unrealized appreciation (depreciation) of: | |
| Unaffiliated investment securities | 642,476,941 |
| Affiliated investment securities | 37,735 |
| Futures contracts | (117,166) |
| 642,397,510 | |
| Net realized and unrealized gain | 656,602,343 |
| Net increase in net assets resulting from operations | $684,062,989 |
| 11 | Invesco S&P 500 Index Fund |
| 2024 | 2023 | |
| Operations: | ||
| Net investment income | $27,460,646 | $24,067,056 |
| Net realized gain | 14,204,833 | 70,075 |
| Change in net unrealized appreciation | 642,397,510 | 297,426,228 |
| Net increase in net assets resulting from operations | 684,062,989 | 321,563,359 |
| Distributions to shareholders from distributable earnings: | ||
| Class A | (18,907,771) | (14,619,410) |
| Class C | (1,387,800) | (2,697,142) |
| Class Y | (5,892,777) | (3,119,500) |
| Class R6 | (346,442) | (201,236) |
| Total distributions from distributable earnings | (26,534,790) | (20,637,288) |
| Share transactions–net: | ||
| Class A | 195,059,555 | 83,378,064 |
| Class C | (17,252,549) | (39,240,029) |
| Class Y | (20,307,765) | 114,438,275 |
| Class R6 | 32,999,403 | 4,627,333 |
| Net increase in net assets resulting from share transactions | 190,498,644 | 163,203,643 |
| Net increase in net assets | 848,026,843 | 464,129,714 |
| Net assets: | ||
| Beginning of year | 2,486,564,326 | 2,022,434,612 |
| End of year | $3,334,591,169 | $2,486,564,326 |
| 12 | Invesco S&P 500 Index Fund |
| Net asset value, beginning of period | Net investment income(a) | Net gains (losses) on securities (both realized and unrealized) | Total from investment operations | Dividends from net investment income | Distributions from net realized gains | Total distributions | Net asset value, end of period | Total return(b) | Net assets, end of period (000’s omitted) | Ratio of expenses to average net assets with fee waivers and/or expenses absorbed | Ratio of expenses to average net assets without fee waivers and/or expenses absorbed | Ratio of net investment income to average net assets | Portfolio turnover (c) | |
| Class A | ||||||||||||||
| Year ended 08/31/24 | $47.86 | $0.53 | $12.02 | $12.55 | $(0.52) | $— | $(0.52) | $59.89 | 26.45% | $2,328,665 | 0.54% | 0.54% | 1.00% | 1% |
| Year ended 08/31/23 | 41.94 | 0.51 | 5.84 | 6.35 | (0.43) | — | (0.43) | 47.86 | 15.33 | 1,681,628 | 0.54 | 0.54 | 1.18 | 2 |
| Year ended 08/31/22 | 48.42 | 0.44 | (5.97) | (5.53) | (0.39) | (0.56) | (0.95) | 41.94 | (11.70) | 1,392,433 | 0.54 | 0.54 | 0.95 | 2 |
| Year ended 08/31/21 | 37.59 | 0.39 | 10.94 | 11.33 | (0.43) | (0.07) | (0.50) | 48.42 | 30.46 | 1,544,523 | 0.54 | 0.54 | 0.93 | 5 |
| Year ended 08/31/20 | 31.59 | 0.45 | 6.21 | 6.66 | (0.45) | (0.21) | (0.66) | 37.59 | 21.33(d) | 1,147,062 | 0.54(d) | 0.54(d) | 1.36(d) | 2 |
| Class C | ||||||||||||||
| Year ended 08/31/24 | 45.60 | 0.13 | 11.46 | 11.59 | (0.19) | — | (0.19) | 57.00 | 25.50 | 394,608 | 1.29 | 1.29 | 0.25 | 1 |
| Year ended 08/31/23 | 40.17 | 0.18 | 5.58 | 5.76 | (0.33) | — | (0.33) | 45.60 | 14.49(e) | 330,698 | 1.28(e) | 1.28(e) | 0.44(e) | 2 |
| Year ended 08/31/22 | 46.48 | 0.09 | (5.75) | (5.66) | (0.09) | (0.56) | (0.65) | 40.17 | (12.38) | 329,140 | 1.29 | 1.29 | 0.20 | 2 |
| Year ended 08/31/21 | 36.09 | 0.12 | 10.52 | 10.64 | (0.18) | (0.07) | (0.25) | 46.48 | 29.65(e) | 400,963 | 1.18(e) | 1.18(e) | 0.29(e) | 5 |
| Year ended 08/31/20 | 30.36 | 0.19 | 5.96 | 6.15 | (0.21) | (0.21) | (0.42) | 36.09 | 20.41 | 353,371 | 1.30 | 1.30 | 0.60 | 2 |
| Class Y | ||||||||||||||
| Year ended 08/31/24 | 48.67 | 0.67 | 12.22 | 12.89 | (0.63) | — | (0.63) | 60.93 | 26.75 | 542,736 | 0.29 | 0.29 | 1.25 | 1 |
| Year ended 08/31/23 | 42.57 | 0.63 | 5.94 | 6.57 | (0.47) | — | (0.47) | 48.67 | 15.63 | 450,318 | 0.29 | 0.29 | 1.43 | 2 |
| Year ended 08/31/22 | 49.12 | 0.56 | (6.05) | (5.49) | (0.50) | (0.56) | (1.06) | 42.57 | (11.48) | 284,424 | 0.29 | 0.29 | 1.20 | 2 |
| Year ended 08/31/21 | 38.11 | 0.50 | 11.10 | 11.60 | (0.52) | (0.07) | (0.59) | 49.12 | 30.80 | 286,102 | 0.29 | 0.29 | 1.18 | 5 |
| Year ended 08/31/20 | 32.01 | 0.53 | 6.30 | 6.83 | (0.52) | (0.21) | (0.73) | 38.11 | 21.62 | 203,430 | 0.30 | 0.30 | 1.60 | 2 |
| Class R6 | ||||||||||||||
| Year ended 08/31/24 | 48.75 | 0.74 | 12.22 | 12.96 | (0.67) | — | (0.67) | 61.04 | 26.87 | 68,583 | 0.19 | 0.19 | 1.35 | 1 |
| Year ended 08/31/23 | 42.61 | 0.67 | 5.95 | 6.62 | (0.48) | — | (0.48) | 48.75 | 15.74 | 23,920 | 0.20 | 0.20 | 1.52 | 2 |
| Year ended 08/31/22 | 49.15 | 0.60 | (6.05) | (5.45) | (0.53) | (0.56) | (1.09) | 42.61 | (11.40) | 16,438 | 0.20 | 0.20 | 1.29 | 2 |
| Year ended 08/31/21 | 38.13 | 0.53 | 11.09 | 11.62 | (0.53) | (0.07) | (0.60) | 49.15 | 30.86 | 12,765 | 0.24 | 0.24 | 1.23 | 5 |
| Year ended 08/31/20 | 32.02 | 0.55 | 6.31 | 6.86 | (0.54) | (0.21) | (0.75) | 38.13 | 21.70 | 8,020 | 0.24 | 0.24 | 1.66 | 2 |
| (a) | Calculated using average shares outstanding. |
| (b) | Includes adjustments in accordance with accounting principles generally accepted in the United States of America and as such, the net asset value for financial reporting purposes and the returns based upon those net asset values may differ from the net asset value and returns for shareholder transactions. Does not include sales charges and is not annualized for periods less than one year, if applicable. |
| (c) | Portfolio turnover is calculated at the fund level and is not annualized for periods less than one year, if applicable. |
| (d) | The total return, ratios of expenses to average net assets and ratio of net investment income to average net assets reflect actual 12b-1 fees of 0.24% for the year ended August 31, 2020, respectively. |
| (e) | The total return, ratios of expenses to average net assets and ratio of net investment income to average net assets reflect actual 12b-1 fees of 0.99% and 0.89% for the years ended August 31, 2023 and August 31, 2021, respectively. |
| 13 | Invesco S&P 500 Index Fund |
| A. | Security Valuations — Securities, including restricted securities, are valued according to the following policy. |
| 14 | Invesco S&P 500 Index Fund |
| B. | Securities Transactions and Investment Income – Securities transactions are accounted for on a trade date basis. Realized gains or losses on sales are computed on the basis of specific identification of the securities sold. Interest income (net of withholding tax, if any) is recorded on an accrual basis from settlement date and includes coupon interest and amortization of premium and accretion of discount on debt securities as applicable. Pay-in-kind interest income and non-cash dividend income received in the form of securities in lieu of cash are recorded at the fair value of the securities received. Dividend income (net of withholding tax, if any) is recorded on the ex-dividend date. |
| C. | Country Determination — For the purposes of making investment selection decisions and presentation in the Schedule of Investments, the investment adviser may determine the country in which an issuer is located and/or credit risk exposure based on various factors. These factors include the laws of the country under which the issuer is organized, where the issuer maintains a principal office, the country in which the issuer derives 50% or more of its total revenues, the country that has the primary market for the issuer’s securities and its "country of risk" as determined by a third party service provider, as well as other criteria. Among the other criteria that may be evaluated for making this determination are the country in which the issuer maintains 50% or more of its assets, the type of security, financial guarantees and enhancements, the nature of the collateral and the sponsor organization. Country of issuer and/or credit risk exposure has been determined to be the United States of America, unless otherwise noted. |
| D. | Distributions – Distributions from net investment income and net realized capital gain, if any, are generally declared and paid annually and recorded on the ex-dividend date. The Fund may elect to treat a portion of the proceeds from redemptions as distributions for federal income tax purposes. |
| E. | Federal Income Taxes – The Fund intends to comply with the requirements of Subchapter M of the Internal Revenue Code of 1986, as amended (the “Internal Revenue Code”), necessary to qualify as a regulated investment company and to distribute substantially all of the Fund’s taxable earnings to shareholders. As such, the Fund will not be subject to federal income taxes on otherwise taxable income (including net realized capital gain) that is distributed to shareholders. Therefore, no provision for federal income taxes is recorded in the financial statements. |
| F. | Expenses – Fees provided for under the Rule 12b-1 plan of a particular class of the Fund are charged to the operations of such class. Transfer agency fees and expenses and other shareholder recordkeeping fees and expenses attributable to Class R6 are charged to such class. Transfer agency fees and expenses and other shareholder recordkeeping fees and expenses relating to all other classes are allocated among those classes based on relative net assets. All other expenses are allocated among the classes based on relative net assets. |
| G. | Accounting Estimates – The preparation of financial statements in conformity with accounting principles generally accepted in the United States of America (“GAAP”) requires management to make estimates and assumptions that affect the reported amounts of assets and liabilities at the date of the financial statements and the reported amounts of revenues and expenses during the reporting period including estimates and assumptions related to taxation. Actual results could differ from those estimates by a significant amount. In addition, the Fund monitors for material events or transactions that may occur or become known after the period-end date and before the date the financial statements are released to print. |
| H. | Indemnifications – Under the Trust’s organizational documents, each Trustee, officer, employee or other agent of the Trust is indemnified against certain liabilities that may arise out of the performance of their duties to the Fund. Additionally, in the normal course of business, the Fund enters into contracts, including the Fund’s servicing agreements, that contain a variety of indemnification clauses. The Fund’s maximum exposure under these arrangements is unknown as this would involve future claims that may be made against the Fund that have not yet occurred. The risk of material loss as a result of such indemnification claims is considered remote. |
| I. | Securities Lending – The Fund may lend portfolio securities having a market value up to one-third of the Fund’s total assets. Such loans are secured by collateral equal to no less than the market value of the loaned securities determined daily by the securities lending provider. Such collateral will be cash or debt securities issued or guaranteed by the U.S. Government or any of its sponsored agencies. Cash collateral received in connection with these loans is invested in short-term money market instruments or affiliated, unregistered investment companies that comply with Rule 2a-7 under the 1940 Act and money market funds (collectively, "affiliated money market funds") and is shown as such on the Schedule of Investments. The Fund bears the risk of loss with respect to the investment of collateral. It is the Fund’s policy to obtain additional collateral from or return excess collateral to the borrower by the end of the next business day, following the valuation date of the securities loaned. Therefore, the value of the collateral held may be temporarily less than the value of the securities on loan. When loaning securities, the Fund retains certain benefits of owning the securities, including the economic equivalent of dividends or interest generated by the security. Lending securities entails a risk of loss to the Fund if, and to the extent that, the market value of the securities loaned were to increase and the borrower did not increase the collateral accordingly, and the borrower failed to return the securities. The securities loaned are subject to termination at the option of the borrower or the Fund. Upon termination, the borrower will return to the Fund the securities loaned and the Fund will return the collateral. Upon the failure of the borrower to return the securities, collateral may be liquidated and the securities may be purchased on the open market to replace the loaned securities. The Fund could experience delays and costs in gaining access to the collateral and the securities may lose value during the delay which could result in potential losses to the Fund. Some of these losses may be indemnified by the lending agent. The Fund bears the risk of any deficiency in the amount of the collateral available for return to the |
| 15 | Invesco S&P 500 Index Fund |
| borrower due to any loss on the collateral invested. Dividends received on cash collateral investments for securities lending transactions, which are net of compensation to counterparties, are included in Dividends from affiliates on the Statement of Operations. The aggregate value of securities out on loan, if any, is shown as a footnote on the Statement of Assets and Liabilities. |
| J. | Futures Contracts — The Fund may enter into futures contracts to manage exposure to interest rate, equity and market price movements and/or currency risks. A futures contract is an agreement between two parties ("Counterparties") to purchase or sell a specified underlying security, currency or commodity (or delivery of a cash settlement price, in the case of an index future) for a fixed price at a future date. The Fund currently invests only in exchange-traded futures and they are standardized as to maturity date and underlying instrument or asset. Initial margin deposits required upon entering into futures contracts are satisfied by the segregation of specific securities or cash as collateral at the futures commission merchant (broker). During the period the futures contracts are open, changes in the value of the contracts are recognized as unrealized gains or losses by recalculating the value of the contracts on a daily basis. Subsequent or variation margin payments are received or made depending upon whether unrealized gains or losses are incurred. These amounts are reflected as receivables or payables on the Statement of Assets and Liabilities. When the contracts are closed or expire, the Fund recognizes a realized gain or loss equal to the difference between the proceeds from, or cost of, the closing transaction and the Fund’s basis in the contract. The net realized gain (loss) and the change in unrealized gain (loss) on futures contracts held during the period is included on the Statement of Operations. The primary risks associated with futures contracts are market risk and the absence of a liquid secondary market. If the Fund were unable to liquidate a futures contract and/or enter into an offsetting closing transaction, the Fund would continue to be subject to market risk with respect to the value of the contracts and continue to be required to maintain the margin deposits on the futures contracts. Futures contracts have minimal Counterparty risk since the exchange’s clearinghouse, as Counterparty to all exchange-traded futures, guarantees the futures against default. Risks may exceed amounts recognized in the Statement of Assets and Liabilities. |
| K. | Leverage Risk — Leverage exists when the Fund can lose more than it originally invests because it purchases or sells an instrument or enters into a transaction without investing an amount equal to the full economic exposure of the instrument or transaction. |
| L. | Collateral —To the extent the Fund has designated or segregated a security as collateral and that security is subsequently sold, it is the Fund’s practice to replace such collateral no later than the next business day. This practice does not apply to securities pledged as collateral for securities lending transactions. |
| Average Daily Net Assets | Rate |
| First $2 billion | 0.120% |
| Over $2 billion | 0.100% |
| 16 | Invesco S&P 500 Index Fund |
| Level 1 | Level 2 | Level 3 | Total | |
| Investments in Securities | ||||
| Common Stocks & Other Equity Interests | $3,265,134,269 | $— | $— | $3,265,134,269 |
| Money Market Funds | 67,442,530 | 39,738,408 | — | 107,180,938 |
| Total Investments in Securities | 3,332,576,799 | 39,738,408 | — | 3,372,315,207 |
| Other Investments - Assets* | ||||
| Futures Contracts | 1,638,672 | — | — | 1,638,672 |
| Total Investments | $3,334,215,471 | $39,738,408 | $— | $3,373,953,879 |
| * | Unrealized appreciation. |
| Value | |
| Derivative Assets | Equity Risk |
| Unrealized appreciation on futures contracts —Exchange-Traded(a) | $1,638,672 |
| Derivatives not subject to master netting agreements | (1,638,672) |
| Total Derivative Assets subject to master netting agreements | $— |
| (a) | The daily variation margin receivable (payable) at period-end is recorded in the Statement of Assets and Liabilities. |
| Location of Gain (Loss) on Statement of Operations | |
| Equity Risk | |
| Realized Gain: | |
| Futures contracts | $14,753,572 |
| 17 | Invesco S&P 500 Index Fund |
| Location of Gain (Loss) on Statement of Operations | |
| Equity Risk | |
| Change in Net Unrealized Appreciation (Depreciation): | |
| Futures contracts | $(117,166) |
| Total | $14,636,406 |
| Futures Contracts | |
| Average notional value | $67,764,707 |
| Tax Character of Distributions to Shareholders Paid During the Fiscal Years Ended August 31, 2024 and 2023: | ||
| 2024 | 2023 | |
| Ordinary income* | $26,534,790 | $20,637,288 |
| * | Includes short-term capital gain distributions, if any. |
| Tax Components of Net Assets at Period-End: | |
| 2024 | |
| Undistributed ordinary income | $20,757,959 |
| Undistributed long-term capital gain | 7,262,309 |
| Net unrealized appreciation — investments | 2,089,244,871 |
| Temporary book/tax differences | (62,925) |
| Shares of beneficial interest | 1,217,388,955 |
| Total net assets | $3,334,591,169 |
| 18 | Invesco S&P 500 Index Fund |
| Unrealized Appreciation (Depreciation) of Investments on a Tax Basis | |
| Aggregate unrealized appreciation of investments | $2,130,988,787 |
| Aggregate unrealized (depreciation) of investments | (41,743,916) |
| Net unrealized appreciation of investments | $2,089,244,871 |
| Summary of Share Activity | |||||
| Year ended August 31, 2024(a) | Year ended August 31, 2023 | ||||
| Shares | Amount | Shares | Amount | ||
| Sold: | |||||
| Class A | 7,645,707 | $400,741,633 | 4,837,964 | $209,631,036 | |
| Class C | 1,628,406 | 81,141,998 | 1,178,645 | 48,451,033 | |
| Class Y | 2,339,767 | 122,627,275 | 4,620,383 | 203,223,167 | |
| Class R6 | 757,378 | 39,774,791 | 207,835 | 9,135,762 | |
| Issued as reinvestment of dividends: | |||||
| Class A | 335,327 | 16,679,179 | 316,821 | 12,853,339 | |
| Class C | 26,708 | 1,271,014 | 62,346 | 2,422,774 | |
| Class Y | 97,460 | 4,923,691 | 59,929 | 2,467,868 | |
| Class R6 | 6,506 | 328,997 | 4,666 | 192,374 | |
| Automatic conversion of Class C shares to Class A shares: | |||||
| Class A | 840,951 | 44,417,602 | 972,593 | 42,215,051 | |
| Class C | (881,874) | (44,417,602) | (1,017,674) | (42,215,051) | |
| Reacquired: | |||||
| Class A | (5,074,269) | (266,778,859) | (4,193,571) | (181,321,362) | |
| Class C | (1,101,998) | (55,247,959) | (1,164,496) | (47,898,785) | |
| Class Y | (2,782,759) | (147,858,731) | (2,109,204) | (91,252,760) | |
| Class R6 | (131,059) | (7,104,385) | (107,591) | (4,700,803) | |
| Net increase in share activity | 3,706,251 | $190,498,644 | 3,668,646 | $163,203,643 | |
| (a) | There are entities that are record owners of more than 5% of the outstanding shares of the Fund and in the aggregate own 48% of the outstanding shares of the Fund. IDI has an agreement with these entities to sell Fund shares. The Fund, Invesco and/or Invesco affiliates may make payments to these entities, which are considered to be related to the Fund, for providing services to the Fund, Invesco and/or Invesco affiliates including but not limited to services such as securities brokerage, distribution, third party record keeping and account servicing. The Fund has no knowledge as to whether all or any portion of the shares owned of record by these entities are also owned beneficially. |
| 19 | Invesco S&P 500 Index Fund |
| 20 | Invesco S&P 500 Index Fund |
| A. | Nature, Extent and Quality of Services Provided by Invesco Advisers and the Affiliated Sub-Advisers |
| B. | Fund Investment Performance |
| 21 | Invesco S&P 500 Index Fund |
| C. | Advisory and Sub-Advisory Fees and Fund Expenses |
| D. | Economies of Scale and Breakpoints |
| E. | Profitability and Financial Resources |
| F. | Collateral Benefits to Invesco Advisers and its Affiliates |
| 22 | Invesco S&P 500 Index Fund |
| 23 | Invesco S&P 500 Index Fund |
| Federal and State Income Tax | |
| Qualified Dividend Income* | 100.00% |
| Corporate Dividends Received Deduction* | 100.00% |
| U.S. Treasury Obligations* | 0.00% |
| Qualified Business Income* | 0.00% |
| Business Interest Income* | 0.00% |
| * | The above percentages are based on ordinary income dividends paid to shareholders during the Fund’s fiscal year. |
| 24 | Invesco S&P 500 Index Fund |
| 25 | Invesco S&P 500 Index Fund |

| Annual Financial Statements and Other Information | August 31, 2024 | |||
Invesco Senior Floating Rate Fund
Nasdaq:
A: OOSAX ∎ C: OOSCX ∎ R: OOSNX ∎ Y: OOSYX ∎ R5: SFRRX ∎ R6: OOSIX
Schedule of Investments
August 31, 2024
Interest Rate | Maturity Date | Principal Amount (000)(a) | Value | |||||||||||
Variable Rate Senior Loan Interests–84.89%(b)(c) |
| |||||||||||||
Aerospace & Defense–3.85% | ||||||||||||||
ADB Safegate (ADBAS/CEP IV) (Luxembourg), Term Loan B | 8.51% | 10/05/2026 | EUR | 14,104 | $ 15,322,156 | |||||||||
Aernnova Aerospace S.A.U (Spain), Term Loan B (3 mo. EURIBOR + 4.00%) | 7.71% | 02/26/2030 | EUR | 615 | 681,356 | |||||||||
Brown Group Holding LLC (Signature Aviation US Holdings, Inc.) | ||||||||||||||
Incremental Term Loan B-2 (1 mo. Term SOFR + 2.75%) | 8.00% | 07/01/2031 | $ | 1,891 | 1,893,830 | |||||||||
Term Loan (1 mo. Term SOFR + 2.75%) | 8.00% | 07/01/2031 | 13,818 | 13,832,832 | ||||||||||
Castlelake Aviation Ltd. | ||||||||||||||
Incremental Term Loan (3 mo. Term SOFR + 2.75%) | 8.09% | 10/22/2027 | 7,915 | 7,948,954 | ||||||||||
Term Loan (3 mo. Term SOFR + 2.50%) | 7.84% | 10/22/2026 | 4,335 | 4,353,006 | ||||||||||
Engineering Research and Consulting, LLC (aka Astrion), First Lien Term Loan (3 mo. Term SOFR + 5.00%)(d) | 10.06% | 08/15/2031 | 5,295 | 5,215,615 | ||||||||||
Gogo Intermediate Holdings LLC, Term Loan (1 mo. Term SOFR + 3.86%) | 9.11% | 04/30/2028 | 4,307 | 4,288,353 | ||||||||||
KKR Apple Bidco LLC, First Lien Term Loan (1 mo. Term SOFR + 2.86%) | 8.11% | 09/22/2028 | 13,015 | 13,053,364 | ||||||||||
Ovation Parent, Inc. (Kaman), Term Loan B (3 mo. Term SOFR + 3.50%) | 8.83% | 04/21/2031 | 2,601 | 2,613,605 | ||||||||||
Peraton Corp. | ||||||||||||||
First Lien Term Loan B (1 mo. Term SOFR + 3.75%) | 9.10% | 02/01/2028 | 3,737 | 3,664,943 | ||||||||||
Second Lien Term Loan B-1 (3 mo. Term SOFR + 7.85%) | 12.97% | 02/01/2029 | 9,194 | 8,975,755 | ||||||||||
Propulsion (BC) Newco LLC (Spain), Term Loan (3 mo. Term SOFR + 3.75%) | 9.08% | 09/14/2029 | 5,430 | 5,453,648 | ||||||||||
Rand Parent LLC (Atlas Air), First Lien Term Loan B (3 mo. Term SOFR + 3.75%) | 9.07% | 03/17/2030 | 9,108 | 9,121,849 | ||||||||||
Spirit AeroSystems, Inc., Term Loan (3 mo. Term SOFR + 4.50%) | 9.75% | 01/15/2027 | 1,551 | 1,567,053 | ||||||||||
Titan Acquisition Holdings L.P., Term loan B (1 mo. Term SOFR + 3.50%) | 8.81% | 06/14/2030 | 2,109 | 2,106,398 | ||||||||||
TransDigm, Inc. | ||||||||||||||
Term Loan I (3 mo. Term SOFR + 2.75%) | 8.08% | 08/24/2028 | 13,560 | 13,631,705 | ||||||||||
Term Loan J (3 mo. Term SOFR + 2.50%) | 7.84% | 02/28/2031 | 2,454 | 2,459,559 | ||||||||||
Term Loan K (3 mo. Term SOFR + 2.75%) | 8.08% | 03/22/2030 | 489 | 492,080 | ||||||||||
| 116,676,061 | ||||||||||||||
Air Transport–1.93% | ||||||||||||||
AAdvantage Loyality IP Ltd. (American Airlines, Inc.), Term Loan | 10.29% | 04/20/2028 | 23,072 | 23,902,284 | ||||||||||
American Airlines, Inc., Term Loan (6 mo. Term SOFR + 2.50%) | 8.77% | 06/04/2029 | 12,870 | 12,819,132 | ||||||||||
eTraveli Group Holding AB (Sweden), Term loan B (3 mo. EURIBOR + 4.50%) | 8.22% | 11/02/2028 | EUR | 1,578 | 1,749,668 | |||||||||
United AirLines, Inc., Term Loan B (3 mo. Term SOFR + 2.75%) | 8.03% | 02/22/2031 | 11,690 | 11,745,097 | ||||||||||
WestJet Airlines Ltd. (Canada), Term Loan (3 mo. Term SOFR + 3.75%) | 9.08% | 02/14/2031 | 8,285 | 8,263,792 | ||||||||||
| 58,479,973 | ||||||||||||||
Automotive–3.40% | ||||||||||||||
Autokiniton US Holdings, Inc., Term Loan B (1 mo. Term SOFR + 4.11%) | 9.36% | 04/06/2028 | 9,550 | 9,590,163 | ||||||||||
Constellation Auto (CONSTE/BCA) (United Kingdom) | ||||||||||||||
First Lien Term Loan B-2 (6 mo. SONIA + 4.75%) | 9.95% | 07/28/2028 | GBP | 1,188 | 1,437,682 | |||||||||
Second Lien Term Loan (6 mo. SONIA + 7.50%) | 12.45% | 07/27/2029 | GBP | 5,046 | 4,770,943 | |||||||||
DexKo Global, Inc., Incremental First Lien Term Loan (3 mo. Term SOFR + 4.25%) | 9.58% | 10/04/2028 | 4,723 | 4,665,312 | ||||||||||
Driven Holdings LLC, Term Loan (1 mo. Term SOFR + 3.11%) | 8.36% | 12/17/2028 | 7,033 | 6,992,094 | ||||||||||
Engineered Components & Systems LLC, Term Loan (1 mo. Term SOFR + 6.00%) | 11.25% | 08/30/2030 | 5,035 | 4,959,795 | ||||||||||
First Brands Group LLC | ||||||||||||||
First Lien Incremental Term Loan (3 mo. EURIBOR + 5.00%)(d) | 8.64% | 03/30/2027 | EUR | 3,157 | 3,507,417 | |||||||||
First Lien Incremental Term Loan (3 mo. Term SOFR + 5.26%) | 10.51% | 03/30/2027 | 16,798 | 16,629,631 | ||||||||||
First Lien Term Loan (3 mo. Term SOFR + 5.26%) | 10.25% | 03/30/2027 | 9,768 | 9,670,271 | ||||||||||
Second Lien Term Loan (3 mo. Term SOFR + 8.76%)(d) | 14.01% | 03/30/2028 | 3,159 | 3,017,169 | ||||||||||
Highline Aftermarket Acquisition LLC, First Lien Term Loan (1 mo. USD LIBOR + 4.00%) | 9.25% | 11/09/2027 | 9,388 | 9,455,710 | ||||||||||
LS Group OpCo Acquisition (Les Schwab Tire Centers), Term Loan B (1 mo. Term SOFR + 3.00%) | 8.25% | 04/23/2031 | 3,169 | 3,176,088 | ||||||||||
Mavis Tire Express Services TopCo Corp., Term Loan (1 mo. Term SOFR + 3.50%) | 8.75% | 05/04/2028 | 10,997 | 11,023,183 | ||||||||||
Panther BF Aggregator 2 L.P. (Power Solutions, Clarios POWSOL) (Canada), Term Loan B (1 mo. Term SOFR + 2.50%) | 7.75% | 05/06/2030 | 2,064 | 2,072,411 | ||||||||||
Project Boost Purchaser LLC, Term Loan (3 mo. Term SOFR + 3.50%) | 8.79% | 07/16/2031 | 3,514 | 3,527,600 | ||||||||||
See accompanying Notes to Financial Statements which are an integral part of the financial statements.
| 2 | Invesco Senior Floating Rate Fund |
Interest Rate | Maturity Date | Principal Amount (000)(a) | Value | |||||||||||
Automotive–(continued) | ||||||||||||||
Wand Newco 3, Inc., First Lien Term Loan (1 mo. Term SOFR + 3.25%) | 8.50% | 01/30/2031 | $ | 8,463 | $ 8,485,245 | |||||||||
| 102,980,714 | ||||||||||||||
Beverage & Tobacco–1.22% | ||||||||||||||
AI Aqua Merger Sub, Inc., Term Loan B (1 mo. Term SOFR + 3.50%) | 8.84% | 07/31/2028 | 16,270 | 16,307,926 | ||||||||||
City Brewing Co. LLC | ||||||||||||||
First Lien Term Loan (3 mo. Term SOFR + 6.25%)(d) | 11.55% | 04/05/2028 | 4,553 | 4,325,114 | ||||||||||
Term Loan (3 mo. Term SOFR + 3.76%)(d) | 9.06% | 04/05/2028 | 10,707 | 9,101,045 | ||||||||||
Term Loan (3 mo. Term SOFR + 3.76%) | 1.50% | 04/14/2028 | 10,747 | 7,240,597 | ||||||||||
| 36,974,682 | ||||||||||||||
Building & Development–3.11% | ||||||||||||||
Arcosa, Inc., Term Loan B (d)(e) | - | 08/13/2031 | 2,285 | 2,296,947 | ||||||||||
Chariot Buyer LLC | ||||||||||||||
First Lien Term Loan (1 mo. Term SOFR + 3.35%) | 8.60% | 11/03/2028 | 1,178 | 1,178,665 | ||||||||||
First Lien Term Loan (1 mo. Term SOFR + 3.50%) | 8.75% | 11/03/2028 | 5,092 | 5,095,341 | ||||||||||
Empire Today LLC, Term Loan B (3 mo. Term SOFR + 5.26%) | 10.51% | 04/01/2028 | 21,142 | 15,471,106 | ||||||||||
Flakt Woods (Fusilli Holdco) (France), Term Loan B (6 mo. EURIBOR + 5.00%) | 8.85% | 04/12/2026 | EUR | 1,719 | 1,876,449 | |||||||||
Gulfside Supply, Inc., Term Loan B (1 mo. Term SOFR + 2.95%)(d) | 8.29% | 06/17/2031 | 3,410 | 3,416,086 | ||||||||||
Icebox Holdco III, Inc., First Lien Term Loan (3 mo. Term SOFR + 4.01%) | 9.35% | 12/22/2028 | 4,127 | 4,153,631 | ||||||||||
Interior Logic Group, Inc. (Signal Parent), Term Loan B (1 mo. Term SOFR + 3.60%) | 8.85% | 04/01/2028 | 11,755 | 10,369,394 | ||||||||||
IPS Corp./CP Iris Holdco, First Lien Term Loan (1 mo. Term SOFR + 3.50%) | 8.75% | 10/02/2028 | 4,079 | 4,083,366 | ||||||||||
Janus International Group LLC, Term Loan (1 mo. Term SOFR + 2.50%) | 7.75% | 08/03/2030 | 1,523 | 1,526,181 | ||||||||||
LHS Borrow LLC (Leaf Home Solutions), Term Loan (1 mo. Term SOFR + 4.85%) | 10.10% | 02/16/2029 | 12,650 | 11,903,518 | ||||||||||
MI Windows and Doors LLC, Incremental Term Loan B (1 mo. Term SOFR + 3.50%) | 8.75% | 03/28/2031 | 4,678 | 4,706,968 | ||||||||||
Oldcastle BuildingEnvelope, Inc., Term Loan B (3 mo. Term SOFR + 4.25%) | 9.58% | 04/29/2029 | 10,763 | 10,692,458 | ||||||||||
Platea (BC) Bidco AB | ||||||||||||||
Delayed Draw Term Loan B (3 mo. EURIBOR + 4.50%) | 4.50% | 04/02/2031 | EUR | 39 | 43,071 | |||||||||
Term Loan B (3 mo. EURIBOR + 4.50%) | 8.22% | 04/02/2031 | EUR | 989 | 1,098,304 | |||||||||
Platea BC Bidco AB, Delayed Draw Term Loan B(f) | 0.00% | 04/03/2031 | 159 | 176,590 | ||||||||||
Quikrete Holdings, Inc. | ||||||||||||||
Term Loan B (1 mo. Term SOFR + 2.25%) | 7.50% | 03/19/2029 | 5,137 | 5,153,222 | ||||||||||
Term Loan B (1 mo. Term SOFR + 2.50%) | 7.75% | 04/14/2031 | 7,310 | 7,333,965 | ||||||||||
TAMKO Building Products LLC, Term Loan (1 mo. Term SOFR + 3.25%) | 8.56% | 09/20/2030 | 3,673 | 3,687,969 | ||||||||||
| 94,263,231 | ||||||||||||||
Business Equipment & Services–8.81% | ||||||||||||||
Allied Universal Holdco LLC (USAGM Holdco LLC/UNSEAM), Term Loan (1 mo. Term SOFR + 3.85%) | 9.10% | 05/12/2028 | 12,310 | 12,251,143 | ||||||||||
Alter Domus (Chrysaor Bidco S.a.r.l.) | ||||||||||||||
Delayed Draw Term Loan(f) | 0.00% | 05/14/2031 | 141 | 141,864 | ||||||||||
Term Loan B(e) | - | 07/14/2031 | 1,909 | 1,918,254 | ||||||||||
Azuria Water Solutions, Inc., Term Loan B (1 mo. Term SOFR + 3.75%) | 9.00% | 05/17/2028 | 1,038 | 1,042,329 | ||||||||||
Boost Newco Borrower LLC (WorldPay), Term Loan B (3 mo. Term SOFR + 2.50%) | 7.75% | 01/31/2031 | 14,401 | 14,459,286 | ||||||||||
Checkout Holding Corp. (Catalina Marketing), Term Loan (3 mo. Term SOFR + 9.50%) | 14.83% | 05/10/2027 | 10,153 | 9,950,256 | ||||||||||
Cimpress USA, Inc., Term Loan B (1 mo. Term SOFR + 3.00%) | 8.25% | 05/17/2028 | 12,603 | 12,645,221 | ||||||||||
Cloud Software Group, Inc. | ||||||||||||||
First Lien Term Loan (3 mo. Term SOFR + 4.50%) | 9.83% | 03/21/2031 | 3,368 | 3,387,263 | ||||||||||
Term Loan B (3 mo. Term SOFR + 4.00%) | 9.33% | 03/30/2029 | 7,014 | 7,020,755 | ||||||||||
Constant Contact, Inc. | ||||||||||||||
Second Lien Term Loan (3 mo. Term SOFR + 7.76%) | 13.07% | 02/12/2029 | 3,742 | 3,484,045 | ||||||||||
Term Loan (3 mo. Term SOFR + 4.26%) | 9.57% | 02/10/2028 | 11,483 | 11,113,813 | ||||||||||
Corporation Service Co., Term Loan B (1 mo. Term SOFR + 2.50%)(d) | 7.75% | 11/02/2029 | 3,252 | 3,262,188 | ||||||||||
Deerfield Dakota Holding Corp. | ||||||||||||||
First Lien Term Loan (3 mo. Term SOFR + 3.75%) | 9.08% | 04/09/2027 | 14,580 | 14,495,722 | ||||||||||
Second Lien Term Loan (3 mo. Term SOFR + 7.01%) | 12.35% | 04/07/2028 | 1,901 | 1,907,884 | ||||||||||
DTI HoldCo, Inc., Incremental Term Loan B (1 mo. Term SOFR + 4.75%) | 10.00% | 04/26/2029 | 2,455 | 2,467,976 | ||||||||||
Dun & Bradstreet Corp. (The), Incremental Term Loan B-2 (1 mo. Term SOFR + 2.75%) | 8.03% | 01/18/2029 | 14,936 | 14,978,248 | ||||||||||
Garda World Security Corp. (Canada), Term Loan B (1 mo. Term SOFR + 3.48%) | 8.83% | 02/01/2029 | 13,133 | 13,167,182 | ||||||||||
GI Revelation Acquisition LLC, First Lien Term Loan (1 mo. Term SOFR + 4.11%) | 9.36% | 05/12/2028 | 13,624 | 13,633,332 | ||||||||||
See accompanying Notes to Financial Statements which are an integral part of the financial statements.
| 3 | Invesco Senior Floating Rate Fund |
Interest Rate | Maturity Date | Principal Amount (000)(a) | Value | |||||||||||
Business Equipment & Services–(continued) | ||||||||||||||
I-Logic Tech Bidco Ltd. (Acuris) (United Kingdom), Term Loan (3 mo. Term SOFR + 4.15%) | 9.48% | 02/16/2028 | $ | 5,730 | $ 5,731,338 | |||||||||
ION Trading Technologies S.a.r.l. (Luxembourg) | ||||||||||||||
Term Loan (3 mo. EURIBOR + 4.25%) | 7.97% | 04/01/2028 | EUR | 8,158 | 8,654,997 | |||||||||
Term Loan (3 mo. Term SOFR + 4.00%) | 9.35% | 04/01/2028 | 9 | 8,840 | ||||||||||
KronosNet CX Bidco (Comspa Konecta) (Spain), Term Loan B | 9.60% | 10/25/2029 | EUR | 10,138 | 7,970,379 | |||||||||
Learning Care Group (US) No. 2, Inc., Term Loan B (3 mo. Term SOFR + 4.00%) | 9.33% | 08/11/2028 | 2,810 | 2,825,578 | ||||||||||
Monitronics International, Inc., Term Loan B (3 mo. Term SOFR + 7.76%) | ||||||||||||||
(Acquired 06/30/2023-02/16/2024; Cost $30,376,298)(g) | 13.01% | 06/30/2028 | 30,359 | 30,207,466 | ||||||||||
Neon Maple Purchaser, Inc., Term Loan B(e) | - | 07/18/2031 | 8,271 | 8,255,801 | ||||||||||
OCM System One Buyer CTB LLC, Term Loan B (3 mo. Term SOFR + 3.90%)(d) | 9.23% | 03/02/2028 | 3,625 | 3,624,690 | ||||||||||
Orchid Merger Sub II LLC, Term Loan (1 mo. Term SOFR + 4.85%) | ||||||||||||||
(Acquired 11/12/2021-01/05/2022; Cost $9,372,418)(g) | 10.10% | 07/27/2027 | 9,699 | 5,916,136 | ||||||||||
Plano HoldCo, Inc. (aka Perficient), Term Loan B(d)(e) | - | 08/15/2031 | 5,408 | 5,434,658 | ||||||||||
Prometric Holdings, Inc., Term Loan B (1 mo. Term SOFR + 4.86%) | 10.11% | 01/31/2028 | 6,234 | 6,273,380 | ||||||||||
Ryan LLC (Ryan Tax), Term Loan (1 mo. Term SOFR + 3.50%) | 8.75% | 11/14/2030 | 787 | 790,739 | ||||||||||
Sitel Worldwide Corp., Term Loan (1 mo. Term SOFR + 3.86%) | 9.11% | 08/28/2028 | 2,280 | 1,561,342 | ||||||||||
Skillsoft Corp., Term Loan (1 mo. Term SOFR + 5.36%) | 10.64% | 07/14/2028 | 3,500 | 2,825,443 | ||||||||||
Solera (Polaris Newco LLC), First Lien Term Loan (1 mo. SONIA + 5.25%) | 10.20% | 06/02/2028 | GBP | 1,486 | 1,887,703 | |||||||||
Spin Holdco, Inc., Term Loan (3 mo. Term SOFR + 4.26%) | 9.60% | 03/04/2028 | 29,785 | 25,473,796 | ||||||||||
Tempo Acquisition LLC, Term Loan B-1 (1 mo. Term SOFR + 2.25%) | 7.50% | 08/31/2028 | 665 | 667,395 | ||||||||||
Thermostat Purchaser III, Inc., Term Loan B (1 mo. Term SOFR + 4.35%)(d) | 9.60% | 08/31/2028 | 980 | 979,013 | ||||||||||
Verra Mobility Corp., First Lien Term Loan B-2 (1 mo. Term SOFR + 2.75%) | 8.00% | 03/24/2028 | 6,578 | 6,627,357 | ||||||||||
| 267,042,812 | ||||||||||||||
Cable & Satellite Television–2.64% | ||||||||||||||
Altice Financing S.A. (Altice-Int’l) (Luxembourg) | ||||||||||||||
Term Loan (3 mo. Term SOFR + 5.00%) | 10.30% | 10/31/2027 | 8,346 | 7,498,716 | ||||||||||
Term Loan B (3 mo. EURIBOR + 5.00%) | 8.66% | 10/31/2027 | EUR | 1,078 | 1,077,856 | |||||||||
Atlantic Broadband Finance LLC (Cogeco) | ||||||||||||||
Incremental Term Loan B (1 mo. Term SOFR + 2.61%) | 7.86% | 09/01/2028 | 1,101 | 1,069,807 | ||||||||||
Term Loan B-1 (1 mo. Term SOFR + 3.25%) | 8.50% | 09/18/2030 | 8,420 | 8,146,703 | ||||||||||
Numericable-SFR S.A. (France) | ||||||||||||||
Incremental Term Loan B-13 (3 mo. USD LIBOR + 4.00%) | 9.38% | 08/14/2026 | 9,335 | 7,491,251 | ||||||||||
Term Loan B-11 (3 mo. USD LIBOR + 2.75%) | 8.26% | 07/31/2025 | 6,087 | 5,418,342 | ||||||||||
Term Loan B-12 (3 mo. USD LIBOR + 3.69%) | 9.25% | 01/31/2026 | 17,605 | 14,411,883 | ||||||||||
Term Loan B-14 (3 mo. EURIBOR + 5.50%) | 9.19% | 08/15/2028 | EUR | 4,817 | 4,034,041 | |||||||||
UPC - LG (Sunrise), Term Loan AX (1 mo. Term SOFR + 3.04%) | 8.44% | 01/31/2029 | 11,255 | 11,205,313 | ||||||||||
Virgin Media 02 - LG (United Kingdom) | ||||||||||||||
Term Loan N (1 mo. Term SOFR + 2.61%) | 7.94% | 01/31/2028 | 8,928 | 8,643,909 | ||||||||||
Term Loan Q (1 mo. Term SOFR + 3.36%) | 8.70% | 01/31/2029 | 3,195 | 3,082,701 | ||||||||||
Term Loan Y (6 mo. Term SOFR + 3.35%) | 8.66% | 03/31/2031 | 8,195 | 7,876,865 | ||||||||||
| 79,957,387 | ||||||||||||||
Chemicals & Plastics–8.91% | ||||||||||||||
A&R Logistics Holdings, Inc. (Quantix), Incremental Term Loan (3 mo. Term SOFR + 6.90%)(d) | 12.22% | 08/03/2026 | 4,842 | 4,706,051 | ||||||||||
A-Gas Finco, Inc., Term Loan (3 mo. Term SOFR + 5.25%) | 10.58% | 12/14/2029 | 8,058 | 7,790,384 | ||||||||||
AkzoNoble Chemicals | ||||||||||||||
Term Loan B (3 mo. Term SOFR + 3.50%) | 8.63% | 04/03/2028 | 10,057 | 10,113,845 | ||||||||||
Term Loan B (3 mo. Term SOFR + 3.50%) | 8.82% | 04/03/2028 | 6,924 | 6,975,377 | ||||||||||
Aruba Investments, Inc. | ||||||||||||||
First Lien Term Loan (1 mo. EURIBOR + 4.00%) | 7.59% | 11/24/2027 | EUR | 3,371 | 3,658,132 | |||||||||
First Lien Term Loan (1 mo. Term SOFR + 4.10%) | 9.35% | 11/24/2027 | 1,954 | 1,945,111 | ||||||||||
Second Lien Term Loan (1 mo. Term SOFR + 7.85%) | 13.10% | 11/24/2028 | 4,299 | 4,133,851 | ||||||||||
Ascend Performance Materials Operations LLC, Term Loan (6 mo. Term SOFR + 4.85%) | 10.07% | 08/27/2026 | 15,114 | 14,729,564 | ||||||||||
Austin Powder (A-AP Buyer, Inc.), First Lien Term Loan(d)(e) | - | 08/01/2031 | 3,609 | 3,627,279 | ||||||||||
Charter NEX US, Inc., First Lien Term Loan (1 mo. Term SOFR + 3.25%) | 8.50% | 12/01/2027 | 6,249 | 6,270,949 | ||||||||||
See accompanying Notes to Financial Statements which are an integral part of the financial statements.
| 4 | Invesco Senior Floating Rate Fund |
Interest Rate | Maturity Date | Principal Amount (000)(a) | Value | |||||||||||
Chemicals & Plastics–(continued) | ||||||||||||||
Chemours Co. (The) | ||||||||||||||
Term Loan B-3 (1 mo. EURIBOR + 4.00%) | 7.60% | 08/18/2028 | EUR | 2,850 | $ 3,161,558 | |||||||||
Term Loan B-3 (1 mo. Term SOFR + 3.50%) | 8.75% | 08/18/2028 | $ | 9,652 | 9,652,378 | |||||||||
Composite Resins Holding B.V. (AOC), Term Loan B (1 mo. Term SOFR + 3.61%) | 8.86% | 10/15/2028 | 6,389 | 6,393,217 | ||||||||||
Derby Buyer LLC (Delrin), Term Loan B (1 mo. Term SOFR + 3.50%) | 8.84% | 11/01/2030 | 4,664 | 4,679,901 | ||||||||||
Discovery Purchaser Corp. (BES) | ||||||||||||||
First Lien Term Loan (3 mo. Term SOFR + 4.38%) | 9.69% | 10/04/2029 | 11,942 | 11,956,159 | ||||||||||
Second Lien Term Loan (3 mo. Term SOFR + 7.00%) | 12.32% | 10/04/2030 | 1,420 | 1,389,184 | ||||||||||
Eastman Tire Additives (River Buyer, Inc.), First Lien Term Loan (3 mo. Term SOFR + 5.51%) | 10.85% | 11/01/2028 | 10,905 | 8,724,221 | ||||||||||
Flint Group (ColourOz Inv) (Germany), PIK Term Loan B, 6.90% PIK Rate, 5.64% Cash Rate(h) | 6.90% | 12/31/2027 | 116 | 23,299 | ||||||||||
Fusion (Fusion UK Holding Ltd. & US HoldCo VAD, Inc.), Term Loan B (3 mo. Term SOFR + 3.50%) | 8.83% | 05/29/2029 | 2,450 | 2,465,205 | ||||||||||
Gemini HDPE LLC, Term Loan (3 mo. Term SOFR + 3.26%) | 8.51% | 12/31/2027 | 7,544 | 7,576,059 | ||||||||||
ICP Group Holdings LLC (CPC Acquisition), First Lien Term Loan | 9.35% | 12/29/2027 | 6,870 | 5,733,884 | ||||||||||
INEOS Enterprises Holdings US Finco LLC (United Kingdom), Term Loan B (3 mo. Term SOFR + 3.85%) | 8.91% | 07/08/2030 | 6,402 | 6,425,655 | ||||||||||
Ineos Quattro (STYRO) (United Kingdom) | ||||||||||||||
Term Loan B (1 mo. Term SOFR + 4.35%) | 9.60% | 04/02/2029 | 13,429 | 13,479,450 | ||||||||||
Term Loan B (1 mo. Term SOFR + 3.85%) | 9.10% | 03/14/2030 | 2,592 | 2,599,471 | ||||||||||
Ineos US Finance LLC | ||||||||||||||
Term Loan (1 mo. Term SOFR + 2.60%) | 7.85% | 11/08/2028 | 1,044 | 1,043,144 | ||||||||||
Term Loan (1 mo. Term SOFR + 3.25%) | 8.50% | 02/18/2030 | 18,605 | 18,602,336 | ||||||||||
Term Loan (1 mo. Term SOFR + 3.75%) | 9.00% | 02/07/2031 | 9,181 | 9,203,919 | ||||||||||
Lummus Technology Holdings V LLC (Illuminate Buyer LLC), Term Loan B (1 mo. Term SOFR + 3.61%) | 8.86% | 12/31/2029 | 3,230 | 3,246,457 | ||||||||||
Oxea Corp. (OQ Chemicals) | ||||||||||||||
Term Loan (3 mo. Term SOFR + 8.24%) | 13.31% | 06/22/2025 | 3,290 | 3,409,576 | ||||||||||
Term Loan B-2 (3 mo. USD LIBOR + 3.25%) | 8.92% | 10/14/2024 | 8,082 | 7,249,810 | ||||||||||
Potters Industries, Term Loan B (3 mo. Term SOFR + 3.75%) | 9.08% | 12/14/2027 | 2,202 | 2,218,589 | ||||||||||
PQ Performance Chemicals (Sparta Holdings L.P.), First Lien Term loan (1 mo. Term SOFR + 3.25%) | 8.59% | 08/02/2030 | 2,937 | 2,948,166 | ||||||||||
Proampac PG Borrower LLC, Term Loan B (3 mo. Term SOFR + 4.00%) | 9.30% | 09/15/2028 | 6,909 | 6,940,496 | ||||||||||
Trinseo Materials Operating S.C.A. | ||||||||||||||
Incremental Term Loan (3 mo. Term SOFR + 2.76%) | 7.82% | 05/03/2028 | 11,076 | 8,877,576 | ||||||||||
Term Loan A (3 mo. Term SOFR + 8.50%) | 13.80% | 05/03/2028 | 1,637 | 1,731,345 | ||||||||||
Term Loan B (3 mo. Term SOFR + 8.50%) | 13.80% | 05/03/2028 | 12,049 | 12,714,192 | ||||||||||
Tronox Finance LLC, Term Loan B (1 mo. Term SOFR + 2.75%) | 8.00% | 04/04/2029 | 11,816 | 11,869,243 | ||||||||||
Univar, Inc., Term Loan B (1 mo. Term SOFR + 4.00%) | 9.31% | 08/01/2030 | 13,345 | 13,435,053 | ||||||||||
V Global Holdings LLC | ||||||||||||||
Revolver Loan (1 mo. Term SOFR + 5.85%)(d) | 0.50% | 12/22/2025 | 745 | 692,472 | ||||||||||
Revolver Loan(d)(f) | 0.00% | 12/22/2025 | 145 | 135,010 | ||||||||||
Term Loan (3 mo. Term SOFR + 5.90%)(d) | 10.96% | 12/22/2027 | 7,150 | 6,649,649 | ||||||||||
W. R. Grace Holdings LLC, Term Loan (3 mo. Term SOFR + 3.44%) | 8.50% | 09/22/2028 | 11,108 | 11,158,246 | ||||||||||
| 270,335,463 | ||||||||||||||
Clothing & Textiles–0.86% | ||||||||||||||
ABG Intermediate Holdings 2 LLC | ||||||||||||||
Delayed Draw Term Loan(f) | 0.00% | 12/21/2028 | 1,629 | 1,638,441 | ||||||||||
Term Loan (1 mo. Term SOFR + 2.75%) | 8.00% | 12/21/2028 | 15,112 | 15,174,857 | ||||||||||
Varsity Brands Holding Co., Inc., Term Loan B | 8.82% | 07/25/2031 | 9,262 | 9,234,643 | ||||||||||
| 26,047,941 | ||||||||||||||
Containers & Glass Products–2.36% | ||||||||||||||
Berlin Packaging LLC, Term Loan B-7 (3 mo. Term SOFR + 3.75%) | 9.08% | 06/07/2031 | 11,098 | 11,108,720 | ||||||||||
See accompanying Notes to Financial Statements which are an integral part of the financial statements.
| 5 | Invesco Senior Floating Rate Fund |
Interest Rate | Maturity Date | Principal Amount (000)(a) | Value | |||||||||||
Containers & Glass Products–(continued) | ||||||||||||||
Keter Group B.V. (Netherlands) | ||||||||||||||
Term Loan (3 mo. EURIBOR + 4.75%) (Acquired 04/29/2024; Cost $12,901,683)(g) | 8.39% | 12/28/2029 | EUR | 12,699 | $ 13,436,384 | |||||||||
Term Loan (3 mo. EURIBOR + 0.00%) (Acquired 04/29/2024-07/29/2024; Cost $11,953,826)(g) | 5.00% | 12/31/2029 | EUR | 14,774 | 13,759,407 | |||||||||
Libbey Glass LLC, Incremental Term Loan (3 mo. Term SOFR + 6.65%) (Acquired 11/22/2022-06/11/2024; Cost $12,141,179)(g) | 11.93% | 11/22/2027 | $ | 12,748 | 12,678,624 | |||||||||
Logoplaste (Mar Bidco S.a.r.l.) (Portugal), Term Loan B (3 mo. Term SOFR + 4.46%) | 9.51% | 07/07/2028 | 3,514 | 3,410,567 | ||||||||||
Mold-Rite Plastics LLC (Valcour Packaging LLC), Term Loan A-2 | 7.08% | 10/10/2028 | 6,500 | 5,576,761 | ||||||||||
Mold-Rite Plastics, LLC (Valcour Packaging LLC), Term Loan A-1 | 10.56% | 10/10/2028 | 5,412 | 5,475,743 | ||||||||||
Refresco (Pegasus Bidco BV) (Netherlands), Term Loan (3 mo. Term SOFR + 3.75%) | 8.87% | 07/12/2029 | 6,000 | 6,022,742 | ||||||||||
| 71,468,948 | ||||||||||||||
Cosmetics & Toiletries–0.96% | ||||||||||||||
Bausch and Lomb, Inc. | ||||||||||||||
Incremental Term Loan (1 mo. Term SOFR + 4.00%) | 9.25% | 09/14/2028 | 4,507 | 4,478,935 | ||||||||||
Term Loan (1 mo. Term SOFR + 3.35%) | 8.66% | 05/10/2027 | 18,604 | 18,383,024 | ||||||||||
Rodenstock (Germany), Term Loan B (3 mo. EURIBOR + 5.00%) | 8.64% | 06/29/2028 | EUR | 5,832 | 6,208,107 | |||||||||
| 29,070,066 | ||||||||||||||
Drugs–0.41% | ||||||||||||||
Grifols Worldwide Operations USA, Inc. | ||||||||||||||
Term Loan B (3 mo. EURIBOR + 2.25%) | 5.91% | 11/15/2027 | EUR | 4,305 | 4,646,950 | |||||||||
Term Loan B (3 mo. Term SOFR + 2.15%) | 7.40% | 11/15/2027 | 7,937 | 7,822,408 | ||||||||||
| 12,469,358 | ||||||||||||||
Ecological Services & Equipment–0.86% | ||||||||||||||
Anticimex Global AB (Sweden), Term Loan B-6 (e) | - | 11/16/2028 | 940 | 946,804 | ||||||||||
EnergySolutions LLC, Term Loan (1 mo. Term SOFR + 3.75%) | 9.00% | 09/20/2030 | 8,074 | 8,145,248 | ||||||||||
Groundworks LLC | ||||||||||||||
Delayed Draw Term Loan (1 mo. Term SOFR + 3.50%) | 8.84% | 03/14/2031 | 77 | 76,977 | ||||||||||
Delayed Draw Term Loan(f) | 0.00% | 03/14/2031 | 404 | 404,129 | ||||||||||
Term Loan (1 mo. Term SOFR + 3.50%) | 8.84% | 03/14/2031 | 2,612 | 2,614,010 | ||||||||||
MIP V Waste LLC (GreenWaste), Term Loan (3 mo. Term SOFR + 3.00%) | 8.35% | 12/08/2028 | 2,462 | 2,462,779 | ||||||||||
Patriot Container Corp., First Lien Term Loan (1 mo. Term SOFR + 3.85%) | 9.10% | 03/20/2025 | 10,560 | 10,367,186 | ||||||||||
TruGreen L.P., Second Lien Term Loan (3 mo. Term SOFR + 8.84%) | 14.01% | 11/02/2028 | 1,488 | 1,227,399 | ||||||||||
| 26,244,532 | ||||||||||||||
Electronics & Electrical–7.73% | ||||||||||||||
Altar BidCo, Inc. (Brooks Automation, Inc.), Second Lien Term Loan | 10.85% | 02/01/2030 | 1,427 | 1,390,025 | ||||||||||
Applied Systems, Inc., Term Loan B-1 (3 mo. Term SOFR + 3.20%) | 8.29% | 02/24/2031 | 547 | 550,104 | ||||||||||
AppLovin Corp. | ||||||||||||||
Term Loan (1 mo. Term SOFR + 2.50%) | 7.75% | 10/25/2028 | 3,298 | 3,306,807 | ||||||||||
Term Loan B (1 mo. Term SOFR + 2.50%) | 7.75% | 08/16/2030 | 1,442 | 1,446,380 | ||||||||||
Boxer Parent Co., Inc., Term Loan (3 mo. Term SOFR + 3.75%) | 9.01% | 07/30/2031 | 8,213 | 8,204,711 | ||||||||||
Central Parent LLC, Term Loan (3 mo. Term SOFR + 3.25%) | 8.58% | 07/06/2029 | 702 | 697,282 | ||||||||||
CommerceHub, Inc., Term Loan B (1 mo. Term SOFR + 4.10%) | 9.44% | 01/01/2028 | 1,490 | 1,382,000 | ||||||||||
CommScope, Inc., Term Loan (1 mo. Term SOFR + 3.36%) | 8.61% | 04/06/2026 | 14,613 | 13,937,323 | ||||||||||
Diebold Nixdorf, Inc., Term Loan (1 mo. Term SOFR + 7.50%) | 12.83% | 08/11/2028 | 5,875 | 6,037,930 | ||||||||||
E2Open LLC, Term Loan (1 mo. Term SOFR + 3.61%) | 8.86% | 02/04/2028 | 2,729 | 2,739,961 | ||||||||||
Epicor Software Corp. | ||||||||||||||
Delayed Draw Term Loan B(f) | 0.00% | 05/30/2031 | 336 | 337,672 | ||||||||||
Term Loan B (1 mo. Term SOFR + 3.25%) | 8.50% | 05/30/2031 | 2,863 | 2,878,002 | ||||||||||
EverCommerce, Term Loan B (1 mo. Term SOFR + 3.11%) | 8.36% | 07/06/2028 | 1,374 | 1,379,794 | ||||||||||
GoTo Group, Inc. (LogMeIn) | ||||||||||||||
First Lien Term Loan (1 mo. Term SOFR + 4.85%) | 10.14% | 04/30/2028 | 20,447 | 17,443,677 | ||||||||||
Second Lien Term Loan (1 mo. Term SOFR + 4.85%) | 10.14% | 04/30/2028 | 11,735 | 4,744,100 | ||||||||||
See accompanying Notes to Financial Statements which are an integral part of the financial statements.
| 6 | Invesco Senior Floating Rate Fund |
Interest Rate | Maturity Date | Principal Amount (000)(a) | Value | |||||||||||
Electronics & Electrical–(continued) | ||||||||||||||
Idemia Group S.A.S. (Oberthur Tech/Morpho/OBETEC) | ||||||||||||||
Term Loan B-5 (3 mo. EURIBOR + 4.00%) | 7.72% | 09/30/2028 | EUR | 1,124 | $ 1,246,034 | |||||||||
Term Loan B-5 (3 mo. Term SOFR + 4.25%) | 9.58% | 09/30/2028 | $ | 7,869 | 7,903,489 | |||||||||
Inetum (Granite Fin Bidco SAS) (France), Term Loan B (3 mo. EURIBOR + 5.00%) | 8.71% | 10/17/2028 | EUR | 1,166 | 1,291,250 | |||||||||
Infinite Electronics | ||||||||||||||
First Lien Incremental Term Loan (3 mo. Term SOFR + 6.51%)(d) | 11.64% | 03/02/2028 | 1,493 | 1,489,693 | ||||||||||
First Lien Term Loan (3 mo. Term SOFR + 3.75%) | 9.26% | 03/02/2028 | 6,853 | 6,646,961 | ||||||||||
Second Lien Term Loan (3 mo. Term SOFR + 7.00%) | 12.51% | 03/02/2029 | 1,609 | 1,361,923 | ||||||||||
Informatica Corp., Term Loan B (1 mo. Term SOFR + 2.25%) | 7.50% | 10/27/2028 | 3,227 | 3,240,383 | ||||||||||
ION Corp (Helios Software), Term Loan (3 mo. Term SOFR + 3.75%) | 9.08% | 07/18/2030 | 4,527 | 4,538,102 | ||||||||||
Learning Pool (Brook Bidco Ltd.) (United Kingdom) | ||||||||||||||
Term Loan (3 mo. SONIA + 6.87%)(d) | 12.07% | 08/17/2028 | GBP | 2,502 | 3,174,474 | |||||||||
Term Loan (3 mo. Term SOFR + 7.11%)(d) | 12.34% | 08/17/2028 | 3,328 | 3,178,204 | ||||||||||
Mavenir Systems, Inc., Term Loan B (3 mo. Term SOFR + 5.01%) | 10.07% | 08/18/2028 | 12,645 | 8,974,865 | ||||||||||
McAfee Enterprise, Term Loan (3 mo. Term SOFR + 6.25%) | 11.37% | 07/27/2028 | 5,145 | 5,196,558 | ||||||||||
McAfee LLC, Term Loan B (1 mo. Term SOFR + 3.25%) | 8.59% | 03/01/2029 | 2,923 | 2,919,365 | ||||||||||
Mirion Technologies, Inc., Term Loan B (3 mo. Term SOFR + 2.25%) | 7.58% | 10/20/2028 | 6,648 | 6,655,292 | ||||||||||
Natel Engineering Co., Inc., Term Loan (1 mo. Term SOFR + 6.36%) | 11.61% | 04/30/2026 | 14,968 | 13,115,568 | ||||||||||
Native Instruments (Music Creation Group GmbH/APTUS) (Germany), Term Loan B (3 mo. EURIBOR + 6.00%)(d) | 9.75% | 03/03/2028 | EUR | 5,399 | 5,282,132 | |||||||||
Open Text Corp. (Canada), Term Loan (1 mo. Term SOFR + 2.25%) | 7.50% | 01/31/2030 | 2,760 | 2,776,846 | ||||||||||
Particle Luxembourg S.a.r.l. (WebPros), Term Loan B (1 mo. Term SOFR + 4.00%) | 9.25% | 03/28/2031 | 6,575 | 6,607,527 | ||||||||||
Proofpoint, Inc., Term Loan (1 mo. Term SOFR + 3.00%) | 8.25% | 08/31/2028 | 12,811 | 12,837,762 | ||||||||||
Quest Software US Holdings, Inc., First Lien Term Loan (3 mo. Term SOFR + 4.40%) (Acquired 01/20/2022-04/29/2024; Cost $19,896,846)(g) | 9.65% | 02/01/2029 | 21,663 | 16,032,566 | ||||||||||
Renaissance Holding Corp., Term Loan B (1 mo. Term SOFR + 4.25%) | 9.50% | 04/05/2030 | 6,553 | 6,562,371 | ||||||||||
Sandvine Corp., First Lien Term Loan | 2.00% | 06/28/2027 | 270 | 48,209 | ||||||||||
SonicWall U.S. Holdings, Inc. | ||||||||||||||
First Lien Term Loan (3 mo. Term SOFR + 5.00%) | 10.33% | 05/18/2028 | 9,514 | 9,357,664 | ||||||||||
Second Lien Term Loan (3 mo. Term SOFR + 7.65%) | 12.98% | 05/18/2026 | 1,353 | 1,260,533 | ||||||||||
Ultimate Software Group, Inc., Term Loan B (3 mo. Term SOFR + 3.25%) | 8.55% | 02/10/2031 | 7,896 | 7,923,079 | ||||||||||
UST Holdings Ltd., Term Loan B (1 mo. Term SOFR + 3.61%) | 8.90% | 11/20/2028 | 7,903 | 7,927,831 | ||||||||||
Utimaco (SGT Ultimate BidCo GmbH) (Germany) | ||||||||||||||
Term Loan B-1 (6 mo. EURIBOR + 6.25%)(d) | 10.00% | 05/31/2029 | EUR | 13,364 | 13,516,607 | |||||||||
Term Loan B-2(d)(e) | - | 05/31/2029 | 7,500 | 6,922,779 | ||||||||||
| 234,463,835 | ||||||||||||||
Farming/Agriculture–0.03% | ||||||||||||||
Rovensa (Root Bidco Sarl), Term Loan B (6 mo. EURIBOR + 5.25%) | 8.84% | 09/29/2027 | EUR | 958 | 1,044,378 | |||||||||
Financial Intermediaries–2.44% | ||||||||||||||
AssetMark Financial Holdings, Inc., Term Loan B (e) | - | 06/03/2031 | 2,483 | 2,472,303 | ||||||||||
AssuredPartners, Inc., Term Loan (1 mo. Term SOFR + 3.50%) | 8.75% | 02/14/2031 | 10,006 | 10,035,393 | ||||||||||
AVS (Ramudden Global), Term Loan (3 mo. EURIBOR + 4.25%) | 7.88% | 12/12/2029 | EUR | 7,000 | 7,730,874 | |||||||||
Broadstreet Partners, Inc., Term Loan B (1 mo. Term SOFR + 3.25%) | 8.50% | 06/13/2031 | 9,972 | 9,981,329 | ||||||||||
Edelman Financial Center LLC (The) | ||||||||||||||
Term Loan (1 mo. Term SOFR + 5.25%) | 10.50% | 10/06/2028 | 690 | 689,818 | ||||||||||
Term Loan B (1 mo. Term SOFR + 3.25%) | 8.50% | 04/07/2028 | 8,896 | 8,916,602 | ||||||||||
Eisner Advisory Group LLC, Incremental Term Loan (1 mo. Term SOFR + 4.00%) | 9.25% | 02/28/2031 | 7,004 | 7,033,331 | ||||||||||
Grant Thornton Advisors LLC, Term Loan B (1 mo. Term SOFR + 3.25%) | 8.50% | 06/02/2031 | 7,307 | 7,340,174 | ||||||||||
LendingTree, Inc., Term Loan B (1 mo. Term SOFR + 4.11%) | 9.36% | 09/15/2028 | 7,825 | 7,785,556 | ||||||||||
Tegra118 Wealth Solutions, Inc., Term Loan (3 mo. Term SOFR + 4.00%) | 9.13% | 02/18/2027 | 7,384 | 7,110,517 | ||||||||||
Tricor (Thevelia / Vistra-Virtue), Term Loan (3 mo. Term SOFR + 3.25%) | 8.51% | 06/18/2029 | 4,745 | 4,781,450 | ||||||||||
| 73,877,347 | ||||||||||||||
Food Products–2.37% | ||||||||||||||
Arnott’s (Snacking Investments US LLC), Term Loan (1 mo. Term SOFR + 4.00%) | 9.25% | 12/18/2026 | 990 | 996,134 | ||||||||||
Biscuit Holding S.A.S. (BISPOU/Cookie Acq) (France), Term Loan B | 7.86% | 02/12/2027 | EUR | 11,269 | 11,736,857 | |||||||||
See accompanying Notes to Financial Statements which are an integral part of the financial statements.
| 7 | Invesco Senior Floating Rate Fund |
Interest Rate | Maturity Date | Principal Amount (000)(a) | Value | |||||||||||
Food Products–(continued) | ||||||||||||||
Florida Food Products LLC | ||||||||||||||
First Lien Term Loan (1 mo. Term SOFR + 5.00%) | 10.25% | 10/18/2028 | $ | 3,009 | $ 2,648,078 | |||||||||
First Lien Term Loan (1 mo. Term SOFR + 5.11%) | 10.36% | 10/18/2028 | 19,177 | 17,004,234 | ||||||||||
Second Lien Term Loan (1 mo. Term SOFR + 8.11%)(d) | 13.36% | 10/18/2029 | 4,194 | 2,831,036 | ||||||||||
Mosel Bidco SE (Alphia) (Germany), Term Loan B (1 mo. Term SOFR + 5.00%) | 10.25% | 10/02/2030 | 3,614 | 3,402,505 | ||||||||||
Nomad Foods Ltd. (United Kingdom), Term Loan B-4 (6 mo. Term SOFR + 2.51%) | 7.81% | 11/13/2029 | 3,335 | 3,341,420 | ||||||||||
Shearer’s Foods LLC, Term Loan (1 mo. Term SOFR + 4.00%) | 9.25% | 02/12/2031 | 4,542 | 4,574,340 | ||||||||||
Sigma Holdco B.V. (Netherlands) | ||||||||||||||
Term Loan B-10 (6 mo. Term SOFR + 4.41%) | 9.77% | 01/03/2028 | 2 | 2,013 | ||||||||||
Term Loan B-9 (3 mo. EURIBOR + 4.50%) | 8.18% | 01/03/2028 | EUR | 20,674 | 22,866,729 | |||||||||
Solina Group Services (Powder Bidco) (France), Term Loan (3 mo. Term SOFR + 3.75%) | 9.09% | 03/07/2029 | 2,605 | 2,616,702 | ||||||||||
| 72,020,048 | ||||||||||||||
Food Service–0.51% | ||||||||||||||
Areas (Pax Midco Spain) | ||||||||||||||
Term Loan B-2 (3 mo. EURIBOR + 5.00%) | 5.00% | 12/31/2029 | EUR | 4,376 | 4,831,922 | |||||||||
Term Loan B-2 (3 mo. EURIBOR + 5.00%) | 8.74% | 12/31/2029 | EUR | 9,335 | 10,306,625 | |||||||||
WW International, Inc., Term Loan(e) | - | 04/13/2028 | 1,485 | 423,879 | ||||||||||
| 15,562,426 | ||||||||||||||
Forest Products–0.16% | ||||||||||||||
NewLife Forest Restoration LLC, Term Loan | - | 04/10/2029 | 4,883 | 4,883,497 | ||||||||||
Health Care–2.89% | ||||||||||||||
Acacium (Impala Bidco Ltd.) (United Kingdom), Term Loan B (1 mo. SONIA + 5.00%)(d) | 9.95% | 06/08/2028 | GBP | 1,000 | 1,273,900 | |||||||||
Ascend Learning LLC, First Lien Term Loan (1 mo. Term SOFR + 3.60%) | 8.85% | 12/11/2028 | 12,431 | 12,428,045 | ||||||||||
Bracket Intermediate Holding Corp. (Signant), First Lien Term Loan | 10.43% | 05/08/2028 | 3,980 | 4,001,453 | ||||||||||
Certara Holdco, Inc., Term Loan B (1 mo. Term SOFR + 3.00%)(d) | 8.25% | 06/26/2031 | 507 | 506,899 | ||||||||||
Curium BidCo S.a.r.l. (Luxembourg), Term Loan (3 mo. Term SOFR + 4.00%) | 9.33% | 07/31/2029 | 665 | 668,217 | ||||||||||
Ethypharm (Financiere Verdi, Orphea Ltd.) (France), Term Loan B | 9.70% | 04/17/2028 | GBP | 1,378 | 1,678,412 | |||||||||
Explorer Holdings, Inc., Term Loan (1 mo. Term SOFR + 4.00%) | 9.25% | 02/04/2027 | 7,029 | 7,076,375 | ||||||||||
Global Medical Response, Inc., Term Loan (3 mo. Term SOFR + 5.50%) | 10.84% | 10/31/2028 | 9,282 | 9,246,404 | ||||||||||
ICU Medical, Inc., Term Loan B (3 mo. Term SOFR + 2.65%) | 7.98% | 01/08/2029 | 591 | 591,536 | ||||||||||
International SOS L.P. (AEA International), Term Loan B (3 mo. Term SOFR + 2.75%) | 8.03% | 09/07/2028 | 4,740 | 4,754,879 | ||||||||||
IVC Evidensia (Indep Vetcare Group) (United Kingdom), Term Loan B | 10.08% | 12/12/2028 | 641 | 641,543 | ||||||||||
MB2 Dental Solutions LLC, Revolver Loan(d)(f) | 0.00% | 02/15/2031 | 155 | 154,646 | ||||||||||
MB2 Dental Solutions LLC | ||||||||||||||
Delayed Draw Term Loan(d)(f) | 0.00% | 02/15/2031 | 1,645 | 1,646,817 | ||||||||||
Delayed Draw Term Loan(d)(f) | 0.00% | 02/15/2031 | 987 | 988,090 | ||||||||||
Revolver Loan (3 mo. Term SOFR + 6.33%)(d) | 11.25% | 02/15/2031 | 174 | 174,388 | ||||||||||
Term Loan (1 mo. Term SOFR + 6.00%)(d) | 11.25% | 02/15/2031 | 4,739 | 4,744,117 | ||||||||||
MedAssets Software Intermediate Holdings, Inc. (nThrive TSG) | ||||||||||||||
First Lien Term Loan (1 mo. Term SOFR + 4.11%) (Acquired 01/20/2022-06/13/2024; Cost $10,338,546)(g) | 9.36% | 12/18/2028 | 11,173 | 7,758,313 | ||||||||||
Second Lien Term Loan (1 mo. Term SOFR + 6.75%) (Acquired 11/19/2021-12/16/2021; Cost $2,719,566)(g) | 12.11% | 12/17/2029 | 2,752 | 1,209,052 | ||||||||||
Mehilainen Yhtiot Oy (Finland) | ||||||||||||||
Delayed Draw Term Loan B-6(f) | 0.00% | 02/07/2031 | EUR | 459 | 508,513 | |||||||||
Term Loan B-5-B | 7.62% | 02/07/2031 | EUR | 2,564 | 2,841,886 | |||||||||
Neuraxpharm (Cerebro BidCo/Blitz F20-80 GmbH) (Germany) | ||||||||||||||
Term Loan B (3 mo. EURIBOR + 3.75%) | 7.39% | 12/15/2027 | EUR | 10 | 11,427 | |||||||||
Term Loan B-2 (3 mo. EURIBOR + 3.75%) | 7.39% | 12/15/2027 | EUR | 6 | 6,601 | |||||||||
Organon & Co., Term Loan B (1 mo. Term SOFR + 2.50%) | 7.84% | 05/19/2031 | 8,984 | 9,045,831 | ||||||||||
PAREXEL International Corp., Term Loan B (1 mo. Term SOFR + 3.00%) | 8.25% | 11/15/2028 | 99 | 99,041 | ||||||||||
Sharp Services LLC, Term Loan (3 mo. Term SOFR + 3.75%)(d) | 9.08% | 12/31/2028 | 337 | 337,394 | ||||||||||
Summit Behavioral Healthcare LLC, Term Loan B (3 mo. Term SOFR + 4.25%)(d) | 9.31% | 11/24/2028 | 1,619 | 1,570,703 | ||||||||||
See accompanying Notes to Financial Statements which are an integral part of the financial statements.
| 8 | Invesco Senior Floating Rate Fund |
Interest Rate | Maturity Date | Principal Amount (000)(a) | Value | |||||||||||
Health Care–(continued) | ||||||||||||||
TEAM Services Group, LLC, Term Loan B (1 mo. Term SOFR + 5.31%) | 10.65% | 12/20/2027 | $ | 5,753 | $ 5,677,829 | |||||||||
TTF Holdings, LLC (Soliant), Term Loan B (1 mo. Term SOFR + 3.75%) | 9.00% | 07/18/2031 | 7,226 | 7,244,105 | ||||||||||
Veonet Lense GmbH (BLIVEO) (Germany), Incremental Term Loan B | 7.97% | 03/14/2029 | EUR | 316 | 351,882 | |||||||||
Waystar (fka Navicure, Inc.), Term Loan B (1 mo. Term SOFR + 2.75%) | 8.00% | 10/22/2029 | 226 | 227,032 | ||||||||||
Zelis Cost Management Buyer, Inc., Term Loan B-2 (1 mo. Term SOFR + 2.75%) | 8.00% | 09/28/2029 | 90 | 90,638 | ||||||||||
| 87,555,968 | ||||||||||||||
Home Furnishings–1.13% | ||||||||||||||
Homeserve USA Holding Corp., Term Loan B (1 mo. Term SOFR + 2.50%) | 7.84% | 10/21/2030 | 3,161 | 3,169,939 | ||||||||||
Mattress Holding Corp., Term Loan (3 mo. Term SOFR + 4.51%) | 9.85% | 09/25/2028 | 6,400 | 6,410,065 | ||||||||||
Serta Simmons Bedding LLC | ||||||||||||||
First Lien Term Loan (3 mo. Term SOFR + 7.61%)(d) | 12.89% | 06/29/2028 | 757 | 755,408 | ||||||||||
Term Loan (3 mo. Term SOFR + 7.61%) | 12.95% | 06/29/2028 | 10,673 | 8,740,448 | ||||||||||
SIWF Holdings, Inc., Term Loan B (1 mo. Term SOFR + 4.11%) | 9.36% | 10/06/2028 | 9,149 | 6,971,170 | ||||||||||
Weber-Stephen Products LLC | ||||||||||||||
Incremental Term Loan B (1 mo. Term SOFR + 4.35%) | 9.60% | 10/30/2027 | 1,846 | 1,732,286 | ||||||||||
Term Loan B (1 mo. Term SOFR + 3.36%) | 8.61% | 10/30/2027 | 6,808 | 6,394,889 | ||||||||||
| 34,174,205 | ||||||||||||||
Industrial Equipment–5.06% | ||||||||||||||
Alliance Laundry Systems LLC, Term Loan B (1 mo. Term SOFR + 3.50%) | 8.81% | 08/09/2031 | 14,495 | 14,555,818 | ||||||||||
Arconic Rolled Products Corp., Term Loan B (1 mo. Term SOFR + 3.25%) | 8.56% | 08/18/2030 | 3,837 | 3,850,673 | ||||||||||
Chart Industries, Inc., Term Loan B (3 mo. Term SOFR + 2.50%) | 7.82% | 03/15/2030 | 5,920 | 5,944,497 | ||||||||||
Crosby US Acquisition Corp., Term Loan (1 mo. Term SOFR + 4.00%) | 9.25% | 08/16/2029 | 3,350 | 3,370,185 | ||||||||||
Deliver Buyer, Inc. (MHS Holdings), Term Loan (3 mo. Term SOFR + 5.50%) | 10.83% | 06/01/2029 | 8,832 | 8,021,839 | ||||||||||
Discovery Energy Holding Co. (Kohler Energy), Term Loan B (3 mo. Term SOFR + 4.75%) | 10.08% | 05/01/2031 | 6,900 | 6,953,310 | ||||||||||
DXP Enterprises, Inc., Incremental Term Loan (6 mo. Term SOFR + 4.85%) | 10.16% | 10/11/2030 | 6,177 | 6,220,168 | ||||||||||
EMRLD Borrower L.P. (Copeland) | ||||||||||||||
Incremental Term Loan B (3 mo. Term SOFR + 2.50%) | 7.56% | 08/04/2031 | 5,528 | 5,534,792 | ||||||||||
Term Loan B (3 mo. Term SOFR + 2.50%) | 7.56% | 05/31/2030 | 7,682 | 7,690,055 | ||||||||||
Kantar (Summer BC Bidco/KANGRP) (United Kingdom) | ||||||||||||||
Revolver Loan(d)(f) | 0.00% | 06/04/2026 | 10,250 | 9,481,250 | ||||||||||
Term Loan B (3 mo. Term SOFR + 5.26%) | 10.59% | 02/05/2029 | 6,959 | 7,011,036 | ||||||||||
Robertshaw US Holding Corp. | ||||||||||||||
First Lien Term Loan (Acquired 05/10/2023-10/17/2023; Cost $7,662,673)(d)(g)(i)(j) | 0.00% | 02/28/2027 | 7,763 | 7,367,353 | ||||||||||
Second Lien Term Loan (Acquired 05/09/2023-07/14/2023; Cost $13,270,973)(d)(g)(i)(j) | 0.00% | 02/28/2027 | 21,991 | 13,942,457 | ||||||||||
Third Lien Term Loan (Acquired 05/09/2023; Cost $1,054,908)(d)(g)(i)(j) | 0.00% | 02/28/2027 | 3,508 | 1,789,180 | ||||||||||
STS Operating, Inc. (Sunsource), Term Loan (1 mo. Term SOFR + 4.09%) | 9.35% | 03/25/2031 | 7,986 | 7,959,028 | ||||||||||
Sulo SAS (France), Term Loan B (3 mo. EURIBOR + 5.00%)(d) | 8.59% | 05/21/2031 | EUR | 1,000 | 1,113,690 | |||||||||
Tank Holding Corp. | ||||||||||||||
Revolver Loan (1 mo. Term SOFR + 5.85%)(d) | 11.10% | 03/31/2028 | 461 | 447,419 | ||||||||||
Revolver Loan(d)(f) | 0.00% | 03/31/2028 | 461 | 447,419 | ||||||||||
Term Loan (1 mo. Term SOFR + 5.85%) | 11.10% | 03/31/2028 | 13,576 | 13,421,125 | ||||||||||
Thyssenkrupp Elevators (Vertical Midco GmbH) (Germany), Term Loan B-2 (6 mo. Term SOFR + 3.50%) | 8.59% | 04/30/2030 | 14,994 | 15,063,522 | ||||||||||
Victory Buyer LLC (Vantage Elevator) | ||||||||||||||
First Lien Term Loan (1 mo. Term SOFR + 3.86%) | 9.14% | 11/19/2028 | 12,749 | 12,292,149 | ||||||||||
Second Lien Term Loan (1 mo. Term SOFR + 7.11%)(d) | 12.37% | 11/19/2029 | 1,148 | 990,087 | ||||||||||
| 153,467,052 | ||||||||||||||
Insurance–2.22% | ||||||||||||||
Acrisure LLC, Term Loan B-6 (3 mo. Term SOFR + 3.25%) | 8.59% | 11/06/2030 | 19,700 | 19,608,092 | ||||||||||
Alliant Holdings Intermediate LLC, Term Loan B-6 (1 mo. Term SOFR + 3.50%) | 8.81% | 11/06/2030 | 9,618 | 9,658,822 | ||||||||||
AmWINS Group LLC, Term Loan (1 mo. Term SOFR + 2.36%) | 7.61% | 02/19/2028 | 1,348 | 1,352,464 | ||||||||||
Hub International Ltd., Term Loan (3 mo. Term SOFR + 3.00%) | 8.23% | 06/20/2030 | 5,635 | 5,645,116 | ||||||||||
See accompanying Notes to Financial Statements which are an integral part of the financial statements.
| 9 | Invesco Senior Floating Rate Fund |
Interest Rate | Maturity Date | Principal Amount (000)(a) | Value | |||||||||||
Insurance–(continued) | ||||||||||||||
Sedgwick Claims Management Services, Inc., Term Loan (3 mo. Term SOFR + 3.00%) | 8.25% | 07/31/2031 | $ | 10,267 | $ 10,292,205 | |||||||||
Truist Insurance Holdings, Term Loan B (3 mo. Term SOFR + 3.25%) | 8.58% | 05/06/2031 | 8,851 | 8,874,369 | ||||||||||
USI, Inc. | ||||||||||||||
Term Loan (1 mo. Term SOFR + 2.75%) | 8.08% | 09/27/2030 | 1,926 | 1,928,005 | ||||||||||
Term Loan B (3 mo. Term SOFR + 2.75%) | 8.08% | 11/22/2029 | 9,995 | 10,009,516 | ||||||||||
| 67,368,589 | ||||||||||||||
Leisure Goods, Activities & Movies–2.91% | ||||||||||||||
Carnival Corp. | ||||||||||||||
Term Loan B (1 mo. Term SOFR + 2.75%) | 8.00% | 08/08/2027 | 75 | 75,261 | ||||||||||
Term Loan B (1 mo. Term SOFR + 2.75%) | 8.00% | 10/18/2028 | 22,364 | 22,467,991 | ||||||||||
Crown Finance US, Inc., Term Loan (1 mo. Term SOFR + 1.61%) | 6.86% | 07/31/2028 | 11,432 | 11,637,352 | ||||||||||
Fitness International LLC, Term Loan B (3 mo. Term SOFR + 5.25%)(d) | 10.53% | 02/05/2029 | 7,387 | 7,378,106 | ||||||||||
GBT Group Servicers B.V. (United Kingdom), Term Loan B (3 mo. Term SOFR + 3.00%) | 8.28% | 07/25/2031 | 5,622 | 5,633,039 | ||||||||||
LC Ahab US Bidco LLC, Term Loan B (1 mo. Term SOFR + 3.50%) | 8.75% | 05/01/2031 | 2,699 | 2,712,160 | ||||||||||
Nord Anglia Education | ||||||||||||||
Term Loan (3 mo. Term SOFR + 4.00%) | 9.06% | 01/31/2028 | 3,851 | 3,882,796 | ||||||||||
Term Loan B-2 (3 mo. Term SOFR + 3.75%) | 8.81% | 02/26/2031 | 3,450 | 3,481,756 | ||||||||||
Parques Reunidos (Piolin Bidco S.A.U.) (Spain) | ||||||||||||||
Revolver Loan (1 mo. EURIBOR + 3.50%)(d) | 1.05% | 03/16/2026 | EUR | 705 | 772,668 | |||||||||
Revolver Loan(d)(f) | 0.00% | 03/16/2026 | 1,937 | 2,123,985 | ||||||||||
Term Loan B-4 (6 mo. EURIBOR + 4.50%) | 8.18% | 09/16/2029 | EUR | 1,811 | 2,002,523 | |||||||||
Scenic (Columbus Capital B.V.) (Australia), Term Loan (3 mo. EURIBOR + 3.75%) | 7.47% | 03/05/2027 | EUR | 12,217 | 12,829,243 | |||||||||
Vue International Bidco PLC (United Kingdom) | ||||||||||||||
Second Lien Term Loan (Acquired 02/20/2024-08/13/2024; Cost $2,327,144)(g) | 3.59% | 12/31/2027 | EUR | 3,624 | 2,183,423 | |||||||||
Term Loan (6 mo. EURIBOR + 8.00%) (Acquired 09/15/2022-02/20/2024; Cost $1,885,666)(g) | 11.84% | 06/30/2027 | EUR | 1,872 | 2,051,864 | |||||||||
Term Loan (1 mo. EURIBOR + 8.00%) (Acquired 02/20/2024-04/08/2024; Cost $1,073,392)(g) | 11.84% | 06/30/2027 | EUR | 1,035 | 1,197,341 | |||||||||
Term Loan (1 mo. EURIBOR + 8.50%) (Acquired 02/20/2024-08/13/2024; Cost $2,317,797)(g) | 3.59% | 12/31/2027 | EUR | 2,206 | 2,310,396 | |||||||||
World Choice Investments, Term Loan B (3 mo. Term SOFR + 4.75%) | 9.87% | 08/13/2031 | 5,549 | 5,538,762 | ||||||||||
| 88,278,666 | ||||||||||||||
Lodging & Casinos–2.51% | ||||||||||||||
Aimbridge Acquisition Co., Inc. | ||||||||||||||
First Lien Term Loan (1 mo. Term SOFR + 3.86%) | 9.11% | 02/02/2026 | 5,787 | 5,663,025 | ||||||||||
First Lien Term Loan (1 mo. Term SOFR + 4.86%) | 10.11% | 02/02/2026 | 6,509 | 6,399,415 | ||||||||||
Caesars Entertainment, Inc. | ||||||||||||||
Incremental Term Loan B (1 mo. Term SOFR + 2.75%) | 8.00% | 02/06/2030 | 8,056 | 8,076,351 | ||||||||||
Term Loan (1 mo. Term SOFR + 2.75%) | 8.00% | 02/06/2031 | 12,460 | 12,487,719 | ||||||||||
Fertitta Entertainment LLC (Golden Nugget), Term Loan B (1 mo. Term SOFR + 3.75%) | 9.09% | 01/27/2029 | 5,921 | 5,919,622 | ||||||||||
GVC Finance LLC, Term Loan B (6 mo. Term SOFR + 2.75%) | 8.01% | 10/31/2029 | 15,057 | 15,105,907 | ||||||||||
Hilton Grand Vacations Borrower LLC, Term Loan (1 mo. Term SOFR + 2.50%) | 7.75% | 08/02/2028 | 8,383 | 8,388,482 | ||||||||||
Penn Entertainment, Inc., Term Loan B (1 mo. Term SOFR + 2.85%) | 8.10% | 05/03/2029 | 7,748 | 7,786,802 | ||||||||||
Travel + Leisure Co., Incremental Term Loan (1 mo. Term SOFR + 3.35%) | 8.66% | 12/14/2029 | 6,252 | 6,273,931 | ||||||||||
| 76,101,254 | ||||||||||||||
Nonferrous Metals & Minerals–0.88% | ||||||||||||||
AZZ, Inc., Term Loan (1 mo. Term SOFR + 3.25%) | 8.50% | 05/14/2029 | 4,211 | 4,246,963 | ||||||||||
Covia Holdings Corp., Term Loan (3 mo. Term SOFR + 4.26%) | 9.58% | 07/31/2026 | 15,148 | 15,078,854 | ||||||||||
Form Technologies LLC | ||||||||||||||
First Lien Term Loan (3 mo. Term SOFR + 4.85%) | 14.41% | 07/19/2025 | 5,033 | 4,911,331 | ||||||||||
First Lien Term Loan (3 mo. Term SOFR + 9.35%) | 14.41% | 10/22/2025 | 3,006 | 2,405,109 | ||||||||||
| 26,642,257 | ||||||||||||||
Oil & Gas–1.77% | ||||||||||||||
ITT Holdings LLC (IMTT), Term Loan B (1 mo. Term SOFR + 3.00%) | 8.35% | 10/11/2030 | 4,186 | 4,201,721 | ||||||||||
See accompanying Notes to Financial Statements which are an integral part of the financial statements.
| 10 | Invesco Senior Floating Rate Fund |
Interest Rate | Maturity Date | Principal Amount (000)(a) | Value | |||||||||||
Oil & Gas–(continued) | ||||||||||||||
McDermott International Ltd. | ||||||||||||||
LOC(d)(f) | 0.00% | 12/31/2026 | $ | 5,184 | $ 4,743,398 | |||||||||
LOC (3 mo. Term SOFR + 5.01%)(d) | 0.50% | 12/31/2026 | 1,354 | 1,238,896 | ||||||||||
LOC(d) | 0.50% | 06/30/2027 | 9,674 | 6,529,683 | ||||||||||
LOC (3 mo. Term SOFR + 4.29%)(d) | 4.15% | 06/30/2027 | 5,868 | 3,198,185 | ||||||||||
PIK Term Loan B, 3.00% PIK Rate, 6.36% Cash Rate(h) | 6.46% | 12/31/2027 | 4,786 | 1,850,592 | ||||||||||
Term Loan (3 mo. Term SOFR + 7.76%)(d) | 13.10% | 12/31/2026 | 4,488 | 4,577,839 | ||||||||||
Term Loan (1 mo. Term SOFR + 3.11%) | 8.36% | 06/30/2027 | 725 | 389,761 | ||||||||||
Par Petroleum LLC and Par Petroleum Finance Corp. (Par Pacific), Term Loan B (3 mo. Term SOFR + 3.75%) | 9.06% | 02/28/2030 | 4,738 | 4,773,216 | ||||||||||
PG Investment Co. 59 S.a.r.l./URSA Minor US Bidco LLC (Rosen), Term Loan B (3 mo. Term SOFR + 3.50%) | 8.83% | 03/26/2031 | 6,466 | 6,494,951 | ||||||||||
Planet US Buyer LLC (Wood Mackenzie), Term Loan (3 mo. Term SOFR + 3.50%) | 8.60% | 02/07/2031 | 5,629 | 5,670,163 | ||||||||||
Prairie ECI Acquiror L.P., Term Loan B-2 (1 mo. Term SOFR + 4.75%) | 10.00% | 08/01/2029 | 5,424 | 5,434,181 | ||||||||||
Rockwood Service Corp., Term loan B (3 mo. Term SOFR + 3.69%) | 8.75% | 07/23/2031 | 1,457 | 1,464,578 | ||||||||||
TransMontaigne Partners LLC, Term Loan B (1 mo. Term SOFR + 3.61%) | 8.86% | 11/17/2028 | 3,104 | 3,124,557 | ||||||||||
| 53,691,721 | ||||||||||||||
Publishing–2.47% | ||||||||||||||
Adtalem Global Education Inc., Term Loan B (1 mo. Term SOFR + 2.75%) | 8.00% | 08/12/2028 | 1,037 | 1,040,277 | ||||||||||
Cengage Learning, Inc., Term Loan B (6 mo. Term SOFR + 4.25%) | 9.54% | 03/22/2031 | 15,883 | 15,956,379 | ||||||||||
Century DE Buyer LLC (Simon & Schuster), Term Loan (1 mo. Term SOFR + 4.01%) | 9.26% | 10/30/2030 | 4,213 | 4,230,545 | ||||||||||
Dotdash Meredith, Inc., Term Loan B (1 mo. Term SOFR + 4.10%) | 9.44% | 12/01/2028 | 18,004 | 18,037,938 | ||||||||||
Harbor Purchaser, Inc. (Houghton Mifflin Harcourt) | ||||||||||||||
First Lien Term Loan B (1 mo. Term SOFR + 5.35%) | 10.60% | 04/09/2029 | 11,687 | 11,108,525 | ||||||||||
Second Lien Term Loan B (1 mo. Term SOFR + 8.50%) | 13.75% | 04/08/2030 | 8,093 | 7,654,524 | ||||||||||
McGraw-Hill Education, Inc., Term Loan B (3 mo. Term SOFR + 4.00%) | 9.23% | 08/01/2031 | 12,937 | 13,002,072 | ||||||||||
Micro Holding L.P., Term Loan (1 mo. Term SOFR + 4.25%) | 9.50% | 05/03/2028 | 3,982 | 3,976,316 | ||||||||||
| 75,006,576 | ||||||||||||||
Radio & Television–0.68% | ||||||||||||||
iHeartCommunications, Inc. | ||||||||||||||
Incremental Term Loan (1 mo. Term SOFR + 3.36%) | 8.61% | 05/01/2026 | 3,221 | 2,705,738 | ||||||||||
Term Loan (1 mo. Term SOFR + 3.11%) | 8.36% | 05/01/2026 | 11,360 | 9,507,230 | ||||||||||
Sinclair Television Group, Inc., Term Loan B-3 (3 mo. Term SOFR + 3.26%) | 8.51% | 04/01/2028 | 1,108 | 795,425 | ||||||||||
Univision Communications, Inc., Incremental Term Loan B (1 mo. Term SOFR + 3.61%) | 8.86% | 01/23/2029 | 7,764 | 7,552,977 | ||||||||||
| 20,561,370 | ||||||||||||||
Retailers (except Food & Drug)–1.30% | ||||||||||||||
Action Holding B.V. (Netherlands), Term Loan B-4 (3 mo. Term SOFR + 3.25%) | 8.58% | 10/28/2030 | 8,069 | 8,109,133 | ||||||||||
Action Holding B.V. (Peer Holdings) (Netherlands), Term Loan B-5 (3 mo. Term SOFR + 3.00%) | 8.33% | 06/20/2031 | 5,744 | 5,769,994 | ||||||||||
Bass Pro Group LLC, Term Loan B-2 (1 mo. Term SOFR + 3.86%) | 9.11% | 03/06/2028 | 11,248 | 11,269,650 | ||||||||||
CNT Holdings I Corp. (1-800 Contacts), First Lien Term Loan (3 mo. Term SOFR + 3.50%) | 8.75% | 11/08/2027 | 8,432 | 8,466,781 | ||||||||||
Savers, Inc., Term Loan (3 mo. Term SOFR + 3.75%) | 9.08% | 04/26/2028 | 5,884 | 5,898,702 | ||||||||||
| 39,514,260 | ||||||||||||||
Surface Transport–1.30% | ||||||||||||||
Carriage Purchaser, Inc., Term Loan B (1 mo. Term SOFR + 4.36%) | 9.61% | 10/02/2028 | 2,681 | 2,695,604 | ||||||||||
First Student Bidco, Inc. | ||||||||||||||
Incremental Term Loan B (3 mo. Term SOFR + 3.10%) | 8.43% | 11/01/2030 | 12,146 | 12,194,960 | ||||||||||
Term Loan B (3 mo. Term SOFR + 3.26%) | 8.60% | 07/21/2028 | 6,626 | 6,649,924 | ||||||||||
Term Loan C (3 mo. Term SOFR + 3.26%) | 8.60% | 07/21/2028 | 2,020 | 2,027,736 | ||||||||||
Hurtigruten Group A/S (Explorer II AS) (Norway) | ||||||||||||||
Term Loan A (3 mo. EURIBOR + 8.50%) (Acquired 02/23/2024-08/23/2024; Cost $12,047,797)(g) | 0.02% | 02/22/2029 | EUR | 26,585 | 3,021,487 | |||||||||
Term Loan B-2 (3 mo. EURIBOR + 7.00%) (Acquired 02/23/2024-08/23/2024; Cost $5,821,453)(g) | 9.91% | 09/30/2027 | EUR | 5,745 | 4,730,752 | |||||||||
PODS LLC, Incremental Term Loan (3 mo. Term SOFR + 4.26%) | 9.51% | 03/31/2028 | 4,815 | 4,556,112 | ||||||||||
See accompanying Notes to Financial Statements which are an integral part of the financial statements.
| 11 | Invesco Senior Floating Rate Fund |
Interest Rate | Maturity Date | Principal Amount (000)(a) | Value | |||||||||||
Surface Transport–(continued) | ||||||||||||||
Reception Purchaser LLC (STG - XPOI Opportunity), Term Loan (3 mo. Term SOFR + 6.15%) | 11.48% | 03/24/2028 | $ | 7,294 | $ 3,549,753 | |||||||||
Reception Purchaser, LLC (STG - XPOI Opportunity), Incremental Term Loan (3 mo. Term SOFR + 6.15%) | 13.50% | 03/24/2028 | 94 | 45,652 | ||||||||||
| 39,471,980 | ||||||||||||||
Telecommunications–4.54% | ||||||||||||||
Avaya, Inc., Term Loan (1 mo. Term SOFR + 7.50%) | 12.75% | 08/01/2028 | 8,603 | 7,682,758 | ||||||||||
CCI Buyer, Inc. (Consumer Cellular), First Lien Term Loan (3 mo. Term SOFR + 4.00%) | 9.33% | 12/17/2027 | 17,163 | 17,216,813 | ||||||||||
Crown Subsea Communications Holding, Inc., Term Loan B (3 mo. Term SOFR + 4.00%) | 9.25% | 01/30/2031 | 13,601 | 13,715,951 | ||||||||||
Genesys Cloud Services Holdings I LLC | ||||||||||||||
Incremental Term Loan (1 mo. Term SOFR + 3.86%) | 9.11% | 12/01/2027 | 2,010 | 2,023,092 | ||||||||||
Term Loan B (1 mo. Term SOFR + 3.50%) | 8.75% | 12/01/2027 | 265 | 266,042 | ||||||||||
II-VI, Inc., Term Loan B-1 (1 mo. Term SOFR + 2.50%) | 7.75% | 07/02/2029 | 7,130 | 7,165,381 | ||||||||||
Inmarsat Finance PLC (United Kingdom), Term Loan B (1 mo. Term SOFR + 4.50%) | 9.75% | 09/27/2029 | 17,834 | 17,392,385 | ||||||||||
Iridium Satellite LLC, Term Loan B (1 mo. Term SOFR + 2.25%) | 7.50% | 09/20/2030 | 1,765 | 1,761,198 | ||||||||||
Lumen Technologies, Inc. | ||||||||||||||
Term Loan B-1 (1 mo. Term SOFR + 2.46%) | 7.74% | 04/15/2030 | 650 | 527,367 | ||||||||||
Term Loan B-2 (1 mo. Term SOFR + 2.46%) | 7.74% | 04/15/2029 | 3,530 | 2,790,734 | ||||||||||
Midcontinent Communications, Term Loan B(d)(e) | - | 08/13/2031 | 5,436 | 5,443,108 | ||||||||||
MLN US HoldCo LLC (dba Mitel) | ||||||||||||||
First Lien Term Loan B (3 mo. Term SOFR + 4.60%) | 9.95% | 11/30/2025 | 358 | 22,363 | ||||||||||
Second Lien Term Loan B (3 mo. Term SOFR + 8.85%) | 14.20% | 11/30/2026 | 923 | 69,265 | ||||||||||
Second Lien Term Loan B-1 (3 mo. Term SOFR + 6.80%) | 12.08% | 10/18/2027 | 23,470 | 2,581,752 | ||||||||||
Term Loan (3 mo. Term SOFR + 6.54%) | 11.82% | 10/18/2027 | 10,543 | 6,338,832 | ||||||||||
Third Lien Term Loan (3 mo. Term SOFR + 9.35%) | 14.63% | 10/18/2027 | 8,152 | 542,629 | ||||||||||
Telesat LLC, Term Loan B-5 (3 mo. Term SOFR + 3.01%) | 8.07% | 12/07/2026 | 12,567 | 6,055,497 | ||||||||||
ViaSat, Inc. | ||||||||||||||
Term Loan (1 mo. Term SOFR + 4.50%) | 9.75% | 03/02/2029 | 10,023 | 9,395,091 | ||||||||||
Term Loan B (1 mo. Term SOFR + 4.61%) | 9.94% | 05/30/2030 | 3,711 | 3,464,103 | ||||||||||
Voyage Digital (NC) Ltd., Term Loan (3 mo. Term SOFR + 3.25%)(d) | 8.35% | 05/11/2029 | 5,789 | 5,810,357 | ||||||||||
Windstream Services LLC, Term Loan (1 mo. Term SOFR + 6.35%) | 11.60% | 09/21/2027 | 12,435 | 12,551,313 | ||||||||||
Zayo Group Holdings, Inc. | ||||||||||||||
Incremental Term Loan (1 mo. Term SOFR + 4.25%) | 9.50% | 03/09/2027 | 4,952 | 4,622,051 | ||||||||||
Term Loan (1 mo. Term SOFR + 3.11%) | 8.25% | 03/09/2027 | 11,073 | 10,251,259 | ||||||||||
| 137,689,341 | ||||||||||||||
Utilities–2.67% | ||||||||||||||
Brookfield WEC Holdings, Inc., First Lien Term Loan (1 mo. Term SOFR + 2.75%) | 8.00% | 01/27/2031 | 4,395 | 4,403,372 | ||||||||||
Covanta Holding Corp. | ||||||||||||||
Incremental Term Loan B (1 mo. Term SOFR + 2.75%) | 8.09% | 11/30/2028 | 765 | 767,813 | ||||||||||
Incremental Term Loan C (1 mo. Term SOFR + 2.75%) | 8.09% | 11/30/2028 | 4 | 3,624 | ||||||||||
Eastern Power LLC, Term Loan (1 mo. USD LIBOR + 3.75%) | 10.50% | 04/03/2028 | 5,178 | 5,192,304 | ||||||||||
Edgewater Generation, Term Loan (1 mo. Term SOFR + 4.25%) | 9.50% | 08/01/2030 | 5,839 | 5,898,633 | ||||||||||
Frontera Generation Holdings LLC | ||||||||||||||
First Lien Term Loan (3 mo. Term SOFR + 13.26%) (Acquired 07/28/2021; Cost $4,144,155)(g) | 18.60% | 07/28/2026 | 4,165 | 5,461,329 | ||||||||||
Second Lien Term Loan (3 mo. Term SOFR + 1.76%) (Acquired 07/28/2021; Cost $2,480,666)(g) | 7.10% | 07/28/2028 | 4,042 | 3,299,757 | ||||||||||
Generation Bridge Northeast LLC, Term Loan B (1 mo. Term SOFR + 3.50%) | 8.75% | 08/22/2029 | 4,701 | 4,746,621 | ||||||||||
Hamilton Projects Acquiror LLC, Term Loan B (1 mo. Term SOFR + 3.75%) | 9.00% | 05/22/2031 | 2,507 | 2,531,051 | ||||||||||
KAMC Holdings, Inc. (Franklin Energy Group), First Lien Term Loan B (3 mo. Term SOFR + 4.26%) | 9.32% | 08/14/2026 | 6,165 | 6,126,026 | ||||||||||
Lightning Power, LLC, Term Loan B (3 mo. Term SOFR + 3.25%) | 8.35% | 08/07/2031 | 11,810 | 11,864,978 | ||||||||||
Lightstone Holdco LLC | ||||||||||||||
Term Loan B (3 mo. Term SOFR + 5.75%) | 11.00% | 01/29/2027 | 16,599 | 16,656,381 | ||||||||||
Term Loan C (3 mo. Term SOFR + 5.75%) | 11.00% | 01/29/2027 | 936 | 938,965 | ||||||||||
See accompanying Notes to Financial Statements which are an integral part of the financial statements.
| 12 | Invesco Senior Floating Rate Fund |
Interest Rate | Maturity Date | Principal Amount (000)(a) | Value | |||||||||||
Utilities–(continued) | ||||||||||||||
Talen Energy Supply LLC | ||||||||||||||
Term Loan B (3 mo. Term SOFR + 3.50%) | 8.60% | 05/17/2030 | $ | 7,261 | $ 7,312,624 | |||||||||
Term Loan C (3 mo. Term SOFR + 3.50%) | 8.60% | 05/17/2030 | 4,504 | 4,535,818 | ||||||||||
Vistra Zero Operating Co. LLC, Term Loan B (1 mo. Term SOFR + 2.75%) | 8.00% | 04/30/2031 | 1,213 | 1,221,235 | ||||||||||
| 80,960,531 | ||||||||||||||
Total Variable Rate Senior Loan Interests (Cost $2,677,317,051) | 2,574,346,469 | |||||||||||||
| Shares | ||||||||||||||
Common Stocks & Other Equity Interests–5.90% | ||||||||||||||
Automotive–0.01% | ||||||||||||||
Cabonline (Acquired 10/30/2023; Cost $10) (Sweden)(d)(g) | 10,623,352 | 1,040 | ||||||||||||
Cabonline (Acquired 10/31/2023; Cost $8) (Sweden)(d)(g) | 9,066,619 | 446 | ||||||||||||
Cabonline (Acquired 10/30/2023; Cost $271,002) (Sweden)(d)(g) | 301,850,286 | 396,854 | ||||||||||||
| 398,340 | ||||||||||||||
Building & Development–0.00% | ||||||||||||||
Fagus Holdco PLC (Acquired 06/14/2022; Cost $0) (Spain)(d)(g) | 12,156 | 0 | ||||||||||||
Business Equipment & Services–1.68% | ||||||||||||||
Bloom Parent, Inc. (Acquired 06/11/2024; Cost $3,284,613)(d)(g) | 3,285 | 3,284,613 | ||||||||||||
Monitronics International, Inc. (Acquired 06/30/2023; Cost $8,930,896)(g) | 443,661 | 9,427,796 | ||||||||||||
My Alarm Center LLC, Class A (Acquired 03/09/2021-05/17/2024; Cost $14,582,747)(d)(g)(k) | 162,068 | 38,235,117 | ||||||||||||
| 50,947,526 | ||||||||||||||
Chemicals & Plastics–0.00% | ||||||||||||||
Flint Group (ColourOz Inv) (Acquired 09/19/2023; Cost $0) (Germany)(d)(g) | 92,542 | 0 | ||||||||||||
Containers & Glass Products–0.43% | ||||||||||||||
Keter Group B.V. (Acquired 04/29/2024; Cost $0) (Netherlands)(d)(g) | 1,460,462,130 | 1,614 | ||||||||||||
Libbey Glass LLC (Acquired 11/13/2020-02/10/2022; | 864,916 | 13,051,583 | ||||||||||||
| 13,053,197 | ||||||||||||||
Electronics & Electrical–0.10% | ||||||||||||||
Internap Holding LLC (Acquired 02/06/2018-02/10/2023; | 2,996,076 | 3,145,880 | ||||||||||||
Sandvine Corp. (Acquired 06/28/2024; Cost $0)(d)(g) | 30,037 | 0 | ||||||||||||
| 3,145,880 | ||||||||||||||
Forest Products–0.70% | ||||||||||||||
Restoration Forest Products Group, LLC (Acquired 02/22/2022-08/27/2024; Cost $27,867,285)(d)(g)(k) | 151,272 | 21,102,429 | ||||||||||||
Home Furnishings–0.09% | ||||||||||||||
Serta Simmons Bedding LLC (Acquired 06/29/2023; Cost $53,939)(g) | 347,996 | 2,592,570 | ||||||||||||
Industrial Equipment–0.04% | ||||||||||||||
North American Lifting Holdings, Inc.(k) | 679,193 | 1,103,689 | ||||||||||||
Leisure Goods, Activities & Movies–0.43% | ||||||||||||||
Crown Finance US, Inc. | 629,533 | 13,082,641 | ||||||||||||
Crown Finance US, Inc. | 3,275 | 68,059 | ||||||||||||
Vue International Bidco PLC (Acquired 02/20/2024; Cost $0) (United Kingdom)(d)(g) | 9,989 | 0 | ||||||||||||
Vue International Bidco PLC (Acquired 02/20/2024; Cost $0) (United Kingdom)(d)(g) | 4,919,597 | 6 | ||||||||||||
Vue International Bidco PLC (Acquired 02/20/2024; Cost $0) (United Kingdom)(d)(g) | 3,062,309 | 3 | ||||||||||||
Vue International Bidco PLC, Class A4 (United Kingdom)(d) | 2,134,862 | 2 | ||||||||||||
| 13,150,711 | ||||||||||||||
Nonferrous Metals & Minerals–0.90% | ||||||||||||||
ACNR Holdings, Inc. | 335,868 | 27,149,218 | ||||||||||||
Oil & Gas–0.79% | ||||||||||||||
HGIM Corp.(d)(k) | 116,926 | 4,677,040 | ||||||||||||
See accompanying Notes to Financial Statements which are an integral part of the financial statements.
| 13 | Invesco Senior Floating Rate Fund |
| Shares | Value | |||||||||||||
Oil & Gas–(continued) | ||||||||||||||
McDermott International Ltd.(d) | 1,853,702 | $ 440,254 | ||||||||||||
Sabine Oil & Gas Holdings, Inc. (Acquired 01/16/2013-03/12/2021; Cost $18,267,226)(d)(g)(l) | 18,025 | 1,623 | ||||||||||||
Seadrill Ltd. (Norway)(l) | 1 | 43 | ||||||||||||
Southcross Energy Partners L.P. (Acquired 07/30/2014-10/29/2020; Cost $29,026,224)(d)(g)(k) | 2,914,935 | 3 | ||||||||||||
Talos Energy, Inc.(l) | 947,541 | 10,868,296 | ||||||||||||
Tribune Resources LLC (Acquired 03/30/2018; Cost $18,014,717)(g)(k) | 5,811,199 | 7,891,608 | ||||||||||||
| 23,878,867 | ||||||||||||||
Surface Transport–0.55% | ||||||||||||||
Commercial Barge Line Co. (Acquired 01/31/2020-02/06/2020; Cost $1,838,610)(d)(g) | 35,397 | 3,342,893 | ||||||||||||
Commercial Barge Line Co., Series B, Pfd., Wts., expiring 04/27/2045 (Acquired 02/05/2020-02/17/2021; Cost $2,380,533)(d)(g) | 100,115 | 9,748,198 | ||||||||||||
Commercial Barge Line Co., Series B, Wts., expiring 04/30/2045 (Acquired 02/23/2024-08/29/2024; Cost $125,144)(d)(g) | 300,345 | 187,716 | ||||||||||||
Commercial Barge Line Co., Wts., expiring 04/27/2045 (Acquired 01/31/2020-08/25/2020; Cost $1,932,877)(d)(g) | 37,211 | 3,514,207 | ||||||||||||
Hurtigruten (Explorer II AS), Wts. (Acquired 02/23/2024; Cost $0) | 1,414,767 | 1 | ||||||||||||
| 16,793,015 | ||||||||||||||
Telecommunications–0.08% | ||||||||||||||
Avaya Holdings Corp. (Acquired 05/01/2023; Cost $4,295,205)(g) | 286,347 | 2,171,512 | ||||||||||||
Avaya, Inc. (Acquired 05/01/2023; Cost $778,995)(g) | 51,933 | 393,834 | ||||||||||||
| 2,565,346 | ||||||||||||||
Utilities–0.10% | ||||||||||||||
Frontera Generation Holdings LLC (Acquired 07/28/2021-11/30/2021; Cost $1,035,881)(d)(g)(k) | 295,967 | 2,950,791 | ||||||||||||
Total Common Stocks & Other Equity Interests (Cost $211,110,711) | 178,831,579 | |||||||||||||
| Interest Rate | Maturity Date | Principal Amount (000)(a) | ||||||||||||
U.S. Dollar Denominated Bonds & Notes–4.30% | ||||||||||||||
Aerospace & Defense–0.30% | ||||||||||||||
Castlelake Aviation Finance DAC (m) | 5.00% | 04/15/2027 | $ | 2,000 | 1,958,723 | |||||||||
Rand Parent LLC(m) | 8.50% | 02/15/2030 | 7,113 | 7,119,658 | ||||||||||
| 9,078,381 | ||||||||||||||
Automotive–0.19% | ||||||||||||||
Panther Escrow Issuer LLC (m) | 7.13% | 06/01/2031 | 5,520 | 5,754,059 | ||||||||||
Building & Development–0.59% | ||||||||||||||
Brookfield Property REIT, Inc./BPR Cumulus LLC/BPR Nimbus LLC/GGSI Sellco LLC (m) | 5.75% | 05/15/2026 | 4,527 | 4,519,851 | ||||||||||
Brookfield Property REIT, Inc./BPR Cumulus LLC/BPR Nimbus LLC/GGSI Sellco LLC(m) | 4.50% | 04/01/2027 | 8,160 | 7,874,779 | ||||||||||
Miter Brands Acquisition Holdco, Inc./MIWD Borrower LLC(m) | 6.75% | 04/01/2032 | 911 | 936,759 | ||||||||||
Signal Parent, Inc.(m) | 6.13% | 04/01/2029 | 6,686 | 4,587,525 | ||||||||||
| 17,918,914 | ||||||||||||||
Business Equipment & Services–0.59% | ||||||||||||||
Acuris Finance US, Inc./Acuris Finance S.a.r.l. (m) | 9.00% | 08/01/2029 | 8,576 | 8,608,160 | ||||||||||
Allied Universal Holdco LLC(m) | 7.88% | 02/15/2031 | 6,739 | 6,847,757 | ||||||||||
Boost Newco Borrower LLC(m) | 7.50% | 01/15/2031 | 2,313 | 2,468,399 | ||||||||||
| 17,924,316 | ||||||||||||||
Cable & Satellite Television–0.80% | ||||||||||||||
Altice Financing S.A. (Luxembourg) (m) | 5.75% | 08/15/2029 | 1,414 | 1,090,851 | ||||||||||
Altice Financing S.A. (Luxembourg)(m) | 5.00% | 01/15/2028 | 18,761 | 15,091,911 | ||||||||||
Altice France S.A. (France)(m) | 5.50% | 10/15/2029 | 6,838 | 4,752,516 | ||||||||||
Virgin Media Secured Finance PLC (United Kingdom)(m) | 4.50% | 08/15/2030 | 3,741 | 3,306,939 | ||||||||||
| 24,242,217 | ||||||||||||||
See accompanying Notes to Financial Statements which are an integral part of the financial statements.
| 14 | Invesco Senior Floating Rate Fund |
| Interest Rate | Maturity Date | Principal (000)(a) | Value | |||||||||||
Chemicals & Plastics–0.69% | ||||||||||||||
INEOS Finance PLC (Luxembourg) (m) | 7.50% | 04/15/2029 | $ | 3,623 | $ 3,754,261 | |||||||||
INEOS Quattro Finance 2 PLC (United Kingdom)(m) | 9.63% | 03/15/2029 | 1,889 | 2,039,842 | ||||||||||
SK Invictus Intermediate II S.a.r.l.(m) | 5.00% | 10/30/2029 | 13,605 | 12,850,535 | ||||||||||
Windsor Holdings III LLC(m) | 8.50% | 06/15/2030 | 1,984 | 2,127,676 | ||||||||||
| 20,772,314 | ||||||||||||||
Food Products–0.01% | ||||||||||||||
Sigma Holdco B.V. (Netherlands) (m) | 7.88% | 05/15/2026 | 200 | 197,507 | ||||||||||
Health Care–0.11% | ||||||||||||||
Global Medical Response, Inc. (h)(m) | 10.00% | 10/31/2028 | 2,208 | 2,206,303 | ||||||||||
Organon & Co./Organon Foreign Debt Co-Issuer B.V.(m) | 6.75% | 05/15/2034 | 1,019 | 1,057,298 | ||||||||||
| 3,263,601 | ||||||||||||||
Industrial Equipment–0.15% | ||||||||||||||
Arsenal AIC Parent LLC (m) | 8.00% | 10/01/2030 | 163 | 175,452 | ||||||||||
Chart Industries, Inc.(m) | 7.50% | 01/01/2030 | 669 | 703,781 | ||||||||||
EMRLD Borrower L.P./Emerald Co-Issuer, Inc.(m) | 6.63% | 12/15/2030 | 3,516 | 3,604,899 | ||||||||||
| 4,484,132 | ||||||||||||||
Insurance–0.35% | ||||||||||||||
Acrisure LLC/Acrisure Finance, Inc. (m) | 7.50% | 11/06/2030 | 4,014 | 4,123,249 | ||||||||||
Alliant Holdings Intermediate LLC/Alliant Holdings Co-Issuer(m) | 7.00% | 01/15/2031 | 4,411 | 4,563,184 | ||||||||||
HUB International Ltd.(m) | 7.25% | 06/15/2030 | 1,857 | 1,940,866 | ||||||||||
| 10,627,299 | ||||||||||||||
Lodging & Casinos–0.14% | ||||||||||||||
Caesars Entertainment, Inc. (m) | 6.50% | 02/15/2032 | 896 | 921,317 | ||||||||||
Caesars Entertainment, Inc.(m) | 7.00% | 02/15/2030 | 1,140 | 1,181,414 | ||||||||||
Hilton Grand Vacations Borrower Escrow LLC/Hilton Grand Vacations Borrower Escrow, Inc.(m) | 6.63% | 01/15/2032 | 2,171 | 2,198,772 | ||||||||||
| 4,301,503 | ||||||||||||||
Publishing–0.02% | ||||||||||||||
McGraw-Hill Education, Inc. (m) | 7.38% | 09/01/2031 | 660 | 682,114 | ||||||||||
Retailers (except Food & Drug)–0.09% | ||||||||||||||
Evergreen Acqco 1 L.P./TVI, Inc. (m) | 9.75% | 04/26/2028 | 2,686 | 2,835,930 | ||||||||||
Telecommunications–0.27% | ||||||||||||||
Connect Finco S.a.r.l./Connect US Finco LLC (United Kingdom) (m) | 6.75% | 10/01/2026 | 4,556 | 4,523,375 | ||||||||||
Windstream Escrow LLC/Windstream Escrow Finance Corp.(m) | 7.75% | 08/15/2028 | 3,818 | 3,730,877 | ||||||||||
| 8,254,252 | ||||||||||||||
Total U.S. Dollar Denominated Bonds & Notes (Cost $132,708,220) | 130,336,539 | |||||||||||||
Non-U.S. Dollar Denominated Bonds & Notes–2.71%(n) | ||||||||||||||
Air Transport–0.04% | ||||||||||||||
SGL Group ApS (Denmark) (3 mo. EURIBOR + 4.75%)(o) | 8.44% | 04/22/2030 | EUR | 1,174 | 1,307,472 | |||||||||
Automotive–0.19% | ||||||||||||||
Cabonline Group Holding AB (Sweden) (Acquired 10/13/2023; Cost $789,246)(g)(m) | 14.00% | 03/19/2026 | SEK | 9,067 | 902,848 | |||||||||
Cabonline Group Holding AB (Sweden) (3 mo. STIBOR + 9.50%) (Acquired 03/24/2022; Cost $3,724,562)(g)(j)(m)(o) | 13.16% | 04/19/2026 | SEK | 35,057 | 3,149,543 | |||||||||
Cabonline Group Holding AB (Sweden) (Acquired 10/12/2023; Cost $1,648,768)(g)(m) | 14.00% | 03/19/2026 | SEK | 18,133 | 1,788,035 | |||||||||
| 5,840,426 | ||||||||||||||
Building & Development–0.09% | ||||||||||||||
APCOA Holdings GmbH (Germany) (3 mo. EURIBOR + 5.00%)(m)(o) | 8.69% | 01/15/2027 | EUR | 750 | 837,132 | |||||||||
APCOA Holdings GmbH (Germany) (3 mo. EURIBOR + 5.00%)(m)(o) | 8.69% | 01/15/2027 | EUR | 1,500 | 1,674,264 | |||||||||
Fagus Holdco PLC (United Kingdom) (Acquired 09/05/2023; Cost $0)(d)(g)(p) | 0.00% | 09/05/2029 | EUR | 200 | 221,602 | |||||||||
| 2,732,998 | ||||||||||||||
See accompanying Notes to Financial Statements which are an integral part of the financial statements.
| 15 | Invesco Senior Floating Rate Fund |
| Interest Rate | Maturity Date | Principal (000)(a) | Value | |||||||||||
Business Equipment & Services–0.04% | ||||||||||||||
Pachelbel Bidco S.p.A. (Italy) (3 mo. EURIBOR + 4.25%)(m)(o) | 8.07% | 05/17/2031 | EUR | 1,136 | $ 1,265,196 | |||||||||
Cable & Satellite Television–0.09% | ||||||||||||||
Altice Finco S.A. (Luxembourg)(m) | 4.75% | 01/15/2028 | EUR | 3,744 | 2,815,450 | |||||||||
Electronics & Electrical–0.15% | ||||||||||||||
Castor S.p.A. (Italy) (3 mo. EURIBOR + 5.25%)(m)(o) | 8.97% | 02/15/2029 | EUR | 4,000 | 4,361,632 | |||||||||
Financial Intermediaries–1.69% | ||||||||||||||
AnaCap (AFE S.A. SICAV-RAIF) (Italy) (3 mo. EURIBOR + 7.50%)(m)(o) | 11.13% | 07/15/2030 | EUR | 13,583 | 8,007,311 | |||||||||
Garfunkelux Holdco 3 S.A. (Luxembourg) (Acquired 10/23/2020-08/09/2022; Cost $2,097,398)(g)(m) | 6.75% | 11/01/2025 | EUR | 2,100 | 1,614,782 | |||||||||
Garfunkelux Holdco 3 S.A. (Luxembourg) (3 mo. EURIBOR + 6.25%) (Acquired 03/22/2022-05/10/2022; Cost $9,895,827)(g)(m)(o) | 9.88% | 05/01/2026 | EUR | 9,341 | 7,184,490 | |||||||||
Garfunkelux Holdco 3 S.A. (Luxembourg) (Acquired 06/30/2022-11/14/2023; Cost $3,770,615)(g)(m) | 6.75% | 11/01/2025 | EUR | 4,000 | 3,075,775 | |||||||||
Sherwood Financing PLC (United Kingdom)(m) | 4.50% | 11/15/2026 | EUR | 1,391 | 1,434,995 | |||||||||
Sherwood Financing PLC (United Kingdom)(m) | 6.00% | 11/15/2026 | GBP | 1,404 | 1,679,152 | |||||||||
Sherwood Financing PLC (United Kingdom) (3 mo. EURIBOR + 4.63%)(m)(o) | 8.17% | 11/15/2027 | EUR | 9,180 | 9,483,007 | |||||||||
Sherwood Financing PLC (United Kingdom) (3 mo. EURIBOR + 4.63%)(m)(o) | 8.17% | 11/15/2027 | EUR | 2,500 | 2,582,518 | |||||||||
Very Group Funding PLC (The) (United Kingdom)(m) | 6.50% | 08/01/2026 | GBP | 14,141 | 16,284,767 | |||||||||
| 51,346,797 | ||||||||||||||
Industrial Equipment–0.05% | ||||||||||||||
Summer (BC) Holdco A S.a.r.l. (Luxembourg)(m) | 9.25% | 10/31/2027 | EUR | 1,371 | 1,491,281 | |||||||||
Leisure Goods, Activities & Movies–0.06% | ||||||||||||||
Deuce Finco PLC (United Kingdom)(m) | 5.50% | 06/15/2027 | GBP | 1,363 | 1,738,577 | |||||||||
Surface Transport–0.31% | ||||||||||||||
Zenith Finco PLC (United Kingdom)(m) | 6.50% | 06/30/2027 | GBP | 9,042 | 8,653,799 | |||||||||
Zenith Finco PLC (United Kingdom)(m) | 6.50% | 06/30/2027 | GBP | 752 | 719,714 | |||||||||
| 9,373,513 | ||||||||||||||
Total Non-U.S. Dollar Denominated Bonds & Notes (Cost $104,016,913) | 82,273,342 | |||||||||||||
| Shares | ||||||||||||||
Preferred Stocks–0.50% | ||||||||||||||
Oil & Gas–0.04% | ||||||||||||||
McDermott International Ltd., Pfd.(d) | 4,611 | 1,152,805 | ||||||||||||
Southcross Energy Partners L.P., Series A, Pfd. (Acquired 05/07/2019-10/31/2019; Cost $11,607,048)(d)(g)(k) | 11,609,067 | 68,493 | ||||||||||||
| 1,221,298 | ||||||||||||||
Surface Transport–0.46% | ||||||||||||||
Commercial Barge Line Co., Series B, Pfd. (Acquired 02/05/2020-10/27/2020; Cost $3,389,672)(d)(g) | 142,554 | 13,880,483 | ||||||||||||
Total Preferred Stocks (Cost $14,996,720) | 15,101,781 | |||||||||||||
Interest Rate | Maturity Date | Principal Amount (000)(a) | ||||||||||||
Asset-Backed Securities–0.30% | ||||||||||||||
Structured Products–0.30% | ||||||||||||||
CIFC Funding Ltd., Series 2014-4RA, Class DR (Cayman Islands) (3 mo. Term SOFR + 7.26%) (m)(o) | 12.55% | 01/17/2035 | $ | 1,250 | 1,253,760 | |||||||||
Empower CLO Ltd., Series 2023-1A, Class E (Cayman Islands) (3 mo. Term SOFR + 8.22%)(m)(o) | 13.50% | 04/25/2036 | 3,500 | 3,565,978 | ||||||||||
Empower CLO Ltd., Series 2023-2A, Class E (Cayman Islands) (3 mo. Term SOFR + 8.25%)(m)(o) | 13.55% | 07/15/2036 | 2,000 | 2,049,872 | ||||||||||
Regatta XIV Funding Ltd., Series 2018-3A, Class E (Cayman Islands) (3 mo. Term SOFR + 6.21%)(m)(o) | 11.50% | 10/25/2031 | 2,200 | 2,164,136 | ||||||||||
Total Asset-Backed Securities (Cost $8,761,728) | 9,033,746 | |||||||||||||
See accompanying Notes to Financial Statements which are an integral part of the financial statements.
| 16 | Invesco Senior Floating Rate Fund |
| Shares | Value | |||||||
| ||||||||
Money Market Funds–2.50% | ||||||||
Invesco Government & Agency Portfolio, Institutional Class, 5.18%(k)(q) | 45,562,551 | $ | 45,562,551 | |||||
| ||||||||
Invesco Treasury Portfolio, Institutional Class, 5.15%(k)(q) | 30,373,136 | 30,373,136 | ||||||
| ||||||||
Total Money Market Funds (Cost $75,935,687) | 75,935,687 | |||||||
| ||||||||
TOTAL INVESTMENTS IN SECURITIES-101.10% (Cost $3,224,847,030) | 3,065,859,143 | |||||||
| ||||||||
OTHER ASSETS LESS LIABILITIES-(1.10)% | (33,303,438 | ) | ||||||
| ||||||||
NET ASSETS-100.00% | $ | 3,032,555,705 | ||||||
| ||||||||
Investment Abbreviations:
| CLO | - Collateralized Loan Obligation | |
| EUR | - Euro | |
| EURIBOR | - Euro Interbank Offered Rate | |
| GBP | - British Pound Sterling | |
| LIBOR | - London Interbank Offered Rate | |
| LOC | - Letter of Credit | |
| Pfd. | - Preferred | |
| PIK | - Pay-in-Kind | |
| SEK | - Swedish Krona | |
| SOFR | - Secured Overnight Financing Rate | |
| SONIA | - Sterling Overnight Index Average | |
| STIBOR | - Stockholm Interbank Offered Rate | |
| USD | - U.S. Dollar | |
| Wts. | - Warrants |
Notes to Schedule of Investments:
| (a) | Principal amounts are denominated in U.S. dollars unless otherwise noted. |
| (b) | Variable rate senior loan interests often require prepayments from excess cash flow or permit the borrower to repay at its election. The degree to which borrowers repay, whether as a contractual requirement or at their election, cannot be predicted with any accuracy. As a result, the actual remaining maturity may be substantially less than the stated maturities shown. However, it is anticipated that the variable rate senior loan interests will have an expected average life of three to five years. |
| (c) | Variable rate senior loan interests are, at present, not readily marketable, not registered under the Securities Act of 1933, as amended (the “1933 Act”) and may be subject to contractual and legal restrictions on sale. Variable rate senior loan interests in the Fund’s portfolio generally have variable rates which adjust to a base, such as the Secured Overnight Financing Rate (“SOFR”), on set dates, typically every 30 days, but not greater than one year, and/or have interest rates that float at margin above a widely recognized base lending rate such as the Prime Rate of a designated U.S. bank. |
| (d) | Security valued using significant unobservable inputs (Level 3). See Note 3. |
| (e) | This variable rate interest will settle after August 31, 2024, at which time the interest rate will be determined. |
| (f) | All or a portion of this holding is subject to unfunded loan commitments. Interest rate will be determined at the time of funding. See Note 8. |
| (g) | Restricted security. The aggregate value of these securities at August 31, 2024 was $328,844,744, which represented 10.84% of the Fund’s Net Assets. |
| (h) | All or a portion of this security is Pay-in-Kind. Pay-in-Kind securities pay interest income in the form of securities. |
| (i) | The borrower has filed for protection in federal bankruptcy court. Subsequent to period-end, a valuation adjustment was made to the Fund’s term loan positions in Robertshaw to reflect the consummation of the borrower’s Chapter 11 plan. |
| (j) | Defaulted security. Currently, the issuer is in default with respect to principal and/or interest payments. The aggregate value of these securities at August 31, 2024 was $26,248,533, which represented less than 1% of the Fund’s Net Assets. |
| (k) | Affiliated holding. Affiliated holdings are investments in entities which are under common ownership or control of Invesco Ltd. or are investments in entities in which the Fund owns 5% or more of the outstanding voting securities. The table below shows the Fund’s transactions in, and earnings from, its investments in affiliates for the fiscal year ended August 31, 2024. |
Value August 31, 2023 | Purchases at Cost | Proceeds from Sales | Change in Unrealized Appreciation (Depreciation) | Realized Gain (Loss) | Value August 31, 2024 | Income | ||||||||||||||||||||||||||||||||||||||||||||||
| ||||||||||||||||||||||||||||||||||||||||||||||||||||
| Investments in Affiliated Money Market Funds: | ||||||||||||||||||||||||||||||||||||||||||||||||||||
| ||||||||||||||||||||||||||||||||||||||||||||||||||||
Invesco Government & Agency Portfolio, Institutional Class | $ | 63,601,590 | $ | 552,316,611 | $ | (570,355,650 | ) | $ | - | $ | - | $ | 45,562,551 | $ | 2,633,895 | |||||||||||||||||||||||||||||||||||||
| ||||||||||||||||||||||||||||||||||||||||||||||||||||
Invesco Treasury Portfolio, Institutional Class | 41,937,612 | 368,211,074 | (379,775,550 | ) | - | - | 30,373,136 | 1,740,053 | ||||||||||||||||||||||||||||||||||||||||||||
| ||||||||||||||||||||||||||||||||||||||||||||||||||||
See accompanying Notes to Financial Statements which are an integral part of the financial statements.
| 17 | Invesco Senior Floating Rate Fund |
Value August 31, 2023 | Purchases at Cost | Proceeds from Sales | Change in Unrealized Appreciation (Depreciation) | Realized Gain (Loss) | Value August 31, 2024 | Income | ||||||||||||||||||||||||||||||||||||||||||||||
| ||||||||||||||||||||||||||||||||||||||||||||||||||||
| Investments in Other Affiliates: | ||||||||||||||||||||||||||||||||||||||||||||||||||||
| ||||||||||||||||||||||||||||||||||||||||||||||||||||
ACNR Holdings, Inc., Pfd.* | $ | 36,213,450 | $ | - | $ | (3,434,670 | ) | $ | (35,178,780 | ) | $ | 2,400,000 | $ | - | $ | - | ||||||||||||||||||||||||||||||||||||
| ||||||||||||||||||||||||||||||||||||||||||||||||||||
Commercial Barge Line Co., Series A, Pfd., Wts., expiring 04/27/2045 | 2,568,926 | - | (2,732,900 | ) | 526,018 | (362,044 | ) | - | 51,242 | |||||||||||||||||||||||||||||||||||||||||||
| ||||||||||||||||||||||||||||||||||||||||||||||||||||
Commercial Barge Line Co., Series A, Wts., expiring 08/18/2030 | 181,044 | 51,242 | (229,166 | ) | (181,044 | ) | 177,924 | - | - | |||||||||||||||||||||||||||||||||||||||||||
| ||||||||||||||||||||||||||||||||||||||||||||||||||||
Commercial Barge Line Co., Series B, Pfd.,Wts., expiring 04/27/2045** | 5,506,325 | - | - | 4,241,873 | - | 9,748,198 | 187,716 | |||||||||||||||||||||||||||||||||||||||||||||
| ||||||||||||||||||||||||||||||||||||||||||||||||||||
Commercial Barge Line Co., Series B, Wts., expiring 04/30/2045** | 187,716 | 250,288 | (309,419 | ) | (125,144 | ) | 184,275 | 187,716 | - | |||||||||||||||||||||||||||||||||||||||||||
| ||||||||||||||||||||||||||||||||||||||||||||||||||||
Commercial Barge Line Co., Wts., expiring 04/27/2045** | 1,674,495 | - | - | 1,839,712 | - | 3,514,207 | - | |||||||||||||||||||||||||||||||||||||||||||||
| ||||||||||||||||||||||||||||||||||||||||||||||||||||
Frontera Generation Holdings LLC | 21,458 | - | - | 2,929,333 | - | 2,950,791 | - | |||||||||||||||||||||||||||||||||||||||||||||
| ||||||||||||||||||||||||||||||||||||||||||||||||||||
Fusion Connect, Inc., Wts., expiring 01/14/2040 | 10,526 | - | - | 10,604,492 | (10,615,018 | ) | - | - | ||||||||||||||||||||||||||||||||||||||||||||
| ||||||||||||||||||||||||||||||||||||||||||||||||||||
HGIM Corp. | 4,326,262 | - | - | 350,778 | - | 4,677,040 | 1,333,541 | |||||||||||||||||||||||||||||||||||||||||||||
| ||||||||||||||||||||||||||||||||||||||||||||||||||||
Internap Holding LLC | 3,145,880 | - | - | - | - | 3,145,880 | - | |||||||||||||||||||||||||||||||||||||||||||||
| ||||||||||||||||||||||||||||||||||||||||||||||||||||
Larchmont Resources LLC | 210,484 | - | - | 2,521,757 | (2,732,241 | ) | - | - | ||||||||||||||||||||||||||||||||||||||||||||
| ||||||||||||||||||||||||||||||||||||||||||||||||||||
Libbey Glass LLC* | 6,811,214 | - | - | 6,240,369 | - | 13,051,583 | - | |||||||||||||||||||||||||||||||||||||||||||||
| ||||||||||||||||||||||||||||||||||||||||||||||||||||
My Alarm Center LLC, Class A | 39,252,693 | - | (7,283,738 | ) | 6,266,162 | - | 38,235,117 | - | ||||||||||||||||||||||||||||||||||||||||||||
| ||||||||||||||||||||||||||||||||||||||||||||||||||||
North American Lifting Holdings, Inc. | 4,754,351 | - | - | (3,650,662 | ) | - | 1,103,689 | - | ||||||||||||||||||||||||||||||||||||||||||||
| ||||||||||||||||||||||||||||||||||||||||||||||||||||
QuarterNorth Energy, Inc. | 113,489,182 | - | (118,802,020 | ) | (69,618,274 | ) | 74,931,112 | - | - | |||||||||||||||||||||||||||||||||||||||||||
| ||||||||||||||||||||||||||||||||||||||||||||||||||||
Restoration Forest Products Group, LLC | - | 27,867,285 | - | (6,764,856 | ) | - | 21,102,429 | - | ||||||||||||||||||||||||||||||||||||||||||||
| ||||||||||||||||||||||||||||||||||||||||||||||||||||
Southcross Energy Partners L.P., Series A, Pfd. | 103,321 | - | - | (34,828 | ) | - | 68,493 | - | ||||||||||||||||||||||||||||||||||||||||||||
| ||||||||||||||||||||||||||||||||||||||||||||||||||||
Southcross Energy Partners L.P. | 40,809 | - | - | (40,806 | ) | - | 3 | - | ||||||||||||||||||||||||||||||||||||||||||||
| ||||||||||||||||||||||||||||||||||||||||||||||||||||
Tribune Resources LLC | 7,990,398 | - | - | (98,790 | ) | - | 7,891,608 | 2,382,592 | ||||||||||||||||||||||||||||||||||||||||||||
| ||||||||||||||||||||||||||||||||||||||||||||||||||||
Total | $ | 332,027,736 | $ | 948,696,500 | $ | (1,082,923,113 | ) | $ | (80,172,690 | ) | $ | 63,984,008 | $ | 181,612,441 | $ | 8,329,039 | ||||||||||||||||||||||||||||||||||||
| ||||||||||||||||||||||||||||||||||||||||||||||||||||
| * | As of August 31, 2023, this security was not considered as an affiliate of the Fund. |
| ** | At August 31, 2024, this security was no longer an affiliate of the Fund. |
| (l) | Non-income producing security. |
| (m) | Security purchased or received in a transaction exempt from registration under the 1933 Act. The security may be resold pursuant to an exemption from registration under the 1933 Act, typically to qualified institutional buyers. The aggregate value of these securities at August 31, 2024 was $220,114,553, which represented 7.26% of the Fund’s Net Assets. |
| (n) | Foreign denominated security. Principal amount is denominated in the currency indicated. |
| (o) | Interest or dividend rate is redetermined periodically. Rate shown is the rate in effect on August 31, 2024. |
| (p) | Zero coupon bond issued at a discount. |
| (q) | The rate shown is the 7-day SEC standardized yield as of August 31, 2024. |
| Open Forward Foreign Currency Contracts | ||||||||||||||||||||||||||||||
| ||||||||||||||||||||||||||||||
| Settlement | Contract to | Unrealized Appreciation | ||||||||||||||||||||||||||||
| Date | Counterparty | Deliver | Receive | (Depreciation) | ||||||||||||||||||||||||||
| ||||||||||||||||||||||||||||||
Currency Risk | ||||||||||||||||||||||||||||||
| ||||||||||||||||||||||||||||||
09/27/2024 | Barclays Bank PLC | USD | 199,420 | SEK | 2,142,646 | $ | 9,502 | |||||||||||||||||||||||
| ||||||||||||||||||||||||||||||
10/31/2024 | Barclays Bank PLC | EUR | 80,580,653 | USD | 89,899,897 | 588,362 | ||||||||||||||||||||||||
| ||||||||||||||||||||||||||||||
09/27/2024 | BNP Paribas S.A. | USD | 14,754,011 | GBP | 11,318,983 | 114,509 | ||||||||||||||||||||||||
| ||||||||||||||||||||||||||||||
10/31/2024 | BNP Paribas S.A. | EUR | 80,028,603 | USD | 89,291,387 | 591,716 | ||||||||||||||||||||||||
| ||||||||||||||||||||||||||||||
10/31/2024 | BNP Paribas S.A. | SEK | 63,672,822 | USD | 6,256,019 | 35,416 | ||||||||||||||||||||||||
| ||||||||||||||||||||||||||||||
09/27/2024 | Canadian Imperial Bank of Commerce | USD | 14,751,049 | GBP | 11,318,983 | 117,472 | ||||||||||||||||||||||||
| ||||||||||||||||||||||||||||||
09/27/2024 | State Street Bank & Trust Co. | USD | 14,552,099 | GBP | 11,162,800 | 111,261 | ||||||||||||||||||||||||
| ||||||||||||||||||||||||||||||
10/31/2024 | State Street Bank & Trust Co. | SEK | 599,210 | USD | 58,837 | 296 | ||||||||||||||||||||||||
| ||||||||||||||||||||||||||||||
09/27/2024 | Toronto-Dominion Bank (The) | USD | 10,837,440 | EUR | 10,000,000 | 228,210 | ||||||||||||||||||||||||
| ||||||||||||||||||||||||||||||
10/31/2024 | Toronto-Dominion Bank (The) | EUR | 80,373,009 | USD | 89,692,323 | 610,931 | ||||||||||||||||||||||||
| ||||||||||||||||||||||||||||||
Subtotal–Appreciation |
| 2,407,675 | ||||||||||||||||||||||||||||
| ||||||||||||||||||||||||||||||
Currency Risk | ||||||||||||||||||||||||||||||
| ||||||||||||||||||||||||||||||
09/27/2024 | Barclays Bank PLC | USD | 89,380,302 | EUR | 80,241,573 | (587,788 | ) | |||||||||||||||||||||||
| ||||||||||||||||||||||||||||||
See accompanying Notes to Financial Statements which are an integral part of the financial statements.
| 18 | Invesco Senior Floating Rate Fund |
| Open Forward Foreign Currency Contracts–(continued) | ||||||||||||||||||||||||||||||
| ||||||||||||||||||||||||||||||
| Settlement | Contract to | Unrealized Appreciation | ||||||||||||||||||||||||||||
| Date | Counterparty | Deliver | Receive | (Depreciation) | ||||||||||||||||||||||||||
| ||||||||||||||||||||||||||||||
10/31/2024 | Barclays Bank PLC | GBP | 157,782 | USD | 205,580 | $ | (1,723 | ) | ||||||||||||||||||||||
| ||||||||||||||||||||||||||||||
09/27/2024 | BNP Paribas S.A. | EUR | 82,550,335 | USD | 89,792,195 | (1,555,113 | ) | |||||||||||||||||||||||
| ||||||||||||||||||||||||||||||
09/27/2024 | BNP Paribas S.A. | GBP | 11,575,912 | USD | 14,959,399 | (246,622 | ) | |||||||||||||||||||||||
| ||||||||||||||||||||||||||||||
09/27/2024 | BNP Paribas S.A. | SEK | 65,802,167 | USD | 6,130,051 | (286,104 | ) | |||||||||||||||||||||||
| ||||||||||||||||||||||||||||||
09/27/2024 | BNP Paribas S.A. | USD | 89,387,370 | EUR | 80,241,573 | (594,857 | ) | |||||||||||||||||||||||
| ||||||||||||||||||||||||||||||
09/27/2024 | BNP Paribas S.A. | USD | 6,243,187 | SEK | 63,659,521 | (35,955 | ) | |||||||||||||||||||||||
| ||||||||||||||||||||||||||||||
10/31/2024 | BNP Paribas S.A. | GBP | 11,292,566 | USD | 14,722,362 | (114,400 | ) | |||||||||||||||||||||||
| ||||||||||||||||||||||||||||||
10/31/2024 | Canadian Imperial Bank of Commerce | GBP | 11,292,567 | USD | 14,719,529 | (117,232 | ) | |||||||||||||||||||||||
| ||||||||||||||||||||||||||||||
10/31/2024 | Canadian Imperial Bank of Commerce | USD | 12,347,230 | EUR | 11,000,000 | (155,385 | ) | |||||||||||||||||||||||
| ||||||||||||||||||||||||||||||
09/27/2024 | Morgan Stanley and Co. International PLC | GBP | 11,112,426 | USD | 14,353,689 | (243,501 | ) | |||||||||||||||||||||||
| ||||||||||||||||||||||||||||||
09/27/2024 | Royal Bank of Canada | EUR | 84,718,608 | USD | 92,146,573 | (1,600,071 | ) | |||||||||||||||||||||||
| ||||||||||||||||||||||||||||||
09/27/2024 | State Street Bank & Trust Co. | EUR | 83,801,098 | USD | 91,092,262 | (1,639,096 | ) | |||||||||||||||||||||||
| ||||||||||||||||||||||||||||||
09/27/2024 | State Street Bank & Trust Co. | GBP | 11,112,426 | USD | 14,343,686 | (253,503 | ) | |||||||||||||||||||||||
| ||||||||||||||||||||||||||||||
10/31/2024 | State Street Bank & Trust Co. | GBP | 11,136,748 | USD | 14,520,992 | (111,047 | ) | |||||||||||||||||||||||
| ||||||||||||||||||||||||||||||
09/27/2024 | Toronto-Dominion Bank (The) | USD | 89,789,636 | EUR | 80,586,894 | (615,001 | ) | |||||||||||||||||||||||
| ||||||||||||||||||||||||||||||
Subtotal–Depreciation |
| (8,157,398 | ) | |||||||||||||||||||||||||||
| ||||||||||||||||||||||||||||||
Total Forward Foreign Currency Contracts |
| $ | (5,749,723 | ) | ||||||||||||||||||||||||||
| ||||||||||||||||||||||||||||||
Abbreviations:
EUR - Euro
GBP - British Pound Sterling
SEK - Swedish Krona
USD - U.S. Dollar
See accompanying Notes to Financial Statements which are an integral part of the financial statements.
| 19 | Invesco Senior Floating Rate Fund |
Statement of Assets and Liabilities
August 31, 2024
Assets: | ||||
Investments in unaffiliated securities, at value | $ | 2,897,696,823 | ||
| ||||
Investments in affiliates, at value | 168,162,320 | |||
| ||||
Other investments: |
| |||
Unrealized appreciation on forward foreign currency contracts outstanding | 2,407,675 | |||
| ||||
Cash | 29,982,703 | |||
| ||||
Restricted cash | 10,690,732 | |||
| ||||
Foreign currencies, at value (Cost $5,806,490) | 5,809,492 | |||
| ||||
Due from broker | 434,910 | |||
| ||||
Receivable for: | ||||
Investments sold | 79,189,311 | |||
| ||||
Fund shares sold | 2,053,180 | |||
| ||||
Dividends | 601,534 | |||
| ||||
Interest | 32,656,752 | |||
| ||||
Investment for trustee deferred compensation and retirement plans | 336,601 | |||
| ||||
Other assets | 286,372 | |||
| ||||
Total assets | 3,230,308,405 | |||
| ||||
Liabilities: | ||||
Other investments: | ||||
Unrealized depreciation on forward foreign currency contracts outstanding | 8,157,398 | |||
| ||||
Payable for: | ||||
Investments purchased | 144,737,642 | |||
| ||||
Dividends | 6,892,481 | |||
| ||||
Proceeds received in connection with pending litigation | 10,690,732 | |||
| ||||
Fund shares reacquired | 2,339,041 | |||
| ||||
Accrued fees to affiliates | 1,300,754 | |||
| ||||
Accrued trustees’ and officers’ fees and benefits | 5,475 | |||
| ||||
Accrued other operating expenses | 224,248 | |||
| ||||
Trustee deferred compensation and retirement plans | 336,601 | |||
| ||||
Unfunded loan commitments | 23,068,328 | |||
| ||||
Total liabilities | 197,752,700 | |||
| ||||
Net assets applicable to shares outstanding | $ | 3,032,555,705 | ||
| ||||
Net assets consist of: | ||||
Shares of beneficial interest | $ | 5,720,227,110 | ||
| ||||
Distributable earnings (loss) | (2,687,671,405 | ) | ||
| ||||
| $ | 3,032,555,705 | |||
| ||||
Net Assets: |
| |||
Class A | $ | 1,538,561,322 | ||
| ||||
Class C | $ | 170,785,908 | ||
| ||||
Class R | $ | 51,616,359 | ||
| ||||
Class Y | $ | 1,156,907,537 | ||
| ||||
Class R5 | $ | 19,693 | ||
| ||||
Class R6 | $ | 114,664,886 | ||
| ||||
Shares outstanding, no par value, with an unlimited number of shares authorized: |
| |||
Class A | 231,483,861 | |||
| ||||
Class C | 25,681,666 | |||
| ||||
Class R | 7,770,140 | |||
| ||||
Class Y | 174,365,657 | |||
| ||||
Class R5 | 2,962 | |||
| ||||
Class R6 | 17,282,544 | |||
| ||||
Class A: | ||||
Net asset value per share | $ | 6.65 | ||
| ||||
Maximum offering price per share | $ | 6.87 | ||
| ||||
Class C: | ||||
Net asset value and offering price per share | $ | 6.65 | ||
| ||||
Class R: | ||||
Net asset value and offering price per share | $ | 6.64 | ||
| ||||
Class Y: | ||||
Net asset value and offering price per share | $ | 6.63 | ||
| ||||
Class R5: | ||||
Net asset value and offering price per share | $ | 6.65 | ||
| ||||
Class R6: | ||||
Net asset value and offering price per share | $ | 6.63 | ||
| ||||
See accompanying Notes to Financial Statements which are an integral part of the financial statements.
| 20 | Invesco Senior Floating Rate Fund |
Statement of Operations
For the year ended August 31, 2024
Investment income: | ||||
Interest | $ | 296,023,969 | ||
| ||||
Dividends | 1,342,085 | |||
| ||||
Dividends from affiliates | 8,329,039 | |||
| ||||
Total investment income | 305,695,093 | |||
| ||||
Expenses: | ||||
Advisory fees | 19,187,449 | |||
| ||||
Administrative services fees | 451,136 | |||
| ||||
Custodian fees | 239,251 | |||
| ||||
Distribution fees: | ||||
Class A | 3,849,678 | |||
| ||||
Class C | 1,856,197 | |||
| ||||
Class R | 260,446 | |||
| ||||
Interest, facilities and maintenance fees | 1,629,640 | |||
| ||||
Transfer agent fees – A, C, R and Y | 3,645,297 | |||
| ||||
Transfer agent fees – R5 | 12 | |||
| ||||
Transfer agent fees – R6 | 49,361 | |||
| ||||
Trustees’ and officers’ fees and benefits | 49,931 | |||
| ||||
Registration and filing fees | 178,190 | |||
| ||||
Reports to shareholders | 434,591 | |||
| ||||
Professional services fees | 722,532 | |||
| ||||
Other | 56,771 | |||
| ||||
Total expenses | 32,610,482 | |||
| ||||
Less: Fees waived, expenses reimbursed and/or expense offset arrangement(s) | (652,123 | ) | ||
| ||||
Net expenses | 31,958,359 | |||
| ||||
Net investment income | 273,736,734 | |||
| ||||
Realized and unrealized gain (loss) from: | ||||
Net realized gain (loss) from: | ||||
Unaffiliated investment securities | (34,680,714 | ) | ||
| ||||
Affiliated investment securities | 63,984,008 | |||
| ||||
Foreign currencies | 596,873 | |||
| ||||
Forward foreign currency contracts | 10,944,911 | |||
| ||||
| 40,845,078 | ||||
| ||||
Change in net unrealized appreciation (depreciation) of: | ||||
Unaffiliated investment securities | 61,091,678 | |||
| ||||
Affiliated investment securities | (80,172,690 | ) | ||
| ||||
Foreign currencies | 41,627 | |||
| ||||
Forward foreign currency contracts | (13,287,671 | ) | ||
| ||||
| (32,327,056 | ) | |||
| ||||
Net realized and unrealized gain | 8,518,022 | |||
| ||||
Net increase in net assets resulting from operations | $ | 282,254,756 | ||
| ||||
See accompanying Notes to Financial Statements which are an integral part of the financial statements.
| 21 | Invesco Senior Floating Rate Fund |
Statement of Changes in Net Assets
For the years ended August 31, 2024 and 2023
| 2024 | 2023 | |||||||
| ||||||||
Operations: | ||||||||
Net investment income | $ | 273,736,734 | $ | 301,283,952 | ||||
| ||||||||
Net realized gain (loss) | 40,845,078 | (139,797,702 | ) | |||||
| ||||||||
Change in net unrealized appreciation (depreciation) | (32,327,056 | ) | 110,439,973 | |||||
| ||||||||
Net increase in net assets resulting from operations | 282,254,756 | 271,926,223 | ||||||
| ||||||||
Distributions to shareholders from distributable earnings: | ||||||||
Class A | (130,100,577 | ) | (151,908,076 | ) | ||||
| ||||||||
Class C | (14,343,400 | ) | (20,837,505 | ) | ||||
| ||||||||
Class R | (4,257,187 | ) | (5,142,756 | ) | ||||
| ||||||||
Class Y | (102,123,264 | ) | (130,241,833 | ) | ||||
| ||||||||
Class R5 | (1,712 | ) | (1,525 | ) | ||||
| ||||||||
Class R6 | (14,224,107 | ) | (19,317,154 | ) | ||||
| ||||||||
Total distributions from distributable earnings | (265,050,247 | ) | (327,448,849 | ) | ||||
| ||||||||
Return of capital: | ||||||||
Class A | (13,590,921 | ) | (5,790,853 | ) | ||||
| ||||||||
Class C | (1,498,380 | ) | (794,342 | ) | ||||
| ||||||||
Class R | (444,726 | ) | (196,046 | ) | ||||
| ||||||||
Class Y | (10,668,279 | ) | (4,964,919 | ) | ||||
| ||||||||
Class R5 | (179 | ) | (58 | ) | ||||
| ||||||||
Class R6 | (1,485,917 | ) | (736,385 | ) | ||||
| ||||||||
Total return of capital | (27,688,402 | ) | (12,482,603 | ) | ||||
| ||||||||
Total distributions | (292,738,649 | ) | (339,931,452 | ) | ||||
| ||||||||
Share transactions–net: | ||||||||
Class A | (14,500,310 | ) | (51,670,541 | ) | ||||
| ||||||||
Class C | (29,037,066 | ) | (62,319,648 | ) | ||||
| ||||||||
Class R | (1,790,702 | ) | (1,057,435 | ) | ||||
| ||||||||
Class Y | (17,132,581 | ) | (242,916,944 | ) | ||||
| ||||||||
Class R5 | – | 8,335 | ||||||
| ||||||||
Class R6 | (84,905,288 | ) | (42,684,802 | ) | ||||
| ||||||||
Net increase (decrease) in net assets resulting from share transactions | (147,365,947 | ) | (400,641,035 | ) | ||||
| ||||||||
Net increase (decrease) in net assets | (157,849,840 | ) | (468,646,264 | ) | ||||
| ||||||||
Net assets: | ||||||||
Beginning of year | 3,190,405,545 | 3,659,051,809 | ||||||
| ||||||||
End of year | $ | 3,032,555,705 | $ | 3,190,405,545 | ||||
| ||||||||
See accompanying Notes to Financial Statements which are an integral part of the financial statements.
| 22 | Invesco Senior Floating Rate Fund |
Statement of Cash Flows
For the year ended August 31, 2024
Cash provided by operating activities: | ||||
Net increase in net assets resulting from operations | $ | 282,254,756 | ||
| ||||
Adjustments to reconcile the change in net assets from operations to net cash provided by operating activities: | ||||
Purchases of investments | (1,447,470,349 | ) | ||
| ||||
Proceeds from sales of investments | 1,473,368,236 | |||
| ||||
Proceeds from sales of short-term investments, net | 102,369,588 | |||
| ||||
Amortization (accretion) of premiums and discounts, net | (14,242,182 | ) | ||
| ||||
Net realized gain from investment securities | (29,303,294 | ) | ||
| ||||
Net change in unrealized depreciation on investment securities | 19,081,012 | |||
| ||||
Net change in unrealized depreciation on forward foreign currency contracts | 13,287,671 | |||
| ||||
Change in operating assets and liabilities: | ||||
| ||||
Decrease in receivables and other assets | 11,165,865 | |||
| ||||
Increase in accrued expenses and other payables | 10,560,185 | |||
| ||||
Net cash provided by operating activities | 421,071,488 | |||
| ||||
Cash provided by (used in) financing activities: | ||||
Dividends paid to shareholders from distributable earnings | (64,700,683 | ) | ||
| ||||
Return of capital | (27,688,402 | ) | ||
| ||||
Proceeds from shares of beneficial interest sold | 705,650,930 | |||
| ||||
Disbursements from shares of beneficial interest reacquired | (1,052,857,477 | ) | ||
| ||||
Net cash provided by (used in) financing activities | (439,595,632 | ) | ||
| ||||
Net decrease in cash and cash equivalents | (18,524,144 | ) | ||
| ||||
Cash and cash equivalents at beginning of period | 140,942,758 | |||
| ||||
Cash and cash equivalents at end of period | $ | 122,418,614 | ||
| ||||
Non-cash financing activities: | ||||
Value of shares of beneficial interest issued in reinvestment of dividends paid to common shareholders | $ | 201,066,428 | ||
| ||||
Supplemental disclosure of cash flow information: | ||||
Cash paid during the period for taxes | $ | 1,552 | ||
| ||||
Cash paid during the period for interest, facilities and maintenance fees | $ | 1,629,640 | ||
| ||||
Reconciliation of cash, cash equivalents, and restricted cash: | ||||
Cash and cash equivalents | $ | 111,727,882 | ||
| ||||
Restricted cash | 10,690,732 | |||
| ||||
Total cash, cash equivalents, and restricted cash: | $ | 122,418,614 | ||
| ||||
See accompanying Notes to Financial Statements which are an integral part of the financial statements.
| 23 | Invesco Senior Floating Rate Fund |
Financial Highlights
The following schedule presents financial highlights for a share of the Fund outstanding throughout the periods indicated.
Net asset value, beginning of period | Net investment income(a) | Net gains (losses) on securities (both realized and unrealized) | Total from investment operations | Dividends from net investment income | Return of capital | Total distributions | Net asset value, end of period | Total return(b) | Net assets, end of period (000’s omitted) | Ratio of expenses to average net assets with fee waivers and/or expenses absorbed | Ratio of expenses to average net assets without fee waivers and/or expenses absorbed | Supplemental ratio of expenses to average net assets with fee waivers (excluding interest, facilities and maintenance fees) | Ratio of net investment income to average net assets | Portfolio turnover (c) | ||||||||||||||||||||||||||||||||||||||||||||||
Class A | ||||||||||||||||||||||||||||||||||||||||||||||||||||||||||||
Year ended 08/31/24 | $6.67 | $0.58 | $ 0.02 | $ 0.60 | $(0.56 | ) | $(0.06 | ) | $(0.62 | ) | $6.65 | 9.35 | % | $1,538,561 | 1.08 | % | 1.10 | % | 1.03 | % | 8.68 | % | 48 | % | ||||||||||||||||||||||||||||||||||||
Year ended 08/31/23 | 6.79 | 0.60 | (0.05 | ) | 0.55 | (0.65 | ) | (0.02 | ) | (0.67 | ) | 6.67 | 8.72 | 1,558,451 | 1.06 | 1.09 | 1.01 | 9.04 | 31 | |||||||||||||||||||||||||||||||||||||||||
Year ended 08/31/22 | 7.10 | 0.35 | (0.32 | ) | 0.03 | (0.34 | ) | – | (0.34 | ) | 6.79 | 0.40 | 1,639,394 | 1.04 | 1.04 | 1.00 | 5.05 | 68 | ||||||||||||||||||||||||||||||||||||||||||
Year ended 08/31/21 | 6.61 | 0.31 | 0.49 | 0.80 | (0.31 | ) | – | (0.31 | ) | 7.10 | 12.35 | 1,666,116 | 1.07 | 1.10 | 1.00 | 4.56 | 86 | |||||||||||||||||||||||||||||||||||||||||||
Year ended 08/31/20 | 7.63 | 0.32 | (1.02 | ) | (0.70 | ) | (0.32 | ) | – | (0.32 | ) | 6.61 | (9.23 | ) | 1,586,129 | 1.13 | 1.16 | 1.02 | 4.59 | 53 | ||||||||||||||||||||||||||||||||||||||||
Class C | ||||||||||||||||||||||||||||||||||||||||||||||||||||||||||||
Year ended 08/31/24 | 6.67 | 0.53 | 0.02 | 0.55 | (0.52 | ) | (0.05 | ) | (0.57 | ) | 6.65 | 8.53 | 170,786 | 1.83 | 1.85 | 1.78 | 7.93 | 48 | ||||||||||||||||||||||||||||||||||||||||||
Year ended 08/31/23 | 6.79 | 0.55 | (0.05 | ) | 0.50 | (0.60 | ) | (0.02 | ) | (0.62 | ) | 6.67 | 7.91 | 200,489 | 1.81 | 1.84 | 1.76 | 8.29 | 31 | |||||||||||||||||||||||||||||||||||||||||
Year ended 08/31/22 | 7.11 | 0.30 | (0.33 | ) | (0.03 | ) | (0.29 | ) | – | (0.29 | ) | 6.79 | (0.49 | ) | 268,127 | 1.79 | 1.79 | 1.75 | 4.30 | 68 | ||||||||||||||||||||||||||||||||||||||||
Year ended 08/31/21 | 6.62 | 0.26 | 0.49 | 0.75 | (0.26 | ) | – | (0.26 | ) | 7.11 | 11.50 | 398,409 | 1.82 | 1.85 | 1.75 | 3.81 | 86 | |||||||||||||||||||||||||||||||||||||||||||
Year ended 08/31/20 | 7.64 | 0.27 | (1.02 | ) | (0.75 | ) | (0.27 | ) | – | (0.27 | ) | 6.62 | (9.90 | ) | 733,122 | 1.88 | 1.91 | 1.77 | 3.84 | 53 | ||||||||||||||||||||||||||||||||||||||||
Class R | ||||||||||||||||||||||||||||||||||||||||||||||||||||||||||||
Year ended 08/31/24 | 6.66 | 0.56 | 0.02 | 0.58 | (0.54 | ) | (0.06 | ) | (0.60 | ) | 6.64 | 9.07 | 51,616 | 1.33 | 1.35 | 1.28 | 8.43 | 48 | ||||||||||||||||||||||||||||||||||||||||||
Year ended 08/31/23 | 6.79 | 0.58 | (0.05 | ) | 0.53 | (0.64 | ) | (0.02 | ) | (0.66 | ) | 6.66 | 8.29 | 53,578 | 1.31 | 1.34 | 1.26 | 8.79 | 31 | |||||||||||||||||||||||||||||||||||||||||
Year ended 08/31/22 | 7.10 | 0.34 | (0.33 | ) | 0.01 | (0.32 | ) | – | (0.32 | ) | 6.79 | 0.14 | 55,615 | 1.29 | 1.29 | 1.25 | 4.80 | 68 | ||||||||||||||||||||||||||||||||||||||||||
Year ended 08/31/21 | 6.61 | 0.30 | 0.48 | 0.78 | (0.29 | ) | – | (0.29 | ) | 7.10 | 12.07 | 60,060 | 1.32 | 1.35 | 1.25 | 4.31 | 86 | |||||||||||||||||||||||||||||||||||||||||||
Year ended 08/31/20 | 7.62 | 0.31 | (1.01 | ) | (0.70 | ) | (0.31 | ) | – | (0.31 | ) | 6.61 | (9.34 | ) | 59,212 | 1.38 | 1.41 | 1.27 | 4.34 | 53 | ||||||||||||||||||||||||||||||||||||||||
Class Y | ||||||||||||||||||||||||||||||||||||||||||||||||||||||||||||
Year ended 08/31/24 | 6.66 | 0.59 | 0.01 | 0.60 | (0.57 | ) | (0.06 | ) | (0.63 | ) | 6.63 | 9.45 | 1,156,908 | 0.83 | 0.85 | 0.78 | 8.93 | 48 | ||||||||||||||||||||||||||||||||||||||||||
Year ended 08/31/23 | 6.78 | 0.61 | (0.04 | ) | 0.57 | (0.66 | ) | (0.03 | ) | (0.69 | ) | 6.66 | 8.99 | 1,178,319 | 0.81 | 0.84 | 0.76 | 9.29 | 31 | |||||||||||||||||||||||||||||||||||||||||
Year ended 08/31/22 | 7.09 | 0.37 | (0.33 | ) | 0.04 | (0.35 | ) | – | (0.35 | ) | 6.78 | 0.63 | 1,450,652 | 0.79 | 0.79 | 0.75 | 5.30 | 68 | ||||||||||||||||||||||||||||||||||||||||||
Year ended 08/31/21 | 6.60 | 0.33 | 0.49 | 0.82 | (0.33 | ) | – | (0.33 | ) | 7.09 | 12.65 | 1,323,124 | 0.82 | 0.85 | 0.75 | 4.81 | 86 | |||||||||||||||||||||||||||||||||||||||||||
Year ended 08/31/20 | 7.61 | 0.35 | (1.02 | ) | (0.67 | ) | (0.34 | ) | – | (0.34 | ) | 6.60 | (8.90 | ) | 1,571,552 | 0.88 | 0.91 | 0.77 | 4.84 | 53 | ||||||||||||||||||||||||||||||||||||||||
Class R5 | ||||||||||||||||||||||||||||||||||||||||||||||||||||||||||||
Year ended 08/31/24 | 6.67 | 0.60 | 0.02 | 0.62 | (0.58 | ) | (0.06 | ) | (0.64 | ) | 6.65 | 9.68 | 20 | 0.79 | 0.79 | 0.74 | 8.97 | 48 | ||||||||||||||||||||||||||||||||||||||||||
Year ended 08/31/23 | 6.80 | 0.62 | (0.06 | ) | 0.56 | (0.66 | ) | (0.03 | ) | (0.69 | ) | 6.67 | 8.89 | 20 | 0.76 | 0.76 | 0.71 | 9.34 | 31 | |||||||||||||||||||||||||||||||||||||||||
Year ended 08/31/22 | 7.11 | 0.38 | (0.33 | ) | 0.05 | (0.36 | ) | – | (0.36 | ) | 6.80 | 0.74 | 12 | 0.70 | 0.70 | 0.66 | 5.39 | 68 | ||||||||||||||||||||||||||||||||||||||||||
Year ended 08/31/21 | 6.62 | 0.34 | 0.48 | 0.82 | (0.33 | ) | – | (0.33 | ) | 7.11 | 12.65 | 12 | 0.73 | 0.74 | 0.66 | 4.90 | 86 | |||||||||||||||||||||||||||||||||||||||||||
Year ended 08/31/20 | 7.63 | 0.34 | (1.00 | ) | (0.66 | ) | (0.35 | ) | – | (0.35 | ) | 6.62 | (8.80 | ) | 8 | 0.80 | 0.80 | 0.69 | 4.92 | 53 | ||||||||||||||||||||||||||||||||||||||||
Class R6 | ||||||||||||||||||||||||||||||||||||||||||||||||||||||||||||
Year ended 08/31/24 | 6.66 | 0.60 | 0.01 | 0.61 | (0.58 | ) | (0.06 | ) | (0.64 | ) | 6.63 | 9.55 | 114,665 | 0.76 | 0.76 | 0.71 | 9.00 | 48 | ||||||||||||||||||||||||||||||||||||||||||
Year ended 08/31/23 | 6.77 | 0.62 | (0.04 | ) | 0.58 | (0.66 | ) | (0.03 | ) | (0.69 | ) | 6.66 | 9.22 | 199,550 | 0.74 | 0.74 | 0.69 | 9.36 | 31 | |||||||||||||||||||||||||||||||||||||||||
Year ended 08/31/22 | 7.08 | 0.37 | (0.32 | ) | 0.05 | (0.36 | ) | – | (0.36 | ) | 6.77 | 0.72 | 245,252 | 0.70 | 0.70 | 0.66 | 5.39 | 68 | ||||||||||||||||||||||||||||||||||||||||||
Year ended 08/31/21 | 6.60 | 0.34 | 0.47 | 0.81 | (0.33 | ) | – | (0.33 | ) | 7.08 | 12.60 | 196,230 | 0.69 | 0.74 | 0.62 | 4.94 | 86 | |||||||||||||||||||||||||||||||||||||||||||
Year ended 08/31/20 | 7.61 | 0.36 | (1.02 | ) | (0.66 | ) | (0.35 | ) | – | (0.35 | ) | 6.60 | (8.80 | ) | 194,825 | 0.77 | 0.79 | 0.66 | 4.95 | 53 | ||||||||||||||||||||||||||||||||||||||||
| (a) | Calculated using average shares outstanding. |
| (b) | Assumes an initial investment on the business day before the first day of the fiscal period, with all dividends and distributions reinvested in additional shares on the reinvestment date, and redemption at the net asset value calculated on the last business day of the fiscal period. Sales charges are not reflected in the total returns. Total returns are not annualized for periods less than one full year. Returns do not reflect the deduction of taxes that a shareholder would pay on fund distributions or the redemption of fund shares. |
| (c) | Portfolio turnover is calculated at the fund level and is not annualized for periods less than one year, if applicable. For the year ended ended August 31, 2021, the portfolio turnover calculation excludes the value of securities purchased of $42,745,724 in connection with the acquisition of Invesco Senior Floating Rate Plus Fund into the Fund. |
See accompanying Notes to Financial Statements which are an integral part of the financial statements.
| 24 | Invesco Senior Floating Rate Fund |
Notes to Financial Statements
August 31, 2024
NOTE 1–Significant Accounting Policies
Invesco Senior Floating Rate Fund (the “Fund”) is a series portfolio of AIM Counselor Series Trust (Invesco Counselor Series Trust) (the “Trust”). The Trust is a Delaware statutory trust registered under the Investment Company Act of 1940, as amended (the “1940 Act”), as an open-end series management investment company authorized to issue an unlimited number of shares of beneficial interest. Information presented in these financial statements pertains only to the Fund. Matters affecting the Fund or each class will be voted on exclusively by the shareholders of the Fund or each class.
The Fund’s investment objective is to seek income.
The Fund currently consists of six different classes of shares: Class A, Class C, Class R, Class Y, Class R5 and Class R6. Class Y shares are available only to certain investors. Class A shares are sold with a front-end sales charge unless certain waiver criteria are met. Under certain circumstances, load waived shares may be subject to contingent deferred sales charges (“CDSC”). Class C shares are sold with a CDSC. Class R, Class Y, Class R5 and Class R6 shares are sold at net asset value. Class C shares held for eight years after purchase are eligible for automatic conversion into Class A shares of the same Fund (the “Conversion Feature”). The automatic conversion pursuant to the Conversion Feature will generally occur at the end of the month following the eighth anniversary after a purchase of Class C shares.
Effective after the close of business on September 30, 2024, Class R5 shares are closed to new investors.
The Fund is an investment company and accordingly follows the investment company accounting and reporting guidance in accordance with Financial Accounting Standards Board Accounting Standards Codification Topic 946, Financial Services - Investment Companies.
The following is a summary of the significant accounting policies followed by the Fund in the preparation of its financial statements.
| A. | Security Valuations - Variable rate senior loan interests are fair valued using quotes provided by an independent pricing service. Quotes provided by the pricing service may reflect appropriate factors such as ratings, tranche type, industry, company performance, spread, individual trading characteristics, institution-size trading in similar groups of securities and other market data. |
Securities, including restricted securities, are valued according to the following policy. A security listed or traded on an exchange is generally valued at its trade price or official closing price that day as of the close of the exchange where the security is principally traded, or lacking any trades or official closing price on a particular day, the security may be valued at the closing bid or ask price on that day. Securities traded in the over-the-counter market (but not securities reported on the NASDAQ Stock Exchange) are valued based on the prices furnished by independent pricing services, in which case the securities may be considered fair valued, or by market makers. Each security reported on the NASDAQ Stock Exchange is valued at the NASDAQ Official Closing Price (“NOCP”) as of the close of the customary trading session on the valuation date or absent a NOCP, at the closing bid price.
Futures contracts are valued at the daily settlement price set by an exchange on which they are principally traded. Where a final settlement price exists, exchange-traded options are valued at the final settlement price from the exchange where the option principally trades. Where a final settlement price does not exist, exchange-traded options are valued at the mean between the last bid and ask price generally from the exchange where the option principally trades.
Securities of investment companies that are not exchange-traded (e.g., open-end mutual funds) are valued using such company’s end-of-business-day net asset value per share.
Fixed income securities (including convertible debt securities) generally are valued on the basis of prices provided by independent pricing services. Prices provided by the pricing service may be determined without exclusive reliance on quoted prices, and may reflect appropriate factors such as institution-size trading in similar groups of securities, developments related to specific securities, dividend rate (for unlisted equities), yield (for debt obligations), quality, type of issue, coupon rate (for debt obligations), maturity (for debt obligations), individual trading characteristics and other market data. Pricing services generally value debt obligations assuming orderly transactions of institutional round lot size, but a fund may hold or transact in the same securities in smaller, odd lot sizes. Odd lots often trade at lower prices than institutional round lots, and their value may be adjusted accordingly. Debt obligations are subject to interest rate and credit risks. In addition, all debt obligations involve some risk of default with respect to interest and/or principal payments.
Swap agreements are fair valued using an evaluated quote, if available, provided by an independent pricing service. Evaluated quotes provided by the pricing service are valued based on a model which may include end-of-day net present values, spreads, ratings, industry, company performance and returns of referenced assets. Centrally cleared swap agreements are valued at the daily settlement price determined by the relevant exchange or clearinghouse.
Deposits, other obligations of U.S. and non-U.S. banks and financial institutions are valued at their daily account value.
Foreign securities’ (including foreign exchange contracts) prices are converted into U.S. dollar amounts using the applicable exchange rates as of the close of the New York Stock Exchange (“NYSE”). If market quotations are available and reliable for foreign exchange-traded equity securities, the securities will be valued at the market quotations. Invesco Advisers, Inc. (the “Adviser” or “Invesco”) may use various pricing services to obtain market quotations as well as fair value prices. Because trading hours for certain foreign securities end before the close of the NYSE, closing market quotations may become not representative of market value in the Adviser’s judgment (“unreliable”). If, between the time trading ends on a particular security and the close of the customary trading session on the NYSE, a significant event occurs that makes the closing price of the security unreliable, the Adviser may fair value the security. If the event is likely to have affected the closing price of the security, the security will be valued at fair value in good faith in accordance with Board- approved policies and related Adviser procedures (“Valuation Procedures”). Adjustments to closing prices to reflect fair value may also be based on a screening process of an independent pricing service to indicate the degree of certainty, based on historical data, that the closing price in the principal market where a foreign security trades is not the current value as of the close of the NYSE. Foreign securities’ prices meeting the degree of certainty that the price is not reflective of current value will be priced at the indication of fair value from the independent pricing service. Multiple factors may be considered by the independent pricing service in determining adjustments to reflect fair value and may include information relating to sector indices, American Depositary Receipts and domestic and foreign index futures. Foreign securities may have additional risks including exchange rate changes, potential for sharply devalued currencies and high inflation, political and economic upheaval, the relative lack of issuer information, relatively low market liquidity and the potential lack of strict financial and accounting controls and standards.
Unlisted securities will be valued using prices provided by independent pricing services or by another method that the Adviser, in its judgment, believes better reflects the security’s fair value in accordance with the Valuation Procedures.
Non-traded rights and warrants shall be valued at intrinsic value if the terms of the rights and warrants are available, specifically the subscription or exercise price and the ratio. Intrinsic value is calculated as the daily market closing price of the security to be received less the subscription price, which is then adjusted by the exercise ratio. In the case of warrants, an option pricing model supplied by an independent pricing service may be used based on market data such as volatility, stock price and interest rate from the independent pricing service and strike price and exercise period from verified terms.
Securities for which market prices are not provided by any of the above methods may be valued based upon quotes furnished by independent sources. The mean between the last bid and ask prices may be used to value debt obligations, including corporate loans.
Securities for which market quotations are not readily available are fair valued by the Adviser in accordance with the Valuation Procedures. If a fair value price provided by a pricing service is unreliable, the Adviser will fair value the security using the Valuation Procedures. Issuer specific events, market trends, bid/ask quotes of brokers and information providers and other market data may be reviewed in the course of making a good faith determination of a security’s fair value.
The Fund may invest in securities that are subject to interest rate risk, meaning the risk that the prices will generally fall as interest rates rise and, conversely, the prices will generally rise as interest rates fall. Specific securities differ in their sensitivity to changes in interest rates depending on their individual characteristics. Changes in interest rates may result in increased market volatility, which may affect the value and/or liquidity of certain Fund investments.
| 25 | Invesco Senior Floating Rate Fund |
Valuations change in response to many factors including the historical and prospective earnings of the issuer, the value of the issuer’s assets, general market conditions which are not specifically related to the particular issuer, such as real or perceived adverse economic conditions, changes in the general outlook for revenues or corporate earnings, changes in interest or currency rates, regional or global instability, natural or environmental disasters, widespread disease or other public health issues, war, acts of terrorism, significant governmental actions or adverse investor sentiment generally and market liquidity. Because of the inherent uncertainties of valuation, the values reflected in the financial statements may materially differ from the value received upon actual sale of those investments.
The price the Fund could receive upon the sale of any investment may differ from the Adviser’s valuation of the investment, particularly for securities that are valued using a fair valuation technique. When fair valuation techniques are applied, the Adviser uses available information, including both observable and unobservable inputs and assumptions, to determine a methodology that will result in a valuation that the Adviser believes approximates market value. Fund securities that are fair valued may be subject to greater fluctuation in their value from one day to the next than would be the case if market quotations were used. Because of the inherent uncertainties of valuation, and the degree of subjectivity in such decisions, the Fund could realize a greater or lesser than expected gain or loss upon the sale of the investment.
| B. | Securities Transactions and Investment Income - Securities transactions are accounted for on a trade date basis. Realized gains or losses on sales are computed on the basis of specific identification of the securities sold. Interest income (net of withholding tax, if any) is recorded on an accrual basis from settlement date and includes coupon interest and amortization of premium and accretion of discount on debt securities as applicable. Pay-in-kind interest income and non-cash dividend income received in the form of securities in lieu of cash are recorded at the fair value of the securities received. Facility fees received may be amortized over the life of the loan. Dividend income (net of withholding tax, if any) is recorded on the ex-dividend date. |
The Fund may periodically participate in litigation related to Fund investments. As such, the Fund may receive proceeds from litigation settlements. Any proceeds received are included in the Statement of Operations as realized gain (loss) for investments no longer held and as unrealized gain (loss) for investments still held.
The Fund is plaintiff to legal proceedings in connection with certain of its portfolio investments. The outcome and financial effect, if any, of these legal proceedings cannot be determined at this time because the proceedings are ongoing and have not been fully adjudicated. The Fund received a cash payment of $10,682,658 from the issuer of one of its portfolio investments (Robertshaw US Holding Corp.), the status of which is subject to such ongoing litigation. Consequently, the Fund continues to recognize its investments in the various Robertshaw Term Loans in the Schedule of Investments and has recorded the cash received as restricted cash and an offsetting liability proceeds received in connection with pending litigation for such cash proceeds received in the Statement of Assets and Liabilities.
Other income is comprised primarily of amendment fees which are recorded when received. Amendment fees are received in return for changes in the terms of the loan or note.
Brokerage commissions and mark ups are considered transaction costs and are recorded as an increase to the cost basis of securities purchased and/or a reduction of proceeds on a sale of securities. Such transaction costs are included in the determination of net realized and unrealized gain (loss) from investment securities reported in the Statement of Operations and the Statement of Changes in Net Assets and the net realized and unrealized gains (losses) on securities per share in the Financial Highlights. Transaction costs are included in the calculation of the Fund’s net asset value and, accordingly, they reduce the Fund’s total returns. These transaction costs are not considered operating expenses and are not reflected in net investment income reported in the Statement of Operations and the Statement of Changes in Net Assets, or the net investment income per share and the ratios of expenses and net investment income reported in the Financial Highlights, nor are they limited by any expense limitation arrangements between the Fund and the investment adviser.
The Fund allocates realized and unrealized capital gains and losses to a class based on the relative net assets of each class. The Fund allocates income to a class based on the relative value of the settled shares of each class.
| C. | Country Determination - For the purposes of making investment selection decisions and presentation in the Schedule of Investments, the investment adviser may determine the country in which an issuer is located and/or credit risk exposure based on various factors. These factors include the laws of the country under which the issuer is organized, where the issuer maintains a principal office, the country in which the issuer derives 50% or more of its total revenues, the country that has the primary market for the issuer’s securities and its “country of risk” as determined by a third party service provider, as well as other criteria. Among the other criteria that may be evaluated for making this determination are the country in which the issuer maintains 50% or more of its assets, the type of security, financial guarantees and enhancements, the nature of the collateral and the sponsor organization. Country of issuer and/or credit risk exposure has been determined to be the United States of America, unless otherwise noted. |
| D. | Distributions - Distributions from net investment income, if any, are declared daily and paid monthly. Distributions from net realized capital gain, if any, are generally declared and paid annually and recorded on the ex-dividend date. The Fund may elect to treat a portion of the proceeds from redemptions as distributions for federal income tax purposes. |
| E. | Federal Income Taxes - The Fund intends to comply with the requirements of Subchapter M of the Internal Revenue Code of 1986, as amended (the “Internal Revenue Code”), necessary to qualify as a regulated investment company and to distribute substantially all of the Fund’s taxable earnings to shareholders. As such, the Fund will not be subject to federal income taxes on otherwise taxable income (including net realized capital gain) that is distributed to shareholders. Therefore, no provision for federal income taxes is recorded in the financial statements. |
The Fund recognizes the tax benefits of uncertain tax positions only when the position is more likely than not to be sustained. Management has analyzed the Fund’s uncertain tax positions and concluded that no liability for unrecognized tax benefits should be recorded related to uncertain tax positions. Management is not aware of any tax positions for which it is reasonably possible that the total amounts of unrecognized tax benefits will change materially in the next 12 months.
The Fund files tax returns in the U.S. Federal jurisdiction and certain other jurisdictions. Generally, the Fund is subject to examinations by such taxing authorities for up to three years after the filing of the return for the tax period.
| F. | Expenses - Fees provided for under the Rule 12b-1 plan of a particular class of the Fund are charged to the operations of such class. Transfer agency fees and expenses and other shareholder recordkeeping fees and expenses attributable to Class R5 and Class R6 are allocated based on relative net assets of Class R5 and Class R6. Sub-accounting fees attributable to Class R5 are charged to the operations of the class. Transfer agency fees and expenses and other shareholder recordkeeping fees and expenses relating to all other classes are allocated among those classes based on relative net assets. All other expenses are allocated among the classes based on the relative value of settled shares. |
| G. | Interest, Facilities and Maintenance Fees - Interest, Facilities and Maintenance Fees include interest and related borrowing costs such as commitment fees, administrative expenses, negative or overdrawn balances on margin accounts and other expenses associated with establishing and maintaining a line of credit. |
| H. | Accounting Estimates - The preparation of financial statements in conformity with accounting principles generally accepted in the United States of America (“GAAP”) requires management to make estimates and assumptions that affect the reported amounts of assets and liabilities at the date of the financial statements and the reported amounts of revenues and expenses during the reporting period including estimates and assumptions related to taxation. Actual results could differ from those estimates by a significant amount. In addition, the Fund monitors for material events or transactions that may occur or become known after the period-end date and before the date the financial statements are released to print. |
| I. | Indemnifications - Under the Trust’s organizational documents, each Trustee, officer, employee or other agent of the Trust is indemnified against certain liabilities that may arise out of the performance of their duties to the Fund. Additionally, in the normal course of business, the Fund enters into contracts, including the Fund’s servicing agreements, that contain a variety of indemnification clauses. The Fund’s maximum exposure under these arrangements is unknown |
| 26 | Invesco Senior Floating Rate Fund |
| as this would involve future claims that may be made against the Fund that have not yet occurred. The risk of material loss as a result of such indemnification claims is considered remote. |
| J. | Cash and Cash Equivalents - For the purposes of the Statement of Cash Flows, the Fund defines Cash and Cash Equivalents as cash (including foreign currency), restricted cash, money market funds and other investments held in lieu of cash and excludes investments made with cash collateral received. |
| K. | Securities Purchased on a When-Issued and Delayed Delivery Basis - The Fund may purchase and sell interests in corporate loans and corporate debt securities and other portfolio securities on a when-issued and delayed delivery basis, with payment and delivery scheduled for a future date. No income accrues to the Fund on such interests or securities in connection with such transactions prior to the date the Fund actually takes delivery of such interests or securities. These transactions are subject to market fluctuations and are subject to the risk that the value at delivery may be more or less than the trade date purchase price. Although the Fund will generally purchase these securities with the intention of acquiring such securities, they may sell such securities prior to the settlement date. |
| L. | Foreign Currency Translations - Foreign currency is valued at the close of the NYSE based on quotations posted by banks and major currency dealers. Portfolio securities and other assets and liabilities denominated in foreign currencies are translated into U.S. dollar amounts at the date of valuation. Purchases and sales of portfolio securities (net of foreign taxes withheld on disposition) and income items denominated in foreign currencies are translated into U.S. dollar amounts on the respective dates of such transactions. The Fund does not separately account for the portion of the results of operations resulting from changes in foreign exchange rates on investments and the fluctuations arising from changes in market prices of securities held. The combined results of changes in foreign exchange rates and the fluctuation of market prices on investments (net of estimated foreign tax withholding) are included with the net realized and unrealized gain or loss from investments in the Statement of Operations. Reported net realized foreign currency gains or losses arise from (1) sales of foreign currencies, (2) currency gains or losses realized between the trade and settlement dates on securities transactions, and (3) the difference between the amounts of dividends, interest, and foreign withholding taxes recorded on the Fund’s books and the U.S. dollar equivalent of the amounts actually received or paid. Net unrealized foreign currency gains and losses arise from changes in the fair values of assets and liabilities, other than investments in securities at fiscal period end, resulting from changes in exchange rates. |
The Fund may invest in foreign securities, which may be subject to foreign taxes on income, gains on investments or currency repatriation, a portion of which may be recoverable. Foreign taxes, if any, are recorded based on the tax regulations and rates that exist in the foreign markets in which the Fund invests and are shown in the Statement of Operations.
The performance of the Fund may be materially affected positively or negatively by foreign currency strength or weakness relative to the U.S. dollar. Currency rates in foreign countries may fluctuate for a number of reasons, including changes in interest rates, political, economic, or social instability and development, and imposition of currency controls. Currency controls in certain foreign jurisdictions may cause the Fund to experience significant delays in its ability to repatriate its assets in U.S. dollars at quoted spot rates, and it is possible that the Fund’s ability to convert certain foreign currencies into U.S. dollars may be limited and may occur at discounts to quoted rates. As a result, the value of the Fund’s assets and liabilities denominated in such currencies that would ultimately be realized could differ from those reported on the Statement of Assets and Liabilities. Certain foreign companies may be subject to sanctions, embargoes, or other governmental actions that may limit the ability to invest in, receive, hold, or sell the securities of such companies, all of which affect the market and/or credit risk of the investments. Because of the inherent uncertainties of valuation, the values reflected in the financial statements may materially differ from the value received upon actual sale of those investments.
| M. | Forward Foreign Currency Contracts - The Fund may engage in foreign currency transactions either on a spot (i.e. for prompt delivery and settlement) basis, or through forward foreign currency contracts, to manage or minimize currency or exchange rate risk. |
The Fund may also enter into forward foreign currency contracts for the purchase or sale of a security denominated in a foreign currency in order to “lock in” the U.S. dollar price of that security, or the Fund may also enter into forward foreign currency contracts that do not provide for physical exchange of the two currencies on the settlement date, but instead are settled by a single cash payment calculated as the difference between the agreed upon exchange rate and the spot rate at settlement based upon an agreed upon notional amount (non-deliverable forwards).
A forward foreign currency contract is an obligation between two parties (“Counterparties”) to purchase or sell a specific currency for an agreed-upon price at a future date. The use of forward foreign currency contracts for hedging does not eliminate fluctuations in the price of the underlying securities the Fund owns or intends to acquire but establishes a rate of exchange in advance. Fluctuations in the value of these contracts are measured by the difference in the contract date and reporting date exchange rates and are recorded as unrealized appreciation (depreciation) until the contracts are closed. When the contracts are closed, realized gains (losses) are recorded. Realized and unrealized gains (losses) on the contracts are included in the Statement of Operations. The primary risks associated with forward foreign currency contracts include failure of the Counterparty to meet the terms of the contract and the value of the foreign currency changing unfavorably. These risks may be in excess of the amounts reflected in the Statement of Assets and Liabilities.
| N. | Industry Focus - To the extent that the Fund invests a greater amount of its assets in securities of issuers in the banking and financial services industries, the Fund’s performance will depend to a greater extent on the overall condition of those industries. The value of these securities can be sensitive to changes in government regulation, interest rates and economic downturns in the U.S. and abroad. |
| O. | Bank Loan Risk - Although the resale, or secondary market for floating rate loans has grown substantially over the past decade, both in overall size and number of market participants, there is no organized exchange or board of trade on which floating rate loans are traded. Instead, the secondary market for floating rate loans is a private, unregulated interdealer or interbank resale market. Such a market may therefore be subject to irregular trading activity, wide bid/ask spreads, and extended trade settlement periods, which may impair the Fund’s ability to sell bank loans within its desired time frame or at an acceptable price and its ability to accurately value existing and prospective investments. Extended trade settlement periods may result in cash not being immediately available to the Fund. As a result, the Fund may have to sell other investments or engage in borrowing transactions to raise cash to meet its obligations. Similar to other asset classes, bank loan funds may be exposed to counterparty credit risk, or the risk than an entity with which the Fund has unsettled or open transactions may fail to or be unable to perform on its commitments. The Fund seeks to manage counterparty credit risk by entering into transactions only with counterparties that it believes have the financial resources to honor their obligations and by monitoring the financial stability of those counterparties. |
| P. | LIBOR Transition Risk - The Fund may have investments in financial instruments that recently transitioned from, or continue to be tied to, the London Interbank Offered Rate (“LIBOR”) as the reference or benchmark rate for variable interest rate calculations. LIBOR was a common benchmark interest rate index historically used to make adjustments to variable-rate debt instruments, to determine interest rates for a variety of financial instruments and borrowing arrangements and as a reference rate in derivative contracts. |
The UK Financial Conduct Authority (“FCA”), the regulator that oversees LIBOR, has ceased publishing the majority of LIBOR rates. In April 2023, the FCA announced that some USD LIBOR settings will continue to be published under a synthetic methodology until September 30, 2024 for certain legacy contracts, but any such rates are considered non-representative of the underlying market. Regulators and financial industry working groups have worked to identify alternative reference rates (“ARRs”) to replace LIBOR and to assist with the transition to the new ARRs. Under U.S. regulations that implement a statutory fallback mechanism to replace LIBOR, benchmark rates based on the Secured Overnight Financing Rate (“SOFR”) have replaced LIBOR in certain financial contracts. SOFR is a broad measure of the cost of overnight borrowing of cash through repurchase agreements collateralized by U.S. Treasury securities.
While the transition process away from LIBOR has become increasingly well-defined, there remains uncertainty and risks relating to converting certain longer-term securities and transactions to a new ARR. There can be no assurance that the composition or characteristics of any ARRs or financial instruments in which the Fund invests that utilize ARRs will be similar to or produce the same value or economic equivalence as LIBOR or that these instruments will have the same volume or liquidity. Additionally, while some legacy USD LIBOR instruments may provide for an alternative or fallback rate-setting methodology, there may be
| 27 | Invesco Senior Floating Rate Fund |
significant uncertainty regarding the effectiveness of such methodologies to replicate USD LIBOR; other legacy USD LIBOR instruments may not include such fallback rate-setting provisions at all or may not be able to rely on the statutory fallback mechanism, the effectiveness of which is also uncertain. While it is expected that the market participants will amend legacy financial instruments referencing LIBOR to include such fallback provisions to ARRs, there remains uncertainty regarding the willingness and ability of parties to add or amend such fallback provisions in legacy instruments. Moreover, certain aspects of the transition from LIBOR will rely on the actions of third-party market participants, such as clearing houses, trustees, administrative agents, asset servicers and certain service providers; the Adviser cannot guarantee the performance of such market participants and any failure on the part of such market participants to manage their part of the LIBOR transition could impact the Fund. The Fund may have instruments linked to other interbank offered rates that may also cease to be published in the future. All of the foregoing may adversely affect the Fund’s performance or NAV.
| Q. | Leverage Risk - The Fund may utilize leverage to seek to enhance the yield of the Fund by borrowing. There are risks associated with borrowing in an effort to increase the yield and distributions on the common shares, including that the costs of the financial leverage may exceed the income from investments purchased with such leverage proceeds, the higher volatility of the net asset value of the shares, and that fluctuations in the interest rates on the borrowing may affect the yield and distributions to the common shareholders. There can be no assurance that the Fund’s leverage strategy will be successful. |
| R. | Other Risks - The Fund may invest all or substantially all of its assets in senior secured floating rate loans and senior secured debt securities that are determined to be rated below investment grade. These securities are generally considered to have speculative characteristics and are subject to greater risk of loss of principal and interest than higher rated securities. The value of lower quality debt securities and floating rate loans can be more volatile due to increased sensitivity to adverse issuer, political, regulatory, market or economic developments. |
The Fund invests in corporate loans from U.S. or non-U.S. companies (the “Borrowers”). The investment of the Fund in a corporate loan may take the form of participation interests or assignments. If the Fund purchases a participation interest from a syndicate of lenders (“Lenders”) or one of the participants in the syndicate (“Participant”), one or more of which administers the loan on behalf of all the Lenders (the “Agent Bank”), the Fund would be required to rely on the Lender that sold the participation interest not only for the enforcement of the Fund’s rights against the Borrower but also for the receipt and processing of payments due to the Fund under the corporate loans. As such, the Fund is subject to the credit risk of the Borrower and the Participant. Lenders and Participants interposed between the Fund and a Borrower, together with Agent Banks, are referred to as “Intermediate Participants”.
Increases in the federal funds and equivalent foreign rates or other changes to monetary policy or regulatory actions may expose fixed income markets to heightened volatility, perhaps suddenly and to a significant degree, and to reduced liquidity for certain fixed income investments, particularly those with longer maturities. Such changes and resulting increased volatility may adversely impact the Fund, including its operations, universe of potential investment options, and return potential. It is difficult to predict the impact of interest rate changes on various markets. In addition, decreases in fixed income dealer market-making capacity may also potentially lead to heightened volatility and reduced liquidity in the fixed income markets. As a result, the value of the Fund’s investments and share price may decline. Changes in central bank policies and other governmental actions and political events within the U.S. and abroad may also, among other things, affect investor and consumer expectations and confidence in the financial markets. This could result in higher than normal redemptions by shareholders, which could potentially increase the Fund’s portfolio turnover rate and transaction costs.
NOTE 2–Advisory Fees and Other Fees Paid to Affiliates
The Trust has entered into a master investment advisory agreement with the Adviser. Under the terms of the investment advisory agreement, the Fund accrues daily and pays monthly an advisory fee to the Adviser based on the annual rate of the Fund’s average daily net assets as follows:
| Average Daily Net Assets | Rate* | |
First $ 200 million | 0.750% | |
Next $200 million | 0.720% | |
Next $200 million | 0.690% | |
Next $200 million | 0.660% | |
Next $4.2 billion | 0.600% | |
Next $5 billion | 0.580% | |
Next $10 billion | 0.560% | |
Over $20 billion | 0.550% |
| * | The advisory fee paid by the Fund shall be reduced by any amounts paid by the Fund under the administrative services agreement with the Adviser. |
For the year ended August 31, 2024, the effective advisory fee rate incurred by the Fund was 0.61%.
Under the terms of a master sub-advisory agreement between the Adviser and each of Invesco Asset Management Deutschland GmbH, Invesco Asset Management Limited, Invesco Asset Management (Japan) Limited, Invesco Hong Kong Limited, Invesco Senior Secured Management, Inc. and Invesco Canada Ltd. and separate sub-advisory agreements with Invesco Capital Management LLC and Invesco Asset Management (India) Private Limited (collectively, the “Affiliated Sub-Advisers”) the Adviser, not the Fund, will pay 40% of the fees paid to the Adviser to any such Affiliated Sub-Adviser(s) that provide(s) discretionary investment management services to the Fund based on the percentage of assets allocated to such Affiliated Sub-Adviser(s). Invesco has also entered into a sub-advisory agreement with OppenheimerFunds, Inc. to provide discretionary management services to the Fund.
The Adviser has contractually agreed, through at least December 31, 2024, to waive advisory fees and/or reimburse expenses to the extent necessary to limit total annual fund operating expenses after fee waiver and/or expense reimbursement (excluding certain items discussed below) of Class A, Class C, Class R, Class Y, Class R5 and Class R6 shares to 1.02%, 1.77%, 1.27%, 0.77%, 0.77% and 0.77%, respectively, of the Fund’s average daily net assets (the “expense limits”). In determining the Adviser’s obligation to waive advisory fees and/or reimburse expenses, the following expenses are not taken into account, and could cause the total annual fund operating expenses after fee waiver and/or expense reimbursement to exceed the numbers reflected above: (1) interest, facilities and maintenance fees; (2) taxes; (3) dividend expense on short sales; (4) extraordinary or non-routine items, including litigation expenses; and (5) expenses that the Fund has incurred but did not actually pay because of an expense offset arrangement. Unless Invesco continues the fee waiver agreement, it will terminate on December 31, 2024. During its term, the fee waiver agreement cannot be terminated or amended to increase the expense limits or reduce the advisory fee waivers without approval of the Board of Trustees.
Further, the Adviser has contractually agreed, through at least June 30, 2026, to waive the advisory fee payable by the Fund in an amount equal to 100% of the net advisory fees the Adviser receives from the affiliated money market funds on investments by the Fund of uninvested cash in such affiliated money market funds.
For the year ended August 31, 2024, the Adviser waived advisory fees of $84,610 and reimbursed class level expenses of $253,450, $33,013, $9,278, $211,045, $0 and $0 of Class A, Class C, Class R, Class Y, Class R5 and Class R6 shares, respectively.
The Trust has entered into a master administrative services agreement with Invesco pursuant to which the Fund has agreed to pay Invesco for certain administrative costs incurred in providing accounting services to the Fund. For the year ended August 31, 2024, expenses incurred under the agreement are shown in the Statement of Operations as Administrative services fees. Invesco has entered into a sub-administration agreement whereby State Street Bank and Trust Company (“SSB”) serves as fund accountant and provides certain administrative services to the Fund. Pursuant to a custody agreement with the Fund, SSB also serves as the Fund’s custodian.
| 28 | Invesco Senior Floating Rate Fund |
The Trust has entered into a transfer agency and service agreement with Invesco Investment Services, Inc. (“IIS”) pursuant to which the Fund has agreed to pay IIS a fee for providing transfer agency and shareholder services to the Fund and reimburse IIS for certain expenses incurred by IIS in the course of providing such services. IIS may make payments to intermediaries that provide omnibus account services, sub-accounting services and/or networking services. All fees payable by IIS to intermediaries that provide omnibus account services or sub-accounting services are charged back to the Fund, subject to certain limitations approved by the Trust’s Board of Trustees. For the year ended August 31, 2024, expenses incurred under the agreement are shown in the Statement of Operations as Transfer agent fees.
The Trust has entered into master distribution agreements with Invesco Distributors, Inc. (“IDI”) to serve as the distributor for the Class A, Class C, Class R, Class Y, Class R5 and Class R6 shares of the Fund. The Trust has adopted plans pursuant to Rule 12b-1 under the 1940 Act with respect to the Fund’s Class A, Class C and Class R shares (collectively, the “Plans”). The Fund, pursuant to the Class A Plan, reimburses IDI for its allocated share of expenses incurred for the period, up to a maximum annual rate of 0.25% of the average daily net assets of Class A shares. The Fund, pursuant to the Class C and Class R Plans, pays IDI compensation at the annual rate of 1.00% of the average daily net assets of Class C shares and 0.50% of the average daily net assets of Class R shares. The fees are accrued daily and paid monthly. Of the Plans payments, up to 0.25% of the average daily net assets of each class of shares may be paid to furnish continuing personal shareholder services to customers who purchase and own shares of such classes. Any amounts not paid as a service fee under the Plans would constitute an asset-based sales charge. Rules of the Financial Industry Regulatory Authority (“FINRA”) impose a cap on the total sales charges, including asset-based sales charges, that may be paid by any class of shares of the Fund. For the year ended August 31, 2024, expenses incurred under the Plans are shown in the Statement of Operations as Distribution fees.
Front-end sales commissions and CDSC (collectively, the “sales charges”) are not recorded as expenses of the Fund. Front-end sales commissions are deducted from proceeds from the sales of Fund shares prior to investment in Class A shares of the Fund. CDSC are deducted from redemption proceeds prior to remittance to the shareholder. During the year ended August 31, 2024, IDI advised the Fund that IDI retained $87,372 in front-end sales commissions from the sale of Class A shares and $28,629 and $10,987 from Class A and Class C shares, respectively, for CDSC imposed upon redemptions by shareholders.
Certain officers and trustees of the Trust are officers and directors of the Adviser, IIS and/or IDI.
NOTE 3–Additional Valuation Information
GAAP defines fair value as the price that would be received to sell an asset or paid to transfer a liability in an orderly transaction between market participants at the measurement date, under current market conditions. GAAP establishes a hierarchy that prioritizes the inputs to valuation methods, giving the highest priority to readily available unadjusted quoted prices in an active market for identical assets (Level 1) and the lowest priority to significant unobservable inputs (Level 3), generally when market prices are not readily available. Based on the valuation inputs, the securities or other investments are tiered into one of three levels. Changes in valuation methods may result in transfers in or out of an investment’s assigned level:
| Level 1 - | Prices are determined using quoted prices in an active market for identical assets. | |
| Level 2 - | Prices are determined using other significant observable inputs. Observable inputs are inputs that other market participants may use in pricing a security. These may include quoted prices for similar securities, interest rates, prepayment speeds, credit risk, yield curves, loss severities, default rates, discount rates, volatilities and others. When significant events due to market movements occur, foreign securities may be fair valued utilizing an independent pricing service. | |
| Level 3 - | Prices are determined using significant unobservable inputs. In situations where quoted prices or observable inputs are unavailable (for example, when there is little or no market activity for an investment at the end of the period), unobservable inputs may be used. Unobservable inputs reflect the Adviser’s assumptions about the factors market participants would use in determining fair value of the securities or instruments and would be based on the best available information. |
The following is a summary of the tiered valuation input levels, as of August 31, 2024. The level assigned to the securities valuations may not be an indication of the risk or liquidity associated with investing in those securities. Because of the inherent uncertainties of valuation, the values reflected in the financial statements may materially differ from the value received upon actual sale of those investments.
| Level 1 | Level 2 | Level 3 | Total | |||||||||||||
| ||||||||||||||||
Investments in Securities | ||||||||||||||||
| ||||||||||||||||
Variable Rate Senior Loan Interests | $ – | $2,383,530,202 | $190,816,267 | $2,574,346,469 | ||||||||||||
| ||||||||||||||||
Common Stocks & Other Equity Interests | 10,868,339 | 63,880,927 | 104,082,313 | 178,831,579 | ||||||||||||
| ||||||||||||||||
U.S. Dollar Denominated Bonds & Notes | – | 130,336,539 | – | 130,336,539 | ||||||||||||
| ||||||||||||||||
Non-U.S. Dollar Denominated Bonds & Notes | – | 82,051,740 | 221,602 | 82,273,342 | ||||||||||||
| ||||||||||||||||
Preferred Stocks | – | – | 15,101,781 | 15,101,781 | ||||||||||||
| ||||||||||||||||
Asset-Backed Securities | – | 9,033,746 | – | 9,033,746 | ||||||||||||
| ||||||||||||||||
Money Market Funds | 75,935,687 | – | – | 75,935,687 | ||||||||||||
| ||||||||||||||||
Total Investments in Securities | 86,804,026 | 2,668,833,154 | 310,221,963 | 3,065,859,143 | ||||||||||||
| ||||||||||||||||
Other Investments - Assets* | ||||||||||||||||
| ||||||||||||||||
Forward Foreign Currency Contracts | – | 2,407,675 | – | 2,407,675 | ||||||||||||
| ||||||||||||||||
Other Investments - Liabilities* | ||||||||||||||||
| ||||||||||||||||
Forward Foreign Currency Contracts | – | (8,157,398 | ) | – | (8,157,398 | ) | ||||||||||
| ||||||||||||||||
Total Other Investments | – | (5,749,723 | ) | – | (5,749,723 | ) | ||||||||||
| ||||||||||||||||
Total Investments | $86,804,026 | $2,663,083,431 | $310,221,963 | $3,060,109,420 | ||||||||||||
| ||||||||||||||||
| * | Unrealized appreciation (depreciation). |
A reconciliation of Level 3 investments is presented when the Fund had a significant amount of Level 3 investments at the beginning and/or end of the reporting period in relation to net assets.
| 29 | Invesco Senior Floating Rate Fund |
The following is a reconciliation of the fair valuations using significant unobservable inputs (Level 3) during the year ended August 31, 2024:
| Value 08/31/23 | Purchases at Cost | Proceeds from Sales | Accrued Discounts/ Premiums | Realized (Loss) | Change in Unrealized Appreciation (Depreciation) | Transfers into Level 3* | Transfers out of Level 3* | Value 08/31/24 | ||||||||||||||||||||||||||||
| Variable Rate Senior Loan Interests | $ | 195,453,168 | $ | 101,738,193 | $ | (84,674,885 | ) | $ | 2,523,330 | $ | (3,900,810 | ) | $ | (8,457,682 | ) | $ | 26,887,523 | $ | (38,752,570 | ) | $ | 190,816,267 | ||||||||||||||
| Common Stocks & Other Equity Interests | 174,610,960 | 34,457,347 | (130,061,382 | ) | – | 61,891,803 | (39,537,141 | ) | 14,054,300 | (11,333,574 | ) | 104,082,313 | ||||||||||||||||||||||||
Preferred Stocks | 2,839,826 | – | – | – | – | 4,421,485 | 7,840,470 | – | 15,101,781 | |||||||||||||||||||||||||||
| Non-U.S. Dollar Denominated Bonds & Notes | 416,703 | – | (440,443 | ) | 14,910 | (13,079 | ) | 243,511 | – | – | 221,602 | |||||||||||||||||||||||||
Total | $ | 373,320,657 | $ | 136,195,540 | $ | (215,176,710 | ) | $ | 2,538,240 | $ | 57,977,914 | $ | (43,329,827 | ) | $ | 48,782,293 | $ | (50,086,144 | ) | $ | 310,221,963 | |||||||||||||||
*Transfers into and out of Level 3 are due to increases or decreases in market activity impacting the available market inputs to determine the price.
Securities determined to be Level 3 at the end of the reporting period were valued primarily by utilizing evaluated prices from a third-party vendor pricing service. A significant change in third-party pricing information could result in a lower or higher value in Level 3 investments.
The following table summarizes the valuation techniques and significant unobservable inputs used in determining fair value measurements for those investments classified as Level 3 at period end:
| Fair Value at 08/31/24 | Valuation Technique | Unobservable Inputs | Range of Unobservable Inputs | Weighted Average of Unobservable Inputs Based on Fair Value | ||||||||
My Alarm Center LLC, Class A | $38,235,117 | Comparable Companies | EBITDA Multiple | 5.5x | - | (a) |
| (a) | Securities classified as Level 3 whose unadjusted values were provided by a pricing service and for which such inputs are unobservable. The valuation is based on an enterprise value approach that utilizes a multiple of the last twelve months’ earnings before interest, taxes, depreciation and amortization of comparable public companies. The Adviser reviews the valuation reports provided by the valuation service on an on-going basis and monitors such investments for additional information or the occurrence of a market event which would warrant a re-evaluation of the security’s fair valuation. |
NOTE 4–Derivative Investments
The Fund may enter into an International Swaps and Derivatives Association Master Agreement (“ISDA Master Agreement”) under which a fund may trade OTC derivatives. An OTC transaction entered into under an ISDA Master Agreement typically involves a collateral posting arrangement, payment netting provisions and close-out netting provisions. These netting provisions allow for reduction of credit risk through netting of contractual obligations. The enforceability of the netting provisions of the ISDA Master Agreement depends on the governing law of the ISDA Master Agreement, among other factors.
For financial reporting purposes, the Fund does not offset OTC derivative assets or liabilities that are subject to ISDA Master Agreements in the Statement of Assets and Liabilities.
Value of Derivative Investments at Period-End
The table below summarizes the value of the Fund’s derivative investments, detailed by primary risk exposure, held as of August 31, 2024:
| Value | ||||
| Currency | ||||
| Derivative Assets | Risk | |||
| ||||
Unrealized appreciation on forward foreign currency contracts outstanding | $ | 2,407,675 | ||
| ||||
Derivatives not subject to master netting agreements | – | |||
| ||||
Total Derivative Assets subject to master netting agreements | $ | 2,407,675 | ||
| ||||
| Value | ||||
| Currency | ||||
| Derivative Liabilities | Risk | |||
| ||||
Unrealized depreciation on forward foreign currency contracts outstanding | $ | (8,157,398 | ) | |
| ||||
Derivatives not subject to master netting agreements | – | |||
| ||||
Total Derivative Liabilities subject to master netting agreements | $ | (8,157,398 | ) | |
| ||||
| 30 | Invesco Senior Floating Rate Fund |
Offsetting Assets and Liabilities
The table below reflects the Fund’s exposure to Counterparties subject to either an ISDA Master Agreement or other agreement for OTC derivative transactions as of August 31, 2024.
| Financial Derivative Assets | Financial Derivative Liabilities | Collateral (Received)/Pledged | ||||||||||||||||||
| Counterparty | Forward Foreign Currency Contracts | Forward Foreign Currency Contracts | Net Value of Derivatives | Non-Cash | Cash | Net Amount | ||||||||||||||
| ||||||||||||||||||||
Barclays Bank PLC | $ 597,864 | $ | (589,511) | $ 8,353 | $– | $– | $ 8,353 | |||||||||||||
| ||||||||||||||||||||
BNP Paribas S.A. | 741,641 | (2,833,051) | (2,091,410 | ) | – | – | (2,091,410 | ) | ||||||||||||
| ||||||||||||||||||||
Canadian Imperial Bank of Commerce | 117,472 | (272,617) | (155,145 | ) | – | – | (155,145 | ) | ||||||||||||
| ||||||||||||||||||||
Morgan Stanley and Co. International PLC | – | (243,501) | (243,501 | ) | – | – | (243,501 | ) | ||||||||||||
| ||||||||||||||||||||
Royal Bank of Canada | – | (1,600,071) | (1,600,071 | ) | – | – | (1,600,071 | ) | ||||||||||||
| ||||||||||||||||||||
State Street Bank & Trust Co. | 111,557 | (2,003,646) | (1,892,089 | ) | – | – | (1,892,089 | ) | ||||||||||||
| ||||||||||||||||||||
Toronto-Dominion Bank (The) | 839,141 | (615,001) | 224,140 | – | – | 224,140 | ||||||||||||||
| ||||||||||||||||||||
Total | $2,407,675 | $ | (8,157,398) | $(5,749,723 | ) | $– | $– | $(5,749,723 | ) | |||||||||||
| ||||||||||||||||||||
Effect of Derivative Investments for the year ended August 31, 2024
The table below summarizes the gains (losses) on derivative investments, detailed by primary risk exposure, recognized in earnings during the period:
| Location of Gain (Loss) on | |||||
| Statement of Operations | |||||
| Currency | |||||
| Risk | |||||
Realized Gain: | |||||
Forward foreign currency contracts | $10,944,911 | ||||
Change in Net Unrealized Appreciation (Depreciation): | |||||
Forward foreign currency contracts | (13,287,671 | ) | |||
Total | $(2,342,760 | ) | |||
The table below summarizes the average notional value of derivatives held during the period. | |||||
Forward Foreign Currency | |||||
Average notional value | $ | 1,028,977,935 | |||
NOTE 5–Expense Offset Arrangement(s)
The expense offset arrangement is comprised of transfer agency credits which result from balances in demand deposit accounts used by the transfer agent for clearing shareholder transactions. For the year ended August 31, 2024, the Fund received credits from this arrangement, which resulted in the reduction of the Fund’s total expenses of $60,727.
NOTE 6–Trustees’ and Officers’ Fees and Benefits
Trustees’ and Officers’ Fees and Benefits include amounts accrued by the Fund to pay remuneration to certain Trustees and Officers of the Fund. Trustees have the option to defer compensation payable by the Fund, and Trustees’ and Officers’ Fees and Benefits also include amounts accrued by the Fund to fund such deferred compensation amounts. Those Trustees who defer compensation have the option to select various Invesco Funds in which their deferral accounts shall be deemed to be invested. Finally, certain current Trustees were eligible to participate in a retirement plan that provided for benefits to be paid upon retirement to Trustees over a period of time based on the number of years of service. The Fund may have certain former Trustees who also participate in a retirement plan and receive benefits under such plan. Trustees’ and Officers’ Fees and Benefits include amounts accrued by the Fund to fund such retirement benefits. Obligations under the deferred compensation and retirement plans represent unsecured claims against the general assets of the Fund.
NOTE 7–Cash Balances and Borrowings
Effective February 16, 2024, the Fund has entered into a credit agreement, which enables the Fund to participate with another Invesco Fund in a committed secured borrowing facility that permits borrowings up to $1,027,500,000, collectively by certain Invesco Funds, and which will expire on February 14, 2025. Prior to February 16, 2024, the credit agreement permitted borrowings up to $1.07 billion. The credit agreement is secured by the assets of the Fund. The Fund is subject to certain covenants relating to the credit agreement. Failure to comply with these restrictions could cause the acceleration of the repayment of the amount outstanding under the credit agreement. During the year ended August 31, 2024, the Fund did not borrow under this agreement.
Additionally, the Fund is permitted to temporarily carry a negative or overdrawn balance in its account with SSB, the custodian bank. Such balances, if any at period-end, are shown in the Statement of Assets and Liabilities under the payable caption Amount due custodian. To compensate the custodian bank for such overdrafts, the overdrawn Fund may either (1) leave funds as a compensating balance in the account so the custodian bank can be compensated by earning the additional interest; or (2) compensate by paying the custodian bank at a rate agreed upon by the custodian bank and Invesco, not to exceed the contractually agreed upon rate.
| 31 | Invesco Senior Floating Rate Fund |
NOTE 8–Unfunded Loan Commitments
Pursuant to the terms of certain Senior Loan agreements, the Fund held the following unfunded loan commitments as of August 31, 2024. The Fund intends to reserve against such contingent obligations by designating cash, liquid securities and liquid Senior Loans as a reserve. Unfunded loan commitments are reflected as a liability on the Statement of Assets and Liabilities.
| Borrower | Type | Unfunded Loan Commitment | Unrealized Appreciation (Depreciation) | |||||||
ABG Intermediate Holdings 2 LLC | Delayed Draw Term Loan | $ 1,629,276 | $ 9,165 | |||||||
Alter Domus (Chrysaor Bidco S.a.r.l.) | Delayed Draw Term Loan | 141,202 | 662 | |||||||
Epicor Software Corp. | Delayed Draw Term Loan B | 335,523 | 2,149 | |||||||
Groundworks LLC | Delayed Draw Term Loan | 401,773 | 2,356 | |||||||
Kantar (Summer BC Bidco/KANGRP) | Revolver Loan | 9,765,449 | (284,199 | ) | ||||||
MB2 Dental Solutions LLC | Revolver Loan | 153,100 | 1,546 | |||||||
MB2 Dental Solutions LLC | Delayed Draw Term Loan | 1,645,172 | 1,645 | |||||||
MB2 Dental Solutions LLC | Delayed Draw Term Loan | 987,103 | 987 | |||||||
McDermott International Ltd. | LOC | 5,184,042 | (440,644 | ) | ||||||
Mehilainen Yhtiot Oy | Delayed Draw Term Loan B-6 | 493,618 | 14,895 | |||||||
Parques Reunidos (Piolin Bidco S.A.U.) | Revolver Loan | 1,562,358 | 561,627 | |||||||
Platea BC Bidco AB | Delayed Draw Term Loan B | 170,398 | 6,192 | |||||||
Tank Holding Corp. | Revolver Loan | 455,317 | (7,898 | ) | ||||||
V Global Holdings LLC | Revolver Loan | 143,997 | (8,987 | ) | ||||||
| $23,068,328 | $(140,504 | ) | ||||||||
NOTE 9–Distributions to Shareholders and Tax Components of Net Assets
Tax Character of Distributions to Shareholders Paid During the Fiscal Years Ended August 31, 2024 and 2023:
| 2024 | 2023 | |||||||||||
| ||||||||||||
Ordinary income* | $265,050,247 | $327,448,849 | ||||||||||
| ||||||||||||
Return of capital | 27,688,402 | 12,482,603 | ||||||||||
| ||||||||||||
Total distributions | $292,738,649 | $339,931,452 | ||||||||||
| ||||||||||||
* Includes short-term capital gain distributions, if any.
Tax Components of Net Assets at Period-End:
| 2024 | ||||
| ||||
Net unrealized appreciation (depreciation) – investments | $ (159,395,765 | ) | ||
| ||||
Net unrealized appreciation (depreciation) – foreign currencies | (200,627 | ) | ||
| ||||
Temporary book/tax differences | (320,619 | ) | ||
| ||||
Capital loss carryforward | (2,527,754,394 | ) | ||
| ||||
Shares of beneficial interest | 5,720,227,110 | |||
| ||||
Total net assets | $ 3,032,555,705 | |||
| ||||
The difference between book-basis and tax-basis unrealized appreciation (depreciation) is due to differences in the timing of recognition of gains and losses on investments for tax and book purposes. The Fund’s net unrealized appreciation (depreciation) difference is attributable primarily to wash sales, amortization and accretion on debt securities and derivative instruments.
The temporary book/tax differences are a result of timing differences between book and tax recognition of income and/or expenses. The Fund’s temporary book/tax differences are the result of the trustee deferral of compensation and retirement plan benefits.
Capital loss carryforward is calculated and reported as of a specific date. Results of transactions and other activity after that date may affect the amount of capital loss carryforward actually available for the Fund to utilize. The ability to utilize capital loss carryforward in the future may be limited under the Internal Revenue Code and related regulations based on the results of future transactions.
The Fund has a capital loss carryforward as of August 31, 2024, as follows:
| Capital Loss Carryforward* | ||||||||||||||||||||
| ||||||||||||||||||||
| Expiration | Short-Term | Long-Term | Total | |||||||||||||||||
| ||||||||||||||||||||
Not subject to expiration | $ | 186,719,900 | $ | 2,341,034,494 | $ | 2,527,754,394 | ||||||||||||||
| ||||||||||||||||||||
| * | Capital loss carryforward is reduced for limitations, if any, to the extent required by the Internal Revenue Code and may be further limited depending upon a variety of factors, including the realization of net unrealized gains or losses as of the date of any reorganization. |
NOTE 10–Investment Transactions
The aggregate amount of investment securities (other than short-term securities, U.S. Government obligations and money market funds, if any) purchased and sold by the Fund during the year ended August 31, 2024 was $1,484,251,314 and $1,506,416,899, respectively. As of August 31, 2024, the aggregate cost of
| 32 | Invesco Senior Floating Rate Fund |
investments, including any derivatives, on a tax basis listed below includes the adjustments for financial reporting purposes as of the most recently completed federal income tax reporting period-end:
| Unrealized Appreciation (Depreciation) of Investments on a Tax Basis | ||||
| ||||
Aggregate unrealized appreciation of investments | $ | 132,907,069 | ||
| ||||
Aggregate unrealized (depreciation) of investments | (292,302,834 | ) | ||
| ||||
Net unrealized appreciation (depreciation) of investments | $ | (159,395,765 | ) | |
| ||||
Cost of investments for tax purposes is $3,219,505,185.
NOTE 11–Reclassification of Permanent Differences
Primarily as a result of differing book/tax treatment of foreign currency transactions and return of capital distributions, on August 31, 2024, undistributed net investment income was increased by $33,389,487, undistributed net realized gain (loss) was decreased by $5,701,086 and shares of beneficial interest was decreased by $27,688,401. This reclassification had no effect on the net assets of the Fund.
NOTE 12–Senior Loan Participation Commitments
The Fund invests in participations, assignments, or acts as a party to the primary lending syndicate of a Senior Loan interest to corporations, partnerships, and other entities. When the Fund purchases a participation of a Senior Loan interest, the Fund typically enters into a contractual agreement with the lender or other third party selling the participation, but not with the borrower directly. As such, the Fund assumes the credit risk of the borrower, selling participant or other persons interpositioned between the Fund and the borrower.
At the year ended August 31, 2024, the following sets forth the selling participants with respect to interest in Senior Loans purchased by the Fund on a participation basis.
| Principal | ||||||||||
| Selling Participant | Amount | Value | ||||||||
| ||||||||||
Barclays Bank PLC | $ | 14,857,647 | $11,273,082 | |||||||
| ||||||||||
JPMorgan Europe Ltd. | 1,479,193 | 1,125,755 | ||||||||
| ||||||||||
NOTE 13–Dividends
The Fund declared the following monthly dividends from net investment income subsequent to August 31, 2024.
| Amount Per Share | ||||
| Share Class | Record Date | Payable September 30, 2024 | ||
| ||||
Class A | Daily | $0.0476 | ||
| ||||
Class C | Daily | $0.0435 | ||
| ||||
Class R | Daily | $0.0462 | ||
| ||||
Class Y | Daily | $0.0489 | ||
| ||||
Class R5 | Daily | $0.0495 | ||
| ||||
Class R6 | Daily | $0.0494 | ||
| ||||
NOTE 14–Share Information
| Summary of Share Activity | ||||||||||||||||
| ||||||||||||||||
| Year ended | Year ended | |||||||||||||||
| August 31, 2024(a) | August 31, 2023 | |||||||||||||||
| Shares | Amount | Shares | Amount | |||||||||||||
| ||||||||||||||||
Sold: | ||||||||||||||||
Class A | 30,320,602 | $ | 202,110,341 | 27,920,339 | $ | 185,092,497 | ||||||||||
| ||||||||||||||||
Class C | 5,233,446 | 34,864,279 | 4,680,280 | 31,030,712 | ||||||||||||
| ||||||||||||||||
Class R | 944,722 | 6,287,859 | 952,149 | 6,279,368 | ||||||||||||
| ||||||||||||||||
Class Y | 61,430,238 | 408,467,303 | 64,350,516 | 425,812,240 | ||||||||||||
| ||||||||||||||||
Class R5 | - | - | 1,256 | 8,335 | ||||||||||||
| ||||||||||||||||
Class R6 | 7,914,139 | 52,496,866 | 24,908,484 | 163,305,758 | ||||||||||||
| ||||||||||||||||
Issued as reinvestment of dividends: | ||||||||||||||||
Class A | 15,559,733 | 103,628,340 | 17,202,634 | 113,352,430 | ||||||||||||
| ||||||||||||||||
Class C | 1,830,780 | 12,202,630 | 2,467,632 | 16,269,590 | ||||||||||||
| ||||||||||||||||
Class R | 679,138 | 4,521,518 | 783,138 | 5,156,425 | ||||||||||||
| ||||||||||||||||
Class Y | 10,800,317 | 71,803,559 | 12,876,307 | 84,671,387 | ||||||||||||
| ||||||||||||||||
Class R6 | 1,339,541 | 8,910,381 | 1,801,876 | 11,852,848 | ||||||||||||
| ||||||||||||||||
Automatic conversion of Class C shares to Class A shares: | ||||||||||||||||
Class A | 5,086,324 | 33,718,731 | 7,041,482 | 46,519,301 | ||||||||||||
| ||||||||||||||||
Class C | (5,083,935 | ) | (33,718,731 | ) | (7,036,400 | ) | (46,519,301 | ) | ||||||||
| ||||||||||||||||
| 33 | Invesco Senior Floating Rate Fund |
| Summary of Share Activity | ||||||||||||||||
| ||||||||||||||||
| Year ended | Year ended | |||||||||||||||
| August 31, 2024(a) | August 31, 2023 | |||||||||||||||
| Shares | Amount | Shares | Amount | |||||||||||||
| ||||||||||||||||
Reacquired: | ||||||||||||||||
Class A | (53,153,435 | ) | $ | (353,957,722 | ) | (59,950,481 | ) | $ | (396,634,769 | ) | ||||||
| ||||||||||||||||
Class C | (6,342,021 | ) | (42,385,244 | ) | (9,533,796 | ) | (63,100,649 | ) | ||||||||
| ||||||||||||||||
Class R | (1,892,395 | ) | (12,600,079 | ) | (1,893,042 | ) | (12,493,228 | ) | ||||||||
| ||||||||||||||||
Class Y | (74,878,814 | ) | (497,403,443 | ) | (114,314,162 | ) | (753,400,571 | ) | ||||||||
| ||||||||||||||||
Class R6 | (21,950,456 | ) | (146,312,535 | ) | (32,934,273 | ) | (217,843,408 | ) | ||||||||
| ||||||||||||||||
Net increase (decrease) in share activity | (22,162,076 | ) | $ | (147,365,947 | ) | (60,676,061 | ) | $ | (400,641,035 | ) | ||||||
| ||||||||||||||||
| (a) | There are entities that are record owners of more than 5% of the outstanding shares of the Fund and in the aggregate own 52% of the outstanding shares of the Fund. IDI has an agreement with these entities to sell Fund shares. The Fund, Invesco and/or Invesco affiliates may make payments to these entities, which are considered to be related to the Fund, for providing services to the Fund, Invesco and/or Invesco affiliates including but not limited to services such as securities brokerage, distribution, third party record keeping and account servicing. The Fund has no knowledge as to whether all or any portion of the shares owned of record by these entities are also owned beneficially. |
| 34 | Invesco Senior Floating Rate Fund |
Report of Independent Registered Public Accounting Firm
To the Board of Trustees of AIM Counselor Series Trust (Invesco Counselor Series Trust) and Shareholders of Invesco Senior Floating Rate Fund
Opinion on the Financial Statements
We have audited the accompanying statement of assets and liabilities, including the schedule of investments, of Invesco Senior Floating Rate Fund (one of the funds constituting AIM Counselor Series Trust (Invesco Counselor Series Trust), referred to hereafter as the “Fund”) as of August 31, 2024, the related statements of operations and cash flows for the year ended August 31, 2024, the statement of changes in net assets for each of the two years in the period ended August 31, 2024, including the related notes, and the financial highlights for each of the five years in the period ended August 31, 2024 (collectively referred to as the “financial statements”). In our opinion, the financial statements present fairly, in all material respects, the financial position of the Fund as of August 31, 2024, the results of its operations and its cash flows for the year then ended, the changes in its net assets for each of the two years in the period ended August 31, 2024 and the financial highlights for each of the five years in the period ended August 31, 2024 in conformity with accounting principles generally accepted in the United States of America.
Basis for Opinion
These financial statements are the responsibility of the Fund’s management. Our responsibility is to express an opinion on the Fund’s financial statements based on our audits. We are a public accounting firm registered with the Public Company Accounting Oversight Board (United States) (PCAOB) and are required to be independent with respect to the Fund in accordance with the U.S. federal securities laws and the applicable rules and regulations of the Securities and Exchange Commission and the PCAOB.
We conducted our audits of these financial statements in accordance with the standards of the PCAOB. Those standards require that we plan and perform the audit to obtain reasonable assurance about whether the financial statements are free of material misstatement, whether due to error or fraud.
Our audits included performing procedures to assess the risks of material misstatement of the financial statements, whether due to error or fraud, and performing procedures that respond to those risks. Such procedures included examining, on a test basis, evidence regarding the amounts and disclosures in the financial statements. Our audits also included evaluating the accounting principles used and significant estimates made by management, as well as evaluating the overall presentation of the financial statements. Our procedures included confirmation of securities owned as of August 31, 2024 by correspondence with the custodian, transfer agent, portfolio company investees, brokers and agent banks; when replies were not received from portfolio company investees, brokers or agent banks, we performed other auditing procedures. We believe that our audits provide a reasonable basis for our opinion.
/s/PricewaterhouseCoopers LLP
Houston, Texas
October 23, 2024
We have served as the auditor of one or more of the investment companies in the Invesco group of investment companies since at least 1995. We have not been able to determine the specific year we began serving as auditor.
| 35 | Invesco Senior Floating Rate Fund |
Approval of Investment Advisory and Sub-Advisory Contracts
At meetings held on June 12, 2024, the Board of Trustees (the Board or the Trustees) of AIM Counselor Series Trust (Invesco Counselor Series Trust) as a whole, and the independent Trustees, who comprise over 75% of the Board, voting separately, approved the continuance of the Invesco Senior Floating Rate Fund’s (the Fund) Master Investment Advisory Agreement with Invesco Advisers, Inc. (Invesco Advisers and the investment advisory agreement) and the Master Intergroup Sub-Advisory Contract for Mutual Funds with Invesco Asset Management Deutschland GmbH, Invesco Asset Management Limited, Invesco Asset Management (Japan) Limited, Invesco Hong Kong Limited, Invesco Senior Secured Management, Inc. and Invesco Canada Ltd. and separate sub-advisory contracts with Invesco Capital Management LLC and Invesco Asset Management (India) Private Limited and OppenheimerFunds, Inc. (collectively, the Affiliated Sub-Advisers and the sub-advisory contracts) for another year, effective July 1, 2024. After evaluating the factors discussed below, among others, the Board approved the renewal of the Fund’s investment advisory agreement and the sub-advisory contracts and determined that the compensation payable thereunder by the Fund to Invesco Advisers and by Invesco Advisers to the Affiliated Sub-Advisers is fair and reasonable.
The Board’s Evaluation Process
The Board has established an Investments Committee, which in turn has established Sub-Committees that meet throughout the year to review the performance of funds advised by Invesco Advisers (the Invesco Funds). The Sub-Committees meet regularly with portfolio managers for their assigned Invesco Funds and other members of management to review information about investment performance and portfolio attributes of these funds. The Board has established additional standing and ad hoc committees that meet regularly throughout the year to review matters within their purview, including a working group focused on opportunities to make ongoing and continuous improvements to the annual review process for the Invesco Funds’ investment advisory and sub-advisory contracts. The Board took into account evaluations and reports that it received from its committees and sub-committees, as well as the information provided to the Board and its committees and sub-committees throughout the year, in considering whether to approve each Invesco Fund’s investment advisory agreement and sub-advisory contracts.
As part of the contract renewal process, the Board reviews and considers information provided in response to requests for information submitted to management by the independent Trustees with assistance from legal counsel to the independent Trustees and the Senior Officer, an officer of the Invesco Funds who reports directly to the independent Trustees. The Board receives comparative investment performance and fee and expense data regarding the Invesco Funds prepared by Broadridge Financial Solutions, Inc. (Broadridge), an independent mutual fund data provider, as well as information on the composition of the peer groups provided by Broadridge and its methodology for determining peer groups. The Board also receives an independent written evaluation from the Senior
Officer. The Senior Officer’s evaluation is prepared as part of his responsibility to manage the process by which the Invesco Funds’ proposed management fees are negotiated during the annual contract renewal process to ensure they are negotiated in a manner that is at arms’ length and reasonable in accordance with certain negotiated regulatory requirements. In addition to meetings with Invesco Advisers and fund counsel throughout the year and as part of meetings convened on May 7, 2024 and June 12, 2024, the independent Trustees also discussed the continuance of the investment advisory agreement and sub-advisory contracts in separate sessions with the Senior Officer and with independent legal counsel. Also, as part of the contract renewal process, the independent Trustees reviewed and considered information provided in response to follow-up requests for information submitted by the independent Trustees to management. The independent Trustees met and discussed those follow-up responses with legal counsel to the independent Trustees and the Senior Officer.
The discussion below is a summary of the Senior Officer’s independent written evaluation with respect to the Fund’s investment advisory agreement and sub-advisory contracts, as well as a discussion of the material factors and related conclusions that formed the basis for the Board’s approval of the Fund’s investment advisory agreement and sub-advisory contracts. The Trustees’ review and conclusions are based on the comprehensive consideration of all information presented to them during the course of the year and in prior years and are not the result of any single determinative factor. Moreover, one Trustee may have weighed a particular piece of information or factor differently than another Trustee. The information received and considered by the Board was current as of various dates prior to the Board’s approval on June 12, 2024.
Factors and Conclusions and Summary of Independent Written Fee Evaluation
| A. | Nature, Extent and Quality of Services Provided by Invesco Advisers and the Affiliated Sub-Advisers |
The Board reviewed the nature, extent and quality of the advisory services provided to the Fund by Invesco Advisers under the Fund’s investment advisory agreement, and the credentials and experience of the officers and employees of Invesco Advisers who provide these services, including the Fund’s portfolio manager(s). The Board’s review included consideration of Invesco Advisers’ investment process and oversight, credit analysis, and research capabilities. The Board considered information regarding Invesco Advisers’ programs for and resources devoted to risk management, including management of investment, enterprise, operational, liquidity, derivatives, valuation and compliance risks, and technology used to manage such risks. The Board received information regarding Invesco’s methodology for compensating its investment professionals and the incentives and accountability it creates, as well as how it impacts Invesco’s ability to attract and retain talent. The Board received a description of, and reports related to, Invesco Advisers’ global security program and business continuity plans and of its approach to data privacy and cybersecurity, including related testing. The
Board also considered non-advisory services that Invesco Advisers and its affiliates provide to the Invesco Funds, such as various middle office and back office support functions, third party oversight, internal audit, valuation, portfolio trading and legal and compliance. The Board observed that Invesco Advisers’ systems preparedness and ongoing investment enabled Invesco Advisers to manage, operate and oversee the Invesco Funds with minimal impact or disruption through challenging environments. The Board reviewed and considered the benefits to shareholders of investing in a Fund that is part of the family of funds under the umbrella of Invesco Ltd., Invesco Advisers’ parent company, and noted Invesco Ltd.’s depth and experience in running an investment management business, as well as its commitment of financial and other resources to such business. The Board concluded that the nature, extent and quality of the services provided to the Fund by Invesco Advisers are appropriate and satisfactory.
The Board reviewed the services that may be provided to the Fund by the Affiliated Sub-Advisers under the sub-advisory contracts and the credentials and experience of the officers and employees of the Affiliated Sub-Advisers who provide these services. The Board noted the Affiliated Sub-Advisers’ expertise with respect to certain asset classes and that the Affiliated Sub-Advisers have offices and personnel that are located in financial centers around the world. As a result, the Board noted that the Affiliated Sub-Advisers can provide research and investment analysis on the markets and economies of various countries and territories in which the Fund may invest, make recommendations regarding securities and assist with portfolio trading. The Board concluded that the sub-advisory contracts may benefit the Fund and its shareholders by permitting Invesco Advisers to use the resources and talents of the Affiliated Sub-Advisers in managing the Fund. The Board concluded that the nature, extent and quality of the services that may be provided to the Fund by the Affiliated Sub-Advisers are appropriate and satisfactory.
| B. | Fund Investment Performance |
The Board considered Fund investment performance as a relevant factor in considering whether to approve the investment advisory agreement as well as the sub-advisory contracts for the Fund, as Invesco Senior Secured Management, Inc. currently manages assets of the Fund.
The Board compared the Fund’s investment performance over multiple time periods ending December 31, 2023 to the performance of funds in the Broadridge performance universe and against the J.P Morgan Leveraged Loan Index (Index). The Board noted that performance of Class A shares of the Fund was in the fourth quintile of its performance universe for the one year period, the first quintile for the three year period and the fifth quintile for the five year period (the first quintile being the best performing funds and the fifth quintile being the worst performing funds). The Board noted that performance of Class A shares of the Fund was below the performance of the Index for the one and five year periods and reasonably comparable to the performance of the Index for the three year period. The Board considered that the Fund was created in
| 36 | Invesco Senior Floating Rate Fund |
connection with Invesco Ltd.’s acquisition of OppenheimerFunds, Inc. and its subsidiaries (the “Transaction”) and that the Fund’s performance prior to the closing of the Transaction on May 24, 2019 is that of its predecessor fund. The Board considered that the Fund underwent a change in portfolio management in 2020, and that performance results prior to such date were those of the prior portfolio management team. The Board considered that relative performance had improved over more recent periods. The Board also considered that concentrated positions, specifically equity positions, in certain sectors had negatively impacted the Fund’s longer-term performance, while certain out-of-benchmark exposures and credit weightings negatively impacted the Fund’s short-term relative underperformance. The Board recognized that the performance data reflects a snapshot in time as of a particular date and that selecting a different performance period could produce different results. The Board also reviewed more recent Fund performance as well as other performance metrics, which did not change its conclusions.
| C. | Advisory and Sub-Advisory Fees and Fund Expenses |
The Board compared the Fund’s contractual management fee rate to the contractual management fee rates of funds in the Fund’s Broadridge expense group. The Board noted that the contractual management and actual management fee rates for Class A shares of the Fund were each reasonably comparable to the median contractual management and actual management fee rates of funds in its expense group. The Board noted that the term “contractual management fee” and “actual management fee” for funds in the expense group may include both advisory and certain non-portfolio management administrative services fees, but that Broadridge is not able to provide information on a fund-by-fund basis as to what is included. The Board also reviewed the methodology used by Broadridge in calculating expense group information, which includes using each fund’s contractual management fee schedule (including any applicable breakpoints) as reported in the most recent prospectus or statement of additional information for each fund in the expense group. The Board also considered comparative information regarding the Fund’s total expense ratio and its various components. The Board noted that the Fund’s actual management fees and total expense ratio were in the fourth quintile of its expense group and discussed with management reasons for such relative actual management fees and total expenses.
The Board noted that Invesco Advisers has contractually agreed to waive fees and/or limit expenses of the Fund for the term disclosed in the Fund’s registration statement in an amount necessary to limit total annual operating expenses to a specified percentage of average daily net assets for each class of the Fund.
The Board noted that Invesco Advisers and the Affiliated Sub-Advisers do not manage other similarly managed mutual funds or client accounts.
The Board also considered the services that may be provided by the Affiliated Sub-Advisers pursuant to the sub-advisory contracts, as well as the fees payable by Invesco Advisers to the Affiliated Sub-Advisers pursuant to the sub-advisory contracts. The Board noted that Invesco Advisers retains overall responsibility for, and provides services to, sub-advised Invesco Funds, including oversight of the Affiliated Sub-Advisers as well as the additional
services described herein other than day-to-day portfolio management.
| D. | Economies of Scale and Breakpoints |
The Board considered the extent to which there may be economies of scale in the provision of advisory services to the Fund and the Invesco Funds, and the extent to which such economies of scale are shared with the Fund and the Invesco Funds. The Board acknowledged the difficulty in calculating and measuring economies of scale at the individual fund level; noting that only indicative and estimated measures are available at the individual fund level and that such measures are subject to uncertainty. The Board considered that the Fund benefits from economies of scale through contractual breakpoints in the Fund’s advisory fee schedule, which generally operate to reduce the Fund’s expense ratio as it grows in size. The Board noted that the Fund also shares in economies of scale through Invesco Advisers’ ability to negotiate lower fee arrangements with third party service providers. The Board noted that the Fund may also benefit from economies of scale through initial fee setting, fee waivers and expense reimbursements, as well as Invesco Advisers’ investment in its business, including investments in business infrastructure, technology and cybersecurity.
E. Profitability and Financial Resources
The Board reviewed information from Invesco Advisers concerning the costs of the advisory and other services that Invesco Advisers and its affiliates provide to the Fund and the Invesco Funds and the profitability of Invesco Advisers and its affiliates in providing these services in the aggregate and on an individual fund-by-fund basis. The Board considered the methodology used for calculating profitability and the periodic review and enhancement of such methodology. The Board noted that Invesco Advisers continues to operate at a net profit from services Invesco Advisers and its affiliates provide to the Invesco Funds in the aggregate and to most Invesco Funds individually. The Board considered that profits to Invesco Advisers can vary significantly depending on the particular Invesco Fund, with some Invesco Funds showing indicative losses to Invesco Advisers and others showing indicative profits at healthy levels, and that Invesco Advisers’ support for and commitment to an Invesco Fund are not, however, solely dependent on the profits attributed to such Fund. The Board did not deem the level of profits realized by Invesco Advisers and its affiliates from providing such services to be excessive, given the nature, extent and quality of the services provided. The Board noted that Invesco Advisers provided information demonstrating that Invesco Advisers is financially sound and has the resources necessary to perform its obligations under the investment advisory agreement, and provided representations indicating that the Affiliated Sub-Advisers are financially sound and have the resources necessary to perform their obligations under the sub-advisory contracts. The Board noted the cyclical and competitive nature of the global asset management industry.
| F. | Collateral Benefits to Invesco Advisers and its Affiliates |
The Board considered various other benefits received by Invesco Advisers and its affiliates from the relationship with the Fund, including the fees received for providing administrative, transfer agency and distribution services to the Fund. The Board received comparative information regarding fees charged for these services, including
information provided by Broadridge and other independent sources. The Board reviewed the performance of Invesco Advisers and its affiliates in providing these services and the organizational structure employed to provide these services. The Board noted that these services are provided to the Fund pursuant to written contracts that are reviewed and subject to approval on an annual basis by the Board based on its determination that the services are required for the operation of the Fund.
The Board considered the benefits realized by Invesco Advisers and the Affiliated Sub-Advisers as a result of portfolio brokerage transactions executed through “soft dollar” arrangements. Invesco Advisers noted that the Fund does not execute brokerage transactions through “soft dollar” arrangements to any significant degree.
The Board considered that the Fund’s uninvested cash and cash collateral from any securities lending arrangements may be invested in registered money market funds or, with regard to securities lending cash collateral, unregistered funds that comply with Rule 2a-7 under the Investment Company Act of 1940 (collectively referred to as “affiliated money market funds”) advised by Invesco Advisers. The Board considered information regarding the returns of the affiliated money market funds relative to comparable overnight investments, as well as the fees paid by the affiliated money market funds to Invesco Advisers and its affiliates. In this regard, the Board noted that Invesco Advisers receives advisory fees from these affiliated money market funds attributable to the Fund’s investments. The Board also noted that Invesco Advisers has contractually agreed to waive through varying periods an amount equal to 100% of the net advisory fee Invesco Advisers receives from the affiliated money market funds with respect to the Fund’s investment in the affiliated money market funds of uninvested cash, but not cash collateral. The Board concluded that the advisory fees payable to Invesco Advisers from the Fund’s investment of cash collateral from any securities lending arrangements in the affiliated money market funds are for services that are not duplicative of services provided by Invesco Advisers to the Fund.
The Board considered that Invesco Advisers may serve as the Fund’s affiliated securities lending agent and evaluated the benefits realized by Invesco Advisers when serving in such role, including the compensation received. The Board considered Invesco Advisers’ securities lending platform and corporate governance structure for securities lending, including Invesco Advisers’ Securities Lending Governance Committee and its related responsibilities. The Board noted that to the extent the Fund utilizes Invesco Advisers as an affiliated securities lending agent, the Fund conducts its securities lending in accordance with, and in reliance upon, no-action letters issued by the SEC staff that provide guidance on how an affiliate may act as a direct agent lender and receive compensation for those services without obtaining exemptive relief. The Board considered information provided by Invesco Advisers related to the performance of Invesco Advisers as securities lending agent, including a summary of the securities lending services provided to the Fund by Invesco Advisers and the compensation paid to Invesco Advisers for such services, as well as any revenues generated for the Fund in connection with such
| 37 | Invesco Senior Floating Rate Fund |
securities lending activity and the allocation of such revenue between the Fund and Invesco Advisers.
The Board also received information about commissions that an affiliated broker may receive for executing certain trades for the Fund. Invesco Advisers and the Affiliated Sub-Advisers advised the Board of the benefits to the Fund of executing trades through the affiliated broker and that such trades were executed in compliance with rules under the federal securities laws and consistent with best execution obligations.
| 38 | Invesco Senior Floating Rate Fund |
Tax Information
Form 1099-DIV, Form 1042-S and other year-end tax information provide shareholders with actual calendar year amounts that should be included in their tax returns. Shareholders should consult their tax advisers.
The following distribution information is being provided as required by the Internal Revenue Code or to meet a specific state’s requirement.
The Fund designates the following amounts or, if subsequently determined to be different, the maximum amount allowable for its fiscal year ended August 31, 2024:
Federal and State Income Tax | ||||||
| Qualified Dividend Income* | 1.85% | |||||
| Corporate Dividends Received Deduction* | 1.85% | |||||
| U.S. Treasury Obligations* | 0.00% | |||||
| Qualified Business Income* | 0.00% | |||||
| Business Interest Income* | 90.75% | |||||
* The above percentages are based on ordinary income dividends paid to shareholders during the Fund’s fiscal year.
| 39 | Invesco Senior Floating Rate Fund |
Other Information Required in Form N-CSR (Items 8-11)
Changes in and Disagreements with Accountants for Open-End Management Investment Companies
Not applicable.
Proxy Disclosures for Open-End Management Investment Companies
Not applicable.
Remuneration Paid to Directors, Officers, and Others of Open-End Management Investment Companies
The aggregate remuneration paid to directors, officers and others is disclosed within the financial statements.
Statement Regarding Basis for Approval of Investment Advisory Contracts
The statement regarding basis for approval of investment advisory contracts can be found in the Approval of Investment Advisory and Sub-Advisory Contracts section of this report.
| 40 | Invesco Senior Floating Rate Fund |
(This page intentionally left blank)
(This page intentionally left blank)
(This page intentionally left blank)
| SEC file number(s): | Invesco Distributors, Inc. | O-SFLR-NCSR |

| Annual Financial Statements and Other Information | August 31, 2024 |
| Interest Rate | Maturity Date | Principal Amount (000) | Value | ||
| Municipal Obligations–97.89% | |||||
| Alabama–2.13% | |||||
| Birmingham (City of), AL Special Care Facilities Financing Authority (Methodist Home for the Aging); Series 2016, RB | 5.25% | 06/01/2025 | $ 305 | $ 303,657 | |
| Black Belt Energy Gas District (The) (Gas); Series 2022 F, RB(a) | 5.50% | 12/01/2028 | 2,500 | 2,663,424 | |
| Fairfield (City of), AL; Series 2012, GO Wts. | 6.00% | 06/01/2031 | 2,950 | 2,655,000 | |
| Huntsville (City of), AL Special Care Facilities Financing Authority (Redstone Village); | |||||
| Series 2007, RB (Acquired 12/29/2015; Cost $90,000)(b)(c) | 5.50% | 01/01/2028 | 90 | 50,400 | |
| Series 2014, RB | 3.50% | 07/01/2026 | 5,022 | 2,812,591 | |
| Jefferson (County of), AL; Series 2024, Ref. RB | 5.25% | 10/01/2045 | 1,500 | 1,635,480 | |
| Mobile (City of), AL Improvement District (McGowin Park); | |||||
| Series 2016 A, RB | 5.00% | 08/01/2025 | 310 | 310,095 | |
| Series 2016 A, RB | 5.25% | 08/01/2030 | 200 | 196,179 | |
| Southeast Energy Authority, a Cooperative District (No. 2); Series 2021 B, RB(a) | 4.00% | 12/01/2031 | 5,390 | 5,402,124 | |
| Southeast Energy Authority, a Cooperative District (No. 3); Series 2022 A-1, RB(a) | 5.50% | 12/01/2029 | 5,000 | 5,417,442 | |
| Talladega (County of), AL; Series 2002 D, Tax Anticipation Wts. (INS - NATL)(d) | 5.25% | 01/01/2029 | 25 | 25,036 | |
| Tuscaloosa (County of), AL Industrial Development Authority (Hunt Refining); Series 2019 A, Ref. IDR(e) | 5.25% | 05/01/2044 | 4,000 | 4,064,096 | |
| 25,535,524 | |||||
| American Samoa–0.09% | |||||
| American Samoa (Territory of) Economic Development Authority; Series 2015 A, Ref. RB | 6.25% | 09/01/2029 | 1,000 | 1,023,012 | |
| Arizona–3.55% | |||||
| Arizona (State of) Industrial Development Authority (ACCEL Schools); | |||||
| Series 2018 A, RB(e) | 4.63% | 08/01/2028 | 825 | 829,659 | |
| Series 2018 A, RB(e) | 5.00% | 08/01/2033 | 1,955 | 1,984,018 | |
| Arizona (State of) Industrial Development Authority (American Charter Schools Foundation); Series 2017, Ref. RB(e) | 6.00% | 07/01/2047 | 1,385 | 1,420,988 | |
| Arizona (State of) Industrial Development Authority (Basis Schools); Series 2017 A, Ref. RB(e) | 5.00% | 07/01/2026 | 210 | 212,240 | |
| Arizona (State of) Industrial Development Authority (Doral Academy of Nevada - Fire Mesa & Red Rock Campus); Series 2019, RB | 3.55% | 07/15/2029 | 485 | 477,518 | |
| Arizona (State of) Industrial Development Authority (Leman Academy-Parker Colorado); Series 2019, RB(e) | 5.00% | 07/01/2039 | 4,520 | 4,527,503 | |
| Arizona (State of) Industrial Development Authority (Linder Village); Series 2020, RB(e) | 5.00% | 06/01/2031 | 2,225 | 2,271,325 | |
| Arizona (State of) Industrial Development Authority (Pinecrest Academy of Nevada-Horizon, Inspirada and St. Rose Campus Projects); Series 2018 A, RB(e) | 5.00% | 07/15/2028 | 615 | 626,704 | |
| Arizona (State of) Industrial Development Authority (Somerset Academy of Las Vegas - Lone Mountain Campus); Series 2019 A, IDR(e) | 5.00% | 12/15/2039 | 400 | 403,947 | |
| Chandler (City of), AZ Industrial Development Authority (Intel Corp.); Series 2022-1, RB(a)(f) | 5.00% | 09/01/2027 | 2,000 | 2,059,238 | |
| Greater Arizona Development Authority; Series 2007 A, RB (INS - NATL)(d) | 4.38% | 08/01/2032 | 5 | 5,005 | |
| Maricopa (County of), AZ Industrial Development Authority (Benjamin Franklin Charter School); Series 2018, RB(e) | 4.80% | 07/01/2028 | 2,525 | 2,597,709 | |
| Maricopa (County of), AZ Industrial Development Authority (Legacy Traditional Schools); Series 2019, Ref. RB(e) | 5.00% | 07/01/2039 | 2,250 | 2,307,484 | |
| Maricopa (County of), AZ Industrial Development Authority (Valley Christian Schools); | |||||
| Series 2023, RB(e) | 5.25% | 07/01/2033 | 725 | 745,817 | |
| Series 2023, RB(e) | 6.00% | 07/01/2043 | 1,885 | 1,945,470 | |
| Phoenix (City of), AZ Industrial Development Authority (Basis Schools); Series 2016 A, Ref. RB(e) | 5.00% | 07/01/2035 | 2,900 | 2,915,494 | |
| Phoenix (City of), AZ Industrial Development Authority (Legacy Traditional Schools); Series 2015, Ref. RB(e) | 5.00% | 07/01/2035 | 2,820 | 2,841,941 | |
| Pima (County of), AZ Industrial Development Authority (American Leadership Academy); Series 2015, Ref. RB(e) | 5.38% | 06/15/2035 | 3,370 | 3,397,918 | |
| Pima (County of), AZ Industrial Development Authority (Arizona Charter Schools); Series 2013 Q, Ref. RB | 5.38% | 07/01/2031 | 4,000 | 4,000,993 | |
| Pima (County of), AZ Industrial Development Authority (Career Success Schools); Series 2020, Ref. RB(e) | 4.75% | 05/01/2030 | 1,525 | 1,530,957 | |
| Pima (County of), AZ Industrial Development Authority (Excalibur Charter School (The)); Series 2016, Ref. RB(e) | 5.00% | 09/01/2026 | 120 | 120,464 | |
| 2 | Invesco Short Duration High Yield Municipal Fund |
| Interest Rate | Maturity Date | Principal Amount (000) | Value | ||
| Arizona–(continued) | |||||
| Pima (County of), AZ Industrial Development Authority (Grande Innovations Academy); Series 2018, RB(e) | 4.13% | 07/01/2026 | $ 520 | $ 516,768 | |
| Pima (County of), AZ Industrial Development Authority (Imagine East Mesa Charter Schools); | |||||
| Series 2019, RB(e) | 5.00% | 07/01/2029 | 300 | 303,952 | |
| Series 2019, RB(e) | 5.00% | 07/01/2034 | 400 | 403,447 | |
| Series 2019, RB(e) | 5.00% | 07/01/2039 | 500 | 501,176 | |
| Pima (County of), AZ Industrial Development Authority (Paideia Academies (The)); Series 2019, RB | 4.13% | 07/01/2029 | 130 | 126,633 | |
| Sierra (City of), AZ Vista Industrial Development Authority; | |||||
| Series 2024, Ref. RB(e) | 5.25% | 06/01/2034 | 1,840 | 1,873,037 | |
| Series 2024, Ref. RB(e) | 5.88% | 06/01/2044 | 1,500 | 1,522,361 | |
| Tempe (City of), AZ Industrial Development Authority (Mirabella at ASU); Series 2017 A, RB(e) | 6.13% | 10/01/2052 | 300 | 185,175 | |
| 42,654,941 | |||||
| Arkansas–1.49% | |||||
| Arkansas (State of) Development Finance Authority (Big River Steel); Series 2019, RB(e)(f) | 4.50% | 09/01/2049 | 2,000 | 2,004,429 | |
| Arkansas (State of) Development Finance Authority (Big River Steel) (Green Bonds); Series 2020, RB(e)(f) | 4.75% | 09/01/2049 | 7,370 | 7,427,325 | |
| Arkansas (State of) Development Finance Authority (Green Bonds); Series 2022, RB(f) | 5.45% | 09/01/2052 | 8,000 | 8,416,863 | |
| 17,848,617 | |||||
| California–7.41% | |||||
| California (State of); Series 2021, GO Bonds | 3.00% | 12/01/2046 | 2,000 | 1,663,288 | |
| California (State of) Community Choice Financing Authority (Green Bonds); | |||||
| Series 2022 A-1, RB(a) | 4.00% | 08/01/2028 | 16,065 | 16,268,950 | |
| Series 2024, RB(a) | 5.00% | 12/01/2032 | 5,000 | 5,396,292 | |
| California (State of) County Tobacco Securitization Agency (Alameda County Tobacco Asset Securitization Corp.); Series 2002, RB | 6.00% | 06/01/2042 | 135 | 137,811 | |
| California (State of) County Tobacco Securitization Agency (Stanislaus County Tobacco Funding Corp.); Series 2002 A, RB | 5.88% | 06/01/2043 | 910 | 915,120 | |
| California (State of) Housing Finance Agency (Social Certificates); Series 2023-1, RB | 4.38% | 09/20/2036 | 2,478 | 2,618,626 | |
| California (State of) Infrastructure & Economic Development Bank (Brightline West Passenger Rail); Series 2020, RB(a)(e)(f) | 8.00% | 08/15/2025 | 4,000 | 4,038,292 | |
| California (State of) Municipal Finance Authority (Bella Mente Montessori Academy); Series 2018 A, RB(e) | 5.00% | 06/01/2038 | 3,345 | 3,397,206 | |
| California (State of) Municipal Finance Authority (United Airlines, Inc.); Series 2019, RB(f) | 4.00% | 07/15/2029 | 7,000 | 7,021,248 | |
| California (State of) Municipal Finance Authority (Waste Management, Inc.); | |||||
| Series 2020, RB(a)(f) | 4.80% | 06/02/2025 | 1,500 | 1,508,299 | |
| Series 2022 A, RB(a)(f) | 4.13% | 10/01/2025 | 4,000 | 4,010,946 | |
| California (State of) Pollution Control Financing Authority (CalPlant I) (Green Bonds); | |||||
| Series 2017, RB (Acquired 09/15/2017-02/12/2019; Cost $5,125,317)(b)(c)(e)(f) | 7.50% | 07/01/2032 | 4,950 | 66,825 | |
| Series 2020, RB (Acquired 10/06/2020; Cost $955,203)(b)(c)(e)(f) | 7.50% | 07/01/2032 | 1,000 | 13,500 | |
| California (State of) Pollution Control Financing Authority (Plant Bonds); Series 2012, RB(e)(f) | 5.00% | 07/01/2037 | 2,000 | 2,005,724 | |
| California (State of) Public Finance Authority (California University of Science and Medicine); Series 2019 A, RB(e) | 6.25% | 07/01/2054 | 6,100 | 6,417,468 | |
| California (State of) Public Finance Authority (Trinity Classical Academy); Series 2019 B, RB(e) | 5.00% | 07/01/2026 | 100 | 98,217 | |
| California (State of) School Finance Authority (Partnership to Uplift Communities) (Social Bonds); | |||||
| Series 2023, Ref. RB(e) | 5.00% | 08/01/2033 | 695 | 733,997 | |
| Series 2023, Ref. RB(e) | 5.25% | 08/01/2038 | 500 | 529,141 | |
| California (State of) Statewide Communities Development Authority (Eskaton Properties, Inc.); Series 2012, RB | 5.25% | 11/15/2034 | 5,965 | 5,967,095 | |
| California (State of) Statewide Communities Development Authority (Loma Linda University Medical Center); | |||||
| Series 2014, RB | 5.50% | 12/01/2054 | 8,238 | 8,250,124 | |
| Series 2016 A, RB(e) | 5.25% | 12/01/2056 | 3,000 | 3,034,463 | |
| Series 2018 A, RB(e) | 5.50% | 12/01/2058 | 3,000 | 3,099,690 | |
| Fresno (City of), CA; Series 2023 A, Ref. RB (INS - BAM)(d)(f) | 5.00% | 07/01/2048 | 2,000 | 2,105,574 | |
| Palomar Health; Series 2016, Ref. RB | 4.00% | 11/01/2039 | 1,250 | 1,102,901 | |
| Pomona Unified School District; Series 2021 F, GO Bonds (INS - BAM)(d) | 3.00% | 08/01/2048 | 1,000 | 828,607 | |
| Sacramento (County of), CA (Juvenile Courthouse); Series 2003, COP (INS - AMBAC)(d) | 5.00% | 12/01/2034 | 5,405 | 5,413,967 | |
| 3 | Invesco Short Duration High Yield Municipal Fund |
| Interest Rate | Maturity Date | Principal Amount (000) | Value | ||
| California–(continued) | |||||
| West Covina (City of), CA Public Financing Authority (Big League Dreams); Series 2006 A, RB | 5.00% | 06/01/2030 | $ 2,305 | $ 2,308,612 | |
| 88,951,983 | |||||
| Colorado–8.00% | |||||
| 3rd and Havana Metropolitan District; Series 2020 A, GO Bonds | 4.50% | 12/01/2030 | 2,330 | 2,207,572 | |
| Amber Creek Metropolitan District; Series 2017 A, Ref. GO Bonds | 5.00% | 12/01/2037 | 697 | 654,637 | |
| Baseline Metropolitan District No. 1; Series 2018 A-2, RB | 5.13% | 12/01/2028 | 1,500 | 1,523,029 | |
| Brighton Crossing Metropolitan District No. 6; | |||||
| Series 2020 A, GO Bonds | 5.00% | 12/01/2035 | 525 | 518,331 | |
| Series 2020 A, GO Bonds | 5.00% | 12/01/2040 | 515 | 487,322 | |
| Canyon Pines Metropolitan District; Series 2022 A, GO Bonds(g) | 0.00% | 12/01/2027 | 8,770 | 6,983,132 | |
| Canyons Metropolitan District No. 5; Series 2016, GO Bonds | 7.00% | 12/15/2057 | 1,500 | 1,077,589 | |
| Centerra Metropolitan District No. 1 (In the City of Loveland); Series 2020 A, Ref. GO Bonds | 4.00% | 12/01/2029 | 1,115 | 1,085,000 | |
| Colliers Hill Metropolitan District No. 2; Series 2022 B-2, GO Bonds | 7.63% | 12/15/2042 | 2,000 | 1,899,259 | |
| Colorado (State of) Educational & Cultural Facilities Authority (Ascent Classical Academy); Series 2024, Ref. RB(e) | 5.25% | 04/01/2039 | 2,500 | 2,615,815 | |
| Colorado (State of) Health Facilities Authority (Aberdeen Ridge); | |||||
| Series 2021 A, RB | 5.00% | 05/15/2035 | 4,035 | 3,425,731 | |
| Series 2021 A, RB | 5.00% | 05/15/2044 | 1,170 | 866,479 | |
| Series 2021 B, RB | 2.63% | 05/15/2029 | 1,125 | 1,076,517 | |
| Colorado (State of) Health Facilities Authority (Ralston Creek at Arvada); Series 2017 B, RB | 4.00% | 11/01/2027 | 4,200 | 3,901,711 | |
| Colorado (State of) Health Facilities Authority (Sunny Vista Living Center); Series 2015 A, Ref. RB(e) | 5.00% | 12/01/2025 | 100 | 95,303 | |
| Colorado (State of) Health Facilities Authority (Volunteers of America Care); Series 2007 A, RB | 5.30% | 07/01/2037 | 335 | 280,261 | |
| Colorado (State of) International Center Metropolitan District No. 14; Series 2018, GO Bonds | 5.63% | 12/01/2032 | 998 | 1,008,497 | |
| Copper Ridge Metropolitan District; Series 2019, RB | 5.00% | 12/01/2043 | 2,750 | 2,603,576 | |
| Copperleaf Metropolitan District No. 6; Series 2022 B, GO Bonds | 6.00% | 12/15/2041 | 1,225 | 1,224,611 | |
| Denver (City & County of), CO (United Airlines, Inc.); Series 2017, Ref. RB(f) | 5.00% | 10/01/2032 | 1,000 | 1,000,172 | |
| Denver Gateway Center Metropolitan District; Series 2018 A, GO Bonds | 5.50% | 12/01/2038 | 1,343 | 1,350,927 | |
| Dominion Water & Sanitation District; | |||||
| Series 2022, Ref. RB | 5.00% | 12/01/2027 | 2,185 | 2,219,667 | |
| Series 2022, Ref. RB | 5.25% | 12/01/2032 | 3,415 | 3,547,448 | |
| Elbert & Highway 86 Commercial Metropolitan District; Series 2021 A, Ref. GO Bonds(e) | 5.00% | 12/01/2041 | 1,700 | 1,686,909 | |
| Frisco (Town of), CO (Marina Enterprise); Series 2019, RB | 5.00% | 12/01/2036 | 600 | 604,009 | |
| Granby Ranch Metropolitan District; Series 2018, Ref. GO Bonds(e) | 4.88% | 12/01/2028 | 575 | 579,292 | |
| Hess Ranch Metropolitan District No. 5; | |||||
| Series 2024 A-1, RB | 6.00% | 12/01/2043 | 650 | 669,765 | |
| Series 2024 A-2, RB | 6.50% | 12/01/2043 | 400 | 416,697 | |
| Independence Water & Sanitation District; Series 2019, RB | 7.25% | 12/01/2038 | 1,253 | 1,291,165 | |
| Jefferson (County of), CO Center Metropolitan District No. 1; Series 2020 B, Ref. RB | 5.75% | 12/15/2050 | 5,499 | 5,572,825 | |
| Kinston Metropolitan District No. 5; Series 2020 A, GO Bonds | 4.63% | 12/01/2035 | 1,000 | 994,365 | |
| Morgan Hill Metropolitan District No. 3; | |||||
| Series 2021 A, GO Bonds | 3.00% | 12/01/2031 | 980 | 850,282 | |
| Series 2021 A, GO Bonds | 3.50% | 12/01/2041 | 2,940 | 2,356,516 | |
| Mulberry Metropolitan District No. 2; Series 2022, RB | 7.00% | 12/01/2034 | 6,000 | 6,236,010 | |
| Nine Mile Metropolitan District; Series 2020, RB | 4.63% | 12/01/2030 | 2,265 | 2,303,307 | |
| Parker Automotive Metropolitan District; Series 2023 B, Ref. GO Bonds | 8.25% | 12/15/2037 | 2,225 | 2,276,362 | |
| Peak Metropolitan District No. 1; | |||||
| Series 2021 A, GO Bonds(e) | 4.00% | 12/01/2035 | 540 | 482,367 | |
| Series 2021 A, GO Bonds(e) | 5.00% | 12/01/2041 | 1,670 | 1,553,530 | |
| Plaza Metropolitan District No. 1; Series 2013, Ref. RB(e) | 5.00% | 12/01/2040 | 1,465 | 1,465,002 | |
| Prairie Center Metropolitan District No. 7; Series 2021, GO Bonds | 6.38% | 06/15/2046 | 1,330 | 1,267,368 | |
| Rampart Range Metropolitan District No. 5; Series 2021, RB | 4.00% | 12/01/2036 | 1,250 | 1,197,323 | |
| Riverpark Metropolitan District (County of Arapahoe); Series 2024, GO Bonds | 6.00% | 12/01/2042 | 1,900 | 1,948,953 | |
| Riverwalk Metropolitan District No. 2; Series 2022 A, RB | 4.50% | 12/01/2032 | 4,000 | 3,765,560 | |
| Rocky Mountain Rail Park Metropolitan District; | |||||
| Series 2021 A, GO Bonds(e) | 5.00% | 12/01/2031 | 3,445 | 3,101,135 | |
| Series 2021 A, GO Bonds(e) | 5.00% | 12/01/2041 | 2,000 | 1,419,262 | |
| St. Vrain Lakes Metropolitan District No. 2; Series 2017 A, GO Bonds | 5.00% | 12/01/2037 | 1,500 | 1,505,138 | |
| 4 | Invesco Short Duration High Yield Municipal Fund |
| Interest Rate | Maturity Date | Principal Amount (000) | Value | |||
| Colorado–(continued) | ||||||
| Sterling Ranch Community Authority Board; | ||||||
| Series 2024 A, Ref. RB | 6.13% | 12/01/2039 | $ 550 | $ 574,633 | ||
| Series 2024, RB | 5.63% | 12/01/2043 | 1,000 | 1,038,380 | ||
| Trails at Crowfoot Metropolitan District No. 3; | ||||||
| Second Series 2019 A, GO Bonds(a)(h) | 4.38% | 09/01/2024 | 620 | 638,600 | ||
| Second Series 2019 A, GO Bonds(a)(h) | 5.00% | 09/01/2024 | 1,000 | 1,030,000 | ||
| Transport Metropolitan District No. 3; Series 2021 A-1, GO Bonds | 5.00% | 12/01/2041 | 2,700 | 2,373,340 | ||
| Vauxmont Metropolitan District; Series 2019, Ref. GO Bonds (INS - AGM)(d) | 3.25% | 12/15/2050 | 803 | 672,498 | ||
| Verve Metropolitan District No. 1; Series 2023, GO Bonds | 5.75% | 12/01/2033 | 2,895 | 2,851,961 | ||
| Villages at Castle Rock Metropolitan District No. 6; Series 2021 B, Ref. GO Bonds(e) | 5.70% | 12/01/2051 | 166 | 160,885 | ||
| Westerly Metropolitan District No. 4; | ||||||
| Series 2021 A, GO Bonds | 4.13% | 12/01/2031 | 615 | 568,675 | ||
| Series 2021 A, GO Bonds | 5.00% | 12/01/2040 | 1,000 | 923,008 | ||
| 96,027,708 | ||||||
| Delaware–0.14% | ||||||
| Millsboro (Town of), DE (Plantation Lakes Special Development District); Series 2018, Ref. RB(e) | 5.00% | 07/01/2028 | 1,633 | 1,656,496 | ||
| District of Columbia–2.05% | ||||||
| District of Columbia (Ingleside at Rock Creek); | ||||||
| Series 2017 A, RB | 4.13% | 07/01/2027 | 725 | 723,912 | ||
| Series 2017 A, RB | 5.00% | 07/01/2032 | 1,500 | 1,524,393 | ||
| District of Columbia (Provident Group - Howard Properties LLC); Series 2013, RB | 5.00% | 10/01/2035 | 1,285 | 1,285,081 | ||
| District of Columbia Tobacco Settlement Financing Corp.; Series 2001, RB | 6.75% | 05/15/2040 | 20,465 | 21,104,351 | ||
| 24,637,737 | ||||||
| Florida–6.79% | ||||||
| Alachua (County of), FL Health Facilities Authority (East Ridge Retirement Village, Inc.); | ||||||
| Series 2014, RB (Acquired 12/04/2020; Cost $185,120)(b)(c) | 5.63% | 11/15/2029 | 185 | 156,844 | ||
| Series 2014, RB (Acquired 06/04/2020; Cost $861,250)(b)(c) | 6.00% | 11/15/2029 | 1,000 | 851,942 | ||
| Series 2014, RB (Acquired 01/17/2020; Cost $1,412,167)(b)(c) | 6.00% | 11/15/2034 | 1,500 | 1,131,576 | ||
| Alachua (County of), FL Health Facilities Authority (Terraces at Bonita Springs); | ||||||
| Series 2022 A, Ref. RB (Acquired 01/25/2022; Cost $965,000)(b)(c)(e) | 5.00% | 11/15/2061 | 965 | 680,520 | ||
| Series 2022 B, RB (Acquired 01/25/2022; Cost $100,000)(b)(c)(e) | 6.50% | 11/15/2033 | 100 | 85,750 | ||
| Boggy Creek Improvement District; Series 2023, Ref. RB | 4.50% | 05/01/2033 | 1,030 | 1,051,177 | ||
| Broward (County of), FL; Series 2015 A, RB(f) | 5.00% | 10/01/2045 | 10,000 | 10,071,503 | ||
| Broward (County of), FL Housing Finance Authority (Golden Villas); Series 2008 B, RB(a)(f) | 6.75% | 04/01/2025 | 35 | 35,089 | ||
| Capital Projects Finance Authority (Kissimmee Charter Academy); Series 2024, RB(e) | 6.13% | 06/15/2044 | 150 | 154,771 | ||
| Capital Trust Agency, Inc. (Elim Senior Housing, Inc.); Series 2017, RB(e) | 5.38% | 08/01/2032 | 1,000 | 890,195 | ||
| Capital Trust Agency, Inc. (H-Bay Ministries, Inc.- Superior Residences); | ||||||
| Series 2018 B, RB (Acquired 06/15/2018; Cost $734,961)(b)(c) | 4.00% | 07/01/2028 | 750 | 8,925 | ||
| Series 2018 B, RB (Acquired 06/15/2018; Cost $612,816)(b)(c) | 4.25% | 07/01/2033 | 625 | 7,437 | ||
| Capital Trust Agency, Inc. (Imagine School at North Manatee); | ||||||
| Series 2021 C, RB(e) | 5.00% | 06/01/2041 | 465 | 453,128 | ||
| Series 2021, RB(e) | 3.25% | 06/01/2031 | 230 | 209,282 | ||
| Series 2021, RB(e) | 5.00% | 06/01/2041 | 1,295 | 1,261,937 | ||
| Capital Trust Agency, Inc. (University Bridge LLC Student Housing); Series 2018 A, RB(e) | 4.00% | 12/01/2028 | 6,310 | 6,227,307 | ||
| Capital Trust Authority (Central Florida Preparatory School Project); Series 2024, RB(e) | 6.25% | 06/15/2040 | 3,000 | 2,992,230 | ||
| Capital Trust Authority (Imagine School At West Pasco Project); Series 2023, RB(e) | 6.25% | 12/15/2043 | 2,135 | 2,175,765 | ||
| Capital Trust Authority (KIPP Miami N Campus); Series 2024 A, RB(e) | 5.63% | 06/15/2044 | 410 | 428,471 | ||
| Charlotte (County of), FL Industrial Development Authority (Town & Country Utilities); Series 2019, RB(e)(f) | 5.00% | 10/01/2029 | 1,330 | 1,372,899 | ||
| Escambia (County of), FL Health Facilities Authority (Baptist Health Care Corp. Obligated Group); Series 2020, Ref. RB | 4.00% | 08/15/2050 | 2,100 | 1,888,620 | ||
| Florida Development Finance Corp.; | ||||||
| Series 2022, RB(a)(e)(f) | 8.25% | 02/14/2025 | 8,000 | 8,076,803 | ||
| Series 2023, RB(a)(e)(f) | 6.13% | 07/01/2026 | 2,000 | 2,055,114 | ||
| 5 | Invesco Short Duration High Yield Municipal Fund |
| Interest Rate | Maturity Date | Principal Amount (000) | Value | ||
| Florida–(continued) | |||||
| Florida Development Finance Corp. (Brightline Florida Passenger Rail Expansion); | |||||
| Series 2024, Ref. RB(a)(e)(f) | 12.00% | 07/15/2028 | $ 2,500 | $ 2,668,763 | |
| Series 2024, Ref. RB (INS - AGM)(d)(f) | 5.00% | 07/01/2044 | 4,000 | 4,209,666 | |
| Series 2024, Ref. RB(f) | 5.25% | 07/01/2047 | 4,500 | 4,625,214 | |
| Florida Development Finance Corp. (IPS Florida LLC-Idea); Series 2022, RB(e) | 5.25% | 06/15/2029 | 1,000 | 1,014,249 | |
| Florida Development Finance Corp. (Parrish Charter Academy, Inc.); Series 2023, RB(a)(e) | 6.25% | 06/15/2028 | 3,000 | 3,021,675 | |
| Florida Housing Finance Corp.; Series 2024 3, RB (CEP - GNMA) | 6.25% | 01/01/2055 | 1,250 | 1,393,973 | |
| Hobe-St. Lucie Conservancy District; Series 2024, RB | 4.75% | 05/01/2031 | 880 | 906,121 | |
| Lake (County of), FL (Lakeside at Waterman Village); Series 2020 A, Ref. RB | 5.50% | 08/15/2030 | 3,375 | 3,410,669 | |
| Lake Helen (City of), FL (Ivy Hawn Charter School of the Arts); | |||||
| Series 2018 A, RB(e) | 5.00% | 07/15/2028 | 395 | 396,974 | |
| Series 2018 A, RB(e) | 5.38% | 07/15/2038 | 1,300 | 1,258,572 | |
| Lakes of Sarasota Community Development District; Series 2024 B, RB | 5.25% | 05/01/2034 | 2,320 | 2,334,998 | |
| Lee (County of), FL Housing Finance Authority (Aria Landings); Series 2023 B, RB(a)(e) | 5.50% | 07/01/2026 | 5,000 | 4,999,500 | |
| Lee (County of), FL Industrial Development Authority; Series 2024 B-3, RB | 4.13% | 11/15/2029 | 1,500 | 1,506,978 | |
| Palm Beach (County of), FL Health Facilities Authority (Harbour’s Edge); Series 2004 A, RB | 6.00% | 11/15/2024 | 5 | 5,005 | |
| Parrish Lakes Community Development District; Series 2024, RB | 5.50% | 05/01/2044 | 1,000 | 1,007,842 | |
| Pembroke Harbor Community Development District; Series 2008 A, RB | 7.00% | 05/01/2038 | 955 | 956,907 | |
| Polk (County of), FL Industrial Development Authority (Carpenter’s Home Estates); Series 2019, Ref. IDR | 5.00% | 01/01/2049 | 2,500 | 2,451,539 | |
| Polk (County of), FL Industrial Development Authority (Mineral Development LLC); Series 2020, RB (Acquired 10/23/2020; Cost $2,855,000)(c)(e)(f) | 5.88% | 01/01/2033 | 2,855 | 2,561,443 | |
| West Villages Improvement District (Develepmont Unit No. 10); Series 2024, RB | 5.38% | 05/01/2044 | 500 | 507,301 | |
| 81,504,674 | |||||
| Georgia–1.84% | |||||
| Albany (City of) & Dougherty (Country of), GA Payroll Development Authority (Procter & Gamble Paper Products Co. (The)); Series 1998, RB(f) | 5.30% | 05/15/2026 | 810 | 811,323 | |
| Atlanta (City of), GA Urban Residential Finance Authority (GE Tower Apartments); Series 2023 B, RB(a) | 5.75% | 06/01/2025 | 5,000 | 5,005,882 | |
| Atlanta Development Authority (The) (Westside Gulch Area); Series 2024 A, RB(e) | 5.00% | 04/01/2034 | 1,750 | 1,789,491 | |
| Cobb (County of), GA Development Authority (Northwest Classical Academy); Series 2023, RB(e) | 5.20% | 06/15/2033 | 1,000 | 1,031,035 | |
| Conyers (City of), GA (Salem Gate); Series 2024, RB | 5.38% | 03/01/2036 | 2,870 | 2,886,834 | |
| DeKalb (County of), IL Development Authority (The Globe Academy, Inc.); | |||||
| Series 2024 A, RB | 5.00% | 06/01/2040 | 400 | 411,453 | |
| Series 2024 A, RB | 5.00% | 06/01/2045 | 415 | 421,965 | |
| Floyd (County of), GA Development Authority (The Spires at Berry College); Series 2018 A, RB | 5.50% | 12/01/2028 | 1,900 | 1,900,994 | |
| Macon-Bibb (County of), GA Urban Development Authority (Academy for Classical Education, Inc.); Series 2017 A, RB(e) | 5.00% | 06/15/2027 | 245 | 248,845 | |
| Main Street Natural Gas, Inc.; | |||||
| Series 2022 C, RB(a)(e) | 4.00% | 11/01/2027 | 3,200 | 3,155,601 | |
| Series 2023 B, RB(a) | 5.00% | 03/01/2030 | 2,000 | 2,132,526 | |
| Oconee (County of), GA Industrial Development Authority (Presbyterian Village Athens); Series 2018 A-1, RB | 5.75% | 12/01/2028 | 2,250 | 2,273,461 | |
| 22,069,410 | |||||
| Guam–0.48% | |||||
| Guam (Territory of); Series 2015 D, Ref. RB | 5.00% | 11/15/2033 | 3,000 | 3,040,406 | |
| Guam (Territory of) Department of Education (John F. Kennedy); Series 2020, Ref. COP | 5.00% | 02/01/2040 | 2,750 | 2,757,055 | |
| 5,797,461 | |||||
| Idaho–0.70% | |||||
| Avimor Community Infrastructure District No. 1 (Assessment Area Five); Series 2024, RB(e) | 5.88% | 09/01/2053 | 1,982 | 2,069,592 | |
| Idaho (State of) Health Facilities Authority (Valley Vista Care Corp.); Series 2017 A, Ref. RB | 4.00% | 11/15/2027 | 825 | 822,607 | |
| Idaho (State of) Housing & Finance Association (Compass Public Charter School, Inc.); Series 2018 A, RB(e) | 4.63% | 07/01/2029 | 130 | 130,588 | |
| Idaho (State of) Housing & Finance Association (Future Public School); Series 2022 A, RB(e) | 4.00% | 05/01/2042 | 2,280 | 1,980,547 | |
| 6 | Invesco Short Duration High Yield Municipal Fund |
| Interest Rate | Maturity Date | Principal Amount (000) | Value | ||
| Idaho–(continued) | |||||
| Idaho (State of) Housing & Finance Association (North Star Charter School); | |||||
| Series 2014 A, Ref. RB | 6.75% | 07/01/2028 | $ 290 | $ 298,965 | |
| Series 2014 A, Ref. RB | 6.75% | 07/01/2036 | 526 | 542,093 | |
| Series 2014 A, Ref. RB | 6.75% | 07/01/2048 | 2,384 | 2,437,234 | |
| Power County Industrial Development Corp. (FMC Corp.); Series 1999, RB(f) | 6.45% | 08/01/2032 | 130 | 130,423 | |
| 8,412,049 | |||||
| Illinois–4.84% | |||||
| Aurora (City of), IL (East River Area TIF No. 6); Series 2018 A, Ref. RB | 5.00% | 12/30/2027 | 690 | 688,664 | |
| Berwyn (City of), IL (South Berwyn Corridor); Series 2020, RB(e) | 4.00% | 12/01/2028 | 1,240 | 1,198,272 | |
| Bradley (Village of), IL (Bradley Commons); | |||||
| Series 2018 A, Ref. RB | 5.00% | 01/01/2025 | 485 | 485,591 | |
| Series 2018 A, Ref. RB | 5.00% | 01/01/2026 | 505 | 508,138 | |
| Series 2018 A, Ref. RB | 5.00% | 01/01/2027 | 530 | 535,095 | |
| Chicago (City of), IL; | |||||
| Series 2015 A, GO Bonds | 5.50% | 01/01/2034 | 1,350 | 1,355,717 | |
| Series 2017 A, Ref. GO Bonds | 5.63% | 01/01/2029 | 1,000 | 1,040,669 | |
| Series 2017 A, Ref. GO Bonds | 5.75% | 01/01/2034 | 1,500 | 1,559,833 | |
| Chicago (City of), IL (O’Hare International Airport); | |||||
| Series 2012 B, Ref. RB(f) | 5.00% | 01/01/2030 | 5,290 | 5,292,144 | |
| Series 2024 A, RB(f) | 5.25% | 01/01/2041 | 2,150 | 2,349,766 | |
| Chicago (City of), IL Board of Education; | |||||
| Series 2015 C, GO Bonds | 5.25% | 12/01/2039 | 850 | 850,857 | |
| Series 2022 B, Ref. GO Bonds | 4.00% | 12/01/2041 | 5,000 | 4,663,368 | |
| Evanston (City of), IL (Roycemore School); | |||||
| Series 2021, RB(e) | 4.00% | 04/01/2032 | 245 | 218,395 | |
| Series 2021, RB(e) | 4.38% | 04/01/2041 | 930 | 768,337 | |
| Hillside (Village of), IL (Mannheim Redevelopment); Series 2018, Ref. RB | 5.00% | 01/01/2030 | 2,195 | 2,223,125 | |
| Illinois (State of) Development Finance Authority (CITGO Petroleum Corp.); Series 2002, RB(f) | 8.00% | 06/01/2032 | 11,805 | 11,819,918 | |
| Illinois (State of) Finance Authority; Series 2023, RB(a)(e)(f) | 7.38% | 09/01/2033 | 5,000 | 5,529,934 | |
| Illinois (State of) Finance Authority (Intrinsic Schools - Belmont School); Series 2015, RB(e) | 5.25% | 12/01/2025 | 175 | 175,786 | |
| Illinois (State of) Finance Authority (Lutheran Communities Obligated Group); | |||||
| Series 2019 A, Ref. RB (Acquired 11/27/2019; Cost $2,182,147)(c) | 5.00% | 11/01/2027 | 2,065 | 1,635,210 | |
| Series 2019 A, Ref. RB (Acquired 09/08/2022; Cost $1,885,670)(c) | 5.00% | 11/01/2035 | 2,020 | 1,452,420 | |
| Illinois (State of) Finance Authority (Park Place of Elmhurst); Series 2016, RB | 5.13% | 05/15/2060 | 1,081 | 590,807 | |
| Illinois (State of) Finance Authority (Plymouth Place); Series 2015, Ref. RB(h) | 5.00% | 05/15/2025 | 55 | 55,720 | |
| Illinois (State of) Finance Authority (Roosevelt University); Series 2007, RB | 5.50% | 04/01/2037 | 2,000 | 1,946,845 | |
| Illinois (State of) Finance Authority (Rush University Medical Center); Series 2015 A, Ref. RB | 5.00% | 11/15/2038 | 8,700 | 8,763,474 | |
| Illinois (State of) Finance Authority (Three Crowns Park); Series 2017, Ref. RB | 4.00% | 02/15/2027 | 1,115 | 1,112,406 | |
| Illinois (State of) Medical District Commission; | |||||
| Series 2002, COP (INS - NATL)(d) | 5.13% | 06/01/2026 | 25 | 25,027 | |
| Series 2002, COP (INS - NATL)(d) | 5.25% | 06/01/2032 | 140 | 140,098 | |
| Morton Grove (Village of), IL (Sawmill Station Redevelopment); Series 2019, RB | 4.25% | 01/01/2029 | 760 | 748,105 | |
| Yorkville (United City of), IL (Raintree Village); Series 2013, Ref. RB | 4.60% | 03/01/2025 | 315 | 314,425 | |
| 58,048,146 | |||||
| Indiana–0.99% | |||||
| Evansville (City of), IN (Silver Birch of Evansville); Series 2017, RB | 4.80% | 01/01/2028 | 300 | 289,961 | |
| Indiana (State of) Finance Authority (Good Samaritan Hospital); | |||||
| Series 2016 A, RB | 5.00% | 04/01/2037 | 200 | 201,803 | |
| Series 2016 A, RB | 5.50% | 04/01/2046 | 5,785 | 5,844,682 | |
| Indiana (State of) Finance Authority (Irvington Community School); Series 2018 A, Ref. RB(e) | 5.50% | 07/01/2028 | 500 | 501,884 | |
| Indiana (State of) Finance Authority (Ohio Valley Electrical Corp.); Series 2012 A, RB | 4.25% | 11/01/2030 | 1,580 | 1,620,059 | |
| Indiana (State of) Finance Authority (University of Evansville); Series 2022 A, Ref. RB | 5.25% | 09/01/2037 | 1,865 | 1,931,948 | |
| Mishawaka (City of), IN (Silver Birch of Mishwaka); Series 2017, RB(e) | 5.10% | 01/01/2032 | 465 | 427,989 | |
| Whiting (City of), IN (BP Products North America, Inc.); Series 2015, RB(a)(f) | 4.40% | 06/10/2031 | 1,000 | 1,022,722 | |
| 11,841,048 | |||||
| Iowa–1.47% | |||||
| Ackley (City of), IA (Grand Jivante); Series 2018 A, RB | 4.50% | 08/01/2033 | 600 | 515,730 | |
| 7 | Invesco Short Duration High Yield Municipal Fund |
| Interest Rate | Maturity Date | Principal Amount (000) | Value | |||
| Iowa–(continued) | ||||||
| Clear Lake (City of), IA (Timbercrest Apartments, LLC); Series 2018, RB | 4.30% | 10/01/2028 | $ 660 | $ 644,310 | ||
| Iowa (State of) Finance Authority (Iowa Fertilizer Co.); Series 2022, Ref. RB(a)(h) | 5.00% | 12/01/2032 | 5,410 | 6,291,978 | ||
| PEFA, Inc.; Series 2019, RB(a) | 5.00% | 09/01/2026 | 10,000 | 10,216,280 | ||
| 17,668,298 | ||||||
| Kansas–0.43% | ||||||
| Pittsburgh (City of), KS (North Broadway - Pittsburgh Town Center); Series 2006, RB | 4.80% | 04/01/2027 | 120 | 104,426 | ||
| Wichita (City of), KS (Presbyterian Manors, Inc.); | ||||||
| Series 2019, Ref. RB | 5.00% | 05/15/2027 | 1,165 | 1,135,405 | ||
| Series 2019, Ref. RB | 5.00% | 05/15/2029 | 1,280 | 1,231,676 | ||
| Series 2019, Ref. RB | 5.00% | 05/15/2034 | 2,950 | 2,745,437 | ||
| 5,216,944 | ||||||
| Kentucky–0.39% | ||||||
| Christian (County of), KY (Jennie Stuart Medical Center, Inc.); | ||||||
| Series 2016, Ref. RB | 5.00% | 02/01/2026 | 320 | 324,510 | ||
| Series 2016, Ref. RB | 5.50% | 02/01/2044 | 2,170 | 2,189,316 | ||
| Kentucky (Commonwealth of) Economic Development Finance Authority (Christian Care Communities); Series 2021, Ref. RB | 4.25% | 07/01/2031 | 925 | 851,919 | ||
| Kentucky (Commonwealth of) Economic Development Finance Authority (Next Generation Kentucky Information Highway); Series 2015 A, RB | 5.00% | 07/01/2030 | 1,000 | 1,009,301 | ||
| Kentucky (Commonwealth of) Economic Development Finance Authority (Rosedale Green); Series 2015, Ref. RB | 5.00% | 11/15/2025 | 260 | 258,667 | ||
| 4,633,713 | ||||||
| Louisiana–1.76% | ||||||
| Louisiana (State of) Local Government Environmental Facilities & Community Development Authority (Livingston (Parish of), LA Gomesha) (Green Bonds); Series 2018, RB(e) | 5.38% | 11/01/2038 | 3,660 | 3,836,429 | ||
| Louisiana (State of) Local Government Environmental Facilities & Community Development Authority (Vermilion (Parish of), LA Gomesha) (Green Bonds); Series 2019, RB(e) | 4.63% | 11/01/2038 | 1,645 | 1,694,785 | ||
| Louisiana (State of) Public Facilities Authority (Encore Academy); | ||||||
| Series 2021, RB (Acquired 11/03/2021; Cost $525,318)(b)(c)(e) | 5.00% | 06/01/2031 | 490 | 293,779 | ||
| Series 2021, RB (Acquired 11/03/2021; Cost $1,041,955)(b)(c)(e) | 5.00% | 06/01/2041 | 985 | 591,163 | ||
| New Orleans (City of), LA Aviation Board; Series 2015 B, RB(f) | 5.00% | 01/01/2040 | 7,700 | 7,709,352 | ||
| Plaquemines Port Harbor & Terminal District; Series 2024 A, RB(e) | 9.00% | 12/01/2044 | 5,000 | 5,021,950 | ||
| St. James (Parish of), LA (Nustar Logistics, L.P.); Series 2011, RB(a)(e) | 5.85% | 06/01/2025 | 2,000 | 2,028,498 | ||
| 21,175,956 | ||||||
| Maryland–0.31% | ||||||
| Baltimore (City of), MD (Convention Center Hotel); | ||||||
| Series 2017, Ref. RB | 5.00% | 09/01/2026 | 2,160 | 2,188,970 | ||
| Series 2017, Ref. RB | 5.00% | 09/01/2027 | 1,100 | 1,121,143 | ||
| Maryland (State of) Health & Higher Educational Facilities Authority (Green Street Academy); Series 2017 A, RB(e) | 5.00% | 07/01/2027 | 335 | 339,493 | ||
| Maryland (State of) Health & Higher Educational Facilities Authority (Johns Hopkins Medical Institutions Parking Facilities); Series 1996, RB (INS - AMBAC)(d) | 5.50% | 07/01/2026 | 20 | 20,146 | ||
| 3,669,752 | ||||||
| Massachusetts–0.89% | ||||||
| Ashland (Town of), MA; Series 2022, GO Bonds | 4.00% | 08/01/2042 | 1,000 | 1,012,489 | ||
| Lynn Housing Authority & Neighborhood Development; | ||||||
| Series 2018, Ref. RB | 4.00% | 10/01/2026 | 100 | 100,009 | ||
| Series 2018, Ref. RB | 4.00% | 10/01/2027 | 150 | 150,015 | ||
| Series 2018, Ref. RB | 4.25% | 10/01/2028 | 320 | 320,054 | ||
| Series 2018, Ref. RB | 4.38% | 10/01/2029 | 385 | 385,074 | ||
| Series 2018, Ref. RB | 4.50% | 10/01/2030 | 690 | 690,139 | ||
| Massachusetts (Commonwealth of) Development Finance Agency (Atrius Health); Series 2015, Ref. RB | 5.00% | 01/01/2041 | 4,280 | 4,289,150 | ||
| Massachusetts (Commonwealth of) Development Finance Agency (Lawrence General Hospital); Series 2017, Ref. RB | 5.00% | 07/01/2028 | 675 | 665,308 | ||
| 8 | Invesco Short Duration High Yield Municipal Fund |
| Interest Rate | Maturity Date | Principal Amount (000) | Value | |||
| Massachusetts–(continued) | ||||||
| Massachusetts (Commonwealth of) Development Finance Agency (Linden Ponds, Inc. Facility); Series 2018, RB(e) | 5.00% | 11/15/2033 | $ 1,500 | $ 1,567,738 | ||
| Massachusetts (Commonwealth of) Development Finance Agency (Newbridge Charles, Inc.); Series 2017, Ref. RB(e) | 5.00% | 10/01/2047 | 1,500 | 1,518,269 | ||
| 10,698,245 | ||||||
| Michigan–1.68% | ||||||
| Advanced Technology Academy; Series 2019, Ref. RB | 5.00% | 11/01/2034 | 1,200 | 1,237,881 | ||
| Detroit (City of), MI; Series 2014 B-1, GO Bonds | 4.00% | 04/01/2044 | 2,500 | 2,001,959 | ||
| Ecorse (City of), MI; Series 2011, GO Bonds | 5.80% | 11/01/2026 | 1,100 | 1,101,631 | ||
| Ivywood Classical Academy; Series 2023, RB | 5.00% | 01/01/2034 | 1,830 | 1,881,817 | ||
| Kalamazoo Economic Development Corp. (Friendship Village of Kalamazoo); Series 2021, Ref. RB(e) | 5.00% | 08/15/2031 | 890 | 866,557 | ||
| Michigan (State of) Finance Authority (Henry Ford Health System); Series 2024, RB | 5.25% | 02/29/2040 | 1,000 | 1,111,623 | ||
| Michigan (State of) Finance Authority (Madison Academy); Series 2021, Ref. RB | 4.25% | 12/01/2039 | 1,515 | 1,268,507 | ||
| Michigan (State of) Finance Authority (Trinity Health Credit Group); Series 2019 A, Ref. RB | 4.00% | 12/01/2049 | 1,145 | 1,088,043 | ||
| Michigan (State of) Strategic Fund (Evangelical Homes); Series 2013, Ref. RB | 5.50% | 06/01/2047 | 2,880 | 2,341,231 | ||
| Michigan (State of) Strategic Fund (Friendship Village of Kalamazoo); Series 2021, Ref. RB(e) | 5.00% | 08/15/2031 | 665 | 647,484 | ||
| Michigan (State of) Strategic Fund (Green Bonds); Series 2021, RB(a)(f) | 4.00% | 10/01/2026 | 5,610 | 5,629,848 | ||
| Waterford Township Economic Development Corp. (Canterbury Health Care, Inc.); Series 2016 A, Ref. RB (Acquired 09/30/2016; Cost $992,159)(b)(c)(e) | 5.00% | 07/01/2026 | 980 | 931,122 | ||
| 20,107,703 | ||||||
| Minnesota–1.17% | ||||||
| Bethel (City of), MN (Ecumen Obligated Group); | ||||||
| Series 2024, Ref. RB | 5.25% | 03/01/2034 | 750 | 770,299 | ||
| Series 2024, Ref. RB | 6.13% | 03/01/2044 | 1,500 | 1,547,351 | ||
| Brooklyn Park (City of), MN (Athlos Leadership Academy); | ||||||
| Series 2015 A, RB | 4.75% | 07/01/2025 | 100 | 99,042 | ||
| Series 2015, RB | 5.75% | 07/01/2046 | 1,400 | 1,281,344 | ||
| Dakota (County of), MN Community Development Agency (Sanctuary at West St. Paul); Series 2015, RB | 5.75% | 08/01/2030 | 775 | 600,409 | ||
| Duluth (City of), MN Housing & Redevelopment Authority (Duluth Public Schools Academy); | ||||||
| Series 2018 A, Ref. RB | 4.25% | 11/01/2028 | 1,680 | 1,627,577 | ||
| Series 2018 A, Ref. RB | 5.00% | 11/01/2033 | 1,070 | 1,056,017 | ||
| Minneapolis (City of), MN (Spero Academy); | ||||||
| Series 2017 A, RB(e) | 5.50% | 07/01/2027 | 515 | 522,514 | ||
| Series 2017 A, RB(e) | 6.00% | 07/01/2032 | 1,080 | 1,114,669 | ||
| Ramsey (City of), MN; Series 2022 A, Ref. RB | 5.00% | 06/01/2032 | 2,000 | 2,033,611 | ||
| Rochester (City of), MN (Homestead at Rochester, Inc.); Series 2013 A, RB | 6.88% | 12/01/2048 | 1,000 | 1,000,161 | ||
| St. Louis Park (City of), MN (Place Via Sol Project); Series 2018, RB (Acquired 12/26/2018; Cost $1,927,397)(a)(b)(c)(e) | 6.00% | 07/01/2027 | 1,927 | 192,740 | ||
| St. Paul (City of), MN Housing & Redevelopment Authority (Great River School); Series 2017 A, RB(e) | 5.25% | 07/01/2033 | 140 | 143,347 | ||
| St. Paul (City of), MN Housing & Redevelopment Authority (Higher Ground Academy); Series 2023, Ref. RB | 4.25% | 12/01/2032 | 1,205 | 1,238,230 | ||
| St. Paul (City of), MN Housing & Redevelopment Authority (Hmong College Prep Academy); Series 2016, Ref. RB | 5.00% | 09/01/2026 | 425 | 428,074 | ||
| St. Paul (City of), MN Housing & Redevelopment Authority (Rossy & Richard Shaller Family Sholom East Campus); | ||||||
| Series 2018, Ref. RB | 4.00% | 10/01/2031 | 250 | 224,844 | ||
| Series 2018, Ref. RB | 4.13% | 10/01/2033 | 250 | 220,110 | ||
| 14,100,339 | ||||||
| Mississippi–0.39% | ||||||
| Mississippi (State of) Development Bank (Jackson County Gomesa); Series 2021, RB(e) | 3.63% | 11/01/2036 | 3,350 | 3,211,092 | ||
| Tunica (County of), MS; Series 2019, Ref. RB | 6.00% | 10/01/2040 | 1,575 | 1,449,794 | ||
| 4,660,886 | ||||||
| 9 | Invesco Short Duration High Yield Municipal Fund |
| Interest Rate | Maturity Date | Principal Amount (000) | Value | |||
| Missouri–0.96% | ||||||
| Cape Girardeau (County of), MO Industrial Development Authority (Procter & Gamble Paper Products Co. (The)); Series 1998, RB(f) | 5.30% | 05/15/2028 | $ 30 | $ 30,055 | ||
| I-470 Western Gateway Transportation Development District; Series 2019 A, RB(e) | 4.50% | 12/01/2029 | 1,485 | 1,477,252 | ||
| Kansas City (City of), MO Industrial Development Authority (Ward Parkway Center Community Improvement District); | ||||||
| Series 2016 A, Ref. RB(e) | 4.25% | 04/01/2026 | 145 | 144,024 | ||
| Series 2016 A, Ref. RB(e) | 5.00% | 04/01/2036 | 2,000 | 1,960,406 | ||
| Kansas City (City of), MO Land Clearance for Redevelopment Authority (Convention Center Hotel); Series 2018 B, RB(e) | 4.38% | 02/01/2031 | 725 | 703,544 | ||
| Kirkwood (City of), MO Industrial Development Authority (Aberdeen Heights); | ||||||
| Series 2017 A, Ref. IDR | 5.00% | 05/15/2026 | 1,000 | 993,186 | ||
| Series 2017 A, Ref. IDR | 5.00% | 05/15/2027 | 800 | 790,615 | ||
| Series 2017 A, Ref. RB | 5.25% | 05/15/2037 | 1,000 | 965,763 | ||
| Series 2017 A, Ref. RB | 5.25% | 05/15/2042 | 1,750 | 1,611,495 | ||
| Maryland Heights (City of), MO (Westport Plaza Redevelopment); | ||||||
| Series 2020, RB | 3.63% | 11/01/2031 | 385 | 384,144 | ||
| Series 2020, RB | 4.13% | 11/01/2038 | 2,500 | 2,459,046 | ||
| 11,519,530 | ||||||
| Montana–0.21% | ||||||
| Montana Board of Housing (Baxter Apartments Projects); Series 2023, RB(a) | 6.00% | 06/01/2025 | 2,500 | 2,517,635 | ||
| Nevada–0.17% | ||||||
| Las Vegas (City of), NV Special Improvement District No. 613; Series 2024, RB | 5.00% | 12/01/2039 | 400 | 406,779 | ||
| Las Vegas (City of), NV Special Improvement District No. 815; Series 2020, RB | 4.75% | 12/01/2040 | 335 | 332,582 | ||
| Nevada (State of) Department of Business & Industry (Doral Academy of Nevada); Series 2017 A, RB | 5.00% | 07/15/2037 | 500 | 502,916 | ||
| North Las Vegas (City of), NV Special Improvement District No. 66 (Villages at Tule Springs Village 1); Series 2022, RB(e) | 5.50% | 06/01/2037 | 745 | 763,146 | ||
| 2,005,423 | ||||||
| New Hampshire–0.98% | ||||||
| New Hampshire (State of) Business Finance Authority; Series 2024-1A, RB | 4.25% | 07/20/2041 | 2,966 | 2,958,579 | ||
| New Hampshire (State of) Business Finance Authority (Covanta); Series 2020 A, Ref. RB(a)(e) | 3.63% | 07/02/2040 | 3,455 | 2,919,216 | ||
| New Hampshire (State of) Business Finance Authority (Social Bonds); Series 2022-2A, RB | 4.00% | 10/20/2036 | 3,901 | 3,860,832 | ||
| New Hampshire (State of) Housing Finance Authority (University Hospitals Home Care Services, Inc.); | ||||||
| Series 2024, RB(e) | 5.63% | 12/15/2033 | 1,000 | 1,029,687 | ||
| Series 2024, RB(e) | 6.25% | 12/15/2038 | 1,000 | 1,043,538 | ||
| 11,811,852 | ||||||
| New Jersey–0.79% | ||||||
| New Jersey (State of) Economic Development Authority (Golden Door Charter School); Series 2018 A, RB(e) | 5.13% | 11/01/2029 | 205 | 207,426 | ||
| New Jersey (State of) Economic Development Authority (Hatikvah International Academy Charter School); Series 2017 A, RB(e) | 5.00% | 07/01/2027 | 255 | 257,121 | ||
| New Jersey (State of) Economic Development Authority (Marion P. Thomas Charter School); Series 2018 A, RB(e) | 4.75% | 10/01/2028 | 1,105 | 1,108,771 | ||
| New Jersey (State of) Economic Development Authority (North Star Academy Charter School of Newark, Inc.); Series 2017, RB | 5.00% | 07/15/2047 | 1,075 | 1,081,262 | ||
| New Jersey (State of) Economic Development Authority (Paterson Charter School for Science and Technology, Inc.); Series 2012 C, RB | 5.00% | 07/01/2032 | 1,160 | 1,160,696 | ||
| New Jersey (State of) Economic Development Authority (Teaneck Community Charter School); Series 2017 A, Ref. RB(e) | 4.25% | 09/01/2027 | 140 | 141,019 | ||
| New Jersey (State of) Transportation Trust Fund Authority; | ||||||
| Series 2008 A, RB(g) | 0.00% | 12/15/2028 | 715 | 623,874 | ||
| Series 2008 A, RB(g) | 0.00% | 12/15/2035 | 1,000 | 660,487 | ||
| Series 2009 A, RB(g) | 0.00% | 12/15/2032 | 1,465 | 1,099,499 | ||
| Series 2018 A, RN(i)(j) | 5.00% | 06/15/2029 | 990 | 1,023,487 | ||
| Series 2018 A, RN(i)(j) | 5.00% | 06/15/2030 | 2,010 | 2,073,558 | ||
| 9,437,200 | ||||||
| 10 | Invesco Short Duration High Yield Municipal Fund |
| Interest Rate | Maturity Date | Principal Amount (000) | Value | ||
| New Mexico–0.10% | |||||
| Winrock Town Center Tax Increment Development District No. 1; Series 2022, Ref. RB(e) | 4.00% | 05/01/2033 | $ 1,250 | $ 1,221,234 | |
| New York–8.86% | |||||
| Allegany County Capital Resource Corp. (Houghton College); Series 2022 A, Ref. RB | 5.00% | 12/01/2032 | 1,385 | 1,388,437 | |
| Buffalo & Erie County Industrial Land Development Corp. (Medaille College); | |||||
| Series 2018, Ref. RB (Acquired 08/16/2018; Cost $220,094)(b)(c)(e) | 5.00% | 10/01/2028 | 213 | 8,625 | |
| Series 2018, Ref. RB (Acquired 08/16/2018; Cost $1,403,843)(b)(c)(e) | 5.00% | 10/01/2038 | 1,389 | 56,238 | |
| Build NYC Resource Corp. (Brooklyn Navy Yard); | |||||
| Series 2019, Ref. RB (LOC - Santander Bank N.A.)(e)(f)(k) | 5.25% | 12/31/2033 | 3,000 | 2,806,183 | |
| Series 2019, Ref. RB (LOC - Santander Bank N.A.)(e)(f)(k) | 5.50% | 12/31/2040 | 5,000 | 4,382,279 | |
| Build NYC Resource Corp. (Shefa School); Series 2021 A, RB(e) | 2.50% | 06/15/2031 | 375 | 338,524 | |
| Build NYC Resource Corp. (Unity Preparatory Charter School of Brooklyn); Series 2023, RB(e) | 5.25% | 06/15/2043 | 525 | 547,464 | |
| Erie Tobacco Asset Securitization Corp.; Series 2005 A, RB | 5.00% | 06/01/2045 | 3,210 | 2,990,060 | |
| Metropolitan Transportation Authority; Subseries 2015 C-1, Ref. RB | 5.25% | 11/15/2031 | 2,000 | 2,047,826 | |
| Nassau (County of), NY Industrial Development Agency (Amsterdam at Harborside); | |||||
| Series 2021, RB (Acquired 01/19/2016-02/28/2018; Cost $1,089,980)(b)(c) | 5.00% | 01/01/2058 | 967 | 289,667 | |
| Series 2021, Ref. RB (Acquired 09/07/2021; Cost $445,000)(b)(c)(e) | 9.00% | 01/01/2041 | 445 | 445,000 | |
| New York & New Jersey (States of) Port Authority; One Hundred Eighty Third Series 2014, RB | 4.00% | 12/15/2038 | 2,000 | 1,999,955 | |
| New York (City of), NY; Series 2021-3, VRD GO Bonds(l) | 2.75% | 04/01/2042 | 4,400 | 4,400,000 | |
| New York (City of), NY Municipal Water Finance Authority; Series 2023 D, Ref. RB | 4.13% | 06/15/2047 | 3,000 | 2,984,376 | |
| New York (City of), NY Transitional Finance Authority; | |||||
| Series 2024 F-1, RB | 5.00% | 02/01/2045 | 5,000 | 5,524,782 | |
| Series 2024, RB | 5.00% | 05/01/2041 | 3,000 | 3,389,268 | |
| New York (State of) Dormitory Authority; Series 2024 A, Ref. RB | 5.50% | 07/01/2054 | 7,000 | 8,015,543 | |
| New York (State of) Dormitory Authority (Montefiore Obligated Group); Series 2018 A, Ref. RB | 5.00% | 08/01/2035 | 1,250 | 1,288,762 | |
| New York Counties Tobacco Trust IV; Series 2010 A, RB(e) | 6.25% | 06/01/2041 | 2,900 | 2,900,419 | |
| New York Counties Tobacco Trust VI; | |||||
| Series 2016 A, Ref. RB | 5.63% | 06/01/2035 | 855 | 877,883 | |
| Series 2016 A, Ref. RB | 6.00% | 06/01/2043 | 2,825 | 2,901,685 | |
| New York Liberty Development Corp. (3 World Trade Center); Series 2014, Class 3, Ref. RB(e) | 7.25% | 11/15/2044 | 5,400 | 5,416,650 | |
| New York Transportation Development Corp. (American Airlines, Inc. John F. Kennedy International Airport); | |||||
| Series 2020, Ref. RB(f) | 5.25% | 08/01/2031 | 2,470 | 2,630,986 | |
| Series 2023, RB(f) | 5.50% | 06/30/2038 | 2,000 | 2,214,164 | |
| Series 2023, RB(f) | 5.50% | 06/30/2039 | 1,000 | 1,101,595 | |
| Series 2023, RB(f) | 5.50% | 06/30/2040 | 875 | 959,536 | |
| Series 2024, RB(f) | 5.25% | 06/30/2043 | 4,000 | 4,301,648 | |
| New York Transportation Development Corp. (American Airlines, Inc.); | |||||
| Series 2016, Ref. RB(f) | 5.00% | 08/01/2026 | 2,880 | 2,884,376 | |
| Series 2016, Ref. RB(f) | 5.00% | 08/01/2031 | 8,680 | 8,689,767 | |
| Series 2021, Ref. RB(f) | 3.00% | 08/01/2031 | 545 | 510,477 | |
| New York Transportation Development Corp. (Delta Air Lines, Inc. LaGuardia Airport Terminals C&D Redevelopment); | |||||
| Series 2018, RB(f) | 5.00% | 01/01/2032 | 4,315 | 4,459,652 | |
| Series 2018, RB(f) | 5.00% | 01/01/2034 | 6,500 | 6,705,680 | |
| Series 2020, RB(f) | 5.00% | 10/01/2035 | 5,000 | 5,259,251 | |
| New York Transportation Development Corp. (LaGuardia Airport Terminal B Redevelopment); Series 2023, RB(f) | 5.63% | 04/01/2040 | 2,500 | 2,694,689 | |
| Oneida Indian Nation; Series 2024 B, RB(e) | 6.00% | 09/01/2043 | 1,400 | 1,542,662 | |
| Suffolk Regional Off-Track Betting Co.; | |||||
| Series 2024, RB | 5.00% | 12/01/2034 | 1,600 | 1,677,018 | |
| Series 2024, RB | 5.75% | 12/01/2044 | 1,500 | 1,570,299 | |
| Tompkins County Development Corp. (Tompkins Cortland Community College Foundation, Inc.); | |||||
| Series 2013 A, RB(b) | 5.00% | 07/01/2027 | 1,000 | 300,000 | |
| Series 2013 A, RB(b) | 5.00% | 07/01/2032 | 1,000 | 300,000 | |
| Westchester (County of), NY Industrial Development Agency (Million Air Two LLC General Aviation Facilities); Series 2017 A, RB(e)(f) | 7.00% | 06/01/2046 | 3,500 | 3,598,625 | |
| 106,400,051 | |||||
| 11 | Invesco Short Duration High Yield Municipal Fund |
| Interest Rate | Maturity Date | Principal Amount (000) | Value | ||
| North Dakota–0.39% | |||||
| Burleigh (County of), ND (University of Mary); Series 2016, RB | 4.38% | 04/15/2026 | $ 420 | $ 418,978 | |
| Grand Forks (City of), ND (Altru Health System); Series 2021, Ref. RB | 4.00% | 12/01/2040 | 3,375 | 3,135,936 | |
| North Dakota (State of) Housing Finance Agency (Social Bonds); Series 2024 C, RB | 6.25% | 01/01/2055 | 1,000 | 1,132,998 | |
| 4,687,912 | |||||
| Ohio–2.84% | |||||
| Buckeye Tobacco Settlement Financing Authority; | |||||
| Series 2020 A-2, Ref. RB | 3.00% | 06/01/2048 | 2,755 | 2,085,810 | |
| Series 2020 A-2, Ref. RB | 4.00% | 06/01/2048 | 1,990 | 1,815,794 | |
| Series 2020 B-2, Ref. RB | 5.00% | 06/01/2055 | 2,470 | 2,273,898 | |
| Cleveland (City of) & Cuyahoga (County of), OH Port Authority (Flats East Bank); Series 2010, RB | 6.00% | 11/15/2035 | 1,000 | 1,001,914 | |
| Cleveland (City of), OH (Continental Airlines, Inc.); Series 1998, RB(f) | 5.38% | 09/15/2027 | 485 | 485,221 | |
| Cuyahoga (County of), OH (MetroHealth System); Series 2017, Ref. RB | 5.00% | 02/15/2037 | 5,470 | 5,621,405 | |
| Franklin (County of), OH (Wesley Communities); Series 2020, Ref. RB | 5.25% | 11/15/2040 | 1,500 | 1,530,880 | |
| Greater Cincinnati (Port of), OH Development Authority; Series 2004, RB | 6.40% | 02/15/2034 | 1,950 | 1,943,102 | |
| Greater Cincinnati (Port of), OH Development Authority (IPS Cincinnati LLC); Series 2021, RB(a) | 4.38% | 06/15/2026 | 3,500 | 3,461,702 | |
| Muskingum (County of), OH (Genesis Healthcare System); | |||||
| Series 2013, RB | 5.00% | 02/15/2033 | 1,000 | 1,000,119 | |
| Series 2013, RB | 5.00% | 02/15/2044 | 4,880 | 4,816,397 | |
| Series 2013, RB | 5.00% | 02/15/2048 | 5,300 | 5,167,672 | |
| Ohio (State of) (Portsmouth Bypass); Series 2015, RB(f) | 5.00% | 12/31/2039 | 2,290 | 2,307,883 | |
| RiverSouth Authority; Series 2007 A, RB | 5.75% | 12/01/2027 | 495 | 495,172 | |
| Youngstown (City of), OH Metropolitan Housing Authority; Series 2014, RB | 4.00% | 12/15/2024 | 30 | 30,008 | |
| 34,036,977 | |||||
| Oklahoma–0.92% | |||||
| Oklahoma (County of), OK Finance Authority (Astec); | |||||
| Series 2024, RB(e) | 5.25% | 06/15/2034 | 700 | 715,759 | |
| Series 2024, RB(e) | 6.00% | 06/15/2044 | 1,000 | 1,029,450 | |
| Oklahoma (State of) Development Finance Authority (OU Medicine); Series 2018 B, RB (INS - AGM)(d) | 4.00% | 08/15/2048 | 2,430 | 2,261,613 | |
| Tulsa (City of), OK Airports Improvement Trust; Series 2001 C, Ref. RB(f) | 5.50% | 12/01/2035 | 2,000 | 2,003,243 | |
| Tulsa (City of), OK Airports Improvement Trust (American Airlines Group, Inc.); Series 2015, Ref. RB(a)(f) | 5.00% | 06/01/2025 | 5,000 | 5,038,205 | |
| 11,048,270 | |||||
| Oregon–0.00% | |||||
| Local Oregon Capital Assets Program; Series 2011 C, COP | 4.60% | 06/01/2031 | 35 | 35,014 | |
| Oregon (State of) (Elderly & Disabled Housing); Series 1993 C, GO Bonds(f) | 5.65% | 08/01/2026 | 5 | 5,010 | |
| 40,024 | |||||
| Pennsylvania–0.73% | |||||
| Allentown (City of), PA Neighborhood Improvement Zone Development Authority (615 Waterfront); Series 2021, RB(e) | 6.00% | 05/01/2042 | 645 | 682,909 | |
| Allentown (City of), PA Neighborhood Improvement Zone Development Authority (City Center); | |||||
| Series 2018, RB(e) | 5.00% | 05/01/2028 | 810 | 837,158 | |
| Series 2018, RB(e) | 5.00% | 05/01/2033 | 500 | 512,380 | |
| Franklin (County of), PA Industrial Development Authority (Menno-Haven, Inc.); | |||||
| Series 2018, Ref. RB | 5.00% | 12/01/2028 | 630 | 639,087 | |
| Series 2018, Ref. RB | 5.00% | 12/01/2030 | 910 | 926,988 | |
| Northampton (County of), PA Industrial Development Authority; | |||||
| Series 2013 A, RB (Acquired 04/03/2013; Cost $308,057)(c)(m)(n) | 5.00% | 06/30/2027 | 350 | 63,025 | |
| Series 2013, RB(m)(n) | 5.00% | 06/30/2027 | 193 | 34,713 | |
| Pennsylvania (Commonwealth of) Housing Finance Agency (Social Bonds); Series 2024-145A, RB | 6.00% | 10/01/2054 | 1,630 | 1,801,290 | |
| Philadelphia (City of), PA Authority for Industrial Development (Alliance for Progress Charter School, Inc.); Series 2019 A, RB | 5.00% | 06/15/2039 | 1,840 | 1,822,799 | |
| 12 | Invesco Short Duration High Yield Municipal Fund |
| Interest Rate | Maturity Date | Principal Amount (000) | Value | |||
| Pennsylvania–(continued) | ||||||
| Philadelphia (City of), PA Authority for Industrial Development (Wesley Enhanced Living Obligated Group); | ||||||
| Series 2017, Ref. RB | 5.00% | 07/01/2031 | $ 500 | $ 499,107 | ||
| Series 2017, Ref. RB | 5.00% | 07/01/2032 | 1,000 | 997,369 | ||
| 8,816,825 | ||||||
| Puerto Rico–8.30% | ||||||
| Children’s Trust Fund; | ||||||
| Series 2002, RB | 5.50% | 05/15/2039 | 10,205 | 10,257,755 | ||
| Series 2002, RB | 5.63% | 05/15/2043 | 7,645 | 7,733,774 | ||
| Corp. Para El Financiamiento Publico de Puerto Rico; | ||||||
| Series 2011, RB(g)(m) | 0.00% | 12/31/2024 | 10,675 | 0 | ||
| Series 2011, RB(g)(m) | 0.00% | 08/01/2025 | 17,475 | 0 | ||
| Series 2011, RB(g)(m) | 0.00% | 08/01/2026 | 6,495 | 0 | ||
| Series 2011, RB(g)(m) | 0.00% | 08/01/2028 | 37,400 | 0 | ||
| Series 2011, RB(g)(m) | 0.00% | 08/01/2031 | 54,770 | 1 | ||
| GDB Debt Recovery Authority of Puerto Rico; Series 2023, RB | 7.50% | 08/20/2040 | 4,073 | 3,879,686 | ||
| PRHTA Custodial Trust; Series 2023, RB(b) | 5.75% | 12/06/2049 | 216 | 77,700 | ||
| PRPBA Custodial Trust; Series 2022, RB(g) | 0.00% | 03/15/2049 | 278 | 3,871 | ||
| Puerto Rico (Commonwealth of); | ||||||
| Series 2021 A, GO Bonds(g) | 0.00% | 07/01/2033 | 2,034 | 1,371,228 | ||
| Series 2021 A-1, GO Bonds | 5.63% | 07/01/2027 | 10,510 | 10,947,439 | ||
| Series 2021 A-1, GO Bonds | 4.00% | 07/01/2033 | 3,300 | 3,275,612 | ||
| Series 2021 A-1, GO Bonds | 4.00% | 07/01/2041 | 4,000 | 3,801,842 | ||
| Subseries 2022, RN(g) | 0.00% | 11/01/2043 | 7,515 | 4,762,704 | ||
| Subseries 2022, RN(g) | 0.00% | 11/01/2051 | 2,048 | 1,312,995 | ||
| Puerto Rico (Commonwealth of) Electric Power Authority; | ||||||
| Series 2005 RR, RB (Acquired 05/16/2013; Cost $100,000) (INS - SGI)(c)(d) | 5.00% | 07/01/2025 | 100 | 99,655 | ||
| Series 2005 RR, RB (Acquired 06/01/2017; Cost $155,000) (INS - AGC)(c)(d) | 5.00% | 07/01/2026 | 155 | 154,936 | ||
| Series 2007 TT, RB (Acquired 06/01/2017; Cost $165,000) (INS - NATL)(c)(d) | 5.00% | 07/01/2026 | 165 | 165,092 | ||
| Series 2007 TT, RB (Acquired 08/08/2018; Cost $313,750)(b)(c) | 5.00% | 07/01/2037 | 500 | 270,000 | ||
| Series 2007 UU, Ref. RB (Acquired 12/11/2018; Cost $1,435,000) (INS - AGC)(c)(d) | 5.00% | 07/01/2026 | 1,435 | 1,434,919 | ||
| Series 2007 VV, Ref. RB (Acquired 03/11/2014; Cost $1,621,881) (INS - NATL)(c)(d) | 5.25% | 07/01/2025 | 1,705 | 1,697,789 | ||
| Series 2007 VV, Ref. RB (Acquired 07/19/2018; Cost $1,036,994) (INS - NATL)(c)(d) | 5.25% | 07/01/2030 | 1,000 | 983,204 | ||
| Series 2010 AAA, RB (Acquired 04/18/2013; Cost $5,685,000)(b)(c) | 5.25% | 07/01/2028 | 5,685 | 3,069,900 | ||
| Series 2010 CCC, RB (Acquired 05/26/2010; Cost $3,520,000)(b)(c) | 5.25% | 07/01/2026 | 3,520 | 1,900,800 | ||
| Series 2010 XX, RB (Acquired 04/25/2013; Cost $250,000)(b)(c) | 5.25% | 07/01/2027 | 250 | 135,000 | ||
| Series 2010 ZZ, Ref. RB (Acquired 03/04/2014; Cost $873,129)(b)(c) | 5.25% | 07/01/2025 | 1,180 | 637,200 | ||
| Puerto Rico (Commonwealth of) Industrial, Tourist, Educational, Medical & Environmental Control Facilities Financing Authority (AES Puerto Rico); | ||||||
| Series 2023 A, RB | 6.63% | 01/01/2027 | 596 | 590,885 | ||
| Series 2023 A, RB | 6.63% | 01/01/2028 | 4,548 | 4,505,129 | ||
| Puerto Rico (Commonwealth of) Municipal Finance Agency; | ||||||
| Series 2002 A, RB (INS - AGM)(d) | 5.00% | 08/01/2027 | 745 | 749,659 | ||
| Series 2005 A, RB (INS - AGM)(d) | 5.00% | 08/01/2030 | 305 | 306,907 | ||
| Puerto Rico Sales Tax Financing Corp.; | ||||||
| Series 2018 A-1, RB(g) | 0.00% | 07/01/2027 | 1,027 | 923,808 | ||
| Series 2018 A-1, RB(g) | 0.00% | 07/01/2029 | 1,003 | 835,886 | ||
| Series 2018 A-1, RB(g) | 0.00% | 07/01/2033 | 11,167 | 7,879,009 | ||
| Series 2018 A-1, RB | 4.50% | 07/01/2034 | 2,662 | 2,665,926 | ||
| Series 2018 A-1, RB | 4.55% | 07/01/2040 | 538 | 539,281 | ||
| Series 2018 A-1, RB(g) | 0.00% | 07/01/2046 | 13,831 | 4,663,723 | ||
| Series 2018 A-1, RB(g) | 0.00% | 07/01/2051 | 11,268 | 2,765,306 | ||
| Series 2019 A-2, RB | 4.33% | 07/01/2040 | 7,975 | 7,887,206 | ||
| Series 2019 A-2, RB | 4.54% | 07/01/2053 | 163 | 156,358 | ||
| Series 2019 A-2, RB | 4.78% | 07/01/2058 | 2,196 | 2,172,963 | ||
| University of Puerto Rico; Series 2006 Q, RB | 5.00% | 06/01/2025 | 5,000 | 4,975,947 | ||
| 99,591,095 | ||||||
| 13 | Invesco Short Duration High Yield Municipal Fund |
| Interest Rate | Maturity Date | Principal Amount (000) | Value | |||
| Rhode Island–0.92% | ||||||
| Pawtucket (City of), RI Housing Authority; Series 2010, RB | 5.50% | 09/01/2028 | $ 195 | $ 195,374 | ||
| Rhode Island Health & Educational Building Corp. (Lifespan Obligated Group); Series 2024, RB | 5.25% | 05/15/2049 | 3,650 | 3,936,627 | ||
| Rhode Island Housing & Mortgage Finance Corp.; Series 1992 10-A, RB | 6.50% | 04/01/2027 | 80 | 80,179 | ||
| Tobacco Settlement Financing Corp.; | ||||||
| Series 2015 B, Ref. RB | 4.50% | 06/01/2045 | 1,685 | 1,691,025 | ||
| Series 2015 B, Ref. RB | 5.00% | 06/01/2050 | 5,175 | 5,180,173 | ||
| 11,083,378 | ||||||
| South Carolina–1.22% | ||||||
| Patriots Energy Group Financing Agency; Series 2023 A-1, RB(a) | 5.25% | 08/01/2031 | 2,500 | 2,701,574 | ||
| South Carolina (State of) Jobs-Economic Development Authority (South Carolina SAVES Green Community Program - AAC East LLC) (Green Bonds); Series 2019, RB(e) | 7.00% | 05/01/2026 | 825 | 804,739 | ||
| South Carolina (State of) Jobs-Economic Development Authority (Novant Health Obligated Group); Series 2024 A, RB | 5.25% | 11/01/2044 | 4,750 | 5,336,574 | ||
| South Carolina (State of) Public Service Authority; Series 2014 A, RB(a)(h) | 5.50% | 10/23/2024 | 2,450 | 2,457,765 | ||
| South Carolina (State of) Public Service Authority (Santee Cooper); Series 2024 B, Ref. RB (INS - AGM)(d) | 5.00% | 12/01/2040 | 3,000 | 3,364,010 | ||
| 14,664,662 | ||||||
| Tennessee–1.90% | ||||||
| Bristol (City of), TN Industrial Development Board (Pinnacle); Series 2016, RB | 5.00% | 06/01/2027 | 3,620 | 3,561,100 | ||
| Knox (County of), TN Health, Educational & Housing Facility Board (University Health); Series 2017, Ref. RB | 5.00% | 04/01/2036 | 2,605 | 2,646,176 | ||
| Memphis (City of) & Shelby (County of), TN Economic Development Growth Engine Industrial Development Board (Graceland); Series 2017 A, Ref. RB | 5.50% | 07/01/2037 | 350 | 266,149 | ||
| Metropolitan Development and Housing Agency (Fifth + Broadway Development); | ||||||
| Series 2018, RB(e) | 4.50% | 06/01/2028 | 865 | 877,291 | ||
| Series 2018, RB(e) | 5.13% | 06/01/2036 | 1,000 | 1,022,465 | ||
| Nashville (City of) & Davidson (County of), TN Metropolitan Government Health & Educational Facilities Board (The) (Trousdale Foundation Properties); Series 2018 A, RB (Acquired 08/29/2018-01/31/2019; Cost $1,602,821)(b)(c)(e) | 5.25% | 04/01/2028 | 1,607 | 112,468 | ||
| Shelby (County of), TN Health, Educational & Housing Facilities Board (Trezevant Manor); | ||||||
| Series 2013 A, Ref. RB | 5.38% | 09/01/2041 | 205 | 172,339 | ||
| Series 2013 A, Ref. RB | 5.50% | 09/01/2047 | 200 | 161,011 | ||
| Series 2016 A, Ref. RB(e) | 5.00% | 09/01/2031 | 3,000 | 2,710,735 | ||
| Series 2016 A, Ref. RB(e) | 5.00% | 09/01/2037 | 1,475 | 1,232,294 | ||
| Tennergy Corp.; | ||||||
| Series 2021 A, RB(a) | 4.00% | 09/01/2028 | 3,610 | 3,638,758 | ||
| Series 2022 A, RB(a) | 5.50% | 12/01/2030 | 5,950 | 6,463,676 | ||
| 22,864,462 | ||||||
| Texas–9.35% | ||||||
| Argyle (Town of), TX (The Highlands of Argyle Public Improvement District No. 1); Series 2017, RB | 4.25% | 09/01/2027 | 195 | 196,188 | ||
| Arlington Higher Education Finance Corp. (Basis Texas Charter Schools, Inc.); | ||||||
| Series 2023, RB(a)(e) | 4.88% | 06/15/2026 | 1,000 | 1,013,429 | ||
| Series 2024, RB(e) | 4.50% | 06/15/2044 | 830 | 809,761 | ||
| Series 2024, RB(e) | 4.75% | 06/15/2049 | 915 | 910,975 | ||
| Arlington Higher Education Finance Corp. (Cypress Christian School); Series 2024, RB(e) | 5.00% | 06/01/2033 | 3,790 | 3,941,397 | ||
| Arlington Higher Education Finance Corp. (Great Hearts America - Texas); Series 2024, RB | 4.50% | 08/15/2039 | 1,500 | 1,507,151 | ||
| Arlington Higher Education Finance Corp. (Legacy Traditional Schools); | ||||||
| Series 2021, Ref. RB | 4.00% | 02/15/2031 | 2,510 | 2,321,967 | ||
| Series 2021, Ref. RB | 4.13% | 02/15/2041 | 3,325 | 2,696,820 | ||
| Arlington Higher Education Finance Corp. (Newman International Academy); | ||||||
| Series 2016, RB | 5.38% | 08/15/2036 | 3,835 | 3,850,699 | ||
| Series 2021, RB | 5.00% | 08/15/2041 | 900 | 849,824 | ||
| Arlington Higher Education Finance Corp. (Odyssey Academy, Inc.); Series 2023 A, RB(e) | 5.25% | 02/15/2033 | 1,950 | 2,018,899 | ||
| Arlington Higher Education Finance Corp. (UME Preparatory Academy); Series 2017 A, RB | 4.55% | 08/15/2028 | 410 | 411,250 | ||
| Arlington Higher Education Finance Corp. (Winfree Academy Charter School); Series 2019, Ref. RB | 5.15% | 08/15/2029 | 1,055 | 1,069,801 | ||
| Austin (City of), TX; Series 2014, RB(f) | 5.00% | 11/15/2044 | 4,000 | 4,001,366 | ||
| Austin (City of), TX (Travis, Williamson and Hays Counties); Series 2017 B, RB(f) | 5.00% | 11/15/2046 | 4,500 | 4,560,421 | ||
| 14 | Invesco Short Duration High Yield Municipal Fund |
| Interest Rate | Maturity Date | Principal Amount (000) | Value | ||
| Texas–(continued) | |||||
| Bexar County Health Facilities Development Corp. (Army Retirement Residence Foundation); | |||||
| Series 2016, Ref. RB | 5.00% | 07/15/2026 | $ 250 | $ 250,912 | |
| Series 2018, Ref. RB | 5.00% | 07/15/2026 | 1,000 | 1,003,650 | |
| Series 2018, Ref. RB | 5.00% | 07/15/2033 | 1,630 | 1,636,721 | |
| Brazoria County Industrial Development Corp. (Gladieux Metals Recycling LLC); | |||||
| Series 2019, RB(f) | 7.00% | 03/01/2039 | 385 | 378,478 | |
| Series 2019, RB(e)(f) | 9.00% | 03/01/2039 | 2,035 | 2,141,239 | |
| Calhoun (County of), TX Navigation Industrial Development Authority (Max Midstream Texas LLC); Series 2021, RN(e)(f) | 3.63% | 07/01/2026 | 3,800 | 3,227,352 | |
| Clifton Higher Education Finance Corp. (International Leadership of Texas); Series 2018 D, RB | 5.75% | 08/15/2033 | 2,000 | 2,035,878 | |
| Crandall (City of), TX; | |||||
| Series 2021, RB(e) | 4.13% | 09/15/2026 | 100 | 99,732 | |
| Series 2021, RB(e) | 4.75% | 09/15/2031 | 100 | 100,858 | |
| Series 2021, RB(e) | 5.25% | 09/15/2051 | 500 | 498,263 | |
| Gulf Coast Industrial Development Authority; Series 1998, RB(f) | 8.00% | 04/01/2028 | 340 | 340,430 | |
| Houston (City of), TX; | |||||
| Series 2011, Ref. RB(f) | 6.50% | 07/15/2030 | 1,450 | 1,452,054 | |
| Series 2014 D, Ref. RB | 5.00% | 11/15/2044 | 2,000 | 2,006,271 | |
| Series 2015 B-1, RB(f) | 5.00% | 07/15/2030 | 5,000 | 5,032,437 | |
| Series 2015 B-1, RB(f) | 5.00% | 07/15/2035 | 7,700 | 7,731,950 | |
| Houston (City of), TX Airport System (United Airlines, Inc. Terminal E); | |||||
| Series 2014, Ref. RB(f) | 5.00% | 07/01/2029 | 1,500 | 1,500,465 | |
| Series 2020 A, Ref. RB(f) | 5.00% | 07/01/2027 | 2,325 | 2,375,768 | |
| Houston Higher Education Finance Corp. (Houston Baptist University); Series 2021, RB | 3.38% | 10/01/2037 | 700 | 597,658 | |
| Mesquite Health Facilities Development Corp. (Christian Care Centers, Inc.); Series 2016, Ref. RB(b) | 5.00% | 02/15/2035 | 220 | 2,200 | |
| Mission Economic Development Corp. (Natgasoline); Series 2018, Ref. RB(e)(f) | 4.63% | 10/01/2031 | 7,500 | 7,510,776 | |
| New Hope Cultural Education Facilities Finance Corp. (Carillon Lifecare Community); | |||||
| Series 2016, Ref. RB | 4.00% | 07/01/2028 | 2,375 | 2,237,741 | |
| Series 2016, Ref. RB | 5.00% | 07/01/2036 | 3,950 | 3,643,704 | |
| New Hope Cultural Education Facilities Finance Corp. (Cumberland Academy); Series 2020 A, RB(e) | 4.00% | 08/15/2030 | 4,805 | 4,700,327 | |
| New Hope Cultural Education Facilities Finance Corp. (Forefront Living San Antonio - Bella Vida at LA Cantera)); Series 2023, RN(e) | 12.00% | 12/01/2028 | 4,000 | 4,682,209 | |
| New Hope Cultural Education Facilities Finance Corp. (Legacy Preparatory Charter Academy); Series 2018 A, RB(e) | 6.00% | 08/15/2037 | 1,000 | 1,024,303 | |
| New Hope Cultural Education Facilities Finance Corp. (Morningside Ministries); Series 2022, Ref. RB | 4.00% | 01/01/2032 | 1,500 | 1,366,549 | |
| New Hope Cultural Education Facilities Finance Corp. (MRC Senior Living-The Langford); Series 2016 A, RB | 5.38% | 11/15/2036 | 1,165 | 1,067,585 | |
| New Hope Cultural Education Facilities Finance Corp. (Outlook at Windhaven (The)); | |||||
| Series 2022 B3, RB | 4.25% | 10/01/2026 | 1,100 | 1,100,004 | |
| Series 2022, RB | 5.50% | 10/01/2027 | 2,500 | 2,494,988 | |
| New Hope Cultural Education Facilities Finance Corp. (Presbyterian Village North); Series 2018, Ref. RB | 5.00% | 10/01/2039 | 1,000 | 963,046 | |
| Port Arthur (Port of), TX Navigation District; Series 2010, Ref. VRD RB(l) | 2.65% | 04/01/2040 | 3,000 | 3,000,000 | |
| Port Beaumont Navigation District (Jefferson Gulf Coast Energy); | |||||
| Series 2021, RB(e)(f) | 2.50% | 01/01/2030 | 2,150 | 2,005,409 | |
| Series 2021, RB(e)(f) | 2.63% | 01/01/2031 | 800 | 742,841 | |
| Series 2024, RB(e)(f) | 5.00% | 01/01/2039 | 1,000 | 1,064,336 | |
| Red River Health Facilities Development Corp. (MRC Crossing); Series 2014 A, RB(h) | 6.75% | 11/15/2024 | 50 | 50,327 | |
| Rowlett (City of), TX (Bayside Public Improvement District North Improvement Area); | |||||
| Series 2016, RB | 4.90% | 09/15/2024 | 60 | 59,992 | |
| Series 2016, RB | 5.38% | 09/15/2030 | 665 | 667,874 | |
| San Antonio (City of), TX; Series 2024 A, RB | 5.00% | 02/01/2041 | 2,215 | 2,482,970 | |
| Tarrant County Cultural Education Facilities Finance Corp. (C.C. Young Memorial Home); | |||||
| Series 2017 A, RB (Acquired 12/15/2016; Cost $1,011,589)(b)(c) | 6.00% | 02/15/2031 | 1,000 | 550,000 | |
| Series 2017, RB (Acquired 11/05/2019; Cost $3,271,528)(b)(c) | 6.38% | 02/15/2041 | 3,000 | 1,650,000 | |
| Tarrant County Cultural Education Facilities Finance Corp. (MRC Stevenson Oaks); | |||||
| Series 2020, Ref. RB | 4.00% | 11/15/2027 | 575 | 556,177 | |
| Series 2020, Ref. RB | 6.25% | 11/15/2031 | 1,000 | 989,071 | |
| 15 | Invesco Short Duration High Yield Municipal Fund |
| Interest Rate | Maturity Date | Principal Amount (000) | Value | ||
| Texas–(continued) | |||||
| Tarrant County Cultural Education Facilities Finance Corp. (Stayton at Museum Way); Series 2020 A, RB (Acquired 09/14/2021; Cost $2,474,779)(b)(c) | 5.75% | 12/01/2054 | $ 2,355 | $ 1,483,547 | |
| Tarrant County Cultural Education Facilities Finance Corp. (Trinity Terrace Project); Series 2024, Ref. RB | 5.00% | 10/01/2044 | 1,375 | 1,476,267 | |
| Texas Private Activity Bond Surface Transportation Corp. (Blueridge Transportation Group, LLC SH 288 Toll Lanes); Series 2016, RB(f) | 5.00% | 12/31/2040 | 2,065 | 2,080,037 | |
| Ysleta Independent School District Public Facility Corp.; Series 2001, Ref. RB (INS - AMBAC)(d) | 5.38% | 11/15/2024 | 15 | 15,054 | |
| 112,237,398 | |||||
| Utah–2.72% | |||||
| Black Desert Public Infrastructure District; | |||||
| Series 2021 A, GO Bonds(e) | 3.25% | 03/01/2031 | 1,050 | 1,000,425 | |
| Series 2021 A, GO Bonds(e) | 3.50% | 03/01/2036 | 1,750 | 1,607,302 | |
| Firefly Public Infrastructure District No. 1 (Firefly Assessment Area No.1); Series 2024, RB(e) | 5.63% | 12/01/2043 | 2,000 | 2,075,461 | |
| Mida Golf and Equestrian Center Public Infrastructure District; | |||||
| Series 2021, GO Bonds(e) | 4.25% | 06/01/2041 | 2,205 | 1,870,743 | |
| Series 2021, GO Bonds(e) | 4.50% | 06/01/2051 | 2,500 | 2,001,056 | |
| Mida Mountain Village Public Infrastructure District; | |||||
| Series 2020 A, RB(e) | 4.25% | 08/01/2035 | 1,645 | 1,632,150 | |
| Series 2020 A, RB(e) | 4.50% | 08/01/2040 | 1,205 | 1,179,986 | |
| Military Installation Development Authority; Series 2021 A-2, RB | 4.00% | 06/01/2041 | 1,250 | 1,124,728 | |
| Olympia Public Infrastructure District No. 1; Series 2024 A-2, RB(e) | 5.13% | 12/01/2029 | 4,000 | 4,096,598 | |
| Sienna Hills Public Infrastructure District No. 1; Series 2023 A, GO Bonds(e) | 6.75% | 07/01/2035 | 2,500 | 2,559,541 | |
| UIPA Crossroads Public Infrastructure District; Series 2021, RB(e) | 4.13% | 06/01/2041 | 3,000 | 2,919,279 | |
| Utah (State of) Charter School Finance Authority (Ascent Academies of Utah); | |||||
| Series 2022, RB(e) | 4.25% | 06/15/2027 | 1,395 | 1,368,746 | |
| Series 2022, RB(e) | 4.50% | 06/15/2032 | 2,000 | 1,918,596 | |
| Series 2022, RB(e) | 5.00% | 06/15/2037 | 2,515 | 2,459,074 | |
| Utah (State of) Charter School Finance Authority (Freedom Academy Foundation (The)); Series 2017, Ref. RB(e) | 4.50% | 06/15/2027 | 110 | 108,886 | |
| Utah (State of) Charter School Finance Authority (Merit Preparatory Academy); | |||||
| Series 2019 A, RB(e) | 4.50% | 06/15/2029 | 500 | 490,278 | |
| Series 2019 A, RB(e) | 5.00% | 06/15/2034 | 1,270 | 1,252,527 | |
| Wohali Public Infrastructure District No. 1 (Wohali Assessment Area #1); Series 2023, RB(e) | 7.00% | 12/01/2042 | 3,000 | 3,046,135 | |
| 32,711,511 | |||||
| Virginia–0.67% | |||||
| Peninsula Town Center Community Development Authority; Series 2018, Ref. RB(e) | 4.50% | 09/01/2028 | 1,195 | 1,212,121 | |
| Roanoke (County of), VA Economic Development Authority; Series 2024, Ref. RB(a) | 5.50% | 09/01/2035 | 355 | 353,991 | |
| Virginia (Commonwealth of) Small Business Financing Authority (Covanta); Series 2018, RB(a)(e)(f) | 5.00% | 07/01/2038 | 2,310 | 2,310,152 | |
| Virginia Beach Development Authority (Westminster-Canterbury on Chesapeake Bay); Series 2023 B-3, RB | 5.38% | 09/01/2029 | 4,000 | 4,162,077 | |
| 8,038,341 | |||||
| Washington–1.37% | |||||
| Kalispel Tribe of Indians; Series 2018 B, RB(e) | 5.00% | 01/01/2032 | 100 | 103,654 | |
| Kelso (City of), WA Housing Authority (Chinook & Columbia Apartments); Series 1998, RB | 5.60% | 03/01/2028 | 85 | 85,023 | |
| King (County of), WA Housing Authority (Rural Preservation); Series 1997, RB(f) | 5.75% | 01/01/2028 | 5 | 5,015 | |
| King (County of), WA Public Hospital District No. 4; Series 2015 A, RB | 6.25% | 12/01/2045 | 1,700 | 1,704,413 | |
| Port of Seattle Industrial Development Corp. (Delta Airlines); Series 2012, Ref. RB(f) | 5.00% | 04/01/2030 | 6,475 | 6,476,808 | |
| Seattle (Port of), WA; Series 2024 B, Ref. RB(f) | 5.25% | 07/01/2041 | 3,500 | 3,837,067 | |
| Washington (State of) Housing Finance Commission (Bayview Manor Homes); Series 2016 A, Ref. RB(e) | 4.00% | 07/01/2026 | 240 | 235,967 | |
| Washington (State of) Housing Finance Commission (Presbyterian Retirement Co.); Series 2016, Ref. RB(e) | 5.00% | 01/01/2036 | 1,755 | 1,731,013 | |
| Washington (State of) Housing Finance Commission (Spokane International Academy); Series 2021 A, RB(e) | 4.00% | 07/01/2040 | 1,640 | 1,502,426 | |
| Washington (State of) Housing Finance Commission (The Hearthstone); Series 2018 A, Ref. RB(e) | 4.50% | 07/01/2028 | 760 | 720,968 | |
| 16,402,354 | |||||
| 16 | Invesco Short Duration High Yield Municipal Fund |
| Interest Rate | Maturity Date | Principal Amount (000) | Value | |||
| West Virginia–0.49% | ||||||
| Harrison (County of), WV County Commission (Charles Pointe Economic Opportunity Development District); Series 2019 A, RB(b)(e) | 5.75% | 06/01/2042 | $ 1,000 | $ 701,520 | ||
| Monogalia (County of), WV (Development Disctict No. 4 - University Town Centre); Series 2023, Ref. RB(e) | 5.75% | 06/01/2043 | 1,000 | 1,078,717 | ||
| Monongalia (County of), WV Building Commission (Monongalia Health System Obligated Group); | ||||||
| Series 2015, Ref. RB | 5.00% | 07/01/2026 | 1,000 | 1,008,732 | ||
| Series 2015, Ref. RB | 4.00% | 07/01/2035 | 190 | 171,616 | ||
| Monongalia (County of), WV Commission Special District (University Town Centre Economic Opportunity Development District); Series 2017 A, Ref. RB(e) | 4.50% | 06/01/2027 | 1,925 | 1,944,032 | ||
| West Virginia (State of) Economic Development Authority (Entsorga West Virginia LLC); | ||||||
| Series 2016, RB(b)(e)(f) | 6.75% | 02/01/2026 | 1,000 | 700,000 | ||
| Series 2018, RB(b)(e)(f) | 8.75% | 02/01/2036 | 320 | 256,000 | ||
| 5,860,617 | ||||||
| Wisconsin–5.01% | ||||||
| Lomira (Village of), WI Community Development Authority; | ||||||
| Series 2018 B, Ref. RB | 3.65% | 10/01/2028 | 705 | 702,140 | ||
| Series 2018 B, Ref. RB | 3.75% | 10/01/2029 | 175 | 171,248 | ||
| Wisconsin (State of) Health & Educational Facilities Authority (Benevolent Corp. Cedar Community); Series 2017, Ref. RB | 5.00% | 06/01/2028 | 1,205 | 1,222,978 | ||
| Wisconsin (State of) Health & Educational Facilities Authority (Dickson Hollow Phase II); Series 2024, RB | 6.00% | 10/01/2044 | 300 | 315,024 | ||
| Wisconsin (State of) Public Finance Authority; | ||||||
| Series 2022 B, RB(e) | 7.00% | 02/01/2028 | 700 | 702,814 | ||
| Series 2022, RB(e) | 5.38% | 06/01/2037 | 670 | 687,399 | ||
| Series 2023 A, Ref. RB(e) | 5.75% | 10/01/2043 | 1,775 | 1,855,608 | ||
| Series 2024, RB(e) | 5.50% | 12/15/2028 | 4,800 | 4,828,549 | ||
| Series 2024, RB(e) | 12.00% | 05/16/2029 | 1,315 | 1,336,266 | ||
| Wisconsin (State of) Public Finance Authority (Alabama Proton Therapy Center); Series 2017 A, RB (Acquired 12/01/2017; Cost $2,000,000)(c)(e) | 6.25% | 10/01/2031 | 2,000 | 200,000 | ||
| Wisconsin (State of) Public Finance Authority (Alamance Community School); Series 2021 A, RB(e) | 5.00% | 06/15/2041 | 510 | 479,582 | ||
| Wisconsin (State of) Public Finance Authority (American Dream at Meadowlands); | ||||||
| Series 2017, RB(b)(e) | 6.25% | 08/01/2027 | 500 | 450,000 | ||
| Series 2017, RB(b)(e) | 6.75% | 08/01/2031 | 500 | 440,000 | ||
| Wisconsin (State of) Public Finance Authority (Ascend Leadership Academy); | ||||||
| Series 2021 A, RB(e) | 4.25% | 06/15/2031 | 550 | 505,318 | ||
| Series 2021 A, RB(e) | 5.00% | 06/15/2041 | 615 | 553,456 | ||
| Wisconsin (State of) Public Finance Authority (Community School of Davidson); Series 2018, RB | 5.00% | 10/01/2033 | 360 | 365,687 | ||
| Wisconsin (State of) Public Finance Authority (Delray Beach Radiation Therapy Center); Series 2017 A, RB (Acquired 04/03/2017; Cost $1,500,000)(b)(c)(e) | 5.75% | 11/01/2024 | 1,500 | 825,000 | ||
| Wisconsin (State of) Public Finance Authority (Explore Academy); | ||||||
| Series 2020 A, RB(e) | 6.13% | 02/01/2039 | 4,310 | 4,246,962 | ||
| Series 2020, RB(e) | 7.00% | 02/01/2025 | 90 | 90,031 | ||
| Series 2022 A, RB(e) | 6.13% | 02/01/2039 | 4,175 | 4,113,936 | ||
| Wisconsin (State of) Public Finance Authority (Indigo); Series 2023, RB(e)(g) | 0.00% | 12/01/2028 | 6,000 | 4,313,945 | ||
| Wisconsin (State of) Public Finance Authority (Lariat); Series 2023, RB(e)(g) | 0.00% | 09/01/2029 | 3,000 | 2,122,049 | ||
| Wisconsin (State of) Public Finance Authority (Mallard Creek Stem Academy); Series 2019 A, RB(e) | 4.38% | 06/15/2029 | 1,280 | 1,270,391 | ||
| Wisconsin (State of) Public Finance Authority (Miami Worldcenter); Series 2024 A, RB(e) | 5.00% | 06/01/2041 | 2,300 | 2,346,410 | ||
| Wisconsin (State of) Public Finance Authority (Million Air Two LLC General Aviation Facilities); | ||||||
| Series 2017 A, RB(f) | 7.25% | 06/01/2035 | 3,800 | 3,956,014 | ||
| Series 2017, Ref. RB(e)(f) | 7.13% | 06/01/2041 | 150 | 154,853 | ||
| Wisconsin (State of) Public Finance Authority (North Carolina Leadership Academy); | ||||||
| Series 2019, RB(e) | 5.00% | 06/15/2039 | 440 | 440,338 | ||
| Series 2019, RB(e) | 5.00% | 06/15/2049 | 540 | 520,636 | ||
| Wisconsin (State of) Public Finance Authority (Proton International); | ||||||
| Series 2021 A, RB(e) | 5.50% | 01/01/2031 | 5,375 | 4,781,407 | ||
| Series 2021 A, RB(e) | 6.50% | 01/01/2041 | 3,110 | 2,509,965 | ||
| Wisconsin (State of) Public Finance Authority (Quality Education Academy); Series 2023, RB(e) | 6.00% | 07/15/2043 | 690 | 744,524 | ||
| Wisconsin (State of) Public Finance Authority (Rans-Bridgewater); Series 2024, RB(e) | 5.63% | 12/15/2030 | 5,000 | 5,017,274 | ||
| Wisconsin (State of) Public Finance Authority (Rans-Elevon); Series 2024, RB(e) | 5.00% | 07/15/2030 | 3,000 | 3,015,300 | ||
| 17 | Invesco Short Duration High Yield Municipal Fund |
| Interest Rate | Maturity Date | Principal Amount (000) | Value | ||
| Wisconsin–(continued) | |||||
| Wisconsin (State of) Public Finance Authority (Roseman University of Health Sciences); Series 2022, RB(e)(h) | 4.00% | 04/01/2032 | $ 10 | $ 10,496 | |
| Wisconsin (State of) Public Finance Authority (Searstone CCRC); Series 2021 A, Ref. RB(e) | 4.00% | 06/01/2036 | 1,500 | 1,415,041 | |
| Wisconsin (State of) Public Finance Authority (Signorelli); Series 2024, RB(e) | 5.38% | 12/15/2032 | 2,000 | 2,005,990 | |
| Wisconsin (State of) Public Finance Authority (Uwharrie Charter Academy); Series 2022 A, RB(e) | 4.50% | 06/15/2032 | 500 | 512,179 | |
| Wisconsin (State of) Public Finance Authority (Wittenberg University); Series 2016, RB(e) | 5.25% | 12/01/2039 | 1,000 | 919,103 | |
| 60,147,913 | |||||
| Total Municipal Obligations (Cost $1,194,357,750) | 1,175,085,306 | ||||
| U.S. Dollar Denominated Bonds & Notes–0.15% | |||||
| California–0.07% | |||||
| CalPlant I LLC; Exit Facility(e) | 15.00% | 07/01/2025 | 770 | 786,170 | |
| Puerto Rico–0.08% | |||||
| AES Puerto Rico, Inc.(m) | 12.50% | 03/04/2026 | 1,057 | 1,024,841 | |
| Total U.S. Dollar Denominated Bonds & Notes (Cost $1,802,642) | 1,811,011 | ||||
| Shares | |||||
| Exchange-Traded Funds–0.08% | |||||
| Invesco Municipal Strategic Income ETF (Cost $872,610)(o) | 17,000 | 873,372 | |||
| Common Stocks & Other Equity Interests–0.00% | |||||
| Resolute Forest Products, Inc. (Cost $9,595)(m) | 6,757 | 9,595 | |||
| Preferred Stocks–0.00% | |||||
| AES Puerto Rico, Inc., Pfd. (Cost $0)(m) | 100,023 | 0 | |||
| TOTAL INVESTMENTS IN SECURITIES(p)–98.12% (Cost $1,197,042,597) | 1,177,779,284 | ||||
| FLOATING RATE NOTE OBLIGATIONS–(0.17)% | |||||
| Notes with interest and fee rate of 3.48% at 08/31/2024 and contractual maturities of collateral ranging from 06/15/2029 to 06/15/2030 (See Note 1J)(q) | (2,000,000) | ||||
| OTHER ASSETS LESS LIABILITIES–2.05% | 24,619,314 | ||||
| NET ASSETS–100.00% | $1,200,398,598 | ||||
| AGC | – Assured Guaranty Corp. |
| AGM | – Assured Guaranty Municipal Corp. |
| AMBAC | – American Municipal Bond Assurance Corp. |
| BAM | – Build America Mutual Assurance Co. |
| CEP | – Credit Enhancement Provider |
| COP | – Certificates of Participation |
| ETF | – Exchange-Traded Fund |
| GNMA | – Government National Mortgage Association |
| GO | – General Obligation |
| IDR | – Industrial Development Revenue Bonds |
| INS | – Insurer |
| LOC | – Letter of Credit |
| NATL | – National Public Finance Guarantee Corp. |
| Pfd. | – Preferred |
| RB | – Revenue Bonds |
| Ref. | – Refunding |
| RN | – Revenue Notes |
| SGI | – Syncora Guarantee, Inc. |
| VRD | – Variable Rate Demand |
| Wts. | – Warrants |
| 18 | Invesco Short Duration High Yield Municipal Fund |
| (a) | Security has an irrevocable call by the issuer or mandatory put by the holder. Maturity date reflects such call or put. |
| (b) | Defaulted security. Currently, the issuer is in default with respect to principal and/or interest payments. The aggregate value of these securities at August 31, 2024 was $19,723,388, which represented 1.64% of the Fund’s Net Assets. |
| (c) | Restricted security. The aggregate value of these securities at August 31, 2024 was $26,943,661, which represented 2.24% of the Fund’s Net Assets. |
| (d) | Principal and/or interest payments are secured by the bond insurance company listed. |
| (e) | Security purchased or received in a transaction exempt from registration under the Securities Act of 1933, as amended (the “1933 Act”). The security may be resold pursuant to an exemption from registration under the 1933 Act, typically to qualified institutional buyers. The aggregate value of these securities at August 31, 2024 was $354,798,348, which represented 29.56% of the Fund’s Net Assets. |
| (f) | Security subject to the alternative minimum tax. |
| (g) | Zero coupon bond issued at a discount. |
| (h) | Advance refunded; secured by an escrow fund of U.S. Government obligations or other highly rated collateral. |
| (i) | Security is subject to a reimbursement agreement which may require the Fund to pay amounts to a counterparty in the event of a significant decline in the market value of the security underlying the TOB Trusts. In case of a shortfall, the maximum potential amount of payments the Fund could ultimately be required to make under the agreement is $2,000,000. However, such shortfall payment would be reduced by the proceeds from the sale of the security underlying the TOB Trusts. |
| (j) | Underlying security related to TOB Trusts entered into by the Fund. See Note 1J. |
| (k) | Principal and interest payments are fully enhanced by a letter of credit from the bank listed or a predecessor bank, branch or subsidiary. |
| (l) | Demand security payable upon demand by the Fund at specified time intervals no greater than thirteen months. Interest rate is redetermined periodically by the issuer or agent based on current market conditions. Rate shown is the rate in effect on August 31, 2024. |
| (m) | Security valued using significant unobservable inputs (Level 3). See Note 3. |
| (n) | The issuer is paying less than stated interest, but is not in default on principal because scheduled principal payments have not yet begun. |
| (o) | Affiliated holding. Affiliated holdings are investments in entities which are under common ownership or control of Invesco Ltd. or are investments in entities in which the Fund owns 5% or more of the outstanding voting securities. The table below shows the Fund’s transactions in, and earnings from, its investments in affiliates for the fiscal year ended August 31, 2024. |
| Value August 31, 2023 | Purchases at Cost | Proceeds from Sales | Change in Unrealized Appreciation | Realized Gain | Value August 31, 2024 | Dividend Income | |
| Invesco Municipal Strategic Income ETF | $- | $872,610 | $- | $762 | $- | $873,372 | $- |
| (p) | Entities may either issue, guarantee, back or otherwise enhance the credit quality of a security. The entities are not primarily responsible for the issuer’s obligations but may be called upon to satisfy the issuer’s obligations. No concentration of any single entity was greater than 5% each. |
| (q) | Floating rate note obligations related to securities held. The interest and fee rates shown reflect the rates in effect at August 31, 2024. At August 31, 2024, the Fund’s investments with a value of $3,097,045 are held by TOB Trusts and serve as collateral for the $2,000,000 in the floating rate note obligations outstanding at that date. |
| 19 | Invesco Short Duration High Yield Municipal Fund |
| Assets: | |
| Investments in unaffiliated securities, at value (Cost $1,196,169,987) | $1,176,905,912 |
| Investments in affiliates, at value (Cost $872,610) | 873,372 |
| Cash | 399,266 |
| Receivable for: | |
| Investments sold | 883,000 |
| Fund shares sold | 1,402,181 |
| Interest | 18,071,069 |
| Investments matured, at value (Cost $17,937,819) | 9,796,158 |
| Investment for trustee deferred compensation and retirement plans | 92,595 |
| Other assets | 238,466 |
| Total assets | 1,208,662,019 |
| Liabilities: | |
| Floating rate note obligations | 2,000,000 |
| Payable for: | |
| Investments purchased | 2,747,671 |
| Dividends | 1,558,129 |
| Fund shares reacquired | 1,365,544 |
| Accrued fees to affiliates | 429,487 |
| Accrued interest expense | 19,779 |
| Accrued trustees’ and officers’ fees and benefits | 3,648 |
| Accrued other operating expenses | 46,568 |
| Trustee deferred compensation and retirement plans | 92,595 |
| Total liabilities | 8,263,421 |
| Net assets applicable to shares outstanding | $1,200,398,598 |
| Net assets consist of: | |
| Shares of beneficial interest | $1,731,353,551 |
| Distributable earnings (loss) | (530,954,953) |
| $1,200,398,598 | |
| Net Assets: | |
| Class A | $714,627,537 |
| Class C | $36,506,864 |
| Class Y | $416,347,620 |
| Class R5 | $9,640 |
| Class R6 | $32,906,937 |
| Shares outstanding, no par value, with an unlimited number of shares authorized: | |
| Class A | 74,839,508 |
| Class C | 3,827,944 |
| Class Y | 43,575,781 |
| Class R5 | 1,001 |
| Class R6 | 3,442,370 |
| Class A: | |
| Net asset value per share | $9.55 |
| Maximum offering price per share (Net asset value of $9.55 ÷ 97.50%) | $9.79 |
| Class C: | |
| Net asset value and offering price per share | $9.54 |
| Class Y: | |
| Net asset value and offering price per share | $9.55 |
| Class R5: | |
| Net asset value and offering price per share | $9.63 |
| Class R6: | |
| Net asset value and offering price per share | $9.56 |
| 20 | Invesco Short Duration High Yield Municipal Fund |
| Investment income: | |
| Interest | $64,746,908 |
| Expenses: | |
| Advisory fees | 4,982,671 |
| Administrative services fees | 177,134 |
| Custodian fees | 18,132 |
| Distribution fees: | |
| Class A | 1,840,133 |
| Class C | 454,577 |
| Interest, facilities and maintenance fees | 1,094,133 |
| Transfer agent fees — A, C and Y | 1,010,457 |
| Transfer agent fees — R5 | 1 |
| Transfer agent fees — R6 | 4,921 |
| Trustees’ and officers’ fees and benefits | 32,853 |
| Registration and filing fees | 150,528 |
| Reports to shareholders | 143,655 |
| Professional services fees | 424,735 |
| Other | 29,715 |
| Total expenses | 10,363,645 |
| Less: Expense offset arrangement(s) | (7,062) |
| Net expenses | 10,356,583 |
| Net investment income | 54,390,325 |
| Realized and unrealized gain (loss) from: | |
| Net realized gain (loss) from: | |
| Unaffiliated investment securities (includes net gains (losses) from securities sold to affiliates of $(1,100,519)) | (11,739,511) |
| Futures contracts | (1,270,289) |
| (13,009,800) | |
| Change in net unrealized appreciation of: | |
| Unaffiliated investment securities | 58,718,499 |
| Affiliated investment securities | 762 |
| 58,719,261 | |
| Net realized and unrealized gain | 45,709,461 |
| Net increase in net assets resulting from operations | $100,099,786 |
| 21 | Invesco Short Duration High Yield Municipal Fund |
| 2024 | 2023 | |
| Operations: | ||
| Net investment income | $54,390,325 | $55,242,617 |
| Net realized gain (loss) | (13,009,800) | (157,711,622) |
| Change in net unrealized appreciation | 58,719,261 | 96,108,524 |
| Net increase (decrease) in net assets resulting from operations | 100,099,786 | (6,360,481) |
| Distributions to shareholders from distributable earnings: | ||
| Class A | (30,048,279) | (31,652,194) |
| Class C | (1,499,517) | (1,959,484) |
| Class Y | (18,131,043) | (17,991,536) |
| Class R5 | (412) | (105,308) |
| Class R6 | (1,438,598) | (1,365,023) |
| Total distributions from distributable earnings | (51,117,849) | (53,073,545) |
| Share transactions–net: | ||
| Class A | (98,445,773) | (94,739,187) |
| Class C | (20,598,794) | (18,531,139) |
| Class Y | (15,021,898) | (63,922,605) |
| Class R5 | (33) | (9,611,316) |
| Class R6 | (3,369,282) | 5,479,781 |
| Net increase (decrease) in net assets resulting from share transactions | (137,435,780) | (181,324,466) |
| Net increase (decrease) in net assets | (88,453,843) | (240,758,492) |
| Net assets: | ||
| Beginning of year | 1,288,852,441 | 1,529,610,933 |
| End of year | $1,200,398,598 | $1,288,852,441 |
| 22 | Invesco Short Duration High Yield Municipal Fund |
| Net asset value, beginning of period | Net investment income(a) | Net gains (losses) on securities (both realized and unrealized) | Total from investment operations | Dividends from net investment income | Net asset value, end of period | Total return(b) | Net assets, end of period (000’s omitted) | Ratio of expenses to average net assets with fee waivers and/or expenses absorbed | Ratio of expenses to average net assets without fee waivers and/or expenses absorbed | Supplemental ratio of expenses to average net assets with fee waivers (excluding interest, facilities and maintenance fees) | Ratio of net investment income to average net assets | Portfolio turnover (c) | |
| Class A | |||||||||||||
| Year ended 08/31/24 | $9.18 | $0.40 | $0.35 | $0.75 | $(0.38) | $9.55 | 8.33% | $714,628 | 0.90% | 0.90% | 0.81% | 4.32% | 29% |
| Year ended 08/31/23 | 9.58 | 0.36 | (0.41) | (0.05) | (0.35) | 9.18 | (0.54) | 784,122 | 0.91 | 0.91 | 0.81 | 3.86 | 33 |
| Year ended 08/31/22 | 10.67 | 0.32 | (1.06) | (0.74) | (0.35) | 9.58 | (7.07) | 914,354 | 0.84 | 0.84 | 0.77 | 3.13 | 26 |
| Year ended 08/31/21 | 10.17 | 0.34 | 0.51 | 0.85 | (0.35) | 10.67 | 8.50 | 933,441 | 0.86 | 0.86 | 0.79 | 3.25 | 19 |
| Year ended 08/31/20 | 10.86 | 0.37 | (0.71) | (0.34) | (0.35) | 10.17 | (3.19) | 826,655 | 0.84 | 0.88 | 0.79 | 3.59 | 49 |
| Class C | |||||||||||||
| Year ended 08/31/24 | 9.17 | 0.33 | 0.35 | 0.68 | (0.31) | 9.54 | 7.53 | 36,507 | 1.65 | 1.65 | 1.56 | 3.57 | 29 |
| Year ended 08/31/23 | 9.56 | 0.29 | (0.40) | (0.11) | (0.28) | 9.17 | (1.19) | 55,464 | 1.66 | 1.66 | 1.56 | 3.11 | 33 |
| Year ended 08/31/22 | 10.65 | 0.24 | (1.06) | (0.82) | (0.27) | 9.56 | (7.79) | 76,878 | 1.59 | 1.59 | 1.52 | 2.38 | 26 |
| Year ended 08/31/21 | 10.16 | 0.26 | 0.50 | 0.76 | (0.27) | 10.65 | 7.60 | 92,982 | 1.61 | 1.61 | 1.54 | 2.50 | 19 |
| Year ended 08/31/20 | 10.84 | 0.29 | (0.70) | (0.41) | (0.27) | 10.16 | (3.84) | 167,426 | 1.59 | 1.63 | 1.54 | 2.84 | 49 |
| Class Y | |||||||||||||
| Year ended 08/31/24 | 9.19 | 0.42 | 0.34 | 0.76 | (0.40) | 9.55 | 8.48 | 416,348 | 0.65 | 0.65 | 0.56 | 4.57 | 29 |
| Year ended 08/31/23 | 9.58 | 0.38 | (0.40) | (0.02) | (0.37) | 9.19 | (0.18) | 414,180 | 0.66 | 0.66 | 0.56 | 4.11 | 33 |
| Year ended 08/31/22 | 10.67 | 0.34 | (1.06) | (0.72) | (0.37) | 9.58 | (6.84) | 497,651 | 0.59 | 0.59 | 0.52 | 3.38 | 26 |
| Year ended 08/31/21 | 10.18 | 0.37 | 0.50 | 0.87 | (0.38) | 10.67 | 8.66 | 365,892 | 0.61 | 0.61 | 0.54 | 3.50 | 19 |
| Year ended 08/31/20 | 10.87 | 0.40 | (0.72) | (0.32) | (0.37) | 10.18 | (2.94) | 280,243 | 0.59 | 0.63 | 0.54 | 3.84 | 49 |
| Class R5 | |||||||||||||
| Year ended 08/31/24 | 9.25 | 0.44 | 0.35 | 0.79 | (0.41) | 9.63 | 8.73 | 10 | 0.58 | 0.58 | 0.49 | 4.64 | 29 |
| Year ended 08/31/23 | 9.60 | 0.39 | (0.37) | 0.02 | (0.37) | 9.25 | 0.25 | 9 | 0.68 | 0.68 | 0.58 | 4.10 | 33 |
| Year ended 08/31/22 | 10.70 | 0.35 | (1.08) | (0.73) | (0.37) | 9.60 | (6.93) | 9,800 | 0.62 | 0.62 | 0.55 | 3.35 | 26 |
| Year ended 08/31/21 | 10.20 | 0.37 | 0.51 | 0.88 | (0.38) | 10.70 | 8.78 | 14,437 | 0.61 | 0.61 | 0.54 | 3.50 | 19 |
| Year ended 08/31/20 | 10.88 | 0.40 | (0.71) | (0.31) | (0.37) | 10.20 | (2.83) | 10 | 0.57 | 0.57 | 0.52 | 3.86 | 49 |
| Class R6 | |||||||||||||
| Year ended 08/31/24 | 9.19 | 0.43 | 0.35 | 0.78 | (0.41) | 9.56 | 8.68 | 32,907 | 0.58 | 0.58 | 0.50 | 4.64 | 29 |
| Year ended 08/31/23 | 9.59 | 0.39 | (0.41) | (0.02) | (0.38) | 9.19 | (0.22) | 35,077 | 0.60 | 0.60 | 0.50 | 4.18 | 33 |
| Year ended 08/31/22 | 10.68 | 0.35 | (1.06) | (0.71) | (0.38) | 9.59 | (6.77) | 30,929 | 0.53 | 0.53 | 0.46 | 3.44 | 26 |
| Year ended 08/31/21 | 10.19 | 0.37 | 0.51 | 0.88 | (0.39) | 10.68 | 8.73 | 20,121 | 0.54 | 0.54 | 0.47 | 3.57 | 19 |
| Year ended 08/31/20 | 10.88 | 0.40 | (0.72) | (0.32) | (0.37) | 10.19 | (2.94) | 12,639 | 0.57 | 0.57 | 0.52 | 3.86 | 49 |
| (a) | Calculated using average shares outstanding. |
| (b) | Includes adjustments in accordance with accounting principles generally accepted in the United States of America and as such, the net asset value for financial reporting purposes and the returns based upon those net asset values may differ from the net asset value and returns for shareholder transactions. Does not include sales charges and is not annualized for periods less than one year, if applicable. |
| (c) | Portfolio turnover is calculated at the fund level and is not annualized for periods less than one year, if applicable. For the year ended August 31, 2020, the portfolio turnover calculation excludes the value of securities purchased of $1,007,963,117 in connection with the acquisition of Invesco Oppenheimer Rochester Short Duration High Yield Municipal Fund into the Fund. |
| 23 | Invesco Short Duration High Yield Municipal Fund |
| A. | Security Valuations – Securities, including restricted securities, are valued according to the following policy. |
| 24 | Invesco Short Duration High Yield Municipal Fund |
| B. | Securities Transactions and Investment Income – Securities transactions are accounted for on a trade date basis. Realized gains or losses on sales are computed on the basis of specific identification of the securities sold. Interest income (net of withholding tax, if any) is recorded on an accrual basis from settlement date and includes coupon interest and amortization of premium and accretion of discount on debt securities as applicable. Pay-in-kind interest income and non-cash dividend income received in the form of securities in lieu of cash are recorded at the fair value of the securities received. Dividend income (net of withholding tax, if any) is recorded on the ex-dividend date. |
| C. | Country Determination — For the purposes of making investment selection decisions and presentation in the Schedule of Investments, the investment adviser may determine the country in which an issuer is located and/or credit risk exposure based on various factors. These factors include the laws of the country under which the issuer is organized, where the issuer maintains a principal office, the country in which the issuer derives 50% or more of its total revenues, the country that has the primary market for the issuer’s securities and its "country of risk" as determined by a third party service provider, as well as other criteria. Among the other criteria that may be evaluated for making this determination are the country in which the issuer maintains 50% or more of its assets, the type of security, financial guarantees and enhancements, the nature of the collateral and the sponsor organization. Country of issuer and/or credit risk exposure has been determined to be the United States of America, unless otherwise noted. |
| D. | Distributions – Distributions from net investment income, if any, are declared daily and paid monthly. Distributions from net realized capital gain, if any, are generally declared and paid annually and recorded on the ex-dividend date. The Fund may elect to treat a portion of the proceeds from redemptions as distributions for federal income tax purposes. |
| E. | Federal Income Taxes — The Fund intends to comply with the requirements of Subchapter M of the Internal Revenue Code of 1986, as amended (the “Internal Revenue Code”), necessary to qualify as a regulated investment company and to distribute substantially all of the Fund’s taxable and tax-exempt earnings to shareholders. As such, the Fund will not be subject to federal income taxes on otherwise taxable income (including net realized capital gain) that is distributed to shareholders. Therefore, no provision for federal income taxes is recorded in the financial statements. |
| F. | Expenses – Fees provided for under the Rule 12b-1 plan of a particular class of the Fund are charged to the operations of such class. Transfer agency fees and expenses and other shareholder recordkeeping fees and expenses attributable to Class R5 and Class R6 are allocated based on relative net assets of Class R5 and Class R6. Sub-accounting fees attributable to Class R5 are charged to the operations of the class. Transfer agency fees and expenses and other shareholder recordkeeping fees and expenses relating to all other classes are allocated among those classes based on relative net assets. All other expenses are allocated among the classes based on the relative value of settled shares. |
| G. | Interest, Facilities and Maintenance Fees – Interest, Facilities and Maintenance Fees include interest and related borrowing costs such as commitment fees, administrative expenses, negative or overdrawn balances on margin accounts and other expenses associated with establishing and maintaining the line of credit. In addition, interest and administrative expenses related to establishing and maintaining floating rate note obligations, if any, are included. |
| H. | Accounting Estimates – The preparation of financial statements in conformity with accounting principles generally accepted in the United States of America (“GAAP”) requires management to make estimates and assumptions that affect the reported amounts of assets and liabilities at the date of the financial statements and the reported amounts of revenues and expenses during the reporting period including estimates and assumptions related to taxation. Actual results could differ from those estimates by a significant amount. In addition, the Fund monitors for material events or transactions that may occur or become known after the period-end date and before the date the financial statements are released to print. |
| I. | Indemnifications – Under the Trust’s organizational documents, each Trustee, officer, employee or other agent of the Trust is indemnified against certain liabilities that may arise out of the performance of their duties to the Fund. Additionally, in the normal course of business, the Fund enters into contracts, including the Fund’s servicing agreements, that contain a variety of indemnification clauses. The Fund’s maximum exposure under these arrangements is unknown as this would involve future claims that may be made against the Fund that have not yet occurred. The risk of material loss as a result of such indemnification claims is considered remote. |
| J. | Floating Rate Note Obligations – The Fund invests in inverse floating rate securities, such as Tender Option Bonds (“TOBs”), for investment purposes and to enhance the yield of the Fund. Such securities may be purchased in the secondary market without first owning an underlying bond but generally are created through the sale of fixed rate bonds by the Fund to special purpose trusts established by a broker dealer or by the Fund (“TOB Trusts”) in exchange for cash and residual interests in the TOB Trusts’ assets and cash flows, which are in the form of inverse floating rate securities. The TOB Trusts finance the purchases of the fixed rate bonds by issuing floating rate notes to third parties and allowing the Fund to retain residual interests in the bonds. The floating rate notes issued by the TOB Trusts have interest rates that reset weekly and the floating rate note holders have the option to tender their notes to the TOB Trusts for redemption at par at each reset date. The residual interests held by the Fund (inverse floating rate securities) include the right of the Fund (1) to cause the holders of the floating rate notes to tender their notes at par at the next interest rate reset date, and (2) to transfer the municipal bond from the TOB Trust to the Fund, thereby collapsing |
| 25 | Invesco Short Duration High Yield Municipal Fund |
| the TOB Trust. Inverse floating rate securities tend to underperform the market for fixed rate bonds in a rising interest rate environment, but tend to outperform the market for fixed rate bonds when interest rates decline or remain relatively stable. |
| K. | Futures Contracts — The Fund may enter into futures contracts to manage exposure to interest rate, equity and market price movements and/or currency risks. A futures contract is an agreement between two parties ("Counterparties") to purchase or sell a specified underlying security, currency or commodity (or delivery of a cash settlement price, in the case of an index future) for a fixed price at a future date. The Fund currently invests only in exchange-traded futures and they are standardized as to maturity date and underlying instrument or asset. Initial margin deposits required upon entering into futures contracts are satisfied by the segregation of specific securities or cash as collateral at the futures commission merchant (broker). During the period the futures contracts are open, changes in the value of the contracts are recognized as unrealized gains or losses by recalculating the value of the contracts on a daily basis. Subsequent or variation margin payments are received or made depending upon whether unrealized gains or losses are incurred. These amounts are reflected as receivables or payables on the Statement of Assets and Liabilities. When the contracts are closed or expire, the Fund recognizes a realized gain or loss equal to the difference between the proceeds from, or cost of, the closing transaction and the Fund’s basis in the contract. The net realized gain (loss) and the change in unrealized gain (loss) on futures contracts held during the period is included on the Statement of Operations. The primary risks associated with futures contracts are market risk and the absence of a liquid secondary market. If the Fund were unable to liquidate a futures contract and/or enter into an offsetting closing transaction, the Fund would continue to be subject to market risk with respect to the value of the contracts and continue to be required to maintain the margin deposits on the futures contracts. Futures contracts have minimal Counterparty risk since the exchange’s clearinghouse, as Counterparty to all exchange-traded futures, guarantees the futures against default. Risks may exceed amounts recognized in the Statement of Assets and Liabilities. |
| L. | Leverage Risk — Leverage exists when the Fund can lose more than it originally invests because it purchases or sells an instrument or enters into a transaction without investing an amount equal to the full economic exposure of the instrument or transaction. |
| M. | Other Risks - The risk of a municipal obligation generally depends on the financial and credit status of the issuer. Constitutional amendments, legislative enactments, executive orders, administrative regulations, voter initiatives, and the issuer’s regional economic conditions may affect the municipal security’s value, interest payments, repayment of principal and the Fund’s ability to sell the security. Failure of a municipal security issuer to comply with applicable tax requirements may make income paid thereon taxable, resulting in a decline in the security’s value. In addition, there could be changes in applicable tax laws or tax treatments that reduce or eliminate the current federal income tax exemption on municipal securities or otherwise adversely affect the current federal or state tax status of municipal securities. |
| 26 | Invesco Short Duration High Yield Municipal Fund |
| Average Daily Net Assets | Rate |
| First $100 million | 0.483% |
| Next $150 million | 0.433% |
| Next $250 million | 0.408% |
| Next $4.5 billion | 0.383% |
| Next $5 billion | 0.373% |
| Over $10 billion | 0.353% |
| 27 | Invesco Short Duration High Yield Municipal Fund |
| Level 1 | Level 2 | Level 3 | Total | |
| Investments in Securities | ||||
| Municipal Obligations | $— | $1,174,987,567 | $97,739 | $1,175,085,306 |
| U.S. Dollar Denominated Bonds & Notes | — | 786,170 | 1,024,841 | 1,811,011 |
| Exchange-Traded Funds | 873,372 | — | — | 873,372 |
| Common Stocks & Other Equity Interests | — | — | 9,595 | 9,595 |
| Preferred Stocks | — | — | 0 | 0 |
| Total Investments in Securities | 873,372 | 1,175,773,737 | 1,132,175 | 1,177,779,284 |
| Other Investments - Assets | ||||
| Investments Matured | — | 7,928,658 | 1,867,500 | 9,796,158 |
| Total Investments | $873,372 | $1,183,702,395 | $2,999,675 | $1,187,575,442 |
| Location of Gain (Loss) on Statement of Operations | |
| Interest Rate Risk | |
| Realized Gain (Loss): | |
| Futures contracts | $(1,270,289) |
| Futures Contracts | |
| Average notional value | $53,464,063 |
| 28 | Invesco Short Duration High Yield Municipal Fund |
| Tax Character of Distributions to Shareholders Paid During the Fiscal Years Ended August 31, 2024 and 2023: | ||
| 2024 | 2023 | |
| Ordinary income* | $1,769,014 | $582,255 |
| Ordinary income-tax-exempt | 49,348,835 | 52,491,290 |
| Total distributions | $51,117,849 | $53,073,545 |
| * | Includes short-term capital gain distributions, if any. |
| Tax Components of Net Assets at Period-End: | |
| 2024 | |
| Undistributed tax-exempt income | $11,347,398 |
| Net unrealized appreciation (depreciation) — investments | (31,317,938) |
| Temporary book/tax differences | (81,997) |
| Capital loss carryforward | (510,902,416) |
| Shares of beneficial interest | 1,731,353,551 |
| Total net assets | $1,200,398,598 |
| Capital Loss Carryforward* | |||
| Expiration | Short-Term | Long-Term | Total |
| Not subject to expiration | $66,803,046 | $444,099,370 | $510,902,416 |
| * | Capital loss carryforward is reduced for limitations, if any, to the extent required by the Internal Revenue Code and may be further limited depending upon a variety of factors, including the realization of net unrealized gains or losses as of the date of any reorganization. |
| Unrealized Appreciation (Depreciation) of Investments on a Tax Basis | |
| Aggregate unrealized appreciation of investments | $31,198,432 |
| Aggregate unrealized (depreciation) of investments | (62,516,370) |
| Net unrealized appreciation (depreciation) of investments | $(31,317,938) |
| 29 | Invesco Short Duration High Yield Municipal Fund |
| Summary of Share Activity | |||||
| Year ended August 31, 2024(a) | Year ended August 31, 2023 | ||||
| Shares | Amount | Shares | Amount | ||
| Sold: | |||||
| Class A | 20,106,640 | $185,963,897 | 30,597,276 | $284,779,360 | |
| Class C | 622,719 | 5,722,821 | 1,583,339 | 14,730,603 | |
| Class Y | 31,396,999 | 287,911,534 | 28,101,189 | 261,582,488 | |
| Class R6 | 1,880,536 | 17,496,690 | 3,201,975 | 29,861,840 | |
| Issued as reinvestment of dividends: | |||||
| Class A | 2,031,706 | 18,899,754 | 2,150,104 | 19,975,198 | |
| Class C | 114,788 | 1,064,983 | 150,504 | 1,396,812 | |
| Class Y | 1,140,961 | 10,635,855 | 1,057,979 | 9,834,306 | |
| Class R5 | - | - | 277 | 2,588 | |
| Class R6 | 106,861 | 995,967 | 107,836 | 1,003,472 | |
| Automatic conversion of Class C shares to Class A shares: | |||||
| Class A | 914,726 | 8,512,056 | 780,861 | 7,266,768 | |
| Class C | (915,903) | (8,512,056) | (781,742) | (7,266,768) | |
| Reacquired: | |||||
| Class A | (33,603,967) | (311,821,480) | (43,626,859) | (406,760,513) | |
| Class C | (2,041,197) | (18,874,542) | (2,943,363) | (27,391,786) | |
| Class Y | (34,040,570) | (313,569,287) | (36,016,747) | (335,339,399) | |
| Class R5 | (3) | (33) | (1,019,575) | (9,613,904) | |
| Class R6 | (2,360,067) | (21,861,939) | (2,720,089) | (25,385,531) | |
| Net increase (decrease) in share activity | (14,645,771) | $(137,435,780) | (19,377,035) | $(181,324,466) | |
| (a) | There are entities that are record owners of more than 5% of the outstanding shares of the Fund and in the aggregate own 48% of the outstanding shares of the Fund. IDI has an agreement with these entities to sell Fund shares. The Fund, Invesco and/or Invesco affiliates may make payments to these entities, which are considered to be related to the Fund, for providing services to the Fund, Invesco and/or Invesco affiliates including but not limited to services such as securities brokerage, distribution, third party record keeping and account servicing. The Fund has no knowledge as to whether all or any portion of the shares owned of record by these entities are also owned beneficially. |
| 30 | Invesco Short Duration High Yield Municipal Fund |
| 31 | Invesco Short Duration High Yield Municipal Fund |
| A. | Nature, Extent and Quality of Services Provided by Invesco Advisers and the Affiliated Sub-Advisers |
| B. | Fund Investment Performance |
| 32 | Invesco Short Duration High Yield Municipal Fund |
| C. | Advisory and Sub-Advisory Fees and Fund Expenses |
| D. | Economies of Scale and Breakpoints |
| E. | Profitability and Financial Resources |
| F. | Collateral Benefits to Invesco Advisers and its Affiliates |
| 33 | Invesco Short Duration High Yield Municipal Fund |
| Federal and State Income Tax | |
| Qualified Dividend Income* | 0.00% |
| Corporate Dividends Received Deduction* | 0.00% |
| U.S. Treasury Obligations* | 0.00% |
| Qualified Business Income* | 0.00% |
| Business Interest Income* | 100.00% |
| Tax-Exempt Interest Dividends* | 96.54% |
| * | The above percentages are based on ordinary income dividends paid to shareholders during the Fund’s fiscal year. |
| 34 | Invesco Short Duration High Yield Municipal Fund |
| 35 | Invesco Short Duration High Yield Municipal Fund |

| Annual Financial Statements and Other Information | August 31, 2024 |
| Interest Rate | Maturity Date | Principal Amount (000) | Value | ||
| Municipal Obligations–98.12% | |||||
| Alabama–1.82% | |||||
| Auburn University; Series 2015 A, Ref. RB | 5.00% | 06/01/2028 | $ 1,000 | $ 1,015,303 | |
| Baldwin (County of), AL Public Building Authority (DHR); Series 2007 A, Revenue Wts. (INS - SGI)(a) | 4.38% | 06/01/2028 | 10 | 10,008 | |
| Black Belt Energy Gas District (The); Series 2024 A, RB(b) | 5.25% | 09/01/2032 | 1,585 | 1,740,049 | |
| Black Belt Energy Gas District (The) (No. 4); Series 2019 A-1, RB(b) | 4.00% | 12/01/2025 | 12,260 | 12,319,699 | |
| Black Belt Energy Gas District (The) (No. 5); Series 2020 A-1, RB(b) | 4.00% | 10/01/2026 | 5,000 | 5,022,385 | |
| Tender Option Bond Trust Receipts/Certificates; Series 2022, VRD RB(c)(d) | 2.80% | 07/01/2025 | 5,000 | 5,000,000 | |
| UAB Medicine Finance Authority; Series 2016 B, Ref. RB | 5.00% | 09/01/2035 | 3,500 | 3,598,482 | |
| 28,705,926 | |||||
| Alaska–0.25% | |||||
| Alaska (State of) International Airports System; Series 2016 A, Ref. RB | 5.00% | 10/01/2028 | 1,465 | 1,493,187 | |
| Matanuska-Susitna (Borough of), AK; Series 2014 B, GO Bonds | 5.00% | 11/01/2026 | 1,000 | 1,000,836 | |
| Northern Tobacco Securitization Corp.; Series 2021 B-1, Ref. RB | 4.00% | 06/01/2050 | 1,460 | 1,476,293 | |
| 3,970,316 | |||||
| Arizona–2.56% | |||||
| Arizona (State of) Game & Fish Department & Commission; Series 2006, RB | 5.00% | 07/01/2032 | 105 | 105,136 | |
| Arizona (State of) Health Facilities Authority (Scottsdale Lincoln Hospital); | |||||
| Series 2014, Ref. RB(b)(e) | 5.00% | 12/01/2024 | 100 | 100,450 | |
| Series 2014, Ref. RB(b)(e) | 5.00% | 12/01/2024 | 2,710 | 2,722,195 | |
| Arizona (State of) Industrial Development Authority; Series 2024, RB(b) | 5.00% | 09/01/2026 | 1,000 | 1,038,615 | |
| Arizona (State of) Industrial Development Authority (Social Bonds); Series 2023, RB | 5.00% | 11/01/2028 | 1,500 | 1,601,724 | |
| Arizona (State of) Industrial Development Authority (Unity at West Glendale); Series 2024, RB(b) | 5.00% | 09/01/2026 | 1,100 | 1,135,324 | |
| Chandler (City of), AZ Industrial Development Authority (Intel Corp.); Series 2022-1, RB(b)(f) | 5.00% | 09/01/2027 | 10,000 | 10,296,191 | |
| Maricopa (County of), AZ Industrial Development Authority (Banner Health Obligated Group); Series 2016, Ref. RB | 5.00% | 01/01/2034 | 2,000 | 2,078,349 | |
| Phoenix Civic Improvement Corp.; | |||||
| Series 2014 B, Ref. RB | 5.00% | 07/01/2027 | 2,565 | 2,568,470 | |
| Series 2016, Ref. RB | 5.00% | 07/01/2033 | 1,500 | 1,553,510 | |
| Series 2017, Ref. RB | 5.00% | 07/01/2038 | 5,145 | 5,307,198 | |
| Pima (County of), AZ; Series 2014, RB | 5.00% | 07/01/2028 | 745 | 746,133 | |
| Pima (County of), AZ Industrial Development Authority (Excalibur Charter School (The)); Series 2016, Ref. RB(c) | 5.00% | 09/01/2026 | 50 | 50,193 | |
| Pima (County of), AZ Industrial Development Authority (Paideia Academies (The)); Series 2019, RB | 4.13% | 07/01/2029 | 155 | 150,986 | |
| Salt River Project Agricultural Improvement & Power District; Series 2015 A, Ref. RB | 5.00% | 12/01/2032 | 5,060 | 5,139,310 | |
| Sun Devil Energy Center LLC (Arizona State University); | |||||
| Series 2008, Ref. RB | 5.00% | 07/01/2027 | 100 | 100,137 | |
| Series 2008, Ref. RB | 5.00% | 07/01/2030 | 155 | 155,193 | |
| University of Arizona (The) (Stimulus Plan for Economic and Educational Development); Series 2014, RB | 5.00% | 08/01/2034 | 920 | 921,417 | |
| University of Arizona Board of Regents; | |||||
| Series 2015 D, RB | 5.00% | 07/01/2030 | 1,450 | 1,475,973 | |
| Series 2016 C, RB | 5.00% | 07/01/2030 | 1,060 | 1,100,086 | |
| Series 2022 B, RB | 5.00% | 07/01/2038 | 1,300 | 1,463,999 | |
| Westpark Community Facility District; Series 2016, Ref. GO Bonds | 4.00% | 07/15/2025 | 340 | 339,880 | |
| Yavapai (County of), AZ Industrial Development Authority; Series 2015 A, Ref. RB(c) | 3.90% | 09/01/2024 | 185 | 185,000 | |
| 40,335,469 | |||||
| Arkansas–0.07% | |||||
| Fort Smith (City of), AR; Series 2015, Ref. RB | 5.00% | 10/01/2030 | 1,130 | 1,149,360 | |
| California–4.45% | |||||
| Anaheim (City of), CA Public Financing Authority (Anaheim Public Improvements); Series 1997 A, RB (INS - AGM)(a) | 6.00% | 09/01/2024 | 1,265 | 1,265,000 | |
| 2 | Invesco Short Term Municipal Fund |
| Interest Rate | Maturity Date | Principal Amount (000) | Value | ||
| California–(continued) | |||||
| Bay Area Toll Authority (San Francisco Bay Area); Series 2024, Ref. VRD RB (LOC - Bank Of America N.A.)(d)(g) | 2.35% | 04/01/2059 | $ 12,450 | $ 12,450,000 | |
| California (State of); | |||||
| Series 2012, Ref. GO Bonds | 5.00% | 09/01/2025 | 10 | 10,017 | |
| Series 2013, Ref. GO Bonds | 5.00% | 10/01/2026 | 5 | 5,010 | |
| Series 2014, Ref. GO Bonds | 5.00% | 10/01/2034 | 9,200 | 9,218,679 | |
| Series 2017, Ref. GO Bonds | 5.00% | 11/01/2029 | 3,695 | 3,964,292 | |
| California (State of) Community Choice Financing Authority (Clean Energy); Series 2023, RB(b) | 5.25% | 04/01/2030 | 2,945 | 3,176,667 | |
| California (State of) Educational Facilities Authority (Santa Clara University); | |||||
| Series 2015, Ref. RB | 5.00% | 04/01/2032 | 1,000 | 1,011,366 | |
| Series 2015, Ref. RB | 5.00% | 04/01/2033 | 1,000 | 1,011,220 | |
| California (State of) Health Facilities Financing Authority; Series 2024 A, RB | 3.85% | 11/15/2027 | 1,850 | 1,861,172 | |
| California (State of) Health Facilities Financing Authority (Adventist Health System); Series 2013 A, RB | 5.00% | 03/01/2025 | 2,720 | 2,722,010 | |
| California (State of) Health Facilities Financing Authority (City of Hope); Series 2012 A, RB | 5.00% | 11/15/2024 | 100 | 100,278 | |
| California (State of) Health Facilities Financing Authority (Sutter Health); | |||||
| Series 2017 A, Ref. RB | 5.00% | 11/15/2032 | 1,285 | 1,359,720 | |
| Series 2018 A, RB | 5.00% | 11/15/2032 | 1,630 | 1,724,781 | |
| California (State of) Housing Finance Agency (Social Certificates); | |||||
| Series 2021-2A, Revenue Ctfs. (CEP - FHLMC) | 3.75% | 03/25/2035 | 3,846 | 3,909,401 | |
| Series 2023-1, RB | 4.38% | 09/20/2036 | 2,478 | 2,618,626 | |
| California (State of) Infrastructure & Economic Development Bank (Brightline West Passenger Rail); Series 2020, RB(b)(c)(f) | 8.00% | 08/15/2025 | 2,000 | 2,019,146 | |
| California (State of) Municipal Finance Authority (Waste Management, Inc.); Series 2022 A, RB(b)(f) | 4.13% | 10/01/2025 | 5,000 | 5,013,682 | |
| California (State of) Public Works Board (California Community Colleges); Series 2005 E, RB (INS - NATL)(a) | 4.50% | 10/01/2026 | 170 | 170,176 | |
| Howell Mountain Elementary School District (Election of 2005); Series 2007, GO Bonds (INS - AGM)(a)(h) | 0.00% | 08/01/2027 | 520 | 469,312 | |
| Imperial Irrigation District; | |||||
| Series 2012 A, Ref. RB | 5.00% | 11/01/2024 | 325 | 325,583 | |
| Series 2012 A, Ref. RB | 5.00% | 11/01/2027 | 225 | 226,629 | |
| Lodi (City of), CA; Series 2004 A, COP (INS - NATL)(a) | 4.75% | 10/01/2024 | 10 | 10,012 | |
| Long Beach Unified School District; | |||||
| Series 2012, Ref. GO Bonds | 5.00% | 08/01/2025 | 675 | 676,203 | |
| Series 2012, Ref. GO Bonds | 5.00% | 08/01/2028 | 775 | 781,067 | |
| Series 2012, Ref. GO Bonds | 5.00% | 08/01/2029 | 100 | 100,140 | |
| Los Angeles (Port of), CA; Series 2014 A, Ref. RB(f) | 5.00% | 08/01/2034 | 2,470 | 2,472,690 | |
| Northern California Energy Authority; Series 2024, Ref. RB(b) | 5.00% | 08/01/2030 | 3,600 | 3,865,528 | |
| Northern California Tobacco Securitization Authority; Series 2021 B-1, Ref. RB | 4.00% | 06/01/2049 | 980 | 993,363 | |
| Pasadena (City of), CA; | |||||
| Series 2013 A, Ref. RB(b)(e) | 5.00% | 10/28/2024 | 320 | 320,915 | |
| Series 2015, Ref. COP | 5.00% | 02/01/2031 | 1,000 | 1,007,818 | |
| Peninsula Corridor Joint Powers Board; Series 2019 A, Ref. RB | 5.00% | 10/01/2044 | 1,285 | 1,316,307 | |
| San Jose (City of), CA; Series 2017 B, Ref. RB | 5.00% | 03/01/2042 | 3,730 | 3,865,974 | |
| 70,042,784 | |||||
| Colorado–0.98% | |||||
| Adams & Arapahoe Joint School District No. 28J Aurora; Series 2017 A, Ref. GO Bonds | 5.00% | 12/01/2032 | 2,700 | 2,827,144 | |
| Colorado (State of) Health Facilities Authority (Aberdeen Ridge); Series 2021 B, RB | 2.13% | 05/15/2028 | 1,000 | 969,553 | |
| Colorado (State of) Health Facilities Authority (Adventhealth Obligated Group); Series 2016, Ref. RB | 5.00% | 11/15/2028 | 1,310 | 1,364,828 | |
| Colorado (State of) Regional Transportation District (Fastracks); | |||||
| Series 2016 A, RB | 5.00% | 11/01/2036 | 2,715 | 2,825,145 | |
| Series 2017 A, RB | 5.00% | 11/01/2033 | 1,000 | 1,045,270 | |
| Denver (City & County of), CO; Series 2016 A, Ref. RB | 5.00% | 11/15/2032 | 1,770 | 1,838,139 | |
| Denver City & County School District No. 1; Series 2013 C, COP | 5.00% | 12/15/2024 | 100 | 100,139 | |
| Larimer County School District No. R-1 Poudre; Series 2018, GO Bonds | 5.00% | 12/15/2040 | 2,660 | 2,836,931 | |
| Weld County School District No. Re-1; Series 2017, GO Bonds (INS - AGM)(a) | 5.00% | 12/15/2031 | 1,500 | 1,578,593 | |
| 15,385,742 | |||||
| 3 | Invesco Short Term Municipal Fund |
| Interest Rate | Maturity Date | Principal Amount (000) | Value | |||
| Connecticut–2.25% | ||||||
| Connecticut (State of); | ||||||
| Series 2014 E, GO Bonds(b)(e) | 5.00% | 11/06/2024 | $ 13,200 | $ 13,242,499 | ||
| Series 2014 F, GO Bonds | 5.00% | 11/15/2033 | 1,940 | 1,944,574 | ||
| Series 2016 E, GO Bonds | 5.00% | 10/15/2034 | 3,280 | 3,386,079 | ||
| Connecticut (State of) (Transportation Infrastructure); Series 2015 A, RB | 5.00% | 08/01/2028 | 3,000 | 3,058,775 | ||
| Connecticut (State of) Health & Educational Facilities Authority (Hartford Healthcare); | ||||||
| Series 2014 E, RB | 5.00% | 07/01/2025 | 125 | 125,169 | ||
| Series 2014 E, RB | 5.00% | 07/01/2026 | 1,000 | 1,003,242 | ||
| Series 2014 E, RB | 5.00% | 07/01/2027 | 1,265 | 1,268,885 | ||
| Connecticut (State of) Health & Educational Facilities Authority (New Haven Hospital); | ||||||
| Series 2013 N, RB(b)(e) | 5.00% | 09/27/2024 | 225 | 225,282 | ||
| Series 2014 A, RB(b)(e) | 5.00% | 09/27/2024 | 10,650 | 10,661,195 | ||
| South Central Connecticut Regional Water Authority; Twenty Ninth Series 2014, Ref. RB | 5.00% | 08/01/2025 | 500 | 500,830 | ||
| 35,416,530 | ||||||
| District of Columbia–0.93% | ||||||
| District of Columbia; | ||||||
| Series 2012, RB | 5.00% | 12/01/2024 | 280 | 280,383 | ||
| Series 2012, RB | 5.00% | 12/01/2026 | 100 | 100,144 | ||
| Series 2023 A, GO Bonds | 5.00% | 01/01/2037 | 3,000 | 3,450,994 | ||
| District of Columbia (Children’s Hospital Obligated Group); | ||||||
| Series 2015, Ref. RB | 5.00% | 07/15/2032 | 1,000 | 1,022,437 | ||
| Series 2015, Ref. RB | 5.00% | 07/15/2040 | 3,190 | 3,238,467 | ||
| Washington Metropolitan Area Transit Authority; | ||||||
| Series 2017 B, RB | 5.00% | 07/01/2031 | 1,110 | 1,166,242 | ||
| Series 2017 B, RB | 5.00% | 07/01/2035 | 1,400 | 1,464,158 | ||
| Series 2018, RB | 5.00% | 07/01/2043 | 3,750 | 3,867,563 | ||
| 14,590,388 | ||||||
| Florida–9.97% | ||||||
| Board of Governors of Florida Atlantic University; Series 2016 A, Ref. RB | 5.00% | 07/01/2031 | 1,000 | 1,028,865 | ||
| Broward (County of), FL; | ||||||
| Series 2012 Q-1, RB | 5.00% | 10/01/2024 | 1,850 | 1,852,050 | ||
| Series 2013 B, RB | 5.00% | 10/01/2026 | 260 | 260,202 | ||
| Broward (County of), FL School Board; | ||||||
| Series 2015 A, Ref. COP | 5.00% | 07/01/2030 | 2,000 | 2,029,236 | ||
| Series 2015 B, Ref. COP | 5.00% | 07/01/2031 | 6,640 | 6,732,701 | ||
| Series 2016 A, Ref. COP | 5.00% | 07/01/2032 | 4,135 | 4,249,652 | ||
| Capital Trust Agency, Inc. (Gardens Apartements); Series 2015 A, RB | 3.50% | 07/01/2025 | 225 | 209,904 | ||
| Central Florida Expressway Authority; | ||||||
| Series 2016 B, Ref. RB(b)(e) | 5.00% | 07/01/2026 | 3,005 | 3,134,410 | ||
| Series 2017, Ref. RB | 5.00% | 07/01/2038 | 1,535 | 1,593,173 | ||
| Series 2017, Ref. RB | 5.00% | 07/01/2039 | 2,020 | 2,093,924 | ||
| Citizens Property Insurance, Inc.; Series 2015 A-1, RB(b)(e) | 5.00% | 12/01/2024 | 20,320 | 20,411,438 | ||
| Florida (State of) Municipal Power Agency; Series 2015, RB | 5.00% | 10/01/2030 | 1,930 | 1,968,622 | ||
| Florida Housing Finance Corp.; Series 2024 3, RB (CEP - GNMA) | 6.25% | 01/01/2055 | 1,650 | 1,840,045 | ||
| Florida Housing Finance Corp. (Social Bonds); Series 2022-3, RB (CEP - GNMA) | 5.50% | 01/01/2054 | 4,215 | 4,463,964 | ||
| Gainesville (City of), FL; | ||||||
| Series 2012 B, Ref. VRD RB(d) | 2.40% | 10/01/2042 | 9,245 | 9,245,000 | ||
| Series 2017 A, RB | 5.00% | 10/01/2031 | 1,265 | 1,331,946 | ||
| Greater Orlando Aviation Authority; | ||||||
| Series 2016 B, RB(b)(e) | 5.00% | 10/01/2026 | 210 | 220,090 | ||
| Series 2016 B, RB | 5.00% | 10/01/2039 | 2,165 | 2,221,368 | ||
| Hialeah (City of), FL; Series 2022, Ref. RB | 5.00% | 10/01/2035 | 2,170 | 2,379,133 | ||
| Hillsborough (County of), FL Aviation Authority (Tampa International Airport); Series 2018 F, RB | 5.00% | 10/01/2043 | 1,305 | 1,369,290 | ||
| Hillsborough (County of), FL Industrial Development Authority (Baycare Health System); Series 2024 C, Ref. RB | 5.00% | 11/15/2034 | 7,000 | 8,163,979 | ||
| Hillsborough (County of), FL School Board (Master Lease Program); Series 2015 A, Ref. COP | 5.00% | 07/01/2030 | 2,330 | 2,366,550 | ||
| Jacksonville Transportation Authority; Series 2015, RB | 5.00% | 08/01/2032 | 3,615 | 3,678,716 | ||
| 4 | Invesco Short Term Municipal Fund |
| Interest Rate | Maturity Date | Principal Amount (000) | Value | ||
| Florida–(continued) | |||||
| JEA Electric System; | |||||
| Series 2017 B, Ref. RB | 5.00% | 10/01/2032 | $ 3,410 | $ 3,579,276 | |
| Series 2017 B, Ref. RB | 5.00% | 10/01/2033 | 4,000 | 4,191,024 | |
| Lake (County of), FL School Board; Series 2015 B, Ref. COP (INS - AGM)(a) | 5.00% | 06/01/2031 | 2,000 | 2,023,059 | |
| Lee (County of), FL Industrial Development Authority; Series 2024 B-3, RB | 4.13% | 11/15/2029 | 1,155 | 1,160,373 | |
| Miami (City of) & Dade (County of), FL School Board; | |||||
| Series 2014 D, Ref. COP | 5.00% | 11/01/2030 | 1,860 | 1,865,536 | |
| Series 2014 D, Ref. COP | 5.00% | 11/01/2031 | 1,420 | 1,424,133 | |
| Series 2015 A, Ref. COP | 5.00% | 05/01/2030 | 3,250 | 3,288,232 | |
| Series 2015 D, Ref. COP | 5.00% | 02/01/2034 | 2,220 | 2,265,020 | |
| Series 2016 A, Ref. COP | 5.00% | 05/01/2032 | 3,295 | 3,377,980 | |
| Series 2016, GO Bonds | 5.00% | 03/15/2030 | 1,320 | 1,362,340 | |
| Miami-Dade (County of), FL; | |||||
| Series 2012 B, Ref. RB | 5.00% | 10/01/2024 | 1,285 | 1,286,797 | |
| Series 2014, RB | 5.00% | 10/01/2032 | 1,160 | 1,161,138 | |
| Series 2015 B, Ref. GO Bonds | 5.00% | 07/01/2029 | 1,105 | 1,106,808 | |
| Miami-Dade (County of), FL Educational Facilities Authority (University of Miami); | |||||
| Series 2012 A, RB | 5.00% | 04/01/2027 | 525 | 525,483 | |
| Series 2012 A, RB | 5.00% | 04/01/2028 | 1,500 | 1,501,395 | |
| Series 2015 A, Ref. RB | 5.00% | 04/01/2032 | 1,000 | 1,009,173 | |
| Miami-Dade (County of), FL Expressway Authority; | |||||
| Series 2010 A, RB | 5.00% | 07/01/2040 | 10,000 | 10,005,959 | |
| Series 2016 A, Ref. RB | 5.00% | 07/01/2032 | 2,000 | 2,060,352 | |
| Miami-Dade (County of), FL Housing Finance Authority (Palm Lakes); Series 2012, RB (LOC - Fannie Mae)(g) | 4.05% | 01/15/2028 | 8,200 | 8,205,305 | |
| Miami-Dade (County of), FL Transit System; Series 2015, Ref. RB | 5.00% | 07/01/2031 | 2,210 | 2,248,128 | |
| Orlando (City of), FL; Series 2013, Ref. RB | 5.00% | 10/01/2027 | 750 | 750,685 | |
| Osceola (County of), FL; Series 2016 A, Ref. RB | 5.00% | 10/01/2030 | 1,000 | 1,019,050 | |
| Palm Beach County School District; | |||||
| Series 2015 C, Ref. COP | 5.00% | 08/01/2032 | 1,000 | 1,017,807 | |
| Series 2015 D, Ref. COP | 5.00% | 08/01/2029 | 1,410 | 1,434,852 | |
| Polk (County of), FL; | |||||
| Series 2012, Ref. RB | 5.00% | 10/01/2024 | 125 | 125,181 | |
| Series 2012, Ref. RB | 5.00% | 10/01/2025 | 165 | 165,557 | |
| Pompano Beach (City of), FL (John Knox Village); Series 2021 B-1, RB | 2.00% | 01/01/2029 | 805 | 804,268 | |
| St. Johns (County of), FL Housing Finance Authority (Oaks at St. John); Series 2023 B, RB(b)(c) | 5.50% | 12/01/2026 | 6,000 | 5,991,569 | |
| Tallahassee (City of), FL; | |||||
| Series 2017, Ref. RB | 5.00% | 10/01/2031 | 1,225 | 1,252,969 | |
| Series 2018, RB(b)(e) | 5.00% | 10/01/2024 | 1,715 | 1,717,379 | |
| USF Financing Corp.; Series 2012 A, Ref. COP | 5.00% | 07/01/2032 | 4,550 | 4,610,549 | |
| Walton County District School Board; Series 2015, COP (INS - AGM)(a) | 5.00% | 07/01/2032 | 1,720 | 1,729,883 | |
| 157,111,518 | |||||
| Georgia–3.69% | |||||
| Atlanta (City of), GA Urban Residential Finance Authority (GE Tower Apartments); Series 2023 B, RB(b) | 5.75% | 06/01/2025 | 3,000 | 3,003,530 | |
| Burke (County of), GA Development Authority (Georgia Power Co. Plant Vogtle); Series 2012, Ref. RB(b) | 2.88% | 08/19/2025 | 5,000 | 4,963,793 | |
| College Park (City of), GA (Atlanta International Airport); Series 2006 B, RB (INS - NATL)(a) | 4.38% | 01/01/2026 | 20 | 20,020 | |
| DeKalb (County of), GA Development Authority (The Globe Academy, Inc.); Series 2024 A, RB | 4.00% | 06/01/2035 | 735 | 730,924 | |
| DeKalb (County of), GA Housing Authority (Park at 500); Series 2024, RB | 4.00% | 03/01/2034 | 3,250 | 3,256,102 | |
| Fulton (County of), GA; Series 2013, Ref. RB | 5.00% | 01/01/2027 | 1,605 | 1,612,698 | |
| Georgia (State of) Municipal Electric Authority (Project One); | |||||
| Series 2015 A, Ref. RB | 5.00% | 01/01/2031 | 1,820 | 1,827,925 | |
| Series 2015 A, Ref. RB | 5.00% | 01/01/2032 | 2,030 | 2,038,452 | |
| Series 2015 A, Ref. RB | 5.00% | 01/01/2034 | 1,900 | 1,906,803 | |
| 5 | Invesco Short Term Municipal Fund |
| Interest Rate | Maturity Date | Principal Amount (000) | Value | ||
| Georgia–(continued) | |||||
| Main Street Natural Gas, Inc.; | |||||
| Series 2019 B, RB(b) | 4.00% | 12/02/2024 | $ 12,225 | $ 12,234,779 | |
| Series 2019 C, RB(b) | 4.00% | 09/01/2026 | 7,000 | 7,048,933 | |
| Series 2021 A, RB(b) | 4.00% | 09/01/2027 | 5,120 | 5,164,033 | |
| Series 2021 C, RB | 4.00% | 12/01/2025 | 1,100 | 1,108,252 | |
| Series 2022 C, RB(c) | 4.00% | 11/01/2024 | 5,200 | 5,195,082 | |
| Series 2022 C, RB(b)(c) | 4.00% | 11/01/2027 | 1,000 | 986,125 | |
| Series 2024 B, RB(b) | 5.00% | 03/01/2032 | 6,400 | 6,942,943 | |
| Milledgeville (City of) & Baldwin (County of), GA Development Authority; Series 2003 A, RB (INS - AGC)(a) | 4.50% | 09/01/2025 | 20 | 20,000 | |
| 58,060,394 | |||||
| Hawaii–0.45% | |||||
| Hawaii (State of); | |||||
| Series 2014 EO, GO Bonds | 5.00% | 08/01/2028 | 1,880 | 1,882,996 | |
| Series 2016 FG, GO Bonds | 5.00% | 10/01/2030 | 2,890 | 3,019,581 | |
| Honolulu (City & County of), HI; Series 2023, RB(b) | 5.00% | 06/01/2026 | 2,125 | 2,195,660 | |
| 7,098,237 | |||||
| Idaho–0.25% | |||||
| Boise State University; Series 2016 A, Ref. RB | 5.00% | 04/01/2033 | 2,000 | 2,050,656 | |
| Idaho (State of) Housing & Finance Association; Series 2024 A, RB (CEP - GNMA) | 6.00% | 07/01/2054 | 1,695 | 1,891,315 | |
| 3,941,971 | |||||
| Illinois–6.22% | |||||
| Chicago (City of), IL; Series 2008 C, Ref. RB | 5.00% | 01/01/2031 | 2,500 | 2,512,637 | |
| Chicago (City of), IL (O’Hare International Airport); | |||||
| Series 2015 B, Ref. RB | 5.00% | 01/01/2027 | 1,350 | 1,358,072 | |
| Series 2015 B, Ref. RB | 5.00% | 01/01/2031 | 4,015 | 4,035,648 | |
| Series 2015 B, Ref. RB | 5.00% | 01/01/2033 | 6,120 | 6,149,626 | |
| Series 2016 C, Ref. RB | 5.00% | 01/01/2038 | 3,000 | 3,046,766 | |
| Series 2024 B, RB | 5.00% | 01/01/2036 | 1,000 | 1,144,430 | |
| Collinsville (City of), IL Area Recreation District; | |||||
| Series 2004, GO Bonds (INS - NATL)(a) | 4.60% | 12/01/2025 | 350 | 350,405 | |
| Series 2004, GO Bonds (INS - NATL)(a) | 4.65% | 12/01/2026 | 450 | 450,468 | |
| Series 2007, Ref. GO Bonds (INS - AMBAC)(a) | 4.00% | 12/01/2027 | 65 | 65,015 | |
| Cook (County of), IL; | |||||
| Series 2016 A, Ref. GO Bonds | 5.00% | 11/15/2029 | 3,100 | 3,232,992 | |
| Series 2016 A, Ref. GO Bonds | 5.00% | 11/15/2030 | 2,750 | 2,872,164 | |
| Elk Grove Village (Village of), IL; Series 2017, GO Bonds | 5.00% | 01/01/2035 | 1,000 | 1,046,618 | |
| Illinois (State of); | |||||
| Series 2016, GO Bonds | 5.00% | 11/01/2025 | 2,000 | 2,045,397 | |
| Series 2019 A, GO Bonds | 5.00% | 11/01/2026 | 2,935 | 3,061,407 | |
| Illinois (State of) Development Finance Authority (CITGO Petroleum Corp.); Series 2002, RB(f) | 8.00% | 06/01/2032 | 560 | 560,708 | |
| Illinois (State of) Finance Authority; Series 2016 A, Ref. RB | 5.00% | 10/01/2035 | 2,000 | 2,056,123 | |
| Illinois (State of) Finance Authority (Advocate Health Care Network); Series 2014, Ref. RB | 5.00% | 08/01/2025 | 1,505 | 1,506,368 | |
| Illinois (State of) Finance Authority (Lutheran Communities Obligated Group); | |||||
| Series 2019 A, Ref. RB (Acquired 11/27/2019; Cost $449,079)(i) | 5.00% | 11/01/2025 | 440 | 359,316 | |
| Series 2019 A, Ref. RB (Acquired 11/27/2019; Cost $476,101)(i) | 5.00% | 11/01/2026 | 460 | 369,458 | |
| Illinois (State of) Finance Authority (Rosalind Franklin University); | |||||
| Series 2017, Ref. RB | 5.00% | 08/01/2027 | 425 | 443,307 | |
| Series 2017, Ref. RB | 5.00% | 08/01/2028 | 500 | 521,311 | |
| Series 2017, Ref. RB | 5.00% | 08/01/2029 | 325 | 338,550 | |
| Illinois (State of) Finance Authority (State Clean Water) (Green Bonds); Series 2016, RB | 5.00% | 07/01/2031 | 4,815 | 4,950,807 | |
| Illinois (State of) Finance Authority (The University of Chicago); Series 2014 A, Ref. RB(b)(e) | 5.00% | 10/01/2024 | 10 | 10,014 | |
| Illinois (State of) Finance Authority (Uchicago Medicine); Series 2022 B-2, RB(b) | 5.00% | 08/15/2027 | 9,500 | 10,014,572 | |
| Illinois (State of) Finance Authority (University of Chicago Medical); Series 2010, VRD RB (LOC - Td Bank N.A.)(d)(g) | 2.60% | 08/01/2044 | 8,745 | 8,745,000 | |
| 6 | Invesco Short Term Municipal Fund |
| Interest Rate | Maturity Date | Principal Amount (000) | Value | ||
| Illinois–(continued) | |||||
| Illinois (State of) Housing Development Authority; | |||||
| Series 2005, RB (INS - AGM)(a) | 4.60% | 09/01/2025 | $ 5 | $ 5,007 | |
| Series 2024 E, Ref. VRD RB (CEP - Federal Housing Administration)(d) | 2.82% | 01/01/2065 | 3,500 | 3,500,000 | |
| Illinois (State of) Housing Development Authority (6900 Crandon); Series 2023, RB (CEP - Federal Housing Administration)(b) | 5.00% | 02/01/2026 | 4,570 | 4,693,585 | |
| Illinois (State of) Municipal Electric Agency; Series 2015 A, Ref. RB | 5.00% | 02/01/2032 | 3,900 | 3,964,859 | |
| Illinois (State of) Toll Highway Authority; | |||||
| Series 2016 A, Ref. RB | 5.00% | 12/01/2031 | 4,440 | 4,543,255 | |
| Series 2016 A, Ref. RB | 5.00% | 12/01/2032 | 2,675 | 2,734,840 | |
| Series 2016 B, RB | 5.00% | 01/01/2031 | 1,000 | 1,034,527 | |
| Series 2016 B, RB | 5.00% | 01/01/2032 | 1,000 | 1,031,675 | |
| Kane McHenry Cook & De Kalb Counties Unit School District No. 300; Series 2015, Ref. GO Bonds | 5.00% | 01/01/2028 | 1,000 | 1,006,305 | |
| Madison-Macoupin Etc Counties Community College District No. 536; Series 2015 A, Ref. GO Bonds (INS - BAM)(a) | 5.00% | 11/01/2027 | 1,335 | 1,338,995 | |
| Rockford (City of), IL (Waterworks System Alternative Revenue Source); Series 2010, GO Bonds | 3.75% | 12/15/2025 | 280 | 280,189 | |
| Tender Option Bond Trust Receipts/Certificates; Series 2023, VRD RB (INS - AGM)(a)(c)(d) | 2.70% | 05/01/2031 | 11,530 | 11,530,000 | |
| University of Illinois; Series 2008 A, Ref. COP (INS - AGM)(a) | 5.25% | 10/01/2026 | 1,020 | 1,021,918 | |
| West Chicago Fire Protection District; Series 2008, GO Bonds (INS - NATL)(a) | 4.75% | 01/01/2029 | 15 | 15,016 | |
| 97,947,350 | |||||
| Indiana–0.69% | |||||
| Indiana (State of) Finance Authority; | |||||
| Series 2015, RB | 5.00% | 03/01/2036 | 3,265 | 3,284,764 | |
| Series 2016, Ref. RB | 5.00% | 09/01/2028 | 1,280 | 1,332,040 | |
| Indiana (State of) Finance Authority (CWA Authority); Series 2014 A, RB | 5.00% | 10/01/2026 | 1,750 | 1,753,031 | |
| Indiana (State of) Municipal Power Agency; Series 2016 C, Ref. RB | 5.00% | 01/01/2039 | 1,000 | 1,026,413 | |
| Indianapolis Local Public Improvement Bond Bank; Series 2015, Ref. RB(f) | 5.00% | 01/01/2030 | 3,250 | 3,265,959 | |
| Merrillville (Town of), IN (Belvedere Housing); Series 2016, RB | 5.05% | 04/01/2026 | 205 | 201,678 | |
| 10,863,885 | |||||
| Iowa–1.60% | |||||
| Ames (City of), IA; Series 2016, Ref. RB | 5.00% | 06/15/2032 | 4,430 | 4,542,362 | |
| Iowa (State of) Finance Authority (Unitypoint Health); | |||||
| Series 2014 C, RB | 5.00% | 02/15/2031 | 810 | 814,314 | |
| Series 2014 C, RB | 5.00% | 02/15/2032 | 3,405 | 3,423,057 | |
| Iowa (State of) Higher Education Loan Authority (Grinnell College); Series 2014, Ref. RB | 5.00% | 12/01/2032 | 1,675 | 1,684,211 | |
| Iowa (State of) Tobacco Settlement Authority; Series 2021 B-1, Ref. RB | 4.00% | 06/01/2049 | 950 | 953,301 | |
| PEFA, Inc.; Series 2019, RB(b) | 5.00% | 09/01/2026 | 13,500 | 13,791,978 | |
| 25,209,223 | |||||
| Kansas–0.81% | |||||
| University of Kansas Hospital Authority (KU Health System); | |||||
| Series 2015, Ref. RB | 5.00% | 09/01/2030 | 1,930 | 1,967,469 | |
| Series 2015, Ref. RB | 5.00% | 09/01/2032 | 2,765 | 2,813,993 | |
| Series 2015, Ref. RB | 5.00% | 09/01/2035 | 2,000 | 2,032,471 | |
| Valley Center (City of), KS; Series 2023-1, GO Notes | 4.38% | 12/01/2025 | 4,820 | 4,823,597 | |
| Wyandotte (County of) & Kansas City (City of), KS Unified Government; Series 2016 C, RB | 5.00% | 09/01/2030 | 1,000 | 1,039,399 | |
| 12,676,929 | |||||
| Kentucky–2.18% | |||||
| Jefferson County Capital Projects Corp.; Series 2007 A, Ref. RB (INS - AGM)(a) | 4.38% | 06/01/2028 | 25 | 25,032 | |
| Kentucky (Commonwealth of) Asset Liability Commission (2014 Federal Highway Trust Fund); Series 2014, Ref. RN(b)(e) | 5.00% | 09/01/2024 | 1,515 | 1,515,000 | |
| Kentucky (Commonwealth of) Economic Development Finance Authority (Catholic Health Initiatives); Series 2011 B, RB (SIFMA Municipal Swap Index + 1.40%)(b)(j) | 4.32% | 02/01/2025 | 2,310 | 2,310,383 | |
| Kentucky (Commonwealth of) Economic Development Finance Authority (Next Generation Kentucky Information Highway); | |||||
| Series 2015 A, RB | 5.00% | 07/01/2025 | 1,635 | 1,651,710 | |
| Series 2015 A, RB | 5.00% | 07/01/2028 | 1,000 | 1,009,822 | |
| 7 | Invesco Short Term Municipal Fund |
| Interest Rate | Maturity Date | Principal Amount (000) | Value | |||
| Kentucky–(continued) | ||||||
| Kentucky (Commonwealth of) Municipal Power Agency; Series 2015 A, Ref. RB (INS - NATL)(a) | 5.00% | 09/01/2026 | $ 2,000 | $ 2,032,971 | ||
| Kentucky (Commonwealth of) Public Energy Authority; | ||||||
| Series 2019 A-1, RB(b) | 4.00% | 06/01/2025 | 5,000 | 5,014,606 | ||
| Series 2019 A-2, RB (1 mo. Term SOFR + 1.12%)(b)(j) | 4.68% | 06/01/2025 | 10,000 | 10,025,477 | ||
| Series 2024 A, RB(b) | 5.00% | 07/01/2030 | 3,120 | 3,313,634 | ||
| Kentucky (Commonwealth of) Turnpike Authority (Revitalization); Series 2016, RB | 5.00% | 07/01/2031 | 1,715 | 1,777,060 | ||
| Louisville (City of) & Jefferson (County of), KY Metropolitan Government (Norton Healthcare, Inc.); | ||||||
| Series 2016 A, Ref. RB | 5.00% | 10/01/2031 | 2,835 | 2,910,607 | ||
| Series 2016 A, Ref. RB | 5.00% | 10/01/2032 | 2,660 | 2,726,865 | ||
| 34,313,167 | ||||||
| Louisiana–1.01% | ||||||
| Louisiana (State of); | ||||||
| Series 2022 A, Ref. RB (SOFR + 0.50%)(b)(j) | 4.24% | 05/01/2026 | 3,115 | 3,110,260 | ||
| Series 2023 A-1, Ref. VRD RB (LOC - Toronto-dominion Bank)(d)(g) | 2.70% | 05/01/2043 | 10,000 | 10,000,000 | ||
| New Orleans (City of), LA Aviation Board (Consolidated Rental Car); | ||||||
| Series 2018, Ref. RB (INS - AGM)(a) | 5.00% | 01/01/2036 | 1,250 | 1,313,435 | ||
| Series 2018, Ref. RB (INS - AGM)(a) | 5.00% | 01/01/2037 | 1,440 | 1,509,064 | ||
| 15,932,759 | ||||||
| Maine–0.17% | ||||||
| Maine (State of) Turnpike Authority; Series 2014, RB | 5.00% | 07/01/2029 | 1,670 | 1,671,953 | ||
| Portland (City of), ME; Series 2016, Ref. RB | 5.00% | 01/01/2032 | 1,000 | 1,018,168 | ||
| 2,690,121 | ||||||
| Maryland–1.63% | ||||||
| Maryland (State of) Health & Higher Educational Facilities Authority; Series 2017, Ref. RB | 5.00% | 07/01/2031 | 3,000 | 3,105,329 | ||
| Maryland (State of) Health & Higher Educational Facilities Authority (MedStar Health); | ||||||
| Series 2013 B, RB | 5.00% | 08/15/2027 | 200 | 200,487 | ||
| Series 2017 A, RB | 5.00% | 05/15/2042 | 1,875 | 1,928,366 | ||
| Maryland Economic Development Corp. (CNX Marine Terminal, Inc. - Port of Baltimore Facility); Series 2010, Ref. RB | 5.75% | 09/01/2025 | 9,030 | 9,094,029 | ||
| Washington (State of) Suburban Sanitary Commission; Series 2013 A, VRD RB(d) | 2.70% | 06/01/2027 | 11,400 | 11,400,000 | ||
| 25,728,211 | ||||||
| Massachusetts–0.20% | ||||||
| Massachusetts (Commonwealth of) (Green Bonds); Series 2014 E, GO Bonds | 5.00% | 09/01/2024 | 680 | 680,000 | ||
| Massachusetts (Commonwealth of) Health & Educational Facilities Authority; Series 2007 C, RB (SIFMA Municipal Swap Index + 0.90%)(j) | 3.74% | 11/15/2032 | 2,405 | 2,325,294 | ||
| Waltham (City of), MA; | ||||||
| Series 2008, GO Bonds | 4.00% | 09/15/2024 | 25 | 25,009 | ||
| Series 2008, GO Bonds | 4.20% | 09/15/2027 | 15 | 15,015 | ||
| Worcester (City of), MA; Series 2006, GO Bonds (INS - SGI)(a) | 4.20% | 11/01/2024 | 10 | 10,009 | ||
| 3,055,327 | ||||||
| Michigan–3.35% | ||||||
| Advanced Technology Academy; Series 2019, Ref. RB | 3.50% | 11/01/2024 | 130 | 129,781 | ||
| Detroit (City of), MI; Series 2006, Ref. RB (3 mo. Term SOFR + 0.60%), (INS - AGM)(a)(j) | 4.35% | 07/01/2032 | 7,825 | 7,681,748 | ||
| Farmington Public School District; Series 2015, Ref. GO Bonds (INS - AGM)(a) | 5.00% | 05/01/2030 | 1,385 | 1,402,386 | ||
| Michigan (State of) Building Authority (Facilities Program); | ||||||
| Series 2015 I, Ref. RB | 5.00% | 04/15/2031 | 1,565 | 1,594,841 | ||
| Series 2016 I, Ref. RB | 5.00% | 10/15/2032 | 1,250 | 1,296,344 | ||
| Michigan (State of) Finance Authority (Sparrow Obligated Group); Series 2015, Ref. RB(b)(e) | 5.00% | 05/15/2025 | 1,620 | 1,645,179 | ||
| Michigan (State of) Finance Authority (Trinity Health Credit Group); | ||||||
| Series 2015, Ref. RB | 5.50% | 12/01/2028 | 2,245 | 2,286,721 | ||
| Series 2015, Ref. RB | 5.50% | 12/01/2029 | 3,075 | 3,129,440 | ||
| Michigan (State of) Hospital Finance Authority (Ascension Health Credit Group); | ||||||
| Series 1999 B-4, RB | 5.00% | 11/15/2031 | 2,325 | 2,354,427 | ||
| Series 1999, RB | 5.00% | 11/15/2027 | 4,355 | 4,416,308 | ||
| Michigan (State of) Housing Development Authority; Series 2021 A, RB | 0.55% | 04/01/2025 | 1,170 | 1,150,843 | ||
| 8 | Invesco Short Term Municipal Fund |
| Interest Rate | Maturity Date | Principal Amount (000) | Value | ||
| Michigan–(continued) | |||||
| Michigan (State of) Housing Development Authority (Social Bonds); Series 2024 A, RB | 6.00% | 06/01/2054 | $ 4,000 | $ 4,400,947 | |
| Muskegon Heights (City of), MI; Series 2006, Ref. RB (INS - NATL)(a) | 4.00% | 11/01/2026 | 185 | 185,045 | |
| North Branch Area Schools; Series 2015, Ref. GO Bonds | 5.00% | 05/01/2032 | 2,915 | 2,949,482 | |
| Rib Floater Trust; Series 2022-047, VRD RB(c)(d) | 2.75% | 12/01/2045 | 10,000 | 10,000,000 | |
| Utica Community Schools; Series 2016, Ref. GO Bonds | 5.00% | 05/01/2031 | 1,990 | 2,059,917 | |
| Wayne (County of), MI Airport Authority (Detroit Michigan Wayne County Airport); Series 2015 D, RB | 5.00% | 12/01/2029 | 1,700 | 1,735,931 | |
| Wayne State University; | |||||
| Series 2015 A, Ref. RB | 5.00% | 11/15/2026 | 175 | 175,828 | |
| Series 2015 A, Ref. RB | 5.00% | 11/15/2030 | 125 | 125,591 | |
| Series 2018 A, RB | 5.00% | 11/15/2038 | 2,220 | 2,262,014 | |
| Western Michigan University; Series 2015 A, Ref. RB | 5.00% | 11/15/2029 | 1,700 | 1,723,764 | |
| 52,706,537 | |||||
| Minnesota–0.65% | |||||
| Minnesota (State of) Governmental Agency Finance Group (Flexible Term Program); Series 2007 A-1, RB (INS - AGC)(a) | 4.13% | 03/01/2027 | 15 | 15,004 | |
| Minnesota (State of) Higher Education Facilities Authority (University of St. Thomas); Series 2017 A, Ref. RB | 5.00% | 10/01/2029 | 1,400 | 1,479,146 | |
| Minnesota State Colleges And Universities Foundation; Series 2013 A, RB | 4.00% | 10/01/2025 | 1,000 | 1,000,629 | |
| Mounds View (City of), MN (Sherman Forbes); Series 2023 A, RB(b) | 4.05% | 11/01/2024 | 1,000 | 999,814 | |
| North Mankato (City of), MN; Series 2009 C, GO Bonds | 4.00% | 12/01/2024 | 10 | 10,007 | |
| St. Paul (City of), MN; | |||||
| Series 2014 G, RB(b)(e) | 5.00% | 11/01/2024 | 2,400 | 2,407,109 | |
| Series 2014 G, RB(b)(e) | 5.00% | 11/01/2024 | 2,250 | 2,256,664 | |
| St. Paul (City of), MN Housing & Redevelopment Authority (Healthpartners Obligated Group); Series 2015 A, Ref. RB | 5.00% | 07/01/2032 | 1,895 | 1,914,792 | |
| St. Paul (City of), MN Housing & Redevelopment Authority (St. Paul City School); Series 2016 A, Ref. RB(b)(e) | 4.50% | 07/01/2026 | 175 | 178,327 | |
| 10,261,492 | |||||
| Mississippi–0.00% | |||||
| Mississippi Business Finance Corp. (Northrop Grumman Corp.); Series 2006, RB | 4.55% | 12/01/2028 | 25 | 25,006 | |
| Missouri–1.66% | |||||
| Cassville School District No. R-IV; Series 2023, GO Bonds | 5.25% | 03/01/2039 | 2,220 | 2,346,107 | |
| Jackson County Consolidated School District No. 4; | |||||
| Series 2022, GO Bonds | 5.00% | 03/01/2038 | 1,825 | 1,889,462 | |
| Series 2022, GO Bonds | 5.00% | 03/01/2039 | 3,005 | 3,107,165 | |
| Kansas City (City of), MO Industrial Development Authority (Ward Parkway Center Community Improvement District); Series 2016 A, Ref. RB(c) | 4.25% | 04/01/2026 | 100 | 99,327 | |
| Lindbergh School District; Series 2019 A, GO Bonds | 5.00% | 03/01/2033 | 1,475 | 1,555,689 | |
| Maryland Heights (City of), MO (Westport Plaza Redevelopment); Series 2020, RB | 4.13% | 11/01/2038 | 1,000 | 983,618 | |
| Missouri (State of) Health & Educational Facilities Authority (BJC Health System); Series 2014, RB | 5.00% | 01/01/2030 | 1,000 | 1,001,749 | |
| Missouri (State of) Health & Educational Facilities Authority (St. Louis University); Series 2015 A, RB | 5.00% | 10/01/2038 | 4,500 | 4,584,933 | |
| Missouri (State of) Health & Educational Facilities Authority (St. Luke’s Health System, Inc.); Series 2016, Ref. RB | 5.00% | 11/15/2030 | 1,215 | 1,255,395 | |
| Missouri (State of) Housing Development Commission (First Place Homeownership Loan); Series 2023, RB (CEP - GNMA) | 5.75% | 05/01/2053 | 2,550 | 2,742,357 | |
| Missouri (State of) Joint Municipal Electric Utility Commission (Prairie State); | |||||
| Series 2015 A, Ref. RB | 5.00% | 06/01/2027 | 2,600 | 2,635,163 | |
| Series 2015 A, Ref. RB | 5.00% | 12/01/2029 | 1,500 | 1,519,288 | |
| Missouri Western State University; Series 2012, Ref. RB | 3.00% | 10/01/2024 | 50 | 49,938 | |
| Springfield Public Building Corp.; Series 2000 A, RB (INS - AMBAC)(a)(h) | 0.00% | 06/01/2025 | 60 | 58,613 | |
| St. Charles (County of), MO Public Water Supply District No. 2; Series 2016, Ref. COP | 5.00% | 12/01/2030 | 2,255 | 2,308,926 | |
| 26,137,730 | |||||
| Nebraska–1.46% | |||||
| Central Plains Energy Project; Series 2019, Ref. RB(b) | 4.00% | 08/01/2025 | 3,380 | 3,395,462 | |
| 9 | Invesco Short Term Municipal Fund |
| Interest Rate | Maturity Date | Principal Amount (000) | Value | |||
| Nebraska–(continued) | ||||||
| Gretna Public Schools; Series 2022 B, GO Bonds | 5.00% | 12/15/2027 | $ 1,000 | $ 1,028,194 | ||
| Omaha School District; | ||||||
| Series 2016, GO Bonds | 5.00% | 12/15/2030 | 3,295 | 3,449,706 | ||
| Series 2016, GO Bonds | 5.00% | 12/15/2032 | 5,000 | 5,221,217 | ||
| Public Power Generation Agency (Whelan Energy Center Unit 2); | ||||||
| Series 2015, Ref. RB | 5.00% | 01/01/2030 | 1,380 | 1,388,293 | ||
| Series 2015, Ref. RB | 5.00% | 01/01/2031 | 2,115 | 2,127,639 | ||
| Series 2016 A, Ref. RB | 5.00% | 01/01/2034 | 3,250 | 3,359,770 | ||
| Series 2016, Ref. RB | 5.00% | 01/01/2032 | 2,980 | 3,081,727 | ||
| 23,052,008 | ||||||
| Nevada–1.30% | ||||||
| Clark (County of), NV; Series 2016 B, Ref. GO Bonds | 5.00% | 11/01/2029 | 2,150 | 2,251,402 | ||
| Clark (County of), NV Water Reclamation District; Series 2015, Ref. GO Bonds | 5.00% | 07/01/2032 | 2,000 | 2,034,505 | ||
| Clark County School District; Series 2015 D, GO Bonds | 5.00% | 06/15/2029 | 1,755 | 1,799,591 | ||
| Las Vegas Valley Water District; Series 2016 B, Ref. GO Bonds | 5.00% | 06/01/2036 | 2,805 | 2,895,240 | ||
| Truckee Meadows Water Authority; | ||||||
| Series 2016, Ref. RB | 5.00% | 07/01/2031 | 2,775 | 2,877,929 | ||
| Series 2016, Ref. RB | 5.00% | 07/01/2032 | 2,000 | 2,070,926 | ||
| Washoe (County of), NV (Sierra Pacific Power Corp.); | ||||||
| Series 2016, Ref. RB(b) | 3.63% | 10/01/2029 | 1,500 | 1,506,748 | ||
| Series 2016, Ref. RB(b)(f) | 4.13% | 10/01/2029 | 5,000 | 5,058,829 | ||
| 20,495,170 | ||||||
| New Hampshire–1.16% | ||||||
| New Hampshire (State of) Business Finance Authority; | ||||||
| Series 2024-1A, RB | 4.25% | 07/20/2041 | 3,942 | 3,931,535 | ||
| Series 2024-3, Revenue Ctfs. | 4.16% | 10/20/2041 | 4,998 | 4,903,814 | ||
| New Hampshire (State of) Business Finance Authority (Social Bonds); Series 2022-2A, RB | 4.00% | 10/20/2036 | 5,290 | 5,236,254 | ||
| New Hampshire (State of) Health and Education Facilities Authority; Series 2016, Ref. RB | 5.50% | 06/01/2031 | 4,000 | 4,123,154 | ||
| 18,194,757 | ||||||
| New Jersey–3.55% | ||||||
| Camden (County of), NJ Improvement Authority (The) (County Capital Program); Series 2024, RB(b) | 5.00% | 03/01/2026 | 4,000 | 4,114,820 | ||
| Gloucester (County of), NJ Improvement Authority (The); Series 2015 B, Ref. RB | 5.00% | 07/01/2027 | 2,000 | 2,029,211 | ||
| Gloucester (County of), NJ Improvement Authority (The) (Rowan University); Series 2024, RN | 4.00% | 02/27/2025 | 2,500 | 2,504,589 | ||
| New Jersey (State of) Economic Development Authority; | ||||||
| Series 2004 A, RB(e) | 5.25% | 07/01/2025 | 820 | 836,232 | ||
| Series 2005 N-1, Ref. RB (INS - AMBAC)(a) | 5.50% | 09/01/2024 | 7,190 | 7,190,000 | ||
| New Jersey (State of) Economic Development Authority (Rutgers University); Series 2013, RB | 5.00% | 06/15/2025 | 130 | 130,179 | ||
| New Jersey (State of) Educational Facilities Authority (Montclair University); | ||||||
| Series 2014, RB | 5.00% | 06/15/2026 | 1,000 | 1,001,336 | ||
| Series 2016 B, Ref. RB | 5.00% | 07/01/2027 | 1,000 | 1,037,396 | ||
| New Jersey (State of) Health Care Facilities Financing Authority (Hackensack Meridian Health Obligated Group); Series 2017, Ref. RB | 5.00% | 07/01/2032 | 815 | 854,836 | ||
| New Jersey (State of) Health Care Facilities Financing Authority (Inspira Health Obligated Group); Series 2016, Ref. RB | 5.00% | 07/01/2031 | 5,100 | 5,261,703 | ||
| New Jersey (State of) Health Care Facilities Financing Authority (RWJ Barnabas Health Obligated Group); Series 2016 A, Ref. RB | 5.00% | 07/01/2031 | 8,840 | 9,139,399 | ||
| New Jersey (State of) Housing & Mortgage Finance Agency (Social Bonds); Series 2022 I, RB | 5.00% | 10/01/2053 | 2,805 | 2,929,223 | ||
| New Jersey (State of) Transportation Trust Fund Authority; | ||||||
| Series 2016 A-1, RN | 5.00% | 06/15/2028 | 1,140 | 1,180,407 | ||
| Series 2018 A, Ref. RN | 5.00% | 06/15/2029 | 5,000 | 5,169,125 | ||
| New Jersey (State of) Turnpike Authority; | ||||||
| Series 2014 A, RB | 5.00% | 01/01/2027 | 3,090 | 3,093,649 | ||
| Series 2015 E, RB(e) | 5.00% | 01/01/2032 | 2,060 | 2,070,468 | ||
| Series 2015 E, RB(e) | 5.00% | 01/01/2034 | 7,360 | 7,397,401 | ||
| 55,939,974 | ||||||
| 10 | Invesco Short Term Municipal Fund |
| Interest Rate | Maturity Date | Principal Amount (000) | Value | ||
| New Mexico–1.00% | |||||
| Albuquerque Municipal School District No. 12; | |||||
| Series 2017, GO Bonds | 5.00% | 08/01/2029 | $ 2,575 | $ 2,688,440 | |
| Series 2017, GO Bonds | 5.00% | 08/01/2030 | 1,250 | 1,304,592 | |
| Series 2017, GO Bonds | 5.00% | 08/01/2031 | 1,700 | 1,772,627 | |
| Series 2017, GO Bonds | 5.00% | 08/01/2032 | 2,910 | 3,036,535 | |
| Farmington (City of), NM (Public Service Co. of New Mexico San Juan); Series 2010, Ref. RB(b) | 3.90% | 06/01/2028 | 3,700 | 3,796,137 | |
| New Mexico Mortgage Finance Authority (Mountain View II & III Apartments); Series 2023, RB(b) | 5.00% | 09/01/2025 | 3,000 | 3,032,986 | |
| Saltillo Public Improvement District; Series 2018, Ref. RB (INS - BAM)(a) | 4.00% | 10/01/2025 | 160 | 161,943 | |
| 15,793,260 | |||||
| New York–10.99% | |||||
| Metropolitan Transportation Authority; | |||||
| Series 2015 D-1, Ref. RB | 5.00% | 11/15/2024 | 115 | 115,438 | |
| Series 2015 F, Ref. RB | 5.00% | 11/15/2027 | 525 | 538,093 | |
| Metropolitan Transportation Authority (Green Bonds); | |||||
| Series 2016 A2, Ref. RB | 4.00% | 11/15/2025 | 145 | 147,119 | |
| Series 2017 B, Ref. RB | 5.00% | 11/15/2024 | 3,500 | 3,513,320 | |
| Series 2017 C-1, Ref. RB | 5.00% | 11/15/2026 | 605 | 633,999 | |
| Series 2018 B, Ref. RB | 5.00% | 11/15/2024 | 175 | 175,666 | |
| Monroe County Industrial Development Corp. (Andrews Terrace Community); Series 2024, RB(b) | 5.00% | 07/01/2027 | 5,000 | 5,264,236 | |
| Monroe County Industrial Development Corp. (University of Rochester); | |||||
| Series 2015 A, Ref. RB | 5.00% | 07/01/2030 | 3,275 | 3,329,071 | |
| Series 2015 A, Ref. RB | 5.00% | 07/01/2032 | 2,000 | 2,031,867 | |
| Nassau County Local Economic Assistance Corp. (Catholic Health Services of Long Island Obligated Group); Series 2014, RB | 5.00% | 07/01/2032 | 1,500 | 1,500,972 | |
| Nassau County Tobacco Settlement Corp.; Series 2006 A-2, RB | 5.25% | 06/01/2026 | 2,414 | 2,362,446 | |
| New York & New Jersey (States of) Port Authority; | |||||
| One Hundred Eighty Fourth Series 2014, RB | 5.00% | 09/01/2027 | 2,700 | 2,703,972 | |
| One Hundred Ninety Third Series 2015, Ref. RB(f) | 5.00% | 10/15/2032 | 2,380 | 2,415,211 | |
| One Hundred Seventy Fifth Series 2012, RB | 5.00% | 12/01/2025 | 480 | 480,785 | |
| One Hundred Seventy Fifth Series 2012, RB | 4.00% | 12/01/2026 | 470 | 470,508 | |
| Series 2014, Ref. RB(f) | 5.00% | 10/15/2032 | 2,465 | 2,469,159 | |
| New York (City of), NY; | |||||
| Series 2012, VRD GO Bonds(d) | 2.55% | 04/01/2042 | 12,885 | 12,885,000 | |
| Subseries 2017 B-5, VRD GO Bonds(d) | 2.70% | 10/01/2046 | 10,940 | 10,940,000 | |
| New York (City of), NY Transitional Finance Authority; | |||||
| Series 2015 S-2, RB | 5.00% | 07/15/2030 | 3,000 | 3,055,994 | |
| Series 2016, RB | 5.00% | 05/01/2032 | 3,940 | 4,061,781 | |
| Series 2019 C-4, VRD RB(d) | 2.70% | 11/01/2044 | 7,500 | 7,500,000 | |
| New York (State of) Dormitory Authority; | |||||
| Series 2014 E, Ref. RB | 5.00% | 02/15/2031 | 2,445 | 2,467,277 | |
| Series 2015 A, Ref. RB | 5.00% | 03/15/2031 | 1,860 | 1,880,097 | |
| Series 2015 A, Ref. RB | 5.00% | 03/15/2033 | 2,500 | 2,526,083 | |
| Series 2015 B, RB | 5.00% | 03/15/2032 | 5,370 | 5,471,178 | |
| Series 2016 D, Ref. RB | 5.00% | 02/15/2029 | 3,965 | 4,123,937 | |
| Series 2017 A, Ref. RB | 5.00% | 07/01/2034 | 1,410 | 1,478,462 | |
| New York (State of) Housing Finance Agency; | |||||
| Series 2023 E-2, RB(b) | 3.80% | 05/01/2027 | 4,000 | 4,023,349 | |
| Series 2023 E-2, RB(b) | 3.88% | 05/01/2028 | 4,380 | 4,429,495 | |
| Series 2024, RB(b) | 3.45% | 11/01/2029 | 7,200 | 7,239,404 | |
| New York (State of) Utility Debt Securitization Authority; Series 2015, Ref. RB | 5.00% | 12/15/2033 | 8,635 | 8,849,677 | |
| New York City Housing Development Corp. (Sustainable Development Bonds); | |||||
| Series 2020 I-2, RB(b) | 0.70% | 05/01/2025 | 5,000 | 4,892,329 | |
| Series 2021 F-2, RB (CEP - Federal Housing Administration)(b) | 0.60% | 07/01/2025 | 980 | 957,211 | |
| Series 2022 B-2, RB (CEP - Federal Housing Administration)(b) | 3.40% | 12/22/2026 | 12,845 | 12,857,767 | |
| New York State Urban Development Corp.; Series 2015 A, Ref. RB | 5.00% | 03/15/2032 | 4,235 | 4,318,698 | |
| New York Transportation Development Corp. (American Airlines, Inc. John F. Kennedy International Airport); Series 2020, Ref. RB(f) | 5.25% | 08/01/2031 | 8,135 | 8,665,211 | |
| 11 | Invesco Short Term Municipal Fund |
| Interest Rate | Maturity Date | Principal Amount (000) | Value | |||
| New York–(continued) | ||||||
| New York Transportation Development Corp. (American Airlines, Inc.); | ||||||
| Series 2016, Ref. RB(f) | 5.00% | 08/01/2026 | $ 6,030 | $ 6,039,163 | ||
| Series 2016, Ref. RB(f) | 5.00% | 08/01/2031 | 20,070 | 20,092,583 | ||
| Suffolk Tobacco Asset Securitization Corp.; Series 2021, Ref. RB | 4.00% | 06/01/2050 | 6,225 | 6,223,687 | ||
| 173,130,245 | ||||||
| North Carolina–0.76% | ||||||
| Charlotte-Mecklenburg Hospital Authority (The) (Atrium Health); Series 2018 E, RB(b) | 0.80% | 10/31/2025 | 5,000 | 4,878,091 | ||
| Charlotte-Mecklenburg Hospital Authority (The) (Carolinas Health Care Systems); | ||||||
| Series 2013 A, Ref. RB | 5.00% | 01/15/2026 | 230 | 230,307 | ||
| Series 2016, Ref. RB | 5.00% | 01/15/2034 | 1,500 | 1,535,573 | ||
| North Carolina (State of) Municipal Power Agency No. 1 (Catawba); | ||||||
| Series 2015 A, Ref. RB | 5.00% | 01/01/2028 | 1,645 | 1,688,781 | ||
| Series 2015 A, Ref. RB | 5.00% | 01/01/2031 | 1,610 | 1,645,737 | ||
| North Carolina (State of) Turnpike Authority; Series 2017, Ref. RB | 5.00% | 01/01/2025 | 2,025 | 2,036,822 | ||
| University of North Carolina; Series 2008 A, RB (INS - AGC)(a) | 4.75% | 10/01/2028 | 10 | 10,011 | ||
| 12,025,322 | ||||||
| Ohio–2.36% | ||||||
| Columbus (City of) & Franklin (County of), OH Finance Authority (Easton); Series 2023, RB(b) | 5.00% | 02/01/2027 | 3,000 | 3,116,993 | ||
| Columbus (City of), OH; | ||||||
| Series 2015, Ref. RB | 5.00% | 06/01/2030 | 1,575 | 1,631,925 | ||
| Series 2018 A, GO Bonds | 5.00% | 04/01/2030 | 5,335 | 5,808,911 | ||
| Columbus City School District (Construction and Improvement); Series 2016 A, Ref. GO Bonds | 5.00% | 12/01/2031 | 6,260 | 6,502,539 | ||
| Cuyahoga (County of), OH (Shaker Square); Series 2010 D, Ref. RB | 5.00% | 12/01/2025 | 425 | 425,695 | ||
| Dayton (City of), OH (James M. Cox); Series 2014 A, Ref. RB (INS - AGM)(a)(f) | 5.00% | 12/01/2026 | 1,335 | 1,336,012 | ||
| Greater Cincinnati (Port of), OH Development Authority (IPS Cincinnati LLC); Series 2021, RB(b) | 4.38% | 06/15/2026 | 1,500 | 1,483,587 | ||
| Hamilton (County of), OH; Series 2016 A, Ref. RB | 5.00% | 12/01/2030 | 3,430 | 3,588,468 | ||
| Hamilton (County of), OH (UC Health); | ||||||
| Series 2014, RB | 5.00% | 02/01/2027 | 465 | 465,326 | ||
| Series 2014, RB | 5.00% | 02/01/2028 | 465 | 465,333 | ||
| Series 2014, RB | 5.00% | 02/01/2029 | 425 | 425,304 | ||
| Kent State University; Series 2016, Ref. RB | 5.00% | 05/01/2029 | 1,245 | 1,291,417 | ||
| Martins Ferry (City of), OH; Series 2023, GO Notes | 5.00% | 12/18/2024 | 1,750 | 1,755,668 | ||
| Ohio (State of); | ||||||
| Series 2015 A, RB | 5.00% | 04/01/2028 | 1,375 | 1,392,733 | ||
| Series 2017 A, GO Bonds | 5.00% | 05/01/2028 | 2,330 | 2,364,626 | ||
| Ohio (State of) Higher Educational Facility Commission (University of Dayton); Series 2018, Ref. RB | 5.00% | 12/01/2035 | 2,000 | 2,112,107 | ||
| RiverSouth Authority; Series 2007 A, RB | 5.75% | 12/01/2027 | 490 | 490,170 | ||
| Stark (County of), OH; Series 2004, GO Bonds (INS - NATL)(a) | 4.38% | 12/01/2024 | 5 | 5,005 | ||
| Westerville City School District; Series 2018, COP | 5.00% | 12/01/2039 | 2,450 | 2,562,922 | ||
| 37,224,741 | ||||||
| Oklahoma–0.41% | ||||||
| Grand River Dam Authority; | ||||||
| Series 2014 A, RB(b)(e) | 5.00% | 10/15/2024 | 750 | 751,564 | ||
| Series 2023, RB | 5.00% | 06/01/2037 | 1,800 | 2,062,156 | ||
| Oklahoma (State of) Capitol Improvement Authority (Capitol Repair); Series 2018 C, RB | 5.00% | 01/01/2038 | 2,320 | 2,427,604 | ||
| Oklahoma (State of) Development Finance Authority (Sommerset); Series 2015, RB | 5.00% | 07/01/2025 | 420 | 421,323 | ||
| University of Oklahoma (The); | ||||||
| Series 2014 C, Ref. RB | 5.00% | 07/01/2027 | 500 | 500,332 | ||
| Series 2014 C, Ref. RB | 5.00% | 07/01/2029 | 250 | 250,183 | ||
| 6,413,162 | ||||||
| Oregon–0.54% | ||||||
| Clackamas & Washington Counties School District No. 3; Series 2015, Ref. GO Bonds (CEP - Oregon School Bond Guaranty) | 5.00% | 06/15/2028 | 1,250 | 1,270,511 | ||
| Multnomah (County of), OR Hospital Facilities Authority (Green Bonds); Series 2021 B, Ref. RB | 1.20% | 06/01/2028 | 695 | 630,200 | ||
| Oregon (State of); Series 2020 J, Ref. VRD GO Bonds(d) | 2.65% | 06/01/2039 | 600 | 600,000 | ||
| 12 | Invesco Short Term Municipal Fund |
| Interest Rate | Maturity Date | Principal Amount (000) | Value | |||
| Oregon–(continued) | ||||||
| Oregon (State of) (Article XI-Q State); Series 2016, Ref. GO Bonds | 5.00% | 05/01/2032 | $ 2,885 | $ 2,993,993 | ||
| Oregon (State of) Lottery; Series 2015 D, Ref. RB | 5.00% | 04/01/2028 | 1,525 | 1,544,931 | ||
| Oregon Health & Science University; Series 2016 B, Ref. RB | 5.00% | 07/01/2039 | 1,390 | 1,428,790 | ||
| 8,468,425 | ||||||
| Pennsylvania–3.01% | ||||||
| Allegheny (County of), PA Higher Education Building Authority (Robert Morris University); Series 2017, RB | 5.00% | 10/15/2026 | 325 | 325,496 | ||
| Allegheny (County of), PA Hospital Development Authority (Allegheny Health Network Obligated Group Issue); Series 2018, Ref. RB | 5.00% | 04/01/2033 | 3,800 | 3,987,890 | ||
| Allegheny (County of), PA Sanitary Authority; Series 2013, RB (INS - BAM)(a) | 5.00% | 12/01/2028 | 145 | 145,229 | ||
| Chester (County of), PA Health & Education Facilities Authority (Main Line Health System); Series 2017 A, Ref. RB | 5.00% | 10/01/2035 | 2,025 | 2,116,811 | ||
| Coatesville Area School District Building Authority; Series 2018, RB (INS - BAM)(a) | 5.00% | 12/01/2024 | 425 | 425,510 | ||
| Dallastown Area School District; Series 2017, Ref. GO Notes | 5.00% | 04/15/2026 | 1,000 | 1,012,520 | ||
| Downingtown Area School District; Series 2018 C, GO Bonds | 5.00% | 08/01/2031 | 1,475 | 1,533,557 | ||
| Montgomery (County of), PA Higher Education & Health Authority (Holy Redeemer Health System); Series 2014 A, Ref. RB | 5.00% | 10/01/2024 | 1,165 | 1,164,909 | ||
| Montgomery (County of), PA Industrial Development Authority (Constellation Energy); Series 2023,Ref RB(b) | 4.10% | 04/03/2028 | 3,000 | 3,074,290 | ||
| Pennsylvania (Commonwealth of); First Series 2015, GO Bonds | 5.00% | 03/15/2028 | 1,600 | 1,618,394 | ||
| Pennsylvania (Commonwealth of) Higher Educational Facilities Authority; Series 2016 AT-1, RB | 5.00% | 06/15/2031 | 2,320 | 2,397,878 | ||
| Pennsylvania (Commonwealth of) Higher Educational Facilities Authority (Thomas Jefferson University); Series 2015 B, VRD RB(d) | 3.64% | 09/01/2045 | 10,095 | 10,095,000 | ||
| Pennsylvania (Commonwealth of) Housing Finance Agency (Social Bonds); Series 2024-145A, RB | 6.00% | 10/01/2054 | 1,500 | 1,657,629 | ||
| Pennsylvania (Commonwealth of) Turnpike Commission; | ||||||
| Series 2014 B, RB | 5.00% | 12/01/2031 | 1,000 | 1,003,801 | ||
| Series 2016 A, Ref. RB | 5.00% | 12/01/2030 | 9,990 | 10,424,108 | ||
| Series 2016 B, Ref. RB (INS - AGM)(a) | 5.00% | 06/01/2029 | 800 | 831,845 | ||
| Philadelphia (City of), PA; | ||||||
| Fourteenth Series 2016, Ref. RB | 5.00% | 10/01/2031 | 3,270 | 3,396,398 | ||
| Fourteenth Series 2016, Ref. RB | 5.00% | 10/01/2032 | 1,400 | 1,452,969 | ||
| Sayre (City of), PA Health Care Facilities Authority (Guthrie Health); Series 2007, RB (3 mo. USD LIBOR + 0.78%)(j) | 4.34% | 12/01/2024 | 15 | 14,996 | ||
| Washington (County of), PA Redevelopment Authority (Victory Centre); Series 2018, Ref. RB | 5.00% | 07/01/2028 | 785 | 791,919 | ||
| 47,471,149 | ||||||
| Puerto Rico–0.38% | ||||||
| Puerto Rico (Commonwealth of); Series 2021 A-1, GO Bonds | 5.38% | 07/01/2025 | 60 | 60,781 | ||
| Puerto Rico (Commonwealth of) Electric Power Authority; | ||||||
| Series 2005 RR, RB (Acquired 01/26/2021; Cost $101,001) (INS - AGC)(a)(i) | 5.00% | 07/01/2026 | 100 | 99,959 | ||
| Series 2005 RR, RB (Acquired 01/06/2021; Cost $3,905,000) (INS - SGI)(a)(i) | 5.00% | 07/01/2026 | 3,905 | 3,887,409 | ||
| Series 2005 RR, RB (Acquired 01/06/2021; Cost $1,505,000) (INS - SGI)(a)(i) | 5.00% | 07/01/2027 | 1,505 | 1,496,884 | ||
| Series 2008 WW, RB (Acquired 05/13/2020; Cost $500,000) (INS - AGC)(a)(i) | 5.25% | 07/01/2033 | 500 | 500,021 | ||
| 6,045,054 | ||||||
| Rhode Island–0.87% | ||||||
| Rhode Island Health & Educational Building Corp.; Series 2017 G, RB (INS - AGM)(a) | 5.00% | 05/15/2039 | 2,520 | 2,608,032 | ||
| Rhode Island Housing & Mortgage Finance Corp.; Series 2024 1-A, RB (CEP - Federal Housing Administration)(b) | 3.60% | 10/01/2027 | 3,000 | 2,998,785 | ||
| Tobacco Settlement Financing Corp.; | ||||||
| Series 2015 A, Ref. RB | 5.00% | 06/01/2026 | 1,145 | 1,154,504 | ||
| Series 2015 B, Ref. RB | 4.50% | 06/01/2045 | 6,925 | 6,949,762 | ||
| 13,711,083 | ||||||
| South Carolina–1.33% | ||||||
| Charleston Educational Excellence Finance Corp. (Charleston County School); Series 2014, Ref. RB | 5.00% | 12/01/2031 | 2,500 | 2,507,718 | ||
| 13 | Invesco Short Term Municipal Fund |
| Interest Rate | Maturity Date | Principal Amount (000) | Value | |||
| South Carolina–(continued) | ||||||
| Florence & Darlington (Counties of), SC Commission for Technical Education; Series 2014, Ref. RB | 5.00% | 03/01/2028 | $ 620 | $ 620,928 | ||
| Florence (County of), SC; Series 2014, Ref. RB(b)(e) | 5.00% | 11/01/2024 | 3,610 | 3,620,692 | ||
| Piedmont Municipal Power Agency; Series 2021 C, Ref. RB | 5.00% | 01/01/2032 | 4,000 | 4,120,818 | ||
| SCAGO Educational Facilities Corp. for Pickens School District; | ||||||
| Series 2015, Ref. RB | 5.00% | 12/01/2028 | 1,800 | 1,821,854 | ||
| Series 2015, Ref. RB | 5.00% | 12/01/2030 | 1,190 | 1,203,561 | ||
| South Carolina (State of) Public Service Authority; | ||||||
| Series 2016 A, Ref. RB | 5.00% | 12/01/2029 | 1,885 | 1,936,241 | ||
| Series 2016 A, Ref. RB (INS - AGM)(a) | 5.00% | 12/01/2032 | 5,000 | 5,132,104 | ||
| 20,963,916 | ||||||
| Tennessee–2.12% | ||||||
| Metropolitan Nashville Airport Authority (The); Series 2015 B, RB(f) | 5.00% | 07/01/2033 | 1,550 | 1,566,923 | ||
| Tennessee Energy Acquisition Corp.; | ||||||
| Series 2006 C, RB | 5.00% | 02/01/2027 | 1,835 | 1,886,599 | ||
| Series 2018, RB(b) | 4.00% | 11/01/2025 | 14,060 | 14,092,226 | ||
| Tennessee Energy Acquisition Corp. (Gas); Series 2023 A-1, Ref. RB(b) | 5.00% | 05/01/2028 | 7,415 | 7,729,827 | ||
| Tennessee Housing Development Agency (Social Bonds); Series 2022, RB | 5.50% | 01/01/2053 | 3,600 | 3,806,741 | ||
| Williamson (County of), TX Industrial Development Board; Series 2023, RB(b) | 5.00% | 05/01/2027 | 4,125 | 4,292,753 | ||
| 33,375,069 | ||||||
| Texas–10.66% | ||||||
| Alamo Community College District; Series 2007, GO Bonds (INS - NATL)(a) | 4.50% | 08/15/2033 | 590 | 590,269 | ||
| Arlington Higher Education Finance Corp. (Basis Texas Charter Schools, Inc.); Series 2021, RB(b)(c) | 4.50% | 06/15/2026 | 1,100 | 1,100,279 | ||
| Austin (City of), TX; Series 2015 A, Ref. RB | 5.00% | 11/15/2029 | 5,600 | 5,733,251 | ||
| Boerne Independent School District; Series 2022, GO Bonds (CEP - Texas Permanent School Fund)(b) | 3.85% | 12/01/2027 | 2,570 | 2,637,089 | ||
| Calhoun (County of), TX Navigation Industrial Development Authority (Max Midstream Texas LLC); Series 2021, RN(c)(f) | 3.63% | 07/01/2026 | 2,200 | 1,868,467 | ||
| Conroe Independent School District; Series 2016 A, Ref. GO Bonds (CEP - Texas Permanent School Fund) | 5.00% | 02/15/2028 | 7,810 | 8,070,367 | ||
| Dallas & Fort Worth (Cities of), TX (Dallas/Fort Worth International Airport); | ||||||
| Series 2024, RB | 5.00% | 11/01/2039 | 1,050 | 1,190,321 | ||
| Series 2024, RB | 5.00% | 11/01/2040 | 875 | 985,625 | ||
| Dallas (City of), TX; | ||||||
| Series 2015 A, Ref. RB | 5.00% | 10/01/2032 | 3,835 | 3,911,030 | ||
| Series 2015, GO Bonds | 5.00% | 02/15/2030 | 1,055 | 1,064,319 | ||
| Series 2015, GO Bonds | 5.00% | 02/15/2032 | 5,035 | 5,074,840 | ||
| Series 2017, RB | 5.00% | 10/01/2031 | 1,745 | 1,843,649 | ||
| Dallas (City of), TX (Dallas, Denton, Collin and Rockwall Counties); Series 2016 A, Ref. RB | 5.00% | 10/01/2041 | 1,000 | 1,025,083 | ||
| Dallas (County of), TX; Series 2016, Ctfs. of Obligation | 5.00% | 08/15/2029 | 4,605 | 4,788,741 | ||
| Denton (City of), TX; | ||||||
| Series 2017, RB | 5.00% | 12/01/2030 | 1,320 | 1,372,109 | ||
| Series 2017, RB | 5.00% | 12/01/2035 | 3,240 | 3,340,192 | ||
| DeSoto Independent School District; Series 2015 B, Ref. GO Bonds (INS - BAM)(a) | 5.00% | 08/15/2032 | 2,000 | 2,032,774 | ||
| El Paso (City of), TX; Series 2016, GO Bonds | 5.00% | 08/15/2034 | 2,100 | 2,157,128 | ||
| El Paso (County of), TX Hospital District; Series 2013, Ctfs. of Obligation(b)(e) | 5.00% | 11/26/2024 | 675 | 677,793 | ||
| Friendswood Independent School District; Series 2024, GO Notes | 5.00% | 02/15/2031 | 1,500 | 1,550,975 | ||
| Garland (City of), TX; Series 2016 B, RB | 5.00% | 03/01/2031 | 1,000 | 1,023,706 | ||
| Godley Independent School District; Series 2015, Ref. GO Bonds (CEP - Texas Permanent School Fund) | 5.00% | 02/15/2029 | 1,090 | 1,099,589 | ||
| Goose Creek Consolidated Independent School District; Series 2016 A, Ref. GO Bonds (CEP - Texas Permanent School Fund) | 5.00% | 02/15/2029 | 5,000 | 5,165,242 | ||
| Grand Prairie Independent School District; Series 2011, Ref. GO Bonds (CEP - Texas Permanent School Fund) | 4.00% | 02/15/2026 | 675 | 675,380 | ||
| Guadalupe (County of) & Seguin (City of), TX Hospital Board of Managers; Series 2015, Ref. RB | 5.00% | 12/01/2024 | 1,865 | 1,863,827 | ||
| Gulf Coast Authority (Bayport Area System); Series 2015, RB (INS - AGM)(a) | 5.00% | 10/01/2031 | 1,410 | 1,434,505 | ||
| 14 | Invesco Short Term Municipal Fund |
| Interest Rate | Maturity Date | Principal Amount (000) | Value | |||
| Texas–(continued) | ||||||
| Harris & Montgomery (Counties of), TX Municipal Utility District No. 386; Series 2014, GO Bonds (INS - AGM)(a) | 4.00% | 09/01/2030 | $ 620 | $ 620,316 | ||
| Harris (County of), TX; Series 2014 A, Ref. GO Bonds(b)(e) | 5.00% | 11/05/2024 | 2,035 | 2,041,269 | ||
| Harris County Cultural Education Facilities Finance Corp. (Memorial Hermann Health System); Series 2016, RB | 5.00% | 07/01/2038 | 1,605 | 1,642,220 | ||
| Harris County Cultural Education Facilities Finance Corp. (Teco Project); Series 2017, Ref. RB | 5.00% | 11/15/2033 | 3,675 | 3,887,368 | ||
| Humble Independent School District; Series 2015 A, Ref. GO Bonds (CEP - Texas Permanent School Fund) | 4.00% | 02/15/2030 | 9,595 | 9,617,796 | ||
| Lamar Consolidated Independent School District; | ||||||
| Series 2016 A, Ref. GO Bonds (CEP - Texas Permanent School Fund) | 5.00% | 02/15/2028 | 1,000 | 1,010,101 | ||
| Series 2018, GO Bonds (CEP - Texas Permanent School Fund) | 5.00% | 02/15/2043 | 1,000 | 1,034,255 | ||
| Lancaster Independent School District; Series 2015, Ref. GO Bonds (INS - BAM)(a) | 5.00% | 02/15/2030 | 1,670 | 1,682,206 | ||
| Leander Independent School District; Series 2015 A, Ref. GO Bonds (CEP - Texas Permanent School Fund) | 5.00% | 08/15/2040 | 3,000 | 3,045,257 | ||
| Lewisville Independent School District; Series 2016 B, Ref. GO Bonds | 5.00% | 08/15/2028 | 1,000 | 1,018,945 | ||
| Lovejoy Independent School District; Series 2016, Ref. GO Bonds (CEP - Texas Permanent School Fund) | 5.00% | 02/15/2033 | 2,665 | 2,731,999 | ||
| Mission Economic Development Corp. (Natgasoline); Series 2018, Ref. RB(c)(f) | 4.63% | 10/01/2031 | 1,000 | 1,001,437 | ||
| Mueller Local Government Corp.; Series 2009, RB | 4.25% | 09/01/2029 | 30 | 30,014 | ||
| North East Independent School District; Series 2015, Ref. GO Bonds (CEP - Texas Permanent School Fund) | 5.00% | 08/01/2031 | 2,355 | 2,402,917 | ||
| North Harris (County of), TX Regional Water Authority; | ||||||
| Series 2013, Ref. RB (INS - BAM)(a) | 5.00% | 12/15/2030 | 205 | 205,255 | ||
| Series 2016, Ref. RB | 5.00% | 12/15/2032 | 1,290 | 1,337,105 | ||
| North Texas Tollway Authority; | ||||||
| Series 2015 A, Ref. RB | 5.00% | 01/01/2032 | 13,200 | 13,269,978 | ||
| Series 2016 A, Ref. RB | 5.00% | 01/01/2025 | 1,310 | 1,314,426 | ||
| Series 2016 A, Ref. RB | 5.00% | 01/01/2031 | 1,000 | 1,025,522 | ||
| Series 2017 A, RB | 5.00% | 01/01/2025 | 55 | 55,186 | ||
| Series 2017 B, Ref. RB | 5.00% | 01/01/2025 | 15 | 15,020 | ||
| Pearland (City of), TX; Series 2014, Ref. GO Bonds | 5.00% | 03/01/2025 | 200 | 200,260 | ||
| Pecos Barstow Toyah Independent School District; | ||||||
| Series 2023, GO Bonds (CEP - Texas Permanent School Fund) | 5.00% | 02/15/2038 | 1,350 | 1,380,854 | ||
| Series 2023, GO Bonds (CEP - Texas Permanent School Fund) | 5.00% | 02/15/2040 | 1,885 | 1,921,378 | ||
| Plano (City of), TX; Series 2023, Ref. GO Bonds | 5.00% | 09/01/2036 | 3,370 | 3,856,497 | ||
| Rowlett (City of), TX (Bayside Public Improvement District North Improvement Area); Series 2016, RB | 4.90% | 09/15/2024 | 30 | 29,996 | ||
| San Antonio (City of), TX; | ||||||
| Series 2019 C, RB(b) | 1.75% | 12/01/2024 | 10,000 | 9,943,275 | ||
| Series 2024 E, Ref. RB | 5.00% | 02/01/2036 | 5,000 | 5,798,164 | ||
| San Antonio Independent School District; Series 2016, Ref. GO Bonds (CEP - Texas Permanent School Fund) | 5.00% | 08/15/2031 | 1,615 | 1,682,875 | ||
| Tarrant (County of), TX Regional Water District; Series 2015, Ref. RB | 5.00% | 03/01/2028 | 1,055 | 1,064,959 | ||
| Tarrant County Cultural Education Facilities Finance Corp. (Baylor Scott & White Health); Series 2016, Ref. RB | 5.00% | 11/15/2032 | 1,020 | 1,045,179 | ||
| Texas (State of); Series 2014 A, Ref. GO Bonds | 5.00% | 10/01/2025 | 1,000 | 1,001,776 | ||
| Texas (State of) Transportation Commission (Central Texas Turnpike System); Series 2015 C, Ref. RB(b)(e) | 5.00% | 11/04/2024 | 3,000 | 3,009,092 | ||
| Texas (State of) Water Development Board (State Water Implementation Fund); Series 2015 A, RB | 5.00% | 10/15/2031 | 2,875 | 2,936,198 | ||
| Texas Municipal Gas Acquisition & Supply Corp. I; Series 2008 D, RB | 6.25% | 12/15/2026 | 10,155 | 10,504,849 | ||
| Texas Municipal Gas Acquisition & Supply Corp. II; Series 2007, RB (SIFMA Municipal Swap Index + 0.55%)(j) | 3.39% | 09/15/2027 | 8,715 | 8,646,937 | ||
| University of Houston; Series 2017 A, Ref. RB | 5.00% | 02/15/2033 | 2,275 | 2,336,255 | ||
| West Travis County Public Utility Agency; Series 2017, Ref. RB (INS - BAM)(a) | 5.00% | 08/15/2030 | 45 | 47,771 | ||
| Wink-Loving Independent School District; | ||||||
| Series 2024, GO Bonds (CEP - Texas Permanent School Fund) | 5.00% | 02/15/2029 | 500 | 509,189 | ||
| Series 2024, GO Bonds (CEP - Texas Permanent School Fund) | 5.00% | 02/15/2032 | 700 | 712,535 | ||
| 167,893,181 | ||||||
| 15 | Invesco Short Term Municipal Fund |
| Interest Rate | Maturity Date | Principal Amount (000) | Value | |||
| Utah–0.22% | ||||||
| Grand (County of), UT School District Local Building Authority; | ||||||
| Series 2019, RB (INS - AGM)(a) | 5.00% | 12/15/2030 | $ 1,370 | $ 1,403,414 | ||
| Series 2019, RB (INS - AGM)(a) | 5.00% | 12/15/2038 | 2,040 | 2,081,989 | ||
| 3,485,403 | ||||||
| Virginia–0.76% | ||||||
| Virginia (Commonwealth of) Housing Development Authority; Series 2023 E-2, RB(b) | 3.90% | 07/01/2025 | 10,000 | 10,001,990 | ||
| Virginia Beach Development Authority (Westminster-Canterbury on Chesapeake Bay); Series 2023 B-3, RB | 5.38% | 09/01/2029 | 1,850 | 1,924,961 | ||
| 11,926,951 | ||||||
| Washington–4.12% | ||||||
| Central Puget Sound Regional Transit Authority; Series 1999, RB (INS - NATL)(a) | 4.75% | 02/01/2028 | 1,230 | 1,246,120 | ||
| Kelso (City of), WA Housing Authority (Chinook & Columbia Apartments); Series 1998, RB | 5.60% | 03/01/2028 | 10 | 10,003 | ||
| King (County of), WA; Series 2024, Ref. VRD RB(d) | 2.55% | 01/01/2042 | 7,500 | 7,500,000 | ||
| King County School District No. 411 Issaquah; Series 2017, GO Bonds (CEP - Oregon School Bond Guaranty) | 5.00% | 12/01/2032 | 1,035 | 1,083,797 | ||
| Lewis (County of), WA Public Utility District No. 1; Series 2013, Ref. RB | 5.25% | 04/01/2032 | 5,000 | 5,017,377 | ||
| Seattle (Port of), WA; | ||||||
| Series 2015 A, RB(b)(e) | 5.00% | 11/12/2024 | 2,840 | 2,850,023 | ||
| Series 2015 B, Ref. RB(b)(e) | 5.00% | 11/12/2024 | 2,365 | 2,373,347 | ||
| Series 2015 B, Ref. RB(b)(e) | 5.00% | 11/12/2024 | 2,000 | 2,007,059 | ||
| Series 2017 C, RB(f) | 5.00% | 05/01/2025 | 275 | 277,899 | ||
| Series 2017, GO Bonds | 5.00% | 01/01/2042 | 3,375 | 3,499,545 | ||
| University of Washington; Series 2015 B, Ref. RB | 5.00% | 06/01/2031 | 1,010 | 1,024,856 | ||
| Washington (State of); | ||||||
| Series 2014 B, Ref. GO Bonds | 5.00% | 07/01/2026 | 11,980 | 12,005,266 | ||
| Series 2015 A-1, GO Bonds | 5.00% | 08/01/2029 | 10,000 | 10,178,972 | ||
| Series 2016 B, GO Bonds | 5.00% | 08/01/2031 | 1,205 | 1,252,838 | ||
| Series 2016 B, Ref. GO Bonds | 5.00% | 07/01/2032 | 1,140 | 1,171,100 | ||
| Washington (State of) Economic Development Finance Authority; Series 2014, Ref. RB | 5.00% | 06/01/2032 | 2,920 | 2,932,883 | ||
| Washington (State of) Health Care Facilities Authority (Multicare Health System); Series 2015 B, Ref. RB | 5.00% | 08/15/2031 | 2,505 | 2,533,632 | ||
| Washington (State of) Health Care Facilities Authority (Providence Health & Services); | ||||||
| Series 2012 A, RB | 5.00% | 10/01/2025 | 125 | 125,073 | ||
| Series 2012 A, RB | 5.00% | 10/01/2026 | 2,540 | 2,548,687 | ||
| Series 2012 A, RB | 5.00% | 10/01/2027 | 2,415 | 2,419,754 | ||
| Series 2012 A, RB | 5.00% | 10/01/2028 | 165 | 165,412 | ||
| Series 2012 A, RB | 4.25% | 10/01/2040 | 2,800 | 2,669,668 | ||
| 64,893,311 | ||||||
| West Virginia–0.07% | ||||||
| West Virginia (State of) Hospital Finance Authority (West Virginia University Health System Obligated Group); Series 2017, RB | 5.00% | 06/01/2035 | 1,100 | 1,136,389 | ||
| Wisconsin–3.21% | ||||||
| Central Brown County Water Authority; | ||||||
| Series 2014 A, Ref. RB(b)(e) | 5.00% | 11/01/2024 | 1,000 | 1,002,962 | ||
| Series 2014 A, Ref. RB(b)(e) | 5.00% | 11/01/2024 | 2,160 | 2,166,398 | ||
| Series 2014 A, Ref. RB(b)(e) | 5.00% | 11/01/2024 | 2,500 | 2,507,405 | ||
| Series 2014 A, Ref. RB(b)(e) | 5.00% | 11/01/2024 | 2,985 | 2,993,841 | ||
| Wisconsin (State of) Health & Educational Facilities Authority (Advocate Aurora Health Credit Group); Series 2018, Ref. RB(b) | 5.00% | 01/29/2025 | 10,000 | 10,044,971 | ||
| Wisconsin (State of) Health & Educational Facilities Authority (Ascension Health Credit Group); Series 2016 A, Ref. RB | 5.00% | 11/15/2039 | 1,350 | 1,379,530 | ||
| Wisconsin (State of) Health & Educational Facilities Authority (Aspirus, Inc. Obligated Group); | ||||||
| Series 2013, RB | 5.00% | 08/15/2026 | 100 | 100,231 | ||
| Series 2013, RB | 5.00% | 08/15/2027 | 800 | 801,778 | ||
| Wisconsin (State of) Health & Educational Facilities Authority (Forensic Science and Protective Medicine Facility); Series 2024, RB(c) | 5.00% | 08/01/2027 | 5,000 | 5,136,671 | ||
| 16 | Invesco Short Term Municipal Fund |
| Interest Rate | Maturity Date | Principal Amount (000) | Value | ||
| Wisconsin–(continued) | |||||
| Wisconsin (State of) Health & Educational Facilities Authority (Hospital Sisters Services, Inc.); Series 2014, Ref. RB | 5.00% | 11/15/2029 | $ 1,800 | $ 1,804,932 | |
| Wisconsin (State of) Health & Educational Facilities Authority (Mercy Alliance); Series 2012, RB | 5.00% | 06/01/2027 | 3,225 | 3,227,954 | |
| Wisconsin (State of) Health & Educational Facilities Authority (Prohealth Care Obligated Group); | |||||
| Series 2015, Ref. RB(b)(e) | 5.00% | 11/12/2024 | 170 | 170,600 | |
| Series 2015, Ref. RB(b)(e) | 5.00% | 11/12/2024 | 1,815 | 1,821,406 | |
| Wisconsin (State of) Health & Educational Facilities Authority (Thedacare, Inc.); Series 2015, Ref. RB | 5.00% | 12/15/2029 | 125 | 125,582 | |
| Wisconsin (State of) Health & Educational Facilities Authority (Unitypoint Health); | |||||
| Series 2014 A, RB | 5.00% | 12/01/2028 | 980 | 982,080 | |
| Series 2014 A, RB | 5.00% | 12/01/2029 | 1,475 | 1,478,135 | |
| Wisconsin (State of) Housing & Economic Development Authority; Series 2023 E, RB(b) | 3.88% | 05/01/2027 | 4,400 | 4,436,125 | |
| Wisconsin (State of) Public Finance Authority; | |||||
| Series 2016, RB | 5.00% | 03/01/2032 | 4,315 | 4,450,674 | |
| Series 2022, Ref. RB(b) | 3.30% | 10/01/2026 | 1,745 | 1,744,680 | |
| Wisconsin (State of) Public Finance Authority (Prime Healthcare Foundation, Inc.); Series 2018 A, RB | 5.00% | 12/01/2027 | 860 | 876,615 | |
| Wisconsin (State of) Public Finance Authority (Renown Regional Medical Center); Series 2015 A, Ref. RB | 5.00% | 06/01/2031 | 3,295 | 3,322,392 | |
| 50,574,962 | |||||
| Total Municipal Obligations (Cost $1,535,025,762) | 1,545,569,904 | ||||
| Shares | |||||
| MuniFund Preferred Shares–1.00% | |||||
| Nuveen AMT-Free Municipal Credit Income Fund, Series B(c)(d) | 5,750,000 | 5,750,000 | |||
| Nuveen AMT-Free Quality Municipal Income Fund, MFP, Series D(c) | 10,000,000 | 10,000,000 | |||
| Total MuniFund Preferred Shares (Cost $15,750,000) | 15,750,000 | ||||
| Exchange-Traded Funds–0.06% | |||||
| Invesco Municipal Strategic Income ETF (Cost $872,950)(k) | 17,000 | 873,372 | |||
| Interest Rate | Maturity Date | Principal Amount (000) | |||
| U.S. Dollar Denominated Bonds & Notes–0.00% | |||||
| California–0.00% | |||||
| CalPlant I LLC; Exit Facility (Cost $75,000)(c) | 15.00% | 07/01/2025 | $ 75 | 76,575 | |
| TOTAL INVESTMENTS IN SECURITIES(l)–99.18% (Cost $1,551,723,712) | 1,562,269,851 | ||||
| OTHER ASSETS LESS LIABILITIES–0.82% | 12,950,033 | ||||
| NET ASSETS–100.00% | $1,575,219,884 | ||||
| 17 | Invesco Short Term Municipal Fund |
| AGC | – Assured Guaranty Corp. |
| AGM | – Assured Guaranty Municipal Corp. |
| AMBAC | – American Municipal Bond Assurance Corp. |
| BAM | – Build America Mutual Assurance Co. |
| CEP | – Credit Enhancement Provider |
| COP | – Certificates of Participation |
| Ctfs. | – Certificates |
| ETF | – Exchange-Traded Fund |
| FHLMC | – Federal Home Loan Mortgage Corp. |
| GNMA | – Government National Mortgage Association |
| GO | – General Obligation |
| INS | – Insurer |
| LIBOR | – London Interbank Offered Rate |
| LOC | – Letter of Credit |
| MFP | – MuniFund Preferred Shares |
| NATL | – National Public Finance Guarantee Corp. |
| RB | – Revenue Bonds |
| Ref. | – Refunding |
| RN | – Revenue Notes |
| SGI | – Syncora Guarantee, Inc. |
| SIFMA | – Securities Industry and Financial Markets Association |
| SOFR | – Secured Overnight Financing Rate |
| USD | – U.S. Dollar |
| VRD | – Variable Rate Demand |
| Wts. | – Warrants |
| (a) | Principal and/or interest payments are secured by the bond insurance company listed. |
| (b) | Security has an irrevocable call by the issuer or mandatory put by the holder. Maturity date reflects such call or put. |
| (c) | Security purchased or received in a transaction exempt from registration under the Securities Act of 1933, as amended (the “1933 Act”). The security may be resold pursuant to an exemption from registration under the 1933 Act, typically to qualified institutional buyers. The aggregate value of these securities at August 31, 2024 was $65,989,871, which represented 4.19% of the Fund’s Net Assets. |
| (d) | Demand security payable upon demand by the Fund at specified time intervals no greater than thirteen months. Interest rate is redetermined periodically by the issuer or agent based on current market conditions. Rate shown is the rate in effect on August 31, 2024. |
| (e) | Advance refunded; secured by an escrow fund of U.S. Government obligations or other highly rated collateral. |
| (f) | Security subject to the alternative minimum tax. |
| (g) | Principal and interest payments are fully enhanced by a letter of credit from the bank listed or a predecessor bank, branch or subsidiary. |
| (h) | Zero coupon bond issued at a discount. |
| (i) | Restricted security. The aggregate value of these securities at August 31, 2024 was $6,713,047, which represented less than 1% of the Fund’s Net Assets. |
| (j) | Interest or dividend rate is redetermined periodically. Rate shown is the rate in effect on August 31, 2024. |
| (k) | Affiliated holding. Affiliated holdings are investments in entities which are under common ownership or control of Invesco Ltd. or are investments in entities in which the Fund owns 5% or more of the outstanding voting securities. The table below shows the Fund’s transactions in, and earnings from, its investments in affiliates for the fiscal year ended August 31, 2024. |
| Value August 31, 2023 | Purchases at Cost | Proceeds from Sales | Change in Unrealized Appreciation | Realized Gain | Value August 31, 2024 | Dividend Income | |
| Invesco Municipal Strategic Income ETF | $- | $872,950 | $- | $422 | $- | $873,372 | $- |
| (l) | Entities may either issue, guarantee, back or otherwise enhance the credit quality of a security. The entities are not primarily responsible for the issuer’s obligations but may be called upon to satisfy issuer’s obligations. No concentration of any single entity was greater than 5% each. |
| 18 | Invesco Short Term Municipal Fund |
| Assets: | |
| Investments in unaffiliated securities, at value (Cost $1,550,850,762) | $1,561,396,479 |
| Investments in affiliates, at value (Cost $872,950) | 873,372 |
| Cash | 16,286,762 |
| Receivable for: | |
| Investments sold | 2,860,000 |
| Fund shares sold | 629,400 |
| Dividends | 629 |
| Interest | 17,100,449 |
| Investments matured, at value (Cost $926,990) | 187,695 |
| Investment for trustee deferred compensation and retirement plans | 54,164 |
| Other assets | 62,660 |
| Total assets | 1,599,451,610 |
| Liabilities: | |
| Payable for: | |
| Investments purchased | 20,238,075 |
| Dividends | 1,598,601 |
| Fund shares reacquired | 1,824,842 |
| Accrued fees to affiliates | 437,079 |
| Accrued trustees’ and officers’ fees and benefits | 5,354 |
| Accrued other operating expenses | 73,611 |
| Trustee deferred compensation and retirement plans | 54,164 |
| Total liabilities | 24,231,726 |
| Net assets applicable to shares outstanding | $1,575,219,884 |
| Net assets consist of: | |
| Shares of beneficial interest | $1,603,295,346 |
| Distributable earnings (loss) | (28,075,462) |
| $1,575,219,884 | |
| Net Assets: | |
| Class A | $469,453,613 |
| Class Y | $1,023,037,059 |
| Class R6 | $82,729,212 |
| Shares outstanding, no par value, with an unlimited number of shares authorized: | |
| Class A | 125,711,133 |
| Class Y | 273,906,481 |
| Class R6 | 22,077,435 |
| Class A: | |
| Net asset value and offering price per share | $3.73 |
| Class Y: | |
| Net asset value and offering price per share | $3.73 |
| Class R6: | |
| Net asset value and offering price per share | $3.75 |
| 19 | Invesco Short Term Municipal Fund |
| Investment income: | |
| Interest | $62,931,263 |
| Dividends | 629 |
| Total investment income | 62,931,892 |
| Expenses: | |
| Advisory fees | 6,467,115 |
| Administrative services fees | 240,066 |
| Custodian fees | 6,983 |
| Distribution fees: | |
| Class A | 1,326,398 |
| Transfer agent fees — A and Y | 1,426,780 |
| Transfer agent fees — R6 | 9,621 |
| Trustees’ and officers’ fees and benefits | 38,714 |
| Registration and filing fees | 119,149 |
| Reports to shareholders | 139,164 |
| Professional services fees | 133,227 |
| Other | 30,939 |
| Total expenses | 9,938,156 |
| Less: Expense offset arrangement(s) | (3,038) |
| Net expenses | 9,935,118 |
| Net investment income | 52,996,774 |
| Realized and unrealized gain (loss) from: | |
| Net realized gain (loss) from unaffiliated investment securities (includes net gains (losses) from securities sold to affiliates of $(1,095,494)) | (7,424,526) |
| Change in net unrealized appreciation of: | |
| Unaffiliated investment securities | 16,755,877 |
| Affiliated investment securities | 422 |
| 16,756,299 | |
| Net realized and unrealized gain | 9,331,773 |
| Net increase in net assets resulting from operations | $62,328,547 |
| 20 | Invesco Short Term Municipal Fund |
| 2024 | 2023 | |
| Operations: | ||
| Net investment income | $52,996,774 | $57,693,882 |
| Net realized gain (loss) | (7,424,526) | (13,744,260) |
| Change in net unrealized appreciation | 16,756,299 | 490,608 |
| Net increase in net assets resulting from operations | 62,328,547 | 44,440,230 |
| Distributions to shareholders from distributable earnings: | ||
| Class A | (17,003,397) | (16,930,046) |
| Class Y | (37,110,485) | (33,316,311) |
| Class R6 | (2,270,388) | (1,584,619) |
| Total distributions from distributable earnings | (56,384,270) | (51,830,976) |
| Share transactions–net: | ||
| Class A | (144,263,341) | (386,987,386) |
| Class Y | (124,962,677) | (389,898,862) |
| Class R6 | 19,654,419 | 17,329,638 |
| Net increase (decrease) in net assets resulting from share transactions | (249,571,599) | (759,556,610) |
| Net increase (decrease) in net assets | (243,627,322) | (766,947,356) |
| Net assets: | ||
| Beginning of year | 1,818,847,206 | 2,585,794,562 |
| End of year | $1,575,219,884 | $1,818,847,206 |
| 21 | Invesco Short Term Municipal Fund |
| Net asset value, beginning of period | Net investment income(a) | Net gains (losses) on securities (both realized and unrealized) | Total from investment operations | Dividends from net investment income | Net asset value, end of period | Total return(b) | Net assets, end of period (000’s omitted) | Ratio of expenses to average net assets with fee waivers and/or expenses absorbed | Ratio of expenses to average net assets without fee waivers and/or expenses absorbed | Supplemental ratio of expenses to average net assets with fee waivers (excluding interest, facilities and maintenance fees) | Ratio of net investment income to average net assets | Portfolio turnover (c) | |
| Class A | |||||||||||||
| Year ended 08/31/24 | $3.72 | $0.11 | $0.02 | $0.13 | $(0.12) | $3.73 | 3.53% | $469,454 | 0.77% | 0.77% | 0.77% | 3.00% | 91% |
| Year ended 08/31/23 | 3.73 | 0.09 | (0.01) | 0.08 | (0.09) | 3.72 | 2.05 | 612,000 | 0.74 | 0.74 | 0.74 | 2.51 | 92 |
| Year ended 08/31/22 | 3.79 | 0.02 | (0.06) | (0.04) | (0.02) | 3.73 | (1.08) | 1,001,761 | 0.75 | 0.75 | 0.74 | 0.57 | 114 |
| Year ended 08/31/21 | 3.79 | 0.02 | 0.01 | 0.03 | (0.03) | 3.79 | 0.72 | 1,581,245 | 0.78 | 0.78 | 0.75 | 0.59 | 24 |
| Year ended 08/31/20 | 3.77 | 0.06 | 0.02 | 0.08 | (0.06) | 3.79 | 2.14 | 896,488 | 0.82 | 0.82 | 0.76 | 1.56 | 89 |
| Three months ended 08/31/19 | 3.75 | 0.02 | 0.02 | 0.04 | (0.02) | 3.77 | 1.03 | 405,334 | 0.82(d) | 0.82(d) | 0.76(d) | 1.72(d) | 13 |
| Class Y | |||||||||||||
| Year ended 08/31/24 | 3.72 | 0.12 | 0.02 | 0.14 | (0.13) | 3.73 | 3.80 | 1,023,037 | 0.52 | 0.52 | 0.52 | 3.25 | 91 |
| Year ended 08/31/23 | 3.73 | 0.10 | (0.01) | 0.09 | (0.10) | 3.72 | 2.30 | 1,144,013 | 0.49 | 0.49 | 0.49 | 2.76 | 92 |
| Year ended 08/31/22 | 3.80 | 0.03 | (0.07) | (0.04) | (0.03) | 3.73 | (1.08) | 1,538,307 | 0.50 | 0.50 | 0.49 | 0.82 | 114 |
| Year ended 08/31/21 | 3.79 | 0.03 | 0.02 | 0.05 | (0.04) | 3.80 | 1.24 | 1,764,272 | 0.53 | 0.53 | 0.50 | 0.84 | 24 |
| Year ended 08/31/20 | 3.77 | 0.07 | 0.02 | 0.09 | (0.07) | 3.79 | 2.39 | 1,230,817 | 0.57 | 0.57 | 0.51 | 1.81 | 89 |
| Three months ended 08/31/19 | 3.75 | 0.02 | 0.02 | 0.04 | (0.02) | 3.77 | 1.09 | 797,580 | 0.57(d) | 0.57(d) | 0.51(d) | 1.97(d) | 13 |
| Class R6 | |||||||||||||
| Year ended 08/31/24 | 3.73 | 0.12 | 0.03 | 0.15 | (0.13) | 3.75 | 4.15 | 82,729 | 0.45 | 0.45 | 0.45 | 3.32 | 91 |
| Year ended 08/31/23 | 3.75 | 0.11 | (0.03) | 0.08 | (0.10) | 3.73 | 2.10 | 62,833 | 0.42 | 0.42 | 0.42 | 2.83 | 92 |
| Year ended 08/31/22 | 3.81 | 0.03 | (0.06) | (0.03) | (0.03) | 3.75 | (0.75) | 45,727 | 0.44 | 0.44 | 0.43 | 0.88 | 114 |
| Year ended 08/31/21 | 3.80 | 0.03 | 0.02 | 0.05 | (0.04) | 3.81 | 1.32 | 25,405 | 0.44 | 0.44 | 0.41 | 0.93 | 24 |
| Year ended 08/31/20 | 3.77 | 0.07 | 0.03 | 0.10 | (0.07) | 3.80 | 2.72 | 2,903 | 0.50 | 0.51 | 0.44 | 1.88 | 89 |
| Three months ended 08/31/19 | 3.75 | 0.02 | 0.02 | 0.04 | (0.02) | 3.77 | 1.10 | 10 | 0.50(d) | 0.50(d) | 0.44(d) | 2.05(d) | 13 |
| (a) | Calculated using average shares outstanding. |
| (b) | Includes adjustments in accordance with accounting principles generally accepted in the United States of America and as such, the net asset value for financial reporting purposes and the returns based upon those net asset values may differ from the net asset value and returns for shareholder transactions. Not annualized for periods less than one year, if applicable. |
| (c) | Portfolio turnover is calculated at the fund level and is not annualized for periods less than one year, if applicable. |
| (d) | Annualized. |
| 22 | Invesco Short Term Municipal Fund |
| A. | Security Valuations – Securities, including restricted securities, are valued according to the following policy. |
| B. | Securities Transactions and Investment Income – Securities transactions are accounted for on a trade date basis. Realized gains or losses on sales are computed on the basis of specific identification of the securities sold. Interest income (net of withholding tax, if any) is recorded on an accrual basis from settlement date and includes coupon interest and amortization of premium and accretion of discount on debt securities as applicable. Pay-in-kind interest income and non-cash dividend income received in the form of securities in lieu of cash are recorded at the fair value of the securities received. Paydown gains and losses on mortgage and asset-backed securities are recorded as adjustments to interest income. Dividend income (net of withholding tax, if any) is recorded on the ex-dividend date. |
| C. | Country Determination — For the purposes of making investment selection decisions and presentation in the Schedule of Investments, the investment adviser may determine the country in which an issuer is located and/or credit risk exposure based on various factors. These factors include the laws of the country under which the issuer is organized, where the issuer maintains a principal office, the country in which the issuer derives 50% or more of its total revenues, the country that has the primary market for the issuer’s securities and its "country of risk" as determined by a third party service provider, as well as other criteria. Among the other criteria that may be evaluated for making this determination are the country in which the issuer maintains 50% or more of its assets, the type of security, financial guarantees and enhancements, the nature of the collateral and the sponsor organization. Country of issuer and/or credit risk exposure has been determined to be the United States of America, unless otherwise noted. |
| D. | Distributions – Distributions from net investment income, if any, are declared daily and paid monthly. Distributions from net realized capital gain, if any, are generally declared and paid annually and recorded on the ex-dividend date. The Fund may elect to treat a portion of the proceeds from redemptions as distributions for federal income tax purposes. |
| 23 | Invesco Short Term Municipal Fund |
| E. | Federal Income Taxes – The Fund intends to comply with the requirements of Subchapter M of the Internal Revenue Code of 1986, as amended (the “Internal Revenue Code”), necessary to qualify as a regulated investment company and to distribute substantially all of the Fund’s taxable earnings to shareholders. As such, the Fund will not be subject to federal income taxes on otherwise taxable income (including net realized capital gain) that is distributed to shareholders. Therefore, no provision for federal income taxes is recorded in the financial statements. |
| F. | Expenses – Fees provided for under the Rule 12b-1 plan of a particular class of the Fund are charged to the operations of such class. Transfer agency fees and expenses and other shareholder recordkeeping fees and expenses attributable to Class R6 are charged to such class. Transfer agency fees and expenses and other shareholder recordkeeping fees and expenses relating to all other classes are allocated among those classes based on relative net assets. All other expenses are allocated among the classes based on the relative value of settled shares. |
| G. | Interest, Facilities and Maintenance Fees — Interest, Facilities and Maintenance Fees include interest and related borrowing costs such as commitment fees, administrative expenses, negative or overdrawn balances on margin accounts and other expenses associated with establishing and maintaining a line of credit. |
| H. | Accounting Estimates – The preparation of financial statements in conformity with accounting principles generally accepted in the United States of America (“GAAP”) requires management to make estimates and assumptions that affect the reported amounts of assets and liabilities at the date of the financial statements and the reported amounts of revenues and expenses during the reporting period including estimates and assumptions related to taxation. Actual results could differ from those estimates by a significant amount. In addition, the Fund monitors for material events or transactions that may occur or become known after the period-end date and before the date the financial statements are released to print. |
| I. | Indemnifications – Under the Trust’s organizational documents, each Trustee, officer, employee or other agent of the Trust is indemnified against certain liabilities that may arise out of the performance of their duties to the Fund. Additionally, in the normal course of business, the Fund enters into contracts, including the Fund’s servicing agreements, that contain a variety of indemnification clauses. The Fund’s maximum exposure under these arrangements is unknown as this would involve future claims that may be made against the Fund that have not yet occurred. The risk of material loss as a result of such indemnification claims is considered remote. |
| J. | Securities Purchased on a When-Issued and Delayed Delivery Basis — The Fund may purchase and sell interests in corporate loans and corporate debt securities and other portfolio securities on a when-issued and delayed delivery basis, with payment and delivery scheduled for a future date. No income accrues to the Fund on such interests or securities in connection with such transactions prior to the date the Fund actually takes delivery of such interests or securities. These transactions are subject to market fluctuations and are subject to the risk that the value at delivery may be more or less than the trade date purchase price. Although the Fund will generally purchase these securities with the intention of acquiring such securities, they may sell such securities prior to the settlement date. |
| K. | Other Risks - The risk of a municipal obligation generally depends on the financial and credit status of the issuer. Constitutional amendments, legislative enactments, executive orders, administrative regulations, voter initiatives, and the issuer’s regional economic conditions may affect the municipal security’s value, interest payments, repayment of principal and the Fund’s ability to sell the security. Failure of a municipal security issuer to comply with applicable tax requirements may make income paid thereon taxable, resulting in a decline in the security’s value. In addition, there could be changes in applicable tax laws or tax treatments that reduce or eliminate the current federal income tax exemption on municipal securities or otherwise adversely affect the current federal or state tax status of municipal securities. |
| Average Daily Net Assets | Rate* |
| First $100 million | 0.500% |
| Next $150 million | 0.450% |
| Next $250 million | 0.425% |
| Next $500 million | 0.400% |
| Next $4 billion | 0.370% |
| Over $5 billion | 0.350% |
| * | The advisory fee paid by the Fund shall be reduced by any amounts paid by the Fund under the administrative services agreement with the Adviser. |
| 24 | Invesco Short Term Municipal Fund |
| Level 1 | Level 2 | Level 3 | Total | |
| Investments in Securities | ||||
| Municipal Obligations | $— | $1,545,569,904 | $— | $1,545,569,904 |
| MuniFund Preferred Shares | — | 15,750,000 | — | 15,750,000 |
| Exchange-Traded Funds | 873,372 | — | — | 873,372 |
| U.S. Dollar Denominated Bonds & Notes | — | 76,575 | — | 76,575 |
| Total Investments in Securities | 873,372 | 1,561,396,479 | — | 1,562,269,851 |
| Other Investments - Assets | ||||
| Investments Matured | — | 7,695 | 180,000 | 187,695 |
| Total Investments | $873,372 | $1,561,404,174 | $180,000 | $1,562,457,546 |
| 25 | Invesco Short Term Municipal Fund |
| Tax Character of Distributions to Shareholders Paid During the Fiscal Years Ended August 31, 2024 and 2023: | ||
| 2024 | 2023 | |
| Ordinary income* | $964,003 | $1,154,347 |
| Ordinary income-tax-exempt | 55,420,267 | 50,676,629 |
| Total distributions | $56,384,270 | $51,830,976 |
| * | Includes short-term capital gain distributions, if any. |
| Tax Components of Net Assets at Period-End: | |
| 2024 | |
| Undistributed tax-exempt income | $6,365,057 |
| Net unrealized appreciation — investments | 9,992,518 |
| Temporary book/tax differences | (42,871) |
| Capital loss carryforward | (44,390,166) |
| Shares of beneficial interest | 1,603,295,346 |
| Total net assets | $1,575,219,884 |
| Capital Loss Carryforward* | |||
| Expiration | Short-Term | Long-Term | Total |
| Not subject to expiration | $24,054,035 | $20,336,131 | $44,390,166 |
| * | Capital loss carryforward is reduced for limitations, if any, to the extent required by the Internal Revenue Code and may be further limited depending upon a variety of factors, including the realization of net unrealized gains or losses as of the date of any reorganization. |
| 26 | Invesco Short Term Municipal Fund |
| Unrealized Appreciation (Depreciation) of Investments on a Tax Basis | |
| Aggregate unrealized appreciation of investments | $12,457,711 |
| Aggregate unrealized (depreciation) of investments | (2,465,193) |
| Net unrealized appreciation of investments | $9,992,518 |
| Summary of Share Activity | |||||
| Year ended August 31, 2024(a) | Year ended August 31, 2023 | ||||
| Shares | Amount | Shares | Amount | ||
| Sold: | |||||
| Class A | 23,308,550 | $86,734,783 | 30,017,027 | $111,940,119 | |
| Class Y | 133,904,494 | 497,883,618 | 209,042,727 | 780,035,504 | |
| Class R6 | 11,743,513 | 43,897,180 | 12,463,193 | 46,661,401 | |
| Issued as reinvestment of dividends: | |||||
| Class A | 3,344,632 | 12,429,023 | 3,383,777 | 12,623,660 | |
| Class Y | 6,267,975 | 23,295,078 | 5,636,206 | 21,027,036 | |
| Class R6 | 127,894 | 477,225 | 68,355 | 255,758 | |
| Reacquired: | |||||
| Class A | (65,466,764) | (243,427,147) | (137,130,281) | (511,551,165) | |
| Class Y | (173,760,266) | (646,141,373) | (319,106,517) | (1,190,961,402) | |
| Class R6 | (6,626,925) | (24,719,986) | (7,903,669) | (29,587,521) | |
| Net increase (decrease) in share activity | (67,156,897) | $(249,571,599) | (203,529,182) | $(759,556,610) | |
| (a) | There are entities that are record owners of more than 5% of the outstanding shares of the Fund and in the aggregate own 72% of the outstanding shares of the Fund. IDI has an agreement with these entities to sell Fund shares. The Fund, Invesco and/or Invesco affiliates may make payments to these entities, which are considered to be related to the Fund, for providing services to the Fund, Invesco and/or Invesco affiliates including but not limited to services such as securities brokerage, distribution, third party record keeping and account servicing. The Fund has no knowledge as to whether all or any portion of the shares owned of record by these entities are also owned beneficially. |
| 27 | Invesco Short Term Municipal Fund |
| 28 | Invesco Short Term Municipal Fund |
| 29 | Invesco Short Term Municipal Fund |
| 30 | Invesco Short Term Municipal Fund |
| 31 | Invesco Short Term Municipal Fund |
| Federal and State Income Tax | |
| Qualified Dividend Income* | 0.00% |
| Corporate Dividends Received Deduction* | 0.00% |
| U.S. Treasury Obligations* | 0.00% |
| Qualified Business Income* | 0.00% |
| Business Interest Income* | 0.00% |
| Tax-Exempt Interest Dividends* | 98.29% |
| * | The above percentages are based on ordinary income dividends paid to shareholders during the Fund’s fiscal year. |
| 32 | Invesco Short Term Municipal Fund |
| 33 | Invesco Short Term Municipal Fund |

| Annual Financial Statements and Other Information | August 31, 2024 |
| Interest Rate | Maturity Date | Principal Amount (000) | Value | ||
| Municipal Obligations–96.55% | |||||
| Alabama–4.19% | |||||
| Black Belt Energy Gas District (The) (Gas); Series 2022 F, RB | 5.25% | 12/01/2027 | $460 | $ 483,762 | |
| Arizona–2.22% | |||||
| Maricopa (County of), AZ Industrial Development Authority (Legacy Traditional Schools); Series 2019, Ref. RB(a) | 5.00% | 07/01/2039 | 250 | 256,387 | |
| California–8.63% | |||||
| California (State of) Housing Finance Agency; Series 2019 A-2, RB | 4.00% | 03/20/2033 | 231 | 237,551 | |
| California (State of) School Finance Authority (TEACH Public Schools); Series 2019 A, RB(a) | 5.00% | 06/01/2029 | 255 | 259,068 | |
| California (State of) Statewide Communities Development Authority (California Baptist University); Series 2014 A, RB(a) | 6.13% | 11/01/2033 | 250 | 250,487 | |
| California (State of) Statewide Communities Development Authority (Loma Linda University Medical Center); Series 2014, RB | 5.50% | 12/01/2054 | 250 | 250,368 | |
| 997,474 | |||||
| Florida–8.74% | |||||
| Capital Projects Finance Authority (Kissimmee Charter Academy); Series 2024, RB(a) | 6.13% | 06/15/2044 | 250 | 257,952 | |
| Florida Development Finance Corp. (Brightline Florida Passenger Rail Expansion); Series 2024, Ref. RB(b) | 5.25% | 07/01/2047 | 250 | 256,956 | |
| Florida Development Finance Corp. (Mater Academy); Series 2022 A, RB | 5.00% | 06/15/2031 | 235 | 243,480 | |
| Miami Beach (City of), FL; Series 2017, Ref. RB | 5.00% | 09/01/2047 | 250 | 251,822 | |
| 1,010,210 | |||||
| Georgia–6.80% | |||||
| Atlanta (City of), GA Urban Residential Finance Authority (GE Tower Apartments); Series 2023 B, RB(c) | 5.75% | 06/01/2025 | 280 | 280,330 | |
| Main Street Natural Gas, Inc.; Series 2023 A, RB(c) | 5.00% | 06/01/2030 | 475 | 505,152 | |
| 785,482 | |||||
| Illinois–2.16% | |||||
| Chicago (City of), IL Board of Education; Series 2015 C, GO Bonds | 5.25% | 12/01/2039 | 250 | 250,252 | |
| Indiana–2.21% | |||||
| Whiting (City of), IN (BP Products North America, Inc.); Series 2015, RB(b)(c) | 4.40% | 06/10/2031 | 250 | 255,681 | |
| Iowa–3.02% | |||||
| Iowa (State of) Finance Authority (Iowa Fertilizer Co.); Series 2022, Ref. RB(c)(d) | 5.00% | 12/01/2032 | 300 | 348,908 | |
| Louisiana–2.18% | |||||
| St. John the Baptist (Parish of), LA (Marathon Oil Corp.); Series 2017, Ref. RB(c) | 4.05% | 07/01/2026 | 250 | 252,360 | |
| Massachusetts–2.17% | |||||
| Massachusetts (Commonwealth of) Development Finance Agency (Atrius Health); Series 2015, Ref. RB | 5.00% | 01/01/2041 | 250 | 250,534 | |
| Minnesota–0.73% | |||||
| Brooklyn Park (City of), MN (Athlos Leadership Academy); Series 2015 A, RB | 4.75% | 07/01/2025 | 85 | 84,185 | |
| Missouri–2.67% | |||||
| Missouri (State of) Health & Educational Facilities Authority (Truman Medical Center, Inc.); Series 2017, RB(a) | 5.00% | 12/01/2037 | 300 | 308,211 | |
| New York–7.46% | |||||
| New York (City of), NY Municipal Water Finance Authority; Series 2015 FF, Ref. RB | 5.00% | 06/15/2039 | 250 | 253,168 | |
| New York (City of), NY Transitional Finance Authority; Series 2019 C-4, VRD RB(e) | 2.70% | 11/01/2044 | 100 | 100,000 | |
| New York Transportation Development Corp. (American Airlines, Inc.); Series 2016, Ref. RB(b) | 5.00% | 08/01/2031 | 250 | 250,281 | |
| New York Transportation Development Corp. (Terminal 4 JFK International Airport); Series 2020, Ref. RB(b) | 5.00% | 12/01/2026 | 250 | 259,368 | |
| 862,817 | |||||
| Ohio–4.17% | |||||
| Buckeye Tobacco Settlement Financing Authority; Series 2020 B-2, Ref. RB | 5.00% | 06/01/2055 | 250 | 230,152 | |
| 2 | Invesco SMA Municipal Bond Fund |
| Interest Rate | Maturity Date | Principal Amount (000) | Value | ||
| Ohio–(continued) | |||||
| Ohio (State of) Higher Educational Facility Commission (Kenyon College); Series 2015, Ref. RB | 5.00% | 07/01/2041 | $250 | $ 252,038 | |
| 482,190 | |||||
| Oregon–2.88% | |||||
| Portland (Port of), OR (Green Bonds); Twenty Ninth Series 2023, RB(b) | 5.25% | 07/01/2039 | 300 | 333,411 | |
| Pennsylvania–8.46% | |||||
| Allentown (City of), PA Neighborhood Improvement Zone Development Authority (City Center); Series 2018, RB(a) | 5.00% | 05/01/2028 | 200 | 206,706 | |
| Montgomery (County of), PA Industrial Development Authority (Constellation Energy Generation LLC); Series 2023 B, Ref. RB | 4.10% | 06/01/2029 | 250 | 258,706 | |
| Pennsylvania (Commonwealth of) Economic Development Financing Authority (PA Bridges Finco L.P.); Series 2015, RB(b) | 5.00% | 12/31/2034 | 250 | 255,884 | |
| Pennsylvania (Commonwealth of) Economic Development Financing Authority (Pennsylvania Rapid Bridge Replacement); Series 2015, RB(b) | 5.00% | 12/31/2029 | 250 | 256,985 | |
| 978,281 | |||||
| South Carolina–4.85% | |||||
| South Carolina (State of) Jobs-Economic Development Authority (Novant Health Obligated Group); Series 2024 A, RB | 5.25% | 11/01/2044 | 250 | 280,873 | |
| South Carolina (State of) Public Service Authority (Santee Cooper); Series 2024 B, Ref. RB (INS - AGM)(f) | 5.00% | 12/01/2040 | 250 | 280,334 | |
| 561,207 | |||||
| Texas–10.28% | |||||
| Bexar County Health Facilities Development Corp. (Army Retirement Residence Foundation); Series 2016, Ref. RB | 5.00% | 07/15/2025 | 430 | 430,552 | |
| Houston (City of), TX Airport System (United Airlines, Inc.); Series 2018, RB(b) | 5.00% | 07/15/2028 | 250 | 257,704 | |
| New Hope Cultural Education Facilities Finance Corp. (Presbyterian Village North); Series 2018, Ref. RB | 5.00% | 10/01/2024 | 500 | 499,829 | |
| 1,188,085 | |||||
| Virginia–4.35% | |||||
| Chesapeake (City of), VA Expressway; Series 2012 A, RB(c)(d) | 5.00% | 10/11/2024 | 250 | 250,472 | |
| Chesapeake Bay Bridge & Tunnel District; Series 2016, RB | 5.00% | 07/01/2046 | 250 | 252,240 | |
| 502,712 | |||||
| Wisconsin–8.38% | |||||
| Wisconsin (State of) Public Finance Authority (Coral Academy of Science Reno); Series 2019, Ref. RB(a) | 5.00% | 06/01/2029 | 250 | 254,404 | |
| Wisconsin (State of) Public Finance Authority (Miami Worldcenter); Series 2024 A, RB(a) | 5.00% | 06/01/2041 | 250 | 255,044 | |
| Wisconsin (State of) Public Finance Authority (Prime Healthcare Foundation, Inc.); Series 2018 A, RB | 5.00% | 12/01/2027 | 205 | 208,960 | |
| Wisconsin (State of) Public Finance Authority (Signorelli); Series 2024, RB(a) | 5.38% | 12/15/2032 | 250 | 250,749 | |
| 969,157 | |||||
| TOTAL INVESTMENTS IN SECURITIES(g)–96.55% (Cost $10,931,962) | 11,161,306 | ||||
| OTHER ASSETS LESS LIABILITIES–3.45% | 398,469 | ||||
| NET ASSETS–100.00% | $11,559,775 | ||||
| AGM | – Assured Guaranty Municipal Corp. |
| GO | – General Obligation |
| INS | – Insurer |
| RB | – Revenue Bonds |
| Ref. | – Refunding |
| VRD | – Variable Rate Demand |
| 3 | Invesco SMA Municipal Bond Fund |
| (a) | Security purchased or received in a transaction exempt from registration under the Securities Act of 1933, as amended (the “1933 Act”). The security may be resold pursuant to an exemption from registration under the 1933 Act, typically to qualified institutional buyers. The aggregate value of these securities at August 31, 2024 was $2,299,008, which represented 19.89% of the Fund’s Net Assets. |
| (b) | Security subject to the alternative minimum tax. |
| (c) | Security has an irrevocable call by the issuer or mandatory put by the holder. Maturity date reflects such call or put. |
| (d) | Advance refunded; secured by an escrow fund of U.S. Government obligations or other highly rated collateral. |
| (e) | Demand security payable upon demand by the Fund at specified time intervals no greater than thirteen months. Interest rate is redetermined periodically by the issuer or agent based on current market conditions. Rate shown is the rate in effect on August 31, 2024. |
| (f) | Principal and/or interest payments are secured by the bond insurance company listed. |
| (g) | Entities may either issue, guarantee, back or otherwise enhance the credit quality of a security. The entities are not primarily responsible for the issuer’s obligations but may be called upon to satisfy the issuer’s obligations. No concentration of any single entity was greater than 5% each. |
| 4 | Invesco SMA Municipal Bond Fund |
| Assets: | |
| Investments in unaffiliated securities, at value (Cost $10,931,962) | $11,161,306 |
| Cash | 316,592 |
| Receivable for: | |
| Fund expenses absorbed | 40,775 |
| Interest | 126,156 |
| Investment for trustee deferred compensation and retirement plans | 4,902 |
| Other assets | 11,414 |
| Total assets | 11,661,145 |
| Liabilities: | |
| Payable for: | |
| Dividends | 40,051 |
| Fund shares reacquired | 4,214 |
| Accrued fees to affiliates | 190 |
| Accrued trustees’ and officers’ fees and benefits | 2,336 |
| Accrued other operating expenses | 49,677 |
| Trustee deferred compensation and retirement plans | 4,902 |
| Total liabilities | 101,370 |
| Net assets applicable to shares outstanding | $11,559,775 |
| Net assets consist of: | |
| Shares of beneficial interest | $11,232,950 |
| Distributable earnings | 326,825 |
| $11,559,775 | |
| Shares outstanding, no par value, with an unlimited number of shares authorized: | |
| Shares outstanding | 1,121,549 |
| Net asset value and offering price per share | $10.31 |
| 5 | Invesco SMA Municipal Bond Fund |
| Investment income: | |
| Interest | $478,837 |
| Expenses: | |
| Administrative services fees | 1,487 |
| Transfer agent fees | 1,556 |
| Trustees’ and officers’ fees and benefits | 22,075 |
| Registration and filing fees | 12,112 |
| Professional services fees | 151,871 |
| Other | (2,668) |
| Total expenses | 186,433 |
| Less: Expenses reimbursed | (186,419) |
| Net expenses | 14 |
| Net investment income | 478,823 |
| Realized and unrealized gain (loss) from: | |
| Net realized gain (loss) from unaffiliated investment securities | (15,827) |
| Change in net unrealized appreciation of unaffiliated investment securities | 253,093 |
| Net realized and unrealized gain | 237,266 |
| Net increase in net assets resulting from operations | $716,089 |
| 6 | Invesco SMA Municipal Bond Fund |
| 2024 | 2023 | |
| Operations: | ||
| Net investment income | $478,823 | $218,439 |
| Net realized gain (loss) | (15,827) | 2,538 |
| Change in net unrealized appreciation (depreciation) | 253,093 | (23,749) |
| Net increase in net assets resulting from operations | 716,089 | 197,228 |
| Distributions to shareholders from distributable earnings | (447,892) | (138,600) |
| Net increase in net assets resulting from share transactions | 1,232,950 | 10,000,000 |
| Net increase in net assets | 1,501,147 | 10,058,628 |
| Net assets: | ||
| Beginning of period | 10,058,628 | — |
| End of period | $11,559,775 | $10,058,628 |
| 7 | Invesco SMA Municipal Bond Fund |
| Year Ended August 31, 2024 | Period Ended August 31, 2023(a) | |
| Net asset value, beginning of period | $10.06 | $10.00 |
| Net investment income(b) | 0.46 | 0.22 |
| Net gains (losses) on securities (both realized and unrealized) | 0.22 | (0.02) |
| Total from investment operations | 0.68 | 0.20 |
| Less: Dividends from net investment income | (0.43) | (0.14) |
| Net asset value, end of period | $10.31 | $10.06 |
| Total return(c) | 6.91% | 1.99% |
| Net assets, end of period (000’s omitted) | $11,560 | $10,059 |
| Portfolio turnover rate(d) | 44% | 166% |
| Ratios/supplemental data based on average net assets: | ||
| Ratio of expenses: | ||
| With fee waivers and/or expense reimbursements | 0.00% | 0.00%(e) |
| Without fee waivers and/or expense reimbursements | 1.76% | 2.46%(e) |
| Ratio of net investment income to average net assets | 4.52% | 4.11%(e) |
| (a) | Commencement date of February 21, 2023. |
| (b) | Calculated using average shares outstanding. |
| (c) | Includes adjustments in accordance with accounting principles generally accepted in the United States of America and as such, the net asset value for financial reporting purposes and the returns based upon those net asset values may differ from the net asset value and returns for shareholder transactions. Not annualized for periods less than one year, if applicable. |
| (d) | Portfolio turnover is not annualized for periods less than one year, if applicable. |
| (e) | Annualized. |
| 8 | Invesco SMA Municipal Bond Fund |
| A. | Security Valuations – Securities, including restricted securities, are valued according to the following policy. |
| B. | Securities Transactions and Investment Income – Securities transactions are accounted for on a trade date basis. Realized gains or losses on sales are computed on the basis of specific identification of the securities sold. Interest income (net of withholding tax, if any) is recorded on an accrual basis from settlement date and includes coupon interest and amortization of premium and accretion of discount on debt securities as applicable. Pay-in-kind interest income and non-cash dividend income received in the form of securities in lieu of cash are recorded at the fair value of the securities received. Paydown gains and losses on mortgage and asset-backed securities are recorded as adjustments to interest income. Dividend income (net of withholding tax, if any) is recorded on the ex-dividend date. |
| C. | Country Determination — For the purposes of making investment selection decisions and presentation in the Schedule of Investments, the investment adviser may determine the country in which an issuer is located and/or credit risk exposure based on various factors. These factors include the laws of the country under which the issuer is organized, where the issuer maintains a principal office, the country in which the issuer derives 50% or more of its total revenues, the country that has the primary market for the issuer’s securities and its "country of risk" as determined by a third party service provider, as well as other criteria. Among the other criteria that may be evaluated for making this determination are the country in which the issuer maintains 50% or more of its assets, the type of security, financial guarantees and enhancements, the nature of the collateral and the sponsor organization. Country of issuer and/or credit risk exposure has been determined to be the United States of America, unless otherwise noted. |
| D. | Distributions – Distributions from net investment income, if any, are declared daily and paid monthly. Distributions from net realized capital gain, if any, are generally declared and paid annually and recorded on the ex-dividend date. The Fund may elect to treat a portion of the proceeds from redemptions as distributions for federal income tax purposes. |
| 9 | Invesco SMA Municipal Bond Fund |
| E. | Federal Income Taxes – The Fund intends to comply with the requirements of Subchapter M of the Internal Revenue Code of 1986, as amended (the “Internal Revenue Code”), necessary to qualify as a regulated investment company and to distribute substantially all of the Fund’s taxable earnings to shareholders. As such, the Fund will not be subject to federal income taxes on otherwise taxable income (including net realized capital gain) that is distributed to shareholders. Therefore, no provision for federal income taxes is recorded in the financial statements. |
| F. | Accounting Estimates – The preparation of financial statements in conformity with accounting principles generally accepted in the United States of America (“GAAP”) requires management to make estimates and assumptions that affect the reported amounts of assets and liabilities at the date of the financial statements and the reported amounts of revenues and expenses during the reporting period including estimates and assumptions related to taxation. Actual results could differ from those estimates by a significant amount. In addition, the Fund monitors for material events or transactions that may occur or become known after the period-end date and before the date the financial statements are released to print. |
| G. | Indemnifications – Under the Trust’s organizational documents, each Trustee, officer, employee or other agent of the Trust is indemnified against certain liabilities that may arise out of the performance of their duties to the Fund. Additionally, in the normal course of business, the Fund enters into contracts, including the Fund’s servicing agreements, that contain a variety of indemnification clauses. The Fund’s maximum exposure under these arrangements is unknown as this would involve future claims that may be made against the Fund that have not yet occurred. The risk of material loss as a result of such indemnification claims is considered remote. |
| H. | Securities Purchased on a When-Issued and Delayed Delivery Basis — The Fund may purchase and sell interests in corporate loans and corporate debt securities and other portfolio securities on a when-issued and delayed delivery basis, with payment and delivery scheduled for a future date. No income accrues to the Fund on such interests or securities in connection with such transactions prior to the date the Fund actually takes delivery of such interests or securities. These transactions are subject to market fluctuations and are subject to the risk that the value at delivery may be more or less than the trade date purchase price. Although the Fund will generally purchase these securities with the intention of acquiring such securities, they may sell such securities prior to the settlement date. |
| I. | Other Risks - Active trading of portfolio securities may result in added expenses, a lower return and increased tax liability. |
| 10 | Invesco SMA Municipal Bond Fund |
| Tax Character of Distributions to Shareholders Paid During the Fiscal Years Ended August 31, 2024 and the period February 21, 2023 (commencement date) through August 31, 2023: | ||
| 2024 | 2023 | |
| Ordinary income* | $1,323 | $379 |
| Ordinary income-tax-exempt | 446,569 | 138,221 |
| Total distributions | $447,892 | $138,600 |
| * | Includes short-term capital gain distributions, if any. |
| Tax Components of Net Assets at Period-End: | |
| 2024 | |
| Undistributed tax-exempt income | $118,006 |
| Net unrealized appreciation — investments | 229,393 |
| Temporary book/tax differences | (3,442) |
| Capital loss carryforward | (17,132) |
| Shares of beneficial interest | 11,232,950 |
| Total net assets | $11,559,775 |
| 11 | Invesco SMA Municipal Bond Fund |
| Capital Loss Carryforward* | |||
| Expiration | Short-Term | Long-Term | Total |
| Not subject to expiration | $17,132 | $— | $17,132 |
| * | Capital loss carryforward is reduced for limitations, if any, to the extent required by the Internal Revenue Code and may be further limited depending upon a variety of factors, including the realization of net unrealized gains or losses as of the date of any reorganization. |
| Unrealized Appreciation (Depreciation) of Investments on a Tax Basis | |
| Aggregate unrealized appreciation of investments | $233,066 |
| Aggregate unrealized (depreciation) of investments | (3,673) |
| Net unrealized appreciation of investments | $229,393 |
| Summary of Share Activity | |||||
| Year ended August 31, 2024(a) | August 31, 2023(b) | ||||
| Shares | Amount | Shares | Amount | ||
| Sold | 123,207 | $1,249,946 | 1,000,001 | $10,000,010 | |
| Reacquired | (1,658) | (16,996) | (1) | (10) | |
| Net increase in share activity | 121,549 | $1,232,950 | 1,000,000 | $10,000,000 | |
| (a) | There is an entity that is a record owner of more than 5% of the outstanding shares of the Fund and owns 11% of the outstanding shares of the Fund. IDI has an agreement with this entity to sell Fund shares. The Fund, Invesco and/or Invesco affiliates may make payments to this entity, which is considered to be related to the Fund, for providing services to the Fund, Invesco and/or Invesco affiliates including but not limited to services such as, securities brokerage, distribution, third party record keeping and account servicing. The Fund has no knowledge as to whether all or any portion of the shares owned of record by this entity are also owned beneficially. |
| In addition, 89% of the outstanding shares of the Fund are owned by the Adviser or an affiliate of the Adviser. | |
| (b) | Commencement date of February 21, 2023. |
| 12 | Invesco SMA Municipal Bond Fund |
| 13 | Invesco SMA Municipal Bond Fund |
| A. | Nature, Extent and Quality of Services Provided by Invesco Advisers and the Affiliated Sub-Advisers |
| B. | Fund Investment Performance |
| 14 | Invesco SMA Municipal Bond Fund |
| C. | Advisory and Sub-Advisory Fees and Fund Expenses |
| D. | Economies of Scale and Breakpoints |
| E. | Profitability and Financial Resources |
| F. | Collateral Benefits to Invesco Advisers and its Affiliates |
| 15 | Invesco SMA Municipal Bond Fund |
| Federal and State Income Tax | |
| Qualified Dividend Income* | 0.00% |
| Corporate Dividends Received Deduction* | 0.00% |
| U.S. Treasury Obligations* | 0.00% |
| Qualified Business Income* | 0.00% |
| Business Interest Income* | 0.00% |
| Tax-Exempt Interest Dividends* | 99.70% |
| * | The above percentages are based on ordinary income dividends paid to shareholders during the Fund’s fiscal year. |
| 16 | Invesco SMA Municipal Bond Fund |
| 17 | Invesco SMA Municipal Bond Fund |
Item 8. Changes in and Disagreements with Accountants for Open-End Management Investment Companies.
Not applicable.
Item 9. Proxy Disclosures for Open-End Management Investment Companies.
Not applicable.
Item 10. Remuneration Paid to Directors, Officers, and Others of Open-End Management Investment Companies.
This information is filed under Item 7 of this Form N-CSR.
Item 11. Statement Regarding Basis for Approval of Investment Advisory Contract.
This information is filed under Item 7 of this Form N-CSR.
Item 12. Disclosure of Proxy Voting Policies and Procedures for Closed-End Management Investment Companies.
Not applicable.
Item 13. Portfolio Managers of Closed-End Management Investment Companies.
Not applicable.
Item 14. Purchases of Equity Securities by Closed-End Management Investment Company and Affiliated Purchasers.
Not applicable.
Item 15. Submission of Matters to a Vote of Security Holders.
None
Item 16. Controls and Procedures.
(a) As of a date within 90 days of the filing date of this report, an evaluation was performed under the supervision and with the participation of the officers of the Registrant, including the PEO and PFO, to assess the effectiveness of the Registrant's disclosure controls and procedures, as that term is defined in Rule 30a-3(c) under the Act. Based on that evaluation, the Registrant's officers, including the PEO and PFO, concluded that the Registrant's disclosure controls and procedures were reasonably designed to ensure: (1) that information required to be disclosed by the Registrant on Form N-CSR is recorded, processed, summarized and reported within the time periods specified by the rules and forms of the Securities and Exchange Commission; and (2) that material information relating to the Registrant is made known to the PEO and PFO as appropriate to allow timely decisions regarding required disclosure.
(b) There have been no changes in the Registrant's internal control over financial reporting (as defined in Rule 30a-3(d) under the Act) that occurred during the period covered by this report that have materially affected, or are reasonably likely to materially affect, the Registrant's internal control over financial reporting.
Item 17. Disclosure of Securities Lending Activity for Closed-End Management Investment Companies.
Not applicable.
Item 18. Recovery of Erroneously Awarded Compensation.
Not applicable.
Item 19. Exhibits
19(a)(1) Code of ethics.
19(a)(2) Not applicable
19(a)(4) Not applicable.
19(a)(5) Not applicable.
SIGNATURES
Pursuant to the requirements of the Securities Exchange Act of 1934 and the Investment Company Act of 1940, the Registrant has duly caused this report to be signed on its behalf by the undersigned, thereunto duly authorized.
Registrant: AIM Counselor Series Trust (Invesco Counselor Series Trust
By: | /s/ Glenn Brightman |
| Glenn Brightman |
| Principal Executive Officer |
|
|
Date: | November 6, 2024 |
Pursuant to the requirements of the Securities and Exchange Act of 1934 and the Investment Company Act of 1940, this report has been signed below by the following persons on behalf of the Registrant and in the capacities and on the dates indicated.
By: | /s/ Glenn Brightman |
| Glenn Brightman |
| Principal Executive Officer |
|
|
Date: | November 6, 2024 |
By: | /s/ Adrien Deberghes |
| Adrien Deberghes |
| Principal Financial Officer |
|
|
Date: | November 6, 2024 |