| FREE WRITING PROSPECTUS | ||
| FILED PURSUANT TO RULE 433 | ||
| REGISTRATION FILE NO.: 333-197550-01 | ||
 |  |
Free Writing Prospectus
Structural and Collateral Term Sheet
$940,849,629
(Approximate Aggregate Cut-off Date Balance of Mortgage Pool)
$795,017,000
(Approximate Aggregate Principal Balance of Offered Certificates)
WFRBS Commercial Mortgage Trust 2014-C23
as Issuing Entity
RBS Commercial Funding Inc.
as Depositor
Wells Fargo Bank, National Association
The Royal Bank of Scotland
Liberty Island Group I LLC
C-III Commercial Mortgage LLC
Basis Real Estate Capital II, LLC
NCB, FSB
as Sponsors and Mortgage Loan Sellers
Commercial Mortgage Pass-Through Certificates
Series 2014-C23
September 15, 2014
RBS | WELLS FARGO SECURITIES | |
Co-Lead Manager and Co-Bookrunner | Co-Lead Manager and Co-Bookrunner | |
Goldman, Sachs & Co. | ||
| Co-Manager | ||
STATEMENT REGARDING THIS FREE WRITING PROSPECTUS
The depositor has filed a registration statement (including a prospectus) with the Securities and Exchange Commission (‘‘SEC’’) (SEC File No. 333-197550) for the offering to which this communication relates. Before you invest, you should read the prospectus in the registration statement and other documents the depositor has filed with the SEC for more complete information about the depositor, the issuing entity and this offering. You may get these documents for free by visiting EDGAR on the SEC Web site at www.sec.gov. Alternatively, the depositor, any underwriter, or any dealer participating in the offering will arrange to send you the prospectus after filing if you request it by calling toll free 1-866-884-2071 (8 a.m. – 5 p.m. EST) or by emailing rbscmbs@rbs.com.
Nothing in this document constitutes an offer to sell or a solicitation to buy securities in any jurisdiction where such offer, solicitation or sale is not permitted. The information contained herein is preliminary as of the date hereof, supersedes any such information previously delivered to you and will be superseded by any information subsequently delivered and ultimately by the final prospectus relating to the securities. These materials are subject to change, completion, supplement or amendment from time to time.
STATEMENT REGARDING ASSUMPTIONS AS TO SECURITIES, PRICING ESTIMATES AND OTHER INFORMATION
The attached information contains certain tables and other statistical analyses (the “Computational Materials”) which have been prepared in reliance upon information furnished by the Mortgage Loan Sellers. Numerous assumptions were used in preparing the Computational Materials, which may or may not be reflected herein. As such, no assurance can be given as to the Computational Materials’ accuracy, appropriateness or completeness in any particular context; or as to whether the Computational Materials and/or the assumptions upon which they are based reflect present market conditions or future market performance. The Computational Materials should not be construed as either projections or predictions or as legal, tax, financial or accounting advice. You should consult your own counsel, accountant and other advisors as to the legal, tax, business, financial and related aspects of a purchase of these securities. Any weighted average lives, yields and principal payment periods shown in the Computational Materials are based on prepayment and/or loss assumptions, and changes in such prepayment and/or loss assumptions may dramatically affect such weighted average lives, yields and principal payment periods. In addition, it is possible that prepayments or losses on the underlying assets will occur at rates higher or lower than the rates shown in the attached Computational Materials. The specific characteristics of the securities may differ from those shown in the Computational Materials due to differences between the final underlying assets and the preliminary underlying assets used in preparing the Computational Materials. The principal amount and designation of any security described in the Computational Materials are subject to change prior to issuance. None of RBS Securities Inc. (“RBSSI”), Wells Fargo Securities, LLC (“WFS”), any other underwriter or dealer participating in this offering, or any of their respective affiliates make any representation or warranty as to the actual rate or timing of payments or losses on any of the underlying assets or the payments or yield on the securities. The information in this presentation is based upon management forecasts and reflects prevailing conditions and management’s views as of this date, all of which are subject to change. In preparing this presentation, we have relied upon and assumed, without independent verification, the accuracy and completeness of all information available from public sources or which was provided to us by or on behalf of the Mortgage Loan Sellers or which was otherwise reviewed by us.
This free writing prospectus contains certain forward-looking statements. If and when included in this free writing prospectus, the words “expects”, “intends”, “anticipates”, “estimates” and analogous expressions and all statements that are not historical facts, including statements about our beliefs or expectations, are intended to identify forward-looking statements. Any forward-looking statements are made subject to risks and uncertainties which could cause actual results to differ materially from those stated. Those risks and uncertainties include, among other things, declines in general economic and business conditions, increased competition, changes in demographics, changes in political and social conditions, regulatory initiatives and changes in customer preferences, many of which are beyond our control and the control of any other person or entity related to this offering. The forward-looking statements made in this free writing prospectus are made as of the date stated on the cover. We have no obligation to update or revise any forward-looking statement.
RBS is a trade name for the investment banking business of RBSSI. Securities, syndicated loan arranging, financial advisory and other investment banking activities are performed by RBSSI and their securities affiliates. Lending, derivatives and other commercial banking activities are performed by The Royal Bank of Scotland plc and their banking affiliates. RBSSI is a member of SIPC, FINRA and the NYSE.
Wells Fargo Securities is the trade name for the capital markets and investment banking services of Wells Fargo & Company and its subsidiaries, including but not limited to Wells Fargo Securities, LLC, a member of NYSE, FINRA, NFA and SIPC, Wells Fargo Institutional Securities, LLC, a member of FINRA and SIPC, Wells Fargo Prime Services, LLC, a member of FINRA, NFA and SIPC, and Wells Fargo Bank, N.A. Wells Fargo Securities, LLC carries and provides clearing services for Wells Fargo Institutional Securities, LLC customer accounts. Wells Fargo Securities, LLC, Wells Fargo Institutional Securities, LLC, and Wells Fargo Prime Services, LLC are distinct entities from affiliated banks and thrifts.
IMPORTANT NOTICE REGARDING THE OFFERED CERTIFICATES
The offered certificates referred to in these materials and the asset pool backing them are subject to modification or revision (including the possibility that one or more classes of certificates may be split, combined or eliminated at any time prior to issuance or availability of a final prospectus) and are offered on a “when, as and if issued” basis. Prospective investors should understand that, when considering the purchase of the offered certificates, a contract of sale will come into being no sooner than the date on which the relevant class of certificates has been priced and the underwriters have confirmed the allocation of certificates to be made to investors; any “indications of interest” expressed by any prospective investor, and any “soft circles” generated by the underwriters, will not create binding contractual obligations for such prospective investors, on the one hand, or the underwriters, the depositor or any of their respective agents or affiliates, on the other hand.
As a result of the foregoing, a prospective investor may commit to purchase certificates that have characteristics that may change, and each prospective investor is advised that all or a portion of the certificates referred to in these materials may be issued that differ from the characteristics described in these materials. The underwriters’ obligation to sell certificates to any prospective investor is conditioned on the certificates and the transaction having the characteristics described in these materials. If the underwriters determine that a condition is not satisfied in any material respect, such prospective investor will be notified, and neither the depositor nor the underwriters will have any obligation to such prospective investor to deliver any portion of the offered certificates which such prospective investor has committed to purchase, and there will be no liability between the underwriters, the depositor or any of their respective agents or affiliates, on the one hand, and such prospective investor, on the other hand, as a consequence of the non-delivery.
Each prospective investor has requested that the underwriters provide to such prospective investor information in connection with such prospective investor’s consideration of the purchase of the certificates described in these materials. These materials are being provided to each prospective investor for informative purposes only in response to such prospective investor’s specific request. The underwriters described in these materials may from time to time perform investment banking services for, or solicit investment banking business from, any company named in these materials. The underwriters and/or their affiliates or respective employees may from time to time have a long or short position in any security or contract discussed in these materials.
The information contained herein supersedes any previous such information delivered to any prospective investor and will be superseded by information delivered to such prospective investor prior to the time of sale.
IMPORTANT NOTICE RELATING TO AUTOMATICALLY-GENERATED EMAIL DISCLAIMERS
Any legends, disclaimers or other notices that may appear at the bottom of, or attached to, any email communication to which this free writing prospectus is attached relating to (1) these materials not constituting an offer (or a solicitation of an offer), (2) no representation that these materials are accurate or complete and may not be updated or (3) these materials possibly being confidential, are not applicable to these materials and should be disregarded. Such legends, disclaimers or other notices have been automatically generated as a result of these materials having been sent via Bloomberg or another system.
THE INFORMATION IN THIS STRUCTURAL AND COLLATERAL TERM SHEET IS NOT COMPLETE AND MAY BE AMENDED PRIOR TO THE TIME OF SALE. THIS TERM SHEET IS NOT AN OFFER TO SELL THESE SECURITIES AND IT IS NOT A SOLICITATION OF AN OFFER TO BUY THESE SECURITIES IN ANY JURISDICTION WHERE THE OFFER OR SALE IS NOT PERMITTED.
2
WFRBS Commercial Mortgage Trust 2014-C23 | Characteristics of the Mortgage Pool |
I. Certificate Structure
Expected Ratings (Fitch/Moody’s/Morningstar)(1) | Approximate Initial Certificate Principal Balance or Notional Amount(2) | Approx. Initial Credit Support(3) | Pass-Through Rate Description | Weighted Average Life (Years)(4) | Expected Principal Window(4) | Certificate Principal to Value Ratio(5) | Certificate Principal U/W NOI Debt Yield(6) | |||
| Offered Certificates | ||||||||||
| A-1 | AAAsf/Aaa(sf)/AAA | $43,360,000 | 30.000% | (7) | 2.91 | 10/14 - 09/19 | 33.6% | 16.3% | ||
| A-2 | AAAsf/Aaa(sf)/AAA | $33,162,000 | 30.000% | (7) | 5.01 | 09/19 - 10/19 | 33.6% | 16.3% | ||
| A-3 | AAAsf/Aaa(sf)/AAA | $8,500,000 | 30.000% | (7) | 6.96 | 09/21 - 09/21 | 33.6% | 16.3% | ||
| A-4 | AAAsf/Aaa(sf)/AAA | $245,000,000 | 30.000% | (7) | 9.86 | 07/24 - 08/24 | 33.6% | 16.3% | ||
| A-5 | AAAsf/Aaa(sf)/AAA | $257,750,000 | 30.000% | (7) | 9.95 | 08/24 - 09/24 | 33.6% | 16.3% | ||
| A-SB | AAAsf/Aaa(sf)/AAA | $70,822,000 | 30.000% | (7) | 7.49 | 10/19 - 07/24 | 33.6% | 16.3% | ||
A-S(8) | AAAsf/Aa1(sf)/AAA | $56,451,000 | 24.000% | (7) | 9.96 | 09/24 - 09/24 | 36.5% | 15.0% | ||
B(8) | AA-sf/Aa3(sf)/AA- | $44,691,000 | 19.250% | (7) | 9.96 | 09/24 - 09/24 | 38.8% | 14.2% | ||
C(8) | A-sf/A3(sf)/A- | $35,281,000 | 15.500% | (7) | 9.96 | 09/24 - 09/24 | 40.6% | 13.5% | ||
PEX(8) | A-sf/A1(sf)/A- | $136,423,000 | 15.500% | (7) | 9.96 | 09/24 - 09/24 | 40.6% | 13.5% | ||
| X-A | AAAsf/NR/AAA | $715,045,000(9) | N/A | Variable(10) | N/A | N/A | N/A | N/A | ||
| X-B | NR/NR/AAA | $156,416,000(11) | N/A | Variable(12) | N/A | N/A | N/A | N/A | ||
| Non-Offered Certificates | ||||||||||
| X-C | BBsf/NR/BB | $11,761,000(13) | N/A | Variable(14) | N/A | N/A | N/A | N/A | ||
| X-D | Bsf/NR/B | $17,641,000(15) | N/A | Variable(16) | N/A | N/A | N/A | N/A | ||
| X-E | NR/NR/NR | $39,986,629(17) | N/A | Variable(18) | N/A | N/A | N/A | N/A | ||
| X-Y | NR/NR/AAA | $39,033,711(19) | N/A | Variable(20) | N/A | N/A | N/A | N/A | ||
| D | BBB-sf/NR/BBB- | $76,444,000 | 7.375% | (7) | 9.99 | 09/24 - 10/24 | 44.5% | 12.3% | ||
| E | BBsf/NR/BB | $11,761,000 | 6.125% | (7) | 10.04 | 10/24 - 10/24 | 45.1% | 12.2% | ||
| F | Bsf/NR/B | $17,641,000 | 4.250% | (7) | 10.04 | 10/24 - 10/24 | 46.0% | 11.9% | ||
| G | NR/NR/NR | $39,986,629 | 0.000% | (7) | 10.04 | 10/24 - 10/24 | 48.0% | 11.4% | ||
Notes:
| (1) | The expected ratings presented are those of Fitch Ratings, Inc. (“Fitch”), Moody’s Investors Service, Inc. (“Moody’s”), and Morningstar Credit Ratings, LLC (“Morningstar”) which the depositor hired to rate the rated offered certificates. One or more other nationally recognized statistical rating organizations, as defined in Section 3(a)(62) of the Securities Exchange Act of 1934, as amended (the “Exchange Act”), that were not hired by the depositor may use information they receive pursuant to Rule 17g-5 under the Securities Exchange Act or otherwise to rate or provide market reports and/or published commentary related to the offered certificates. We cannot assure you as to what ratings a non-hired nationally recognized statistical rating organization would assign or that its reports will not express differing, possibly negative, views of the mortgage loans and/or the offered certificates. See “Risk Factors—Risks Related to the Offered Certificates—Nationally Recognized Statistical Rating Organizations May Assign Different Ratings to the Certificates; Ratings of the Certificates Reflect Only the Views of the Applicable Rating Agencies as of the Dates Such Ratings Were Issued; Ratings May Affect ERISA Eligibility; Ratings May Be Downgraded” in the free writing prospectus, dated September 15, 2014 (the “Free Writing Prospectus”). | |||
| (2) | The principal balances and notional amounts set forth in the table are approximate. The actual initial principal balances and notional amounts may be larger or smaller depending on the aggregate cut-off date principal balance of the mortgage loans definitively included in the pool of mortgage loans, which aggregate cut-off date principal balance may be as much as 5% larger or smaller than the amount presented in the Free Writing Prospectus. | |||
| (3) | The approximate initial credit support with respect to the Class A-1, A-2, A-3, A-4, A-5 and A-SB Certificates represents the approximate credit enhancement for the Class A-1, A-2, A-3, A-4, A-5 and A-SB Certificates in the aggregate. The approximate initial credit support with respect to each of the Class C Certificates and Class PEX Certificates is equal to the approximate initial credit support of the Class C regular interest, which will have an initial outstanding principal balance of the closing date of $35,281,000. | |||
| (4) | Weighted Average Lives and Expected Principal Windows are calculated based on an assumed prepayment rate of 0% CPR and the “Structuring Assumptions” described on Annex D to the Free Writing Prospectus. | |||
| (5) | The Certificate Principal to Value Ratio for each Class of Certificates (other than the Class A-1, A-2, A-3, A-4, A-5 and A-SB Certificates and other than the Exchangeable Certificates) is calculated by dividing the aggregate principal balance of such class of certificates and all classes of certificates (other than the Exchangeable Certificates and other than the Class X-A, X-B, X-C, X-D, X-E and X-Y Certificates, which are notional amount certificates and will not have principal balances), if any, that are senior to such class by the aggregate appraised value of $1,960,332,900 (calculated as described in the Free Writing Prospectus) of the mortgaged properties securing the mortgage loans (excluding, with respect to each pari passu loan combination, a pro rata portion of the related appraised value allocated to the related companion loan based on its cut-off date principal balance). The Certificate Principal to Value Ratios for each of the Class A-1, A-2, A-3, A-4, A-5 and A-SB Certificates are calculated by dividing the aggregate principal balance of the Class A-1, A-2, A-3, A-4, A-5 and A-SB Certificates by such aggregate appraised value (excluding, with respect to each pari passu loan combination, a pro rata portion of the related appraised value allocated to the related companion loan based on its cut-off date principal balance). The Certificate Principal to Value Ratio for each of the Class A-S, B and C Certificates is calculated by dividing the aggregate principal balance of the Class A-S regular interest, the Class B regular interest or the Class C regular interest, as applicable, and all other classes of certificates (other than the Exchangeable Certificates) and the regular interests that are senior to such class, by such aggregate appraised value (excluding, with respect to each pari passu loan combination, a pro rata portion of the related appraised value allocated to the related companion loan based on its cut-off date principal balance). The Certificate Principal to Value Ratio of the Class PEX Certificates is equal to the Certificate Principal to Value Ratio of the Class C Certificates. In any event, however, excess mortgaged property value associated with a mortgage loan will not be available to offset losses on any other mortgage loan. | |||
| (6) | The Certificate Principal U/W NOI Debt Yield for each Class of Certificates (other than the Class A-1, A-2, A-3, A-4, A-5 and A-SB Certificates and other than the Exchangeable Certificates) is calculated by dividing the underwritten net operating income (which excludes, with respect to each pari passu loan combination, a pro rata portion of the related underwritten net operating income allocated to the related companion loan based on its cut-off date principal balance) for the mortgage pool of $107,543,392 (calculated as described in the Free Writing Prospectus) by the aggregate principal balance of such class of certificates and all classes of certificates (other than the Class X-A, X-B, X-C, X-D, X-E and X-Y Certificates, which are notional amount certificates and will not have principal balances, and other than the Exchangeable Certificates), if any, that are senior to such class of certificates. The Certificate Principal U/W NOI Debt Yield for each of the Class A-1, A-2, A-3, A-4, A-5 and A-SB Certificates is calculated by dividing such mortgage pool underwritten net operating income (which excludes, with respect to each pari passu loan combination, a pro rata portion of the related underwritten net operating income allocated to the related companion loan based on its cut-off date principal balance) by the aggregate principal balance of the Class A-1, A-2, A-3, A-4, A-5 and A-SB Certificates. The Certificate Principal U/W NOI Debt Yield for each of the Class A-S, B and C Certificates is calculated by dividing the underwritten net operating income (which excludes, with respect to each pari passu loan combination, a pro rata portion of the related underwritten net operating income allocated to the related companion loan based on its cut-off date principal balance) for the mortgage pool of approximately $107,543,392 (calculated as described in the Free Writing Prospectus) by the aggregate principal balance of the Class A-S regular interest, the Class B regular interest or the Class C regular interest, as applicable, and all other classes of certificates (other than the Exchangeable Certificates) and the regular interests that are senior to such class. The Certificate Principal U/W NOI Debt Yield of the Class PEX Certificates is equal to the Certificate Principal U/W NOI Debt Yield for the Class C Certificates. In any event, however, cash flow from each mortgaged property supports only the related mortgage loan and will not be available to support any other mortgage loan. |
THE INFORMATION IN THIS STRUCTURAL AND COLLATERAL TERM SHEET IS NOT COMPLETE AND MAY BE AMENDED PRIOR TO THE TIME OF SALE. THIS TERM SHEET IS NOT AN OFFER TO SELL THESE SECURITIES AND IT IS NOT A SOLICITATION OF AN OFFER TO BUY THESE SECURITIES IN ANY JURISDICTION WHERE THE OFFER OR SALE IS NOT PERMITTED.
3
WFRBS Commercial Mortgage Trust 2014-C23 | Characteristics of the Mortgage Pool |
| (7) | The pass-through rates for the Class A-1, A-2, A-3, A-4, A-5, A-SB, D, E, F and G Certificates and the Class A-S, B and C regular interests, in each case, will be one of the following: (i) a fixed rate per annum, (ii) the WAC Rate (as defined in the Free Writing Prospectus) for the related distribution date, (iii) a variable rate per annum equal to the lesser of (a) a fixed rate and (b) the WAC Rate for the related distribution date or (iv) a variable rate per annum equal to the WAC Rate for the related distribution date minus a specified percentage. For purposes of the calculation of the weighted average of the net mortgage interest rates on the mortgage loans for each distribution date, the mortgage interest rates will be adjusted as necessary to a 30/360 basis and, in the case of certain designated mortgage loans being sold to the trust by NCB, FSB, will be net of the Class X-Y strip rate defined in footnote (20) below. The Class PEX Certificates will not have a pass-through rate, but will be entitled to receive the sum of the interest distributable on the percentage interests of the Class A-S, B and C regular interests represented by the Class PEX Certificates. The pass-through rates on the Class A-S, B and C Certificates will at all times be the same as the pass-through rates of the Class A-S, B and C regular interests. | |||
| (8) | The Class A-S, B, C and PEX Certificates are “Exchangeable Certificates”. On the closing date, the upper-tier REMIC of the issuing entity will issue the Class A-S, B and C regular interests (each a “regular interest”) which will have outstanding principal balances on the closing date of $56,451,000, $44,691,000 and $35,281,000, respectively. The regular interests will be held in a grantor trust for the benefit of the holders of the Class A-S, B, C and PEX Certificates. The Class A-S, B, C and PEX Certificates will, at all times, represent undivided beneficial ownership interests in a grantor trust that will hold those regular interests. Each class of the Class A-S, B and C Certificates will, at all times, represent an undivided beneficial ownership interest in a percentage of the outstanding certificate principal balance of the regular interest with the same alphabetical class designation. The Class PEX Certificates will, at all times, represent an undivided beneficial ownership interest in the remaining percentages of the outstanding certificate principal balances of the Class A-S, B and C regular interests and which portions of those regular interests are referred to in this Term Sheet as the Class PEX Component A-S, Class PEX Component B and Class PEX Component C (collectively, the “Class PEX Components”). Following any exchange of Class A-S, B and C Certificates for Class PEX Certificates or any exchange of Class PEX Certificates for Class A-S, B and C Certificates as described in the Free Writing Prospectus, the percentage interest of the outstanding certificate principal balances of the Class A-S, B and C regular interest that is represented by the Class A-S, B, C and PEX Certificates will be increased or decreased accordingly. The initial certificate principal balance of each of the Class A-S, B and C Certificates shown in the table represents the maximum certificate principal balance of such class without giving effect to any exchange. The initial certificate principal balance of the Class PEX Certificates is equal to the aggregate of the initial certificate principal balance of the Class A-S, B and C Certificates and represents the maximum certificate principal balance of the Class PEX Certificates that could be issued in an exchange. The certificate principal balances of the Class A-S, B and C Certificates to be issued on the closing date will be reduced, in required proportions, by an amount equal to the certificate principal balance of the Class PEX Certificates issued on the closing date. Distributions and allocations of payments and losses with respect to the Exchangeable Certificates are described in this Term Sheet under “Allocations and Distributions on the Class A-S, B, C and PEX Certificates” and under “Description of the Offered Certificates—Distributions” in the Free Writing Prospectus. The maximum certificate principal balance of the Class PEX Certificates is set forth in the table but is not included in the certificate principal balance of the certificates set forth on the cover page of this Term Sheet or on the top of the cover page of the Free Writing Prospectus. | |||
| (9) | The Class X-A Certificates are notional amount certificates. The Notional Amount of the Class X-A Certificates will be equal to the aggregate principal balance of the Class A-1, A-2, A-3, A-4, A-5 and A-SB Certificates and the Class A-S regular interest outstanding from time to time. The Class X-A Certificates will not be entitled to distributions of principal. | |||
| (10) | The pass-through rate for the Class X-A Certificates for any distribution date will be a per annum rate equal to the excess, if any, of (a) the weighted average of the net mortgage interest rates on the mortgage loans for the related distribution date, over (b) the weighted average of the pass-through rates on the Class A-1, A-2, A-3, A-4, A-5 and A-SB Certificates and the Class A-S regular interest for the related distribution date, weighted on the basis of their respective aggregate principal balances outstanding immediately prior to that distribution date. For purposes of the calculation of the weighted average of the net mortgage interest rates on the mortgage loans for each distribution date, the mortgage interest rates will be adjusted as necessary to a 30/360 basis and, in the case of certain designated mortgage loans being sold to the trust by NCB, FSB, will be net of the Class X-Y strip rate. | |||
| (11) | The Class X-B Certificates are notional amount certificates. The Notional Amount of the Class X-B Certificates will be equal to the aggregate principal balance of the Class B and C regular interests and the Class D Certificates outstanding from time to time. The Class X-B Certificates will not be entitled to distributions of principal. | |||
| (12) | The pass-through rate for the Class X-B certificates for any distribution date will be a per annum rate equal to the excess, if any, of (a) the weighted average of the net mortgage interest rates on the mortgage loans for the related distribution date, over (b) the weighted average of the pass-through rates on the Class D certificates and the Class B and Class C regular interests for the related distribution date, weighted on the basis of their respective aggregate certificate principal balances outstanding immediately prior to that distribution date. For purposes of the calculation of the weighted average of the net mortgage interest rates on the mortgage loans for each distribution date, the mortgage interest rates will be adjusted as necessary to a 30/360 basis and, in the case of certain designated mortgage loans being sold to the trust by NCB, FSB, will be net of the Class X-Y strip rate. | |||
| (13) | The Class X-C Certificates are notional amount certificates. The Notional Amount of the Class X-C Certificates will be equal to the principal balance of the Class E Certificates outstanding from time to time. The Class X-C Certificates will not be entitled to distributions of principal. | |||
| (14) | The pass-through rate for the Class X-C Certificate for any distribution date will be a per annum rate equal to the excess, if any, of (a) the weighted average of the net mortgage interest rates on the mortgage loans for the related distribution date, over (b) the pass-through rate on the Class E Certificates for the related distribution date. For purposes of the calculation of the weighted average of the net mortgage interest rates on the mortgage loans for each distribution date, the mortgage interest rates will be adjusted as necessary to a 30/360 basis and, in the case of certain designated mortgage loans being sold to the trust by NCB, FSB, will be net of the Class X-Y strip rate. | |||
| (15) | The Class X-D Certificates are notional amount certificates. The Notional Amount of the Class X-D Certificates will be equal to the aggregate principal balance of the Class F Certificates outstanding from time to time. The Class X-D Certificates will not be entitled to distributions of principal. | |||
| (16) | The pass-through rate for the Class X-D Certificates for any distribution date will be a per annum rate equal to the excess, if any, of (a) the weighted average of the net mortgage interest rates on the mortgage loans for the related distribution date, over (b) the pass-through rate on the Class F Certificates for the related distribution date. For purposes of the calculation of the weighted average of the net mortgage interest rates on the mortgage loans for each distribution date, the mortgage interest rates will be adjusted as necessary to a 30/360 basis and, in the case of certain designated mortgage loans being sold to the trust by NCB, FSB, will be net of the Class X-Y strip rate. | |||
| (17) | The Class X-E Certificates are notional amount certificates. The Notional Amount of the Class X-E Certificates will be equal to the aggregate principal balance of the Class G Certificates outstanding from time to time. The Class X-E Certificates will not be entitled to distributions of principal. | |||
| (18) | The pass-through rate for the Class X-E Certificates for any distribution date will be a per annum rate equal to the excess, if any, of (a) the weighted average of the net mortgage interest rates on the mortgage loans for the related distribution date, over (b) the pass-through rate on the Class G Certificates for the related distribution date. For purposes of the calculation of the weighted average of the net mortgage interest rates on the mortgage loans for each distribution date, the mortgage interest rates will be adjusted as necessary to a 30/360 basis and, in the case of certain designated mortgage loans being sold to the trust by NCB, FSB, will be net of the Class X-Y strip rate. | |||
| (19) | The Class X-Y Certificates are notional amount certificates. The Notional Amount of the Class X-Y Certificates will be equal to the aggregate principal balance of the designated NCB mortgage loans outstanding from time to time. A “designated NCB mortgage loan” is a mortgage loan sold by NCB, FSB that with respect to which the prepayment premium payable in connection with certain prepayments is equal to a stated percentage of the principal amount prepaid. This percentage declines over the term of the mortgage loan from 5% of the principal amount prepaid to 1% of the principal amount prepaid. Sixteen (16) of the twenty (20) mortgage loans being sold by NCB, FSB to the depositor, having an aggregate cut-off date principal balance of $39,033,711 and representing approximately 4.1% of the cut-off date pool balance, are sometimes referred to herein as “designated NCB mortgage loans”. The Class X-Y Certificates will not be entitled to distributions of principal. | |||
| (20) | The pass-through rate for the Class X-Y Certificates for any distribution date will be [0.10]% per annum (the “Class X-Y strip rate”), adjusted as necessary to a 30/360 basis. |
THE INFORMATION IN THIS STRUCTURAL AND COLLATERAL TERM SHEET IS NOT COMPLETE AND MAY BE AMENDED PRIOR TO THE TIME OF SALE. THIS TERM SHEET IS NOT AN OFFER TO SELL THESE SECURITIES AND IT IS NOT A SOLICITATION OF AN OFFER TO BUY THESE SECURITIES IN ANY JURISDICTION WHERE THE OFFER OR SALE IS NOT PERMITTED.
4
WFRBS Commercial Mortgage Trust 2014-C23 | Characteristics of the Mortgage Pool |
II. Transaction Highlights
Mortgage Loan Sellers:
Mortgage Loan Seller | Number of Mortgage Loans | Number of Mortgaged Properties | Aggregate Cut-off Date Balance | % of Cut-off Date Pool Balance | |||||||||||
| Wells Fargo Bank, National Association | 42 | 44 | $535,763,998 | 56.9 | % | ||||||||||
The Royal Bank of Scotland(1) | 11 | 25 | 186,337,500 | 19.8 | |||||||||||
| Liberty Island Group I LLC | 5 | 6 | 74,250,000 | 7.9 | |||||||||||
| C-III Commercial Mortgage LLC | 8 | 8 | 50,658,000 | 5.4 | |||||||||||
| Basis Real Estate Capital II, LLC | 6 | 8 | 48,657,750 | 5.2 | |||||||||||
NCB, FSB | 20 | 20 | 45,182,381 | 4.8 | |||||||||||
| Total | 92 | 111 | $940,849,629 | 100.0 | % | ||||||||||
| (1) | The mortgage loan seller referred to herein as The Royal Bank of Scotland is comprised of two affiliated companies: The Royal Bank of Scotland plc and RBS Financial Products Inc. With respect to the mortgage loans being sold for deposit into the trust by The Royal Bank of Scotland: (a) nine (9) mortgage loans, having an aggregate cut-off date principal balance of $158,837,500 and representing approximately 16.9% of the aggregate principal balance of the pool of mortgage loans as of the cut-off date, are being sold for deposit into the trust by The Royal Bank of Scotland plc and (b) two (2) mortgage loans, having an aggregate cut-off date principal balance of $27,500,000 and representing approximately 2.9% of the aggregate principal balance of the pool of mortgage loans as of the cut-off date are being sold for deposit into the trust by RBS Financial Products Inc. |
Loan Pool:
| Cut-off Date Balance: | $940,849,629 |
| Number of Mortgage Loans: | 92 |
| Average Cut-off Date Balance per Mortgage Loan: | $10,226,626 |
| Number of Mortgaged Properties: | 111 |
Average Cut-off Date Balance per Mortgaged Property(1): | $8,476,123 |
| Weighted Average Mortgage Interest Rate: | 4.419% |
| Ten Largest Mortgage Loans as % of Cut-off Date Pool Balance: | 53.2% |
| Weighted Average Original Term to Maturity (months): | 118 |
| Weighted Average Remaining Term to Maturity (months): | 117 |
Weighted Average Original Amortization Term (months)(2): | 360 |
Weighted Average Remaining Amortization Term (months)(2): | 360 |
| Weighted Average Seasoning (months): | 0 |
| (1) | Information regarding mortgage loans secured by multiple properties is based on an allocation according to relative appraised values or the allocated loan amounts or property-specific release prices set forth in the related loan documents or such other allocation as the related mortgage loan seller deemed appropriate. |
| (2) | Excludes any mortgage loan that does not amortize. |
Credit Statistics:
Weighted Average U/W Net Cash Flow DSCR(1): | 1.92x |
Weighted Average U/W Net Operating Income Debt Yield Ratio(1): | 11.4% |
Weighted Average Cut-off Date Loan-to-Value Ratio(1): | 65.1% |
Weighted Average Balloon Loan-to-Value Ratio(1): | 56.8% |
% of Mortgage Loans with Additional Subordinate Debt(2): | 8.2% |
% of Mortgage Loans with Single Tenants(3): | 5.5% |
| (1) | With respect to the each pari passu mortgage loan, loan-to-value ratio, debt service coverage ratio and debt yield calculations include the related pari passu companion loan (unless otherwise stated) in total debt. The debt service coverage ratio and debt yield calculations for each residential cooperative mortgage loan is calculated using underwritten net cash flow for the related residential cooperative property, which is the projected net cash flow reflected in the most recent appraisal obtained by or otherwise in the possession of the related mortgage loan seller as of the cut-off date, and the loan-to value ratio information for each residential cooperative mortgage loan is based upon the appraised value of the residential cooperative property determined as if such residential cooperative property is operated as a residential cooperative. See Annex A to the Free Writing Prospectus. Debt service coverage ratio, debt yield and loan-to-value ratio information does not take into account any of subordinate debt (whether or not secured by the mortgaged property), that is allowed under the terms of any mortgage loan. |
| (2) | Nineteen (19) of the mortgage loans, each of which is secured by residential cooperative properties, currently have in place subordinate secured lines of credit to the related mortgage borrowers that permit future advances (such loans, collectively, the “Subordinate Coop LOCs”). The percentage figure expressed as “% of Mortgage loans with Additional Subordinate Debt” is determined as a percentage of cut-off date principal balance of the mortgage pool and does not take into account future subordinate debt (whether or not secured by the mortgaged property), if any, that may be permitted under the terms of any mortgage loan or the pooling and servicing agreement. See “Description of the Mortgage Pool—Subordinate and/or Other Financing” and “—Additional Debt Financing for Mortgage Loans Secured by Residential Cooperatives” in the Free Writing Prospectus. |
| (3) | Excludes mortgage loans that are secured by multiple single-tenant properties. |
THE INFORMATION IN THIS STRUCTURAL AND COLLATERAL TERM SHEET IS NOT COMPLETE AND MAY BE AMENDED PRIOR TO THE TIME OF SALE. THIS TERM SHEET IS NOT AN OFFER TO SELL THESE SECURITIES AND IT IS NOT A SOLICITATION OF AN OFFER TO BUY THESE SECURITIES IN ANY JURISDICTION WHERE THE OFFER OR SALE IS NOT PERMITTED.
5
WFRBS Commercial Mortgage Trust 2014-C23 | Characteristics of the Mortgage Pool |
Loan Structural Features:
Amortization: Based on the Cut-off Date Pool Balance, 83.9% of the mortgage pool (84 mortgage loans) have scheduled amortization, as follows:
26.1% (43 mortgage loans) require amortization during the entire loan term
57.8% (41 mortgage loans) provide for an interest-only period followed by an amortization period
Interest-Only: Based on the Cut-off Date Pool Balance, 16.1% of the mortgage pool (8 mortgage loans) provides for interest-only payments during the entire loan term. The Weighted Average Cut-off Date Loan-to-Value Ratio and Weighted Average U/W Net Cash Flow DSCR for those mortgage loans is 61.3% and 2.86x, respectively.
Hard Lockboxes: Based on the Cut-off Date Pool Balance, 53.0% of the mortgage pool (14 mortgage loans) have hard lockboxes in place.
Reserves: The mortgage loans require amounts to be escrowed monthly as follows (excluding any mortgage loans with springing provisions):
| Real Estate Taxes: | 92.8% of the pool | |
| Insurance Premiums: | 35.0% of the pool | |
| Capital Replacements: | 89.6% of the pool | |
| TI/LC: | 58.2% of the pool(1) | |
| (1) | The percentage of the Cut-off Date Balance for loans with TI/LC reserves is based on the aggregate principal balance allocable to office, retail, industrial, and mixed use properties. | |
Call Protection/Defeasance: Based on the Cut-off Date Pool Balance, the mortgage pool has the following call protection and defeasance features:
91.8% of the mortgage pool (64 mortgage loans) features a lockout period, then defeasance only until an open period;
3.4% of the mortgage pool (eight mortgage loans) features a lockout period, then requires the greater of a prepayment premium or yield maintenance until an open period;
3.2% of the mortgage pool (14 mortgage loans) features no lockout period, but requires a prepayment premium equal to a stated percentage of the principal amount prepaid which declines from 5.0% of the principal amount prepaid to 1.0% of the principal amount repaid until an open period;
1.0% of the mortgage pool (two mortgage loans) features a one month lockout period, then requires a prepayment premium equal to a stated percentage of the principal amount prepaid which declines from 5.0% of the principal amount prepaid to 1.0% of the principal amount repaid until an open period;
0.5% of the mortgage pool (three mortgage loans) features no lockout period, but requires the greater of a prepayment premium or yield maintenance for a period, then a prepayment premium until an open period; and
0.2% of the mortgage pool (one mortgage loan) features a one month lockout period, then requires the greater of a prepayment premium or yield maintenance for a period, then a prepayment premium until an open period.
Please refer to Annex A to the Free Writing Prospectus for further description of individual loan call protection.
THE INFORMATION IN THIS STRUCTURAL AND COLLATERAL TERM SHEET IS NOT COMPLETE AND MAY BE AMENDED PRIOR TO THE TIME OF SALE. THIS TERM SHEET IS NOT AN OFFER TO SELL THESE SECURITIES AND IT IS NOT A SOLICITATION OF AN OFFER TO BUY THESE SECURITIES IN ANY JURISDICTION WHERE THE OFFER OR SALE IS NOT PERMITTED.
6
WFRBS Commercial Mortgage Trust 2014-C23 | Characteristics of the Mortgage Pool |
III. Issue Characteristics
| Securities Offered: | $795,017,000 approximate monthly pay, multi-class, commercial mortgage REMIC pass-through certificates consisting of twelve classes (Classes A-1, A-2, A-3, A-4, A-5, A-SB, A-S, B, C, PEX, X-A and X-B), which are offered pursuant to a registration statement filed with the SEC. | |
| Mortgage Loan Sellers: | Wells Fargo Bank, National Association (“WFB”); The Royal Bank of Scotland (“RBS”); Liberty Island Group I LLC (“LIG I”); Basis Real Estate Capital II, LLC (“Basis”); C-III Commercial Mortgage LLC (“CIIICM”); and NCB, FSB | |
| Co-lead Bookrunning Managers: | RBS Securities Inc. and Wells Fargo Securities, LLC | |
| Co-Managers: | Goldman, Sachs & Co. | |
| Rating Agencies: | Fitch Ratings, Inc., Moody’s Investors Service, Inc., and Morningstar Credit Ratings, LLC | |
| Master Servicers: | Wells Fargo Bank, National Association and NCB, FSB | |
| Special Servicers: | CWCapital Asset Management, LLC and NCB, FSB | |
| Certificate Administrator: | Wells Fargo Bank, National Association | |
| Trustee: | Wilmington Trust, National Association | |
| Trust Advisor: | Trimont Real Estate Advisors, Inc. | |
| Initial Majority Subordinate Certificateholder: | Affiliates of Raith Capital Management, LLC and AllianceBernstein L.P. | |
| Cut-off Date: | The Cut-off Date with respect to each mortgage loan is the due date for the monthly debt service payment that is due in September 2014 (or, in the case of any mortgage loan that has its first due date in October 2014, the date that would have been its due date in September 2014 under the terms of that mortgage loan if a monthly debt service payment were scheduled to be due in that month). | |
| Expected Closing Date: | On or about September 30, 2014. | |
| Determination Dates: | The eleventh day of each month (or if that day is not a business day, the next succeeding business day), commencing in October 2014. | |
| Distribution Dates: | The fourth business day following the Determination Date in each month, commencing in October 2014. | |
| Rated Final Distribution Date: | The Distribution Date in October 2057. | |
| Interest Accrual Period: | With respect to any Distribution Date, the calendar month preceding the month in which such Distribution Date occurs. | |
| Day Count: | The Offered Certificates will accrue interest on a 30/360 basis. | |
| Minimum Denominations: | $10,000 for each Class of Offered Certificates (other than the Class X-A and Class X-B Certificates) and $1,000,000 for the Class X-A and Class X-B Certificates. Investments may also be made in any whole dollar denomination in excess of the applicable minimum denomination. | |
| Clean-up Call: | 1% | |
| Delivery: | DTC, Euroclear and Clearstream Banking | |
| ERISA/SMMEA Status: | Each Class of Offered Certificates is expected to be eligible for exemptive relief under ERISA. No Class of Offered Certificates will be SMMEA eligible. | |
| Risk Factors: | THE CERTIFICATES INVOLVE CERTAIN RISKS AND MAY NOT BE SUITABLE FOR ALL INVESTORS. SEE THE “RISK FACTORS” SECTION OF THE FREE WRITING PROSPECTUS. | |
| Bond Analytics Information: | The Certificate Administrator will be authorized to make distribution date settlements, CREFC® reports and certain supplemental reports (other than confidential information) available to certain financial modeling and data provision services, including Bloomberg Financial Markets L.P., Trepp LLC, Intex Solutions, Inc., Markit Group Limited, Interactive Data Corp., BlackRock Financial Management, Inc. and CMBS.com, Inc. |
THE INFORMATION IN THIS STRUCTURAL AND COLLATERAL TERM SHEET IS NOT COMPLETE AND MAY BE AMENDED PRIOR TO THE TIME OF SALE. THIS TERM SHEET IS NOT AN OFFER TO SELL THESE SECURITIES AND IT IS NOT A SOLICITATION OF AN OFFER TO BUY THESE SECURITIES IN ANY JURISDICTION WHERE THE OFFER OR SALE IS NOT PERMITTED.
7
WFRBS Commercial Mortgage Trust 2014-C23 | Characteristics of the Mortgage Pool |
IV. Characteristics of the Mortgage Pool(1)
A. Ten Largest Mortgage Loans
Mortgage Loan Seller | Mortgage Loan Name | City | State | Number of Mortgage Loans / Mortgaged Properties | Mortgage Loan Cut-off Date Balance ($) | % of Cut- off Date Pool Balance (%) | Property Type | Number of SF or Rooms | Cut-off Date Balance Per Unit of Measure($) | Cut-off Date LTV Ratio (%) | Balloon LTV Ratio (%) | U/W NCF DSCR (x) | U/W NOI Debt Yield (%) | |||||||||||||||||
| WFB | Bank of America Plaza | Los Angeles | CA | 1 / 1 | $116,670,000 | 12.4 | % | Office | 1,432,285 | $279 | 66.1 | % | 66.1 | % | 2.08 | x | 9.3 | % | ||||||||||||
| WFB | Crossings at Corona | Corona | CA | 1 / 1 | 75,000,000 | 8.0 | Retail | 834,075 | 174 | 65.3 | 56.9 | 1.27 | 8.2 | |||||||||||||||||
| WFB | Columbus Square Portfolio | New York | NY | 1 / 1 | 75,000,000 | 8.0 | Mixed Use | 494,224 | 809 | 72.1 | 66.1 | 1.15 | 6.7 | |||||||||||||||||
| RBS | DC Metro Mixed Use Portfolio | Various | Various | 1 / 15 | 63,487,500 | 6.7 | Various | 158,121 | 402 | 75.0 | 64.8 | 1.27 | 8.1 | |||||||||||||||||
| LIG I | Centennial Center & Two Century Center | Schaumburg | IL | 1 / 2 | 42,500,000 | 4.5 | Office | 493,428 | 86 | 73.0 | 64.8 | 1.49 | 10.5 | |||||||||||||||||
| RBS | 677 Broadway | Albany | NY | 1 / 1 | 28,875,000 | 3.1 | Office | 177,039 | 163 | 74.0 | 59.8 | 1.51 | 10.0 | |||||||||||||||||
| WFB | Homewood Suites – New Orleans | New Orleans | LA | 1 / 1 | 26,953,433 | 2.9 | Hospitality | 166 | 162,370 | 59.0 | 43.1 | 1.83 | 13.3 | |||||||||||||||||
| WFB | Culver City Office Portfolio | Culver City | CA | 1 / 1 | 25,300,000 | 2.7 | Office | 93,977 | 269 | 68.6 | 55.4 | 1.32 | 8.7 | |||||||||||||||||
| WFB | Slatten Ranch Shopping Center | Antioch | CA | 1 / 1 | 25,200,000 | 2.7 | Retail | 118,250 | 213 | 68.5 | 62.5 | 1.43 | 9.1 | |||||||||||||||||
| LIG I | Simi Valley Shopping Center | Simi Valley | CA | 1 / 1 | 22,000,000 | 2.3 | Retail | 218,698 | 101 | 55.0 | 44.5 | 1.86 | 12.2 | |||||||||||||||||
| Top Three Total/Weighted Average | 3 / 3 | $266,670,000 | 28.3 | % | 67.6 | % | 63.5 | % | 1.59 | x | 8.3 | % | ||||||||||||||||||
| Top Five Total/Weighted Average | 5 / 20 | $372,657,500 | 39.6 | % | 69.4 | % | 63.9 | % | 1.52 | x | 8.5 | % | ||||||||||||||||||
| Top Ten Total/Weighted Average | 10 / 25 | $500,985,933 | 53.2 | % | 68.4 | % | 61.2 | % | 1.54 | x | 9.0 | % | ||||||||||||||||||
| Non-Top Ten Total/Weighted Average | 82 / 86 | $439,863,696 | 46.8 | % | 61.3 | % | 51.9 | % | 2.35 | x | 14.1 | % | ||||||||||||||||||
(1) | With respect to each pari passu mortgage loan, Cut-off Date Balance per unit of measure, loan-to-value ratio, debt service coverage ratio and debt yield calculations include the related pari passu companion loan (unless otherwise stated) in total debt. With respect to each mortgage loan, debt service coverage ratio, debt yield and loan-to-value ratio information takes no account of subordinate debt (whether or not secured by the related mortgage property), if any, that is allowed under the terms of any mortgage loan. |
THE INFORMATION IN THIS STRUCTURAL AND COLLATERAL TERM SHEET IS NOT COMPLETE AND MAY BE AMENDED PRIOR TO THE TIME OF SALE. THIS TERM SHEET IS NOT AN OFFER TO SELL THESE SECURITIES AND IT IS NOT A SOLICITATION OF AN OFFER TO BUY THESE SECURITIES IN ANY JURISDICTION WHERE THE OFFER OR SALE IS NOT PERMITTED.
8
WFRBS Commercial Mortgage Trust 2014-C23 | Characteristics of the Mortgage Pool |
B. Summary of Pari Passu Split Loan Structures
Mortgage Loan Name | Mortgage Loan Seller | Related Notes in Loan Group (Original Balance) | Holder of Note | Whether Note is Lead Servicing for the Entire Loan Combination | Current Master Servicer Under Related Securitization PSA | Current Special Servicer Under Related Securitization PSA | |
| Bank of America Plaza | WFB | $150,000,000 | WFRBS 2014-C22(1) | Yes | Wells Fargo Bank, National Association | CWCapital Asset Management, LLC | |
| WFB | $116,670,000 | WFRBS 2014-C23 | No | Wells Fargo Bank, National Association | CWCapital Asset Management, LLC | ||
| Citi | $133,330,000 | (2) | No | TBD | TBD | ||
| Crossings at Corona | WFB | $75,000,000 | WFRBS 2014-C23 | Yes | Wells Fargo Bank, National Association | Rialto Capital Management, LLC | |
| WFB | $70,000,000 | (3) | No | TBD | TBD | ||
| Columbus Square Portfolio | WFB | $125,000,000 | WFRBS 2014-C22(1) | Yes | Wells Fargo Bank, National Association | CWCapital Asset Management, LLC | |
| WFB | $75,000,000 | WFRBS 2014-C23 | No | Wells Fargo Bank, National Association | CWCapital Asset Management, LLC | ||
| Barclays | $103,750,000 | (4) | No | TBD | TBD | ||
| Barclays | $96,250,000 | (4) | No | TBD | TBD |
(1) | The related pari passu companion loan Note A-1 is currently held by Wells Fargo Bank, National Association and is expected to be contributed to WFRBS 2014-C22. |
(2) | The related pari passu companion loan Note A-3 is currently held by Citigroup Global Markets Realty Corp. and is expected to be contributed to a future securitization. No assurance can be provided that Note A-3 will not be split further. |
(3) | The related pari passu companion loan Note A-2 is currently held by Wells Fargo Bank, National Association and is expected to be contributed to a future securitization. No assurance can be provided that Note A-2 will not be split further. |
(4) | The related pari passu companion loan Notes A-2 and A-4 are currently held by Barclays Bank plc and are expected to be contributed to future securitizations. No assurance can be provided that Notes A-2 and A-4 will not be split further. |
C. Mortgage Loans with Additional Secured and Mezzanine Financing(1)(2)
| Loan No. | Mortgage Loan Seller | Mortgage Loan Name | Mortgage Loan Cut-off Date Balance ($) | % of Cut-off Date Balance (%) | Sub Debt Cut-off Date Balance ($) | Mezzanine Debt Cut-off Date Balance ($) | Total Debt Interest Rate (%) | Mortgage Loan U/W NCF DSCR (x) | Total Debt U/W NCF DSCR (x) | Mortgage Loan Cut- off Date U/W NOI Debt Yield (%) | Total Debt Cut-off Date U/W NOI Debt Yield (%) | Mortgage Loan Cut-off Date LTV Ratio (%) | Total Debt Cut-off Date LTV Ratio (%) | ||||||||||||||||||||||||||
| 6 | RBS | 677 Broadway | $ | 28,875,000 | 3.1 | % | $0 | $ | 3,350,000 | 5.262 | % | 1.51 | x | 1.23 | x | 10.0 | % | 8.9 | % | 74.0 | % | 82.6 | % | ||||||||||||||||
| 34 | WFB | Jordan Hospital Medical Office | 6,435,000 | 0.7 | 0 | 2,290,672 | (3) | 4.290 | (4) | 1.59 | (4) | 1.27 | (4) | 10.3 | 7.6 | 60.1 | 81.5 | ||||||||||||||||||||||
| Total/Weighted Average | $ | 35,310,000 | 3.8 | % | $0 | $ | 5,640,672 | 5.085 | % | 1.52 | x | 1.24 | x | 10.1 | % | 8.7 | % | 71.5 | % | 82.4 | % | ||||||||||||||||||
| (1) | In addition, nineteen (19) of the mortgage loans, each of which are secured by residential cooperative properties, currently have in place Subordinate Coop LOCs that permit future advances, but as to which there are no present outstanding balances, except for loan #81, 61 Irving Place Corporation, which has a balance of $350,000 on its related Subordinate Coop LOC. See “Description of the Mortgage Pool—Additional Indebtedness” and “—Additional Debt Financing for Mortgage Loans Secured by Residential Cooperatives” in the Free Writing Prospectus. |
| (2) | Total Debt Interest Rate for any specified mortgage loan reflects the weighted average of the interest rates on the respective components of the total debt. |
(3) | The Mezzanine Debt Cut-off Date Balance reflects the allocated mezzanine loan for the Jordan Hospital Medical Office Mortgage Loan. The total $6.3 million mezzanine loan is secured by the interests in the borrower of the Jordan Hospital Medical Office Mortgage Loan and the Barrington Orthopedics Portfolio Mortgage Loan that was contributed to WFRBS 2014-C21. |
(4) | The mezzanine loan interest rate is variable. For calculations, 4.150% was the assumed mezzanine loan rate. |
THE INFORMATION IN THIS STRUCTURAL AND COLLATERAL TERM SHEET IS NOT COMPLETE AND MAY BE AMENDED PRIOR TO THE TIME OF SALE. THIS TERM SHEET IS NOT AN OFFER TO SELL THESE SECURITIES AND IT IS NOT A SOLICITATION OF AN OFFER TO BUY THESE SECURITIES IN ANY JURISDICTION WHERE THE OFFER OR SALE IS NOT PERMITTED.
9
WFRBS Commercial Mortgage Trust 2014-C23 | Characteristics of the Mortgage Pool |
D. Previous Securitization History(1)
| Loan No. | Mortgage Loan Seller | Mortgage Loan or Mortgaged Property Name | City | State | Property Type | Mortgage Loan or Mortgaged Property Cut-off Date Balance ($) | % of Cut-off Date Pool Balance (%) | Previous Securitization |
| 1 | WFB | Bank of America Plaza | Los Angeles | CA | Office | $116,670,000 | 12.4% | MSC 2004-HQ4 |
| 2 | WFB | Crossings at Corona | Corona | CA | Retail | 75,000,000 | 8.0 | COMM 2004-LB4A & WBCMT 2005-C21 |
| 6 | RBS | 677 Broadway | Albany | NY | Office | 28,875,000 | 3.1 | BSCMS 2005-PWR8 |
| 7 | WFB | Homewood Suites – New Orleans | New Orleans | LA | Hospitality | 26,953,433 | 2.9 | GMACC 2004-C3 |
| 9 | WFB | Slatten Ranch Shopping Center | Antioch | CA | Retail | 25,200,000 | 2.7 | WBCMT 2004-C15 |
| 28 | WFB | San Rafael Self Storage | San Rafael | CA | Self Storage | 8,800,000 | 0.9 | LBUBS 2004-C6 |
| 32.01 | WFB | Spring Lake Town Center | Spring Lake | NC | Retail | 3,075,000 | 0.3 | GSMS 2004-GG2 |
| 33 | WFB | Larchmont Village Plaza | Los Angeles | CA | Retail | 7,000,000 | 0.7 | CSFB 2004-C5 |
| 35 | RBS | Shiloh Business Park | Windsor | CA | Industrial | 6,000,000 | 0.6 | MSC 2007-HQ11 |
| 37 | CIIICM | Storage Choice Sugar Land | Sugar Land | TX | Self Storage | 5,640,000 | 0.6 | BACM 2004-5 |
| 38 | NCB, FSB | Chateau Villa Corp. | Staten Island | NY | Multifamily | 5,500,000 | 0.6 | MSC 2005-IQ10 |
| 39 | CIIICM | Storage Choice Pearland | Pearland | TX | Self Storage | 5,250,000 | 0.6 | BACM 2004-5 |
| 40 | CIIICM | Country Life MHP | El Centro | CA | Manufactured Housing Community | 5,200,000 | 0.6 | COMM 2004-LB4A |
| 45 | WFB | StorQuest – Hollywood | Los Angeles | CA | Self Storage | 4,050,000 | 0.4 | BACM 2004-5 |
| 52 | WFB | Renaissance Park I | Wilmington | NC | Office | 3,500,000 | 0.4 | CSFB 2004-C5 |
| 54 | CIIICM | Storage Choice Stafford | Houston | TX | Self Storage | 3,350,000 | 0.4 | GECMC 2005-C1 |
| 55 | WFB | Walgreens – Albuquerque | Albuquerque | NM | Retail | 3,346,219 | 0.4 | BSCMS 2004-PWR6 |
| 58 | WFB | Statewide Self Storage | Santa Cruz | CA | Self Storage | 2,830,253 | 0.3 | MSC 2004-HQ4 |
| 60 | CIIICM | Storage Choice Clear Lake | Webster | TX | Self Storage | 2,768,000 | 0.3 | GECMC 2005-C1 |
| 62 | WFB | Storage Depot – McAllen | McAllen | TX | Self Storage | 2,750,000 | 0.3 | BACM 2004-4 |
| 63 | NCB, FSB | Locust Street Owners Inc. | Mount Vernon | NY | Multifamily | 2,496,676 | 0.3 | MSC 2006-IQ11 |
| 66 | WFB | Cedar River Estates MHC | Fowlerville | MI | Manufactured Housing Community | 2,400,000 | 0.3 | MSC 2005-T17 |
| 67 | NCB, FSB | Elmhurst House, Inc. | Elmhurst | NY | Multifamily | 2,396,809 | 0.3 | CSFB 2004-C4 |
| 70 | NCB, FSB | 130 E. 94th Apartments Corp. | New York | NY | Multifamily | 2,296,942 | 0.2 | CSFB 2004-C4 |
| 71 | NCB, FSB | 95 Sedgwick Owners Corp. | Yonkers | NY | Multifamily | 2,197,075 | 0.2 | CSFB 2004-C4 |
| 78 | NCB, FSB | 828 Fifth Avenue Owners Corp. | New York | NY | Multifamily | 1,800,000 | 0.2 | CSFB 2004-C4 |
| 80 | NCB, FSB | Clark Street Tenants Incorporated | Brooklyn | NY | Multifamily | 1,600,000 | 0.2 | MSC 2005-IQ10 |
| 81 | NCB, FSB | 61 Irving Place Corporation | New York | NY | Multifamily | 1,597,872 | 0.2 | MSC 2005-IQ9 |
| 82 | NCB, FSB | 444 East 87th Street Owners Corp. | New York | NY | Multifamily | 1,550,000 | 0.2 | MSC 2005-IQ10 |
| 84 | NCB, FSB | 40 W. 22nd St. Tenants Cooperative Corp. | New York | NY | Multifamily | 1,500,000 | 0.2 | MSC 2005-IQ10 |
| 85 | CIIICM | Cheney Center | Mansfield | TX | Retail | 1,500,000 | 0.2 | JPMCC 2004-C3 |
| 86 | NCB, FSB | 323 West 83rd Owners Corp. | New York | NY | Multifamily | 1,500,000 | 0.2 | MSC 2005-IQ9 |
| 87 | WFB | Gibbons Commons Apartments | North Tonawanda | NY | Multifamily | 1,450,000 | 0.2 | BSCMS 2005-PWR7 |
| 89 | NCB, FSB | Trinity Arms Ltd. | New Rochelle | NY | Multifamily | 1,248,338 | 0.1 | MSC 2005-IQ9 |
| 90 | NCB, FSB | Garden Lofts Corp. | New York | NY | Multifamily | 1,200,000 | 0.1 | MSC 2005-IQ9 |
| Total | $368,491,617 | 39.2% | ||||||
(1) The table above represents the most recent securitization with respect to the mortgaged property securing the related mortgage loan, based on information provided by the related borrower or obtained through searches of a third-party database. While the above mortgage loans may have been securitized multiple times in prior transactions, mortgage loans are only listed in the above chart if the mortgage loan paid off a mortgage loan in another securitization. The information in the table above has not otherwise been confirmed by the mortgage loan sellers.
THE INFORMATION IN THIS STRUCTURAL AND COLLATERAL TERM SHEET IS NOT COMPLETE AND MAY BE AMENDED PRIOR TO THE TIME OF SALE. THIS TERM SHEET IS NOT AN OFFER TO SELL THESE SECURITIES AND IT IS NOT A SOLICITATION OF AN OFFER TO BUY THESE SECURITIES IN ANY JURISDICTION WHERE THE OFFER OR SALE IS NOT PERMITTED.
10
| WFRBS Commercial Mortgage Trust 2014-C23 | Characteristics of the Mortgage Pool |
E. Mortgage Loans with Scheduled Balloon Payments and Related Classes
Class A-2(1) | ||||||||||||||||||||||||||||||||
| Loan No. | Mortgage Loan Seller | Mortgage Loan Name | State | Property Type | Mortgage Loan Cut-off Date Balance ($) | % of Cut-off Date Pool Balance (%) | Mortgage Loan Balance at Maturity ($) | % of Class A-2 Certificate Principal Balance (%)(2) | Units/SF /Rooms | Loan per Unit/SF/ Room ($) | U/W NCF DSCR (x) | U/W NOI Debt Yield (%) | Cut-off Date LTV Ratio (%) | Balloon LTV Ratio (%) | Rem. IO Period (mos.) | Rem. Term to Maturity (mos.) | ||||||||||||||||
| 12 | RBS | Marriott Bakersfield | CA | Hospitality | $21,500,000 | 2.3% | $20,846,144 | 62.9% | 259 | $83,012 | 1.52x | 12.1% | 66.0% | 63.9% | 37 | 61 | ||||||||||||||||
| 20 | WFB | Corridors Deer Valley | AZ | Office | 10,600,000 | 1.1 | 10,011,691 | 30.2 | 164,410 | 64 | 2.08 | 13.6 | 66.3 | 62.6 | 24 | 60 | ||||||||||||||||
| Total/Weighted Average | $32,100,000 | 3.4% | $30,857,835 | 93.1% | 1.70x | 12.6% | 66.1% | 63.5% | 33 | 61 | ||||||||||||||||||||||
(1) The table above presents the mortgage loans whose balloon payments would be applied to pay down the principal balance of the Class A-2 Certificates, assuming a 0% CPR and applying the “Structuring Assumptions” described in the Free Writing Prospectus, including the assumptions that (i) none of the mortgage loans in the pool experience prepayments, defaults or losses; (ii) there are no extensions of maturity dates of any mortgage loans in the pool; and (iii) each mortgage loan in the pool is paid in full on its stated maturity date. Each class of Certificates, including the Class A-2 Certificates, evidences undivided ownership interests in the entire pool of mortgage loans. (2) Reflects the Mortgage Loan Balance at Maturity divided by the initial Class A-2 Certificate Principal Balance expressed as a percentage. | ||||||||||||||||||||||||||||||||
Class A-3(1) | ||||||||||||||||||||||||||||||||
| Loan No. | Mortgage Loan Seller | Mortgage Loan Name | State | Property Type | Mortgage Loan Cut-off Date Balance ($) | % of Cut-off Date Pool Balance (%) | Mortgage Loan Balance at Maturity ($) | % of Class A-3 Certificate Principal Balance (%)(2) | Units/SF /Pads | Loan per Unit/SF/ Pads ($) | U/W NCF DSCR (x) | U/W NOI Debt Yield (%) | Cut-off Date LTV Ratio (%) | Balloon LTV Ratio (%) | Rem. IO Period (mos.) | Rem. Term to Maturity (mos.) | ||||||||||||||||
| 23 | WFB | Gateway Plaza | TX | Retail | $9,750,000 | 1.0% | $8,500,988 | 100.0% | 138,452 | $70 | 1.48x | 10.0% | 72.2% | 63.0% | 0 | 84 | ||||||||||||||||
| Total/Weighted Average | $9,750,000 | 1.0% | $8,500,988 | 100.0% | 1.48x | 10.0% | 72.2% | 63.0% | 0 | 84 | ||||||||||||||||||||||
(1) The table above presents the mortgage loans whose balloon payments would be applied to pay down the principal balance of the Class A-3 Certificates, assuming a 0% CPR and applying the “Structuring Assumptions” described in the Free Writing Prospectus, including the assumptions that (i) none of the mortgage loans in the pool experience prepayments, defaults or losses; (ii) there are no extensions of maturity dates of any mortgage loans in the pool; and (iii) each mortgage loan in the pool is paid in full on its stated maturity date. Each class of Certificates, including the Class A-3 Certificates, evidences undivided ownership interests in the entire pool of mortgage loans. (2) Reflects the Mortgage Loan Balance at Maturity divided by the initial Class A-3 Certificate Principal Balance expressed as a percentage. | ||||||||||||||||||||||||||||||||
THE INFORMATION IN THIS STRUCTURAL AND COLLATERAL TERM SHEET IS NOT COMPLETE AND MAY BE AMENDED PRIOR TO THE TIME OF SALE. THIS TERM SHEET IS NOT AN OFFER TO SELL THESE SECURITIES AND IT IS NOT A SOLICITATION OF AN OFFER TO BUY THESE SECURITIES IN ANY JURISDICTION WHERE THE OFFER OR SALE IS NOT PERMITTED.
11
| WFRBS Commercial Mortgage Trust 2014-C23 | Characteristics of the Mortgage Pool |
F. Property Type Distribution(1)
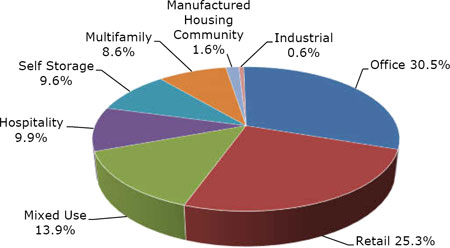
| Property Type | Number of Mortgaged Properties | Aggregate Cut- off Date Balance ($) | % of Cut- off Date Pool Balance (%) | Weighted Average Cut-off Date LTV Ratio (%) | Weighted Average Balloon LTV Ratio (%) | Weighted Average U/W NCF DSCR (x) | Weighted Average U/W NOI Debt Yield (%) | Weighted Average U/W NCF Debt Yield (%) | Weighted Average Mortgage Rate (%) |
| Office | 13 | $286,690,000 | 30.5% | 68.7% | 62.1% | 1.73x | 9.8% | 8.9% | 4.310% |
| CBD | 6 | 193,495,000 | 20.6 | 68.6 | 63.6 | 1.80 | 9.2 | 8.5 | 4.223 | ||
| Suburban | 6 | 86,760,000 | 9.2 | 69.4 | 59.3 | 1.59 | 11.1 | 9.7 | 4.501 | ||
| Medical | 1 | 6,435,000 | 0.7 | 60.1 | 54.9 | 1.59 | 10.3 | 9.5 | 4.340 | ||
| Retail | 28 | 237,980,776 | 25.3 | 65.6 | 56.6 | 1.51 | 9.6 | 8.9 | 4.404 | ||
| Anchored | 11 | 173,706,440 | 18.5 | 64.2 | 55.7 | 1.54 | 9.7 | 9.0 | 4.384 | ||
| Unanchored | 11 | 44,550,000 | 4.7 | 72.3 | 61.5 | 1.39 | 9.1 | 8.4 | 4.470 | ||
| Single Tenant | 3 | 13,598,087 | 1.4 | 58.9 | 49.7 | 1.57 | 10.2 | 9.6 | 4.456 | ||
| Shadow Anchored | 3 | 6,126,250 | 0.7 | 70.1 | 61.0 | 1.51 | 10.0 | 9.1 | 4.383 | ||
| Mixed Use | 9 | 130,629,133 | 13.9 | 72.7 | 64.8 | 1.25 | 7.7 | 7.4 | 4.544 | ||
| Retail/other/Office | 1 | 75,000,000 | 8.0 | 72.1 | 66.1 | 1.15 | 6.7 | 6.6 | 4.570 | ||
| Retail/Office | 6 | 42,504,133 | 4.5 | 73.8 | 63.6 | 1.38 | 9.2 | 8.4 | 4.519 | ||
| Multifamily/Retail | 1 | 8,925,000 | 0.9 | 75.0 | 64.8 | 1.27 | 8.1 | 7.7 | 4.500 | ||
| Self Storage/Retail | 1 | 4,200,000 | 0.4 | 66.1 | 53.4 | 1.77 | 11.1 | 10.7 | 4.437 | ||
| Hospitality | 8 | 92,719,417 | 9.9 | 64.0 | 50.8 | 1.64 | 12.6 | 10.9 | 4.651 | ||
| Limited Service | 6 | 44,265,984 | 4.7 | 66.0 | 49.2 | 1.59 | 12.4 | 10.9 | 4.793 | ||
| Extended Stay | 1 | 26,953,433 | 2.9 | 59.0 | 43.1 | 1.83 | 13.3 | 12.1 | 4.360 | ||
| Full Service | 1 | 21,500,000 | 2.3 | 66.0 | 63.9 | 1.52 | 12.1 | 9.5 | 4.722 | ||
| Self Storage | 22 | 90,305,753 | 9.6 | 65.6 | 56.1 | 1.65 | 9.8 | 9.6 | 4.515 | ||
| Self Storage | 22 | 90,305,753 | 9.6 | 65.6 | 56.1 | 1.65 | 9.8 | 9.6 | 4.515 | ||
| Multifamily | 25 | 81,224,550 | 8.6 | 39.9 | 33.6 | 5.43 | 28.8 | 28.5 | 4.245 | ||
| Cooperative | 20 | 45,182,381 | 4.8 | 13.3 | 11.0 | 8.72 | 44.7 | 44.7 | 4.016 | ||
| Garden | 4 | 34,592,169 | 3.7 | 74.0 | 62.5 | 1.30 | 8.6 | 8.0 | 4.536 | ||
| Senior Housing | 1 | 1,450,000 | 0.2 | 58.0 | 46.8 | 1.74 | 12.2 | 10.5 | 4.420 | ||
| Manufactured Housing Community | 5 | 15,300,000 | 1.6 | 61.2 | 52.7 | 1.88 | 11.9 | 11.6 | 4.504 | ||
| Manufactured Housing Community | 5 | 15,300,000 | 1.6 | 61.2 | 52.7 | 1.88 | 11.9 | 11.6 | 4.504 | ||
| Industrial | 1 | 6,000,000 | 0.6 | 71.7 | 71.7 | 2.07 | 10.3 | 9.6 | 4.579 | ||
| Light Industrial | 1 | 6,000,000 | 0.6 | 71.7 | 71.7 | 2.07 | 10.3 | 9.6 | 4.579 | ||
| Total/Weighted Average | 111 | $940,849,629 | 100.0% | 65.1% | 56.8% | 1.92x | 11.4% | 10.7% | 4.419% | ||
| (1) | Because this table presents information relating to the mortgaged properties and not the mortgage loans, the information for mortgage loans secured by more than one mortgaged property is based on allocated amounts (allocating the mortgage loan principal balance to each of those properties according to the relative appraised values of the mortgaged properties or the allocated loan amounts or property-specific release prices set forth in the related mortgage loan documents or such other allocation as the related mortgage loan seller deemed appropriate). For mortgaged properties securing residential cooperative mortgage loans, the debt service coverage ratio or debt yield for each such mortgaged property is calculated using underwritten net cash flow for the related residential cooperative property, which is the projected net cash flow reflected in the most recent appraisal obtained by or otherwise in the possession of the related mortgage loan seller as of the cut-off date, and the loan-to-value ratio is calculated based upon the appraised value of the residential cooperative property determined as if such residential cooperative property is operated as a residential cooperative. Debt service coverage ratio, debt yield and loan-to-value ratio information takes no account of subordinate debt (whether or not secured by the mortgaged property), if any, that is allowed under the terms of any mortgage loan. With respect to each pari passu mortgage loan, loan-to-value ratio, debt service coverage ratio and debt yield calculations include the related pari passu companion loan (unless otherwise stated) in total debt. |
THE INFORMATION IN THIS STRUCTURAL AND COLLATERAL TERM SHEET IS NOT COMPLETE AND MAY BE AMENDED PRIOR TO THE TIME OF SALE. THIS TERM SHEET IS NOT AN OFFER TO SELL THESE SECURITIES AND IT IS NOT A SOLICITATION OF AN OFFER TO BUY THESE SECURITIES IN ANY JURISDICTION WHERE THE OFFER OR SALE IS NOT PERMITTED.
12
| WFRBS Commercial Mortgage Trust 2014-C23 | Characteristics of the Mortgage Pool |
G. Geographic Distribution(1)(2)
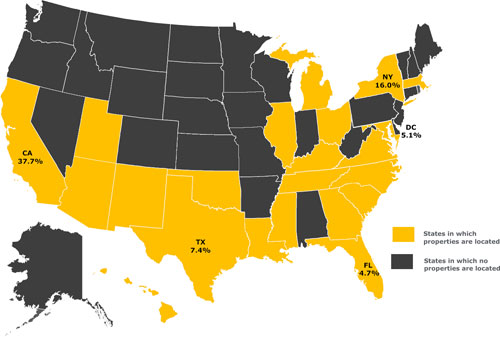
Location(3) | Number of Mortgaged Properties | Aggregate Cut-off Date Balance ($) | % of Cut-off Date Pool Balance | Weighted Average Cut-off Date LTV Ratio (%) | Weighted Average Balloon LTV Ratio (%) | Weighted Average U/W NCF DSCR (x) | Weighted Average U/W NOI Debt Yield (%) | Weighted Average U/W NCF Debt Yield (%) | Weighted Average Mortgage Rate (%) | ||||||||
| California | 16 | $354,689,107 | 37.7 | % | 64.4 | % | 59.0 | % | 1.73x | 9.7% | 8.9% | 4.311% | |||||
| Southern | 11 | 302,370,000 | 32.1 | 64.0 | 58.6 | 1.75 | 9.7 | 8.8 | 4.290 | ||||||||
| Northern | 5 | 52,319,107 | 5.6 | 67.1 | 61.2 | 1.63 | 9.7 | 9.1 | 4.437 | ||||||||
| New York | 23 | 150,507,381 | 16.0 | 54.7 | 48.2 | 3.50 | 18.8 | 18.6 | 4.385 | ||||||||
| Texas | 14 | 69,903,000 | 7.4 | 68.2 | 58.2 | 1.57 | 10.3 | 9.5 | 4.462 | ||||||||
| District of Columbia | 10 | 47,625,000 | 5.1 | 75.0 | 64.8 | 1.27 | 8.1 | 7.7 | 4.500 | ||||||||
| Florida | 8 | 43,579,321 | 4.6 | 65.7 | 55.3 | 1.56 | 10.6 | 9.6 | 4.587 | ||||||||
Other States(4) | 40 | 274,545,820 | 29.2 | 69.1 | 57.3 | 1.55 | 10.6 | 9.7 | 4.524 | ||||||||
| Total/Weighted Average | 111 | $940,849,629 | 100.0 | % | 65.1 | % | 56.8 | % | 1.90x | 11.4% | 10.7% | 4.419% | |||||
| (1) | The mortgaged properties are located in 22 states and the District of Columbia. |
| (2) | Because this table presents information relating to the mortgaged properties and not the mortgage loans, the information for mortgage loans secured by more than one mortgaged property is based on allocated amounts (allocating the mortgage loan principal balance to each of those properties according to the relative appraised values of the mortgaged properties or the allocated loan amounts or property-specific release prices set forth in the related mortgage loan documents or such other allocation as the related mortgage loan seller deemed appropriate). For mortgaged properties securing residential cooperative mortgage loans, the debt service coverage ratio or debt yield for each such mortgaged property is calculated using underwritten net cash flow for the related residential cooperative property, which is the projected net cash flow reflected in the most recent appraisal obtained by or otherwise in the possession of the related mortgage loan seller as of the cut-off date, and the loan-to-value ratio is calculated based upon the appraised value of the residential cooperative property determined as if such residential cooperative property is operated as a residential cooperative. Debt service coverage ratio, debt yield and loan-to-value ratio information takes no account of subordinate debt (whether or not secured by the mortgaged property), if any, that is allowed under the terms of any mortgage loan. With respect to each pari passu mortgage loan, loan-to-value ratio, debt service coverage ratio and debt yield calculations include the related pari passu companion loan (unless otherwise stated) in total debt. |
| (3) | For purposes of determining whether a mortgaged property is in Northern California or Southern California, Northern California includes areas with zip codes above 93600 and Southern California includes areas with zip codes of 93600 and below. |
| (4) | Includes 18 other states |
THE INFORMATION IN THIS STRUCTURAL AND COLLATERAL TERM SHEET IS NOT COMPLETE AND MAY BE AMENDED PRIOR TO THE TIME OF SALE. THIS TERM SHEET IS NOT AN OFFER TO SELL THESE SECURITIES AND IT IS NOT A SOLICITATION OF AN OFFER TO BUY THESE SECURITIES IN ANY JURISDICTION WHERE THE OFFER OR SALE IS NOT PERMITTED.
13
| WFRBS Commercial Mortgage Trust 2014-C23 | Characteristics of the Mortgage Pool |
H. Characteristics of the Mortgage Pool(1)
| CUT-OFF DATE BALANCE | |||
Range of Cut-off Date Balances ($) | Number of Mortgage Loans | Aggregate Cut- off Date Balance ($) | % of Cut-off Date Pool Balance |
| 998,670 - 1,000,000 | 1 | $998,670 | 0.1% |
| 1,000,001 - 2,000,000 | 20 | 32,146,982 | 3.4 |
| 2,000,001 - 3,000,000 | 14 | 35,200,753 | 3.7 |
| 3,000,001 - 4,000,000 | 12 | 42,808,202 | 4.5 |
| 4,000,001 - 5,000,000 | 5 | 22,550,000 | 2.4 |
| 5,000,001 - 6,000,000 | 6 | 33,490,000 | 3.6 |
| 6,000,001 - 7,000,000 | 2 | 13,435,000 | 1.4 |
| 7,000,001 - 8,000,000 | 4 | 30,731,250 | 3.3 |
| 8,000,001 - 9,000,000 | 1 | 8,800,000 | 0.9 |
| 9,000,001 - 10,000,000 | 5 | 46,763,854 | 5.0 |
| 10,000,001 - 15,000,000 | 8 | 95,657,750 | 10.2 |
| 15,000,001 - 20,000,000 | 2 | 33,981,234 | 3.6 |
| 20,000,001 - 30,000,000 | 7 | 171,628,433 | 18.2 |
| 30,000,001 - 50,000,000 | 1 | 42,500,000 | 4.5 |
| 50,000,001 - 70,000,000 | 1 | 63,487,500 | 6.7 |
| 70,000,001 - 90,000,000 | 2 | 150,000,000 | 15.9 |
| 110,000,001 – 116,670,000 | 1 | 116,670,000 | 12.4 |
| Total: | 92 | $940,849,629 | 100.0% |
| Average: | $10,226,626 | ||
| UNDERWRITTEN NOI DEBT SERVICE COVERAGE RATIO | |||
Range of U/W NOI DSCRs (x) | Number of Mortgage Loans | Aggregate Cut- off Date Balance ($) | % of Cut-off Date Pool Balance |
| 1.17 - 1.20 | 1 | $75,000,000 | 8.0% |
| 1.21 - 1.30 | 1 | 21,800,000 | 2.3 |
| 1.31 - 1.40 | 4 | 160,937,500 | 17.1 |
| 1.41 - 1.50 | 7 | 52,841,984 | 5.6 |
| 1.51 - 1.60 | 16 | 119,729,941 | 12.7 |
| 1.61 - 1.70 | 11 | 83,760,469 | 8.9 |
| 1.71 - 1.80 | 8 | 77,635,000 | 8.3 |
| 1.81 - 1.90 | 6 | 36,148,669 | 3.8 |
| 1.91 - 2.00 | 4 | 40,550,000 | 4.3 |
| 2.01 - 2.25 | 7 | 77,163,433 | 8.2 |
| 2.26 - 2.50 | 5 | 137,200,253 | 14.6 |
| 2.51 – 3.00 | 1 | 5,900,000 | 0.6 |
| 3.01 - 30.58 | 21 | 52,182,381 | 5.5 |
| Total: | 92 | $940,849,629 | 100.0% |
| Weighted Average: | 2.05x | ||
| UNDERWRITTEN NCF DEBT SERVICE COVERAGE RATIO | |||
Range of U/W NCF DSCRs (x) | Number of Mortgage Loans | Aggregate Cut- off Date Balance ($) | % of Cut-off Date Pool Balance |
| 1.15 - 1.20 | 2 | $96,800,000 | 10.3% |
| 1.21 - 1.30 | 4 | 160,937,500 | 17.1 |
| 1.31 - 1.40 | 5 | 56,408,338 | 6.0 |
| 1.41 - 1.50 | 18 | 160,423,500 | 17.1 |
| 1.51 - 1.60 | 15 | 118,889,337 | 12.6 |
| 1.61 - 1.70 | 10 | 51,694,888 | 5.5 |
| 1.71 - 1.80 | 3 | 13,550,000 | 1.4 |
| 1.81 - 1.90 | 5 | 59,653,433 | 6.3 |
| 1.91 - 2.00 | 2 | 21,210,000 | 2.3 |
| 2.01 - 2.25 | 3 | 133,270,000 | 14.2 |
| 2.26 - 2.50 | 4 | 15,830,253 | 1.7 |
| 2.51 - 3.50 | 3 | 5,745,014 | 0.6 |
| 3.51 – 4.00 | 2 | 9,197,075 | 1.0 |
| 4.01 – 30.58 | 16 | 37,240,293 | 4.0 |
| Total: | 92 | $940,849,629 | 100.0% |
| Weighted Average: | 1.92x | ||
| LOAN PURPOSE | |||
| Loan Purpose | Number of Mortgage Loans | Aggregate Cut- off Date Balance ($) | % of Cut-off Date Pool Balance |
| Refinance | 77 | $826,905,809 | 87.9% |
| Acquisition | 15 | 113,943,821 | 12.1 |
| Total: | 92 | $940,849,629 | 100.0% |
| MORTGAGE RATE | |||
Range of Mortgage Rates (%) | Number of Mortgage Loans | Aggregate Cut- off Date Balance ($) | % of Cut-off Date Pool Balance |
| 3.770 - 4.000 | 18 | $47,132,381 | 5.0% |
| 4.001 - 4.250 | 5 | 132,320,000 | 14.1 |
| 4.251 - 4.500 | 30 | 418,882,183 | 44.5 |
| 4.501 - 4.750 | 31 | 298,019,228 | 31.7 |
| 4.751 - 5.000 | 6 | 33,113,000 | 3.5 |
| 5.001 - 5.250 | 2 | 11,382,837 | 1.2 |
| Total: | 92 | $940,849,629 | 100.0% |
| Weighted Average: | 4.419% | ||
| UNDERWRITTEN NOI DEBT YIELD | |||
Range of U/W NOI Debt Yields (%) | Number of Mortgage Loans | Aggregate Cut- off Date Balance ($) | % of Cut-off Date Pool Balance |
| 6.7 - 8.9 | 7 | $274,537,500 | 29.2% |
| 9.0 - 9.9 | 23 | 284,510,088 | 30.2 |
| 10.0 - 10.9 | 17 | 145,379,219 | 15.5 |
| 11.0 - 11.9 | 10 | 44,712,006 | 4.8 |
| 12.0 - 12.9 | 6 | 60,350,000 | 6.4 |
| 13.0 - 13.9 | 5 | 69,248,183 | 7.4 |
| 14.0 - 14.9 | 1 | 5,200,000 | 0.6 |
| 15.0 - 15.9 | 2 | 8,900,000 | 0.9 |
| 16.0 - 16.9 | 1 | 2,830,253 | 0.3 |
| 18.0 - 19.9 | 3 | 5,745,014 | 0.6 |
| 20.0 – 124.0 | 17 | 39,437,368 | 4.2 |
| Total: | 92 | $940,849,629 | 100.0% |
| Weighted Average: | 11.4% | ||
| UNDERWRITTEN NCF DEBT YIELD | |||
Range of U/W NCF Debt Yields (%) | Number of Mortgage Loans | Aggregate Cut- off Date Balance ($) | % of Cut-off Date Pool Balance |
| 6.6 - 7.9 | 5 | $239,987,500 | 25.5% |
| 8.0 - 8.9 | 12 | 257,603,338 | 27.4 |
| 9.0 - 9.9 | 26 | 217,089,750 | 23.1 |
| 10.0 - 10.9 | 16 | 60,110,138 | 6.4 |
| 11.0 - 11.9 | 8 | 76,992,837 | 8.2 |
| 12.0 - 12.9 | 1 | 26,953,433 | 2.9 |
| 14.0 - 19.9 | 7 | 22,675,266 | 2.4 |
| 20.0 – 124.0 | 17 | 39,437,368 | 4.2 |
| Total: | 92 | $940,849,629 | 100.0% |
| Weighted Average: | 10.7% | ||
| (1) | The information in this “Characteristics of the Mortgage Pool” section has been calculated in accordance with the methodologies specified in footnote (1) to the table captioned “Credit Statistics” under the “Transaction Highlights” section above. |
THE INFORMATION IN THIS STRUCTURAL AND COLLATERAL TERM SHEET IS NOT COMPLETE AND MAY BE AMENDED PRIOR TO THE TIME OF SALE. THIS TERM SHEET IS NOT AN OFFER TO SELL THESE SECURITIES AND IT IS NOT A SOLICITATION OF AN OFFER TO BUY THESE SECURITIES IN ANY JURISDICTION WHERE THE OFFER OR SALE IS NOT PERMITTED.
14
| WFRBS Commercial Mortgage Trust 2014-C23 | Characteristics of the Mortgage Pool |
| ORIGINAL TERM TO MATURITY | |||
Range of Original Terms to Maturity (months) | Number of Mortgage Loans | Aggregate Cut- off Date Balance ($) | % of Cut-off Date Pool Balance |
| 60 - 61 | 2 | $32,100,000 | 3.4% |
| 84 | 1 | 9,750,000 | 1.0 |
| 120 - 121 | 89 | 898,999,629 | 95.6 |
| Total: | 92 | $940,849,629 | 100.0% |
| Weighted Average: | 118 months | ||
| REMAINING TERM TO MATURITY | |||
| Range of Remaining Terms to Maturity (months) | Number of Mortgage Loans | Aggregate Cut- off Date Balance ($) | % of Cut-off Date Pool Balance |
| 60 - 61 | 2 | $32,100,000 | 3.4% |
| 62 - 84 | 1 | 9,750,000 | 1.0 |
| 85 - 121 | 89 | 898,999,629 | 95.6 |
| Total: | 92 | $940,849,629 | 100.0% |
| Weighted Average: | 117 months | ||
ORIGINAL AMORTIZATION TERM(2) | |||
Range of Original Amortization Terms (months) | Number of Mortgage Loans | Aggregate Cut- off Date Balance ($) | % of Cut-off Date Pool Balance |
| Non-Amortizing | 8 | $151,720,000 | 16.1% |
| 240 | 1 | 9,200,000 | 1.0 |
| 241 - 300 | 10 | 76,126,006 | 8.1 |
| 301 - 360 | 69 | 620,153,623 | 65.9 |
| 361 - 480 | 4 | 83,650,000 | 8.9 |
| Total: | 92 | $940,849,629 | 100.0% |
Weighted Average(3): | 360 months | ||
(2) The original amortization term shown for any mortgage loan that is interest-only for part of its term does not include the number of months in its interest-only period and reflects only the number of months as of the commencement of amortization remaining from the end of such interest-only period. (3) Excludes the non-amortizing loans. | |||
REMAINING AMORTIZATION TERM(4) | |||
Range of Remaining Amortization Terms (months) | Number of Mortgage Loans | Aggregate Cut- off Date Balance ($) | % of Cut-off Date Pool Balance |
| Non-Amortizing | 8 | $151,720,000 | 16.1% |
| 240 | 1 | 9,200,000 | 1.0 |
| 241 - 300 | 10 | 76,126,006 | 8.1 |
| 301 - 360 | 69 | 620,153,623 | 65.9 |
| 361 - 480 | 4 | 83,650,000 | 8.9 |
| Total: | 92 | $940,849,629 | 100.0% |
Weighted Average(5): | 360 months | ||
(4) The remaining amortization term shown for any mortgage loan that is interest-only for part of its term does not include the number of months in its interest-only period and reflects only the number of months as of the commencement of amortization remaining from the end of such interest-only period. (5) Excludes the non-amortizing loans. | |||
| LOCKBOXES | |||
| Type of Lockbox | Number of Mortgage Loans | Aggregate Cut- off Date Balance ($) | % of Cut-off Date Pool Balance |
| Hard/Springing Cash Management | 11 | $394,255,500 | 41.9% |
| Springing (Without Estab Account) | 32 | 236,740,576 | 25.2 |
| None | 43 | 144,053,553 | 15.3 |
| Hard/Upfront Cash Management | 2 | 100,300,000 | 10.7 |
| Soft/Springing Cash Management | 4 | 65,500,000 | 7.0 |
| Total: | 92 | $940,849,629 | 100.0% |
| PREPAYMENT PROVISION SUMMARY | |||
| Prepayment Provision | Number of Mortgage Loans | Aggregate Cut- off Date Balance ($) | % of Cut-off Date Pool Balance |
| Lockout/Defeasance/Open | 64 | $863,647,063 | 91.8% |
| Lockout/YM%/Open | 8 | 32,020,185 | 3.4 |
| 5%/4%/3%/2%/1%/Open | 14 | 30,033,711 | 3.2 |
| Lockout/5%/4%/3%/2%/1%/Open | 2 | 9,000,000 | 1.0 |
| GTR 1% or YM/1%/Open | 3 | 4,598,670 | 0.5 |
| Lockout/GTR 1% or YM/1%/Open | 1 | 1,550,000 | 0.2 |
| Total: | 92 | $940,849,629 | 100.0% |
| CUT-OFF DATE LOAN-TO-VALUE RATIO | |||
Range of Cut-off Date LTV Ratios (%) | Number of Mortgage Loans | Aggregate Cut- off Date Balance ($) | % of Cut-off Date Pool Balance |
| 2.2 - 30.0 | 19 | $42,985,307 | 4.6% |
| 30.1 - 45.0 | 3 | 12,027,327 | 1.3 |
| 45.1 - 50.0 | 2 | 7,200,000 | 0.8 |
| 50.1 - 55.0 | 4 | 31,548,087 | 3.4 |
| 55.1 - 60.0 | 10 | 64,004,401 | 6.8 |
| 60.1 - 65.0 | 8 | 44,543,000 | 4.7 |
| 65.1 - 70.0 | 21 | 362,133,919 | 38.5 |
| 70.1 - 75.0 | 25 | 376,407,588 | 40.0 |
| Total: | 92 | $940,849,629 | 100.0% |
| Weighted Average: | 65.1% | ||
| BALLOON LOAN-TO-VALUE RATIO | |||
| Range of Balloon LTV Ratios (%) | Number of Mortgage Loans | Aggregate Cut- off Date Balance ($) | % of Cut-off Date Pool Balance |
| 1.8 - 30.0 | 21 | $48,012,634 | 5.1% |
| 30.1 - 40.0 | 1 | 7,000,000 | 0.7 |
| 40.1 - 45.0 | 8 | 79,851,270 | 8.5 |
| 45.1 - 50.0 | 9 | 43,219,219 | 4.6 |
| 50.1 - 55.0 | 16 | 83,066,234 | 8.8 |
| 55.1 - 60.0 | 13 | 185,581,023 | 19.7 |
| 60.1 - 65.0 | 17 | 248,318,000 | 26.4 |
| 65.1 - 70.0 | 6 | 239,801,250 | 25.5 |
| 70.1 - 71.7 | 1 | 6,000,000 | 0.6 |
| Total: | 92 | $940,849,629 | 100.0% |
| Weighted Average: | 56.8% | ||
| AMORTIZATION TYPE | |||
| Type of Amortization | Number of Mortgage Loans | Aggregate Cut- off Date Balance ($) | % of Cut-off Date Pool Balance |
| Interest-only, Amortizing Balloon | 41 | $543,452,250 | 57.8% |
| Amortizing Balloon | 43 | 245,677,379 | 26.1 |
| Interest-only, Balloon | 8 | 151,720,000 | 16.1 |
| Total: | 92 | $940,849,629 | 100.0% |
| ORIGINAL TERM OF INTEREST-ONLY PERIOD FOR PARTIAL IO LOANS | |||
| IO Term (months) | Number of Mortgage Loans | Aggregate Cut- off Date Balance ($) | % of Cut-off Date Pool Balance |
| 1 | 14 | $102,531,000 | 10.9% |
| 13 - 24 | 7 | 37,967,500 | 4.0 |
| 25 - 36 | 9 | 176,987,500 | 18.8 |
| 37 - 48 | 5 | 168,131,250 | 17.9 |
| 49 - 60 | 6 | 57,835,000 | 6.1 |
| Total: | 41 | $543,452,250 | 57.8% |
| Weighted Average: | 32 months | ||
SEASONING | |||
| Seasoning (months) | Number of Mortgage Loans | Aggregate Cut- off Date Balance ($) | % of Cut-off Date Pool Balance |
| 0 | 60 | $627,987,250 | 66.7% |
| 1 - 2 | 32 | 312,862,379 | 33.3 |
| Total: | 92 | $940,849,629 | 100.0% |
| Weighted Average: | 0 month | ||
THE INFORMATION IN THIS STRUCTURAL AND COLLATERAL TERM SHEET IS NOT COMPLETE AND MAY BE AMENDED PRIOR TO THE TIME OF SALE. THIS TERM SHEET IS NOT AN OFFER TO SELL THESE SECURITIES AND IT IS NOT A SOLICITATION OF AN OFFER TO BUY THESE SECURITIES IN ANY JURISDICTION WHERE THE OFFER OR SALE IS NOT PERMITTED.
15
| WFRBS Commercial Mortgage Trust 2014-C23 | Certain Terms and Conditions |
V. Certain Terms and Conditions
| Interest Entitlements: | The interest entitlement of each Class of Offered Certificates on each Distribution Date generally will be the interest accrued during the related Interest Accrual Period on the related Certificate Principal Balance or Notional Amount at the related pass-through rate, net of any prepayment interest shortfalls allocated to that Class for such Distribution Date as described below. If prepayment interest shortfalls arise from voluntary prepayments (without applicable Special Servicer consent) on particular non-specially serviced mortgage loans during any collection period, the applicable Master Servicer is required to make a compensating interest payment to offset those shortfalls, generally up to an amount equal to the portion of its master servicing fees that accrue at one basis point per annum. The remaining amount of prepayment interest shortfalls will be allocated to reduce the interest entitlement on all Classes of Certificates (other than the Class X-A, X-B, X-C, X-D, X-E and X-Y Certificates), pro rata, based on their respective amounts of accrued interest for the related Distribution Date (except with respect to the allocation among the Class A-S, B, C and PEX Certificates as described below under “Allocations and Distributions on the Class A-S, B, C and PEX Certificates”). If a Class receives less than the entirety of its interest entitlement on any Distribution Date, then the shortfall, excluding any shortfall due to prepayment interest shortfalls, will be added to its interest entitlement for the next succeeding Distribution Date. Interest entitlements on the Class E and D Certificates and the Class C and B regular interests, in that order, may be reduced by certain Trust Advisor expenses (subject to the discussion below under “Allocations and Distributions on the Class A-S, B, C and PEX Certificates”). | ||
| Principal Distribution Amount: | The Principal Distribution Amount for each Distribution Date generally will be the aggregate amount of principal received or advanced in respect of the mortgage loans, net of any non-recoverable advances and interest thereon that are reimbursed to the applicable Master Servicer, the applicable Special Servicer or the Trustee during the related collection period. Non-recoverable advances and interest thereon are reimbursable from principal collections and advances before reimbursement from other amounts. The Principal Distribution Amount may also be reduced, with a corresponding loss, to the Class E and D Certificates and the Class C, B and A-S regular interests, then to the Class A-1, A-2, A-3, A-4, A-5 and A-SB Certificates (with any losses on the Class A-1, A-2, A-3, A-4, A-5 and A-SB Certificates allocated pro rata according to their respective Certificate Principal Balances immediately prior to that Distribution Date), in that order, in connection with certain Trust Advisor expenses to the extent that interest entitlements on the Class B and C regular interests and the Class D and E Certificates are insufficient to absorb the effect of the expense on any particular Distribution Date. For a discussion on the allocation of amounts distributable in respect of the Class A-S, B and C regular interests, see “Allocations and Distributions on the Class A-S, B, C and PEX Certificates” below. | ||
| Distributions: | On each Distribution Date, funds available for distribution from the mortgage loans, net of specified trust fees, expenses and reimbursements will generally be distributed in the following amounts and order of priority (in each case to the extent of remaining available funds): | ||
| 1. | Class A-1, A-2, A-3, A-4, A-5, A-SB, X-A, X-B, X-C, X-D, X-E and X-Y Certificates: To interest on the Class A-1, A-2, A-3, A-4, A-5, A-SB, X-A, X-B, X-C, X-D, X-E and X-Y Certificates, pro rata, according to their respective interest entitlements. | ||
| 2. | Class A-1, A-2, A-3, A-4, A-5 and A-SB Certificates: To principal on the Class A-1, A-2, A-3, A-4, A-5 and A-SB Certificates in the following amounts and order of priority: (i) first, to principal on the Class A-SB Certificates, in an amount up to the Principal Distribution Amount for such Distribution Date until their Certificate Principal Balance is reduced to the Class A-SB Planned Principal Balance for such Distribution Date; (ii) second, to principal on the Class A-1 Certificates until their Certificate Principal Balance is reduced to zero, up to the remainder of the Principal Distribution Amount for such Distribution Date; (iii) third, to principal on the Class A-2 Certificates until their Certificate Principal Balance is reduced to zero, up to the remainder of the Principal Distribution Amount for such Distribution Date; (iv) fourth, to principal on the Class A-3 Certificates until their Certificate Principal Balance is reduced to zero, up to the remainder of the Principal Distribution Amount for such Distribution Date; (v) fifth, to principal on the Class A-4 Certificates until their Certificate Principal Balance is reduced to zero, up to the remainder of the Principal Distribution Amount for such Distribution Date; (vi) sixth, to principal on the Class A-5 Certificates until their Certificate Principal Balance is reduced to zero, up to the remainder of the Principal Distribution Amount for such Distribution Date; and (vii) seventh, to principal on the Class A-SB Certificates until their Certificate Principal Balance is reduced to zero, up to the remainder of the Principal Distribution Amount for such Distribution Date. However, if the Certificate Principal Balance of each and every Class of Principal Balance Certificates, other than the Class A-1, A-2, A-3, A-4, A-5 and A-SB | ||
THE INFORMATION IN THIS STRUCTURAL AND COLLATERAL TERM SHEET IS NOT COMPLETE AND MAY BE AMENDED PRIOR TO THE TIME OF SALE. THIS TERM SHEET IS NOT AN OFFER TO SELL THESE SECURITIES AND IT IS NOT A SOLICITATION OF AN OFFER TO BUY THESE SECURITIES IN ANY JURISDICTION WHERE THE OFFER OR SALE IS NOT PERMITTED.
16
| WFRBS Commercial Mortgage Trust 2014-C23 | Certain Terms and Conditions |
| Certificates, has been reduced to zero as a result of the allocation of Mortgage Loan losses and expenses and any of the Class A-1, A-2, A-3, A-4, A-5 and A-SB Certificates remains outstanding, then the Principal Distribution Amount will be distributed on the Class A-1, A-2, A-3, A-4, A-5 and A-SB Certificates, pro rata, based on their respective outstanding Certificate Principal Balances, until their Certificate Principal Balances have been reduced to zero. | |||
| 3. | Class A-1, A-2, A-3, A-4, A-5 and A-SB Certificates: To reimburse the holders of the Class A-1, A-2, A-3, A-4, A-5 and A-SB Certificates, pro rata, for any previously unreimbursed losses (other than certain Trust Advisor expenses) on the mortgage loans that were previously allocated in reduction of the Certificate Principal Balances of such Classes. | ||
| 4. | Class A-S regular interest: To make distributions on the Class A-S regular interest as follows: (a) first, to interest on Class A-S regular interest in the amount of the interest entitlement for that Class; (b) next, to the extent of the portion of the Principal Distribution Amount remaining after distributions in respect of principal to each Class with a higher distribution priority (in this case, the Class A-1, A-2, A-3, A-4, A-5 and A-SB Certificates), to principal on the Class A-S regular interest until its principal balance is reduced to zero; and (c) next, to reimburse the holders of the Class A-S regular interest for any previously unreimbursed losses (other than certain Trust Advisor expenses) on the mortgage loans that were previously allocated to that Class in reduction of its principal balance. | ||
| 5. | Class B regular interest: To make distributions on the Class B regular interest as follows: (a) first, to interest on Class B regular interest in the amount of the interest entitlement for that Class; (b) next, to the extent of the portion of the Principal Distribution Amount remaining after distributions in respect of principal to each Class with a higher distribution priority (in this case, the Class A-1, A-2, A-3, A-4, A-5 and A-SB Certificates and the Class A-S regular interest), to principal on the Class B regular interest until its principal balance is reduced to zero; and (c) next, to reimburse the holders of the Class B regular interest for any previously unreimbursed losses (other than certain Trust Advisor expenses) on the mortgage loans that were previously allocated to that Class in reduction of its principal balance. | ||
| 6. | Class C regular interest: To make distributions on the Class C regular interest as follows: (a) first, to interest on Class C regular interest in the amount of the interest entitlement for that Class; (b) next, to the extent of the portion of the Principal Distribution Amount remaining after distributions in respect of principal to each Class with a higher distribution priority (in this case, the Class A-1, A-2, A-3, A-4, A-5 and A-SB Certificates and the Class A-S and B regular interests), to principal on the Class C regular interest until its principal balance is reduced to zero; and (c) next, to reimburse the holders of the Class C regular interest for any previously unreimbursed losses (other than certain Trust Advisor expenses) on the mortgage loans that were previously allocated to that Class in reduction of its principal balance. | ||
| 7. | Class D Certificates: To make distributions on the Class D Certificates as follows: (a) first, to interest on Class D Certificates in the amount of the interest entitlement for that Class; (b) next, to the extent of the portion of the Principal Distribution Amount remaining after distributions in respect of principal to each Class with a higher distribution priority (in this case, the Class A-1, A-2, A-3, A-4, A-5 and A-SB Certificates and the Class A-S, B and C regular interests), to principal on the Class D Certificates until its principal balance is reduced to zero; and (c) next, to reimburse the holders of the Class D Certificates for any previously unreimbursed losses (other than certain Trust Advisor expenses) on the mortgage loans that were previously allocated to that Class in reduction of its principal balance. | ||
| 8. | After the Class A-1, A-2, A-3, A-4, A-5 and A-SB Certificates, the Class A-S, B and C regular interests and the Class D Certificates are paid all amounts to which they are entitled, the remaining funds available for distribution will be used to pay interest, principal and loss reimbursement amounts (other than certain Trust Advisor expenses) on the Class E, F and G Certificates sequentially in that order in a manner analogous to the Class D Certificates. | ||
THE INFORMATION IN THIS STRUCTURAL AND COLLATERAL TERM SHEET IS NOT COMPLETE AND MAY BE AMENDED PRIOR TO THE TIME OF SALE. THIS TERM SHEET IS NOT AN OFFER TO SELL THESE SECURITIES AND IT IS NOT A SOLICITATION OF AN OFFER TO BUY THESE SECURITIES IN ANY JURISDICTION WHERE THE OFFER OR SALE IS NOT PERMITTED.
17
| WFRBS Commercial Mortgage Trust 2014-C23 | Certain Terms and Conditions |
| Allocations and Distributions on the Class A-S, B, C and PEX Certificates: | On the closing date, the upper-tier REMIC of the issuing entity will issue the Class A-S, Class B and Class C regular interests (each a “regular interest”) which will have outstanding principal balances on the closing date of $56,451,000, $44,691,000 and $35,281,000, respectively. The regular interests will be held in a grantor trust for the benefit of the holders of the Class A-S, B, C and PEX Certificates. The Class A-S, B, C and PEX Certificates will, at all times, represent undivided beneficial ownership interests in a grantor trust that will hold those regular interests. Each class of the Class A-S, B and C Certificates will, at all times, represent an undivided beneficial ownership interest in a percentage of the outstanding principal balance of the regular interest with the same alphabetical class designation. The Class PEX Certificates will, at all times, represent an undivided beneficial ownership interest in the remaining percentages of the outstanding principal balances of the Class A-S, B and C regular interests and which percentage interests are referred to in this Term Sheet as the “Class PEX Component A-S, Class PEX Component B and Class PEX Component C” (collectively, the “Class PEX Components”). Interest, principal, prepayment premiums, yield maintenance charges and voting rights that are allocated to the Class A-S, B or C regular interest will be distributed or allocated, as applicable, as between the Class A-S, B or C Certificates, as applicable, on the one hand, and Class PEX Component A-S, Class PEX Component B or Class PEX Component C, as applicable (and correspondingly, the Class PEX Certificates), on the other hand, pro rata, based on their respective percentage interests in the Class A-S, Class B or Class C regular interest, as applicable. In addition, any losses (including, without limitation, as a result of Trust Advisor expenses) that are allocated to the Class A-S, Class B or Class C regular interest will correspondingly be allocated as between the Class A-S, B or C Certificates, as applicable, on the one hand, and Class PEX Component A-S, Class PEX Component B or Class PEX Component C, as applicable (and correspondingly, the Class PEX Certificates), on the other hand, pro rata, based on their respective percentage interests in the Class A-S, Class B or Class C regular interest, as applicable. For a complete description of the allocations and distributions with respect to the Class A-S regular interest, the Class B regular interest and the Class C regular interest (and correspondingly the Class A-S, B, C and PEX Certificates and the Class PEX Component A-S, Class PEX Component B and Class PEX Component C), see “Description of the Offered Certificates” in the Free Writing Prospectus. See “Material Federal Income Tax Consequences” in the Free Writing Prospectus for a discussion of the tax treatment of the Exchangeable Certificates. | ||
Exchanging Certificates through Combination and Recombination: | If you own Class A-S, B and C Certificates, you will be able to exchange them for a proportionate interest in the Class PEX Certificates, and vice versa, as described in the Free Writing Prospectus. You can exchange your Exchangeable Certificates by notifying the Certificate Administrator. If Exchangeable Certificates are outstanding and held by certificateholders, those certificates will receive principal and interest that would otherwise have been payable on the same proportion of certificates exchanged therefor if those certificates were outstanding and held by certificateholders. Any such allocations of principal and interest between classes of Exchangeable Certificates will have no effect on the principal or interest entitlements of any other class of certificates. The Free Writing Prospectus describes the available combinations of Exchangeable Certificates eligible for exchange. | ||
| Allocation of Yield Maintenance and Prepayment Premiums: | If any yield maintenance charges and prepayment premiums are collected during any particular collection period with respect to any mortgage loan, then on the distribution date corresponding to that collection period, the certificate administrator will pay a portion of the yield maintenance charges and prepayment premiums (or, in the case of a designated NCB mortgage loan, 50% of the prepayment premium) (net of liquidation fees payable therefrom) in the following manner: (1) pro rata, between (x) the group (“YM Group A”) of the Class A-1, A-2, A-3, A-4, A-5, A-SB and X-A Certificates and the Class A-S regular interest and (y) the group (“YM Group B” and, collectively with the YM Group A, the “YM Groups”) of Class B and C regular interests and the Class D and Class X-B Certificates, based upon the aggregate amount of principal distributed to the applicable classes of principal balance certificates (other than the Class A-S, B, C and PEX Certificates) and the Class A-S, B and C regular interests, as applicable, in each YM Group for that distribution date, and (2) among the classes of certificates and regular interest(s) in each YM Group, in the following manner, up to an amount equal to the product of (a) the yield maintenance or prepayment premium allocated to such YM Group, (b) the related Base Interest Fraction (as defined in the Free Writing Prospectus), and (c) a fraction, which in no event may be greater than 1.0, the numerator of which is equal to the amount of principal distributed to the holder(s) of such class or regular interest for that distribution date, and the denominator of which is the aggregate amount of principal distributed to all the certificates and the regular interests in that YM Group for that distribution date. Any yield maintenance charges or prepayment premium allocated to such YM Group remaining after such distributions to Principal Balance Certificates or regular interest(s) described above will be distributed to the Class X-A or Class X-B Certificates as applicable, in such YM Group. | ||
THE INFORMATION IN THIS STRUCTURAL AND COLLATERAL TERM SHEET IS NOT COMPLETE AND MAY BE AMENDED PRIOR TO THE TIME OF SALE. THIS TERM SHEET IS NOT AN OFFER TO SELL THESE SECURITIES AND IT IS NOT A SOLICITATION OF AN OFFER TO BUY THESE SECURITIES IN ANY JURISDICTION WHERE THE OFFER OR SALE IS NOT PERMITTED.
18
| WFRBS Commercial Mortgage Trust 2014-C23 | Certain Terms and Conditions |
| The Class X-Y Certificates will be entitled to receive 50% of any prepayment premium received in connection with any designated NCB mortgage loan. No prepayment premiums or yield maintenance charges will be distributed to the holders of the Class X-C, X-D, X-E, E, F, G or R Certificates. The holders of the Class X-B Certificates will be entitled to receive all yield maintenance charges and prepayment premiums after the Class A-1, A-2, A-3, A-4, A-5, X-A, A-SB and D Certificates and the Class A-S, B and C regular interests (and, therefore, the Class A-S, B, C and PEX Certificates) have been retired. For a description of when prepayment premiums and yield maintenance charges are generally required on the mortgage loans, see Annex A to the Free Writing Prospectus. See also “Risk Factors—The Timing of Prepayments and Repurchases and Other Liquidations May Change Your Anticipated Yield” in the prospectus attached to the Free Writing Prospectus. Prepayment premiums and yield maintenance charges will be distributed on each Distribution Date only to the extent they are actually received on the mortgage loans as of the related Determination Date. | ||
| Realized Losses: | The Certificate Principal Balances of the Class A-1, A-2, A-3, A-4, A-5, A-SB, D, E, F and G Certificates, and the Class A-S, B and C regular interests will be reduced without distribution on any Distribution Date as a write-off to the extent of any losses realized on the mortgage loans allocated to such Class or regular interest on such Distribution Date. Such losses (other than certain Trust Advisor expenses) will be applied in the following order, in each case until the related Certificate Principal Balance is reduced to zero: first, to Class G; second, to Class F; third, to Class E; fourth, to Class D; fifth, to the Class C regular interest; sixth, to the Class B regular interest; seventh, to the Class A-S regular interest; and, finally, pro rata, to Classes A-1, A-2, A-3, A-4, A-5 and A-SB based on their outstanding Certificate Principal Balances. Certain Trust Advisor expenses (if not absorbed by reductions of interest entitlements on the Class E and D Certificates and the Class C and B regular interests) will be applied as write-offs in a similar manner, except that such write-offs will be applied only to the Class E and D Certificates, the Class C, B and A-S regular interests, and the Class A-1, A-2, A-3, A-4, A-5 and A-SB Certificates (with any write-offs on the Class A-1, A-2, A-3, A-4, A-5 and A-SB Certificates to be allocated pro rata according to their respective Certificate Principal Balances immediately prior to that Distribution Date), in that order. Any realized losses allocated to the Class A-S, B and C regular interests will, in turn, be allocated to the Class A-S, B, C and PEX Certificates as described above in “Allocations and Distributions on the Class A-S, B, C and PEX Certificates”. The notional amount of the Class X-A Certificates will be reduced by the amount of all losses that are allocated to the Class A-1, A-2, A-3, A-4, A-5 or A-SB Certificates or the Class A-S regular interest as write-offs in reduction of their Certificate Principal Balances. The notional amount of the Class X-B Certificates will be reduced by the amount of all losses that are allocated to the Class B and C regular interests and the Class D Certificates as write-offs in reduction of their Certificate Principal Balances. The notional amount of the Class X-C Certificates will be reduced by the amount of all losses that are allocated to the Class E Certificates as write-offs in reduction of its Certificate Principal Balance. The notional amount of the Class X-D Certificates will be reduced by the amount of all losses that are allocated to the Class F Certificates as write-offs in reduction of its Certificate Principal Balance. The notional amount of the Class X-E Certificates will be reduced by the amount of all losses that are allocated to the Class G Certificates as write-offs in reduction of its Certificate Principal Balance. The notional amount of the Class X-Y Certificates will be reduced by the amount of all principal payments that are applied to reduce the principal balance of the designated NCB mortgage loans or by the amount of any other reductions in the principal balance of the designated NCB mortgage loans, including through default, a bankruptcy or other insolvency proceeding. | |
| Debt Service Advances: | The related Master Servicer or, if such Master Servicer fails to do so, the Trustee, will be obligated to advance delinquent debt service payments (other than balloon payments and default interest) and assumed debt service payments on the mortgage loans (including each pari passu mortgage loan but not its related pari passu companion loans), except to the extent any such advance is deemed non-recoverable from collections on the related mortgage loan. In addition, if an Appraisal Reduction Amount exists for a given mortgage loan, the interest portion of any debt service advance for such mortgage loan will be reduced, which will have the effect of reducing the amount of interest available for distribution to the Certificates in reverse alphabetical order of their Class designations (except that interest payments on the Class A-1, A-2, A-3, A-4, A-5, A-SB, X-A, X-B, X-C, X-D, X-E and X-Y Certificates would be affected on a pari passu basis). | |
| Servicing Advances: | The related Master Servicer or, if such Master Servicer fails to do so, the Trustee, will be obligated to make servicing advances with respect to each mortgage loan it services, including the payment of delinquent property taxes, insurance premiums and ground rent, except to the extent that those advances are deemed non-recoverable from collections on the related mortgage loan. The applicable master servicer under the WFRBS 2014-C22 securitization will have the primary obligation to make any servicing advances with respect to the Bank of America Plaza and Columbus Square Portfolio loan combinations. | |
THE INFORMATION IN THIS STRUCTURAL AND COLLATERAL TERM SHEET IS NOT COMPLETE AND MAY BE AMENDED PRIOR TO THE TIME OF SALE. THIS TERM SHEET IS NOT AN OFFER TO SELL THESE SECURITIES AND IT IS NOT A SOLICITATION OF AN OFFER TO BUY THESE SECURITIES IN ANY JURISDICTION WHERE THE OFFER OR SALE IS NOT PERMITTED.
19
| WFRBS Commercial Mortgage Trust 2014-C23 | Certain Terms and Conditions |
| Appraisal Reduction Amounts: | An Appraisal Reduction Amount generally will be created in the amount, if any, by which the principal balance of a required appraisal loan (which is a mortgage loan with respect to which certain defaults, modifications or insolvency events have occurred as further described in the Free Writing Prospectus) plus other amounts overdue or advanced in connection with such mortgage loan exceeds 90% of the appraised value of the related mortgaged property plus certain escrows and reserves (including letters of credit) held with respect to the mortgage loan. A mortgage loan will cease to be a required appraisal loan when the same has ceased to be a specially serviced mortgage loan (if applicable), has been brought current for at least three consecutive months and no other circumstances exist that would cause such mortgage loan to be a required appraisal loan. Appraisal Reduction Amounts will affect the amount of debt service advances on the related mortgage loan. Appraisal Reduction Amounts will also be taken into account in the determination of the identity of the Class whose majority constitutes the “majority subordinate certificateholder” and is entitled to appoint the subordinate class representative. | |
| Clean-Up Call and Exchange Termination: | On each Distribution Date occurring after the aggregate unpaid principal balance of the mortgage loans is reduced below 1% of the initial aggregate principal balance of the mortgage loans as of the Cut-off Date, certain specified persons will have the option to purchase all of the remaining mortgage loans (and the trust’s interest in all property acquired through exercise of remedies in respect of any mortgage loan) at the price specified in the Free Writing Prospectus. Exercise of the option will terminate the trust and retire the then-outstanding certificates. If the aggregate Certificate Principal Balances of each of the Class A-1, A-2, A-3, A-4, A-5, A-SB, PEX and D Certificates and the Class A-S, B and C regular interests have been reduced to zero, the trust may also be terminated in connection with an exchange of all the then-outstanding certificates, for the mortgage loans and REO properties then remaining in the issuing entity, but all of the holders of those Classes of outstanding certificates would have to voluntarily participate in the exchange. | |
| Liquidated Loan Waterfall: | Following the liquidation of any loan or property, the net liquidation proceeds generally will be applied (after reimbursement of advances and certain trust fund expenses), first, as a recovery of accrued interest, other than delinquent interest that was not advanced as a result of Appraisal Reduction Amounts, second, as a recovery of principal until all principal has been recovered, and then as a recovery of delinquent interest that was not advanced as a result of Appraisal Reduction Amounts. Please see “Description of the Offered Certificates—Distributions—Application of Mortgage Loan Collections” in the Free Writing Prospectus. | |
| Majority Subordinate Certificateholder and Subordinate Class Representative: | A subordinate class representative may be appointed by the “majority subordinate certificate-holder”, which will be the holder(s) of a majority of: (a) during a “subordinate control period”, the most subordinate class among the Class F and G Certificates that has a Certificate Principal Balance, as notionally reduced by any Appraisal Reduction Amounts allocable to that class, that is at least equal to 25% of its total initial principal balance and (b) during a “collective consultation period”, the most subordinate class among the Class F and G Certificates that has a total principal balance, without regard to Appraisal Reduction Amounts, that is at least equal to 25% of its initial Certificate Principal Balance. The majority subordinate certificateholder will have a continuing right to appoint, remove or replace the subordinate class representative in its sole discretion. This right may be exercised at any time and from time to time. See “The Pooling and Servicing Agreement—The Majority Subordinate Certificateholder and the Subordinate Class Representative” in the Free Writing Prospectus. | |
| Control and Consultation: | The rights of various parties to replace each Special Servicer and approve or consult with respect to major actions of each Special Servicer will vary according to defined periods. A “subordinate control period” will exist as long as the Class F Certificates have a Certificate Principal Balance, net of any Appraisal Reduction Amounts allocable to that class, that is not less than 25% of the initial principal balance of that class (unless a senior consultation period is deemed to occur generally or with respect to a particular mortgage loan, pursuant to clause (ii) of the definition of “senior consultation period”). In general, during a subordinate control period, (i) the subordinate class representative will be entitled to grant or withhold approval of asset status reports prepared, and material servicing actions proposed, by either Special Servicer, and (ii) the majority subordinate certificateholder, or the subordinate class representative on its behalf, will be entitled to terminate and replace each Special Servicer with or without cause, and appoint itself or another person as the applicable successor special servicer (other than with respect to the Bank of America Plaza and Columbus Square Portfolio loan combinations). It will be a condition to such appointment that Fitch, Moody’s and Morningstar confirm that the appointment would not result in a qualification, downgrade or withdrawal of any of their then-current ratings of certificates. A “collective consultation period” will exist as long as the Class F Certificates have a Certificate Principal Balance that both (i) as notionally reduced by any Appraisal Reduction Amounts allocable to that | |
THE INFORMATION IN THIS STRUCTURAL AND COLLATERAL TERM SHEET IS NOT COMPLETE AND MAY BE AMENDED PRIOR TO THE TIME OF SALE. THIS TERM SHEET IS NOT AN OFFER TO SELL THESE SECURITIES AND IT IS NOT A SOLICITATION OF AN OFFER TO BUY THESE SECURITIES IN ANY JURISDICTION WHERE THE OFFER OR SALE IS NOT PERMITTED.
20
| WFRBS Commercial Mortgage Trust 2014-C23 | Certain Terms and Conditions |
class, is less than 25% of its initial principal balance and (ii) without regard to any Appraisal Reduction Amounts allocable to that class, is 25% or more of its initial Certificate Principal Balance (unless a senior consultation period is deemed to occur generally or with respect to a particular mortgage loan, pursuant to clause (ii) of the definition of “senior consultation period”). In general, during a collective consultation period, each Special Servicer will be required to consult with the Trust Advisor (in addition to the subordinate class representative, during a collective consultation period) in connection with asset status reports and material special servicing actions. A “senior consultation period” will exist as long as either (i) the Class F certificates have an aggregate principal balance, without regard to any Appraisal Reduction Amounts allocable to that class, that is less than 25% of its initial principal balance or (ii) during such time as the Class F certificates are the most subordinate class of control-eligible certificates that have a then outstanding principal balance, net of Appraisal Reduction Amounts, at least equal to 25% of its initial principal balance, the then-majority subordinate certificateholder has irrevocably waived its right to appoint a subordinate class representative and to exercise any of the rights of the majority subordinate certificateholder or cause the exercise of the rights of the subordinate class representative and such rights have not been reinstated to a successor majority subordinate certificateholder as set forth in the pooling and servicing agreement. In general, during a senior consultation period, each Special Servicer must seek to consult with the Trust Advisor in connection with asset status reports and material special servicing actions, and, in general, no subordinate class representative will be recognized or have any right to terminate either Special Servicer or approve, direct or consult with respect to servicing matters. Furthermore, notwithstanding any contrary description set forth above, with respect to the Bank of America Plaza and Columbus Square Portfolio mortgage loans, in general the loan combinations will be serviced under the WFRBS 2014-C22 pooling and servicing agreement, which grants to a subordinate class representative control rights that include the right to approve or disapprove various material servicing actions involving the loan combination but the subordinate class representative for this securitization will nonetheless have the right to be consulted on a non-binding basis with respect to such actions. For purposes of the servicing of the Bank of America Plaza and Columbus Square Portfolio loan combinations, the occurrence and continuance of a collective consultation period or senior consultation period with respect to the subordinate class representative under this securitization will not limit the control or other rights of the subordinate class representative under the WFRBS 2014-C22 securitization, and any collective consultation period or senior consultation period or similar period under the WFRBS 2014-C22 securitization will not limit the consultation rights of the subordinate class representative under this securitization. In general, loan combination control rights also include the right, in certain circumstances, to direct the replacement of the applicable special servicer for the related loan combination only. | ||
| Replacement of Special Servicer by General Vote of Certificateholders: | During any “collective consultation period” or “senior consultation period”, each Special Servicer may be terminated and replaced upon the affirmative direction of certificate owners holding not less than 75% of the appraisal-reduced voting rights of all certificates, following a proposal from certificate owners holding not less than 25% of the appraisal-reduced voting rights of all certificates. The certificateholders who initiate a vote on a termination and replacement of either Special Servicer without cause must cause Fitch, Moody’s and Morningstar to confirm the then-current ratings of the certificates (or decline to review the matter) and cause the payment of the fees and expenses incurred in the replacement. | |
THE INFORMATION IN THIS STRUCTURAL AND COLLATERAL TERM SHEET IS NOT COMPLETE AND MAY BE AMENDED PRIOR TO THE TIME OF SALE. THIS TERM SHEET IS NOT AN OFFER TO SELL THESE SECURITIES AND IT IS NOT A SOLICITATION OF AN OFFER TO BUY THESE SECURITIES IN ANY JURISDICTION WHERE THE OFFER OR SALE IS NOT PERMITTED.
21
| WFRBS Commercial Mortgage Trust 2014-C23 | Certain Terms and Conditions |
| Appraisal Remedy: | Solely for purposes of determining whether a “subordinate control period” is in effect, whenever either Special Servicer obtains an appraisal or updated appraisal under the pooling and servicing agreement, the subordinate class representative, with respect to the mortgage loans (other than, the Bank of America Plaza and Columbus Square Portfolio mortgage loans) serviced by either Special Servicer will have the right (at its or their expense) to direct such Special Servicer to hire a qualified appraiser to prepare a second appraisal of the mortgaged property. The applicable Special Servicer must thereafter determine whether, based on its assessment of such second appraisal, any recalculation of the Appraisal Reduction Amount is warranted. The Appraisal Reduction Amount, whether based on the first or the second appraisal, will become effective following the second appraisal, except that the Appraisal Reduction Amount based on the first appraisal shall become effective if the subordinate class representative declines to demand a second appraisal within a specified number of business days, or if a second appraisal is not received within 90 days after the direction of the subordinate class representative. In addition, for the same purposes, if there is a material change in the mortgaged property securing any mortgage loan for which an Appraisal Reduction Amount has been calculated, the majority certificateholder of the Class F or G Certificates or other designed certificateholders will be entitled (at its expense) to present an additional appraisal to such Special Servicer, which will generally be required to recalculate the Appraisal Reduction Amount based upon such additional appraisal. This latter right may not be exercised more frequently than once in any 12-month period for each mortgage loan for which an Appraisal Reduction Amount was calculated and can only be exercised during a subordinate control period or a collective consultation period as further described in the Free Writing Prospectus. | |
| Sale of Defaulted Assets: | There will be no “fair value” purchase option. Instead, the pooling and servicing agreement will authorize each Special Servicer to sell defaulted mortgage loans serviced by such Special Servicer to the highest bidder in a manner generally similar to sales of REO properties. Subject to certain limitations set forth in the related intercreditor agreement, the loan combination serviced under the WFRBS 2014-C23 pooling and servicing agreement may be sold only if that mortgage loan and the related pari passu companion loans are sold together as one whole loan. The sale of a defaulted loan (other than a non-serviced mortgage loan) for less than par plus accrued interest and certain other fees and expenses owed on the loan will be subject to consent or consultation rights of the subordinate class representative and/or Trust Advisor and, in the case of the Bank of America Plaza mortgage loan and the Columbus Square Portfolio mortgage loan, consultation rights of the holders of the related pari passu companion loans, as described in the Free Writing Prospectus. In the case of the Bank of America Plaza mortgage loan, pursuant to the applicable intercreditor agreement and the WFRBS 2014-C22 pooling and servicing agreement, the WFRBS 2014-C22 special servicer may offer to sell to any person (or may offer to purchase) for cash such loan combination during such time as such loan combination constitutes a defaulted mortgage loan, and, in connection with any such sale, the WFRBS 2014-C22 special servicer is required to sell both the pari passu mortgage loan and related pari passu companion loans in any such loan combination as a whole loan. The subordinate class representative will have consultation rights as the holder of an interest in the related pari passu mortgage loan, as described in the Free Writing Prospectus. In the case of the Columbus Square Portfolio mortgage loan, pursuant to the applicable intercreditor agreement and the WFRBS 2014-C22 pooling and servicing agreement, the WFRBS 2014-C22 special servicer may offer to sell to any person (or may offer to purchase) for cash such loan combination during such time as such loan combination constitutes a defaulted mortgage loan, and, in connection with any such sale, the WFRBS 2014-C22 special servicer is required to sell both the pari passu mortgage loan and related pari passu companion loans in any such loan combination as a whole loan. The subordinate class representative will have consultation rights as the holder of an interest in the related pari passu mortgage loan, as described in the Free Writing Prospectus. | |
| “As-Is” Appraisals: | Appraisals must be conducted on an “as-is” basis, and must be no more than 9 months old, for purposes of determining Appraisal Reduction Amounts, market value in connection with REO sales, etc. Required appraisals may consist of updates of prior appraisals. Internal valuations by the applicable Special Servicer are permitted if the principal balance of a mortgage loan is less than $2,000,000. | |
| Trust Advisor: | The Trust Advisor will perform certain review duties that will generally include a limited annual review of and report regarding each Special Servicer to the Certificate Administrator. The review and report generally will be based on: (a) during a collective consultation period or senior consultation period, any asset status reports and additional information delivered to the Trust Advisor by either Special Servicer with respect to any mortgage loan serviced by such Special Servicer, and/or (b) during a senior consultation period, in addition to the applicable information described above, a meeting with each Special Servicer to conduct a limited review of such Special | |
THE INFORMATION IN THIS STRUCTURAL AND COLLATERAL TERM SHEET IS NOT COMPLETE AND MAY BE AMENDED PRIOR TO THE TIME OF SALE. THIS TERM SHEET IS NOT AN OFFER TO SELL THESE SECURITIES AND IT IS NOT A SOLICITATION OF AN OFFER TO BUY THESE SECURITIES IN ANY JURISDICTION WHERE THE OFFER OR SALE IS NOT PERMITTED.
22
| WFRBS Commercial Mortgage Trust 2014-C23 | Certain Terms and Conditions |
Servicer’s operational practices on a platform basis in light of the servicing standard. In addition, during any collective consultation period or senior consultation period, each Special Servicer must seek to consult with the Trust Advisor (in addition to the subordinate class representative during a collective consultation period) in connection with material special servicing actions with respect to specially serviced mortgage loans serviced by such Special Servicer. Furthermore, under certain circumstances, but only during a senior consultation period, the Trust Advisor may recommend the replacement of either Special Servicer, in which case the Certificate Administrator will deliver notice of such recommendation to the certificateholders, and certificateholders with specified percentages of the voting rights may direct the replacement of such Special Servicer at their expense. Notwithstanding any contrary provision described above, the Trust Advisor will have no rights or duties in connection with the Bank of America Plaza and Columbus Square Portfolio mortgage loans. The Trust Advisor may be removed and replaced without cause upon the affirmative direction of certificates owners holding not less than 75% of the appraisal-reduced voting rights of all certificates, following a proposal from certificate owners holding not less than 25% of the appraisal-reduced voting rights of all certificates. The certificateholders who initiate a vote on a termination and replacement of the Trust Advisor without cause must cause Fitch, Moody’s and Morningstar to confirm the then-current ratings of the certificates (or decline to review the matter) and cause the payment of the fees and expenses incurred in the replacement. During any “subordinate control period”, the proposed replacement trust advisor will be subject to the subordinate class representative’s consent (such consent not to be unreasonably withheld). If a proposed termination and replacement of the Trust Advisor is not consummated within 180 days following the initial request of the certificateholders who requested a vote, the proposed termination and replacement shall have no further force or effect. The Trust Advisor generally may be discharged from its duties if and when the Class A-1, A-2, A-3, A-4, A-5, A-SB, A-S, B, C, PEX, D and E Certificates are retired. | ||
| Certain Fee Offsets: | If a workout fee is earned by either Special Servicer following a loan default with respect to any mortgage loan that it services, then certain limitations will apply to the collection and retention of a modification fee from the borrower. The modification fee generally must not exceed 1% of the principal balance of the loan as modified. In addition, if the loan re-defaults within a specified period of months and other conditions are satisfied, any subsequent workout or liquidation fee on that loan must be reduced by a portion of the previously-collected modification fee. Furthermore, workout fees, liquidation fees and modification fees collected with respect to any workout, liquidation and/or partial liquidation of a mortgage loan or loan combination that is serviced by a Special Servicer will be subject to an aggregate cap equal to the greater of (i) $1,000,000 and (ii) 1.00% of the stated principal balance of the subject mortgage loan or loan combination. | |
| Deal Website: | The Certificate Administrator will be required to maintain a deal website which will include, among other items: (a) summaries of asset status reports prepared by each Special Servicer, (b) inspection reports, (c) appraisals, (d) various “special notices” described in the Free Writing Prospectus, (e) the “Investor Q&A Forum” and (f) a voluntary “Investor Registry”. Investors may access the deal website following execution of a certification and confidentiality agreement. | |
| Initial Majority Subordinate Certificateholder: | It is expected that affiliates of Raith Capital Management, LLC and AllianceBernstein L.P. will be the initial majority subordinate certificateholders. | |
| Loan Combinations: | Each of the mortgaged properties identified on Annex A to the Free Writing Prospectus as Bank of America Plaza, Crossings at Corona and Columbus Square Portfolio secure both a mortgage loan to be included in the trust fund and one or more other mortgage loans that will not be included in the trust fund, which will be pari passu in right of payment with the trust mortgage loan. With respect to each group of mortgage loans that we refer to as a “loan combination”, the Crossings at Corona loan combination will be principally serviced under the pooling and servicing agreement. The Bank of America Plaza and Columbus Square Portfolio loan combinations will be serviced under the WFRBS 2014-C22 pooling and servicing agreement. | |
THE INFORMATION IN THIS STRUCTURAL AND COLLATERAL TERM SHEET IS NOT COMPLETE AND MAY BE AMENDED PRIOR TO THE TIME OF SALE. THIS TERM SHEET IS NOT AN OFFER TO SELL THESE SECURITIES AND IT IS NOT A SOLICITATION OF AN OFFER TO BUY THESE SECURITIES IN ANY JURISDICTION WHERE THE OFFER OR SALE IS NOT PERMITTED.
23
(THIS PAGE INTENTIONALLY LEFT BLANK)
24
| BANK OF AMERICA PLAZA |
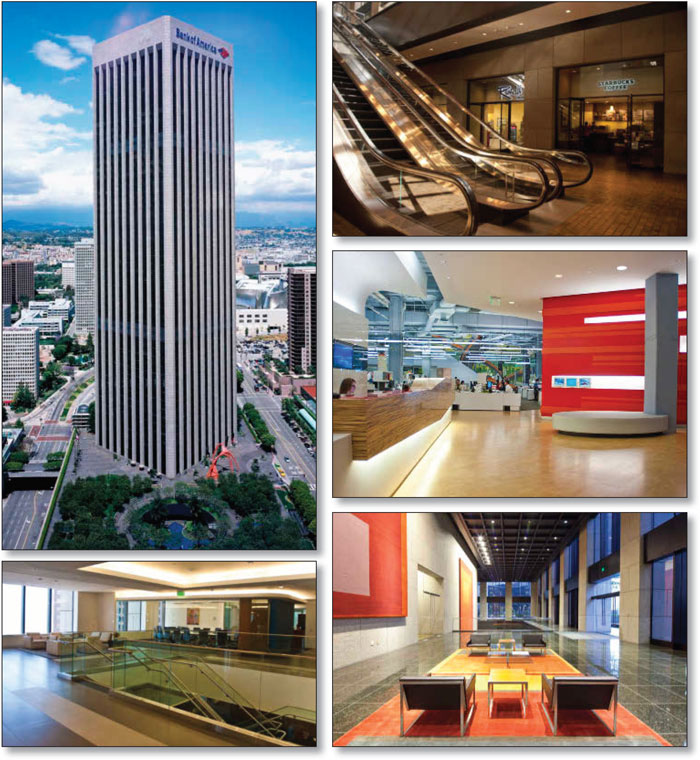
THE INFORMATION IN THIS STRUCTURAL AND COLLATERAL TERM SHEET IS NOT COMPLETE AND MAY BE AMENDED PRIOR TO THE TIME OF SALE. THIS TERM SHEET IS NOT AN OFFER TO SELL THESE SECURITIES AND IT IS NOT A SOLICITATION OF AN OFFER TO BUY THESE SECURITIES IN ANY JURISDICTION WHERE THE OFFER OR SALE IS NOT PERMITTED.
25
| BANK OF AMERICA PLAZA |
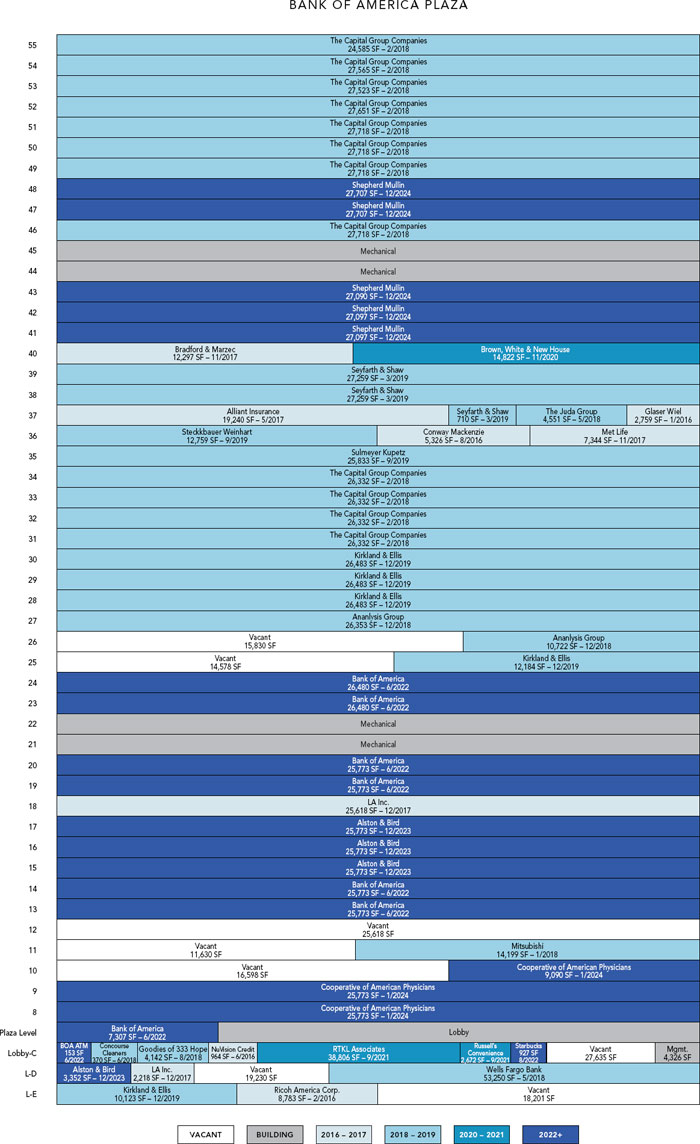
THE INFORMATION IN THIS STRUCTURAL AND COLLATERAL TERM SHEET IS NOT COMPLETE AND MAY BE AMENDED PRIOR TO THE TIME OF SALE. THIS TERM SHEET IS NOT AN OFFER TO SELL THESE SECURITIES AND IT IS NOT A SOLICITATION OF AN OFFER TO BUY THESE SECURITIES IN ANY JURISDICTION WHERE THE OFFER OR SALE IS NOT PERMITTED.
26
| BANK OF AMERICA PLAZA |
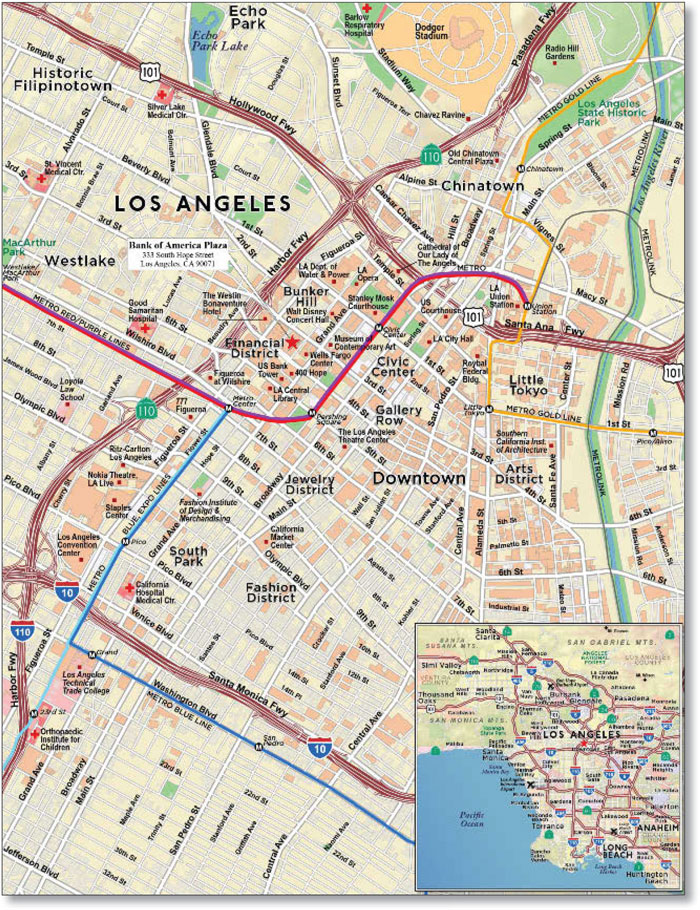
THE INFORMATION IN THIS STRUCTURAL AND COLLATERAL TERM SHEET IS NOT COMPLETE AND MAY BE AMENDED PRIOR TO THE TIME OF SALE. THIS TERM SHEET IS NOT AN OFFER TO SELL THESE SECURITIES AND IT IS NOT A SOLICITATION OF AN OFFER TO BUY THESE SECURITIES IN ANY JURISDICTION WHERE THE OFFER OR SALE IS NOT PERMITTED.
27
| No. 1 - Bank of America Plaza | ||||||||
| Loan Information | Property Information | |||||||
| Mortgage Loan Seller: | Wells Fargo Bank, National Association | Single Asset/Portfolio: | Single Asset | |||||
| Credit Assessment (Fitch/Moody’s/Morningstar): | NR/NR/NR | Property Type: | Office | |||||
Original Principal Balance(1): | $116,670,000 | Specific Property Type: | CBD | |||||
Cut-off Date Principal Balance(1): | $116,670,000 | Location: | Los Angeles, CA | |||||
| % of Initial Pool Balance: | 12.4% | Size: | 1,432,285 SF | |||||
| Loan Purpose: | Refinance | Cut-off Date Principal Balance Per SF(1): | $279.27 | |||||
| Borrower Names: | 333 South Hope Co. LLC; 333 South Hope Plant LLC | Year Built/Renovated: | 1974/2009 | |||||
| Sponsor: | Brookfield Office Properties Inc. | Title Vesting: | Fee | |||||
| Mortgage Rate: | 4.050% | Property Manager: | Self-managed | |||||
| Note Date: | August 7, 2014 | 3rd Most Recent Occupancy (As of): | 95.0% (12/31/2011) | |||||
| Anticipated Repayment Date: | NAP | 2nd Most Recent Occupancy (As of): | 93.0% (12/31/2012) | |||||
| Maturity Date: | September 1, 2024 | Most Recent Occupancy (As of): | 92.0% (12/31/2013) | |||||
| IO Period: | 120 months | Current Occupancy (As of): | 89.5% (8/19/2014) | |||||
| Loan Term (Original): | 120 months | |||||||
| Seasoning: | 0 months | Underwriting and Financial Information: | ||||||
| Amortization Term (Original): | NAP | |||||||
| Loan Amortization Type: | Interest-only, Balloon | 3rd Most Recent NOI (As of): | $29,607,501 (12/31/2012) | |||||
| Interest Accrual Method: | Actual/360 | 2nd Most Recent NOI (As of): | $28,864,479 (12/31/2013) | |||||
| Call Protection: | L(24),D(89),O(7) | Most Recent NOI (As of)(4): | $33,167,204 (TTM 6/30/2014) | |||||
| Lockbox Type: | Hard/Springing Cash Management | |||||||
Additional Debt(1)(2): | Yes | |||||||
Additional Debt Type(1)(2): | Pari Passu and Future Mezzanine | U/W Revenues: | $63,011,458 | |||||
| U/W Expenses: | $25,626,454 | |||||||
U/W NOI(4): | $37,385,004 | |||||||
Escrows and Reserves(3): | U/W NCF: | $34,233,977 | ||||||
U/W NOI DSCR(1): | 2.28x | |||||||
Type: | Initial | Monthly | Cap (If Any) | U/W NCF DSCR(1): | 2.08x | |||
| Taxes | $4,151,842 | $518,981 | NAP | U/W NOI Debt Yield(1): | 9.3% | |||
| Insurance | $0 | Springing | NAP | U/W NCF Debt Yield(1): | 8.6% | |||
| Replacement Reserves | $0 | $23,871 | NAP | As-Is Appraised Value: | $605,000,000 | |||
| TI/LC Reserve | $0 | Springing | NAP | As-Is Appraisal Valuation Date: | JJune 24, 2014 | |||
| Tenants Specific TI/LC Reserve | $2,991,870 | $0 | NAP | Cut-off Date LTV Ratio(1): | 66.1% | |||
| Tenants Specific Rent Concession Reserve | $520,213 | $0 | NAP | LTV Ratio at Maturity or ARD(1): | 66.1% | |||
| (1) | The Bank of America Plaza Loan Combination, totaling $400,000,000, is comprised of three pari passu notes. The non-controlling Note A-2 had an original principal balance of $116,670,000 has an outstanding principal balance as of the Cut-off Date of $116,670,000 and will be contributed to the WFRBS 2014-C23 Trust. The controlling Note A-1 had an original principal balance of $150,000,000 and is expected to be contributed to the WFRBS 2014-C22 trust and the non-controlling Note A-3 had an original principal balance of $133,330,000, has an outstanding principal balance as of the Cut-off Date of $133,330,000 and is expected to be contributed to a future trust. All statistical information related to balances per square foot, loan-to-value ratios, debt service coverage ratios and debt yields are based on the Bank of America Plaza Loan Combination. |
| (2) | See “Subordinate and Mezzanine Indebtedness” section. |
| (3) | See “Escrows” section. |
| (4) | See “Cash Flow Analysis” section. |
The Mortgage Loan. The mortgage loan (the “Bank of America Plaza Loan Combination”) is evidenced by three pari passu promissory notes (the A-1, A-2 and A-3 notes, respectively) secured by a first mortgage encumbering an office building located in Los Angeles, California (the “Bank of America Plaza Property”). The Bank of America Plaza Loan Combination was co-originated on August 7, 2014 by Wells Fargo Bank, National Association and Citigroup Global Markets Realty Corp. The Bank of America Plaza Loan Combination had an original principal balance of $400,000,000, has an outstanding principal balance as of the Cut-off Date of $400,000,000 and accrues interest at an interest rate of 4.050% per annum. The Bank of America Plaza Loan Combination had an initial term of 120 months, has a remaining term of 120 months as of the Cut-off Date and requires interest-only payments through the term of the Bank of America Plaza Loan Combination. The Bank of America Plaza Loan Combination matures on September 1, 2024. See “Description of the Mortgage Pool—Additional Indebtedness—The Loan Combinations—The Bank of America Plaza Loan Combination” and “The Pooling and Servicing Agreement—Servicing of the Loan Combinations” in the Free Writing Prospectus.
Note A-2, which represents a non-controlling interest in the Bank of America Plaza Loan Combination, will be contributed to the WFRBS 2014-C23 Trust, had an original principal balance of $116,670,000 and has an outstanding principal balance as of the Cut-off Date of $116,670,000. Note A-1, which had an original principal balance of $150,000,000, represents the controlling interest in the Bank of America Plaza Loan Combination and is expected to be contributed to WFRBS 2014-C22 Trust. Note A-3, which had an
THE INFORMATION IN THIS STRUCTURAL AND COLLATERAL TERM SHEET IS NOT COMPLETE AND MAY BE AMENDED PRIOR TO THE TIME OF SALE. THIS TERM SHEET IS NOT AN OFFER TO SELL THESE SECURITIES AND IT IS NOT A SOLICITATION OF AN OFFER TO BUY THESE SECURITIES IN ANY JURISDICTION WHERE THE OFFER OR SALE IS NOT PERMITTED.
28
| BANK OF AMERICA PLAZA |
original principal balance of $133,330,000 and has an outstanding principal balance as of the Cut-off Date of $133,330,000 represents a non-controlling interest in the Bank of America Plaza Loan Combination and is expected to be contributed to a future trust. However, the lender provides no assurances that the note A-3 will not be split further. Collectively, Notes A-1 and A-3 are referenced herein as the “Bank of America Plaza Companion Loans”.
Following the lockout period, the borrowers have the right to defease the Bank of America Plaza Loan Combination in whole, or in part (see “Partial Release” section), on any date before March 1, 2024. In addition, the Bank of America Plaza Loan Combination is prepayable without penalty on or after March 1, 2024.
Sources and Uses
| Sources | Uses | |||||||
| Original loan combination amount | $400,000,000 | 100.0% | Loan payoff(1) | $212,736,296 | 53.2% | |||
| Reserves | 7,663,925 | 1.9 | ||||||
| Closing costs | 1,457,860 | 0.4 | ||||||
| Return of equity | 178,141,919 | 44.5 | ||||||
| Total Sources | $400,000,000 | 100.0% | Total Uses | $400,000,000 | 100.0% |
| (1) | The Bank of America Plaza Property was previously securitized in MSCM 2004-HQ4. Loan payoff represents a $168.7 million trust balance and $44.0 million of subordinate debt. |
The Property. The Bank of America Plaza Property is a 55-story, class A, LEED Gold certified office building containing 1,432,285 square feet located in Los Angeles, California. Situated on 4.2 acres, the Bank of America Plaza Property was originally constructed in 1974 and the office tower consists of 49 stories, the plaza level and four mechanical floors. Below the office tower is the concourse level which contains a 194-seat auditorium and retail space. The ground floor plaza features gardens, public art and three 24-foot waterfalls. The Bank of America Plaza Property contains nine levels of underground parking totaling 2,242 spaces, resulting in a parking ratio of 1.6 spaces per 1,000 square feet of net rentable area. Other building amenities include twenty-one escalators, a professional copy center, on-site auto repair and car wash, 24-hour building security and a web-based visitor management system. Two of the largest tenants, The Capital Group and Sheppard Mullin (together consisting of approximately 35.6% of the net rentable square footage and 39.8% of Annual U/W Base Rent) both operate their global headquarters from the Bank of America Plaza Property and have been in occupancy for 36 and 40 years, respectively. As of August 19, 2014, the Bank of America Plaza Property was 89.5% occupied by 31 tenants.
THE INFORMATION IN THIS STRUCTURAL AND COLLATERAL TERM SHEET IS NOT COMPLETE AND MAY BE AMENDED PRIOR TO THE TIME OF SALE. THIS TERM SHEET IS NOT AN OFFER TO SELL THESE SECURITIES AND IT IS NOT A SOLICITATION OF AN OFFER TO BUY THESE SECURITIES IN ANY JURISDICTION WHERE THE OFFER OR SALE IS NOT PERMITTED.
29
| BANK OF AMERICA PLAZA |
The following table presents certain information relating to the tenancy at the Bank of America Plaza Property:
Major Tenants
| Tenant Name | Credit Rating (Fitch/Moody’s/ S&P)(1) | Tenant NRSF | % of NRSF | Annual U/W Base Rent PSF(2) | Annual U/W Base Rent(2) | % of Total Annual U/W Base Rent | Lease Expiration Date |
| Major Tenants | |||||||
The Capital Group(3) | NR/NR/NR | 323,554 | 22.6% | $26.00 | $8,413,679 | 25.8% | 2/28/2018(4) |
Bank of America(5) | A/Baa2/A- | 163,512 | 11.4% | $29.31(6) | $4,793,001(6) | 14.7% | 6/30/2022(7)(8) |
Sheppard Mullin(9) | NR/NR/NR | 185,927 | 13.0% | $24.49 | $4,553,151 | 14.0% | 12/31/2024(10)(11) |
| Kirkland & Ellis | NR/NR/NR | 101,756 | 7.1% | $23.56 | $2,397,380 | 7.4% | 12/31/2019 |
| Alston & Bird | NR/NR/NR | 81,094 | 5.7% | $23.50 | $1,905,604(12) | 5.9% | 12/31/2023(13) |
| Seyfarth & Shaw | NR/NR/NR | 55,228 | 3.9% | $31.63 | $1,746,862 | 5.4% | 3/31/2019 |
| Total Major Tenants | 911,071 | 63.6% | $26.13 | $23,809,677 | 73.1% | ||
| Non-Major Tenants | 371,031 | 25.9% | $23.56 | $8,742,976 | 26.9% | ||
| Occupied Collateral Total | 1,282,102 | 89.5% | $25.39 | $32,552,653 | 100.0% | ||
| Vacant Space | 150,183 | 10.5% | |||||
| Collateral Total | 1,432,285 | 100.0% | |||||
| (1) | Certain ratings are those of the parent company whether or not the parent guarantees the lease. |
| (2) | Annual U/W Base Rent PSF and Annual U/W Base Rent include contractual rent increases through August 2015. |
| (3) | The Capital Group is a private asset management firm founded in 1931 with assets in excess of one trillion dollars. |
| (4) | The Capital Group has two, five-year renewal options with 19 months’ notice. |
| (5) | Bank of America is an international financial institution that serves individual customers, corporations and governments with a range of banking, investing, asset management and other financial and risk management products and services. |
| (6) | The Annual U/W Base Rent and Annual U/W Base Rent PSF for Bank of America represent the tenant’s average rent over their lease term. The tenant’s current in-place rent is $25.78 per square foot. |
| (7) | Bank of America has a one-time right to reduce its space by one full floor or 12,000 to 13,000 square feet of its highest or lowest contiguous floors upon providing notice on June 30, 2019 with 12-months’ notice. |
| (8) | Bank of America has two, five-year renewal options with 19-months’ notice. |
| (9) | Sheppard Mullin is a law firm that practices bankruptcy, corporate law, securities law, intellectual property, litigation, real estate, and tax and estate planning. |
| (10) | Sheppard Mullin may reduce its space by one full floor on December 31, 2019 with 12-months’ notice. |
| (11) | Sheppard Mullin has two, four-year renewal options with nine months’ notice. |
| (12) | Alston & Bird has a rent abatement period that expires in June 2015. An escrow was collected at closing for the remaining rent concessions. |
| (13) | Alston & Bird may terminate 25,773 square feet on June 30, 2018 with 12-months’ notice and a termination fee of $2,410,728. |
THE INFORMATION IN THIS STRUCTURAL AND COLLATERAL TERM SHEET IS NOT COMPLETE AND MAY BE AMENDED PRIOR TO THE TIME OF SALE. THIS TERM SHEET IS NOT AN OFFER TO SELL THESE SECURITIES AND IT IS NOT A SOLICITATION OF AN OFFER TO BUY THESE SECURITIES IN ANY JURISDICTION WHERE THE OFFER OR SALE IS NOT PERMITTED.
30
| BANK OF AMERICA PLAZA |
The following table presents certain information relating to the lease rollover schedule at the Bank of America Plaza Property:
Lease Expiration Schedule(1)(2)
Year Ending December 31, | No. of Leases Expiring | Expiring NRSF | % of Total NRSF | Cumulative Expiring NRSF | Cumulative % of Total NRSF | Annual U/W Base Rent | % of Annual U/W Base Rent | Annual U/W Base Rent PSF(3) | ||||||
| MTM | 7 | 6,439 | 0.4% | 6,439 | 0.4% | $117,609 | 0.4% | $18.27 | ||||||
| 2014 | 0 | 0 | 0.0% | 6,439 | 0.4% | $0 | 0.0% | $0.00 | ||||||
| 2015 | 0 | 0 | 0.0% | 6,439 | 0.4% | $0 | 0.0% | $0.00 | ||||||
| 2016 | 4 | 17,832 | 1.2% | 24,271 | 1.7% | $485,307 | 1.5% | $27.22 | ||||||
| 2017 | 6 | 76,462 | 5.3% | 100,733 | 7.0% | $1,883,542 | 5.8% | $24.63 | ||||||
| 2018 | 8 | 437,191 | 30.5% | 537,924 | 37.6% | $10,724,524 | 32.9% | $24.53 | ||||||
| 2019 | 8 | 195,576 | 13.7% | 733,500 | 51.2% | $5,080,457 | 15.6% | $25.98 | ||||||
| 2020 | 2 | 15,450 | 1.1% | 748,950 | 52.3% | $468,606 | 1.4% | $30.33 | ||||||
| 2021 | 4 | 41,478 | 2.9% | 790,428 | 55.2% | $1,073,697 | 3.3% | $25.89 | ||||||
| 2022 | 4 | 164,439 | 11.5% | 954,867 | 66.7% | $4,825,103 | 14.8% | $29.34 | ||||||
| 2023 | 2 | 80,671 | 5.6% | 1,035,538 | 72.3% | $1,900,528 | 5.8% | $23.56 | ||||||
| 2024 | 5 | 246,564 | 17.2% | 1,282,102 | 89.5% | $5,993,280 | 18.4% | $24.31 | ||||||
| Thereafter | 0 | 0 | 0.0% | 1,282,102 | 89.5% | $0 | 0.0% | $0.00 | ||||||
| Vacant | 0 | 150,183 | 10.5% | 1,432,285 | 100.0% | $0 | 0.0% | $0.00 | ||||||
| Total/Weighted Average | 50(4) | 1,432,285 | 100.0% | $32,552,653 | 100.0% | $25.39 |
| (1) | Information obtained from the underwritten rent roll. |
| (2) | Certain tenants may have lease termination options that are exercisable prior to the originally stated expiration date of the subject lease and that are not considered in the Lease Expiration Schedule. |
| (3) | Weighted Average Annual U/W Base Rent PSF excludes vacant space. |
| (4) | Multiple tenants operate under more than one lease. There are 31 tenants subject to 50 leases. |
The following table presents historical occupancy percentages at the Bank of America Plaza Property:
Historical Occupancy
12/31/2009(1) | 12/31/2010(1) | 12/31/2011(1) | 12/31/2012(1) | 12/31/2013(1) | 8/19/2014(2) | |||||
| 94.0% | 94.0% | 95.0% | 93.0% | 92.0% | 89.5% |
| (1) | Information obtained from the borrower. |
| (2) | Information obtained from the underwritten rent roll. |
The following table presents historical base rent per square foot at Bank of America Plaza Property:
Historical Average Base Rent (PSF)(1)
12/31/2011 | 12/31/2012 | 12/31/2013 | 6/30/2014 | |||
| $21.79 | $21.92 | $21.38 | $21.20 |
| (1) | Information obtained from borrower operating statements. The average base rent is based on the gross potential rent divided by the total square footage. |
THE INFORMATION IN THIS STRUCTURAL AND COLLATERAL TERM SHEET IS NOT COMPLETE AND MAY BE AMENDED PRIOR TO THE TIME OF SALE. THIS TERM SHEET IS NOT AN OFFER TO SELL THESE SECURITIES AND IT IS NOT A SOLICITATION OF AN OFFER TO BUY THESE SECURITIES IN ANY JURISDICTION WHERE THE OFFER OR SALE IS NOT PERMITTED.
31
| BANK OF AMERICA PLAZA |
Operating History and Underwritten Net Cash Flow. The following table presents certain information relating to the historical operating performance and the Underwritten Net Cash Flow at the Bank of America Plaza Property:
Cash Flow Analysis
| 2011 | 2012 | 2013 | TTM 6/30/2014 | U/W | U/W $ per SF | |||||||
| Base Rent | $31,216,203 | $31,394,104 | $30,617,785 | $30,371,257 | $32,552,653(1) | $22.73 | ||||||
| Grossed Up Vacant Space | 0 | 0 | 0 | 0 | 3,314,834 | 2.31 | ||||||
| Total Reimbursables | 19,248,665 | 19,957,742 | 20,928,986 | 22,426,286 | 22,516,480 | 15.72 | ||||||
| Parking Income | 6,991,844 | 7,363,885 | 7,985,629 | 8,010,994 | 8,010,994 | 5.59 | ||||||
| Other Income | 618,297 | 242,045 | 176,754 | 203,246 | 203,246 | 0.14 | ||||||
| Less Free Rent | (598,846) | (6,430,584) | (5,945,870) | (2,236,116) | 0(2) | 0.00 | ||||||
| Less Vacancy | 0 | 0 | 0 | 0 | (3,586,749)(3) | (2.50) | ||||||
| Effective Gross Income | $57,476,163 | $52,527,192 | $53,763,284 | $58,775,667 | $63,011,458 | $43.99 | ||||||
| Total Operating Expenses | $22,620,951 | $22,919,691 | $24,898,805 | $25,608,463 | $25,626,454 | $17.89 | ||||||
| Net Operating Income | $34,855,212 | $29,607,501 | $28,864,479 | $33,167,204 | $37,385,004 | $26.10 | ||||||
| TI/LC | 0 | 0 | 0 | 0 | 2,864,570 | 2.00 | ||||||
| Capital Expenditures | 0 | 0 | 0 | 0 | 286,457 | 0.20 | ||||||
| Net Cash Flow | $34,855,212 | $29,607,501 | $28,864,479 | $33,167,204 | $34,233,977 | $23.90 | ||||||
NOI DSCR(4) | 2.12x | 1.80x | 1.76x | 2.02x | 2.28x | |||||||
NCF DSCR(4) | 2.12x | 1.80x | 1.76x | 2.02x | 2.08x | |||||||
NOI DY(4) | 8.7% | 7.4% | 7.2% | 8.3% | 9.3% | |||||||
NCF DY(4) | 8.7% | 7.4% | 7.2% | 8.3% | 8.6% |
| (1) | The increase in the U/W Base Rent from the TTM 6/30/2014 is attributed to contractual rent increases through August 2015 ($1,567,800) and rent averaging for Bank of America, Wells Fargo and MetLife ($616,845). |
| (2) | The remaining free rent for Alston & Bird ($472,505) and Analysis Group ($47,708) expires in June 2015 and August 2015, respectively. A free rent escrow was collected at closing for all outstanding concessions. |
| (3) | The underwritten economic vacancy is 10.0%. The Bank of America Plaza Property was 89.5% physically occupied as of August 19, 2014. |
| (4) | DSCRs and debt yields are based on the Bank of America Plaza Loan Combination. |
Appraisal. As of the appraisal valuation date of June 24, 2014, the Bank of America Plaza Property had an “as-is” appraised value of $605,000,000.
Environmental Matters. According to a Phase I environmental site assessment dated July 7, 2014, a recognized environmental condition (“REC”) exists at the Bank of America Plaza Property. The REC is related to a 4,000 gallon underground storage tank (“UST”) used to store diesel for the back-up power system. No leaks or spills from the UST have been reported; however, based upon the age (40 years), the onsite UST is considered to be a REC. The UST system is equipped with a continuous automatic monitoring system, an automatic shutoff device and overfills alarm and a spill and overfill sump. An environmental consultant estimated that the potential remediation costs associated with the aforementioned REC could range from $30,000 to $100,000.
Market Overview and Competition. The Bank of America Plaza is situated along the entire block bounded by Hope Street and 4th Street to the south and east and 3rd Street and Flower Street to the north and west in the Bunker Hill District within the Los Angeles central business district. Downtown Los Angeles experienced significant investment over the past two decades from public and non-profit institutions and several public/private partnerships that have resulted in new developments including LA Live, Staples Center, an expanded Convention Center, the Cathedral, Disney Concert Hall and the Colburn School that have increased interest in downtown Los Angeles. The Bunker Hill neighborhood encompasses approximately 133 acres and comprises the northern section of the financial district. Marked by higher topography, Bunker Hill is located north of Fifth Street and east of Figueroa Street and the predominant land use consists of high rise office buildings. Other local attractions within Bunker Hill include the Museum of Contemporary Art and the Angel’s Flight Funicular. According to a third party market research report, the Bank of America Plaza Property is located within the Downtown Los Angeles submarket. As of the second quarter of 2014, the submarket had a total inventory of 77 class A office buildings comprising approximately 38.5 million square feet and the class A office submarket reported a vacancy rate of 15.4%. Based on the Bank of America Plaza Property’s historical occupancy and the direct comparable properties, the appraiser assumed a 10.0% vacancy and concluded to a market rent ranging between $22.00 per square foot and $25.00 per square foot, triple net for the Bank of America Plaza Property.
THE INFORMATION IN THIS STRUCTURAL AND COLLATERAL TERM SHEET IS NOT COMPLETE AND MAY BE AMENDED PRIOR TO THE TIME OF SALE. THIS TERM SHEET IS NOT AN OFFER TO SELL THESE SECURITIES AND IT IS NOT A SOLICITATION OF AN OFFER TO BUY THESE SECURITIES IN ANY JURISDICTION WHERE THE OFFER OR SALE IS NOT PERMITTED.
32
| BANK OF AMERICA PLAZA |
The following table presents certain information relating to comparable properties to the Bank of America Plaza Property:
Competitive Set(1)
Bank of America Plaza (Subject) | Figueroa at Wilshire | TCW Building | 801 Tower | Wells Fargo Tower North | Wells Fargo Tower South | Ernst & Young Plaza | |
| Location | Los Angeles, CA | Los Angeles, CA | Los Angeles, CA | Los Angeles, CA | Los Angeles, CA | Los Angeles, CA | Los Angeles, CA |
| Distance from Subject | -- | 1.5 miles | 0.9 miles | 1.6 miles | 1.2 miles | 1.2 miles | 1.6 miles |
| Property Type | Office | Office | Office | Office | Office | Office | Office |
| Year Built/Renovated | 1974/2009 | 1991 | 1991 | 1992 | 1982 | 1982 | 1985 |
| Stories | 55 | 52 | 35 | 25 | 54 | 45 | 41 |
| Total GLA | 1,432,285 SF | 1,038,971 SF | 685,402 SF | 458,149 SF | 1,404,714 SF | 1,109,326 SF | 916,756 SF |
| Total Occupancy | 90% | 87% | 99% | 88% | 84% | 83% | 87% |
| (1) | Information obtained from the appraisal. |
The Borrowers. The borrowers are 333 South Hope Co. LLC and 333 South Hope Plant LLC, which are single purpose entities with two independent directors. Legal counsel to the borrowers delivered a non-consolidation opinion in connection with the origination of the Bank of America Plaza Loan Combination. Brookfield DTLA Holdings LLC is the guarantor of certain nonrecourse carveouts under the Bank of America Plaza Loan Combination.
The Sponsor. The sponsor is Brookfield Office Properties Inc. (“Brookfield”). Brookfield is one of North America’s largest public real estate companies. Brookfield owns and manages a portfolio of 114 commercial properties in 16 cities and 20 development sites comprising over approximately 103 million square feet in markets that include New York, London (England), Toronto (Canada), Los Angeles and Washington, D.C.
Escrows. The loan documents provide for upfront reserves in the amount of $4,151,842 for taxes, $2,991,870 for tenant improvements and leasing commissions and $520,213 for rent concessions associated with the Alston & Bird space ($472,505) and Analysis Group space ($47,708). The loan documents provide for the guarantor to deliver a reserve guaranty of $3,785,317 in lieu of a cash deposit for tenant improvements and leasing commissions associated with the Bank of America and Alston & Bird space. If at any time (i) an event of default has occurred and is continuing; (ii) the Bank of America Plaza Loan Combination has been assumed; (iii) the sponsor owns less than 10.0% of the borrower or no longer controls the borrower; or (iv) the reserve guaranty is no longer in full force and effect, the borrowers will deposit with the lender an amount equal to $3,785,317 less any amounts that would have been required to be distributed to the borrowers during the Bank of America Plaza Loan Combination term.
The loan documents require monthly deposits of $518,981 for real estate taxes, $23,871 for replacement reserves and beginning on September 1, 2020, monthly deposits of $119,357 for tenant improvements and leasing commissions. The loan documents do not require monthly escrows for insurance provided (i) no event of default has occurred and is continuing; (ii) the insurance required to be maintained by the borrowers is maintained pursuant to one or more blanket insurance policies; and (iii) the borrowers provides the lender with timely proof of payment of insurance premiums.
Lockbox and Cash Management. The Bank of America Plaza Loan Combination requires a lender-controlled lockbox account, which is already in place, and that the borrowers direct tenants to pay their rents directly into such lockbox account. The loan documents also require that all rents received by the borrowers or the property manager be deposited into the lockbox account within three business days of receipt. Prior to the occurrence of a Trigger Period (as defined below), all funds on deposit in the lockbox account are distributed to the borrower. During a Trigger Period, all cash flow is swept to a lender controlled cash management account.
A “Trigger Period” will commence upon a Cash Trap Event Period (as defined below), a Capital Group Cash Trap Event Period (as defined below), or the exercise of the borrowers’ right to incur mezzanine financing (see “Subordinate and Mezzanine Indebtedness” below). A Trigger Period caused by a Cash Trap Event Period or a Capital Group Cash Trap Event Period will end when the related Cash Trap Event Period or Capital Group Cash Trap Event Period ends, as described below. A Trigger Period caused by the exercise of the borrower’s right to incur mezzanine financing will end upon the repayment in full of the Bank of America Plaza Loan Combination.
A “Cash Trap Event Period” will commence upon the earlier of (i) the occurrence and continuance of an event of default; or (ii) the net cash flow debt service coverage ratio is less than 1.30x at the end of any calendar quarter. A Cash Trap Event Period will be cured, with regard to clause (i), upon the cure of such event of default; and with regard to clause (ii), (a) upon the net cash flow debt service coverage ratio being equal to or greater than 1.30x for two consecutive calendar quarters; or (b) the payment of funds by the borrower into a reserve account or, in lieu of posting funds into a reserve account, posting a letter of credit that will be held as additional security during the loan term, which, if applied to reduce the outstanding principal balance of the loan, the debt service coverage ratio would be equal to or greater than 1.30x.
THE INFORMATION IN THIS STRUCTURAL AND COLLATERAL TERM SHEET IS NOT COMPLETE AND MAY BE AMENDED PRIOR TO THE TIME OF SALE. THIS TERM SHEET IS NOT AN OFFER TO SELL THESE SECURITIES AND IT IS NOT A SOLICITATION OF AN OFFER TO BUY THESE SECURITIES IN ANY JURISDICTION WHERE THE OFFER OR SALE IS NOT PERMITTED.
33
| BANK OF AMERICA PLAZA |
A “Capital Group Cash Trap Event Period” will commence (i) July 30, 2016, in the event that The Capital Group does not renew all of its space under the current lease or (ii) upon the occurrence of any event after July 30, 2016 which would cause The Capital Group’s exercise of its renewal option to be ineffective, null or void. A Capital Group Cash Trap Event Period will end upon the earlier of (a) funds have been deposited into an account in an amount equal $8,088,850 (which may be reduced if and to the extent that the actual tenant improvement and leasing commission costs relating to a qualified replacement lease is less than $25.00 per square foot for the area leased pursuant to such qualified replacement lease); or (b) the net cash flow debt service coverage ratio is equal to or greater than 1.30x at the end of any calendar quarter and the entire space previously leased by The Capital Group has been leased to a replacement tenant (or relet to The Capital Group) for a lease term of no less than five years and such tenant is in occupancy and operating within the space.
Property Management. The Bank of America Plaza Property is managed by an affiliate of the borrowers.
Assumption. The borrowers have a two-time right to transfer the Bank of America Plaza Property provided that certain conditions are satisfied, including (i) no event of default has occurred and is continuing; (ii) the lender has reasonably determined that the proposed transferee and guarantor satisfy the lender’s credit review and underwriting standards, taking into consideration transferee experience, financial strength and general business standing; and (iii) the lender has received confirmation from Fitch, Moody’s and Morningstar that such assumption will not result in a downgrade, withdrawal or qualification of the respective ratings assigned to the Series 2014-C23 Certificates, and similar confirmations with respect to the ratings of any securities backed by the Bank of America Plaza Companion Loans.
Partial Release. The borrowers are permitted to release any air rights with respect to a land parcel and a portion of the concourse level immediately below the air rights (“Release Parcels”) from the lien of the Bank of America Plaza Loan Combination provided (i) no event of default has occurred and is continuing; (ii) any construction associated with the improvement of the Release Parcels will not interfere with any tenant or give rise to any right for any tenant to terminate its lease; (iii) the partial defeasance of 110.0% of the allocated loan amount associated with the Release Parcels, based on a current appraisal; (iv) the remaining portion of the Bank of America Plaza Property has a net cash flow debt yield not less than the net cash flow debt yield immediately prior to the release; and (v) the remaining portion of the Bank of America Plaza Property has a loan-to-value ratio that is equal to or less than the loan-to-value ratio immediately prior to the release.
Real Estate Substitution. Not permitted.
Subordinate and Mezzanine Indebtedness. The borrower has the right to incur mezzanine financing subject to the satisfaction of certain conditions including (i) the execution of an intercreditor agreement in form and substance acceptable to the lender and each of Fitch, Moody’s and Morningstar; (ii) the combined loan-to-value ratio is not greater than 66.0%; (iii) the combined debt service coverage ratio is not less than 2.10x; and (iv) receipt of rating agency confirmations from Fitch, Moody’s and Morningstar that the mezzanine financing will not result in a downgrade, withdrawal or qualification of the respective ratings assigned to the Series 2014-C23 Certificates and similar confirmations with respect to the ratings of any securities backed by the Bank of America Plaza Companion Loans.
Terrorism Insurance. The loan documents require that the “all risk” insurance policy required to be maintained by the borrowers provide coverage for terrorism in an amount equal to the full replacement cost of the Bank of America Plaza Property; provided, however, if TRIPRA is discontinued or not renewed, the borrowers will be required to carry terrorism coverage in an amount at least equal to the lesser of (i) the outstanding principal balance of the Bank of America Plaza Loan Combination or (ii) the sum of the business income insurance equal to 100% of the projected gross income from the Bank of America Plaza Property for a 12-month period from the date of casualty plus the full replacement cost. However, the borrowers shall not be required to spend on terrorism coverage more than two times the amount of the premium for property insurance required to insure against physical hazards and business interruption. The loan documents also require business interruption insurance covering no less than the 36-month period following the occurrence of a casualty event, together with a 12-month extended period of indemnity.
Earthquake Insurance: The loan documents do not require earthquake insurance. The seismic report indicated a probable maximum loss of 13%.
THE INFORMATION IN THIS STRUCTURAL AND COLLATERAL TERM SHEET IS NOT COMPLETE AND MAY BE AMENDED PRIOR TO THE TIME OF SALE. THIS TERM SHEET IS NOT AN OFFER TO SELL THESE SECURITIES AND IT IS NOT A SOLICITATION OF AN OFFER TO BUY THESE SECURITIES IN ANY JURISDICTION WHERE THE OFFER OR SALE IS NOT PERMITTED.
34
(THIS PAGE INTENTIONALLY LEFT BLANK)
35
(THIS PAGE INTENTIONALLY LEFT BLANK)
36
| CROSSINGS AT CORONA |
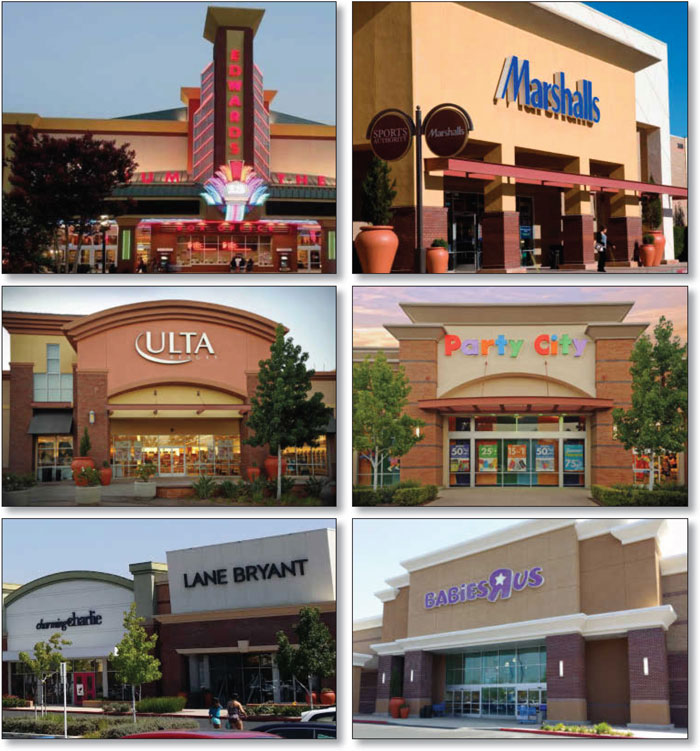
THE INFORMATION IN THIS STRUCTURAL AND COLLATERAL TERM SHEET IS NOT COMPLETE AND MAY BE AMENDED PRIOR TO THE TIME OF SALE. THIS TERM SHEET IS NOT AN OFFER TO SELL THESE SECURITIES AND IT IS NOT A SOLICITATION OF AN OFFER TO BUY THESE SECURITIES IN ANY JURISDICTION WHERE THE OFFER OR SALE IS NOT PERMITTED.
37
| CROSSINGS AT CORONA |
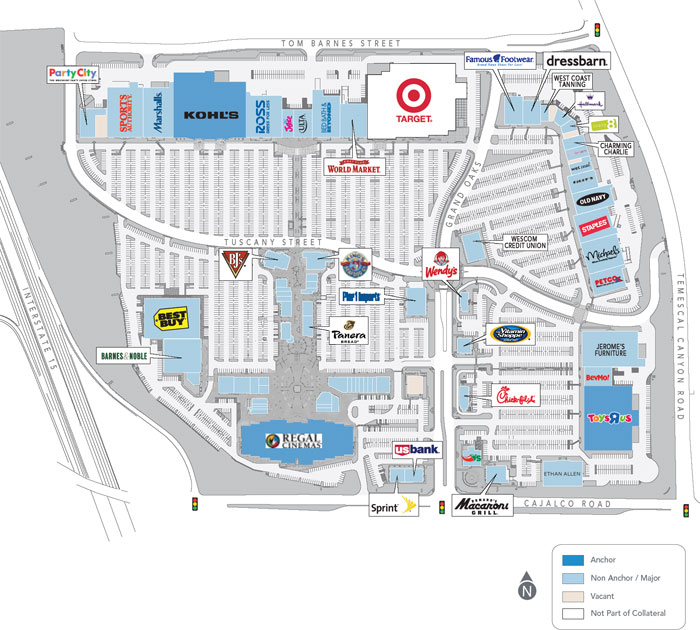
THE INFORMATION IN THIS STRUCTURAL AND COLLATERAL TERM SHEET IS NOT COMPLETE AND MAY BE AMENDED PRIOR TO THE TIME OF SALE. THIS TERM SHEET IS NOT AN OFFER TO SELL THESE SECURITIES AND IT IS NOT A SOLICITATION OF AN OFFER TO BUY THESE SECURITIES IN ANY JURISDICTION WHERE THE OFFER OR SALE IS NOT PERMITTED.
38
| CROSSINGS AT CORONA |
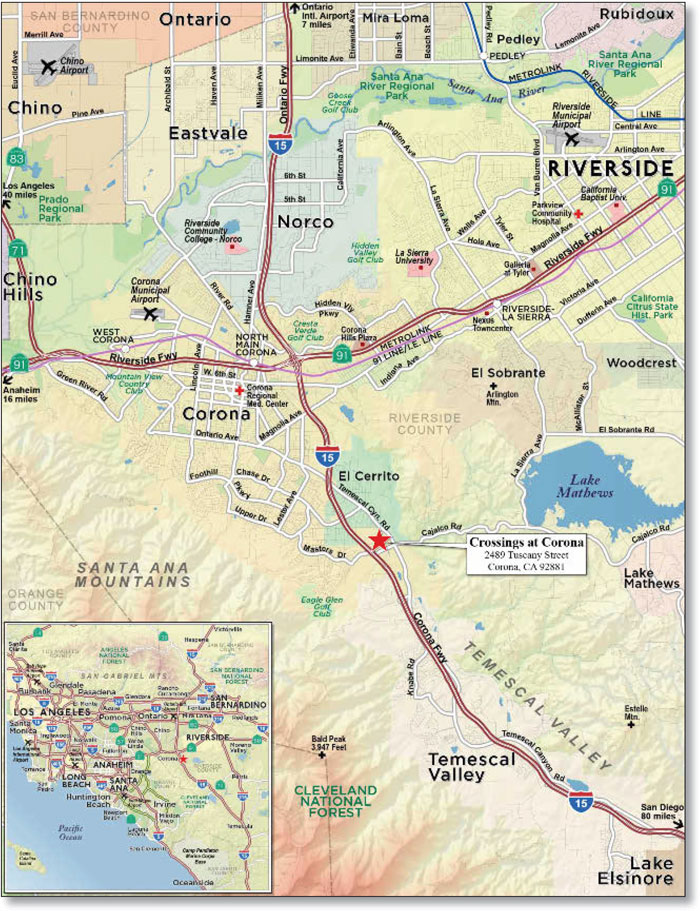
THE INFORMATION IN THIS STRUCTURAL AND COLLATERAL TERM SHEET IS NOT COMPLETE AND MAY BE AMENDED PRIOR TO THE TIME OF SALE. THIS TERM SHEET IS NOT AN OFFER TO SELL THESE SECURITIES AND IT IS NOT A SOLICITATION OF AN OFFER TO BUY THESE SECURITIES IN ANY JURISDICTION WHERE THE OFFER OR SALE IS NOT PERMITTED.
39
| No. 2 - Crossings at Corona | ||||||||
| Loan Information | Property Information | |||||||
| Mortgage Loan Seller: | Wells Fargo Bank, National Association | Single Asset/Portfolio: | Single Asset | |||||
| Credit Assessment (Fitch/Moody’s/Morningstar): | NR/NR/NR | Property Type: | Retail | |||||
Original Principal Balance(1): | $75,000,000 | Specific Property Type: | Anchored | |||||
Cut-off Date Principal Balance(1): | $75,000,000 | Location: | Corona, CA | |||||
| % of Initial Pool Balance: | 8.0% | Size: | 834,075 SF | |||||
| Loan Purpose: | Refinance | Cut-off Date Principal Balance Per SF(1): | $173.85 | |||||
| Borrower Name: | Castle & Cooke Corona Crossings, LLC | Year Built/Renovated(4): | Various/NAP | |||||
| Sponsors: | Various(2) | Title Vesting: | Fee | |||||
| Mortgage Rate: | 4.300% | Property Manager: | Self-managed | |||||
| Note Date: | September 11, 2014 | 3rd Most Recent Occupancy (As of): | 97.6% (12/31/2011) | |||||
| Anticipated Repayment Date: | NAP | 2nd Most Recent Occupancy (As of): | 97.3% (12/31/2012) | |||||
| Maturity Date: | September 11, 2024 | Most Recent Occupancy (As of): | 98.1% (12/31/2013) | |||||
| IO Period: | 36 months | Current Occupancy (As of)(5): | 96.9% (7/31/2014) | |||||
| Loan Term (Original): | 120 months | |||||||
| Seasoning: | 0 months | Underwriting and Financial Information: | ||||||
| Amortization Term (Original): | 360 months | |||||||
| Loan Amortization Type: | Interest-only, Amortizing Balloon | 3rd Most Recent NOI (As of): | $12,988,840 (12/31/2012) | |||||
| Interest Accrual Method: | Actual/360 | 2nd Most Recent NOI (As of): | $12,904,757 (12/31/2013) | |||||
| Call Protection: | L(24),D(89),O(7) | Most Recent NOI (As of): | $12,978,805 (TTM 6/30/2014) | |||||
| Lockbox Type: | Hard/Springing Cash Management | |||||||
Additional Debt(1): | Yes | |||||||
Additional Debt Type(1): | Pari Passu | U/W Revenues: | $18,045,605 | |||||
| U/W Expenses: | $6,112,113 | |||||||
Escrows and Reserves(3): | U/W NOI: | $11,933,492 | ||||||
| U/W NCF: | $10,906,369 | |||||||
Type: | Initial | Monthly | Cap (If Any) | U/W NOI DSCR(1): | 1.39x | |||
| Taxes | $2,117,050 | $229,672 | NAP | U/W NCF DSCR(1): | 1.27x | |||
| Insurance | $0 | Springing | NAP | U/W NOI Debt Yield(1): | 8.2% | |||
| Replacement Reserves | $0 | $15,291 | NAP | U/W NCF Debt Yield(1): | 7.5% | |||
| TI/LC Reserve | $0 | $69,506 | $850,000 | As-Is Appraised Value: | $222,000,000 | |||
| Earnout Reserve | $6,500,000 | $0 | NAP | As-Is Appraisal Valuation Date: | August 5, 2014 | |||
| Sports Authority Reserve | $172,830 | $0 | NAP | Cut-off Date LTV Ratio(1): | 65.3% | |||
| Outstanding TI/LC Reserve | $75,000 | $0 | NAP | LTV Ratio at Maturity or ARD(1): | 56.9% | |||
| (1) | The Crossings at Corona Loan Combination, totaling $145,000,000, is comprised of two pari passu notes (Notes A-1 and A-2). Note A-1, which represents the controlling interest in the Crossings at Corona Loan Combination, had an original principal balance of $75,000,000, has an outstanding principal balance of $75,000,000 as of the Cut-off Date and will be contributed to the WFRBS 2014-C23 Trust. The non-controlling Note A-2 had an original principal balance of $70,000,000 and is expected to be contributed to a future trust. All statistical information related to balances per square foot, loan-to-value ratios, debt service coverage ratios and debt yields are based on the Crossings at Corona Loan Combination. |
| (2) | See “The Sponsors” section. |
| (3) | See “Escrows” section. |
| (4) | The Crossings at Corona Property was constructed in phases from 2004 to 2007. |
| (5) | Current Occupancy includes Barnes & Noble (25,023 square feet; 3.0% of net rentable area), who was considered vacant for underwriting purposes. Barnes & Noble’s lease expires in January 2015 and is currently in its lease renewal notice period. Current Occupancy excluding Barnes & Noble is 93.9%. |
The Mortgage Loan. The mortgage loan (the “Crossings at Corona Loan Combination”) is evidenced by two pari passu promissory notes (Notes A-1 and A-2) secured by a first mortgage encumbering an anchored retail center located in Corona, California (the “Crossings at Corona Property”). The Crossings at Corona Loan Combination was originated on September 11, 2014 by Wells Fargo Bank, National Association. The Crossings at Corona Loan Combination had an original principal balance of $145,000,000, has an outstanding principal balance as of the Cut-off Date of $145,000,000 and accrues interest at an interest rate of 4.300% per annum. The Crossings at Corona Loan Combination had an initial term of 120 months, has a remaining term of 120 months as of the Cut-off Date and requires payments of interest-only for the first 36 payments following origination and, thereafter, requires payments of principal and interest based on a 30-year amortization schedule. The Crossings at Corona Loan Combination matures on September 11, 2024. See Description of the Mortgage Pool—Additional Indebtedness—The Loan Combinations—The Crossings at Corona Loan Combination” and “The Pooling and Servicing Agreement—Servicing of the Loan Combinations” in the Free Writing Prospectus.
Note A-1, which represents the controlling interest in the Crossings at Corona Loan Combination, will be contributed to the WFRBS 2014-C23 Trust, had an original principal balance of $75,000,000 and has an outstanding principal balance as of the Cut-off Date of $75,000,000. Note A-2 (the “Crossings at Corona Companion Loan”), which had an original principal balance of $70,000,000 and represents the non-controlling interest in the Crossings at Corona Loan Combination, will be contributed to a future trust. The lender provides no assurances that note A-2 will not be split further.
THE INFORMATION IN THIS STRUCTURAL AND COLLATERAL TERM SHEET IS NOT COMPLETE AND MAY BE AMENDED PRIOR TO THE TIME OF SALE. THIS TERM SHEET IS NOT AN OFFER TO SELL THESE SECURITIES AND IT IS NOT A SOLICITATION OF AN OFFER TO BUY THESE SECURITIES IN ANY JURISDICTION WHERE THE OFFER OR SALE IS NOT PERMITTED.
40
| CROSSINGS AT CORONA |
Following the lockout period, the borrower has the right to defease the Crossings at Corona Loan Combination in whole, but not in part, on any date before March 11, 2024. In addition, the Crossings at Corona Loan Combination is prepayable without penalty on or after March 11, 2024.
Sources and Uses
| Sources | Uses | |||||||
| Original loan combination amount | $145,000,000 | 95.7% | Loan payoff(1) | $141,943,815 | 93.7% | |||
| Sponsor’s new cash contribution | $6,505,377 | 4.3 | Reserves | 8,864,880 | 5.9 | |||
| Closing costs | 696,682 | 0.5 | ||||||
| Total Sources | $151,505,377 | 100.0% | Total Uses | $151,505,377 | 100.0% |
| (1) | Phases I and II of the Crossings at Corona Property were securitized in COMM 2004-LB4A; phase III was securitized in WBCMT 2005-C21; and phase IV debt was not securitized. |
The Property. The Crossings at Corona Property is an anchored retail power center located in Corona, California, approximately 50 miles southeast of Los Angeles, California. The Crossings at Corona Property contains 962,238 square feet of retail space, of which 834,075 square feet serve as collateral for the Crossings at Corona Loan Combination. The Crossings at Corona Property is situated on a 97.5-acre parcel of land and is anchored by Target (not part of collateral), Edwards Theatres (Regal), Kohl’s and Toys/Babies”R”Us. Other major tenants include Marshall’s, Ross Dress for Less, Best Buy, Michaels, Bed, Bath & Beyond, Old Navy, Petco and Cost Plus. The Crossings at Corona Property consists of 26 buildings, with anchor and in-line space along the north and east boundaries, and an entertainment-focused portion near the center portion, which includes the Edwards Theatres and various restaurants. The Crossings at Corona Property contains 6,370 parking spaces, resulting in a parking ratio of 6.6 spaces per 1,000 square feet of rentable area. As of December 2013, 19 tenants, representing approximately 204,271 square feet (24.5% of net rentable area) reporting at least three full prior years of comparable sales exhibited average trailing 12-month sales of $294 PSF with an average occupancy cost of 8.6% (excluding Edwards Theatres as their sales are based on a per screen basis). Comparable year-over-year sales increased 6.1% from 2011 to 2012, and 6.1% from 2012 to 2013.
The Crossings at Corona Property was constructed in four phases from 2004 through 2007. The Crossings at Corona Property has exhibited a stable operating history, with net operating income of at least $11.0 million since 2007 (trough 2008 NOI debt yield was 7.6%), and averaging approximately $12.4 million over the same time period (including the trailing-12 June 30, 2014 net operating income). Occupancy has been at least 90.3% since 2007, averaging 95.7% over the same time period (including the current July 31, 2014 occupancy). Further, investment-grade rated tenants lease approximately 28.7% of the net rentable area. A partial condemnation is possible in connection with the proposed widening of Cajalco Road, adjacent to the Crossings at Corona Property. No physical impact on any buildings at the Crossings at Corona Property is anticipated based on current design proposals. See “Description of the Mortgage Pool—Tenant or Other Third Party Issues—Other Matters” in the Free Writing Prospectus. As of July 31, 2014, the Crossings at Corona Property was 96.9% occupied by 67 tenants.
THE INFORMATION IN THIS STRUCTURAL AND COLLATERAL TERM SHEET IS NOT COMPLETE AND MAY BE AMENDED PRIOR TO THE TIME OF SALE. THIS TERM SHEET IS NOT AN OFFER TO SELL THESE SECURITIES AND IT IS NOT A SOLICITATION OF AN OFFER TO BUY THESE SECURITIES IN ANY JURISDICTION WHERE THE OFFER OR SALE IS NOT PERMITTED.
41
| CROSSINGS AT CORONA |
The following table presents certain information relating to the tenancy at the Crossings at Corona Property:
Major Tenants
| Tenant Name | Credit Rating (Fitch/Moody’s/ S&P)(1) | Tenant NRSF | % of NRSF | Annual U/W Base Rent PSF(2) | Annual U/W Base Rent(2) | % of Total Annual U/W Base Rent | Sales PSF(3) | Occupancy Cost(3) | Lease Expiration Date |
| Anchor Tenant – Not Part of Collateral | |||||||||
| Target | A-/A2/A | 128,163 | SHADOW ANCHOR – NOT PART OF THE COLLATERAL | ||||||
| Anchor Tenants | |||||||||
| Edwards Theatres (Regal) | B+/B1/B+ | 80,485 | 9.6% | $20.00 | $1,609,700 | 12.0% | $498,454(4) | 22.9%(4) | 11/30/2019(5) |
| Kohl’s | BBB+/Baa1/BBB+ | 87,050 | 10.4% | $12.05(6) | $1,048,920(6) | 7.8% | NAV | NAV | 1/31/2024(7) |
| Toys/Babies”R”Us | CCC-/Caa2/B- | 63,359 | 7.6% | $14.00(8) | $887,026(8) | 6.6% | NAV | NAV | 1/31/2019(9) |
| Total Anchor Tenants | 230,894 | 27.7% | $15.36 | $3,545,646 | 26.5% | ||||
| Major Tenants | |||||||||
| Sports Authority | NR/NR/NR | 37,633 | 4.5% | $13.25 | $498,637 | 3.7% | NAV | NAV | 1/31/2019 |
| Marshalls | NR/A3/A+ | 30,000 | 3.6% | $14.25 | $427,500 | 3.2% | $272 | 6.9% | 1/31/2019 |
| Ross | NR/NR/A- | 30,187 | 3.6% | $14.00 | $422,618 | 3.2% | $260 | 7.3% | 1/31/2020 |
| Best Buy | BB/Baa2/BB | 45,000 | 5.4% | $9.25 | $416,250 | 3.1% | NAV | NAV | 1/31/2019 |
| Michaels | NR/NR/B | 23,716 | 2.8% | $16.63 | $394,397 | 2.9% | NAV | NAV | 2/28/2019 |
| Total Major Tenants | 166,536 | 20.0% | $12.97 | $2,159,402 | 16.1% | ||||
| Non-Major Tenants | 385,450 | 46.2% | $19.93 | $7,683,228 | 57.4% | ||||
| Occupied Collateral Total | 782,880 | 93.9% | $17.10 | $13,388,276 | 100.0% | ||||
| Vacant Space | 51,195(10) | 6.1%(10) | |||||||
| Collateral Total | 834,075 | 100.0% | |||||||
| (1) | Certain ratings are those of the parent company whether or not the parent guarantees the lease. |
| (2) | Annual U/W Base Rent PSF and Annual U/W Base Rent include contractual rent steps through October 2015. |
| (3) | Sales and occupancy costs are based on the trailing 12-month period ending December 31, 2013 and Annual U/W Base Rent, respectively, unless otherwise noted. |
| (4) | Sales figures for Edwards Theatres (Regal) are the sales per screen (based on 18 screens). |
| (5) | Edwards Theatres (Regal) has three, 5-year lease renewal options and one, 4-year lease renewal option. |
| (6) | The Annual U/W Base Rent and Annual U/W Base Rent PSF for Kohl’s represent the tenant’s average rent over the lease term. The tenant’s current in-place rent is $11.69 per square foot. |
| (7) | Kohl’s has eight, 5-year lease renewal options. |
| (8) | The Annual U/W Base Rent and Annual U/W Base Rent PSF for Toys/Babies”R”Us are based on the market rent. The tenant’s current in-place rent is $22.09 per square foot, representing a mark to market adjustment of $512,324. |
| (9) | Toys/Babies”R”Us has five, 5-year lease renewal options. |
| (10) | Vacant Space includes Barnes & Noble (25,023 square feet; 3.0% of NRSF), who was considered vacant for underwriting purposes. Barnes & Noble’s lease expires in January 2015 and is currently in its lease renewal notice period. Occupancy including Barnes & Noble is 96.9%. |
THE INFORMATION IN THIS STRUCTURAL AND COLLATERAL TERM SHEET IS NOT COMPLETE AND MAY BE AMENDED PRIOR TO THE TIME OF SALE. THIS TERM SHEET IS NOT AN OFFER TO SELL THESE SECURITIES AND IT IS NOT A SOLICITATION OF AN OFFER TO BUY THESE SECURITIES IN ANY JURISDICTION WHERE THE OFFER OR SALE IS NOT PERMITTED.
42
| CROSSINGS AT CORONA |
The following table presents certain information relating to the historical sales and occupancy costs at the Crossings at Corona Property:
Historical Sales (PSF) and Occupancy Costs(1)
| Tenant Name | 2011 | 2012 | 2013 | TTM 6/30/2014 | Current Occupancy Cost | |
Edwards Theatres (Regal)(2) | $435,077 | $455,387 | $482,563 | $498,454 | 22.9% | |
| Marshall’s | $237 | $267 | $272 | NAV | 6.9% | |
| Ross | $207 | $236 | $260 | NAV | 7.3% | |
Barnes & Noble(3) | NAV | NAV | $143 | $141(4) | 16.4% | |
| Bed, Bath & Beyond | $174 | $171 | $184 | NAV | 9.2% | |
| Cost Plus, Inc. | NAV | $112 | $119 | NAV | 11.8% | |
| Old Navy | $219 | $220 | $241 | $252 | 8.4% | |
| Petco | $244 | $247 | $309 | $307 | 6.6% | |
| Pier 1 Imports | NAV | $232 | $150 | $143(5) | 20.2% | |
| Ulta Salon | $354 | $420 | $459 | $472(4) | 8.0% | |
| Tilly’s | $334 | $327 | $316 | $299 | 9.7% | |
| Party America | $188 | $195 | $199 | $202 | 12.7% | |
| Famous Footwear | NAV | $149 | $169 | $172 | 14.8% | |
Total Comparable Sales(6) | $261 | $277 | $294 | NAV | ||
Occupancy Costs(6)(7) | 9.7% | 9.1% | 8.6% | NAV | ||
| (1) | Historical Sales (PSF) and Occupancy Costs were provided by the borrower. Tenants who are not required to report sales have been excluded from the chart above. Current Occupancy Cost is based on the most recent available Historical Sales. |
| (2) | Sales figures for Edwards Cinemas (Regal) are the sales per screen (based on 18 screens). |
| (3) | Barnes & Noble (25,023 square feet; 3.0% of net rentable area) was considered vacant for underwriting purposes and is currently in its lease renewal notice period. |
| (4) | Sales are based on the trailing 12-month period ending April 30, 2014. |
| (5) | Sales are based on the trailing 12-month period ending February 28, 2014. |
| (6) | Represents the 19 tenants, comprising approximately 204,271 square feet (24.5% of net rentable area) that reported at least three full prior years of comparable sales (excluding Edwards Theatres). |
| (7) | Occupancy Costs are based on the Annual U/W Base Rent and reimbursements and historical sales. |
The following table presents certain information relating to the lease rollover schedule at the Crossings at Corona Property:
Lease Expiration Schedule(1)(2)
Year Ending December 31, | No. of Leases Expiring | Expiring NRSF | % of Total NRSF | Cumulative Expiring NRSF | Cumulative % of Total NRSF | Annual U/W Base Rent | % of Annual U/W Base Rent | Annual U/W Base Rent PSF(3) | |
| MTM | 1 | 2,004 | 0.2% | 2,004 | 0.2% | $0 | 0.0% | $0.00 | |
| 2014 | 1 | 935 | 0.1% | 2,939 | 0.4% | $35,990 | 0.3% | $38.49 | |
| 2015 | 8 | 33,708 | 4.0% | 36,647 | 4.4% | $800,838 | 6.0% | $23.76 | |
| 2016 | 7 | 28,671 | 3.4% | 65,318 | 7.8% | $782,904 | 5.8% | $27.31 | |
| 2017 | 9 | 30,614 | 3.7% | 95,932 | 11.5% | $869,866 | 6.5% | $28.41 | |
| 2018 | 6 | 38,452 | 4.6% | 134,384 | 16.1% | $1,078,391 | 8.1% | $28.05 | |
| 2019 | 16 | 389,811 | 46.7% | 524,195 | 62.8% | $5,950,114 | 44.4% | $15.26 | |
| 2020 | 8 | 96,035 | 11.5% | 620,230 | 74.4% | $1,418,707 | 10.6% | $14.77 | |
| 2021 | 4 | 21,195 | 2.5% | 641,425 | 76.9% | $562,002 | 4.2% | $26.52 | |
| 2022 | 2 | 16,301 | 2.0% | 657,726 | 78.9% | $263,148 | 2.0% | $16.14 | |
| 2023 | 1 | 3,104 | 0.4% | 660,830 | 79.2% | $55,996 | 0.4% | $18.04 | |
| 2024 | 3 | 102,050 | 12.2% | 762,880 | 91.5% | $1,376,720 | 10.3% | $13.49 | |
| Thereafter | 1 | 20,000 | 2.4% | 782,880 | 93.9% | $193,600 | 1.4% | $9.68 | |
Vacant(4) | 0 | 51,195 | 6.1% | 834,075 | 100.0% | $0 | 0.0% | $0.00 | |
| Total/Weighted Average | 67 | 834,075 | 100.0% | $13,388,276 | 100.0% | $17.10 | |||
| (1) | Information obtained from the underwritten rent roll. |
| (2) | Certain tenants may have lease termination options that are exercisable prior to the originally stated expiration date of the subject lease and that are not considered in the Lease Expiration Schedule. |
| (3) | Weighted Average Annual U/W Base Rent PSF excludes vacant space. |
| (4) | Vacant space includes Barnes & Noble (25,023 square feet; 3.0% of net rentable area), which was considered vacant for underwriting purposes. Barnes & Noble’s lease expires in January 2015 and is currently in its lease renewal notice period. Current vacancy excluding Barnes & Noble is 3.1%. |
THE INFORMATION IN THIS STRUCTURAL AND COLLATERAL TERM SHEET IS NOT COMPLETE AND MAY BE AMENDED PRIOR TO THE TIME OF SALE. THIS TERM SHEET IS NOT AN OFFER TO SELL THESE SECURITIES AND IT IS NOT A SOLICITATION OF AN OFFER TO BUY THESE SECURITIES IN ANY JURISDICTION WHERE THE OFFER OR SALE IS NOT PERMITTED.
43
| CROSSINGS AT CORONA |
The following table presents historical occupancy percentages at the Crossings at Corona Property:
Historical Occupancy
12/31/2008(1) | 12/31/2009(1) | 12/31/2010(1) | 12/31/2011(1) | 12/31/2012(1) | 12/31/2013(1) | 7/31/2014(2) | ||||||
| 90.3% | 90.6% | 97.1% | 97.6% | 97.3% | 98.1% | 96.9% |
| (1) | Information obtained from the borrower. |
| (2) | Information obtained from the underwritten rent roll. July 31, 2014 occupancy includes Barnes & Noble (25,023 square feet; 3.0% of net rentable area), which was considered vacant for underwriting purposes. Barnes & Noble’s lease expires in January 2015 and is currently in its lease renewal notice period. Occupancy excluding Barnes & Noble is 93.9%. |
Operating History and Underwritten Net Cash Flow. The following table presents certain information relating to the historical operating performance and the Underwritten Net Cash Flow at the Crossings at Corona Property:
Cash Flow Analysis
| 2011 | 2012 | 2013 | TTM 6/30/2014 | U/W | U/W $ per SF | |||||||
| Base Rent | $13,909,498 | $13,858,428 | $13,844,614 | $13,908,329 | $13,388,276(1)(2) | $16.05 | ||||||
| Grossed Up Vacant Space | 0 | 0 | 0 | 0 | 1,026,093(1) | $1.23 | ||||||
| Percentage Rent | 85,082 | 115,858 | 382,140 | 406,501 | 158,138 | $0.19 | ||||||
| Total Reimbursables | 4,539,478 | 4,485,907 | 4,638,911 | 4,577,629 | 4,499,191 | $5.39 | ||||||
| Other Income | 0 | 0 | 0 | 0 | 0 | $0.00 | ||||||
| Less Vacancy & Credit Loss | 0 | 0 | 0 | 0 | (1,026,093)(1) | ($1.23) | ||||||
| Effective Gross Income | $18,534,058 | $18,460,193 | $18,865,665 | $18,892,459 | $18,045,605 | $21.64 | ||||||
| Total Operating Expenses | $5,449,749 | $5,471,353 | $5,960,908 | $5,913,654 | $6,112,113 | $7.33 | ||||||
| Net Operating Income | $13,084,309 | $12,988,840 | $12,904,757 | $12,978,805 | $11,933,492 | $14.31 | ||||||
| T TI/LC | 0 | 0 | 0 | 0 | 843,626 | $1.01 | ||||||
| Capital Expenditures | 0 | 0 | 0 | 0 | 183,497 | $0.22 | ||||||
Net Cash Flow | $13,084,309 | $12,988,840 | $12,904,757 | $12,978,805 | $10,906,369 | $13.08 | ||||||
NOI DSCR(3) | 1.52x | 1.51x | 1.50x | 1.51x | 1.39x | |||||||
NCF DSCR(3) | 1.52x | 1.51x | 1.50x | 1.51x | 1.27x | |||||||
NOI DY(3) | 9.0% | 9.0% | 8.9% | 9.0% | 8.2% | |||||||
NCF DY(3) | 9.0% | 9.0% | 8.9% | 9.0% | 7.5% | |||||||
| (1) | The underwritten economic vacancy is 7.1%. The Crossings at Corona Property was 96.9% physically occupied as of July 31, 2014. Barnes & Noble (25,023 square feet; 3.0% of net rentable area; $380,600 of base rent) was considered vacant for underwriting purposes. Barnes & Noble’s lease expires in January 2015 and is currently in its lease renewal notice period. Occupancy excluding Barnes & Noble is 93.9%. |
| (2) | Base Rent includes approximately $279,112 in contractual rent increases and rent averaging, along with mark to market adjustments totaling ($550,721), for a net decrease of $271,609. |
| (3) | DSCRs and debt yields are based on the Crossings at Corona Loan Combination. Net of the $6.5 million upfront Earnout Reserve, the 2011 NOI DY and NCF DY is 9.4%, the 2012 NOI DY and NCF DY is 9.4%, the 2013 NOI DY and NCF DY is 9.3%, the TTM 6/30/2014 NOI DY and NCF DY is 9.4% and the U/W NOI and NCF DYs are 8.6% and 7.9%, respectively. |
Appraisal. As of the appraisal valuation date of August 5, 2014, the Crossings at Corona Property had an “as-is” appraised value of $222,000,000.
Environmental Matters. According to a Phase I environmental site assessment dated August 7, 2014, there was no evidence of any recognized environmental conditions at the Crossings at Corona Property.
Market Overview and Competition. The Crossings at Corona Property is located in Corona, California, approximately 5.0 miles south of the Corona central business district, adjacent to Interstate 15, approximately 51.1 miles southeast of Los Angeles and 28 miles east of Anaheim. Corona is located in Riverside County, within the Inland Empire region and is part of the Riverside-San Bernardino-Ontario metropolitan statistical area. The Inland Empire’s proximity to the coastal regions of Los Angeles County and Orange County has historically been the primary factor driving growth in the region, mainly in the distribution and manufacturing industries. According to the appraisal, Riverside County is the fourth largest county by land area in California and the eleventh most populous in the United States, with a population of approximately 2.3 million people.
Corona is primarily a bedroom community for the greater Los Angeles and Inland Empire area. Located within the core of the Inland Empire, Corona enjoys numerous resources for transportation, providing strong support for distributers and businesses in the area. Corona is served by the Chino Valley (State Route 71), Ontario (Interstate 15) and Riverside (State Route 91) freeways. The Crossings at Corona Property enjoys good visibility from Interstate 15 with a traffic count in excess of 165,000 cars per day. Air transportation is available at the Riverside Municipal Airport (approximately 16.0 miles northeast of the Crossings at Corona Property) and the Ontario International Airport (approximately 18.7 miles north).
The Crossings at Corona Property’s primary trade area encompasses an area within five miles, and the secondary trade area encompasses an area within 10 miles. According to the appraisal, as of 2014, the residential population within a five- and ten-mile radius of the Crossings at Corona Property is 137,328 and 425,425, respectively, with an average household income within the
THE INFORMATION IN THIS STRUCTURAL AND COLLATERAL TERM SHEET IS NOT COMPLETE AND MAY BE AMENDED PRIOR TO THE TIME OF SALE. THIS TERM SHEET IS NOT AN OFFER TO SELL THESE SECURITIES AND IT IS NOT A SOLICITATION OF AN OFFER TO BUY THESE SECURITIES IN ANY JURISDICTION WHERE THE OFFER OR SALE IS NOT PERMITTED.
44
| CROSSINGS AT CORONA |
same radii of $89,041 and $81,831, respectively. According to the appraisal, the Crossings at Corona Property is located in the San Bernardino/Riverside retail market and the Moreno Valley/Riverside/Corona retail submarket. As of the second quarter of 2014, the Moreno Valley/Riverside/Corona retail submarket had a total inventory of approximately 10.2 million square feet with a vacancy rate of 7.2%, down from 9.1% as of fourth quarter 2009. The vacancy rate within the 16-property competitive set (comprised of properties in both the primary and secondary competitive set) is approximately 4.0%. As of the second quarter of 2014, the average retail asking rent was $20.78 per square foot on a triple-net basis.
The following table presents certain information relating to comparable properties to the Crossings at Corona Property:
Competitive Set
Crossings at Corona (Subject) | Eastvale Gateway | Riverside Plaza | Anaheim Hills Festival Center | Towngate Center | The District at Tustin Legacy | |
| Location | Corona, CA | Mira Loma, CA | Riverside, CA | Anaheim Hills, CA | Moreno Valley, CA | Tustin, CA |
| Distance from Subject | -- | 12.6 miles | 16.5 miles | 21.6 miles | 23.1 miles | 30.3 miles |
| Property Type | Power Center | Power Center | Regional Center | Power Center | Power Center | Power Center |
| Year Built/Renovated | 2004-2007/NAP | 2003/NAP | 1957/2014 | 1992/2002 | 1988/1992 | 2007/NAP |
| Anchors | Various(1) | Best Buy, Home Depot, Kohl’s, TJ Maxx, Edwards Cinemas, Target | CVS, Marshalls, Nordstrom Rack, Jo-Anns, Hobby Lobby, Regal Cinemas | Target, Toys “R” Us, TJ Maxx, Regal Cinemas, Hobby Lobby | Ross Dress for Less, Planet Fitness, BevMo!, TJ Maxx/Home Goods, Regency Theaters, Burlington | AMC Theaters, Costco, DSW, Lowe’s, Office Depot, PetSmart, Target, TJ Maxx, Whole Foods |
| Total GLA | 962,238 SF | 808,210 SF | 497,757 SF | 564,456 SF | 377,993 SF | 1,004,085 SF |
| Total Occupancy | 97% | 99% | 90% | 98% | 93% | 98% |
| (1) | See “Major Tenants” section above. |
The Borrower. The borrower is Castle & Cooke Corona Crossings, LLC, a Delaware limited liability company and single purpose entity with two independent directors. Legal counsel to the borrower delivered a non-consolidation opinion in connection with the origination of the Crossings at Corona Loan Combination. Murdock Realty, LLC, Castle & Cooke Westlake Holdings, LLC and Castle & Cooke, Inc. are the guarantors of certain nonrecourse carveouts under the Crossings at Corona Loan Combination.
The Sponsors. The sponsors are Murdock Realty, LLC, Castle & Cooke Westlake Holdings, LLC and Castle & Cooke, Inc., all part of David H. Murdock’s group of companies. David H. Murdock serves as chairman, president and chief executive officer of Castle & Cooke, Inc., which was listed on the New York Stock Exchange prior to being taken private by Mr. Murdock in 2000. Mr. Murdock is also the majority stock holder in Dole Food Company, Inc. (“Dole”) and serves as its chairman of the board and chief executive officer. Dole is the world’s largest producer and marketer of fresh fruit and fresh vegetables, and was taken private by Mr. Murdock in 2013. The combined companies make up one of the largest privately-held companies in the United States, with approximately 63,000 employees operating in more than 90 countries around the world at its peak. Castle & Cooke, Inc. has a commercial real estate portfolio of approximately 3.9 million square feet, including approximately 2.2 million square feet of retail space.
Escrows. The loan documents provide for upfront reserves in the amount of $2,117,050 for real estate taxes, $75,000 for outstanding TI/LC reserves for Tilly’s, $172,830 for outstanding tax reimbursements due to Sports Authority, and $6.5 million for an Earnout Reserve. The Earnout Reserve will be released upon the achievement of an U/W net cash flow debt yield of 7.85%. The funds may be released incrementally (in amounts not less than $750,000) provided the Crossings at Corona Property satisfies an U/W net cash flow debt yield of 7.85% calculated based on the outstanding principal balance of the Crossings at Corona Loan Combination, less the amount in the Earnout Reserve, plus the aggregate amount of disbursements from the Earnout Reserve and the amount of any pending request for disbursement from the Earnout Reserve.
The loan documents require monthly deposits of $229,672 for real estate taxes, $15,291 for replacement reserves and $69,506 for tenant improvements and leasing commissions (subject to a cap of $850,000). The loan documents do not require monthly escrows for insurance provided (i) no event of default has occurred and is continuing; (ii) the insurance required to be maintained by the borrower is maintained pursuant to one or more blanket insurance policies approved by the lender; (iii) the borrower provides the lender with timely proof of payment of insurance premiums; and (iv) the borrower provides evidence of renewal of insurance policies.
Lockbox and Cash Management. The Crossings at Corona Loan Combination requires a lender-controlled lockbox account, which is already in place, and that the borrower directs tenants to pay their rents directly into such lockbox account. The loan documents also require that all rents received by the borrower or the property manager be deposited into the lockbox account within two business days of receipt. Prior to the occurrence of a Cash Trap Event Period (as defined below), all funds on deposit in the lockbox account are distributed to the borrower. During a Cash Trap Event Period, all cash flow is swept to a lender controlled cash management account.
A “Cash Trap Event Period” will commence upon the earlier of (i) the occurrence and continuance of an event of default or (ii) the net cash flow debt yield falling below 6.75% at the end of any calendar quarter. A Cash Trap Event Period will be cured, with regard to clause (i), upon the cure of such event of default; and with regard to clause (ii), upon the net cash flow debt yield being equal to or greater than 6.75% for two consecutive calendar quarters.
THE INFORMATION IN THIS STRUCTURAL AND COLLATERAL TERM SHEET IS NOT COMPLETE AND MAY BE AMENDED PRIOR TO THE TIME OF SALE. THIS TERM SHEET IS NOT AN OFFER TO SELL THESE SECURITIES AND IT IS NOT A SOLICITATION OF AN OFFER TO BUY THESE SECURITIES IN ANY JURISDICTION WHERE THE OFFER OR SALE IS NOT PERMITTED.
45
| CROSSINGS AT CORONA |
Property Management. The Crossings at Corona Property is managed by an affiliate of the borrower.
Assumption. The borrower has the two-time right to transfer the Crossings at Corona Property provided that certain conditions are satisfied, including (i) no event of default has occurred and is continuing; (ii) the lender has reasonably determined that the proposed transferee and guarantor satisfy “Qualified Equity Holder” criteria (generally, an institutional party with total assets in name or under management of at least of $600 million and, except for pension advisory firms or similar fiduciaries, capital/statutory surplus or shareholder’s equity of at least $250 million) and the lender’s credit review and underwriting standards, taking into consideration transferee’s experience, financial strength and general business standing; and (iii) the lender has received confirmation from Fitch, Moody’s and Morningstar that such assumption will not result in a downgrade, withdrawal or qualification of the respective ratings assigned to the Series 2014-C23 Certificates, and similar confirmations with respect to the ratings of any securities backed by the Crossings at Corona Companion Loan.
Partial Release. Not permitted.
Real Estate Substitution. Not permitted.
Subordinate and Mezzanine Indebtedness. Not permitted.
Ground Lease. None.
Terrorism Insurance. The loan documents require that the “all risk” insurance policy required to be maintained by the borrower provides coverage for terrorism in an amount equal to the full replacement cost of the Crossings at Corona Property. The loan documents also require business interruption insurance covering no less than the 18-month period following the occurrence of a casualty event, together with a six-month extended period of indemnity.
Earthquake Insurance. The loan documents do not require earthquake insurance. The seismic report indicated a probable maximum loss of 13%.
THE INFORMATION IN THIS STRUCTURAL AND COLLATERAL TERM SHEET IS NOT COMPLETE AND MAY BE AMENDED PRIOR TO THE TIME OF SALE. THIS TERM SHEET IS NOT AN OFFER TO SELL THESE SECURITIES AND IT IS NOT A SOLICITATION OF AN OFFER TO BUY THESE SECURITIES IN ANY JURISDICTION WHERE THE OFFER OR SALE IS NOT PERMITTED.
46
(THIS PAGE INTENTIONALLY LEFT BLANK)
47
(THIS PAGE INTENTIONALLY LEFT BLANK)
48
| COLUMBUS SQUARE PORTFOLIO |
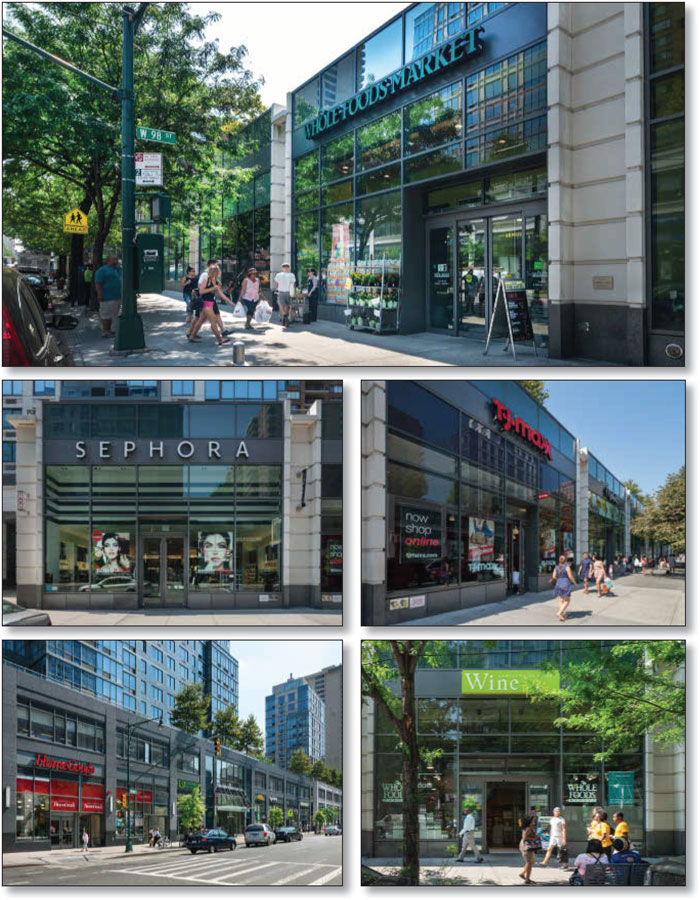
THE INFORMATION IN THIS STRUCTURAL AND COLLATERAL TERM SHEET IS NOT COMPLETE AND MAY BE AMENDED PRIOR TO THE TIME OF SALE. THIS TERM SHEET IS NOT AN OFFER TO SELL THESE SECURITIES AND IT IS NOT A SOLICITATION OF AN OFFER TO BUY THESE SECURITIES IN ANY JURISDICTION WHERE THE OFFER OR SALE IS NOT PERMITTED.
49
| COLUMBUS SQUARE PORTFOLIO |
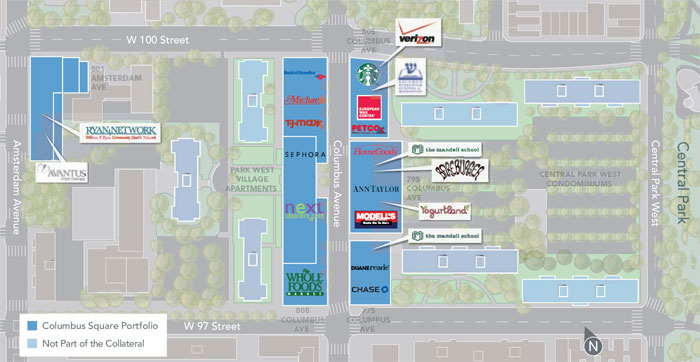
THE INFORMATION IN THIS STRUCTURAL AND COLLATERAL TERM SHEET IS NOT COMPLETE AND MAY BE AMENDED PRIOR TO THE TIME OF SALE. THIS TERM SHEET IS NOT AN OFFER TO SELL THESE SECURITIES AND IT IS NOT A SOLICITATION OF AN OFFER TO BUY THESE SECURITIES IN ANY JURISDICTION WHERE THE OFFER OR SALE IS NOT PERMITTED.
50
| COLUMBUS SQUARE PORTFOLIO |
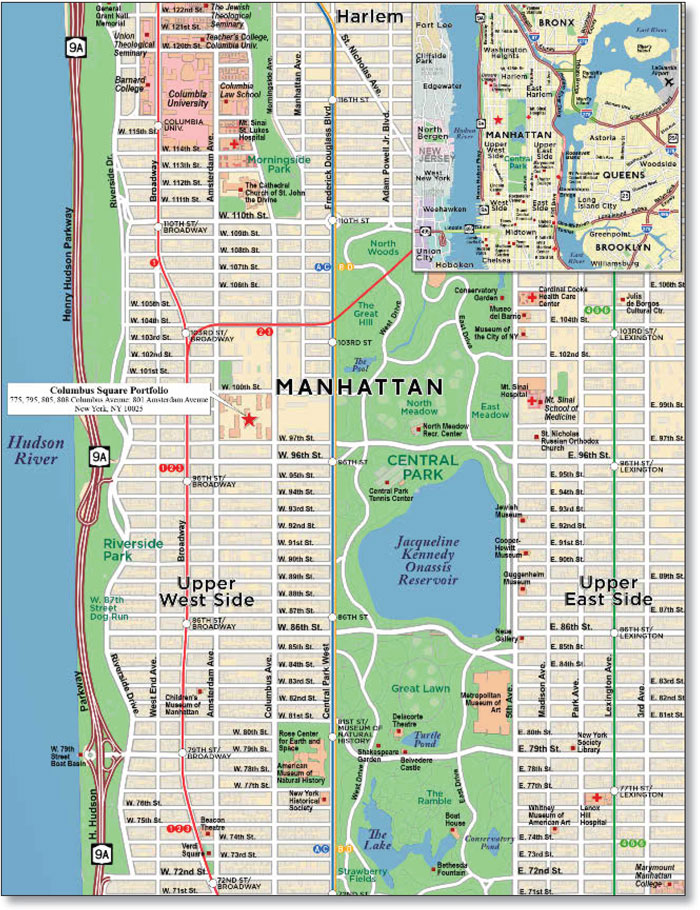
THE INFORMATION IN THIS STRUCTURAL AND COLLATERAL TERM SHEET IS NOT COMPLETE AND MAY BE AMENDED PRIOR TO THE TIME OF SALE. THIS TERM SHEET IS NOT AN OFFER TO SELL THESE SECURITIES AND IT IS NOT A SOLICITATION OF AN OFFER TO BUY THESE SECURITIES IN ANY JURISDICTION WHERE THE OFFER OR SALE IS NOT PERMITTED.
51
| No. 3 - Columbus Square Portfolio | |||||||
| Loan Information | Property Information | ||||||
| Mortgage Loan Seller: | Wells Fargo Bank, National Association | Single Asset/Portfolio: | Portfolio | ||||
| Credit Assessment (Fitch/Moody’s/Morningstar): | NR/NR/NR | Property Type: | Mixed Use | ||||
Original Principal Balance(1): | $75,000,000 | Specific Property Type: | Retail/Other/Office | ||||
Cut-off Date Principal Balance(1): | $75,000,000 | Location: | New York, NY | ||||
| % of Initial Pool Balance: | 8.0% | Size: | 494,224 SF | ||||
| Loan Purpose: | Refinance | Cut-off Date Principal Balance Per SF(1): | $809.35 | ||||
| Borrower Names: | Various(2) | Year Built/Renovated(5): | Various/NAP | ||||
| Sponsors: | Jacob Chetrit; Laurence Gluck | Title Vesting: | Fee | ||||
| Mortgage Rate: | 4.570% | Property Manager: | Self-managed | ||||
| Note Date: | August 8, 2014 | 3rd Most Recent Occupancy (As of)(6): | NAV | ||||
| Anticipated Repayment Date: | NAP | 2nd Most Recent Occupancy (As of)(7): | 71.9% (12/31/2012) | ||||
| Maturity Date: | August 11, 2024 | Most Recent Occupancy (As of)(7): | 75.0% (12/31/2013) | ||||
| IO Period: | 42 months | Current Occupancy (As of)(8): | 95.7% (7/31/2014) | ||||
| Loan Term (Original): | 120 months | ||||||
| Seasoning: | 1 month | Underwriting and Financial Information: | |||||
| Amortization Term (Original): | 420 months | ||||||
| Loan Amortization Type: | Interest-only, Amortizing Balloon | 3rd Most Recent NOI (As of)(6): | NAV | ||||
| Interest Accrual Method: | Actual/360 | 2nd Most Recent NOI (As of): | $20,421,271 (12/31/2012) | ||||
Call Protection(3): | L(25),D(91),O(4) | Most Recent NOI (As of)(9): | $19,333,826 (12/31/2013) | ||||
| Lockbox Type: | Hard/Upfront Cash Management | ||||||
Additional Debt(1): | Yes | ||||||
Additional Debt Type(1): | Pari Passu | U/W Revenues: | $29,269,650 | ||||
| U/W Expenses: | $2,376,810 | ||||||
U/W NOI(9): | $26,892,839 | ||||||
U/W NCF(9): | $26,393,417 | ||||||
U/W NOI DSCR(1)(9)(10): | 1.17x | ||||||
Escrows and Reserves(4): | U/W NCF DSCR(1)(9)(10): | 1.15x | |||||
U/W NOI Debt Yield(1)(9): | 6.7% | ||||||
Type: | Initial | Monthly | Cap (If Any) | U/W NCF Debt Yield(1)(9): | 6.6% | ||
| Taxes | $249,368 | $77,575 | NAP | As-Is Appraised Value: | $555,000,000 | ||
| Insurance | $0 | Springing | NAP | As-Is Appraisal Valuation Date: | July 16, 2014 | ||
| Replacement Reserves | $6,177 | $6,177 | $148,267 | Cut-off Date LTV Ratio(1): | 72.1% | ||
| TI/LC Reserve | $0 | Springing(4) | $4,500,000 | LTV Ratio at Maturity or ARD(1): | 66.1% | ||
| (1) | The Columbus Square Portfolio Loan Combination, totaling $400,000,000, is comprised of four pari passu notes (Notes A-1, A-2, A-3 and A-4). Note A-3, which represents a non-controlling interest in the Columbus Square Portfolio Loan Combination, had an original principal balance of $75,000,000, has an outstanding principal balance of $75,000,000 as of the Cut-off Date and will be contributed to the WFRBS 2014-C23 Trust. The controlling Note A-1 had an original principal balance of $125,000,000 and is expected to be contributed to the WFRBS 2014-C22 Trust. The remaining two pari passu notes (Notes A-2 and A-4) had an aggregate original principal balance of $200,000,000 and are expected to be contributed to future trusts. All statistical information related to balances per square foot, loan-to-value ratios, debt service coverage ratios and debt yields are based on the Columbus Square Portfolio Loan Combination. |
| (2) | See “The Borrowers” section. |
| (3) | See “Purchase Option” section. |
| (4) | See “Escrows” section. |
| (5) | The Columbus Square Portfolio Properties were constructed in 2007 and 2008. |
| (6) | 3rd Most Recent Occupancy and 3rd Most Recent NOI are not available because historical statements prior to 2012 include the non-collateral apartment and condominium unit performance. |
| (7) | See “Historical Occupancy” section. |
| (8) | Two tenants (Avantus Renal Therapy and Bareburger) comprising 3.7% of the net rentable area and 4.2% of the underwritten base rent are not yet in occupancy. Occupancy excluding these tenants is 92.0%. |
| (9) | See “Cash Flow Analysis” section. |
| (10) | The interest-only U/W NOI and NCF DSCRs are 1.45x and 1.42x, respectively. |
The Mortgage Loan. The mortgage loan (the “Columbus Square Portfolio Loan Combination”) is evidenced by four pari passu promissory notes (the A-1, A-2, A-3 and A-4 notes, respectively) secured by a first mortgage encumbering five mixed-use condominium units located in New York, New York (the “Columbus Square Portfolio Properties”). The Columbus Square Portfolio Loan Combination was co-originated on August 8, 2014 by Wells Fargo Bank, National Association and Barclays Bank PLC. The Columbus Square Portfolio Loan Combination had an original principal balance of $400,000,000, has an outstanding principal balance as of the Cut-off Date of $400,000,000 and accrues interest at an interest rate of 4.570% per annum. The Columbus Square Portfolio Loan Combination had an initial term of 120 months, has a remaining term of 119 months as of the Cut-off Date and requires payments of interest-only for the first 42 payments following origination and, thereafter, requires payments of principal and interest based on a 35-year amortization schedule. The Columbus Square Portfolio Loan Combination matures on August 11, 2024. See “Description of the Mortgage Pool—Additional Indebtedness—The Loan Combinations—The Columbus Square
THE INFORMATION IN THIS STRUCTURAL AND COLLATERAL TERM SHEET IS NOT COMPLETE AND MAY BE AMENDED PRIOR TO THE TIME OF SALE. THIS TERM SHEET IS NOT AN OFFER TO SELL THESE SECURITIES AND IT IS NOT A SOLICITATION OF AN OFFER TO BUY THESE SECURITIES IN ANY JURISDICTION WHERE THE OFFER OR SALE IS NOT PERMITTED.
52
| COLUMBUS SQUARE PORTFOLIO |
Portfolio Loan Combination” and “The Pooling and Servicing Agreement—Servicing of the Loan Combinations” in the Free Writing Prospectus.
Note A-3, which represents a non-controlling interest in the Columbus Square Portfolio Loan Combination and will be contributed to the WFRBS 2014-C23 Trust, had an original principal balance of $75,000,000 and has an outstanding principal balance as of the Cut-off Date of $75,000,000. Note A-1, which had an original principal balance of $125,000,000 and represents the controlling interest in the Columbus Square Portfolio Loan Combination, is expected to be contributed to the WFRBS 2014-C22 Trust. The remaining two pari passu notes, which had an aggregate original principal balance of $200,000,000 and each represent a non-controlling interest in the Columbus Square Portfolio Loan Combination, are expected to be contributed to future trusts. Collectively, Notes A-1, A-2 and A-4 shall be referred to herein as the “Columbus Square Portfolio Companion Loans”. As of the loan closing date, the A-2 note had an original principal balance of $103,750,000, and the A-4 note had an original principal balance of $96,250,000; however, the lender provides no assurances that any non-securitized pari passu notes will not be split further.
Following the lockout period, the borrowers have the right to defease the Columbus Square Portfolio Loan Combination in whole, or prepay in connection with a certain partial release by paying a yield maintenance premium, if applicable (see “Purchase Option” section), on any date before May 11, 2024. In addition, the Columbus Square Portfolio Loan Combination is prepayable without penalty on or after May 11, 2024.
Sources and Uses
| Sources | Uses | ||||||||
| Original loan combination amount | $400,000,000 | 100.0% | Loan payoff | $271,916,460 | 68.0 | % | |||
| Reserves | 255,545 | 0.1 | |||||||
| Closing costs | 7,071,223 | 1.8 | |||||||
| Return of equity | 120,756,773 | 30.2 | |||||||
| Total Sources | $400,000,000 | 100.0% | Total Uses | $400,000,000 | 100.0 | % |
The Properties. The Columbus Square Portfolio Properties comprise five mixed-use condominium buildings (see “Description of the Mortgage Pool—Statistical Characteristics of the Mortgage Loans—Condominium Structures” in the Free Writing Prospectus) situated on two separate blocks located on Manhattan’s Upper West Side within New York, New York. The Columbus Square Portfolio Properties contain 494,224 square feet of predominantly retail space constructed by the sponsors in 2007 and 2008, as detailed in the following table:
| Building Name | Year Built | NRSF | % of NRSF | Annual U/W Base Rent | % of Annual U/W Base Rent | Retail SF | % of Building SF | Community Facility SF | % of Building SF | Parking SF | % of Building SF | ||||||||||||||||
| 775 Columbus | 2008 | 39,644 | 8.0% | $3,847,641 | 13.5% | 22,664 | 57.2% | 10,715 | 27.0% | 6,265 | 15.8% | ||||||||||||||||
| 795 Columbus | 2007 | 104,218 | 21.1% | $6,927,149 | 24.3% | 59,911 | 57.5% | 44,307 | 42.5% | 0 | 0.0% | ||||||||||||||||
| 805 Columbus | 2007 | 40,260 | 8.1% | $3,136,876 | 11.0% | 26,531 | 65.9% | 13,729 | 34.1% | 0 | 0.0% | ||||||||||||||||
| 808 Columbus | 2007 | 240,852 | 48.7% | $12,385,867 | 43.4% | 157,177 | 65.3% | 0 | 0.0% | 83,675 | 34.7% | ||||||||||||||||
| 801 Amsterdam | 2008 | 69,250 | 14.0% | $2,252,890 | 7.9% | 9,674 | 14.0% | 41,072 | 59.3% | 18,504 | 26.7% | ||||||||||||||||
| Total/Weighted Average | 494,224 | 100.0% | $28,550,424 | 100.0% | 275,957 | 55.8% | 109,823 | 22.2% | 108,444 | 21.9% | |||||||||||||||||
The retail space is comprised of 275,957 square feet, with approximately 98,000 square feet at grade level, and 178,000 square feet of below grade space. The retail portion of the Columbus Square Portfolio Properties is located along Columbus Avenue and is anchored by Whole Foods, which recently expanded with an adjoining 2,775 square foot wine store (the first Whole Foods wine store in New York City), TJ Maxx, which added its HomeGoods concept after experiencing high sales volumes, and Michael’s, which expanded by an additional 10,572 square feet in March 2013. Eight tenants (or their parent companies), accounting for approximately 33.1% of the net rentable area and 48.9% of the annual underwritten base rent, are rated investment-grade, and only 33.9% of the net rentable area is scheduled to expire during the loan term. The majority of the community facility portion of the Columbus Square Portfolio Properties is leased to the Mandell School, a private co-educational institution founded in 1939 for pre-school through eighth graders. The 775 and 795 Columbus properties house the Mandell School’s elementary and preparatory divisions and their Upper West Side pre-school. Three below-grade parking garages containing 392 parking spaces leased to Quik Park comprise the remainder of the Columbus Square Portfolio Properties. The sponsors began to assemble land for this project in the late 1990s, and transformed the site, previously home to condominiums and rent-controlled apartments, into a 24/7 “live, work and play” neighborhood. The Columbus Square Portfolio Properties are situated in the Columbus Square mixed-use development, which includes the Columbus Square Luxury Apartments (located above the Columbus Square Portfolio Properties), the Park West Village Apartments and Central Park West Condominiums, which include over 3,200 units and 13,000 residents combined. No portion of the Columbus Square Luxury Apartments, Park West Village Apartments or the Central Park West Condominiums is collateral for the Columbus Square Portfolio Loan Combination. As of July 31, 2014, the Columbus Square Portfolio Properties were 95.7% occupied by 23 tenants.
THE INFORMATION IN THIS STRUCTURAL AND COLLATERAL TERM SHEET IS NOT COMPLETE AND MAY BE AMENDED PRIOR TO THE TIME OF SALE. THIS TERM SHEET IS NOT AN OFFER TO SELL THESE SECURITIES AND IT IS NOT A SOLICITATION OF AN OFFER TO BUY THESE SECURITIES IN ANY JURISDICTION WHERE THE OFFER OR SALE IS NOT PERMITTED.
53
| COLUMBUS SQUARE PORTFOLIO |
The following table presents certain information relating to the tenancy at the Columbus Square Portfolio Properties:
Major Tenants
| Tenant Name | Credit Rating (Fitch/Moody’s/ S&P)(1) | Tenant NRSF | % of NRSF | Annual U/W Base Rent PSF(2) | Annual U/W Base Rent(2) | % of Total Annual U/W Base Rent | Sales PSF(3) | Occupancy Cost(3) | Lease Expiration Date | ||||||||
| Anchor Tenants | |||||||||||||||||
| Whole Foods | NR/NR/BBB- | 62,454 | 12.6% | $73.06(4) | $4,562,703(4) | 16.0% | NAV | NAV | 8/31/2029(5) | ||||||||
| Michael’s | NR/B3/NR | 34,424 | 7.0% | $57.37 | $1,975,000 | 6.9% | NAV | NAV | 3/31/2020(6) | ||||||||
| HomeGoods | NR/A3/A+ | 27,019 | 5.5% | $71.58(7) | $1,933,902(7) | 6.8% | $362 | 18.4% | 5/31/2021(8) | ||||||||
| TJ Maxx | NR/A3/A+ | 40,550 | 8.2% | $47.21(9) | $1,914,494(9) | 6.7% | $512 | 8.4% | 10/31/2019(10) | ||||||||
| Total Anchor Tenants | 164,447 | 33.3% | $63.16 | $10,386,100 | 36.4% | ||||||||||||
| Major Tenants | |||||||||||||||||
| Mandell School | NR/NR/NR | 55,022 | 11.1% | $58.79 | $3,234,757 | 11.3% | NAP | NAP | 6/30/2030(11) | ||||||||
| Petco | NR/B3/B | 19,487 | 3.9% | $95.96 | $1,869,973 | 6.5% | NAP | NAP | 10/31/2020 | ||||||||
| JPMorgan Chase | A+/A3/A | 4,955 | 1.0% | $330.56(12) | $1,637,944(12) | 5.7% | NAP | NAP | 11/30/2030 | ||||||||
| Duane Reade | NR/Baa1/BBB | 17,196 | 3.5% | $80.46(13) | $1,383,547(13) | 4.8% | NAV | NAV | 10/31/2030 | ||||||||
| Sephora | NR/NR/A+ | 5,602 | 1.1% | $216.82(14) | $1,214,617(14) | 4.3% | $812(15) | 21.5%(15) | 1/31/2026 | ||||||||
| Total Major Tenants | 102,262 | 20.7% | $91.34 | $9,340,838 | 32.7% | ||||||||||||
| Non-Major Tenants | 97,754 | 19.8% | $71.79 | $7,018,236 | 24.6% | ||||||||||||
| Total Retail & Community Facility Tenants | 364,463 | 73.7% | $73.38 | $26,745,174 | 93.7% | ||||||||||||
| Parking Tenant | |||||||||||||||||
| Quik Park | 108,444 | 21.9% | $16.65 | $1,805,250 | 6.3% | 4/30/2029 | |||||||||||
| Occupied Collateral Total | 472,907 | 95.7% | $60.37 | $28,550,424 | 100.0% | ||||||||||||
| Vacant Space | 21,317 | 4.3% | |||||||||||||||
| Collateral Total | 494,224 | 100.0% | |||||||||||||||
| (1) | Certain ratings are those of the parent company whether or not the parent guarantees the lease. |
| (2) | Annual U/W Base Rent PSF and Annual U/W Base Rent include contractual rent steps through October 2015. |
| (3) | Sales and occupancy costs are based on the current in-place rent and the trailing 12-month period ending January 31, 2014 unless otherwise noted. |
| (4) | The Annual U/W Base Rent and Annual U/W Base Rent PSF for Whole Foods represent the tenant’s average rent over the lease term. The tenant’s current in-place rent is $59.75 per square foot. |
| (5) | Whole Foods has six, 5-year lease renewal options. |
| (6) | Michael’s has two 10-year lease renewal options. |
| (7) | The Annual U/W Base Rent and Annual U/W Base Rent PSF for HomeGoods represent the tenant’s average rent over the lease term. The tenant’s current in-place rent is $66.62 per square foot. |
| (8) | HomeGoods has three, 5-year lease renewal options. |
| (9) | The Annual U/W Base Rent and Annual U/W Base Rent PSF for TJ Maxx represent the tenant’s average rent over the lease term. The tenant’s current in-place rent is $43.04 per square foot. |
| (10) | TJ Maxx has three, 5-year lease renewal options. |
| (11) | Mandell School has the right to terminate their lease at any time with four months written notice and subject to the payment of a termination fee equal to three years rent (three years rent totals approximately $8.4 million through June 2015, $9.7 million through June 2020, $11.2 million through June 2025 and $12.8 million through June 2030). |
| (12) | The Annual U/W Base Rent and Annual U/W Base Rent PSF for JP Morgan Chase represent the tenant’s average rent over the lease term. The tenant’s current in-place rent is $253.48 per square foot. |
| (13) | The Annual U/W Base Rent and Annual U/W Base Rent PSF for Duane Reade represent the tenant’s average rent over the lease term. The tenant’s current in-place rent is $64.90 per square foot. |
| (14) | The Annual U/W Base Rent and Annual U/W Base Rent PSF for Sephora represent the tenant’s average rent over the lease term. The tenant’s current in-place rent is $174.94 per square foot. |
| (15) | Sales and occupancy costs are for the trailing 12-month period ending April 30, 2014. |
THE INFORMATION IN THIS STRUCTURAL AND COLLATERAL TERM SHEET IS NOT COMPLETE AND MAY BE AMENDED PRIOR TO THE TIME OF SALE. THIS TERM SHEET IS NOT AN OFFER TO SELL THESE SECURITIES AND IT IS NOT A SOLICITATION OF AN OFFER TO BUY THESE SECURITIES IN ANY JURISDICTION WHERE THE OFFER OR SALE IS NOT PERMITTED.
54
| COLUMBUS SQUARE PORTFOLIO |
The following table presents certain information relating to the lease rollover schedule at the Columbus Square Portfolio Properties:
Lease Expiration Schedule(1)(2)
Year Ending December 31, | No. of Leases Expiring | Expiring NRSF | % of Total NRSF | Cumulative Expiring NRSF | Cumulative % of Total NRSF | Annual U/W Base Rent | Annual U/W Base Rent PSF(3) | ||||||||
| MTM | 0 | 0 | 0.0% | 0 | 0.0% | $0 | $0.00 | ||||||||
| 2014 | 0 | 0 | 0.0% | 0 | 0.0% | $0 | $0.00 | ||||||||
| 2015 | 0 | 0 | 0.0% | 0 | 0.0% | $0 | $0.00 | ||||||||
| 2016 | 0 | 0 | 0.0% | 0 | 0.0% | $0 | $0.00 | ||||||||
| 2017 | 0 | 0 | 0.0% | 0 | 0.0% | $0 | $0.00 | ||||||||
| 2018 | 0 | 0 | 0.0% | 0 | 0.0% | $0 | $0.00 | ||||||||
| 2019 | 1 | 40,550 | 8.2% | 40,550 | 8.2% | $1,914,494 | $47.21 | ||||||||
| 2020 | 4 | 68,153 | 13.8% | 108,703 | 22.0% | $4,546,123 | $66.70 | ||||||||
| 2021 | 2 | 28,550 | 5.8% | 137,253 | 27.8% | $2,193,499 | $76.83 | ||||||||
| 2022 | 2 | 1,512 | 0.3% | 138,765 | 28.1% | $250,813 | $165.88 | ||||||||
| 2023 | 3 | 19,798 | 4.0% | 158,563 | 32.1% | $1,412,400 | $71.34 | ||||||||
| 2024 | 2 | 8,966 | 1.8% | 167,529 | 33.9% | $1,788,736 | $199.50 | ||||||||
| Thereafter | 9 | 305,378 | 61.8% | 472,907 | 95.7% | $16,444,358 | $53.85 | ||||||||
| Vacant | 0 | 21,317 | 4.3% | 494,224 | 100.0% | $0 | $0.00 | ||||||||
| Total/Weighted Average | 23 | 494,224 | 100.0% | $28,550,424 | $60.37 |
| (1) | Information obtained from the underwritten rent roll. |
| (2) | Certain tenants may have lease termination options that are exercisable prior to the originally stated expiration date of the subject lease and that are not considered in the Lease Expiration Schedule. |
| (3) | Weighted Average Annual U/W Base Rent PSF excludes vacant space. |
The following table presents historical occupancy percentages at the Columbus Square Portfolio Properties:
Historical Occupancy
12/31/2011(1) | 12/31/2012(2) | 12/31/2013(2) | 7/31/2014(3) | |||
| NAV | 71.9% | 75.0% | 95.7% |
| (1) | 12/31/2011 historical occupancy is not available because historical statements prior to 2012 include the non-collateral apartment and condominium unit performance. |
| (2) | Information obtained from the borrowers. 12/31/2012 and 12/31/2013 occupancy is lower as the Columbus Square Portfolio Properties were still in lease-up phase. While the buildings were constructed in 2007 and 2008, the final building (805 Columbus) did not open until August 2010. Approximately 134,382 square feet (27.2% of NRSF) in new leases were signed in 2013 and 2014. |
| (3) | Information obtained from the underwritten rent roll. Two tenants (Avantus Renal Therapy and Bareburger) comprising 3.7% of the net rentable area and 4.2% of the underwritten base rent are not yet in occupancy. Occupancy excluding these tenants is 92.0%. |
THE INFORMATION IN THIS STRUCTURAL AND COLLATERAL TERM SHEET IS NOT COMPLETE AND MAY BE AMENDED PRIOR TO THE TIME OF SALE. THIS TERM SHEET IS NOT AN OFFER TO SELL THESE SECURITIES AND IT IS NOT A SOLICITATION OF AN OFFER TO BUY THESE SECURITIES IN ANY JURISDICTION WHERE THE OFFER OR SALE IS NOT PERMITTED.
55
| COLUMBUS SQUARE PORTFOLIO |
Operating History and Underwritten Net Cash Flow. The following table presents certain information relating to the historical operating performance and the Underwritten Net Cash Flow at the Columbus Square Portfolio Properties:
Cash Flow Analysis
| 2012 | 2013(1) | U/W(1) | U/W $ per SF | ||||||
| Base Rent | $22,345,979 | $21,411,531 | $28,550,424 | $57.77 | |||||
| Grossed Up Vacant Space | 0 | 0 | 2,917,555 | 5.90 | |||||
| Percentage Rent | 0 | 0 | 0 | 0.00 | |||||
| Total Reimbursables | 1,025,172 | 83,728 | 152,226 | 0.31 | |||||
| Other Income | 415,820 | 372,424 | 567,000 | 1.15 | |||||
| Less Vacancy & Credit Loss | (150,642) | (45,833) | (2,917,555)(2) | (5.90) | |||||
| Effective Gross Income | $23,636,329 | $21,821,850 | $29,269,650 | $59.22 | |||||
| Total Operating Expenses | $3,215,058 | $2,488,024 | $2,376,810(3) | $4.81 | |||||
| Net Operating Income | $20,421,271 | $19,333,826 | $26,892,839 | $54.41 | |||||
| TI/LC | 0 | 0 | 450,000 | 0.91 | |||||
| Capital Expenditures | 0 | 0 | 49,422 | 0.10 | |||||
| Net Cash Flow | $20,421,271 | $19,333,826 | $26,393,417 | $53.40 | |||||
NOI DSCR(4) | 0.89x | 0.84x | 1.17x | ||||||
NCF DSCR(4) | 0.89x | 0.84x | 1.15x | ||||||
NOI DY(4) | 5.1% | 4.8% | 6.7% | ||||||
NCF DY(4) | 5.1% | 4.8% | 6.6% |
| (1) | The increase in Base Rent from 2013 to U/W is primarily due to approximately $4.1 million (approximately 134,382 square feet; 27.2% of NRSF) in new leasing activity along with approximately $908,000 in contractual rent increases and $2.1 million rent averaging for investment-grade rated tenants. |
| (2) | The underwritten economic vacancy is 9.3%. The Columbus Square Portfolio Properties were 95.7% leased and 92.0% physically occupied as of July 31, 2014. |
| (3) | The Columbus Square Portfolio Properties benefit from Industrial and Commercial Incentive Programs (“ICIPs”) and 421a tax exemptions (the parking garages benefit from the 421a exemptions), which result in a reduced property tax expense. The property tax expense as of year-end 2013 was $140,846. The ICIPs expire in 2034 and will be gradually phased out beginning in the 2025/2026 tax year. The 421a exemptions expire in 2021 and 2022 (the 808 Columbus property’s exemption expires in 2032) and will be gradually phased out beginning in the 2013/2014 and 2014/2015 tax years (the 808 Columbus property’s exemption will be phased out beginning in the 2023/2024 tax years). The U/W property tax expense of $949,975 is based on the current abated tax expense. The taxes are projected to increase from the current level to $1,638,023 by the time the Columbus Square Portfolio Loan Combination matures. According to the leases, all tax increases may be passed through to the tenants at the Columbus Square Portfolio Properties. |
| (4) | DSCRs and debt yields are based on the Columbus Square Portfolio Loan Combination. The interest-only U/W NOI and NCF DSCRs are 1.45x and 1.42x, respectively |
Appraisal. As of the appraisal valuation date of July 16, 2014, the Columbus Square Portfolio Properties had an “as-is” appraised value of $555,000,000.
Environmental Matters. According to a Phase I environmental site assessment dated July 15, 2014, there was no evidence of any recognized environmental conditions at the Columbus Square Portfolio Properties. However, six above ground storage tanks (“ASTs”) are maintained at the Columbus Square Portfolio Properties. Based on a review of the online database, the tanks at the 775, 795 and 805 Columbus properties have current permits but the remaining two tanks are listed with expired registrations. The borrower has obtained the current permits.
Market Overview and Competition. The Columbus Square Portfolio Properties are situated on two abutting city blocks bounded by 100th Street to the north, 97th Street to the south, Amsterdam Avenue to the west and Columbus Avenue to the east in the Upper West Side neighborhood of Manhattan. The Upper West Side is an upscale, primarily residential area known for its cultural, educational and historical institutions, including Columbia University (1.0 mile north of the Columbus Square Portfolio Properties), Lincoln Center (1.8 miles south) and the American Museum of Natural History (1.0 mile south), in addition to Central Park (less than one mile east). The Columbus Square Portfolio Properties are part of the larger Columbus Square development, which contains five buildings, 500,000 square feet of retail and community facility space, over 3,200 units and over 13,000 residents combined. Nearby and adjacent uses include a mix of high-rise, luxury and market rate residential buildings with multi-level retail and older pre-war high rise residential buildings, providing significant foot traffic for the Columbus Square Portfolio Properties. According to a third party market research report, the median household income is approximately $111,000 within a one-mile radius of the Columbus Square Portfolio Properties, while the median home value is approximately $905,000.
The Columbus Square Portfolio Properties neighborhood is serviced by an excellent transportation network via subway and public bus. The Columbus Square Portfolio Properties are located one block northwest of the 96th Street (at Central Park West) subway station, which provides access to the B and C subway lines and two blocks northeast of 96th Street (at Broadway) subway station, which provides access to the 1, 2 and 3 subway lines. Further, the Metropolitan Transit Authority bus system makes this neighborhood accessible from virtually all locations north, south and east. Crosstown buses run along 66th, 79th-81st, 86th, 96th/97th and 110th Streets. Uptown bus service is available along Central Park West, Amsterdam Avenue, Broadway and Riverside Drive, and downtown buses run along Central Park West, Columbus Avenue, Broadway and Riverside Drive.
According to a third party market research report, the Columbus Square Portfolio Properties are located within the Upper West Side submarket. As of the second quarter of 2014, the retail submarket had a total inventory of 4.3 million square feet across 266 buildings. The retail submarket reported a vacancy rate of 1.2%, down from 6.3% as of the fourth quarter of 2007, with an average
THE INFORMATION IN THIS STRUCTURAL AND COLLATERAL TERM SHEET IS NOT COMPLETE AND MAY BE AMENDED PRIOR TO THE TIME OF SALE. THIS TERM SHEET IS NOT AN OFFER TO SELL THESE SECURITIES AND IT IS NOT A SOLICITATION OF AN OFFER TO BUY THESE SECURITIES IN ANY JURISDICTION WHERE THE OFFER OR SALE IS NOT PERMITTED.
56
| COLUMBUS SQUARE PORTFOLIO |
retail rent of approximately $103.49 per square foot on a gross equivalent basis. The appraiser concluded to a market rent of $55.00 per square foot on a gross basis for the community facility space, and $5,000 per licensed space for the parking garage, which equates to a rent of $18.07 per square foot of parking square footage.
The Borrowers. The borrowers are 808 Columbus Commercial Owner LLC, 775 Columbus LLC, 795 Columbus LLC, 805 Columbus LLC and 801 Amsterdam Commercial Owner LLC, all single purpose entities whose managing member has two independent directors. Legal counsel to the borrowers delivered a non-consolidation opinion in connection with the origination of the Columbus Square Portfolio Loan Combination. Jacob Chetrit and Laurence Gluck are the guarantors of certain nonrecourse carveouts under the Columbus Square Portfolio Loan Combination.
The Sponsors. The sponsors are Jacob Chetrit and Laurence Gluck. Jacob Chetrit is among the principals of The Chetrit Group. Founded by Joseph Chetrit, The Chetrit Group is a privately held real estate investment firm headquartered in Manhattan, with a portfolio of over 14.0 million square feet of commercial real estate in New York, Chicago, Miami, Los Angeles and other countries. Laurence Gluck is the founder and owner of Stellar Management, an owner-manager of over two million square feet of office space and apartments (approximately 12,000 units in 100 buildings) in New York City, Washington, D.C., San Francisco, and South Florida. Stellar Management has management teams based in New York, Washington, D.C. and San Francisco. Jacob Chetrit and Laurence Gluck have been involved in prior loan defaults, modifications and foreclosures, and Laurence Gluck is involved in ongoing litigation with a former business partner. See “Description of the Mortgage Pool – Litigation Considerations” and “Description of the Mortgage Pool—Statistical Characteristics of the Mortgage Loans—Default History, Bankruptcy Issues and Other Proceedings” in the Free Writing Prospectus.
Escrows. The loan documents provide for upfront reserves in the amount of $249,368 for real estate taxes and $6,177 for replacement reserves. The loan documents require monthly deposits of $77,575 for real estate taxes, $6,177 for replacement reserves (subject to a cap of $148,267) and monthly deposits beginning January 11, 2018 of $70,726 for tenant improvements and leasing commissions (subject to a cap of $4,500,000). The loan documents do not require monthly escrows for insurance provided (i) no event of default has occurred and is continuing; (ii) the insurance required to be maintained by the borrowers is maintained pursuant to one or more blanket insurance policies approved by the lender; (iii) the borrowers provide the lender with timely proof of payment of insurance premiums; and (iv) the borrowers provide evidence of renewal of insurance policies.
Lockbox and Cash Management. The Columbus Square Portfolio Loan Combination requires a lender-controlled lockbox account, which is already in place, and that the borrowers direct tenants to pay their rents directly into such lockbox account. The loan documents also require that all rents received by the borrowers or the property manager be deposited into the lockbox account within one business day of receipt. Funds are then swept into a cash management account controlled by the lender and prior to the occurrence of a Cash Trap Event Period (as defined below), all excess funds after application in accordance with the loan documents are distributed to the borrowers’ operating account. During a Cash Trap Event Period, all excess cash flow is retained in the cash management account.
A “Cash Trap Event Period” will commence upon the earlier of (i) the occurrence and continuance of an event of default or (ii) the net cash flow debt yield falling below 5.25% at the end of any calendar quarter. A Cash Trap Event Period will be cured, with regard to clause (i), upon the cure of such event of default; and with regard to clause (ii), upon the net cash flow debt yield being equal to or greater than 5.25% for two consecutive calendar quarters.
Property Management. The Columbus Square Portfolio Properties are managed by an affiliate of the borrowers.
Assumption. The borrowers have a two-time right to transfer the Columbus Square Portfolio Properties provided that certain conditions are satisfied, including (i) no event of default has occurred and is continuing; (ii) the lender reasonably determined that the proposed transferee and guarantor satisfy the lender’s credit review and underwriting standards, taking into consideration transferee’s experience, financial strength and general business standing; and (iii) the lender has received confirmation from Fitch, Moody’s and Morningstar that such assumption will not result in a downgrade, withdrawal or qualification of the respective ratings assigned to the Series 2014-C23 Certificates, and similar confirmations with respect to the ratings of any securities backed by the Columbus Square Portfolio Companion Loans.
Partial Release. See “Purchase Option” section.
Real Estate Substitution. Not permitted.
Subordinate and Mezzanine Indebtedness. Not permitted.
Purchase Option. A tenant at the 801 Amsterdam property, William F. Ryan (24,581 square feet; 5.0% of net rentable area) may exercise a purchase option on the tenant’s leased condominium unit (provided the tenant is not in default of the lease) at a purchase price of $19.8 million. In the event the purchase option is exercised (between January 2020 and January 2030), the borrowers must release the 801 Amsterdam property from the lien of the Columbus Square Portfolio Loan Combination mortgage with payment of a release price equal to $51.5 million, together with any applicable yield maintenance charges, subject to, among other things: (i) confirmation of compliance with zoning and subdivision requirements; (ii) confirmation from Fitch, Moody’s and Morningstar that such release will not result in a downgrade, withdrawal or qualification of the respective ratings assigned to the Series 2014-C23 Certificates, and similar confirmations with respect to the ratings of any securities backed by the Columbus Square Portfolio Companion Loans; and (iii) opinion of counsel that the REMIC trust will not fail to maintain its REMIC status due to the partial release.
Ground Lease. None.
THE INFORMATION IN THIS STRUCTURAL AND COLLATERAL TERM SHEET IS NOT COMPLETE AND MAY BE AMENDED PRIOR TO THE TIME OF SALE. THIS TERM SHEET IS NOT AN OFFER TO SELL THESE SECURITIES AND IT IS NOT A SOLICITATION OF AN OFFER TO BUY THESE SECURITIES IN ANY JURISDICTION WHERE THE OFFER OR SALE IS NOT PERMITTED.
57
| COLUMBUS SQUARE PORTFOLIO |
Terrorism Insurance. The loan documents require that the “all risk” insurance policy required to be maintained by the borrower provides coverage for terrorism in an amount equal to the full replacement cost of the Columbus Square Portfolio Properties. The loan documents also require business interruption insurance covering no less than the 18-month period following the occurrence of a casualty event, together with a 12-month extended period of indemnity.
THE INFORMATION IN THIS STRUCTURAL AND COLLATERAL TERM SHEET IS NOT COMPLETE AND MAY BE AMENDED PRIOR TO THE TIME OF SALE. THIS TERM SHEET IS NOT AN OFFER TO SELL THESE SECURITIES AND IT IS NOT A SOLICITATION OF AN OFFER TO BUY THESE SECURITIES IN ANY JURISDICTION WHERE THE OFFER OR SALE IS NOT PERMITTED.
58
(THIS PAGE INTENTIONALLY LEFT BLANK)
59
| DC METRO MIXED USE PORTFOLIO |
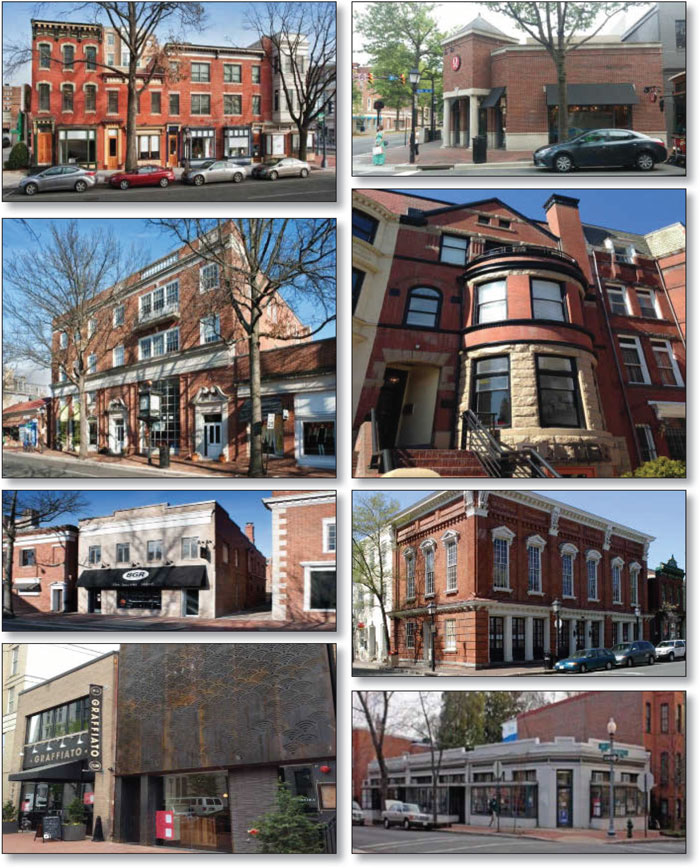
THE INFORMATION IN THIS STRUCTURAL AND COLLATERAL TERM SHEET IS NOT COMPLETE AND MAY BE AMENDED PRIOR TO THE TIME OF SALE. THIS TERM SHEET IS NOT AN OFFER TO SELL THESE SECURITIES AND IT IS NOT A SOLICITATION OF AN OFFER TO BUY THESE SECURITIES IN ANY JURISDICTION WHERE THE OFFER OR SALE IS NOT PERMITTED.
60
| DC METRO MIXED USE PORTFOLIO |
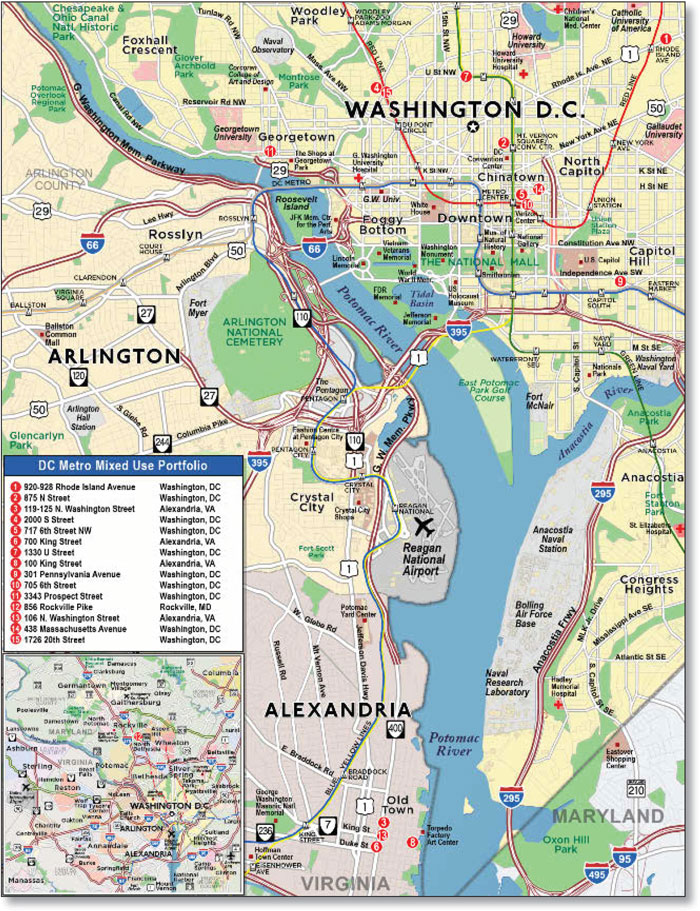
THE INFORMATION IN THIS STRUCTURAL AND COLLATERAL TERM SHEET IS NOT COMPLETE AND MAY BE AMENDED PRIOR TO THE TIME OF SALE. THIS TERM SHEET IS NOT AN OFFER TO SELL THESE SECURITIES AND IT IS NOT A SOLICITATION OF AN OFFER TO BUY THESE SECURITIES IN ANY JURISDICTION WHERE THE OFFER OR SALE IS NOT PERMITTED.
61
| No. 4 – DC Metro Mixed Use Portfolio | |||||||
| Loan Information | Property Information | ||||||
| Mortgage Loan Seller: | The Royal Bank of Scotland | Single Asset/Portfolio: | Portfolio | ||||
| Credit Assessment (Fitch/Moody’s/Morningstar): | NR/NR/NR | Property Type: | Various – See Table | ||||
| Original Principal Balance: | $63,487,500 | Specific Property Type: | Various – See Table | ||||
| Cut-off Date Principal Balance: | $63,487,500 | Location: | Various – See Table | ||||
| % of Initial Pool Balance: | 6.7% | Size(4): | 158,121 SF | ||||
| Loan Purpose: | Refinance | Cut-off Date Principal Balance Per SF: | $401.51 | ||||
| Borrower Names: | Various(1) | Year Built/Renovated: | Various – See Table | ||||
| Sponsor: | Douglas Development Corporation | Title Vesting: | Fee | ||||
| Mortgage Rate: | 4.500% | Property Manager: | Self-managed | ||||
| Note Date: | July 17, 2014 | 3rd Most Recent Occupancy (As of): | 83.9% (12/31/2011) | ||||
| Anticipated Repayment Date: | NAP | 2nd Most Recent Occupancy (As of): | 86.8% (12/31/2012) | ||||
| Maturity Date: | August 1, 2024 | Most Recent Occupancy (As of): | 78.9% (12/31/2013) | ||||
| IO Period: | 30 months | Current Occupancy (As of)(5): | 91.2% (4/1/2014) | ||||
| Loan Term (Original): | 120 months | ||||||
| Seasoning: | 1 month | Underwriting and Financial Information: | |||||
| Amortization Term (Original): | 360 months | ||||||
| Loan Amortization Type: | Interest-only, Amortizing Balloon | 3rd Most Recent NOI (As of): | $3,609,617 (12/31/2012) | ||||
| Interest Accrual Method: | Actual/360 | 2nd Most Recent NOI (As of): | $3,617,879 (12/31/2013) | ||||
| Call Protection: | L(25),D(89),O(6) | Most Recent NOI (As of): | $3,400,381 (TTM 3/31/2014) | ||||
| Lockbox Type: | Hard/Springing Cash Management | ||||||
Additional Debt(2): | Yes | U/W Revenues: | $6,393,399 | ||||
Additional Debt Type(2): | Future Mezzanine | U/W Expenses: | $1,229,280 | ||||
U/W NOI(6): | $5,164,118 | ||||||
Escrows and Reserves(3): | U/W NCF(6): | $4,900,730 | |||||
| U/W NOI DSCR: | 1.34x | ||||||
| Type: | Initial | Monthly | Cap (If Any) | U/W NCF DSCR: | 1.27x | ||
| Taxes | $246,626 | $49,325 | NAP | U/W NOI Debt Yield: | 8.1% | ||
| Insurance | $5,513 | Springing | NAP | U/W NCF Debt Yield: | 7.7% | ||
| Replacement Reserves | $3,294 | $3,294 | NAP | As-Is Appraised Value(7): | $84,650,000 | ||
| TI/LC Reserves | $3,539,451 | $13,836 | NAP | As-Is Appraisal Valuation Dates: | Various(7) | ||
| Deferred Maintenance | $118,188 | $0 | NAP | Cut-off Date LTV Ratio(7): | 75.0% | ||
| Free Rent Reserve | $934,922 | $0 | NAP | LTV Ratio at Maturity or ARD(7): | 64.8% | ||
| (1) | See “The Borrower” section. |
| (2) | See “Subordinate and Mezzanine Indebtedness” section. |
| (3) | See “Escrows” section. |
| (4) | The total square footage includes 80,742 square feet of office space, 64,293 square feet of retail space and 17 multifamily units totaling 13,086 square feet. |
| (5) | See “Historical Occupancy” section. |
| (6) | See “Cash Flow Analysis” section. |
| (7) | The appraiser concluded to an “as-completed” appraised value for four of the DC Metro Mixed Use Portfolio Properties (119-125 N. Washington; 717 6th Street; 700 King Street; and 100 King Street), based on the expected completion of new-tenant build-outs, the costs of which were reserved for at closing. The As-Is Appraised Value, Cut-off Date LTV Ratio and LTV Ratio at Maturity shown are based on the aggregate of the “as-completed” appraised values of the four properties and the “as-is” appraised values for the rest of the DC Metro Mixed Use Portfolio Properties. See “Appraisal” section. |
The Mortgage Loan. The mortgage loan (the “DC Metro Mixed Use Portfolio Mortgage Loan”) is evidenced by a single promissory note that is secured by first mortgages encumbering 15 mixed use, office, retail and multifamily properties located in Washington, D.C., Virginia and Maryland (the “DC Metro Mixed Use Portfolio Properties”). The DC Metro Mixed Use Portfolio Mortgage Loan was originated on July 17, 2014 by The Royal Bank of Scotland. The DC Metro Mixed Use Portfolio Mortgage Loan had an original principal balance of $63,487,500, has an outstanding principal balance as of the Cut-off Date of $63,487,500 and accrues interest at an interest rate of 4.500% per annum. The DC Metro Mixed Use Portfolio Mortgage Loan had an initial term of 120 months, has a remaining term of 119 months as of the Cut-off Date and requires interest-only payments for the first 30 payments following origination and, thereafter, requires payments of principal and interest based on a 30-year amortization schedule. The DC Metro Mixed Use Portfolio Mortgage Loan matures on August 1, 2024.
Following the lockout period, the borrowers have the right to defease the DC Metro Mixed Use Portfolio Mortgage Loan in whole, or in part (see “Partial Release” section), on any date before March 1, 2024. In addition, the DC Metro Mixed Use Portfolio Mortgage Loan is prepayable without penalty on or after March 1, 2024.
THE INFORMATION IN THIS STRUCTURAL AND COLLATERAL TERM SHEET IS NOT COMPLETE AND MAY BE AMENDED PRIOR TO THE TIME OF SALE. THIS TERM SHEET IS NOT AN OFFER TO SELL THESE SECURITIES AND IT IS NOT A SOLICITATION OF AN OFFER TO BUY THESE SECURITIES IN ANY JURISDICTION WHERE THE OFFER OR SALE IS NOT PERMITTED.
62
| DC METRO MIXED USE PORTFOLIO |
Sources and Uses
| Sources | Uses | ||||||||
| Original loan amount | $63,487,500 | 100.0% | Loan payoff | $35,013,255 | 55.1 | % | |||
| Reserves | 4,847,994 | 7.6 | |||||||
| Closing costs | 1,780,822 | 2.8 | |||||||
| Return of equity | 21,845,429 | 34.4 | |||||||
| Total Sources | $63,487,500 | 100.0% | Total Uses | $63,487,500 | 100.0 | % |
The Properties. The DC Metro Mixed Use Portfolio Mortgage Loan is secured by the fee interests in 15 properties totaling 158,121 square feet located in Washington D.C. (10 properties), downtown Alexandria, Virginia (four properties) and Rockville, Montgomery County, Maryland (one property). The DC Metro Mixed Use Portfolio Properties were built between 1871 and 2013 and comprise 80,742 square feet of office space (51.1% of net rentable area), 64,293 square feet of retail space (40.7% of net rentable area), and 17 multifamily units totaling 13,086 square feet (8.3% of net rentable area) which are located above ground floor retail space. Six of the 15 properties are single-tenant and the remaining nine properties are multi-tenant. The 920-928 Rhode Island Avenue property was recently expanded by 20,637 square feet to 40,746 square feet and is 100% leased to the District of Columbia (“D.C.”), which utilizes the space for the D.C. court systems and the Department of Human Services. As of April 1, 2014, the DC Metro Mixed Use Portfolio Properties were collectively 91.2% leased to commercial and multifamily tenants, including a diverse mix of office and retail tenants representing various industries including: government, medical, non-profit, technology, and service sectors.
The following table presents certain information relating to the DC Metro Mixed Use Portfolio Properties:
| Property Name – Location | Property Type | Allocated Cut-off Date Principal Balance | % of Portfolio Cut-off Date Principal Balance | Occupancy | Year Built/ Renovated | Net Rentable Area (SF) | Appraised Value(1) | ||||||||||||
| 920-928 Rhode Island Avenue – Washington, DC | Office | 17,400,000 | 27.4 | % | 100.0 | % | 1927/2014 | 40,746 | $23,200,000 | ||||||||||
| 875 N Street – Washington, DC | Mixed Use | 8,925,000 | 14.1 | % | 96.1 | % | 1888/2007 | 27,354 | $11,900,000 | ||||||||||
| 119-125 N. Washington Street – Alexandria, VA | Mixed Use | 5,850,000 | 9.2 | % | 50.3 | % | 1950/1998 | 25,738 | $7,800,000 | ||||||||||
| 2000 S Street – Washington, DC | Office | 4,125,000 | 6.5 | % | 100.0 | % | 1890/1990 | 10,800 | $5,500,000 | ||||||||||
| 717 6th Street NW – Washington, DC | Retail | 3,900,000 | 6.1 | % | 100.0 | % | 1928/2014 | 7,650 | $5,200,000 | ||||||||||
| 700 King Street – Alexandria, VA | Mixed Use | 3,412,500 | 5.4 | % | 100.0 | % | 1940/NAP | 4,584 | $4,550,000 | ||||||||||
| 1330 U Street – Washington, DC | Mixed Use | 3,225,000 | 5.1 | % | 100.0 | % | 1900/NAP | 7,570 | $4,300,000 | ||||||||||
| 100 King Street – Alexandria, VA | Retail | 3,225,000 | 5.1 | % | 100.0 | % | 1871/NAP | 6,482 | $4,300,000 | ||||||||||
| 301 Pennsylvania Avenue – Washington, DC | Retail | 2,925,000 | 4.6 | % | 100.0 | % | 1925/2014 | 4,300 | $3,900,000 | ||||||||||
| 705 6th Street – Washington, DC | Retail | 2,250,000 | 3.5 | % | 100.0 | % | 2013/NAP | 4,200 | $3,000,000 | ||||||||||
| 3343 Prospect Street – Washington, DC | Retail | 2,175,000 | 3.4 | % | 100.0 | % | 1923/2014 | 3,337 | $2,900,000 | ||||||||||
| 856 Rockville Pike – Rockville, MD | Retail | 1,800,000 | 2.8 | % | 100.0 | % | 1970/NAP | 4,795 | $2,400,000 | ||||||||||
| 106 N. Washington Street – Alexandria, VA | Retail | 1,575,000 | 2.5 | % | 100.0 | % | 1928/NAP | 3,935 | $2,100,000 | ||||||||||
| 438 Massachusetts Avenue – Washington, DC | Retail | 1,575,000 | 2.5 | % | 100.0 | % | 1900/2011 | 3,619 | $2,100,000 | ||||||||||
| 1726 20th Street – Washington, DC | Office | 1,125,000 | 1.8 | % | 100.0 | % | 1900/NAP | 3,011 | $1,500,000 | ||||||||||
| Total/Weighted Average | $63,487,500 | 100.0 | % | 91.2 | % | 158,121 | $84,650,000 | ||||||||||||
| (1) | See “Appraisal” section. |
THE INFORMATION IN THIS STRUCTURAL AND COLLATERAL TERM SHEET IS NOT COMPLETE AND MAY BE AMENDED PRIOR TO THE TIME OF SALE. THIS TERM SHEET IS NOT AN OFFER TO SELL THESE SECURITIES AND IT IS NOT A SOLICITATION OF AN OFFER TO BUY THESE SECURITIES IN ANY JURISDICTION WHERE THE OFFER OR SALE IS NOT PERMITTED.
63
| DC METRO MIXED USE PORTFOLIO |
The following table presents certain information relating to the tenancies at the DC Metro Mixed Use Portfolio Properties:
Major Tenants
| Tenant Name | Credit Rating (Fitch/Moody’s/ S&P)(1) | Tenant NRSF | % of NRSF | Annual U/W Base Rent PSF(2) | Annual U/W Base Rent(2) | % of Total Annual U/W Base Rent | Lease Expiration Date | ||||||||||
| Major Tenants | |||||||||||||||||
| District of Columbia | NR/Aa2/AA- | 40,746 | 28.1 | % | $37.23 | $1,517,127 | 29.3 | % | Various(3) | ||||||||
| ROOFTOPDC, LLC | NR/NR/NR | 7,650 | 5.3 | % | $42.48 | $325,000 | 6.3 | % | 8/1/2024 | ||||||||
| HUGE, LLC | NR/NR/NR | 6,850 | 4.7 | % | $43.05 | $294,893 | 5.7 | % | 6/1/2017(4) | ||||||||
| Lululemon USA, Inc. | NR/NR/NR | 3,450 | 2.4 | % | $81.16 | $280,000 | 5.4 | % | 9/30/2019 | ||||||||
| Carluccio’s | 6,482 | 4.5 | % | $42.43 | $275,000 | 5.3 | % | 1/31/2026 | |||||||||
| Total Major Tenants | 65,178 | 44.9 | % | $41.30 | $2,692,020 | 52.1 | % | ||||||||||
Non-Major Tenants(5) | 66,004 | 45.5 | % | $37.57 | $2,479,761 | 47.9 | % | ||||||||||
Occupied Collateral Total(5)(6) | 131,182 | 90.4 | % | $39.42 | $5,171,781 | 100.0 | % | ||||||||||
Vacant Space(4) | 13,853 | 9.6 | % | ||||||||||||||
Collateral Total(4) | 145,035 | 100.0 | % | ||||||||||||||
| (1) | Certain ratings are those of the parent company whether or not the parent guarantees the lease. |
| (2) | Annual U/W Base Rent PSF and Annual U/W Base Rent include contractual rent steps through April 2015. |
| (3) | District of Columbia has two leases at the DC Metro Mixed Use Portfolio Properties: 20,109 square feet expiring on November 30, 2017; and 20,637 square feet expiring on January 31, 2025. |
| (4) | HUGE, LLC has a one-time right to terminate its lease as of January 1, 2016 with 210 days’ notice. |
| (5) | Excludes 17 multifamily leases totaling 13,086 of net rentable area and $360,981 of underwritten base rent, which, when included in Occupied Collateral Total would increase occupancy to 91.2% on a PSF basis. |
| (6) | Some tenants have signed leases but are still in the build-out phase or free rent period. |
The following table presents certain information relating to the unit mix of the multifamily portion of the DC Metro Mixed Use Portfolio Properties:
Unit Mix Summary(1)
| Unit Type | No. of Units | % of Total Units | Total SF | Average Unit Size (SF) | Average U/W Monthly Rent per Unit | |||||
| Studio | 13 | 76.5% | 9,518 | 732 | $1,660 | |||||
| 1 Bedroom/1 Bath | 4 | 23.5% | 3,568 | 892 | $2,127 | |||||
| Total/Weighted Average | 17 | 100.0% | 13,086 | 776 | $1,787 | |||||
| (1) | Information obtained from the underwritten rent roll. |
THE INFORMATION IN THIS STRUCTURAL AND COLLATERAL TERM SHEET IS NOT COMPLETE AND MAY BE AMENDED PRIOR TO THE TIME OF SALE. THIS TERM SHEET IS NOT AN OFFER TO SELL THESE SECURITIES AND IT IS NOT A SOLICITATION OF AN OFFER TO BUY THESE SECURITIES IN ANY JURISDICTION WHERE THE OFFER OR SALE IS NOT PERMITTED.
64
| DC METRO MIXED USE PORTFOLIO |
The following table presents certain information relating to the lease rollover schedule at the DC Metro Mixed Use Portfolio Properties:
Lease Expiration Schedule(1)(2)
Year Ending December 31, | No. of Leases Expiring | Expiring NRSF | % of Total NRSF | Cumulative Expiring NRSF | Cumulative % of Total NRSF | Annual U/W Base Rent | Annual U/W Base Rent PSF(3) | ||||||
| MTM | 0 | 0 | 0% | 0 | 0% | $0 | $0 | ||||||
| 2014 | 2 | 4,200 | 2.9% | 4,200 | 2.9% | $94,543 | $22.51 | ||||||
| 2015 | 0 | 0 | 0.0% | 4,200 | 2.9% | $0 | $0.00 | ||||||
| 2016 | 0 | 0 | 0.0% | 4,200 | 2.9% | $0 | $0.00 | ||||||
| 2017 | 9 | 39,215 | 27.0% | 43,415 | 29.9% | $1,510,283 | $38.51 | ||||||
| 2018 | 0 | 0 | 0.0% | 43,415 | 29.9% | $0 | $0.00 | ||||||
| 2019 | 4 | 12,390 | 8.5% | 55,805 | 38.5% | $586,687 | $47.35 | ||||||
| 2020 | 5 | 17,302 | 11.9% | 73,107 | 50.4% | $639,455 | $36.96 | ||||||
| 2021 | 0 | 0 | 0.0% | 73,107 | 50.4% | $0 | $0.00 | ||||||
| 2022 | 1 | 3,619 | 2.5% | 76,726 | 52.9% | $140,302 | $38.77 | ||||||
| 2023 | 2 | 7,570 | 5.2% | 84,296 | 58.1% | $381,873 | $50.45 | ||||||
| 2024 | 4 | 19,767 | 13.6% | 104,063 | 71.8% | $820,018 | $41.48 | ||||||
| Thereafter | 2 | 27,119 | 18.7% | 131,182 | 90.4% | $998,620 | $36.82 | ||||||
| Vacant | 0 | 13,853 | 9.6% | 145,035 | 100.0% | $0 | $0.00 | ||||||
| Total/Weighted Average | 29 | 145,035 | 100.0% | $5,171,781 | $39.42 | ||||||||
| (1) | Information obtained from the underwritten rent roll and excludes 17 multifamily leases totaling 13,086 of net rentable area and $360,981 of underwritten base rent. |
| (2) | Certain tenants may have lease termination options that are exercisable prior to the originally stated expiration date of the subject lease and that are not considered in the Lease Expiration Schedule. |
| (3) | Weighted Average Annual U/W Base Rent PSF excludes vacant space. |
The following table presents historical occupancy percentages at the DC Metro Mixed Use Portfolio Properties:
Historical Occupancy
12/31/2011(1) | 12/31/2012(1) | 12/31/2013(1) | 4/1/2014(2)(3) | |||
| 83.9% | 86.8% | 78.9% | 91.2% |
| (1) | Information obtained from the borrower. |
| (2) | Information obtained from the underwritten rent roll. |
| (3) | Current occupancy is higher than historicals partially due to seven new leases totaling 47,537 square feet (30.1% of the net rentable area), including the 20,637 square foot expansion at the 920-928 Rhode Island Avenue Property and construction of the 705 6th Street property. |
Operating History and Underwritten Net Cash Flow. The following table presents certain information relating to the historical operating performance and the Underwritten Net Cash Flow at the DC Metro Mixed Use Portfolio Properties:
Cash Flow Analysis
2012(1) | 2013(1) | TTM 3/31/2014(1) | U/W(1) | U/W $ per SF | |||||||
| Base Rent | $4,435,272 | $4,527,640 | $4,376,330 | $5,532,762(2) | $34.99 | ||||||
| Grossed Up Vacant Space | 0 | 0 | 0 | 332,558 | 2.10 | ||||||
| Free Rent/Abatement | (98,795) | (97,961) | (97,542) | 0 | 0.00 | ||||||
| Total Reimbursables | 405,269 | 430,959 | 417,412 | 806,382 | 5.10 | ||||||
| Other Income | 123,534 | 117,275 | 104,690 | 104,690 | 0.66 | ||||||
| Less Vacancy & Credit Loss | (152,696) | (170,864) | (210,436) | (382,993)(3) | (2.42) | ||||||
| Effective Gross Income | $4,712,584 | $4,807,049 | $4,590,454 | $6,393,399 | $40.43 | ||||||
| Total Operating Expenses | 1,102,967 | $1,189,170 | $1,190,073 | $1,229,280 | $7.77 | ||||||
| Net Operating Income | $3,609,617 | $3,617,879 | $3,400,381 | $5,164,118 | $32.66 | ||||||
| TI/LC | 0 | 0 | 0 | 227,698 | 1.44 | ||||||
| Replacement Reserves | 0 | 0 | 0 | 35,690 | 0.23 | ||||||
| Net Cash Flow | $3,609,617 | $3,617,879 | $3,400,381 | $4,900,730 | $30.99 | ||||||
| NOI DSCR | 0.94x | 0.94x | 0.88x | 1.34x | |||||||
| NCF DSCR | 0.94x | 0.94x | 0.88x | 1.27x | |||||||
| NOI DY | 5.7% | 5.7% | 5.4% | 8.1% | |||||||
| NCF DY | 5.7% | 5.7% | 5.4% | 7.7% |
| (1) | U/W NOI is higher than 2012, 2013 and TTM 3/31/2014 NOI partially due to the 20,637 square foot expansion of the 920-928 Rhode Island Property and the 705 6th Street property which was constructed in 2013 and not reflected in the historical operating statements. |
| (2) | U/W Base Rent is comprised of $5,171,781 associated with retail/office tenants and $360,981 associated with multifamily tenants. |
| (3) | The underwritten economic vacancy is 5.7%. The DC Metro Mixed Use Portfolio Properties were 91.2% leased as of April 1, 2014. |
THE INFORMATION IN THIS STRUCTURAL AND COLLATERAL TERM SHEET IS NOT COMPLETE AND MAY BE AMENDED PRIOR TO THE TIME OF SALE. THIS TERM SHEET IS NOT AN OFFER TO SELL THESE SECURITIES AND IT IS NOT A SOLICITATION OF AN OFFER TO BUY THESE SECURITIES IN ANY JURISDICTION WHERE THE OFFER OR SALE IS NOT PERMITTED.
65
| DC METRO MIXED USE PORTFOLIO |
Appraisal. As of the appraisal valuation dates ranging from May 15, 2014 to August 1, 2014 the DC Metro Mixed Use Portfolio Properties had an aggregate “as-is” appraised value of $84,650,000. The appraiser concluded to an “as-completed” appraised value for four of the DC Metro Mixed Use Portfolio Properties (119-125 N. Washington; 717 6th Street; 700 King Street; and 100 King Street), based on improvements resulting from the completion of new-tenant build-outs, which costs were reserved for at closing.
Environmental Matters. According to the Phase I environmental site assessments dated from May 19, 2014 to June 10, 2014, there was no evidence of any recognized environmental conditions (“RECs”) at 12 of the 15 DC Metro Mixed Use Portfolio Properties. Three of the DC Metro Mixed Use Portfolio Properties were identified as having a REC: 920-928 Rhode Island Avenue (due to historical use as a dry cleaner and listing on a regulatory database as an underground storage tank site), 3343 Prospect Street (due to historical use as a dry cleaner) and 717 6th Street NW (due to historical use as a printing company and listing on a regulatory database as an underground storage tank site). According to the Phase II environmental site assessments dated from June 25, 2014 to June 30, 2014, no further action was recommended.
Market Overview. The DC Metro Mixed Use Portfolio Properties are located in Washington, D.C., Virginia and Maryland. Ten properties totaling 112,587 square feet are located in Washington D.C.; four properties totaling 40,739 square feet are located in Alexandria, Virginia; and the remaining property totaling 4,795 square feet is located in Rockville, Maryland. Each of the DC metro Mixed Use Portfolio Properties are located in the Washington, D.C. metropolitan statistical area (“MSA”), one of the largest metropolitan areas in the nation. The Washington, D.C. MSA benefits from the stability of the Federal Government, a diverse economic base and expansive public transportation systems.
Washington, D.C.
The Washington, D.C. office market is comprised of approximately 296 million square feet of office space, and as of the first quarter of 2014, demonstrated strong leasing activity with 1.7 million square feet in renewals, representing a 7.0% increase from the previous quarter. According to the appraisal, the Washington, D.C. office market reported a vacancy rate of 17.8% and average asking rent of $36.46 per square foot. According to the appraisal, the Washington, D.C. retail market contains approximately 22 million square feet of retail space, and has reported vacancy rates under 5.0% for six out of the last eight calendar years. The Washington, D.C. retail market benefits from its abundance of wealthy household and disposable income, and has over 20 million annual visitors with spending in excess of $6.1 billion dollars. According to a third party market research report, the majority of submarkets within the Washington D.C. MSA apartment market posted annual vacancy gains over the trailing 12 months as of the second quarter of 2014. The Northwest D.C. apartment submarket reported a vacancy rate of 5.2% and an average effective rent of $1,994 per month, as of the second quarter of 2014.
Suburban Virginia
The City of Alexandria is situated in suburban Virginia, west of the Potomac River, approximately five miles south of the Washington, D.C. MSA, and according to the appraisal, 2013 retail sales in the City of Alexandria totaled $3.61 billion. According to the appraisal, the Suburban Virginia Retail market contains approximately 39.8 million square feet of space, and as of the first quarter of 2014, had a reported vacancy rate of 5.9% and an average asking rate of $27.93 per square foot. According to the appraisal, the City of Alexandria is located within the Northern Virginia office market, which comprises 15 submarkets and 131.8 million square feet of office space. As of the first quarter of 2014, the Northern Virginia office market reported a vacancy rate of 19.8% and average asking rent of $33.00 per square foot, up 4.2% from the first quarter of 2013.
Suburban Maryland
According to the appraisal, as of the first quarter of 2014, the Suburban Maryland Retail market demonstrated positive trends over the trailing year, mainly as a result of declining vacancy levels. As of the first quarter of 2014, the Suburban Maryland Retail market contained approximately 33.2 million square feet of space, and had a reported vacancy rate of 8.4% and an average asking rate of $25.60 per square foot.
The Borrower. The borrower comprises 15 single purpose entities with two independent directors each. Legal counsel to the borrower delivered a non-consolidation opinion in connection with the origination of the DC Metro Mixed Use Portfolio Mortgage Loan. Norman Jemal is the guarantor of certain nonrecourse carveouts under the DC Metro Mixed Use Portfolio Mortgage Loan.
The Sponsor. The loan sponsor is Douglas Development Corporation. Douglas Development Corporation is a diversified real estate organization headquartered in Washington, D.C., involved in the ownership, management, development and redevelopment of numerous properties. The Douglas Development Corporation owns nearly nine million square feet of commercial real estate throughout Washington, D.C. and the surrounding suburbs. Norman Jemal is the founder and president of Douglas Development Corporation and is the non-recourse carve-out guarantor of the DC Metro Mixed Use Portfolio Mortgage Loan. See “Description of the Mortgage Loans—Litigation Considerations” and “Description of the Mortgage Pool—Statistical Characteristics of the Mortgage Loans—Default History, Prior Bankruptcy Issues and Other Proceedings” in the Free Writing Prospectus.
Escrows. The loan documents provide for upfront escrows in the amount of $118,188 for deferred maintenance, $246,626 for real estate taxes, $5,513 for insurance, $3,294 for replacement reserves, $3,539,451 for tenant improvements and leasing commissions (“TI/LCs”), of which, $3,525,616 is owed to tenants under recently executed leases and $934,922 for free rent reserves. The loan documents provide for monthly escrows in the amount of $49,325 for real estate taxes, $3,294 for replacement reserves, and $13,836 for TI/LCs. The loan documents do not require monthly escrows for insurance provided (i) no event of default has occurred and is continuing; and (ii) the borrower provides the lender with timely proof of payment of insurance premiums.
Lockbox and Cash Management. The DC Metro Mixed Use Portfolio Mortgage Loan requires a lender-controlled lockbox account for each property, which are already in place, and that the borrower direct non-residential tenants to deposit all rents directly into the lockbox accounts. In addition the borrower and the property manager are required to deposit all rents received into the lockbox account within one business day of receipt. Prior to the occurrence of a Cash Management Period (as defined below), all funds on
THE INFORMATION IN THIS STRUCTURAL AND COLLATERAL TERM SHEET IS NOT COMPLETE AND MAY BE AMENDED PRIOR TO THE TIME OF SALE. THIS TERM SHEET IS NOT AN OFFER TO SELL THESE SECURITIES AND IT IS NOT A SOLICITATION OF AN OFFER TO BUY THESE SECURITIES IN ANY JURISDICTION WHERE THE OFFER OR SALE IS NOT PERMITTED.
66
| DC METRO MIXED USE PORTFOLIO |
deposit in the lockbox account will be released to the borrower’s account on a daily basis. During a Cash Management Period, funds on deposit in the lockbox account will be swept on a daily basis into a lender controlled cash management account.
A “Cash Management Period” will commence upon the earlier of: (i) the occurrence and continuance of an event of default; and (ii) the amortizing debt service coverage ratio falling below 1.10x as of the end of any calendar quarter. A Cash Management Period will end with respect to clause (i), when such event of default has been cured; and with respect to clause (ii), upon the achievement of an amortizing debt service coverage ratio of 1.10x as of the end of any calendar quarter.
Property Management. The DC Metro Mixed Use Portfolio Properties are managed by an affiliate of the borrower.
Assumption. The borrower has the right to transfer all, but not less than all, of the DC Metro Mixed Use Portfolio Properties, provided that no event of default has occurred and is continuing and certain other conditions are satisfied, including: (i) the proposed transferee, the property manager and management agreement are satisfactory to the lender and Fitch, Moody’s and Morningstar; (ii) execution of a recourse guaranty (which includes an environmental indemnity) by an affiliate of the transferee; and (iii) rating agency confirmation from Fitch, Moody’s and Morningstar that the transfer will not result in a downgrade, withdrawal or qualification of the respective ratings assigned to the Series 2014-C23 Certificates.
Partial Release. On any payment date after September 1, 2016, the borrower may obtain the release of an individual property from the lien of the DC Metro Mixed Use Portfolio Mortgage Loan (and the related loan documents) in connection with a partial defeasance upon the satisfaction of certain conditions including but not limited to: (i) no event of default has occurred or is continuing at the time of the release; (ii) the borrower has delivered defeasance collateral in an amount equal to the greater of 100% of the net sales proceeds or 115% of the allocated loan amount for the property to be released; (iii) after such release, the amortizing debt service coverage ratio of the remaining properties must not be less than (x) 1.50x or (y) if the debt service coverage ratio is less than 1.50x, the greater of (a) the amortizing debt service coverage ratio immediately preceding such release and (b) 1.20x; (iv) receipt of rating agency confirmation from Fitch, Moody’s and Morningstar that the release will not result in a downgrade, withdrawal or qualification of the respective ratings assigned to the Series 2014-C23 Certificates; and (v) delivery of a legal opinion to the lender to demonstrate that the release will satisfy REMIC requirements.
Real Estate Substitution. Not permitted.
Subordinate and Mezzanine Indebtedness. There is no existing mezzanine debt in place related to the DC Metro Mixed Use Portfolio Properties; however the borrower has the right to incur mezzanine financing subject to the satisfaction of certain conditions including (i) the combined loan-to-value ratio is not greater than 80.0%; (ii) the execution of an intercreditor agreement in form and substance acceptable to Fitch, Moody’s and Morningstar and reasonably acceptable to the lender; (iii) the combined amortizing debt service coverage ratio is not less than 1.10x; and (iv) receipt of rating agency confirmation from Fitch, Moody’s and Morningstar that the mezzanine financing will not result in a downgrade, withdrawal or qualification of the respective ratings assigned to the Series 2014-C23 Certificates.
Ground Lease. None.
Terrorism Insurance. The loan documents require that the “all risk” insurance policy required to be maintained by the borrower provide coverage for terrorism in an amount equal to the full replacement cost of the DC Metro Mixed Use Portfolio Properties. The loan documents also require business interruption insurance covering no less than the 18-month period following the occurrence of a casualty event, together with a six-month extended period of indemnity.
THE INFORMATION IN THIS STRUCTURAL AND COLLATERAL TERM SHEET IS NOT COMPLETE AND MAY BE AMENDED PRIOR TO THE TIME OF SALE. THIS TERM SHEET IS NOT AN OFFER TO SELL THESE SECURITIES AND IT IS NOT A SOLICITATION OF AN OFFER TO BUY THESE SECURITIES IN ANY JURISDICTION WHERE THE OFFER OR SALE IS NOT PERMITTED.
67
| CENTENNIAL CENTER & TWO CENTURY CENTER |
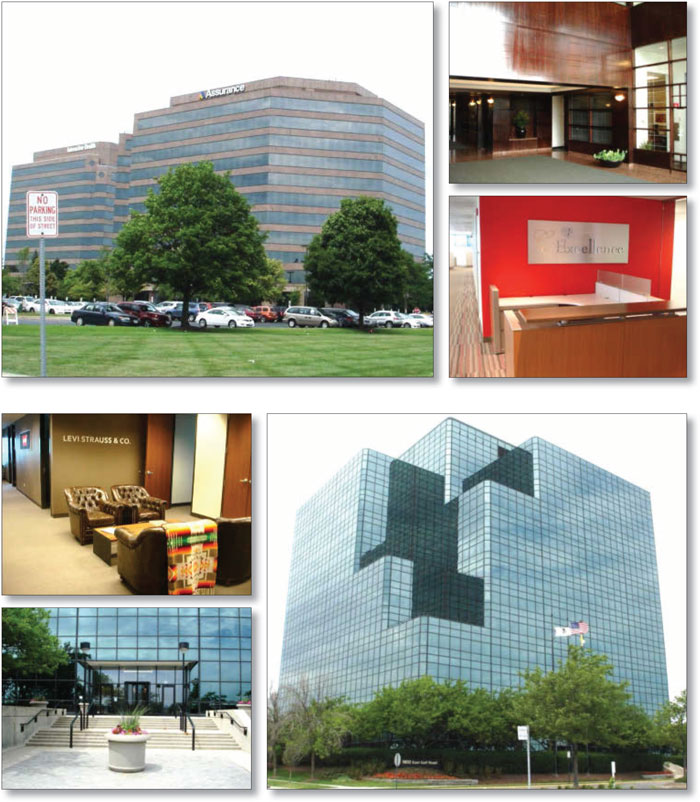
THE INFORMATION IN THIS STRUCTURAL AND COLLATERAL TERM SHEET IS NOT COMPLETE AND MAY BE AMENDED PRIOR TO THE TIME OF SALE. THIS TERM SHEET IS NOT AN OFFER TO SELL THESE SECURITIES AND IT IS NOT A SOLICITATION OF AN OFFER TO BUY THESE SECURITIES IN ANY JURISDICTION WHERE THE OFFER OR SALE IS NOT PERMITTED.
68
| CENTENNIAL CENTER & TWO CENTURY CENTER |
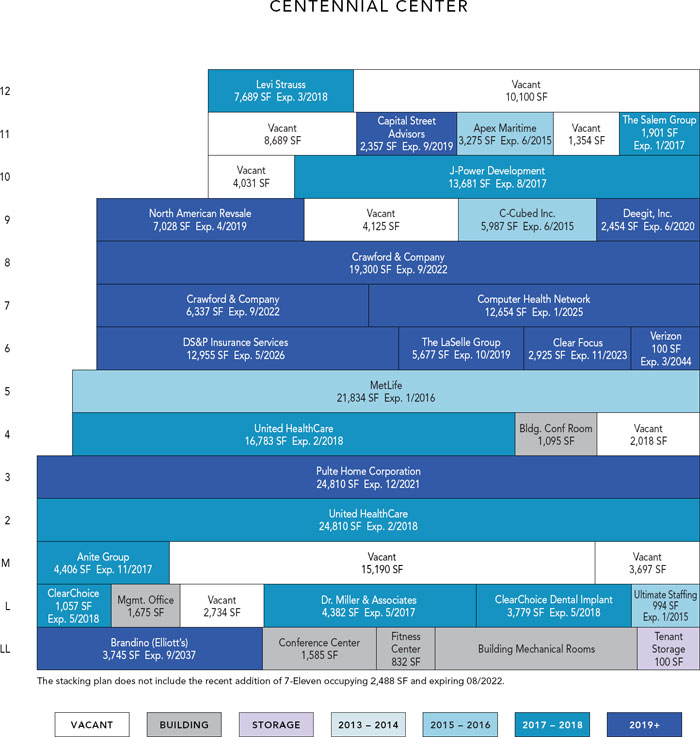
THE INFORMATION IN THIS STRUCTURAL AND COLLATERAL TERM SHEET IS NOT COMPLETE AND MAY BE AMENDED PRIOR TO THE TIME OF SALE. THIS TERM SHEET IS NOT AN OFFER TO SELL THESE SECURITIES AND IT IS NOT A SOLICITATION OF AN OFFER TO BUY THESE SECURITIES IN ANY JURISDICTION WHERE THE OFFER OR SALE IS NOT PERMITTED.
69
| CENTENNIAL CENTER & TWO CENTURY CENTER |
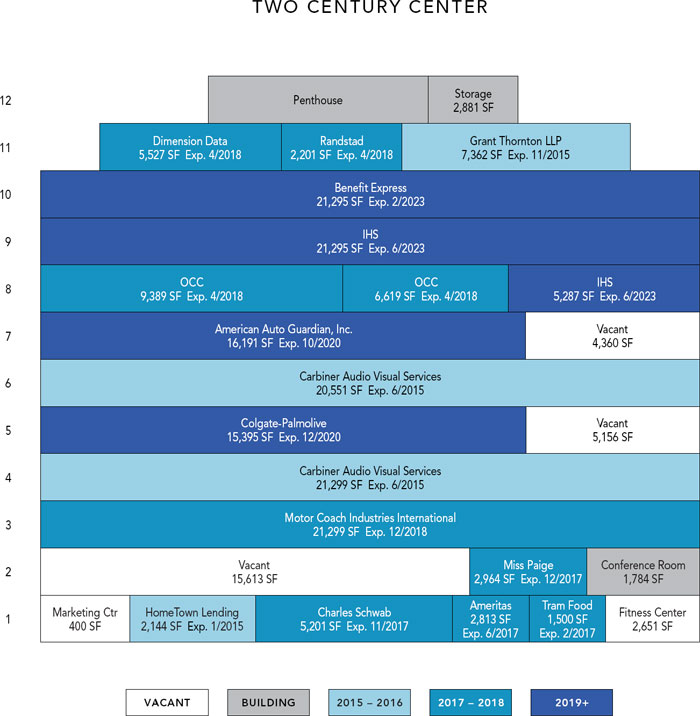
THE INFORMATION IN THIS STRUCTURAL AND COLLATERAL TERM SHEET IS NOT COMPLETE AND MAY BE AMENDED PRIOR TO THE TIME OF SALE. THIS TERM SHEET IS NOT AN OFFER TO SELL THESE SECURITIES AND IT IS NOT A SOLICITATION OF AN OFFER TO BUY THESE SECURITIES IN ANY JURISDICTION WHERE THE OFFER OR SALE IS NOT PERMITTED.
70
| CENTENNIAL CENTER & TWO CENTURY CENTER |
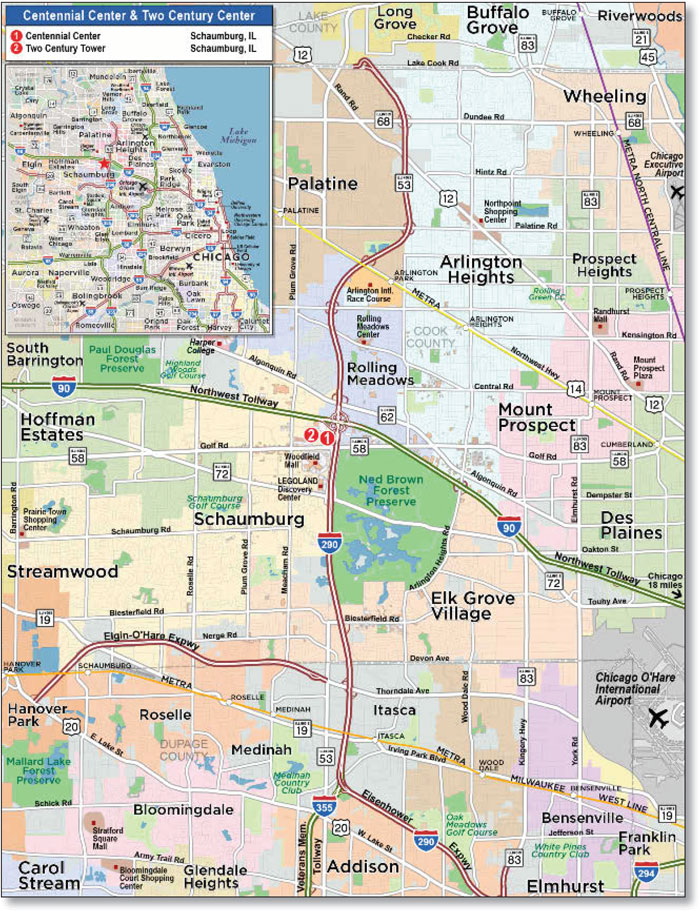
THE INFORMATION IN THIS STRUCTURAL AND COLLATERAL TERM SHEET IS NOT COMPLETE AND MAY BE AMENDED PRIOR TO THE TIME OF SALE. THIS TERM SHEET IS NOT AN OFFER TO SELL THESE SECURITIES AND IT IS NOT A SOLICITATION OF AN OFFER TO BUY THESE SECURITIES IN ANY JURISDICTION WHERE THE OFFER OR SALE IS NOT PERMITTED.
71
| No. 5 – Centennial Center & Two Century Center | |||||||
| Loan Information | Property Information | ||||||
| Mortgage Loan Seller: | Liberty Island Group I LLC | Single Asset/Portfolio: | Single Asset | ||||
Credit Assessment (Fitch/Moody’s/Morningstar): | NR/NR/NR | Property Type: | Office | ||||
| Original Principal Balance: | $42,500,000 | Specific Property Type: | Suburban | ||||
| Cut-off Date Principal Balance: | $42,500,000 | Location: | Schaumburg, IL | ||||
| % of Initial Pool Balance: | 4.5% | Size: | 493,428 SF | ||||
| Loan Purpose: | Refinance | Cut-off Date Principal Balance Per SF: | $86.13 | ||||
| Borrower Names: | Two Century, LLC; Centennial Center, LLC | Year Built/Renovated(2): | Various/NAP | ||||
| Sponsor: | Cyrus Sakhai | Title Vesting: | Fee | ||||
| Mortgage Rate: | 4.600% | Property Manager: | Transwestern Commercial Services Illinois, L.L.C. | ||||
| Note Date: | August 8, 2014 | 3rd Most Recent Occupancy (As of): | 75.0% (12/31/2011) | ||||
| Anticipated Repayment Date: | NAP | 2nd Most Recent Occupancy (As of): | 91.0% (12/31/2012) | ||||
| Maturity Date: | September 1, 2024 | Most Recent Occupancy (As of): | 83.7% (12/31/2013) | ||||
| IO Period: | 42 months | Current Occupancy (As of)(3): | 84.8% (7/25/2014) | ||||
| Loan Term (Original): | 120 months | ||||||
| Seasoning: | 0 months | Underwriting and Financial Information: | |||||
| Amortization Term (Original): | 360 months | ||||||
| Loan Amortization Type: | Interest-only, Amortizing Balloon | 3rd Most Recent NOI (As of): | $2,977,132 (12/31/2012) | ||||
| Interest Accrual Method: | Actual/360 | 2nd Most Recent NOI (As of): | $2,643,404 (12/31/2013) | ||||
| Call Protection: | L(24),D(91),O(5) | Most Recent NOI (As of)(4): | $2,360,634 (T-10 Annualized 7/31/2014) | ||||
| Lockbox Type: | Hard/Springing Cash Management | ||||||
| Additional Debt: | None | U/W Revenues: | $9,597,979 | ||||
| Additional Debt Type: | NAP | U/W Expenses: | $5,126,349 | ||||
U/W NOI(4): | $4,471,630 | ||||||
Escrows and Reserves(1): | U/W NCF: | $3,886,238 | |||||
| U/W NOI DSCR: | 1.71x | ||||||
Type: | Initial | Monthly | Cap (If Any) | U/W NCF DSCR: | 1.49x | ||
| Taxes | $891,260 | $222,815 | NAP | U/W NOI Debt Yield: | 10.5% | ||
| Insurance | $110,351 | $7,882 | NAP | U/W NCF Debt Yield: | 9.1% | ||
| Replacement Reserves | $6,170 | $6,170 | $222,042 | As-Is Appraised Value: | $58,200,000 | ||
| TI/LC Reserve | $41,000 | $41,000 | $1,000,000 | As-Is Appraisal Valuation Date: | July 15, 2014 | ||
| Deferred Maintenance | $49,871 | $0 | NAP | Cut-off Date LTV Ratio: | 73.0% | ||
| Other Reserve | $2,930,069 | $0 | NAP | LTV Ratio at Maturity or ARD: | 64.8% | ||
| (1) | See “Escrows” section. |
| (2) | The Centennial Center & Two Century Center Property comprises two buildings which were built in 1980 and 1989. |
| (3) | As of July 25, 2014, the Centennial Center & Two Century Property was 79.8% physically occupied and 84.8% leased. |
| (4) | See “Cash Flow Analysis” section. |
The Mortgage Loan. The mortgage loan (the “Centennial Center & Two Century Center Mortgage Loan”) is evidenced by a single promissory note that is secured by a first mortgage encumbering two adjacent office buildings located in Schaumburg, Illinois (the “Centennial Center & Two Century Center Property”). The Centennial Center & Two Century Center Mortgage Loan was originated on August 8, 2014 by Prudential Mortgage Capital Company. The Centennial Center & Two Century Center Mortgage Loan had an original principal balance of $42,500,000, has an outstanding principal balance as of the Cut-off Date of $42,500,000 and accrues interest at an interest rate of 4.600% per annum. The Centennial Center & Two Century Center Mortgage Loan had an initial term of 120 months, has a remaining term of 120 months as of the Cut-off Date and requires interest-only payments for the first 42 payments following origination and, thereafter, requires payments of principal and interest based on a 30-year amortization schedule. The Centennial Center & Two Century Center Mortgage Loan matures on September 1, 2024.
Following the lockout period, the borrower has the right to defease the Centennial Center & Two Century Center Mortgage Loan in whole, or in part (see “Partial Release” section), on any date before May 1, 2024. In addition, the Centennial Center & Two Century Center Mortgage Loan is prepayable without penalty on or after May 1, 2024.
THE INFORMATION IN THIS STRUCTURAL AND COLLATERAL TERM SHEET IS NOT COMPLETE AND MAY BE AMENDED PRIOR TO THE TIME OF SALE. THIS TERM SHEET IS NOT AN OFFER TO SELL THESE SECURITIES AND IT IS NOT A SOLICITATION OF AN OFFER TO BUY THESE SECURITIES IN ANY JURISDICTION WHERE THE OFFER OR SALE IS NOT PERMITTED.
72
| CENTENNIAL CENTER & TWO CENTURY CENTER |
Sources and Uses
| Sources | Uses | |||||||
| Original loan amount | $42,500,000 | 100.0% | Loan payoff | $24,605,443 | 57.9% | |||
| Reserves | 4,028,721 | 9.5 | ||||||
| Closing costs | 621,197 | 1.5 | ||||||
| Return of equity | 13,244,639 | 31.2 | ||||||
| Total Sources | $42,500,000 | 100.0% | Total Uses | $42,500,000 | 100.0% | |||
The Property. The Centennial Center & Two Century Center Property consists of two adjacent class A office buildings (the Centennial Center property and the Two Century Center property) situated on approximately 21.5 acres (the Centennial Center property on 13.0 acres and the Two Century Center property on 8.5 acres) and located in Schaumburg, Illinois, approximately 26.1 miles northwest of the Chicago “Loop” and 13.0 miles northwest of O’Hare International Airport. The Centennial Center property is 13 stories, was constructed in 1980 and contains 272,251 square feet of rentable area. Amenities at the Centennial Center property include a tenant lounge, building deli, fitness center, two building conference rooms, 24-hour onsite property management and staffed security and an outdoor putting green for tenant use. In addition, the Centennial Center property provides indoor pedestrian access to the adjacent Hyatt Regency Hotel, which provides additional amenities, including a restaurant, meeting rooms, sundry store, barber shop, coffee bar, and Avis Car Rental outlet. The Centennial Center property features 1,003 surface parking spaces, resulting in a parking ratio of 3.7 spaces per 1,000 square feet of rentable area. The Two Century Center property is 11 stories, was constructed in 1989 and contains 221,177 square feet of rentable area. Amenities at the Two Century Center property include a fitness center with group classes and on-site masseuse, on-site dining, staffed security desk with a touch-screen tenant directory, communal marketing center and conference room, pick-up dry cleaning, on-site oil changes, and an outdoor putting green for tenant use. The Two Century Center property features 698 parking spaces (57 covered spaces and 641 surface spaces) resulting in a parking ratio of 3.2 spaces per 1,000 square feet of rentable area. As of July 25, 2014 The Centennial Center & Two Century Center Property was 84.8% leased and 79.8% occupied.
The following table presents certain information relating to the Centennial Center and Two Century Center Property:
| Property Name | Property Type | Allocated Cut-off Date Principal Balance | % of Allocated Cut-off Date Principal Balance | Occupancy | Year Built/ Renovated | Net Rentable Area (SF) | Appraised Value | ||||||
| Centennial Center | Office | $22,125,000 | 52.1% | 72.6% | 1980/NAP | 272,251 | $30,300,000 | ||||||
| Two Century Center | Office | 20,375,000 | 47.9% | 88.6% | 1989/NAP | 221,177 | $27,900,000 | ||||||
| Total/Weighted Average | $42,500,000 | 100.0% | 84.8% | 493,428 | $58,200,000 | ||||||||
THE INFORMATION IN THIS STRUCTURAL AND COLLATERAL TERM SHEET IS NOT COMPLETE AND MAY BE AMENDED PRIOR TO THE TIME OF SALE. THIS TERM SHEET IS NOT AN OFFER TO SELL THESE SECURITIES AND IT IS NOT A SOLICITATION OF AN OFFER TO BUY THESE SECURITIES IN ANY JURISDICTION WHERE THE OFFER OR SALE IS NOT PERMITTED.
73
| CENTENNIAL CENTER & TWO CENTURY CENTER |
The following table presents certain information relating to the tenancy at the Centennial Center & Two Century Center Property:
Major Tenants
| Tenant Name | Credit Rating (Fitch/Moody’s/ S&P)(1) | Tenant NRSF | % of NRSF | Annual U/W Base Rent PSF(2) | Annual U/W Base Rent(2) | % of Total Annual U/W Base Rent | Lease Expiration Date |
| Major Tenants | |||||||
| Audio Visual Services Group | NR/NR/NR | 41,850 | 8.5% | $17.80 | $744,924 | 11.7% | 6/30/2015 |
Interactive Health Solutions(3) | NR/NR/NR | 26,582 | 5.4% | $22.75 | $604,740 | 9.5% | 6/30/2023 |
Pulte Home Corporation(4) | BB+/Ba1/BB+ | 24,810 | 5.0% | $22.75 | $564,428 | 8.8% | 12/31/2021 |
United Health Care Services(5) | A-/A3/A-1 | 41,593 | 8.4% | $11.50 | $478,320 | 7.5% | 2/28/2018 |
| Total Major Tenants | 134,835 | 27.3% | $17.74 | $2,392,412 | 37.5% | ||
| Non-Major Tenants | 283,544 | 57.5% | $14.07 | $3,990,011 | 62.5% | ||
| Occupied Collateral Total | 418,379 | 84.8% | $15.26 | $6,382,423 | 100.0% | ||
| Vacant Space | 75,049 | 15.2% | |||||
| Collateral Total | 493,428 | 100.0% | |||||
| (1) | Certain ratings are those of the parent company whether or not the parent guarantees the lease. |
| (2) | Annual U/W Base Rent PSF and Annual U/W Base Rent include contractual rent steps through March 2015. |
| (3) | Interactive Health Solutions may terminate its lease at any time on or after July 1, 2020 upon 12 months’ notice. The tenant is required to pay a termination fee equal to $25.50 per square foot ($677,841). |
| (4) | Pulte Home Corporation has a fully executed lease and is expected to take occupancy on January 1, 2015. |
| (5) | United Health Care Service has a one-time right to terminate its lease in whole or in part at any time after February 29, 2016 upon 12 months’ written notice. Simultaneously with the delivery of the termination notice the tenant is required to pay a termination fee equal to the unamortized cost of construction allowance, leasing commissions and abated rent. |
The following table presents certain information relating to the lease rollover schedule at the Centennial Center & Two Century Center Property:
Lease Expiration Schedule(1)(2)
Year Ending December 31, | No. of Leases Expiring | Expiring NRSF | % of Total NRSF | Cumulative Expiring NRSF | Cumulative % of Total NRSF | Annual U/W Base Rent | Annual U/W Base Rent PSF(3) | ||||||||
| MTM | 0 | 0 | 0.0% | 0 | 0.0% | $0 | $0.00 | ||||||||
| 2014 | 2 | 0 | 0.0% | 0 | 0.0% | $18,261 | $0.00 | ||||||||
| 2015 | 4 | 50,156 | 10.2% | 50,156 | 10.2% | $866,729 | $17.28 | ||||||||
| 2016 | 1 | 21,834 | 4.4% | 71,990 | 14.6% | $294,759 | $13.50 | ||||||||
| 2017 | 10 | 40,693 | 8.2% | 112,683 | 22.8% | $460,524 | $11.32 | ||||||||
| 2018 | 13 | 110,559 | 22.4% | 223,242 | 45.2% | $1,630,985 | $14.75 | ||||||||
| 2019 | 4 | 15,062 | 3.1% | 238,304 | 48.3% | $344,573 | $22.88 | ||||||||
| 2020 | 4 | 34,040 | 6.9% | 272,344 | 55.2% | $417,974 | $12.28 | ||||||||
| 2021 | 2 | 24,810 | 5.0% | 297,154 | 60.2% | $702,417 | $28.31 | ||||||||
| 2022 | 2 | 28,125 | 5.7% | 325,279 | 65.9% | $324,547 | $11.54 | ||||||||
| 2023 | 3 | 50,802 | 10.3% | 376,081 | 76.2% | $849,865 | $16.73 | ||||||||
| 2024 | 0 | 0 | 0.0% | 376,081 | 76.2% | $0 | $0.00 | ||||||||
| Thereafter | 14 | 42,298 | 8.6% | 418,379 | 84.8% | $471,788 | $11.15 | ||||||||
| Vacant | 0 | 75,049 | 15.2% | 493,428 | 100.0% | $0 | $0.00 | ||||||||
| Total/Weighted Average | 59 | 493,428 | 100.0% | $6,382,423 | $15.26 |
| (1) | Information obtained from the underwritten rent roll. |
| (2) | Certain tenants may have lease termination options that are exercisable prior to the originally stated expiration date of the subject lease and that are not considered in the Lease Expiration Schedule. |
| (3) | Weighted Average Annual U/W Base Rent PSF excludes vacant space. |
THE INFORMATION IN THIS STRUCTURAL AND COLLATERAL TERM SHEET IS NOT COMPLETE AND MAY BE AMENDED PRIOR TO THE TIME OF SALE. THIS TERM SHEET IS NOT AN OFFER TO SELL THESE SECURITIES AND IT IS NOT A SOLICITATION OF AN OFFER TO BUY THESE SECURITIES IN ANY JURISDICTION WHERE THE OFFER OR SALE IS NOT PERMITTED.
74
| CENTENNIAL CENTER & TWO CENTURY CENTER |
The following table presents historical occupancy percentages at the Centennial Center & Two Century Center Property:
Historical Occupancy
12/31/2011(1) | 12/31/2012(1) | 12/31/2013(1) | 7/25/2014(2)(3) | |||
| 75.0% | 91.0% | 83.7% | 79.8% |
| (1) | Information obtained from the borrower. |
| (2) | Information obtained from the underwritten rent roll. |
| (3) | As of July 25, 2014, the Centennial Center & Two Century Center Property was 79.8% physically occupied and 84.8% leased. |
Operating History and Underwritten Net Cash Flow. The following table presents certain information relating to the historical operating performance and the Underwritten Net Cash Flow at the Centennial Center & Two Century Center Property:
Cash Flow Analysis
| 2012 | 2013 | T-10 Annualized 7/31/2014 | U/W(1) | U/W $ per SF | |||||||
| Base Rent | $4,224,223 | $4,071,785 | $4,090,717 | $6,320,748 | $12.81 | ||||||
| Grossed Up Vacant Space | 0 | 0 | 0 | 888,193 | 1.80 | ||||||
| Total Reimbursables | 4,605,160 | 3,197,076 | 3,024,053 | 3,530,801 | 7.16 | ||||||
| Antenna Income | 43,028 | 59,813 | 50,166 | 64,220 | 0.13 | ||||||
| Other Income | 40,077 | 53,510 | 95,333 | 75,057 | 0.15 | ||||||
| Less Vacancy & Credit Loss | 87,710 | (12,604) | 0 | (1,281,040)(2) | (2.60) | ||||||
| Effective Gross Income | $9,000,197 | $7,369,581 | $7,260,269 | $9,597,979 | $19.45 | ||||||
| Total Operating Expenses | $6,023,065 | $4,726,178 | $4,899,635 | $5,126,349 | $10.39 | ||||||
| Net Operating Income | $2,977,132 | $2,643,404 | $2,360,634 | $4,471,630 | $9.06 | ||||||
| TI/LC | 0 | 0 | 0 | 511,378 | 1.04 | ||||||
| Capital Expenditures | 0 | 0 | 0 | 74,014 | 0.15 | ||||||
| Net Cash Flow | $2,977,132 | $2,643,404 | $2,630,634 | $3,886,238 | $7.88 | ||||||
| NOI DSCR | 1.14x | 1.01x | 0.90x | 1.71x | |||||||
| NCF DSCR | 1.14x | 1.01x | 0.90x | 1.49x | |||||||
| NOI DY | 7.0% | 6.2% | 5.6% | 10.5% | |||||||
| NCF DY | 7.0% | 6.2% | 5.6% | 9.1% | |||||||
| (1) | The increase in underwritten NOI is due to recent leasing activity and contractual rent increases through March 2015. |
| (2) | The underwritten economic vacancy is 17.6%. The Centennial Center & Two Century Center Property was 84.8% leased and 79.8% physically occupied as of July 25, 2014. |
Appraisal. As of the appraisal valuation date of July 15, 2014, the Centennial Center & Two Century Center Property had an “as-is” appraised value of $58,200,000.
Environmental Matters. According to the Phase I environmental report dated July 25, 2014, there was no evidence of any recognized environmental conditions at the Centennial Center & Two Century Center Property.
Market Overview and Competition. The Centennial Center & Two Century Center Property is located in Schaumburg, Illinois, which is approximately 13.0 miles northwest of O’Hare International Airport and 26.1 miles west of the Chicago Loop. Primary access to the area is provided by Interstate 90, a major arterial that crosses the Chicago Metro area in an east/west direction. Access to the subject from Interstate 90 is provided by Golf Road, and travel time by car from the major arterial to the subject is approximately two minutes. According to a third party independent report, the Centennial Center & Two Century Center Property is located in the Chicago, Illinois Metro market, within the class A, Northwest Suburb office submarket which comprises approximately 38.0 million square feet of office space as of the first quarter of 2014. The submarket occupancy rate for class A office space is currently 76.4% and has remained fairly stable, averaging 76.0% over the past five years. The current average asking rent within the submarket is $25.63 per square foot on a gross basis.
THE INFORMATION IN THIS STRUCTURAL AND COLLATERAL TERM SHEET IS NOT COMPLETE AND MAY BE AMENDED PRIOR TO THE TIME OF SALE. THIS TERM SHEET IS NOT AN OFFER TO SELL THESE SECURITIES AND IT IS NOT A SOLICITATION OF AN OFFER TO BUY THESE SECURITIES IN ANY JURISDICTION WHERE THE OFFER OR SALE IS NOT PERMITTED.
75
| CENTENNIAL CENTER & TWO CENTURY CENTER |
The following table presents certain information relating to comparable office properties for the Centennial Center & Two Century Center Property:
Competitive Set
| Centennial Center & Two Century Center (Subject) | One Century Center | Woodfield Corporate Center | Continental Towers | Crossroads Executive Center | |
| Location | Schaumburg, IL | Schaumburg, IL | Schaumburg, IL | Rolling Meadows, IL | Rolling Meadows, IL |
| Distance from Subject | -- | 0.3 miles | 2.0 miles | 2.0 miles | 2.4 miles |
| Property Type | Office | Office | Office | Office | Office |
| Year Built/Renovated | Various/2008 | 1985/NAV | 1986/NAV | 1982/NAV | 1976/NAV |
| Stories | 11-13 | 11 | 13 | 12 | 10 |
| Total GLA | 493,428 SF | 212,212 SF | 711,532 SF | 281,651 SF | 142,088 SF |
| Total Occupancy | 85% | 96% | 82% | 58% | 85% |
The Borrowers. The borrowers are Centennial Center, LLC and Two Century, LLC, each of which is a Delaware limited liability company and a single purpose entity with one independent director. Legal counsel to the borrowers delivered a non-consolidation opinion in connection with the origination of the Centennial Center & Two Century Center Mortgage Loan. Cyrus Sakhai is the guarantor of certain nonrecourse carveouts under the Centennial Center & Two Century Center Mortgage Loan.
The Sponsor. The loan sponsor is Cyrus Sakhai. Mr. Sakhai co-founded Sovereign Partners (“Sovereign”) with his brother, Darius Sakhai, in 2002. Sovereign has since acquired more than four million square feet of value-added office properties across numerous markets throughout the United States. Mr. Sakhai has amassed a strong track record as an owner operator, making targeted capital upgrades to his assets and successfully attracting tenants to create substantial value across the portfolio. Mr. Sakhai reports a net worth of approximately $35.8 million as of April 30, 2013.
Escrows. The loan documents provide for upfront reserves in the amount of $891,260 for real estate taxes, $110,351 for insurance, $6,170 for replacement reserves, $41,000 for tenant improvements and leasing commissions (“TI/LCs”), $49,871 for deferred maintenance, $1,648,889 for tenant improvements owed to existing tenants, $986,180 for rent abatements and $295,000 for cost associated with the Pulte Home Corporation termination fee. The borrower agreed to pay Pulte’s lease termination fee at their current building to entice the tenant to lease space at the Centennial Center property. The lease termination fee totaled $590,000, half of which was paid prior to closing. The loan documents also provide for ongoing monthly escrows in the amount of $222,815 for real estate taxes, $7,882 for insurance, $6,170 for replacement reserves (subject to a cap of $222,042) and $41,000 for TI/LCs (subject to a cap of $1,000,000).
Lockbox and Cash Management. The Centennial Center & Two Century Center Mortgage Loan requires a lender-controlled lockbox account which is already in place, and that the borrower direct tenants to pay their rents directly to such lockbox account. Prior to the occurrence of a Cash Management Period (as defined below), all funds on deposit in the lockbox account will be released to the borrower’s account on a daily basis. During a Cash Management Period, funds on deposit in the lockbox account will be swept on a daily basis into a lender controlled cash management account.
A “Cash Management Period” will commence upon the earlier of (i) the occurrence and continuance of an event of default or (ii) the amortizing debt service coverage ratio falling below 1.20x at the end of any calendar quarter. A Cash Management Period will expire, with regard to clause (i), upon the cure of such event of default, or with regard to clause (ii), upon the date the amortizing debt service coverage ratio is equal to or greater than 1.20x for two consecutive calendar quarters.
Property Management. The Centennial Center & Two Century Center Property is managed by Transwestern Commercial Services Illinois, L.L.C.
Assumption. The borrower has the right to transfer the Centennial Center & Two Century Center Property, provided that no event of default has occurred and is continuing and certain other conditions are satisfied, including (i) the lender’s reasonable determination that the proposed transferee and guarantor satisfy the lender’s credit review and underwriting standards, taking into consideration transferee experience, financial strength and general business standing; (ii) execution of a recourse guaranty (which includes an environmental indemnity) by an affiliate of the transferee; and (iii) rating agency confirmation from Fitch, Moody’s and Morningstar that the transfer will not result in a downgrade, withdrawal or qualification of the respective ratings assigned to the Series 2014-C23 Certificates.
Partial Release. Following the second anniversary of the Series 2014-C23 Certificates, the borrowers are permitted to partially release either of the properties from the lien of the Centennial Center & Two Century Center Mortgage Loan in connection with a partial defeasance, subject to certain conditions, including (i) no event of default has occurred and is continuing; (ii) following the release, the debt yield of the remaining property will not be less than the debt yield of the Centennial Center & Two Century Center Mortgage Loan at the time of origination; and (iii) rating agency confirmation from Fitch, Moody’s and Morningstar that the release will not result in a downgrade, withdrawal or qualification of the respective ratings assigned to the Series 2014-C23 Certificates.
Real Estate Substitution. Not permitted.
Subordinate and Mezzanine Indebtedness. Not permitted.
THE INFORMATION IN THIS STRUCTURAL AND COLLATERAL TERM SHEET IS NOT COMPLETE AND MAY BE AMENDED PRIOR TO THE TIME OF SALE. THIS TERM SHEET IS NOT AN OFFER TO SELL THESE SECURITIES AND IT IS NOT A SOLICITATION OF AN OFFER TO BUY THESE SECURITIES IN ANY JURISDICTION WHERE THE OFFER OR SALE IS NOT PERMITTED.
76
| CENTENNIAL CENTER & TWO CENTURY CENTER |
Ground Lease. None.
Terrorism Insurance. The loan documents require that the “all risk” insurance policy required to be maintained by the borrower provide coverage for terrorism in an amount equal to the full replacement cost of the Centennial Center & Two Century Center Property, as well as business interruption insurance covering no less than the 12-month period following the occurrence of a casualty event, together with a six-month extended period of indemnity.
THE INFORMATION IN THIS STRUCTURAL AND COLLATERAL TERM SHEET IS NOT COMPLETE AND MAY BE AMENDED PRIOR TO THE TIME OF SALE. THIS TERM SHEET IS NOT AN OFFER TO SELL THESE SECURITIES AND IT IS NOT A SOLICITATION OF AN OFFER TO BUY THESE SECURITIES IN ANY JURISDICTION WHERE THE OFFER OR SALE IS NOT PERMITTED.
77
(THIS PAGE INTENTIONALLY LEFT BLANK)
78
| 677 BROADWAY |
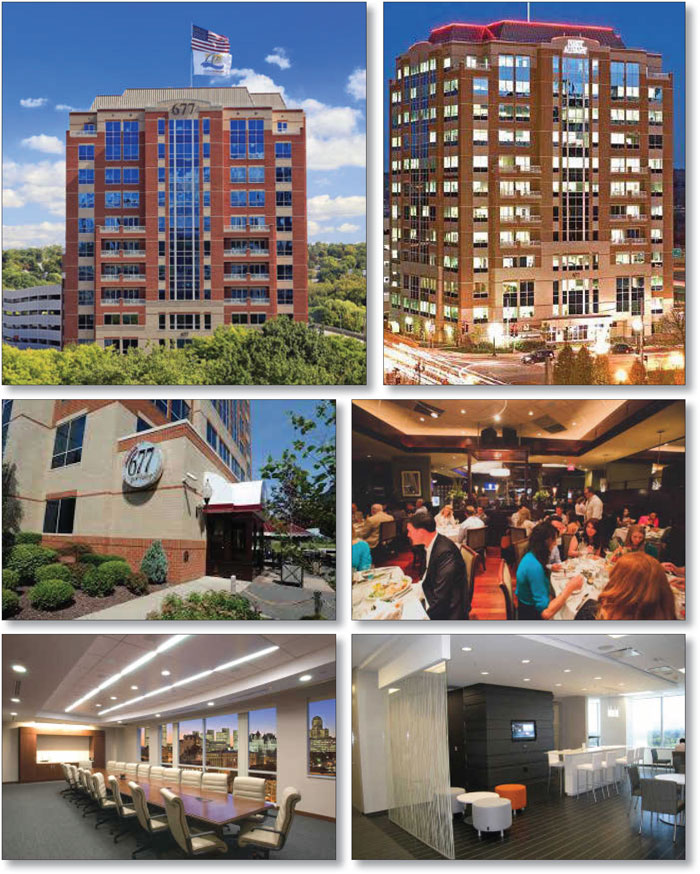
THE INFORMATION IN THIS STRUCTURAL AND COLLATERAL TERM SHEET IS NOT COMPLETE AND MAY BE AMENDED PRIOR TO THE TIME OF SALE. THIS TERM SHEET IS NOT AN OFFER TO SELL THESE SECURITIES AND IT IS NOT A SOLICITATION OF AN OFFER TO BUY THESE SECURITIES IN ANY JURISDICTION WHERE THE OFFER OR SALE IS NOT PERMITTED.
79
| 677 BROADWAY |
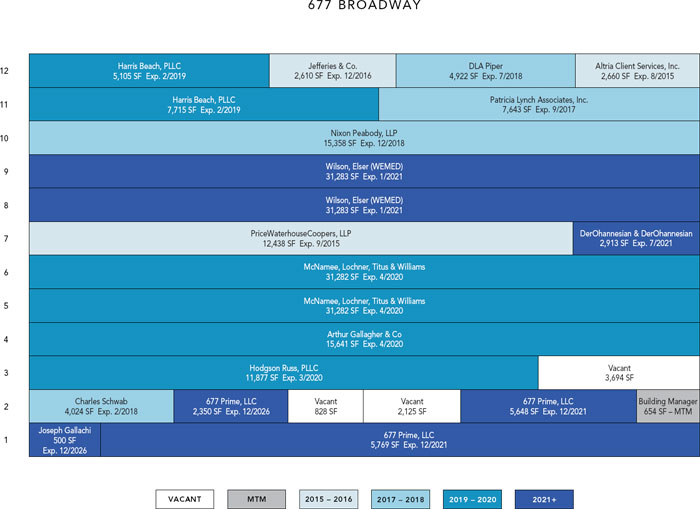
THE INFORMATION IN THIS STRUCTURAL AND COLLATERAL TERM SHEET IS NOT COMPLETE AND MAY BE AMENDED PRIOR TO THE TIME OF SALE. THIS TERM SHEET IS NOT AN OFFER TO SELL THESE SECURITIES AND IT IS NOT A SOLICITATION OF AN OFFER TO BUY THESE SECURITIES IN ANY JURISDICTION WHERE THE OFFER OR SALE IS NOT PERMITTED.
80
| 677 BROADWAY |
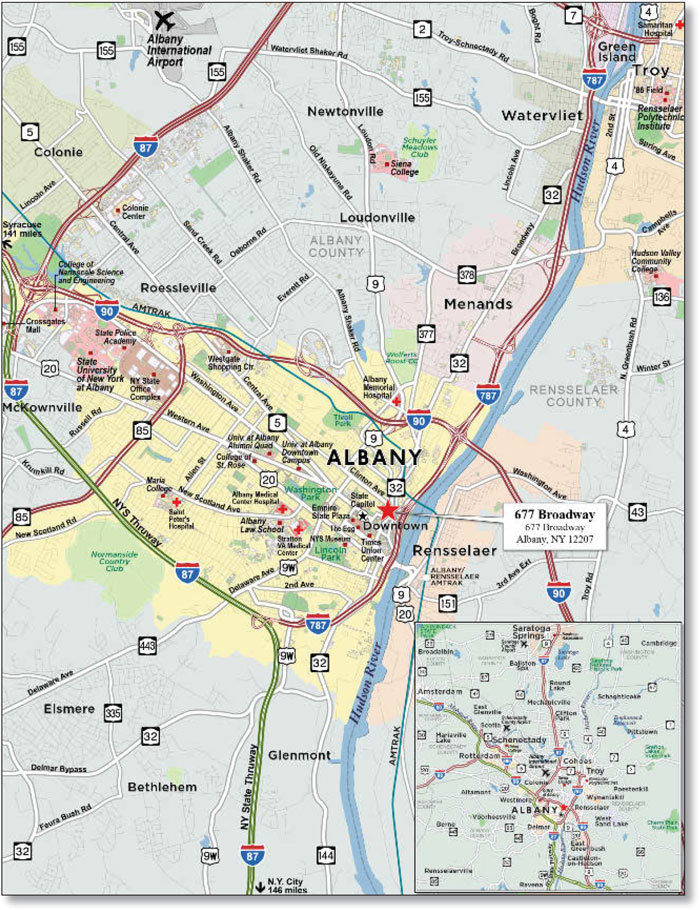
THE INFORMATION IN THIS STRUCTURAL AND COLLATERAL TERM SHEET IS NOT COMPLETE AND MAY BE AMENDED PRIOR TO THE TIME OF SALE. THIS TERM SHEET IS NOT AN OFFER TO SELL THESE SECURITIES AND IT IS NOT A SOLICITATION OF AN OFFER TO BUY THESE SECURITIES IN ANY JURISDICTION WHERE THE OFFER OR SALE IS NOT PERMITTED.
81
| No. 6 – 677 Broadway | |||||||
| Loan Information | Property Information | ||||||
| Mortgage Loan Seller: | The Royal Bank of Scotland | Single Asset/Portfolio: | Single Asset | ||||
Credit Assessment (Fitch/Moody’s/Morningstar): | NR/NR/NR | Property Type: | Office | ||||
| Original Principal Balance: | $28,875,000 | Specific Property Type: | CBD | ||||
| Cut-off Date Principal Balance: | $28,875,000 | Location: | Albany, NY | ||||
| % of Initial Pool Balance: | 3.1% | Size: | 177,039 SF | ||||
| Loan Purpose: | Acquisition | Cut-off Date Principal Balance Per SF: | $163.10 | ||||
Borrower Names(1): | Shelbourne Albany LLC; Shelbourne Broadway LLC | Year Built/Renovated: | 2004/NAP | ||||
| Sponsors: | Saul Friedman; Barry Friedman | Title Vesting: | Fee | ||||
| Mortgage Rate: | 4.480% | Property Manager: | Shelbourne Global Solutions, LLC | ||||
| Note Date: | August 25, 2014 | 3rd Most Recent Occupancy (As of): | 100.0% (12/31/2011) | ||||
| Anticipated Repayment Date: | NAP | 2nd Most Recent Occupancy (As of): | 97.9% (12/31/2012) | ||||
| Maturity Date: | September 1, 2024 | Most Recent Occupancy (As of): | 97.9% (12/31/2013) | ||||
| IO Period: | None | Current Occupancy (As of): | 96.2% (8/11/2014) | ||||
| Loan Term (Original): | 120 months | ||||||
| Seasoning: | 0 months | Underwriting and Financial Information: | |||||
| Amortization Term (Original): | 360 months | ||||||
| Loan Amortization Type: | Amortizing Balloon | 3rd Most Recent NOI (As of): | $2,173,490 (12/31/2012) | ||||
| Interest Accrual Method: | Actual/360 | 2nd Most Recent NOI (As of)(4): | $2,424,299 (12/31/2013) | ||||
| Call Protection: | L(24),D(92),O(4) | Most Recent NOI (As of)(4): | $2,727,678 (TTM 6/30/2014) | ||||
| Lockbox Type: | Hard/Springing Cash Management | ||||||
Additional Debt(2): | Yes | U/W Revenues: | $5,250,306 | ||||
Additional Debt Type(2): | Mezzanine | U/W Expenses: | $2,376,693 | ||||
| U/W NOI: | $2,873,613 | ||||||
| U/W NCF: | $2,652,313 | ||||||
U/W NOI DSCR(2): | 1.64x | ||||||
Escrows and Reserves(3): | U/W NCF DSCR(2): | 1.51x | |||||
U/W NOI Debt Yield(2): | 10.0% | ||||||
Type: | Initial | Monthly | Cap (If Any) | U/W NCF Debt Yield(2): | 9.2% | ||
| Taxes | $404,967 | $50,268 | NAP | As-Is Appraised Value: | $39,000,000 | ||
| Insurance | $15,519 | $5,173 | NAP | As-Is Appraisal Valuation Date: | July 22, 2014 | ||
| Replacement Reserves | $0 | $3,688 | NAP | Cut-off Date LTV Ratio(2): | 74.0% | ||
| TI/LC Reserve | $345,000 | $14,753 | (3) | LTV Ratio at Maturity or ARD: | 59.8% | ||
| (1) | The borrower is comprised of two tenants-in-common (“TIC”). See “The Borrowers” section. |
| (2) | See “Subordinate and Mezzanine Indebtedness” section. The equity interests in the borrowers under the 677 Broadway Mortgage Loan have been pledged to secure mezzanine indebtedness with a balance as of the Cut-off Date of $3,350,000. All LTV, DSCR, Debt Yield and Cut-off Date Principal Balance Per SF numbers shown in the chart above are based solely on the $28,875,000 mortgage loan financing. As of the Cut-off Date, the combined U/W NCF DSCR is 1.23x (based on a 12.000% interest rate on the mezzanine indebtedness), the combined LTV ratio is 82.6% and the combined U/W NOI Debt Yield is 8.9%. |
| (3) | See “Escrows” section. |
| (4) | See “Cash Flow Analysis” section. |
The Mortgage Loan. The mortgage loan (the “677 Broadway Mortgage Loan”) is evidenced by a single promissory note that is secured by a first mortgage encumbering a 12-story office building located in Albany, New York (the “677 Broadway Property”). The 677 Broadway Mortgage Loan was originated on August 25, 2014 by The Royal Bank of Scotland. The 677 Broadway Mortgage Loan had an original principal balance of $28,875,000, has an outstanding principal balance as of the Cut-off Date of $28,875,000 and accrues interest at an interest rate of 4.480% per annum. The 677 Broadway Mortgage Loan had an initial term of 120 months, has a remaining term of 120 months as of the Cut-off Date and requires payments of principal and interest based on a 30-year amortization schedule. The 677 Broadway Mortgage Loan matures on September 1, 2024.
Following the lockout period, the borrower has the right to defease the 677 Broadway Mortgage Loan in whole, but not in part, on any date before June 1, 2024. In addition, the 677 Broadway Mortgage Loan is prepayable without penalty on or after June 1, 2024.
THE INFORMATION IN THIS STRUCTURAL AND COLLATERAL TERM SHEET IS NOT COMPLETE AND MAY BE AMENDED PRIOR TO THE TIME OF SALE. THIS TERM SHEET IS NOT AN OFFER TO SELL THESE SECURITIES AND IT IS NOT A SOLICITATION OF AN OFFER TO BUY THESE SECURITIES IN ANY JURISDICTION WHERE THE OFFER OR SALE IS NOT PERMITTED.
82
| 677 BROADWAY |
Sources and Uses
| Sources | Uses | |||||||||
| Original loan amount | $28,875,000 | 73.3 | % | Purchase price | $37,687,500 | 95.7 | % | |||
| Mezzanine loan | 3,350,000 | 8.5 | Reserves | 765,486 | 1.9 | |||||
| Sponsor’s new cash contribution | 7,181,309 | 18.2 | Closing costs | 953,323 | 2.4 | |||||
| Total Sources | $39,406,309 | 100.0 | % | Total Uses | $39,406,309 | 100.0 | % | |||
The Property. The 677 Broadway Property is a 12-story, class A office building situated on approximately 0.6 acres located in Albany, New York. The 677 Broadway Property was constructed in 2004, contains 177,039 rentable square feet and is located in the Albany central business district. The 677 Broadway Property is directly adjacent to Interstate 787 and benefits from visibility and immediate access to the on/off ramps. Amenities at the 677 Broadway Property include the 677 Prime Restaurant and banquet facility, views of the Hudson river to the east, private balconies, 24-hour security and heated sidewalks which surround the property. Located directly adjacent to the 677 Broadway Property is a 900-space parking garage owned by the City of Albany Parking Authority, which services the 677 Broadway Property and other local office properties. The 677 Broadway Property also contains 22 parking spaces.
As of August 11, 2014, the 677 Broadway Property was 96.2% occupied by 15 tenants including a mix of professional service tenants, primarily from the legal, financial and accounting industries. The second largest tenant, McNamee, Lochner, Titus & Williams (representing 17.7% of rentable area and 15.1% of underwritten base rent) utilizes the 677 Broadway Property as its headquarters location, and according to the tenant has invested approximately $2.8 million ($90 per square foot) of its own capital on improvements to its space.
The following table presents certain information relating to the tenancy at the 677 Broadway Property:
Major Tenants
| Tenant Name | Credit Rating (Fitch/Moody’s /S&P) | Tenant NRSF | % of NRSF | Annual U/W Base Rent PSF(2) | Annual U/W Base Rent(2) | % of Total Annual U/W Base Rent | Lease Expiration Date | ||||||||
| Major Tenants | |||||||||||||||
Wilson, Elser (WEMED) | NR/NR/NR | 31,283 | 17.7% | $23.00 | $719,509 | 19.8% | 1/31/2021 | ||||||||
McNamee, Lochner, Titus & Williams | NR/NR/NR | 31,282 | 17.7% | $17.49 | $547,122 | 15.1% | 4/30/2020(2) | ||||||||
Nixon Peabody, LLP | NR/NR/NR | 15,358 | 8.7% | $22.50 | $345,555 | 9.5% | 12/23/2018 | ||||||||
Arthur Gallagher & Co | NR/NR/NR | 15,641 | 8.8% | $20.81 | $325,512 | 9.0% | 4/30/2020 | ||||||||
Harris Beach, PLLC | NR/NR/NR | 12,820 | 7.2% | $24.91 | $319,292 | 8.8% | 2/9/2019 | ||||||||
| Total Major Tenants | 106,384 | 60.1% | $21.22 | $2,256,990 | 62.1% | ||||||||||
| Non-Major Tenants | 64,008 | 36.2% | $21.49 | $1,375,808 | 37.9% | ||||||||||
| Occupied Collateral Total | 170,392 | 96.2% | $21.32 | $3,632,798 | 100.0% | ||||||||||
| Vacant Space | 6,647 | 3.8% | |||||||||||||
| Collateral Total | 177,039 | 100.0% | |||||||||||||
| (1) | Annual U/W Base Rent PSF and Annual U/W Base Rent include contractual rent steps through July 2015. |
| (2) | McNamee, Lochner, Titus & Williams has the option to surrender 15,641 square feet of leased space as of May 2016 with 180 days’ notice. |
THE INFORMATION IN THIS STRUCTURAL AND COLLATERAL TERM SHEET IS NOT COMPLETE AND MAY BE AMENDED PRIOR TO THE TIME OF SALE. THIS TERM SHEET IS NOT AN OFFER TO SELL THESE SECURITIES AND IT IS NOT A SOLICITATION OF AN OFFER TO BUY THESE SECURITIES IN ANY JURISDICTION WHERE THE OFFER OR SALE IS NOT PERMITTED.
83
| 677 BROADWAY |
The following table presents certain information relating to the lease rollover schedule at the 677 Broadway Property:
Lease Expiration Schedule(1)(2)
Year Ending December 31, | No. of Leases Expiring | Expiring NRSF | % of Total NRSF | Cumulative Expiring NRSF | Cumulative % of Total NRSF | Annual U/W Base Rent | Annual U/W Base Rent PSF(3) | ||||||||
| MTM | 1 | 654 | 0.4% | 654 | 0.4% | $0 | $0.00 | ||||||||
| 2014 | 0 | 0 | 0.0% | 654 | 0.4% | $0 | $0.00 | ||||||||
| 2015 | 2 | 15,098 | 8.5% | 15,752 | 8.9% | $333,917 | $22.12 | ||||||||
| 2016 | 1 | 2,610 | 1.5% | 18,362 | 10.4% | $61,353 | $23.51 | ||||||||
| 2017 | 1 | 7,643 | 4.3% | 26,005 | 14.7% | $181,357 | $23.73 | ||||||||
| 2018 | 3 | 24,304 | 13.7% | 50,309 | 28.4% | $563,156 | $23.17 | ||||||||
| 2019 | 1 | 12,820 | 7.2% | 63,129 | 35.7% | $319,292 | $24.91 | ||||||||
| 2020 | 3 | 58,800 | 33.2% | 121,929 | 68.9% | $1,127,990 | $19.18 | ||||||||
| 2021 | 3 | 45,613 | 25.8% | 167,542 | 94.6% | $997,903 | $21.88 | ||||||||
| 2022 | 0 | 0 | 0.0% | 167,542 | 94.6% | $0 | $0.00 | ||||||||
| 2023 | 0 | 0 | 0.0% | 167,542 | 94.6% | $0 | $0.00 | ||||||||
| 2024 | 0 | 0 | 0.0% | 167,542 | 94.6% | $0 | $0.00 | ||||||||
| Thereafter | 2 | 2,850 | 1.6% | 170,392 | 96.2% | $47,830 | $16.78 | ||||||||
| Vacant | 0 | 6,647 | 3.8% | 177,039 | 100.0% | $0 | $0.00 | ||||||||
| Total/Weighted Average | 17 | 177,039 | 100.0% | $3,632,798 | $21.32 |
| (1) | Information obtained from the underwritten rent roll. |
| (2) | Certain tenants may have lease termination options that are exercisable prior to the originally stated expiration date of the subject lease and that are not considered in the Lease Expiration Schedule. |
| (3) | Weighted Average Annual U/W Base Rent PSF excludes vacant space. |
The following table presents historical occupancy percentages at the 677 Broadway Property:
Historical Occupancy
12/31/2011(1) | 12/31/2012(1) | 12/31/2013(1) | 8/11/2014(2) | |||
| 100.0% | 97.9% | 97.9% | 96.2% |
| (1) | Information obtained from the borrower. |
| (2) | Information obtained from the underwritten rent roll. |
Operating History and Underwritten Net Cash Flow. The following table presents certain information relating to the Underwritten Net Cash Flow at the 677 Broadway Property:
Cash Flow Analysis
| 2012 | 2013 | TTM 6/30/2014 | U/W(1) | U/W $ per SF(1) | |||||||
| Base Rent | $3,704,278 | $3,588,192 | $3,618,046 | $3,632,798 | $20.52 | ||||||
| Grossed Up Vacant Space | 0 | 0 | 0 | 179,469 | 1.01 | ||||||
| Total Reimbursables | 497,587 | 706,877 | 916,218 | 1,645,671(2) | 9.30 | ||||||
| Other Income | 43,102 | 34,111 | 38,574 | 38,574 | 0.22 | ||||||
| Less Vacancy & Free Rent | 0 | 0 | 0 | (246,206)(3) | (1.39) | ||||||
| Effective Gross Income | $4,244,967 | $4,329,180 | $4,572,838 | $5,250,306 | $29.66 | ||||||
| Total Operating Expenses | $2,071,477(4) | $1,904,881(4) | $1,845,160(4) | $2,376,693 | $13.42 | ||||||
| Net Operating Income | $2,173,490(4) | $2,424,299(4) | $2,727,678(4) | $2,873,613 | $16.23 | ||||||
| TI/LC | 0 | 0 | 0 | 177,040 | 1.00 | ||||||
| Capital Expenditures | 0 | 0 | 0 | 44,260 | 0.25 | ||||||
| Net Cash Flow | $2,173,490 | $2,424,299 | $2,727,678 | $2,652,313 | $14.98 | ||||||
| NOI DSCR | 1.24x | 1.38x | 1.56x | 1.64x | |||||||
| NCF DSCR | 1.24x | 1.38x | 1.56x | 1.51x | |||||||
| NOI DY | 7.5% | 8.4% | 9.4% | 10.0% | |||||||
| NCF DY | 7.5% | 8.4% | 9.4% | 9.2% |
| (1) | Annual U/W Base Rent PSF and Annual U/W Base Rent include contractual rent steps through July 2015. |
| (2) | U/W Total Reimbursables are higher than TTM 6/30/2014 partially due to the property’s tax abatement program expiring in 2015. The underwritten real estate tax reimbursement represents the unabated tax amount which will be reimbursed to the borrower per the individual tenant leases. |
| (3) | The underwritten economic vacancy is 4.5%. The 677 Broadway Property was 96.2% physically occupied as of August 11, 2014. |
(4) | Historical Total Operating Expenses during TTM 6/30/2014 and 2013 reflect a credit from the taxing authority for overpayment of real estate taxes on the property in prior years during a payment in lieu of taxes (“PILOT”) program. Total U/W Operating Expenses include the unabated tax amount due upon expiry of the PILOT program. See “Risks Related to Mortgage Loans and Mortgaged Properties—Increases in Real Estate Taxes May Reduce Net Operating Income” and “Description of the Mortgage Pool—Tenant or Other Third Party Issues—Other Matters” in the Free Writing Prospectus. |
THE INFORMATION IN THIS STRUCTURAL AND COLLATERAL TERM SHEET IS NOT COMPLETE AND MAY BE AMENDED PRIOR TO THE TIME OF SALE. THIS TERM SHEET IS NOT AN OFFER TO SELL THESE SECURITIES AND IT IS NOT A SOLICITATION OF AN OFFER TO BUY THESE SECURITIES IN ANY JURISDICTION WHERE THE OFFER OR SALE IS NOT PERMITTED.
84
| 677 BROADWAY |
Appraisal. As of the appraisal valuation date of July 22, 2014, the 677 Broadway Property had an “as-is” appraised value of $39,000,000.
Environmental Matters. According to the Phase I environmental report dated July 18, 2014, there was no evidence of any recognized environmental conditions at the 677 Broadway Property.
Market Overview and Competition. The 677 Broadway Property is located in the central business district (“CBD”) of Albany, New York. The greater Albany area is recognized as a major transportation corridor through the North Country region of New York, and primary access to the 677 Broadway Property is provided by Interstate 787, the main highway for traveling into and out of the Albany CBD. The 677 Broadway Property is approximately 2.6 miles northeast of Interstate 87, which serves as eastern New York’s primary north-south highway and provides access from downtown Albany to the State University of New York-Albany and Albany International Airport. According to a third party market research report, the 677 Broadway Property is located in the Albany/Schenectady/Troy class A office market, within the Albany CBD class A submarket, which comprises approximately 2.0 million square feet of office space as of the second quarter of 2014. According to the appraisal, the class A Albany/Schenectady/Troy office market occupancy rate is 95.8% and the current average asking rent within the market is $26.81 per square foot.
The following table presents certain information relating to comparable office properties for the 677 Broadway Property:
Competitive Set(1)
677 Broadway (Subject) | Broadway Plaza | Omni Plaza | IBM Building | Key Corp Plaza | Bank of America Building | Twin Towers/One Commerce Plaza | 54 State Street | |
| Location | Albany, NY | Albany, NY | Albany, NY | Albany, NY | Albany, NY | Albany, NY | Albany, NY | Albany, NY |
| Distance from Subject | -- | 0.2 miles | 0.4 miles | 0.4 miles | 0.5 miles | 0.4 miles | 0.8 miles | 0.9 miles |
| Property Type | Office | Office | Office | Office | Office | Office | Office | Office |
| Year Built/Renovated | 2004/NAP | 1988/NAV | 1986/NAV | 1984/NAV | 1990/NAV | 1927/NAV | 1971/NAV | 1963/NAV |
| Stories | 12 | 7 | 14 | 12 | 10 | 17 | 20 | 10 |
| Total GLA | 177,039 SF(2) | 89,816 SF | 220,000 SF | 171,273 SF | 245,935 SF | 182,265 SF | 889,560 SF | 150,000 SF |
| Total Occupancy | 96%(2) | 100% | 93% | 87% | 100% | 63% | 98% | 60% |
| (1) | Information obtained from the appraisal and third party market research reports. The competitive set includes the majority of the class A offices in the Albany CBD market identified by the appraiser. |
| (2) | Information obtained from the underwritten rent roll. |
The Borrowers. The borrowers are Shelbourne Albany LLC and Shelbourne Broadway LLC, as tenants in common. Each is a Delaware limited liability company and single purpose entity with two independent directors. Within six months of loan closing, the indirect ownership of Shelbourne Broadway LLC is expected to be transferred to a pre-approved transferee owned by one of the guarantors of certain non-recourse carveouts under the 677 Broadway Mortgage Loan. Legal counsel to the borrower delivered a non-consolidation opinion in connection with the origination of the 677 Broadway Mortgage Loan. Barry Friedman and Saul Friedman (not related) are the guarantors of certain nonrecourse carveouts under the 677 Broadway Mortgage Loan.
The Sponsors. The loan sponsors are Barry Friedman and Saul Friedman (not related). Saul Friedman is the founder and managing partner at Saul N. Friedman and Company, an accounting and tax advisory firm located in Brooklyn, New York, and is also a partner of Whitney Jordan Equities, where he has been involved in the management of a portfolio of class A office and other properties. Barry Friedman has been the owner operator of numerous healthcare properties and businesses since 2001, and from 2007-2013 owned and managed a portfolio of residential buildings comprising 202 units in Brooklyn, New York and the Bronx, New York.
Escrows. The loan documents provide for an upfront reserve in the amount of $404,967 for real estate taxes, $15,519 for insurance and $345,000 for tenant improvements and leasing commissions (“TI/LCs”). The loan documents also provide for ongoing monthly escrows in the amount of $50,268 for real estate taxes, $5,173 for insurance, $3,688 for replacement reserves and $14,753 for TI/LCs (subject to a cap of $345,000 for the first 24 months and $885,195 thereafter).
Lockbox and Cash Management. The 677 Broadway Mortgage Loan requires a lender-controlled lockbox account which is already in place, and that the borrower direct tenants to pay their rents directly to such lockbox account. The loan documents also require that all rents received by the borrower or the property manager be deposited into the lockbox account within two business days of receipt. Prior to the occurrence of a Cash Management Period (as defined below), all funds on deposit in the lockbox account will be released to the borrower’s account on a daily basis. During a Cash Management Period, funds on deposit in the lockbox account will be swept on a daily basis into a lender controlled cash management account.
A “Cash Management Period” will commence upon the occurrence of: (i) an event of default; (ii) the debt service coverage ratio being less than 1.10x as of the end of any calendar quarter; or (iii) an event of default under the 677 Broadway Mezzanine Loan (see “Subordinate and Mezzanine Indebtedness” section). A Cash Management Period will end, with respect to clause (i), upon the cure of such event of default; with respect to clause (ii), upon the achievement of a debt service coverage ratio of 1.10x for two
THE INFORMATION IN THIS STRUCTURAL AND COLLATERAL TERM SHEET IS NOT COMPLETE AND MAY BE AMENDED PRIOR TO THE TIME OF SALE. THIS TERM SHEET IS NOT AN OFFER TO SELL THESE SECURITIES AND IT IS NOT A SOLICITATION OF AN OFFER TO BUY THESE SECURITIES IN ANY JURISDICTION WHERE THE OFFER OR SALE IS NOT PERMITTED.
85
| 677 BROADWAY |
consecutive calendar quarters; and with respect to clause (iii), upon the cure of such event of default under the 677 Broadway Mezzanine Loan.
Property Management. The 677 Broadway Property is managed by Shelbourne Global Solutions, LLC.
Assumption. The borrower has the right to transfer the 677 Broadway Property, provided that no event of default has occurred and is continuing and certain other conditions are satisfied, including, but not limited to the following: (i) the lender’s reasonable determination that the proposed transferee and guarantor satisfy the lender’s credit review and underwriting standards, taking into consideration transferee’s experience, financial strength and general business standing; (ii) execution of a recourse guaranty and an environmental indemnity by an affiliate of the transferee; (iii) the proposed transfer and assumption will not cause a default under the 677 Broadway Mezzanine Loan; and (iv) if requested by the lender, rating agency confirmation from Fitch, Moody’s and Morningstar that the transfer will not result in a downgrade, withdrawal or qualification of the respective ratings assigned to the Series 2014-C23 Certificates. In addition, the borrower is expected to exercise its right to transfer indirect ownership interests in Shelbourne Broadway LLC to certain preapproved transferees. See “The Borrowers” section.
Partial Release. Not permitted.
Real Estate Substitution. Not permitted.
Subordinate and Mezzanine Indebtedness. SR 677 Bway LLC (the “677 Broadway Mezzanine Lender”) has made a $3,350,000 mezzanine loan (the “677 Broadway Mezzanine Loan”) to Shelbourne BRF LLC and Shelbourne 677 LLC, collectively, the limited liability companies that own 100% of the borrowers under the 677 Broadway Mortgage Loan. The 677 Broadway Mezzanine Loan accrues interest at an interest rate of 12.000% per annum and requires interest-only payments through the term of the 677 Broadway Mezzanine Loan. The rights of the 677 Broadway Mezzanine Lender are further described under “Description of the Mortgage Pool—Additional Indebtedness—Property-Secured Financing and Mezzanine and Similar Financing” in the Free Writing Prospectus.
Ground Lease. None.
Terrorism Insurance. The loan documents require that the “all risk” insurance policy required to be maintained by the borrower provide coverage for terrorism in an amount equal to the full replacement cost of the 677 Broadway Property, as well as business interruption insurance covering no less than the 18-month period following the occurrence of a casualty event, together with a six-month extended period of indemnity.
THE INFORMATION IN THIS STRUCTURAL AND COLLATERAL TERM SHEET IS NOT COMPLETE AND MAY BE AMENDED PRIOR TO THE TIME OF SALE. THIS TERM SHEET IS NOT AN OFFER TO SELL THESE SECURITIES AND IT IS NOT A SOLICITATION OF AN OFFER TO BUY THESE SECURITIES IN ANY JURISDICTION WHERE THE OFFER OR SALE IS NOT PERMITTED.
86
(THIS PAGE INTENTIONALLY LEFT BLANK)
87
HOMEWOOD SUITES – NEW ORLEANS |

THE INFORMATION IN THIS STRUCTURAL AND COLLATERAL TERM SHEET IS NOT COMPLETE AND MAY BE AMENDED PRIOR TO THE TIME OF SALE. THIS TERM SHEET IS NOT AN OFFER TO SELL THESE SECURITIES AND IT IS NOT A SOLICITATION OF AN OFFER TO BUY THESE SECURITIES IN ANY JURISDICTION WHERE THE OFFER OR SALE IS NOT PERMITTED.
88
HOMEWOOD SUITES – NEW ORLEANS |
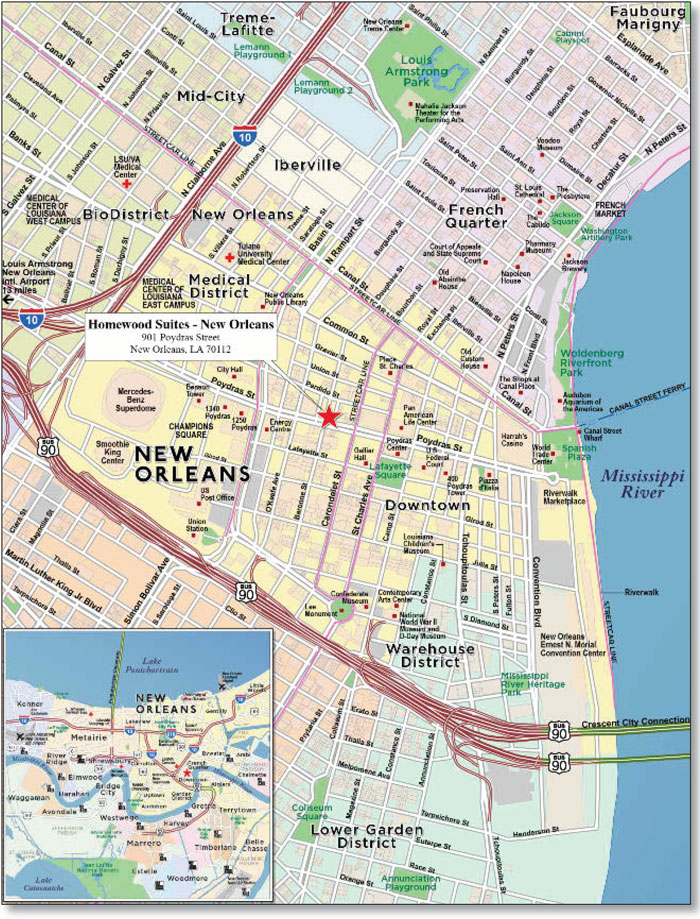
THE INFORMATION IN THIS STRUCTURAL AND COLLATERAL TERM SHEET IS NOT COMPLETE AND MAY BE AMENDED PRIOR TO THE TIME OF SALE. THIS TERM SHEET IS NOT AN OFFER TO SELL THESE SECURITIES AND IT IS NOT A SOLICITATION OF AN OFFER TO BUY THESE SECURITIES IN ANY JURISDICTION WHERE THE OFFER OR SALE IS NOT PERMITTED.
89
No. 7 – Homewood Suites – New Orleans | |||||||||
| Loan Information | Property Information | ||||||||
| Mortgage Loan Seller: | Wells Fargo Bank, National Association | Single Asset/Portfolio: | Single Asset | ||||||
Credit Assessment (Fitch/Moody’s/Morningstar): | NR/NR/NR | Property Type: | Hospitality | ||||||
| Original Principal Balance: | $27,000,000 | Specific Property Type: | Extended Stay | ||||||
| Cut-off Date Principal Balance: | $26,953,433 | Location: | New Orleans, LA | ||||||
| % of Initial Pool Balance: | 2.9% | Size: | 166 Rooms | ||||||
| Loan Purpose: | Refinance | Cut-off Date Principal Balance Per Room: | $162,370 | ||||||
| Borrower Name: | Apple Seven SPE New Orleans, L.P. | Year Built/Renovated: | 2002/2014 | ||||||
| Sponsor: | Apple Hospitality REIT, Inc. | Title Vesting: | Fee | ||||||
| Mortgage Rate: | 4.360% | Property Manager: | Dimension Development Two, LLC | ||||||
| Note Date: | July 17, 2014 | 3rd Most Recent Occupancy (As of): | 83.5% (12/31/2011) | ||||||
| Anticipated Repayment Date: | NAP | 2nd Most Recent Occupancy (As of): | 84.1% (12/31/2012) | ||||||
| Maturity Date: | August 11, 2024 | Most Recent Occupancy (As of)(2): | 77.7% (12/31/2013) | ||||||
| IO Period: | None | Current Occupancy (As of)(2): | 73.8% (6/30/2014) | ||||||
| Loan Term (Original): | 120 months | ||||||||
| Seasoning: | 1 month | Underwriting and Financial Information: | |||||||
| Amortization Term (Original): | 300 months | ||||||||
| Loan Amortization Type: | Amortizing Balloon | 3rd Most Recent NOI (As of): | $3,867,394 (12/31/2012) | ||||||
| Interest Accrual Method: | Actual/360 | 2nd Most Recent NOI (As of): | $3,825,193 (12/31/2013) | ||||||
| Call Protection: | L(25),D(91),O(4) | Most Recent NOI (As of): | $3,636,070 (TTM 6/30/2014) | ||||||
| Lockbox Type: | Springing (Without Established Account) | ||||||||
| Additional Debt: | None | ||||||||
| Additional Debt Type: | NAP | U/W Revenues: | $8,072,544 | ||||||
| U/W Expenses: | $4,499,454 | ||||||||
| U/W NOI: | $3,573,090 | ||||||||
| U/W NCF: | $3,250,188 | ||||||||
Escrows and Reserves(1): | U/W NOI DSCR: | 2.01x | |||||||
| U/W NCF DSCR: | 1.83x | ||||||||
Type: | Initial | Monthly | Cap (If Any) | U/W NOI Debt Yield: | 13.3% | ||||
| Taxes | $194,336 | $27,763 | NAP | U/W NCF Debt Yield: | 12.1% | ||||
| Insurance | $0 | Springing | NAP | As-Is Appraised Value(3): | $45,700,000 | ||||
| FF&E Reserve | $0 | $26,934 | NAP | As-Is Appraisal Valuation Date(3): | May 26, 2014 | ||||
| PIP Reserve | $1,341,000 | Springing | NAP | Cut-off Date LTV Ratio(3): | 59.0% | ||||
| Springing Cash Flow Reserve | $0 | Springing | $1,000,000 | LTV Ratio at Maturity or ARD(3): | 43.1% | ||||
| (1) | See “Escrows” section. |
| (2) | See “Cash Flow Analysis” section. |
| (3) | The appraiser concluded to an “as renovated” value of $46,700,000, which assumes that the PIP, as described in “The Property” section, is complete as of November 26, 2014. Based on the “as renovated” appraised value, the Cut-off Date LTV Ratio and LTV Ratio at Maturity would be 57.7% and 42.2%, respectively. The appraiser also concluded to an “as stabilized” value of $48,300,000, which assumes that the Homewood Suites – New Orleans Property has stabilized as of November 26, 2015. Based on the “as stabilized” appraised value, the Cut-off Date LTV Ratio and LTV Ratio at Maturity would be 55.8% and 40.8%, respectively. |
The Mortgage Loan. The mortgage loan (the “Homewood Suites - New Orleans Mortgage Loan”) is evidenced by a single promissory note that is secured by a first mortgage encumbering the fee interest in an extended stay hotel located in the central business district of New Orleans, Louisiana (the “Homewood Suites - New Orleans Property”). The Homewood Suites - New Orleans Mortgage Loan was originated on July 17, 2014 by Wells Fargo Bank, National Association. The Homewood Suites - New Orleans Mortgage Loan had an original principal balance of $27,000,000, has an outstanding principal balance as of the Cut-off Date of $26,953,433 and accrues interest at an interest rate of 4.360% per annum. The Homewood Suites - New Orleans Mortgage Loan had an initial term of 120 months, has a remaining term of 119 months as of the Cut-off Date and requires principal and interest payments based on a 25-year amortization schedule. The Homewood Suites - New Orleans Mortgage Loan matures on August 11, 2024.
Following the lockout period, the borrower has the right to defease the Homewood Suites - New Orleans Mortgage Loan in whole, but not in part, on any date before May 11, 2024. In addition, the Homewood Suites - New Orleans Mortgage Loan is prepayable without penalty on or after May 11, 2024.
THE INFORMATION IN THIS STRUCTURAL AND COLLATERAL TERM SHEET IS NOT COMPLETE AND MAY BE AMENDED PRIOR TO THE TIME OF SALE. THIS TERM SHEET IS NOT AN OFFER TO SELL THESE SECURITIES AND IT IS NOT A SOLICITATION OF AN OFFER TO BUY THESE SECURITIES IN ANY JURISDICTION WHERE THE OFFER OR SALE IS NOT PERMITTED.
90
HOMEWOOD SUITES – NEW ORLEANS |
Sources and Uses
| Sources | Uses | |||||||
| Original loan amount | $27,000,000 | 100.0% | Loan payoff(1) | $14,164,076 | 52.5% | |||
| Reserves | 1,535,336 | 5.7 | ||||||
| Closing costs | 249,627 | 0.9 | ||||||
| Return of equity | 11,050,961 | 40.9 | ||||||
| Total Sources | $27,000,000 | 100.0% | Total Uses | $27,000,000 | 100.0% |
| (1) | The Homewood Suites – New Orleans Property was previously securitized in GMACC 2004-C3. |
The Property. The Homewood Suites - New Orleans Property is a 166-room, 12-story, extended stay hotel located in the central business district of New Orleans, Louisiana, four blocks south of The French Quarter. The Homewood Suites - New Orleans Property was built in 2002 and comprises 136 one-bedroom suites and 30 two-bedroom suites. All of the suites include a sleeping area, bathroom, sitting area and a fully equipped kitchen. Amenities at the Homewood Suites - New Orleans Property include an indoor pool, jacuzzi, fitness center, business center, sundry shop, valet parking, guest laundry and complimentary breakfast and evening receptions. The Homewood Suites - New Orleans Property also contains 5,168 square feet of meeting space including a boardroom and ballrooms on the mezzanine and second floors. The borrower under the Homewood Suites – New Orleans Mortgage Loan entered into a franchise agreement with Hilton Hotels Corporation, that expires in November 2020. The sponsor purchased the Homewood Suites – New Orleans Property for $43,000,000 ($259,036 per room) in November 2006 and retains $16.0 million of cash equity ahead of the Homewood Suites – New Orleans Mortgage Loan.
The borrower is in the process of completing an approximate $2.0 million ($12,199 per room) Property Improvement Plan (“PIP”), which includes improvements to guestroom carpet, furniture and painting ($1,675,000) and public space carpet and furniture ($350,000). The PIP is expected to be completed in October 2014 and the remaining PIP amount as of the note date was reserved for at closing (See “Escrows” section below and see “Description of the Mortgage Pool—Tenant or Other Third Party Issues—Other Matters” in the Free Writing Prospectus).
Operating History and Underwritten Net Cash Flow. The following table presents certain information relating to the historical operating performance and the Underwritten Net Cash Flow at the Homewood Suites - New Orleans Property:
Cash Flow Analysis
| 2011 | 2012 | 2013 | TTM 6/30/2014 | U/W | U/W $ per Room | |||||||
| Occupancy | 83.5% | 84.1% | 77.7%(1) | 73.8%(1) | 73.8% | |||||||
| ADR | $141.80 | $153.27 | $168.74 | $171.94 | $171.94 | |||||||
| RevPAR | $118.36 | $128.87 | $131.19 | $126.81 | $126.89 | |||||||
| Total Revenue | $7,640,606 | $8,316,687 | $8,368,799 | $8,067,599 | $8,072,544 | $48,630 | ||||||
| Total Department Expenses | 1,579,318 | 1,617,228 | 1,668,672 | 1,594,565 | 1,603,025 | $9,657 | ||||||
| Gross Operating Profit | $6,061,288 | $6,699,459 | $6,700,127 | $6,473,034 | $6,469,519 | $38,973 | ||||||
| Total Undistributed Expenses | 2,267,461 | 2,491,396 | 2,458,280 | 2,408,146 | 2,467,612 | $14,865 | ||||||
| Profit Before Fixed Charges | $3,793,827 | $4,208,063 | $4,241,847 | $4,064,888 | $4,001,907 | $24,108 | ||||||
| Total Fixed Charges | 353,339 | 340,669 | 416,654 | 428,817 | 428,817 | $2,583 | ||||||
| Net Operating Income | $3,440,488 | $3,867,394 | $3,825,193 | $3,636,070 | $3,573,090 | $21,525 | ||||||
| FF&E | 0 | 0 | 0 | 0 | 322,902 | $1,945 | ||||||
| Net Cash Flow | $3,440,488 | $3,867,394 | $3,825,193 | $3,636,070 | $3,250,188 | $19,579 | ||||||
| NOI DSCR | 1.94x | 2.18x | 2.15x | 2.05x | 2.01x | |||||||
| NCF DSCR | 1.94x | 2.18x | 2.15x | 2.05x | 1.83x | |||||||
| NOI DY | 12.8% | 14.3% | 14.2% | 13.5% | 13.3% | |||||||
| NCF DY | 12.8% | 14.3% | 14.2% | 13.5% | 12.1% | |||||||
| (1) | The decrease in occupancy in 2013 and TTM 6/30/2014 is due to a decrease in government demand as a result of government sequestration and as FEMA and United States Coast Guard employees were relocated after work surrounding the Deepwater Horizon oil spill and Hurricane Katrina lessened. |
Appraisal. As of the appraisal valuation date of May 26, 2014, the Homewood Suites - New Orleans Property had an “as-is” appraised value of $45,700,000 and an “as renovated” value of $46,700,000, which assumes that the PIP is complete as of November 26, 2014. The appraisal also concluded to an “as stabilized” value of $48,300,000 with a valuation date of November 26, 2015.
Environmental Matters. According to the Phase I environmental site assessment dated June 26, 2014, there was no evidence of any recognized environmental conditions (“REC”) at the Homewood Suites - New Orleans Property, but a parking parcel previously owned by the borrower was determined to have an REC. See “Description of the Mortgage Pool—Assessments of Property Value and Condition” in the Free Writing Prospectus.
THE INFORMATION IN THIS STRUCTURAL AND COLLATERAL TERM SHEET IS NOT COMPLETE AND MAY BE AMENDED PRIOR TO THE TIME OF SALE. THIS TERM SHEET IS NOT AN OFFER TO SELL THESE SECURITIES AND IT IS NOT A SOLICITATION OF AN OFFER TO BUY THESE SECURITIES IN ANY JURISDICTION WHERE THE OFFER OR SALE IS NOT PERMITTED.
91
HOMEWOOD SUITES – NEW ORLEANS |
Market Overview and Competition. The Homewood Suites - New Orleans Property is located in New Orleans, Louisiana, along the north side of Poydras Street, bounded by Perdido Street to the north and Baronne Street to the east. The Homewood Suites – New Orleans is located in the central business district, three blocks east of the Louisiana Superdome and four blocks south of The French Quarter. The neighborhood that encompasses the central business district also contains the New Orleans Morial Convention Center (recent improvements include a new entrance and 60,300 square foot column-free ballroom), the Riverfront, Harrah’s Casino and the Tulane Medical Center. New Orleans recently hosted numerous events including the annual Mardi Gras celebration, the Sugar Bowl, the Superbowl and WrestleMania.
New development has also fueled New Orleans’ growth. The Outlet Collection at Riverwalk (0.6 miles east of the Homewood Suites – New Orleans Property) opened May 22, 2014 as the nation’s first downtown outlet center. Following an $80.0 million redevelopment, The Outlet Collection at Riverwalk is 99% leased to retailers such as Neiman Marcus Last Call Studio, Coach, Forever 21 and Tommy Bahama. Further, within three miles of the Homewood Suites – New Orleans Property, construction of two new hospitals (the $1.2 billion University Medical Center teaching hospital and the 1.6 million square foot Veterans Administration Hospital) is scheduled to be complete in 2015 and 2016. Development in the New Orleans BioDistrict is expected to create 34,000 jobs over the next 20 years. According to the appraisal, in 2013, New Orleans had 9.3 million visitors that spent $6.0 billion in the city. This is the highest visitor spending ever recorded in the city’s history. The CBD/French Quarter/Warehouse District/Convention Center submarket contains more than 23,000 hotel rooms. According to the appraisal, for the trailing 12-month period as of the first quarter of 2014, the submarket had an average occupancy of 70.1%, ADR of $171.29 and RevPAR of $120.11.
The following table presents certain information relating to the Homewood Suites - New Orleans Property’s competitive set:
Subject and Market Historical Occupancy, ADR and RevPAR(1)
Competitive Set | Homewood Suites - New Orleans | Penetration Factor | |||||||||||||||
Year | Occupancy | ADR | RevPAR | Occupancy | ADR | RevPAR | Occupancy | ADR | RevPAR | ||||||||
| 6/30/2014 TTM | 66.5% | $142.02 | $94.38 | 73.3% | $172.93 | $126.81 | 110.3% | 121.8% | 134.4% | ||||||||
| 6/30/2013 TTM | 68.5% | $139.56 | $95.59 | 82.2% | $159.91 | $131.40 | 120.0% | 114.6% | 137.5% | ||||||||
| 6/30/2012 TTM | 62.9% | $127.73 | $80.39 | 83.1% | $148.72 | $123.66 | 132.1% | 116.4% | 153.8% | ||||||||
| (1) | Information obtained from a third party hospitality report dated July 18, 2014. The competitive set includes the following hotels: Embassy Suites New Orleans Convention Center, Hampton Inn & Suites New Orleans Downtown French Quarter Area, Courtyard New Orleans Downtown, Residence Inn New Orleans Downtown, Drury Inn & Suites New Orleans, Hilton Garden Inn New Orleans Convention Center, Wyndham The Whitney, Springhill Suites New Orleans Downtown and Cotton Exchange Hotel (currently closed for renovations). |
The Borrower. The borrower is Apple Seven SPE New Orleans, L.P., a Virginia limited partnership and a single purpose entity with one independent director. Legal counsel to the borrower delivered a non-consolidation opinion in connection with the origination of the Homewood Suites - New Orleans Mortgage Loan. Apple Hospitality REIT, Inc. is the guarantor of certain nonrecourse carveouts under the Homewood Suites - New Orleans Mortgage Loan.
The Sponsors. The sponsor is Apple Hospitality REIT, Inc., a public, non-listed hospitality real estate investment trust that was formed in March 2014 through the merger of Apple REIT Seven, Inc. and Apple REIT Eight, Inc., to acquire income producing real estate. As of June 30, 2014, Apple Hospitality REIT, Inc.’s real estate portfolio comprised ownership interests in 188 hotels with 23,489 guestrooms located in 33 states. Apple Hospitality REIT, Inc. is a party to three class action lawsuits relating to the merger of Apple REIT Seven, Inc. and Apple REIT Eight, Inc. See “Description of the Mortgage Pool—Litigation Considerations” in the Free Writing Prospectus.
Operating Lessee. The borrower leases the Homewood Suites - New Orleans Property to Apple Seven Services New Orleans, L.P. (the “Homewood Suites - New Orleans Operating Lessee”) pursuant to an operating lease (the “Homewood Suites - New Orleans Operating Lease”). The Homewood Suites - New Orleans Operating Lessee is an affiliate of the borrower. Pursuant to the Homewood Suites - New Orleans Operating Lease, the Homewood Suites Operating Lessee receives revenue from the Homewood Suites - New Orleans Property and pays the borrower, as rent, the revenues from the operation of the Homewood Suites – New Orleans Property net of certain expenses and a management fee. The Homewood Suites - New Orleans Operating Lessee is not a single purpose bankruptcy remote entity. The Homewood Suites – New Orleans Operating Lease is subordinated to the Homewood Suites – New Orleans Property mortgage. See “Risk Factors—Risks Related to the Mortgage Loans—The Borrower’s Form of Entity May Cause Special Risks” in the Free Writing Prospectus.
Escrows. The loan documents provide for upfront escrows in the amount of $194,336 for real estate taxes and $1,341,000 for a PIP reserve. The lender may reassess its estimate of the future cost of the PIP and require the borrower to deposit 125% of the lender’s estimated future cost of the remaining PIP. The loan documents provide for monthly escrows in the amount of $27,763 for real estate taxes and FF&E reserves in an amount equal to the greater of (i) 1/12 of 4.0% of operating income for the prior fiscal year and (ii) the current FF&E monthly escrow ($26,934). In addition, a springing monthly cash flow escrow in the amount of $45,000 (subject to a cap of $1,000,000) is required upon (a) the occurrence of an event of default or (b) at any time the net cash flow debt service coverage ratio for any trailing 12-month period is less than or equal to 1.30x.
Ongoing monthly reserves for insurance are not required as long as (i) no event of default has occurred and is continuing; (ii) the Homewood Suites - New Orleans Property is covered by an acceptable blanket insurance policy; and (iii) the borrower provides the lender with evidence of renewal of the policies and timely proof of payment of insurance premiums.
THE INFORMATION IN THIS STRUCTURAL AND COLLATERAL TERM SHEET IS NOT COMPLETE AND MAY BE AMENDED PRIOR TO THE TIME OF SALE. THIS TERM SHEET IS NOT AN OFFER TO SELL THESE SECURITIES AND IT IS NOT A SOLICITATION OF AN OFFER TO BUY THESE SECURITIES IN ANY JURISDICTION WHERE THE OFFER OR SALE IS NOT PERMITTED.
92
HOMEWOOD SUITES – NEW ORLEANS |
Lockbox and Cash Management. Upon the occurrence of a Cash Trap Event Period (as defined below), the loan documents require that the borrower establish a lender-controlled lockbox account and that the borrower or property manager cause all receipts payable with respect to the Homewood Suites – New Orleans Property be deposited directly into such lockbox account. During a Cash Trap Event Period, all excess funds on deposit in the lockbox account are swept to a lender-controlled subaccount on a monthly basis.
A “Cash Trap Event Period” will commence upon the occurrence and continuance of an event of default and will expire upon the cure of such event of default.
Property Management. The Homewood Suites - New Orleans Property is managed by Dimension Development Two, LLC.
Assumption. The borrower has the two-time right to transfer the Homewood Suites - New Orleans Property provided that certain conditions are satisfied, including (i) no event of default has occurred and is continuing; (ii) the lender reasonably determines that the proposed transferee and guarantor satisfy the lender’s credit review and underwriting standards, taking into consideration transferee experience, financial strength and general business standing; and (iii) the lender has received confirmation from Fitch, Moody’s and Morningstar that such assumption will not result in a downgrade, withdrawal or qualification of the respective ratings assigned to the Series 2014-C23 Certificates.
Partial Release. Not permitted.
Real Estate Substitution. Not permitted.
Subordinate and Mezzanine Indebtedness. Not permitted.
Ground Lease. None.
Terrorism Insurance. The loan documents require that the “all risk” insurance policy required to be maintained by the borrower provide coverage for terrorism in an amount equal to the full replacement cost of the Homewood Suites - New Orleans Property, as well as business interruption insurance covering no less than the 12-month period following the occurrence of a casualty event, together with a six-month extended period of indemnity.
Windstorm Insurance: The loan documents require windstorm insurance covering the full replacement cost of the Homewood Suites – New Orleans Property during the loan term. At the time of closing, the Homewood Suites – New Orleans Property had insurance coverage for windstorm.
THE INFORMATION IN THIS STRUCTURAL AND COLLATERAL TERM SHEET IS NOT COMPLETE AND MAY BE AMENDED PRIOR TO THE TIME OF SALE. THIS TERM SHEET IS NOT AN OFFER TO SELL THESE SECURITIES AND IT IS NOT A SOLICITATION OF AN OFFER TO BUY THESE SECURITIES IN ANY JURISDICTION WHERE THE OFFER OR SALE IS NOT PERMITTED.
93
| CULVER CITY OFFICE PORTFOLIO |

THE INFORMATION IN THIS STRUCTURAL AND COLLATERAL TERM SHEET IS NOT COMPLETE AND MAY BE AMENDED PRIOR TO THE TIME OF SALE. THIS TERM SHEET IS NOT AN OFFER TO SELL THESE SECURITIES AND IT IS NOT A SOLICITATION OF AN OFFER TO BUY THESE SECURITIES IN ANY JURISDICTION WHERE THE OFFER OR SALE IS NOT PERMITTED.
94
| CULVER CITY OFFICE PORTFOLIO |
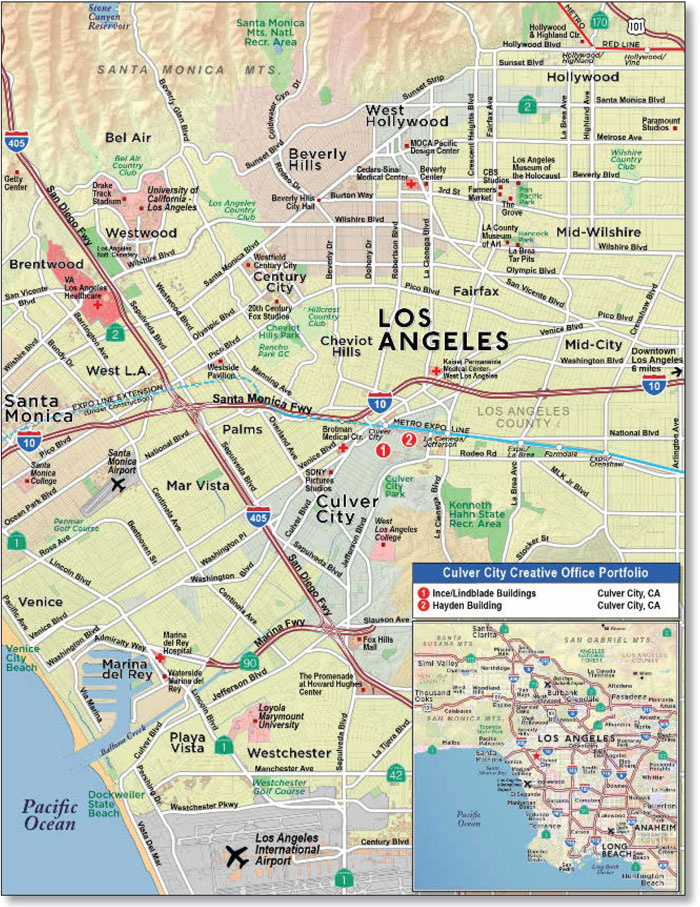
THE INFORMATION IN THIS STRUCTURAL AND COLLATERAL TERM SHEET IS NOT COMPLETE AND MAY BE AMENDED PRIOR TO THE TIME OF SALE. THIS TERM SHEET IS NOT AN OFFER TO SELL THESE SECURITIES AND IT IS NOT A SOLICITATION OF AN OFFER TO BUY THESE SECURITIES IN ANY JURISDICTION WHERE THE OFFER OR SALE IS NOT PERMITTED.
95
| No. 8 – Culver City Office Portfolio | |||||||
| Loan Information | Property Information | ||||||
| Mortgage Loan Seller: | Wells Fargo Bank, National Association | Single Asset/Portfolio: | Single Asset | ||||
Credit Assessment (Fitch/Moody’s/Morningstar): | NR/NR/NR | Property Type: | Office | ||||
| Original Principal Balance: | $25,300,000 | Specific Property Type: | CBD | ||||
| Cut-off Date Principal Balance: | $25,300,000 | Location: | Culver City, CA | ||||
| % of Initial Pool Balance: | 2.7% | Size: | 93,977 SF | ||||
| Loan Purpose: | Refinance | Cut-off Date Principal Balance Per SF: | $269.21 | ||||
| Borrower Name: | Conjunctive Points Properties III, L.P. | Year Built/Renovated(2): | Various | ||||
| Sponsors: | Frederick N. Smith; Laurie M. Smith | Title Vesting(3): | Fee/Leasehold | ||||
| Mortgage Rate: | 4.480% | Property Manager: | Self-managed | ||||
| Note Date: | September 8, 2014 | 3rd Most Recent Occupancy (As of)(4): | 65.7% (12/31/2011) | ||||
| Anticipated Repayment Date: | NAP | 2nd Most Recent Occupancy (As of)(4): | 72.3% (12/31/2012) | ||||
| Maturity Date: | September 11, 2024 | Most Recent Occupancy (As of): | 98.3% (12/31/2013) | ||||
| IO Period: | None | Current Occupancy (As of): | 100.0% (9/4/2014) | ||||
| Loan Term (Original): | 120 months | ||||||
| Seasoning: | 0 months | Underwriting and Financial Information: | |||||
| Amortization Term (Original): | 360 months | ||||||
| Loan Amortization Type: | Amortizing Balloon | 3rd Most Recent NOI (As of): | $1,511,481 (12/31/2012) | ||||
| Interest Accrual Method: | Actual/360 | 2nd Most Recent NOI (As of): | $2,031,003 (12/31/2013) | ||||
| Call Protection: | L(24),D(92),O(4) | Most Recent NOI (As of): | $2,509,085 (TTM 6/30/2014) | ||||
| Lockbox Type: | Hard/Upfront Cash Management | ||||||
| Additional Debt: | None | U/W Revenues: | $3,419,983 | ||||
| Additional Debt Type: | NAP | U/W Expenses: | $1,228,807 | ||||
| U/W NOI: | $2,191,176 | ||||||
Escrows and Reserves(1): | U/W NCF: | $2,025,463 | |||||
| U/W NOI DSCR: | 1.43x | ||||||
Type: | Initial | Monthly | Cap (If Any) | U/W NCF DSCR: | 1.32x | ||
| Taxes | $84,169 | $14,028 | NAP | U/W NOI Debt Yield: | 8.7% | ||
| Insurance | $0 | Springing | NAP | U/W NCF Debt Yield: | 8.0% | ||
| Replacement Reserves | $0 | $1,566 | $37,590 | As-Is Appraised Value: | $36,900,000 | ||
| TI/LC | $500,000 | $11,747 | $500,000 | As-Is Appraisal Valuation Date: | July 8, 2014 | ||
| Rent Concession Reserve | $126,027 | $0 | NAP | Cut-off Date LTV Ratio: | 68.6% | ||
| Parking Lease Reserve | $0 | $7,100 | $7,100 | LTV Ratio at Maturity or ARD: | 55.4% | ||
| (1) | See “Escrows” section. |
| (2) | See “The Properties” section. |
| (3) | The borrower leases 54 off-site parking spaces related to the Hayden building, which are subject to a ground lease. See “Ground Lease” section. |
| (4) | See “Historical Occupancy” section. |
The Mortgage Loan. The mortgage loan (the “Culver City Office Portfolio Mortgage Loan”) is evidenced by a single promissory note that is secured by a first mortgage encumbering the fee interests in five office buildings situated on two non-contiguous parcels and the leasehold interest in 54 off-site parking spaces in Culver City, California (the “Culver City Office Portfolio Properties”). The Culver City Office Portfolio Mortgage Loan was originated on September 8, 2014 by Wells Fargo Bank, National Association. The Culver City Office Portfolio Mortgage Loan had an original principal balance of $25,300,000, has an outstanding principal balance as of the Cut-off Date of $25,300,000 and accrues interest at an interest rate of 4.480% per annum. The Culver City Office Portfolio Mortgage Loan had an initial term of 120 months, has a remaining term of 120 months as of the Cut-off Date and requires payments of principal and interest based on a 30-year amortization schedule. The Culver City Office Portfolio Mortgage Loan matures on September 11, 2024.
Following the lockout period, the borrower has the right to defease the Culver City Office Portfolio Mortgage Loan in whole, but not in part, on any due date before June 11, 2024. In addition, the Culver City Office Portfolio Mortgage Loan is prepayable without penalty on or after June 11, 2024.
THE INFORMATION IN THIS STRUCTURAL AND COLLATERAL TERM SHEET IS NOT COMPLETE AND MAY BE AMENDED PRIOR TO THE TIME OF SALE. THIS TERM SHEET IS NOT AN OFFER TO SELL THESE SECURITIES AND IT IS NOT A SOLICITATION OF AN OFFER TO BUY THESE SECURITIES IN ANY JURISDICTION WHERE THE OFFER OR SALE IS NOT PERMITTED.
96
| CULVER CITY OFFICE PORTFOLIO |
| Sources | Uses | |||||||
| Original loan amount | $25,300,000 | 100.0% | Loan payoff | $17,119,333 | 67.7% | |||
| Reserves | 710,196 | 02.8 | ||||||
| Closing costs | 336,737 | 01.3 | ||||||
| Return of equity | 7,133,734 | 28.2 | ||||||
| Total Sources | $25,300,000 | 100.0% | Total Uses | $25,300,000 | 100.0% |
The Properties. The Culver City Office Portfolio Properties comprise five, one- to four-story creative office buildings totaling 93,977 square feet of rentable area and situated on two non-contiguous parcels and the leasehold interest in 54 off-site parking spaces, all located in Culver City, California. Four of the five buildings that comprise the Culver City Office Portfolio Properties form a cohesive office park environment with the buildings encircling a shared central parking lot (the Ince/Lindblade buildings), while the remaining building (the Hayden building) is located approximately one mile away. The four Ince/Lindblade buildings were built in 1924, 1925 and 1952 and renovated in 1987 and total 46,801 square feet of rentable area. The Ince/Lindblade buildings are situated on a 1.6-acre parcel with 106 surface parking spaces, resulting in a parking ratio of 2.3 spaces per 1,000 square feet of rentable area. Built in 1997, the Hayden building comprises 47,176 square feet of rentable area and is situated on a 1.1-acre parcel with 78 surface parking spaces. The borrower leases an additional 54 off-site parking spaces (located approximately two blocks north of the Hayden building) from a sponsor-affiliated entity through January 2040, which combined with the 78 on-site parking spaces at the Hayden building, account for 132 parking spaces, resulting in a parking ratio of 2.8 spaces per 1,000 square feet of rentable area. As of September 4, 2014, the Culver City Office Portfolio Properties were 100.0% leased by 19 tenants.
The following table presents certain information relating to the tenancy at the Culver City Office Portfolio Properties:
Major Tenants
| Tenant Name | Credit Rating (Fitch/Moody’s/ S&P) | Tenant NRSF | % of NRSF | Annual U/W Base Rent PSF | Annual U/W Base Rent | % of Total Annual U/W Base Rent | Lease Expiration Date | |||
| Major Tenants | ||||||||||
Blur Studios(1) | NR/NR/NR | 24,384 | 25.9% | $32.75(1) | $798,674(1) | 26.3% | 10/31/2023 | |||
The Tennis Channel(2)(3) | NR/NR/NR | 17,355 | 18.5% | $31.84 | $552,653 | 18.2% | Various(2) | |||
| Hornet Animations | NR/NR/NR | 8,660 | 9.2% | $32.46 | $281,104 | 9.3% | 3/31/2018 | |||
PCCP Studio City(4)(5) | NR/NR/NR | 8,160 | 8.7% | $32.10 | $261,915 | 8.6% | 12/31/2014 | |||
Fullscreen, Inc.(5) | NR/NR/NR | 5,597 | 6.0% | $33.00 | $184,701 | 6.1% | 3/31/2015 | |||
| Total Major Tenants | 64,156 | 68.3% | $32.41 | $2,079,046 | 68.5% | |||||
| Non-Major Tenants | 29,821 | 31.7% | $32.01 | $954,557 | 31.5% | |||||
| Occupied Collateral Total | 93,977 | 100.0% | $32.28 | $3,033,603 | 100.0% | |||||
| Vacant Space | 0 | 0.0% | ||||||||
| Collateral Total | 93,977 | 100.0% | ||||||||
| (1) | Blur Studios has monthly rent abatements of up to 50% in May 2015, May 2016, November 2018, May 2019, November 2019, May 2020 and November 2020. The rent abatements occurring through November 2018 were reserved for as a portion of the Rent Concession Reserve (see “Escrows” section). The remaining rent abatements were not reserved for, as the contractual net effective annual rents in these years are higher than the Annual U/W Base Rent due to contractual rental rate increases. |
| (2) | The Tennis Channel leases three spaces at the Hayden building: 10,608 square feet on the fourth floor with an Annual U/W Base Rent PSF of $32.13 and Lease Expiration Date of September 30, 2015; 5,575 square feet on the first floor with an Annual U/W Base Rent PSF of $31.06 and Lease Expiration Date of August 31, 2018; and 1,172 square feet on the second floor with an Annual U/W Base Rent PSF of $33.00 and Lease Expiration Date of September 30, 2015. |
| (3) | The Tennis Channel does not occupy a majority of its space, but instead, as part of its business model, offers its space to clients who operate under service agreements to utilize The Tennis Channel’s space and audio visual equipment. AlJazeerAmerica currently occupies The Tennis Channel’s fourth floor space under a service agreement. MNet currently occupies The Tennis Channel’s first floor space and shares approximately half of the second floor space with The Tennis Channel under a service agreement. |
| (4) | PCCP Studio City subleases its entire space to Fullscreen, Inc. |
| (5) | PCCP Studio City and Fullscreen, Inc. have indicated that they will vacate their respective spaces on March 31, 2015 (Fullscreen Inc. intends to extend the lease on the PCCP Studio City space, which it currently subleases, to be coterminous with its primary space with a March 31, 2015 lease expiration date). The borrower has executed two leases with Eric Owen Moss Architects and Samitaur Medical Technologies, LLC to take over the PCCP Studio City and Fullscreen, Inc. spaces, respectively. Both replacement tenants are borrower-affiliated entities and have each signed three-year leases with a rental rate of $33.00 per square foot, modified gross. In addition, both replacement tenant leases will include a landlord termination option such that if the borrower enters into a new replacement lease with a tenant acceptable to the lender at a rental rate equal to or greater than $30.00 per square foot, modified gross, and for a term not less than three years, the borrower can terminate the applicable borrower-affiliated lease upon occupancy by the new replacement tenant. |
THE INFORMATION IN THIS STRUCTURAL AND COLLATERAL TERM SHEET IS NOT COMPLETE AND MAY BE AMENDED PRIOR TO THE TIME OF SALE. THIS TERM SHEET IS NOT AN OFFER TO SELL THESE SECURITIES AND IT IS NOT A SOLICITATION OF AN OFFER TO BUY THESE SECURITIES IN ANY JURISDICTION WHERE THE OFFER OR SALE IS NOT PERMITTED.
97
| CULVER CITY OFFICE PORTFOLIO |
The following table presents certain information relating to the lease rollover schedule at the Culver City Office Portfolio Properties:
Lease Expiration Schedule(1)(2)
Year Ending December 31, | No. of Leases Expiring | Expiring NRSF | % of Total NRSF | Cumulative Expiring NRSF | Cumulative % of Total NRSF | Annual U/W Base Rent | Annual U/W Base Rent PSF |
| MTM | 0 | 0 | 0.0% | 0 | 0.0% | $0 | $0.00 |
| 2014 | 2 | 8,832 | 9.4% | 8,832 | 9.4% | $284,091 | $32.17 |
| 2015 | 11 | 32,841 | 34.9% | 41,673 | 44.3% | $1,052,747 | $32.06 |
| 2016 | 5 | 8,567 | 9.1% | 50,240 | 53.5% | $277,984 | $32.45 |
| 2017 | 2 | 5,118 | 5.4% | 55,358 | 58.9% | $165,822 | $32.40 |
| 2018 | 2 | 14,235 | 15.1% | 69,593 | 74.1% | $454,286 | $31.91 |
| 2019 | 0 | 0 | 0.0% | 69,593 | 74.1% | $0 | $0.00 |
| 2020 | 0 | 0 | 0.0% | 69,593 | 74.1% | $0 | $0.00 |
| 2021 | 0 | 0 | 0.0% | 69,593 | 74.1% | $0 | $0.00 |
| 2022 | 0 | 0 | 0.0% | 69,593 | 74.1% | $0 | $0.00 |
| 2023 | 1 | 24,384 | 25.9% | 93,977 | 100.0% | $798,674 | $32.75 |
| 2024 | 0 | 0 | 0.0% | 93,977 | 100.0% | $0 | $0.00 |
| Thereafter | 0 | 0 | 0.0% | 93,977 | 100.0% | $0 | $0.00 |
| Vacant | 0 | 0 | 0.0% | 93,977 | 100.0% | $0 | $0.00 |
| Total/Weighted Average | 23 | 93,977 | 100.0% | $3,033,603 | $32.28 |
| (1) | Information obtained from the underwritten rent roll. |
| (2) | Certain tenants may have lease termination options that are exercisable prior to the originally stated expiration date of the subject lease and that are not considered in the Lease Expiration Schedule. |
The following table presents historical occupancy percentages at the Culver City Office Portfolio Properties:
Historical Occupancy
12/31/2011(1)(2) | 12/31/2012(1)(2) | 12/31/2013(1) | 9/4/2014(3) | |||
| 65.7% | 72.3% | 98.3% | 100.0% |
| (1) | Information obtained from the borrower. |
| (2) | The low occupancy in 2011 and 2012 was primarily due to Sony Pictures, which occupied 25.9% of the net rentable area of the Culver City Office Portfolio Properties, vacating its space at lease expiration in July 2011. The borrower significantly renovated the space and ultimately re-leased the entire space to Blur Studios in January 2013. The Culver City Office Portfolio Properties were 99.8% occupied as of December 31, 2008; 99.8% occupied as of December 31, 2009; and 87.8% occupied as of December 31, 2010. |
| (3) | Information obtained from the underwritten rent roll. |
Operating History and Underwritten Net Cash Flow. The following table presents certain information relating to the Underwritten Net Cash Flow at the Culver City Office Portfolio Properties:
Cash Flow Analysis
| 2012 | 2013 | TTM 6/30/2014 | U/W | U/W $ per SF | ||||||
| Base Rent | $1,956,694 | $2,498,632 | $2,853,869 | $3,033,603 | $32.28 | |||||
| Grossed Up Vacant Space | 0 | 0 | 0 | 0 | 0.00 | |||||
| Total Reimbursables | 272,607 | 321,087 | 415,865 | 357,857 | 3.81 | |||||
| Other Income | 194,766 | 301,547 | 316,958 | 301,547 | 3.21 | |||||
| Less Vacancy & Credit Loss | 0 | 0 | 0 | (273,024)(1) | (2.91) | |||||
| Effective Gross Income | $2,424,067 | $3,121,266 | $3,586,692 | $3,419,983 | $36.39 | |||||
| Total Operating Expenses | $912,586 | $1,090,262 | $1,077,607 | $1,228,807 | $13.08 | |||||
| Net Operating Income | $1,511,481 | $2,031,003 | $2,509,085 | $2,191,176(2) | $23.32 | |||||
| TI/LC | 0 | 0 | 0 | 146,917 | 1.56 | |||||
| Capital Expenditures | 0 | 0 | 0 | 18,795 | 0.20 | |||||
| Net Cash Flow | $1,511,481 | $2,031,003 | $2,509,085 | $2,025,463 | $21.55 | |||||
| NOI DSCR | 0.98x | 1.32x | 1.63x | 1.43x | ||||||
| NCF DSCR | 0.98x | 1.32x | 1.63x | 1.32x | ||||||
| NOI DY | 6.0% | 8.0% | 9.9% | 8.7% | ||||||
| NCF DY | 6.0% | 8.0% | 9.9% | 8.0% |
| (1) | The underwritten economic vacancy is 9.0%. The Culver City Office Portfolio Properties were 100.0% physically occupied as of September 4, 2014. |
| (2) | The decrease in U/W Net Operating Income is primarily due to the underwritten vacancy factor, which was also applied to U/W Total Reimbursables, and higher U/W Total Operating Expenses. |
THE INFORMATION IN THIS STRUCTURAL AND COLLATERAL TERM SHEET IS NOT COMPLETE AND MAY BE AMENDED PRIOR TO THE TIME OF SALE. THIS TERM SHEET IS NOT AN OFFER TO SELL THESE SECURITIES AND IT IS NOT A SOLICITATION OF AN OFFER TO BUY THESE SECURITIES IN ANY JURISDICTION WHERE THE OFFER OR SALE IS NOT PERMITTED.
98
| CULVER CITY OFFICE PORTFOLIO |
Environmental Matters. According to the Phase I environmental reports dated July 17, 2014, there was no evidence of any recognized environmental conditions at the Culver City Office Portfolio Properties.
Market Overview and Competition. Culver City is located just southeast of the intersection of the San Diego Freeway (Interstate 405) and the Santa Monica Freeway (Interstate 10), approximately six miles north of Los Angeles International Airport (LAX), five miles east of Marina del Rey and the Pacific Ocean, seven miles southeast of Santa Monica, five miles south of Beverly Hills and 11 miles west of downtown Los Angeles. The commercial center of Culver City is its downtown historic core, nearby the Sony Pictures and Culver Studios. The main Northeast/Southwest commercial arteries in the area include Washington Boulevard, Culver Boulevard, Jefferson Boulevard and Venice Boulevard; and the main Northwest/Southeast corridors include Sepulveda Boulevard and National Boulevard. Due to its proximity and easy access to both the business and entertainment industries, Culver City has become a highly desirable development location in recent years. Completed in April 2012, Phase I of the Metro Expo Line is a new $932 million, 8.6-mile light rail line that connects Culver City with the central business district of Los Angeles with an average travel time of less than 30 minutes. With over 28,000 average weekday riders during the first quarter of 2014, the Metro Expo Line has already exceeded its goal to have 27,000 daily riders by year-end 2020. Phase II of the Metro Expo Line will comprise a 6.6-mile extension from Culver City to Santa Monica and is expected to be completed in 2015 at a total estimated cost of approximately $1.5 billion. By 2030, an estimated 64,000 daily riders are expected for the Metro Expo Line, which would make it one of the most heavily used light rail lines in the United States. The Hayden building is located approximately two blocks west of the La Cienega/Jefferson light rail stop, and the Ince/Lindblade parcel is located approximately two blocks south of the Culver City light rail stop. As of 2014, the estimated population within a one-, three- and five-mile radius of the Culver City Office Portfolio Properties was 27,686, 310,006 and 914,270, respectively. The average household income within the same one-, three- and five-mile radii was $73,026, $78,899 and $78,357, respectively.
According to a third party market research report, the Culver City Office Portfolio Properties are located within the Culver City submarket. As of the second quarter of 2014, the submarket reported a total inventory of 473 office properties totaling approximately 8.2 million square feet with a 9.0% vacancy rate and average asking rents of $31.37 per square foot, full service. The appraiser identified a competitive set for the Culver City Office Portfolio Properties, which comprised 44 creative office buildings totaling 1.7 million square feet. As of July 2014, this competitive set reported a 2.3% vacancy rate with average asking rents of $39.00 per square foot, on a full service gross basis.
The following table presents certain information relating to comparable office properties for the Culver City Office Portfolio Properties:
Competitive Set
Culver City Office Portfolio (Subject) | 3562-3582 Eastham | Conjunctive Points (3501 Hayden Avenue) | 8660 Hayden | Hayden Creative | Jefferson Palms | |
| Location | Culver City, CA | Culver City, CA | Culver City, CA | Culver City, CA | Culver City, CA | Culver City, CA |
Distance from Subject(1) | -- | 1.1 miles | 0.9 miles | 0.9 miles | 1.0 mile | 1.1 miles |
| Property Type | Creative Office | Creative Office | Creative Office | Creative Office | Creative Office | Creative Office |
| Year Built/Renovated | Various | 1952/2000 | 1945-2014/NAP | 1979/NAP | 1976/2014 | 1949/2009 |
| Stories | 1-4 | 1 | 1-2 | 1 | 2 | 1 |
| Total GLA | 93,977 SF | 70,700 SF | 155,942 SF | 78,947 SF | 76,892 SF | 66,000 SF |
| Occupancy | 100% | 100% | 99% | 100% | 100% | 100% |
| (1) | Distance from Subject represents the greater of the distance of each comparable property from the Hayden building and the Ince/Lindblade buildings. |
The Borrower. The borrower is Conjunctive Points Properties III, L.P., a single purpose entity with one independent director. Legal counsel to the borrower delivered a non-consolidation opinion in connection with origination of the Culver City Office Portfolio Mortgage Loan. Frederick N. Smith and Laurie M. Smith are the guarantors of certain nonrecourse carveouts under the Culver City Office Portfolio Mortgage Loan.
The Sponsors. The sponsors are Frederick N. Smith and Laurie M. Smith. As of December 31, 2013, Mr. Smith owned a portfolio of nine creative office properties in Culver City totaling approximately 501,000 square feet with an average occupancy rate of 96.8%.
Escrows. The loan documents provide for upfront escrows in the amount of $84,169 for real estate taxes, $500,000 for tenant improvements and leasing commissions (“TI/LCs”) and $126,027 for scheduled future rent concessions for Carat Inc./Vizeum ($7,329), LA World Affairs Council ($13,690) and Blur Studios ($105,008). The loan documents also provide for ongoing monthly escrows of $14,028 for real estate taxes, $1,566 for replacement reserves (subject to a cap of $37,590), $11,747 for TI/LCs (subject to a cap of $500,000) and $7,100 for leased parking rent associated with the Hayden building (subject to a cap of $7,100). The loan documents do not require monthly escrows for insurance provided (i) no event of default has occurred and is continuing; (ii) the insurance required to be maintained by the borrower is maintained pursuant to one or more blanket insurance policies; and (iii) the borrower provides the lender with timely proof of payment of insurance premiums.
Lockbox and Cash Management. The Culver City Office Portfolio Mortgage Loan requires a lender-controlled lockbox account, which is already in place, and that the borrower direct the tenants to pay their rents directly into such lockbox account. The loan
THE INFORMATION IN THIS STRUCTURAL AND COLLATERAL TERM SHEET IS NOT COMPLETE AND MAY BE AMENDED PRIOR TO THE TIME OF SALE. THIS TERM SHEET IS NOT AN OFFER TO SELL THESE SECURITIES AND IT IS NOT A SOLICITATION OF AN OFFER TO BUY THESE SECURITIES IN ANY JURISDICTION WHERE THE OFFER OR SALE IS NOT PERMITTED.
99
| CULVER CITY OFFICE PORTFOLIO |
documents also require that all cash revenues and all other monies received by the borrower or property manager relating to the Culver City Office Portfolio Properties be deposited into the lockbox account within one business day after receipt. Prior to the occurrence of a Cash Trap Event Period (as defined below), all excess funds on deposit in the lockbox account are swept into the borrowers’ operating account on a monthly basis. During a Cash Trap Event Period, all funds on deposit in the lockbox account are swept to a lender-controlled cash management account on a monthly basis.
A “Cash Trap Event Period” will commence upon the earlier of (i) the occurrence and continuance of an event of default or (ii) the debt service coverage ratio falling below 1.15x at the end of any calendar month. A Cash Trap Event Period will expire, with regard to clause (i), upon the cure of such event of default; and with regard to clause (ii), upon the debt service coverage ratio being equal to or greater than 1.20x for two consecutive calendar quarters.
Property Management. The Culver City Office Portfolio Properties are managed by an affiliate of the borrower.
Assumption. The borrowers have a two-time right to transfer the Culver City Office Portfolio Properties, provided that no event of default has occurred and is continuing and certain other conditions are satisfied, including (i) the lender’s reasonable determination that the proposed transferee and guarantor satisfy the lender’s credit review and underwriting standards, taking into consideration transferee experience, financial strength and general business standing; (ii) execution of a recourse guaranty and an environmental indemnity by an affiliate of the transferee; and (iii) if requested by the lender, rating agency confirmation from Fitch, Moody’s and Morningstar that the transfer will not result in a downgrade, withdrawal or qualification of the respective ratings assigned to the Series 2014-C23 Certificates.
Partial Release. Not permitted.
Real Estate Substitution. Not permitted.
Subordinate and Mezzanine Indebtedness. Not permitted.
Ground Lease. The borrower leases 54 off-site parking spaces related to the Hayden building, which are subject to a ground lease that expires in January 2040.
Terrorism Insurance. The loan documents require that the “all risk” insurance policy required to be maintained by the borrowers provide coverage for terrorism in an amount equal to the full replacement cost of the Culver City Office Portfolio Properties. The loan documents also require business interruption insurance covering no less than the 12-month period following the occurrence of a casualty event, together with a six-month extended period of indemnity.
Earthquake Insurance. The loan documents do not require earthquake insurance. The seismic report indicated a probable maximum loss of 18% for each of the Culver City Office Portfolio Properties.
THE INFORMATION IN THIS STRUCTURAL AND COLLATERAL TERM SHEET IS NOT COMPLETE AND MAY BE AMENDED PRIOR TO THE TIME OF SALE. THIS TERM SHEET IS NOT AN OFFER TO SELL THESE SECURITIES AND IT IS NOT A SOLICITATION OF AN OFFER TO BUY THESE SECURITIES IN ANY JURISDICTION WHERE THE OFFER OR SALE IS NOT PERMITTED.
100
(THIS PAGE INTENTIONALLY LEFT BLANK)
101
(THIS PAGE INTENTIONALLY LEFT BLANK)
102
| SLATTEN RANCH SHOPPING CENTER |
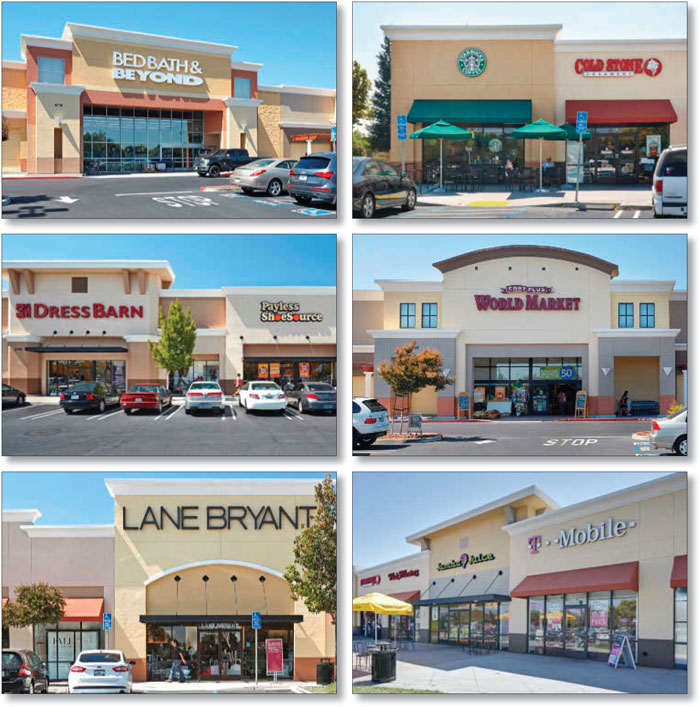
THE INFORMATION IN THIS STRUCTURAL AND COLLATERAL TERM SHEET IS NOT COMPLETE AND MAY BE AMENDED PRIOR TO THE TIME OF SALE. THIS TERM SHEET IS NOT AN OFFER TO SELL THESE SECURITIES AND IT IS NOT A SOLICITATION OF AN OFFER TO BUY THESE SECURITIES IN ANY JURISDICTION WHERE THE OFFER OR SALE IS NOT PERMITTED.
103
| SLATTEN RANCH SHOPPING CENTER |
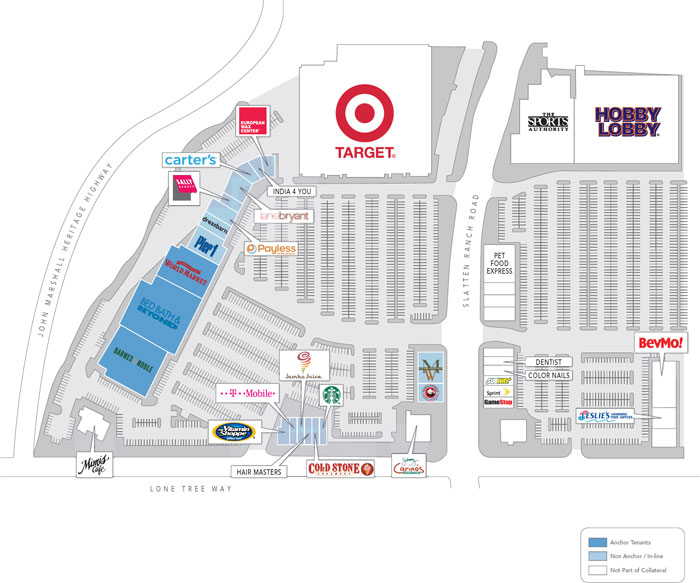
THE INFORMATION IN THIS STRUCTURAL AND COLLATERAL TERM SHEET IS NOT COMPLETE AND MAY BE AMENDED PRIOR TO THE TIME OF SALE. THIS TERM SHEET IS NOT AN OFFER TO SELL THESE SECURITIES AND IT IS NOT A SOLICITATION OF AN OFFER TO BUY THESE SECURITIES IN ANY JURISDICTION WHERE THE OFFER OR SALE IS NOT PERMITTED.
104
| SLATTEN RANCH SHOPPING CENTER |
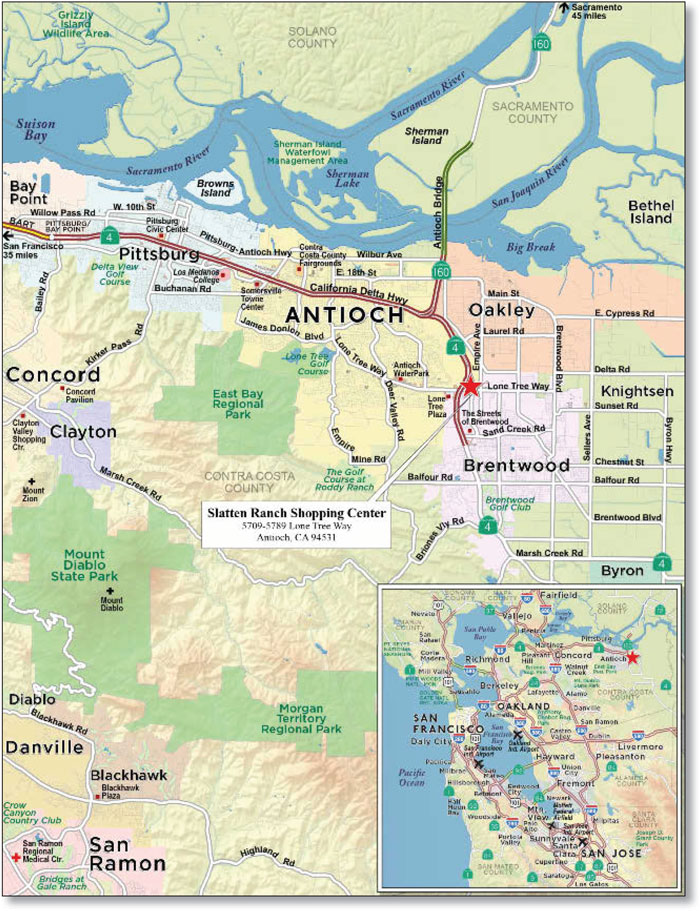
THE INFORMATION IN THIS STRUCTURAL AND COLLATERAL TERM SHEET IS NOT COMPLETE AND MAY BE AMENDED PRIOR TO THE TIME OF SALE. THIS TERM SHEET IS NOT AN OFFER TO SELL THESE SECURITIES AND IT IS NOT A SOLICITATION OF AN OFFER TO BUY THESE SECURITIES IN ANY JURISDICTION WHERE THE OFFER OR SALE IS NOT PERMITTED.
105
| No. 9 – Slatten Ranch Shopping Center | |||||||||
| Loan Information | Property Information | ||||||||
| Mortgage Loan Seller: | Wells Fargo Bank, National Association | Single Asset/Portfolio: | Single Asset | ||||||
Credit Assessment (Fitch/Moody’s/Morningstar): | NR/NR/NR | Property Type: | Retail | ||||||
| Original Principal Balance: | $25,200,000 | Specific Property Type: | Anchored | ||||||
| Cut-off Date Principal Balance: | $25,200,000 | Location: | Antioch, CA | ||||||
| % of Initial Pool Balance: | 2.7% | Size: | 118,250 SF | ||||||
| Loan Purpose: | Refinance | Cut-off Date Principal Balance Per SF: | $213.11 | ||||||
| Borrower Name: | Camden Village LLC | Year Built/Renovated: | 2003/NAP | ||||||
| Sponsors: | Mark S. Carter; Leland S. Kraemer; Fred T. Kroger | Title Vesting: | Fee | ||||||
| Mortgage Rate: | 4.300% | Property Manager: | Colliers Parrish Asset Management, Inc. | ||||||
| Note Date: | July 11, 2014 | 3rd Most Recent Occupancy (As of): | 96.8% (12/31/2011) | ||||||
| Anticipated Repayment Date: | NAP | 2nd Most Recent Occupancy (As of): | 100.0% (12/31/2012) | ||||||
| Maturity Date: | July 11, 2024 | Most Recent Occupancy (As of): | 100.0% (12/31/2013) | ||||||
| IO Period: | 60 months | Current Occupancy (As of): | 100.0% (6/30/2014) | ||||||
| Loan Term (Original): | 120 months | ||||||||
| Seasoning: | 2 months | Underwriting and Financial Information: | |||||||
| Amortization Term (Original): | 360 months | ||||||||
| Loan Amortization Type: | Interest-only, Amortizing Balloon | 3rd Most Recent NOI (As of): | $2,567,383 (12/31/2012) | ||||||
| Interest Accrual Method: | Actual/360 | 2nd Most Recent NOI (As of): | $2,542,407 (12/31/2013) | ||||||
| Call Protection: | L(26),D(90),O(4) | Most Recent NOI (As of): | $2,555,041 (TTM 4/30/2014) | ||||||
| Lockbox Type: | Soft/Springing Cash Management | ||||||||
| Additional Debt: | None | U/W Revenues: | $3,343,329 | ||||||
| Additional Debt Type: | NAP | U/W Expenses: | $1,056,465 | ||||||
| U/W NOI: | $2,286,864 | ||||||||
| U/W NCF: | $2,143,976 | ||||||||
| U/W NOI DSCR: | 1.53x | ||||||||
Escrows and Reserves(1): | U/W NCF DSCR: | 1.43x | |||||||
| U/W NOI Debt Yield: | 9.1% | ||||||||
Type: | Initial | Monthly | Cap (If Any) | U/W NCF Debt Yield: | 8.5% | ||||
| Taxes | $79,980 | $26,660 | NAP | As-Is Appraised Value: | $36,800,000 | ||||
| Insurance | $0 | Springing | NAP | As-Is Appraisal Valuation Date: | May 28, 2014 | ||||
| Replacement Reserves | $0 | $3,569 | NAP | Cut-off Date LTV Ratio: | 68.5% | ||||
| TI/LC | $0 | Springing | $295,625 | LTV Ratio at Maturity or ARD: | 62.5% | ||||
| (1) | See “Escrows” section. |
The Mortgage Loan. The mortgage loan (the “Slatten Ranch Shopping Center Mortgage Loan”) is evidenced by a single promissory note that is secured by a first mortgage encumbering an anchored retail center located in Antioch, California (the “Slatten Ranch Shopping Center Property”). The Slatten Ranch Shopping Center Mortgage Loan was originated on July 11, 2014 by Wells Fargo Bank, National Association. The Slatten Ranch Shopping Center Mortgage Loan had an original principal balance of $25,200,000, has an outstanding principal balance as of the Cut-off Date of $25,200,000 and accrues interest at an interest rate of 4.300% per annum. The Slatten Ranch Shopping Center Mortgage Loan had an initial term of 120 months, has a remaining term of 118 months as of the Cut-off Date and requires interest-only payments for the first 60 payments following origination and, thereafter, requires payments of principal and interest based on a 30-year amortization schedule. The Slatten Ranch Shopping Center Mortgage Loan matures on July 11, 2024.
Following the lockout period, the borrower has the right to defease the Slatten Ranch Shopping Center Mortgage Loan in whole, but not in part, on any date before April 11, 2024. In addition, the Slatten Ranch Shopping Center Mortgage Loan is prepayable without penalty on or after April 11, 2024.
THE INFORMATION IN THIS STRUCTURAL AND COLLATERAL TERM SHEET IS NOT COMPLETE AND MAY BE AMENDED PRIOR TO THE TIME OF SALE. THIS TERM SHEET IS NOT AN OFFER TO SELL THESE SECURITIES AND IT IS NOT A SOLICITATION OF AN OFFER TO BUY THESE SECURITIES IN ANY JURISDICTION WHERE THE OFFER OR SALE IS NOT PERMITTED.
106
| SLATTEN RANCH SHOPPING CENTER |
Sources and Uses
| Sources | Uses | ||||||
| Original loan amount | $25,200,000 | 100.0% | Loan payoff(1) | $23,512,639 | 93.3% | ||
| Reserves | 79,980 | 00.3 | |||||
| Closing costs | 277,324 | 01.1 | |||||
| Return of equity | 1,330,057 | 05.3 | |||||
| Total Sources | $25,200,000 | 100.0% | Total Uses | $25,200,000 | 100.0% |
| (1) | The Slatten Ranch Shopping Center Property was previously securitized in WBCMT 2004-C15. |
The Property. The Slatten Ranch Shopping Center Property is an anchored retail center located in Antioch, California that contains approximately 118,250 square feet of rentable area. Built in 2003, the Slatten Ranch Shopping Center Property is situated on a 10.4-acre parcel and is part of a larger retail center that comprises a total of 441,103 square feet. The Slatten Ranch Shopping Center Property is anchored by Bed Bath & Beyond, Barnes & Noble and Cost Plus and shadow anchored by Target, Hobby Lobby and Sports Authority (the three shadow anchor tenants are not part of the collateral). The Slatten Ranch Shopping Center Property contains 725 surface parking spaces, resulting in a parking ratio of 6.1 spaces per 1,000 square feet of rentable area. As of June 30, 2014, the Slatten Ranch Shopping Center Property was 100.0% occupied by 19 tenants.
The following table presents certain information relating to the tenancy at the Slatten Ranch Shopping Center Property:
Major Tenants
| Tenant Name | Credit Rating (Fitch/Moody’s/ S&P)(1) | Tenant NRSF | % of NRSF | Annual U/W Base Rent PSF | Annual U/W Base Rent | % of Total Annual U/W Base Rent | Sales PSF(2)(3) | Occupancy Cost(2)(3) | Lease Expiration Date |
| Shadow Anchor Tenants – Not Part of Collateral | |||||||||
| Target A-/A2/A | SHADOW ANCHOR – NOT PART OF THE COLLATERAL | ||||||||
| Hobby Lobby NR/NR/NR | SHADOW ANCHOR – NOT PART OF THE COLLATERAL | ||||||||
| Sports Authority NR/B3/NR | SHADOW ANCHOR – NOT PART OF THE COLLATERAL | ||||||||
| Anchor Tenant | |||||||||
| Bed Bath & Beyond | NR/Baa1/A- | 27,000 | 22.8% | $15.00 | $405,000 | 15.3% | NAV | NAV | 1/31/2024 |
| Barnes & Noble | NR/NR/NR | 23,000 | 19.5% | $16.50 | $379,500 | 14.4% | NAV | NAV | 1/31/2019 |
| Cost Plus | NR/Baa1/A- | 17,750 | 15.0% | $10.00 | $177,500 | 6.7% | $118 | 10.1% | 1/31/2019 |
| Total Anchor Tenants | 67,750 | 57.3% | $14.20 | $962,000 | 36.4% | ||||
| Major Tenants | |||||||||
| Pier 1 Imports | NR/B1/B+ | 9,998 | 8.5% | $25.11 | $251,050 | 9.5% | NAV | NAV | 2/28/2019 |
| The Dress Barn | NR/NR/NR | 7,300 | 6.2% | $30.25 | $220,825 | 8.4% | $208 | 17.6% | 12/31/2018 |
| Men’s Wearhouse | NR/Ba3/B+ | 5,000 | 4.2% | $33.30 | $166,500 | 6.3% | NAV | NAV | 2/28/2019 |
| Total Major Tenants | 22,298 | 18.9% | $28.63 | $638,375 | 24.2% | ||||
| Non-Major Tenants | 28,202 | 23.8% | $36.89 | $1,040,307 | 39.4% | ||||
| Occupied Collateral Total | 118,250 | 100.0% | $22.33 | $2,640,682 | 100.0% | ||||
| Vacant Space | 0 | 0.0% | |||||||
| Collateral Total | 118,250 | 100.0% | |||||||
| (1) | Certain ratings are those of the parent company whether or not the parent guarantees the lease. |
| (2) | The majority of tenants at the Slatten Ranch Shopping Center Property are not required to report sales. |
| (3) | Sales PSF and Occupancy cost are for the trailing 12-month period ending December 31, 2013. |
THE INFORMATION IN THIS STRUCTURAL AND COLLATERAL TERM SHEET IS NOT COMPLETE AND MAY BE AMENDED PRIOR TO THE TIME OF SALE. THIS TERM SHEET IS NOT AN OFFER TO SELL THESE SECURITIES AND IT IS NOT A SOLICITATION OF AN OFFER TO BUY THESE SECURITIES IN ANY JURISDICTION WHERE THE OFFER OR SALE IS NOT PERMITTED.
107
| SLATTEN RANCH SHOPPING CENTER |
The following table presents certain information relating to the lease rollover schedule at the Slatten Ranch Shopping Center Property:
Lease Expiration Schedule(1)(2)
Year Ending December 31, | No. of Leases Expiring | Expiring NRSF | % of Total NRSF | Cumulative Expiring NRSF | Cumulative % of Total NRSF | Annual U/W Base Rent | Annual U/W Base Rent PSF |
| MTM | 0 | 0 | 0.0% | 0 | 0.0% | $0 | $0.00 |
| 2014 | 0 | 0 | 0.0% | 0 | 0.0% | $0 | $0.00 |
| 2015 | 1 | 1,400 | 1.2% | 1,400 | 1.2% | $37,800 | $27.00 |
| 2016 | 1 | 1,500 | 1.3% | 2,900 | 2.5% | $72,000 | $48.00 |
| 2017 | 0 | 0 | 0.0% | 2,900 | 2.5% | $0 | $0.00 |
| 2018 | 4 | 16,400 | 13.9% | 19,300 | 16.3% | $504,189 | $30.74 |
| 2019 | 7 | 59,773 | 50.5% | 79,073 | 66.9% | $1,141,782 | $19.10 |
| 2020 | 0 | 0 | 0.0% | 79,073 | 66.9% | $0 | $0.00 |
| 2021 | 1 | 3,837 | 3.2% | 82,910 | 70.1% | $84,414 | $22.00 |
| 2022 | 0 | 0 | 0.0% | 82,910 | 70.1% | $0 | $0.00 |
| 2023 | 3 | 6,840 | 5.8% | 89,750 | 75.9% | $316,617 | $46.29 |
| 2024 | 2 | 28,500 | 24.1% | 118,250 | 100.0% | $483,880 | $16.98 |
| Thereafter | 0 | 0 | 0.0% | 118,250 | 100.0% | $0 | $0.00 |
| Vacant | 0 | 0 | 0.0% | 118,250 | 100.0% | $0 | $0.00 |
| Total/Weighted Average | 19 | 118,250 | 100.0% | $2,640,682 | $22.33 |
| (1) | Information obtained from the underwritten rent roll. |
| (2) | Certain tenants may have lease termination options that are exercisable prior to the originally stated expiration date of the subject lease and that are not considered in the Lease Expiration Schedule. |
The following table presents historical occupancy percentages at the Slatten Ranch Shopping Center Property:
Historical Occupancy
12/31/2011(1) | 12/31/2012(1) | 12/31/2013(1) | 6/30/2014(2) | |||
| 96.8% | 100.0% | 100.0% | 100.0% |
| (1) | Information obtained from the borrower. |
| (2) | Information obtained from the underwritten rent roll. |
Operating History and Underwritten Net Cash Flow. The following table presents certain information relating to the historical operating performance and Underwritten Net Cash Flow at the Slatten Ranch Shopping Center Property:
Cash Flow Analysis
| 2012 | 2013 | TTM 4/30/2014 | U/W | U/W $ per SF | ||||||
| Base Rent | $2,688,734 | $2,689,156 | $2,678,334 | $2,640,682 | $22.33 | |||||
| Grossed Up Vacant Space | 0 | 0 | 0 | 0 | 0.00 | |||||
| Percentage Rent | 0 | 0 | 0 | 0 | 0.00 | |||||
| Total Reimbursables | 918,930 | 914,236 | 914,235 | 834,682 | 7.06 | |||||
| Other Income | 0 | 0 | 0 | 0 | 0.00 | |||||
| Less Vacancy & Credit Loss | 0 | 0 | 0 | (132,034)(1) | (1.12) | |||||
| Effective Gross Income | $3,607,664 | $3,603,392 | $3,592,569 | $3,343,329 | $28.27 | |||||
| Total Operating Expenses | $1,040,281 | $1,060,985 | $1,037,528 | $1,056,465 | $8.93 | |||||
| Net Operating Income | $2,567,383 | $2,542,407 | $2,555,041 | $2,286,864(2) | $19.34 | |||||
| TI/LC | 0 | 0 | 0 | 100,063 | 0.85 | |||||
| Capital Expenditures | 0 | 0 | 0 | 42,825 | 0.36 | |||||
| Net Cash Flow | $2,567,383 | $2,542,407 | $2,555,041 | $2,143,976 | $18.13 | |||||
| NOI DSCR | 1.72x | 1.70x | 1.71x | 1.53x | ||||||
| NCF DSCR | 1.72x | 1.70x | 1.71x | 1.43x | ||||||
| NOI DY | 10.2% | 10.1% | 10.1% | 9.1% | ||||||
| NCF DY | 10.2% | 10.1% | 10.1% | 8.5% |
| (1) | The underwritten economic vacancy is 5.0%. The Slatten Ranch Shopping Center Property was 100.0% physically occupied as of June 30, 2014. |
| (2) | The decrease in U/W Net Operating Income is primarily due to the underwritten vacancy factor, which was also applied to U/W Total Reimbursables. |
Appraisal. As of the appraisal valuation date of May 28, 2014, the Slatten Ranch Shopping Center Property had an “as-is” appraised value of $36,800,000.
Environmental Matters. According to the Phase I environmental site assessment dated June 13, 2014, there was no evidence of any recognized environmental conditions at the Slatten Ranch Shopping Center Property.
THE INFORMATION IN THIS STRUCTURAL AND COLLATERAL TERM SHEET IS NOT COMPLETE AND MAY BE AMENDED PRIOR TO THE TIME OF SALE. THIS TERM SHEET IS NOT AN OFFER TO SELL THESE SECURITIES AND IT IS NOT A SOLICITATION OF AN OFFER TO BUY THESE SECURITIES IN ANY JURISDICTION WHERE THE OFFER OR SALE IS NOT PERMITTED.
108
| SLATTEN RANCH SHOPPING CENTER |
Market Overview and Competition. The Slatten Ranch Shopping Center Property is located within a major retail hub in the eastern portion of the city of Antioch, California, approximately 50 miles east of San Francisco. Primary access to the area is provided by Highway 4, which runs north/south through the local neighborhood and is just west of the Slatten Ranch Shopping Center Property. The primary east/west arteries in the area are Lone Tree Way (the road on which the Slatten Ranch Shopping Center Property is situated) and Sand Creek Road. Lone Tree Way is also one of the city borders between Antioch and Brentwood. While the city of Antioch has historically been an industrial community with manufacturing plants and an established rail transportation corridor, it has recently transformed into an affordable residential option when compared to other, more centralized Bay Area communities and also benefits from its close proximity to employment centers such as Pleasant Hill (approximately 23 miles west) and Walnut Creek (approximately 26 miles west). As of 2014, the estimated population within a one-, three- and five-mile radius of the Slatten Ranch Shopping Center Property was 9,375, 105,786 and 177,476, respectively. The average household income within the same one-, three- and five-mile radii was $82,769, $82,929 and $75,231, respectively.
According to the appraisal, the Slatten Ranch Shopping Center is located within the Highway 4 submarket. As of the fourth quarter of 2013, the Highway 4 submarket reported a total retail inventory of 8.6 million square feet with a 7.9% vacancy rate and average asking rents of $15.63 per square foot, triple net. The appraiser concluded to market rents for the Slatten Ranch Shopping Center Property of $16.00 per square foot for anchor tenants, $27.00 to $33.00 per square foot for in-line tenants, and $33.00 to $51.00 per square foot for pad tenants, all on a triple net basis.
The following table presents certain information relating to comparable retail properties for the Slatten Ranch Shopping Center Property:
Competitive Set
Slatten Ranch Shopping Center (Subject) | Somersville Towne Center | Streets of Brentwood | Century Plaza | Lone Tree Plaza | Empire Shopping Center | |
| Location | Antioch, CA | Antioch, CA | Brentwood, CA | Pittsburg, CA | Brentwood, CA | Antioch, CA |
| Distance from Subject | -- | 8.1 miles | 3.4 miles | 8.2 miles | 0.5 miles | 0.1 miles |
| Property Type | Retail | Retail | Retail | Retail | Retail | Retail |
| Year Built/Renovated | 2003/NAP | 1996/2004 | 2008/NAP | 1988/NAP | 2005/NAP | 2004/NAP |
| Anchors | Target(1), Hobby Lobby(1), Sports Authority(1), Bed Bath & Beyond, Barnes & Noble | Macy’s, Marshalls, Sears, 24 Hour Fitness | AMC Theater, REI, DSW, Ulta | Target, Maya Cinemas, Burlington Coat Factory, Toys R Us, Ross, PetSmart, Big 5 Sporting Goods | Home Depot, Kohl’s, Michael’s, Babies R Us, Petco, Trader Joe’s | Office Depot, Old Navy, PetSmart |
| Total GLA | 441,103 SF(2) | 249,274 SF | 350,000 SF | 522,977 SF | 462,000 SF | 120,000 SF |
| Total Occupancy | 100% | 94% | 100% | 89% | 91% | 98% |
| (1) | Target, Hobby Lobby and Sports Authority are shadow anchor tenants and are not part of the collateral of the Slatten Ranch Shopping Center Mortgage Loan. |
| (2) | Total GLA shown includes shadow anchors, which are not part of the collateral. The collateral for the Slatten Ranch Shopping Center Mortgage Loan comprises 118,250 square feet. |
The Borrower. The borrower is Camden Village LLC, a California limited liability company and single purpose entity. Mark S. Carter, both as an individual and as trustee of the Carter Family Living Trust; Leland S. Kraemer, as an individual; Leland S. Kraemer and Darlene Kraemer, each as trustee of the Kraemer Family Revocable Trust; Frederick T. Kroger, as an individual; and Frederick T. Kroger and Robbin C. Kroger, each as trustee of the Kroger Family Trust are the guarantors of certain nonrecourse carveouts under the Slatten Ranch Shopping Center Mortgage Loan.
The Sponsors. The sponsors are Mark S. Carter, Leland S. Kraemer and Fred T. Kroger. Mr. Carter is the President and CEO of Sequoia Equities, Inc. (“Sequoia”), a real estate investment and property management firm headquartered in Walnut Creek, California. Established in 1986, Sequoia is a vertically integrated company that provides in-house acquisition, property management, marketing, reporting and construction services. As of September 2014, Sequoia’s commercial real estate portfolio was valued at over $2.0 billion.
Escrows. The loan documents provide for an upfront escrow in the amount of $79,980 for real estate taxes. In addition, the loan documents provide for ongoing monthly escrows of $26,660 for real estate taxes and $3,569 for replacement reserves. During a TI/LC Trigger Event Period (as defined below), the borrower is required to make ongoing monthly TI/LC reserve deposits of $9,854 (subject to a cap of $295,625). In addition, during a Major Tenant Trigger Period (as defined below), all excess cash flow is swept to a reserve account (the “Major Tenant Reserve”) until such time the amount on deposit in the Major Tenant Reserve is equal to or greater than $15.00 per square foot of the applicable Major Tenant (as defined below) space associated with the Major Tenant Trigger Period. Funds deposited into the Major Tenant Reserve are intended to be used for tenant improvements and leasing commissions associated with the re-tenanting of the applicable Major Tenant space. The borrower also has the option to provide a letter of credit in lieu of any required deposits into the Major Tenant Reserve. The loan documents do not require monthly escrows for insurance provided (i) no event of default has occurred and is continuing; (ii) the insurance required to be maintained by the borrower is maintained pursuant to one or more blanket insurance policies; and (iii) the borrower provides the lender with timely proof of payment of insurance premiums.
THE INFORMATION IN THIS STRUCTURAL AND COLLATERAL TERM SHEET IS NOT COMPLETE AND MAY BE AMENDED PRIOR TO THE TIME OF SALE. THIS TERM SHEET IS NOT AN OFFER TO SELL THESE SECURITIES AND IT IS NOT A SOLICITATION OF AN OFFER TO BUY THESE SECURITIES IN ANY JURISDICTION WHERE THE OFFER OR SALE IS NOT PERMITTED.
109
| SLATTEN RANCH SHOPPING CENTER |
A “TI/LC Trigger Event Period” will commence if the amortizing debt service coverage ratio is less than 1.25x at the end of any calendar month. A TI/LC Trigger Event Period will expire upon the date that the amortizing debt service coverage ratio is equal to or greater than 1.25x for one calendar quarter (provided that no event of default has occurred and is continuing at the time of the expiration of such period).
A “Major Tenant Trigger Period” will commence upon the earlier of (i) the failure of any Major Tenant to extend its lease by the notice date outlined in its lease and (ii) the date that is six months prior to the date on which any Major Tenant’s lease expires. A Major Tenant Trigger Period will expire if either (a) the Major Tenant renews its lease or (b) the Major Tenant space is re-leased to a replacement tenant under terms reasonably acceptable to the lender.
A “Major Tenant” is (i) any tenant which leases 20,000 square feet or more at the Slatten Ranch Shopping Center Property; (ii) Barnes & Noble; or (iii) Bed Bath & Beyond.
Lockbox and Cash Management. The Slatten Ranch Shopping Center Mortgage Loan requires a lender-controlled lockbox account, which is already in place, and that the borrower and property manager deposit all cash revenues and all other monies received into such lockbox account within one business day after receipt. Prior to a Cash Trap Event Period (as defined below), all funds on deposit in the lockbox account are swept to the borrower. During a Cash Trap Event Period, tenants will be directed to pay their rents directly into the lockbox account, and all funds on deposit in the lockbox account are swept to a lender-controlled cash management account on a daily basis.
A “Cash Trap Event Period” will commence upon the earlier of (i) the occurrence and continuance of an event of default or (ii) the amortizing debt service coverage ratio falling below 1.15x at the end of any calendar month. A Cash Trap Event Period will expire with regard to clause (i), upon the cure of such event of default and with regard to clause (ii), upon the date that the amortizing debt service coverage ratio is equal to or greater than 1.15x for one full calendar quarter.
Property Management. The Slatten Ranch Shopping Center Property is managed by Colliers Parrish Asset Management, Inc.
Assumption. The borrower has a two-time right to transfer the Slatten Ranch Shopping Center Property, provided that no event of default has occurred and is continuing and certain other conditions are satisfied, including, but not limited to the following: (i) the lender’s reasonable determination that the proposed transferee and guarantor satisfy the lender’s credit review and underwriting standards, taking into consideration transferee’s experience, financial strength and general business standing; (ii) execution of a recourse guaranty and an environmental indemnity by an affiliate of the transferee; and (iii) if requested by the lender, rating agency confirmation from Fitch, Moody’s and Morningstar that the transfer will not result in a downgrade, withdrawal or qualification of the respective ratings assigned to the Series 2014-C23 Certificates.
Partial Release. Not permitted.
Real Estate Substitution. Not permitted.
Subordinate and Mezzanine Indebtedness. None.
Ground Lease. None.
Terrorism Insurance. The loan documents require that the “all risk” insurance policy required to be maintained by the borrower provide coverage for terrorism in an amount equal to the full replacement cost of the Slatten Ranch Shopping Center Property. The loan documents also require business interruption insurance covering no less than the 12-month period following the occurrence of a casualty event, together with a six-month extended period of indemnity.
Earthquake Insurance. The loan documents do not require earthquake insurance. The seismic report indicated a probable maximum loss of 9%.
THE INFORMATION IN THIS STRUCTURAL AND COLLATERAL TERM SHEET IS NOT COMPLETE AND MAY BE AMENDED PRIOR TO THE TIME OF SALE. THIS TERM SHEET IS NOT AN OFFER TO SELL THESE SECURITIES AND IT IS NOT A SOLICITATION OF AN OFFER TO BUY THESE SECURITIES IN ANY JURISDICTION WHERE THE OFFER OR SALE IS NOT PERMITTED.
110
(THIS PAGE INTENTIONALLY LEFT BLANK)
111
| SIMI VALLEY SHOPPING CENTER |

THE INFORMATION IN THIS STRUCTURAL AND COLLATERAL TERM SHEET IS NOT COMPLETE AND MAY BE AMENDED PRIOR TO THE TIME OF SALE. THIS TERM SHEET IS NOT AN OFFER TO SELL THESE SECURITIES AND IT IS NOT A SOLICITATION OF AN OFFER TO BUY THESE SECURITIES IN ANY JURISDICTION WHERE THE OFFER OR SALE IS NOT PERMITTED.
112
| SIMI VALLEY SHOPPING CENTER |
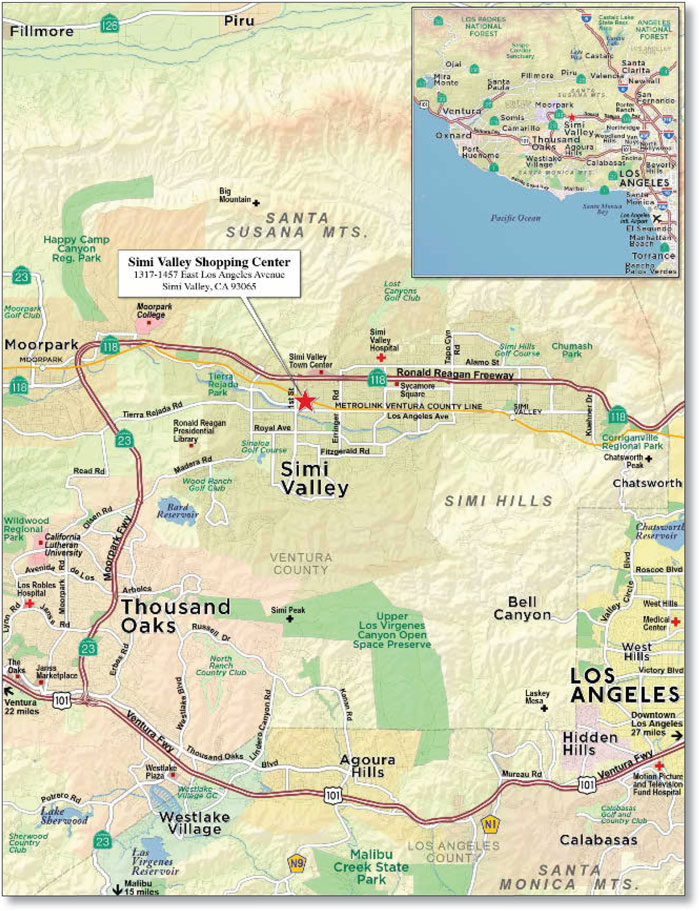
THE INFORMATION IN THIS STRUCTURAL AND COLLATERAL TERM SHEET IS NOT COMPLETE AND MAY BE AMENDED PRIOR TO THE TIME OF SALE. THIS TERM SHEET IS NOT AN OFFER TO SELL THESE SECURITIES AND IT IS NOT A SOLICITATION OF AN OFFER TO BUY THESE SECURITIES IN ANY JURISDICTION WHERE THE OFFER OR SALE IS NOT PERMITTED.
113
| No. 10 – Simi Valley Shopping Center | |||||||
| Loan Information | Property Information | ||||||
| Mortgage Loan Seller: | Liberty Island Group I LLC | Single Asset/Portfolio: | Single Asset | ||||
Credit Assessment (Fitch/Moody’s/Morningstar): | NR/NR/NR | Property Type: | Retail | ||||
| Original Principal Balance: | $22,000,000 | Specific Property Type: | Anchored | ||||
| Cut-off Date Principal Balance: | $22,000,000 | Location: | Simi Valley, CA | ||||
| % of Initial Pool Balance: | 2.3% | Size: | 218,698 SF | ||||
| Loan Purpose: | Refinance | Cut-off Date Principal Balance Per SF: | $100.60 | ||||
| Borrower Names: | Simi Valley Plaza, LLC; Wyoming Partners, LLC | Year Built/Renovated: | 1991/2013 | ||||
| Sponsor: | Sohrab Shakib | Title Vesting: | Fee | ||||
| Mortgage Rate: | 4.500% | Property Manager: | Self-managed | ||||
| Note Date: | September 11, 2014 | 3rd Most Recent Occupancy (As of): | 89.1% (12/31/2011) | ||||
| Anticipated Repayment Date: | NAP | 2nd Most Recent Occupancy (As of): | 93.2% (12/31/2012) | ||||
| Maturity Date: | October 1, 2024 | Most Recent Occupancy (As of): | 95.1% (12/31/2013) | ||||
| IO Period: | 1 month | Current Occupancy (As of): | 95.1% (8/31/2014) | ||||
| Loan Term (Original): | 121 months | ||||||
| Seasoning: | 0 months | Underwriting and Financial Information: | |||||
| Amortization Term (Original): | 360 months | ||||||
| Loan Amortization Type: | Interest-only, Amortizing Balloon | 3rd Most Recent NOI (As of): | $2,601,048 (12/31/2012) | ||||
| Interest Accrual Method: | Actual/360 | 2nd Most Recent NOI (As of): | $2,944,424 (12/31/2013) | ||||
| Call Protection: | L(24),D(93),O(4) | Most Recent NOI (As of): | $2,642,776 (TTM 6/30/2014) | ||||
| Lockbox Type: | Springing (Without Established Account) | ||||||
| Additional Debt: | NAP | U/W Revenues: | $3,497,056 | ||||
| Additional Debt Type: | NAP | U/W Expenses: | $809,562 | ||||
| U/W NOI: | $2,687,495 | ||||||
| U/W NCF: | $2,489,645 | ||||||
| U/W NOI DSCR: | 2.01x | ||||||
Escrows and Reserves(1): | U/W NCF DSCR: | 1.86x | |||||
| U/W NOI Debt Yield: | 12.2% | ||||||
Type: | Initial | Monthly | Cap (If Any) | U/W NCF Debt Yield: | 11.3% | ||
| Taxes | $195,018 | $24,377 | NAP | As-Is Appraised Value: | $40,000,000 | ||
| Insurance | $35,656 | $3,962 | NAP | As-Is Appraisal Valuation Date: | August 9, 2014 | ||
| Replacement Reserves | $0 | Springing | NAP | Cut-off Date LTV Ratio: | 55.0% | ||
| TI/LC Reserve | $0 | Springing | NAP | LTV Ratio at Maturity or ARD: | 44.5% | ||
| (1) | See “Escrows” section. |
The Mortgage Loan. The mortgage loan (the “Simi Valley Shopping Center Mortgage Loan”) is evidenced by a single promissory note that is secured by a first mortgage encumbering a grocery anchored shopping center located in Simi Valley, California (the “Simi Valley Shopping Center Property”). The Simi Valley Shopping Center Mortgage Loan was originated on September 11, 2014 by Prudential Mortgage Capital Company. The Simi Valley Shopping Center Mortgage Loan had an original principal balance of $22,000,000, has an outstanding principal balance as of the Cut-off Date of $22,000,000 and accrues interest at an interest rate of 4.5000% per annum. The Simi Valley Shopping Center Mortgage Loan had an initial term of 121 months, has a remaining term of 121 months as of the Cut-off Date and requires payments of principal and interest based on a 30-year amortization schedule. The Simi Valley Shopping Center Mortgage Loan matures on October 1, 2024.
Following the lockout period, the borrower has the right to defease the Simi Valley Shopping Center Mortgage Loan in whole, but not in part on any date before July 1, 2024. In addition, the Simi Valley Shopping Center Mortgage Loan is prepayable without penalty on or after July 1, 2024.
THE INFORMATION IN THIS STRUCTURAL AND COLLATERAL TERM SHEET IS NOT COMPLETE AND MAY BE AMENDED PRIOR TO THE TIME OF SALE. THIS TERM SHEET IS NOT AN OFFER TO SELL THESE SECURITIES AND IT IS NOT A SOLICITATION OF AN OFFER TO BUY THESE SECURITIES IN ANY JURISDICTION WHERE THE OFFER OR SALE IS NOT PERMITTED.
114
| SIMI VALLEY SHOPPING CENTER |
Sources and Uses
| Sources | Uses | ||||||||
| Original loan amount | $22,000,000 | 100.0% | Loan payoff | $18,357,298 | 83.4% | ||||
| Reserves | 230,674 | 1.0 | |||||||
| Closing costs | 933,925 | 4.2 | |||||||
| Return of equity | 2,478,103 | 11.3 | |||||||
| Total Sources | $22,000,000 | 100.0% | Total Uses | $22,000,000 | 100.0% |
The Property. The Simi Valley Shopping Center Property consists of a grocery anchored shopping center totaling 218,698 square feet of rentable area located in Simi Valley, California, approximately 42.4 miles northwest of Los Angeles. Built in 1991 and renovated in 2013, the Simi Valley Shopping Center Property is anchored by a 75,040 square foot Vallarta Supermarket grocery store. Vallarta is a grocer specializing in Central and South American products with 41 stores throughout California. The collateral consists of a primary in-line shop/anchor building, two multi-tenant pad shop buildings, a freestanding theater, and a freestanding Chase bank branch building. The Simi Valley Shopping Center Property comprises 1,205 surface parking spaces, resulting in a parking ratio of 5.5 spaces per 1,000 square feet of rentable area. As of August 31, 2014 the Simi Valley Shopping Center Property was 95.1% occupied by 26 tenants.
The following table presents certain information relating to tenancy at the Simi Valley Shopping Center Property:
Major Tenants
| Tenant Name | Credit Rating (Fitch/Moody’s/ S&P)(1) | Tenant NRSF | % of NRSF | Annual U/W Base Rent PSF(2) | Annual U/W Base Rent(2) | % of Total Annual U/W Base Rent | Sales PSF(3) | Occupancy Cost(3)(4) | Lease Expiration Date |
| Anchor Tenant | |||||||||
| Vallarta Supermarket | NR/NR/NR | 75,040 | 34.3% | $6.48 | $486,259 | 17.9% | NAV | NAV | 3/31/2031 |
| Total Anchor Tenant | 75,040 | 34.3% | $6.48 | $486,259 | 17.9% | ||||
| Major Tenants | |||||||||
| Gold’s Gym | NR/NR/NR | 38,892 | 17.8% | $18.67 | $726,000 | 26.8% | NAV | NAV | 11/14/2021 |
| Tristone Cinema Group, LLC | NR/NR/NR | 37,000 | 16.9% | $6.16 | $228,000 | 8.4% | $139,694(5) | 26.6% | 12/02/2019 |
| Simi Dialysis Center | NR/NR/NR | 5,034 | 2.3% | $25.92 | $130,481 | 4.8% | NAV | NAV | 6/17/2017 |
| JP Morgan Chase Bank | A+/A-1/A3 | 3,666 | 1.7% | $35.40 | $129,776 | 4.8% | NAV | NAV | 10/31/2021 |
| Total Major Tenants | 84,592 | 38.7% | $14.35 | $1,214,258 | 44.8% | ||||
| Non-Major Tenants | 48,357 | 22.1% | $20.94 | $1,012,672 | 37.3% | ||||
| Total Occupied Collateral | 207,989 | 95.1% | $13.04 | $2,713,188 | 100.0% | ||||
| Total Vacant Space | 10,709 | 4.9% | |||||||
| Collateral Total | 218,698 | 100.0% | |||||||
| (1) | Certain ratings are those of the parent company whether or not the parent guarantees the lease. |
| (2) | Annual U/W Base Rent PSF and Annual U/W Base Rent include contractual rent steps through December 2014. |
| (3) | Sales PSF and occupancy costs are for the trailing 12-month period ending November 30, 2013. |
| (4) | Occupancy costs include base rent, reimbursements and percentage rent, as applicable. |
| (5) | Sales are per screen (based on 10 screens) and do not include income from concessions. |
The following table presents certain information relating to the historical sales and occupancy costs at the Simi Valley Shopping Center Property:
Historical Sales(1)
| Tenant Name | 2011 | 2012 | 2013 |
Tristone Cinema Group, LLC(2) | $123,664 | $140,389 | $139,694 |
| (1) | Information provided by the borrower. |
| (2) | Sales are per screen based on 10 screens and do not include income from concessions. |
THE INFORMATION IN THIS STRUCTURAL AND COLLATERAL TERM SHEET IS NOT COMPLETE AND MAY BE AMENDED PRIOR TO THE TIME OF SALE. THIS TERM SHEET IS NOT AN OFFER TO SELL THESE SECURITIES AND IT IS NOT A SOLICITATION OF AN OFFER TO BUY THESE SECURITIES IN ANY JURISDICTION WHERE THE OFFER OR SALE IS NOT PERMITTED.
115
| SIMI VALLEY SHOPPING CENTER |
The following table presents certain information relating to the lease rollover schedule at the Simi Valley Shopping Center Property:
Lease Expiration Schedule(1)(2)
Year Ending December 31, | No. of Leases Expiring | Expiring NRSF | % of Total NRSF | Cumulative of Total NRSF | Cumulative % of Total NRSF | Annual U/W Base Rent | Annual U/W Base Rent PSF(3) | |
| MTM | 2 | 3,550 | 1.6% | 3,550 | 1.6% | $60,072 | $16.92 | |
| 2014 | 0 | 0 | 0.0% | 3,550 | 1.6% | $0 | $0.00 | |
| 2015 | 3 | 4,899 | 2.2% | 8,449 | 3.9% | $106,926 | $21.83 | |
| 2016 | 2 | 4,107 | 1.9% | 12,556 | 5.7% | $87,262 | $21.25 | |
| 2017 | 7 | 27,962 | 12.8% | 40,518 | 18.5% | $625,147 | $22.36 | |
| 2018 | 3 | 4,134 | 1.9% | 44,652 | 20.4% | $78,028 | $18.87 | |
| 2019 | 6 | 45,739 | 20.9% | 90,391 | 41.3% | $413,718 | $9.05 | |
| 2020 | 0 | 0 | 0.0% | 90,391 | 41.3% | $0 | $0.00 | |
| 2021 | 2 | 42,558 | 19.5% | 132,949 | 60.8% | $855,776 | $20.11 | |
| 2022 | 0 | 0 | 0.0% | 132,949 | 60.8% | $0 | $0.00 | |
| 2023 | 0 | 0 | 0.0% | 132,949 | 60.8% | $0 | $0.00 | |
| 2024 | 0 | 0 | 0.0% | 132,949 | 60.8% | $0 | $0.00 | |
| Thereafter | 1 | 75,040 | 34.3% | 207,989 | 95.1% | $486,259 | $6.48 | |
| Vacant | 0 | 10,709 | 4.9% | 218,698 | 100.0% | $0 | $0.00 | |
| Total/Weighted Average | 26 | 218,698 | 100.0% | $2,713,188 | $13.04 | |||
| (1) | Information obtained from the underwritten rent roll. |
| (2) | Certain tenants may have lease termination options that are exercisable prior to the originally stated expiration date of the subject lease and that are not considered in the Lease Expiration Schedule. |
| (3) | The Weighted Average Annual U/W Base Rent PSF excludes vacant space. |
The following table presents historical occupancy percentages at the Simi Valley Shopping Center Property:
Historical Occupancy
12/31/2011(1) | 12/31/2012(1) | 12/31/2013(1) | 8/31/2014(2) | |||
| 89.1% | 93.2% | 95.1% | 95.1% |
(1) | Information obtained from the borrower. |
(2) | Information obtained from the underwritten rent roll. |
Operating History and Underwritten Net Cash Flow. The following table presents certain information relating to the historical operating performance and the Underwritten Net Cash Flow at the Simi Valley Shopping Center Property:
Cash Flow Analysis
| 2012 | 2013 | TTM 6/30/2014 | U/W | U/W $ per SF | ||||||
| Base Rent | $2,464,450 | $2,903,432 | $2,652,601 | $2,713,188 | $12.41 | |||||
| Grossed Up Vacant Space | 0 | 0 | 0 | 192,762 | 0.88 | |||||
| Percentage Rent | 95,328 | 129,678 | 127,387 | 92,714 | 0.42 | |||||
| Total Reimbursables | 678,073 | 726,883 | 744,564 | 763,555 | 3.49 | |||||
| Other Income | 24,021 | 27,600 | 25,668 | 26,322 | 0.12 | |||||
| Less Vacancy & Credit Loss | 0 | 0 | 0 | (291,485)(1) | (1.33) | |||||
| Effective Gross Income | $3,261,874 | $3,787,592 | $3,550,220 | $3,497,056 | $15.99 | |||||
| Total Operating Expenses | $660,826 | $843,169 | $907,444 | $809,562 | $3.70 | |||||
| Net Operating Income | $2,601,048 | $2,944,424 | $2,642,776 | $2,687,495 | $12.29 | |||||
| TI/LC | 0 | 0 | 0 | 154,110 | 0.70 | |||||
| Replacement Reserves | 0 | 0 | 0 | 43,740 | 0.20 | |||||
| Net Cash Flow | $2,601,048 | $2,944,424 | $2,642,776 | $2,489,645 | $11.38 | |||||
| NOI DSCR | 1.94x | 2.20x | 1.98x | 2.01x | ||||||
| NCF DSCR | 1.94x | 2.20x | 1.98x | 1.86x | ||||||
| NOI DY | 11.8% | 13.4% | 12.0% | 12.2% | ||||||
| NCF DY | 11.8% | 13.4% | 12.0% | 11.3% | ||||||
| (1) | The underwritten economic vacancy is 7.7%. The Simi Valley Shopping Center Property was 95.1% physically occupied as of August 31, 2014. |
Appraisal. As of the appraisal valuation date of August 9, 2014, the Simi Valley Shopping Center Property had an “as-is” appraised value of $40,000,000.
Environmental Matters. According to the Phase I environmental report dated November 27, 2013 there was no evidence of any recognized environmental conditions at the Simi Valley Shopping Center Property.
THE INFORMATION IN THIS STRUCTURAL AND COLLATERAL TERM SHEET IS NOT COMPLETE AND MAY BE AMENDED PRIOR TO THE TIME OF SALE. THIS TERM SHEET IS NOT AN OFFER TO SELL THESE SECURITIES AND IT IS NOT A SOLICITATION OF AN OFFER TO BUY THESE SECURITIES IN ANY JURISDICTION WHERE THE OFFER OR SALE IS NOT PERMITTED.
116
SIMI VALLEY SHOPPING CENTER |
Market Overview and Competition. The Simi Valley Shopping Center Property is located in Simi Valley, California, approximately 42.4 miles northwest of Los Angeles. Primary access to the area is provided by Highway 118, a major arterial that crosses the San Fernando Valley in an east/west direction, and is situated approximately one mile north of the Simi Valley Shopping Center Property. As of 2013, the population within a one-, three- and five-mile radius of the Simi Valley Shopping Center Property was 17,271, 79,155 and 122,683, respectively. The average household income within the same one-, three- and five-mile radii was $72,657, $86,673 and $88,651, respectively.
According to a third party market research report, the Simi Valley Shopping Center Property is located in the Ventura County market, within the Simi Valley/Moorpark submarket which comprised approximately 2.4 million square feet of retail space as of the second quarter of 2014. For the same period, the submarket reported a 13.3% vacancy rate and an average asking rent of $24.71 per square foot, on a triple-net basis.
The following table presents certain information relating to comparable office properties for the Simi Valley Shopping Center Property:
Competitive Set
Simi Valley Shopping Center (Subject) | Mountaingate Plaza | El Paseo Simi | Sycamore Square | Troop Real Estate Plaza | |
| Location | Simi Valley, CA | Simi Valley, CA | Simi Valley, CA | Simi Valley, CA | Simi Valley, CA |
| Distance from Subject | -- | 0.1 miles | 5.1 miles | 3.7 miles | 2.4 miles |
| Property Type | Retail | Retail | Retail | Retail | Retail |
| Year Built/Renovated | 1991/2013 | 1963/NAV | 2003/NAV | 1978/NAV | 1987/NAV |
| Total GLA | 218,698 SF | 281,276 SF | 194,990 SF | 197,292 SF | 46,000 SF |
| Total Occupancy | 95% | 94% | 100% | 91% | 100% |
The Borrowers. The borrowers are Simi Valley Plaza, LLC and Wyoming Partners, LLC, as tenants in common (“TIC”), each of which is a California limited liability company and a single purpose entity. Sohrab Shakib is the guarantor of certain nonrecourse carveouts under the Simi Valley Shopping Center Mortgage Loan.
The Sponsor. The sponsor is Sohrab Shakib. Mr. Shakib has nearly 30 years of experience in commercial real estate investment and property management. Mr. Shakib’s current portfolio consists of 600,000 square feet of retail properties and 63 residential units, with a combined market value of approximately $90 million. Mr. Shakib is based in Van Nuys, California and the majority of his real estate holdings are located in Southern California. The Namvar family, who own approximately 45% of the borrower, have been involved with civil litigation in connection with their relationship with a family member who does not have any ownership stake in the Simi Valley Shopping Center Property. See “Description of the Mortgage Pool—Litigation Considerations” in the Free Writing Prospectus. The Namvar family members collectively own 90% of Wyoming Partners, LLC and are passive investors. Mr. Shakib, who is unrelated to the Namvar family members, holds a 50% ownership interest (100% ownership of Simi Valley Plaza, LLC), is the property manager, and the manager under the TIC agreement. Mr. Shakib cannot be removed from these management positions without his consent, and without lender’s consent. See “Description of the Mortgage Pool—Statistical Characteristics of the Mortgage Loans—Default History, Prior Bankruptcy Issues and Other Proceedings” in the Free Writing Prospectus.
Escrows. The loan documents provide for upfront reserves in the amount of $195,018 for real estate taxes and $35,656 for insurance. The loan documents also provide for ongoing monthly escrows in the amount of $24,377 for real estate taxes and $3,962 for insurance. If the occupancy of the Simi Valley Shopping Center Property falls below 80%, then monthly escrows in the amount of $3,645 for replacement reserves and $15,308 for TI/LCs will be required.
Lockbox and Cash Management. Upon the occurrence of a Cash Sweep Event Period (as defined below), the loan documents require that the borrower establish a lender-controlled lockbox account and that the borrower or property manager cause all rents and profits payable with respect to the Simi Valley Shopping Center Property be deposited directly into such lockbox account.
A “Cash Sweep Event Period” will commence upon the earlier of (i) the occurrence and continuance of an event of default; (ii) the amortizing debt service coverage ratio falling below 1.25x; (iii) the date that is 12 months prior to the expiration of the Gold’s Gym lease, (iv) Gold’s Gym indicates they will not exercise their extension option; (v) any Major Tenant (as defined below) going dark; or (vi) any Major Tenant filing bankruptcy. A Cash Sweep Event will expire, with regard to clause (i), upon the cure of such event of default; with regard to clause (ii), upon the date the amortizing debt service coverage ratio is equal to or greater than 1.30x for two consecutive calendar quarters; with regard to clause (iii) and (iv), if the space previously occupied by Gold’s Gym is leased to a new tenant with a minimum lease term of five years and that tenant is in occupancy and has commenced rent payments or deposited $995,000; with regard to clause (v), either (a) the space previously occupied by a Major Tenant is occupied by a new tenant with a minimum lease term of five years and rent payments have commenced, (b) the debt service coverage ratio excluding the dark Major Tenant is equal to or greater than 1.30x for two consecutive quarters; and with respect to clause (vi) or a Major Tenant Go-Dark Event related to Gold’s Gym, an amount equal to $995,000 is deposited into the cash sweep subaccount; with respect to clause (vi) or a Major Tenant Go-Dark Event related to Tristone Cinema Group, LLC, an amount equal to $650,000 is deposited into the cash sweep subaccount; with respect to clause (vi) either (a) the Major Tenant has emerged from bankruptcy or (b) the debt service coverage ratio excluding the Major Tenant associated with the bankruptcy filing is equal to or greater than 1.30x for two consecutive calendar quarters or (c) replacement lease term is a minimum of five years.
THE INFORMATION IN THIS STRUCTURAL AND COLLATERAL TERM SHEET IS NOT COMPLETE AND MAY BE AMENDED PRIOR TO THE TIME OF SALE. THIS TERM SHEET IS NOT AN OFFER TO SELL THESE SECURITIES AND IT IS NOT A SOLICITATION OF AN OFFER TO BUY THESE SECURITIES IN ANY JURISDICTION WHERE THE OFFER OR SALE IS NOT PERMITTED.
117
| SIMI VALLEY SHOPPING CENTER |
“Major Tenant” is defined as Gold’s Gym, Tristone Cinema Group, LLC or Vallarta Supermarket.
Property Management. The Simi Valley Shopping Center Property is managed by an affiliate of the borrower.
Assumption. The borrower has a two-time right to transfer the right to transfer the Simi Valley Shopping Center Property, provided that no event of default has occurred and is continuing and certain other conditions are satisfied, including (i) the lender’s reasonable determination that the proposed transferee and guarantor satisfy the lender’s credit review and underwriting standards, taking into consideration transferee experience, financial strength and general business standing; (ii) execution of a recourse guaranty (which includes an environmental indemnity) by an affiliate of the transferee; and (iii) rating agency confirmation from Fitch, Moody’s and Morningstar that the transfer will not result in a downgrade, withdrawal or qualification of the respective ratings assigned to the Series 2014-C23 Certificates.
Partial Release. Not permitted.
Real Estate Substitution. Not permitted.
Subordinate and Mezzanine Indebtedness. Not permitted.
Ground Lease. None.
Terrorism Insurance. The loan documents require that the “all risk” insurance policy required to be maintained by the borrower provide coverage for terrorism in an amount equal to the full replacement cost of the Simi Valley Shopping Center Property, as well as business interruption insurance covering no less than the 18-month period following the occurrence of a casualty event.
Earthquake Insurance. The loan documents do not require earthquake insurance. The seismic report indicated a probable maximum loss of 17%.
THE INFORMATION IN THIS STRUCTURAL AND COLLATERAL TERM SHEET IS NOT COMPLETE AND MAY BE AMENDED PRIOR TO THE TIME OF SALE. THIS TERM SHEET IS NOT AN OFFER TO SELL THESE SECURITIES AND IT IS NOT A SOLICITATION OF AN OFFER TO BUY THESE SECURITIES IN ANY JURISDICTION WHERE THE OFFER OR SALE IS NOT PERMITTED.
118
(THIS PAGE INTENTIONALLY LEFT BLANK)
119
| No. 11 – Stratford at Hillcrest | ||||||
| Loan Information | Property Information | |||||
| Mortgage Loan Seller: | The Royal Bank of Scotland | Single Asset/Portfolio: | Single Asset | |||
Credit Assessment (Fitch/Moody’s/Morningstar): | NR/NR/NR | Property Type: | Multifamily | |||
| Original Principal Balance: | $21,800,000 | Specific Property Type: | Garden | |||
| Cut-off Date Principal Balance: | $21,800,000 | Location: | Winston-Salem, NC | |||
| % of Initial Pool Balance: | 2.3% | Size: | 336 units | |||
| Loan Purpose: | Refinance | Cut-off Date Principal Balance Per Unit: | $64,881 | |||
| Borrower Name: | RS Stratford Apartments, LLC | Year Built/Renovated: | 2007/NAP | |||
Sponsor(1): | RealSource Property Consulting, LLC | Title Vesting: | Fee | |||
| Mortgage Rate: | 4.500% | Property Manager: | Cottonwood Capital Property Management II, LLC | |||
| Note Date: | September 4, 2014 | 3rd Most Recent Occupancy (As of): | 96.7% (12/31/2011) | |||
| Anticipated Repayment Date: | NAP | 2nd Most Recent Occupancy (As of): | 90.8% (12/31/2012) | |||
| Maturity Date: | October 1, 2024 | Most Recent Occupancy (As of): | 90.5% (12/31/2013) | |||
| IO Period: | 37 months | Current Occupancy (As of): | 97.3% (7/28/2014) | |||
| Loan Term (Original): | 121 months | |||||
| Seasoning: | 0 months | Underwriting and Financial Information: | ||||
| Amortization Term (Original): | 360 months | |||||
| Loan Amortization Type: | Interest-only, Amortizing Balloon | 3rd Most Recent NOI (As of): | $1,546,432 (12/31/2012) | |||
| Interest Accrual Method: | Actual/360 | 2nd Most Recent NOI (As of): | $1,613,443 (12/31/2013) | |||
| Call Protection: | L(24),D(93),O(4) | Most Recent NOI (As of): | $1,658,597 (TTM 6/30/2014) | |||
| Lockbox Type: | Soft/Springing Cash Management | |||||
| Additional Debt: | None | U/W Revenues: | $2,928,134 | |||
| Additional Debt Type: | NAP | U/W Expenses: | $1,269,650 | |||
| U/W NOI: | $1,658,484 | |||||
| U/W NCF: | $1,567,764 | |||||
| U/W NOI DSCR: | 1.25x | |||||
Escrows and Reserves: | U/W NCF DSCR: | 1.18x | ||||
| U/W NOI Debt Yield: | 7.6% | |||||
Type: | Initial | Monthly | Cap (If Any) | U/W NCF Debt Yield: | 7.2% | |
| Taxes | $291,578 | $26,507 | NAP | As-Is Appraised Value: | $29,200,000 | |
| Insurance | $32,136 | $4,591 | NAP | As-Is Appraisal Valuation Date: | July 30, 2014 | |
| Replacement Reserves | $0 | $7,560 | NAP | Cut-off Date LTV Ratio: | 74.7% | |
| Deferred Maintenance | $11,400 | $0 | NAP | LTV Ratio at Maturity or ARD: | 65.4% | |
| (1) | The sponsor has been involved in prior loan defaults. See “Description of the Mortgage Pool—Statistical Characteristics of the Mortgage Loans—Default History, Prior Bankruptcy Issues and Other Proceedings” in the Free Writing Prospectus. |
The Stratford at Hillcrest mortgage loan is evidenced by a single promissory note that is secured by a first mortgage encumbering a 336-unit multifamily property located Winston-Salem, North Carolina (the “Stratford at Hillcrest Property”). The Stratford at Hillcrest Property was built in 2007 and comprises 14 three-story apartment buildings and one clubhouse/leasing office and one maintenance building. The Stratford at Hillcrest Property is situated on a 13.7-acre site and is located approximately 2.0 miles south of Interstate-40, which serves as a primary east-west highway and provides access from downtown Winston-Salem to the Piedmont Triad International Airport and the city of Greensboro. The Stratford at Hillcrest Property consists of 138 one bedroom/one bathroom units, 138 two bedroom/two bathroom units, 30 large two bedroom/two bathroom units and 30 three bedroom/two bathroom units. Amenities at the Stratford at Hillcrest Property include a community pool, exercise room, business center and 4,000 square foot clubhouse with a lounge and conference center. Unit amenities include gourmet kitchens, built-in wine displays, ceiling fans in all rooms, full-size washer and dryer connections, private patios or balconies and security systems. Select units feature deep garden tubs, walk-in closets, vanities with dual sinks, and storage units on either a balcony or patio. The property contains 529 surface parking spaces, reflecting an overall parking ratio of 1.6 spaces per unit. As of July 28, 2014, the Stratford at Hillcrest Property was 97.3% occupied.
Sources and Uses
| Sources | Uses | |||||||
| Original loan amount | $21,800,000 | 99.6% | Loan payoff | $21,013,866 | 96.0% | |||
| Sponsor’s new cash contribution | 84,408 | 0.4 | Reserves | 335,114 | 1.5 | |||
| Closing costs | 535,428 | 2.4 | ||||||
| Total Sources | $21,884,408 | 100.0% | Total Uses | $21,884,408 | 100.0% | |||
THE INFORMATION IN THIS STRUCTURAL AND COLLATERAL TERM SHEET IS NOT COMPLETE AND MAY BE AMENDED PRIOR TO THE TIME OF SALE. THIS TERM SHEET IS NOT AN OFFER TO SELL THESE SECURITIES AND IT IS NOT A SOLICITATION OF AN OFFER TO BUY THESE SECURITIES IN ANY JURISDICTION WHERE THE OFFER OR SALE IS NOT PERMITTED.
120
| STRATFORD AT HILLCREST |
The following table presents certain information relating to the unit mix of the Stratford at Hillcrest Property:
Unit Mix Summary(1)
| Unit Type | No. of Units | % of Total Units | Average Unit Size (SF) | Average U/W Rent Per Unit | ||||||
| 1 Bedroom/1 Bathroom | 138 | 41.1% | 850 | $675 | ||||||
| 2 Bedroom/2 Bathroom | 138 | 41.1% | 1,075 | $791 | ||||||
| Large 2 Bedroom/2 Bathroom | 30 | 8.9% | 1,120 | $827 | ||||||
| 3 Bedroom/2 Bathroom | 30 | 8.9% | 1,300 | $1,050 | ||||||
| Total/Weighted Average | 336 | 100.0% | 1,007 | $770 | ||||||
| (1) | Information obtained from the appraisal and underwritten rent roll. |
The following table presents historical occupancy percentages at the Stratford at Hillcrest Property:
Historical Occupancy
12/31/2011(1) | 12/31/2012(1) | 12/31/2013(1) | 7/28/2014(2) | |||
| 96.7% | 90.8% | 90.5% | 97.3% |
| (1) | Information obtained from the borrower. |
| (2) | Information obtained from the underwritten rent roll. |
Operating History and Underwritten Net Cash Flow. The following table presents certain information relating to the Underwritten Net Cash Flow at the Stratford at Hillcrest Property:
Cash Flow Analysis
| 2012 | 2013 | TTM 6/30/2014 | U/W | U/W $ per Unit | |||||||
| Base Rent | $2,860,052 | $2,904,944 | $2,924,525 | $3,103,416 | $9,236 | ||||||
| Loss to Lease & Concessions | (12,295) | (10,038) | (10,436) | (157,324) | (468) | ||||||
| Other Income | 118,337 | 156,916 | 154,285 | 154,285 | 459 | ||||||
| Less Vacancy & Credit Loss | (194,205) | (213,600) | (170,531) | (172,243)(1) | (513) | ||||||
| Effective Gross Income | $2,771,889 | $2,838,222 | $2,897,843 | $2,928,134 | $8,715 | ||||||
| Total Operating Expenses | $1,225,457 | $1,224,779 | $1,239,246 | $1,269,650 | $3,779 | ||||||
| Net Operating Income | $1,546,432 | $1,613,443 | $1,658,597 | $1,658,484 | $4,936 | ||||||
| Capital Expenditures | 0 | 0 | 0 | 90,720 | 270 | ||||||
| Net Cash Flow | $1,546,432 | $1,613,443 | $1,658,597 | $1,567,764 | 4,666 | ||||||
| NOI DSCR | 1.17x | 1.22x | 1.25x | 1.25x | |||||||
| NCF DSCR | 1.17x | 1.22x | 1.25x | 1.18x | |||||||
| NOI DY | 7.1% | 7.4% | 7.6% | 7.6% | |||||||
| NCF DY | 7.1% | 7.4% | 7.6% | 7.2% |
| (1) | The underwritten economic vacancy is 5.8%. The Stratford at Hillcrest Property was 97.3% physically occupied as of July 28, 2014. |
THE INFORMATION IN THIS STRUCTURAL AND COLLATERAL TERM SHEET IS NOT COMPLETE AND MAY BE AMENDED PRIOR TO THE TIME OF SALE. THIS TERM SHEET IS NOT AN OFFER TO SELL THESE SECURITIES AND IT IS NOT A SOLICITATION OF AN OFFER TO BUY THESE SECURITIES IN ANY JURISDICTION WHERE THE OFFER OR SALE IS NOT PERMITTED.
121
| No. 12 - Marriott Bakersfield | |||||||
| Loan Information | Property Information | ||||||
| Mortgage Loan Seller: | The Royal Bank of Scotland | Single Asset/Portfolio: | Single Asset | ||||
Credit Assessment (Fitch/Moody’s/Morningstar): | NR/NR/NR | Property Type: | Hospitality | ||||
| Original Principal Balance: | $21,500,000 | Specific Property Type: | Full Service | ||||
| Cut-off Date Principal Balance: | $21,500,000 | Location: | Bakersfield, CA | ||||
| % of Initial Pool Balance: | 2.3% | Size: | 259 rooms | ||||
| Loan Purpose: | Refinance | Cut-off Date Principal Balance Per Room: | $83,012 | ||||
| Borrower Name: | Bakersfield Convention Hotel I, LLC | Year Built/Renovated: | 1995/2008 | ||||
| Sponsor: | Richard Deihl | Title Vesting: | Fee | ||||
| Mortgage Rate: | 4.722% | Property Manager: | Barney Hospitality Group, LLC | ||||
| Note Date: | September 9, 2014 | 3rd Most Recent Occupancy (As of): | 69.4% (12/31/2011) | ||||
| Anticipated Repayment Date: | NAP | 2nd Most Recent Occupancy (As of): | 73.5% (12/31/2012) | ||||
| Maturity Date: | October 1, 2019 | Most Recent Occupancy (As of): | 80.1% (12/31/2013) | ||||
| IO Period: | 37 months | Current Occupancy (As of): | 80.4% (6/30/2014) | ||||
| Loan Term (Original): | 61 months | ||||||
| Seasoning: | 0 months | ||||||
| Amortization Term (Original): | 360 months | Underwriting and Financial Information: | |||||
| Loan Amortization Type: | Interest Only, Amortizing Balloon | ||||||
| Interest Accrual Method: | Actual/360 | 3rd Most Recent NOI (As of): | $2,036,466 (12/31/2012) | ||||
| Call Protection: | L(24),D(33),O(4) | 2nd Most Recent NOI (As of): | $2,311,384 (12/31/2013) | ||||
| Lockbox Type: | Springing (Without Established Account) | Most Recent NOI (As of): | $2,549,114 (TTM 6/30/2014) | ||||
| Additional Debt: | None | ||||||
| Additional Debt Type: | NAP | U/W Revenues: | $11,177,596 | ||||
| U/W Expenses: | $8,578,954 | ||||||
| U/W NOI: | $2,598,642 | ||||||
| U/W NCF: | $2,039,748 | ||||||
| U/W NOI DSCR: | 1.94x | ||||||
Escrows and Reserves: | U/W NCF DSCR: | 1.52x | |||||
| U/W NOI Debt Yield: | 12.1% | ||||||
| U/W NCF Debt Yield: | 9.5% | ||||||
Type: | Initial | Monthly | Cap (If Any) | As-Is Appraised Value: | $32,600,000 | ||
| Taxes | $90,833 | $18,167 | NAP | As-Is Appraisal Valuation Date: | July 15, 2014 | ||
| Insurance | $53,209 | $6,651 | NAP | Cut-off Date LTV Ratio: | 66.0% | ||
| FF&E Reserve | $0 | $37,259 | NAP | LTV Ratio at Maturity or ARD: | 63.9% | ||
The Marriott Bakersfield mortgage loan is evidenced by a single promissory note that is secured by a first mortgage encumbering a 259-room, full service hotel located in Bakersfield, California (the “Marriott Bakersfield Property”). The Marriott Bakersfield Property was constructed in 1995 and consists of a nine-story building situated on 5.6 acres. In 2008, the Marriott Bakersfield Property underwent a $4.2 million renovation and rebranding from a Holiday Inn Select to a Marriott, and features 117 king bed guestrooms, eight queen bed guestrooms, 125 two-queen bed guestrooms, one hospitality suite, three studio suites, and five, one-bedroom suites. Amenities at the Marriott Bakersfield Property include a restaurant and lounge, 10 meeting rooms totaling 9,136 square feet of meeting space, a grand ballroom with capacity for 900 people, business center, outdoor pool, fitness facilities, sauna and whirlpools. In-room amenities include wireless high-speed internet access and a two-line telephone with voicemail and data port. Additionally, suites offer a larger living space and additional amenities such as a wet-bar with a microwave and small refrigerator. The Marriott Bakersfield Property is centrally located in downtown Bakersfield, California and has direct access to the 10,000-seat Rabobank Arena and 3,000-seat Bakersfield Convention Center through a pre-functionary lobby and hallway. The Marriott International franchise agreement expires in March 2028.
Sources and Uses
| Sources | Uses | ||||||||
| Original loan amount | $21,500,000 | 80.4% | Loan payoff | $26,431,523 | 98.9 | % | |||
| Sponsor’s new cash contribution | 5,229,788 | 19.6 | Reserves | 144,042 | 0.5 | ||||
| Closing costs | 154,222 | 0.6 | |||||||
| Total Sources | $26,729,787 | 100.0% | Total Uses | $26,729,787 | 100.0 | % |
THE INFORMATION IN THIS STRUCTURAL AND COLLATERAL TERM SHEET IS NOT COMPLETE AND MAY BE AMENDED PRIOR TO THE TIME OF SALE. THIS TERM SHEET IS NOT AN OFFER TO SELL THESE SECURITIES AND IT IS NOT A SOLICITATION OF AN OFFER TO BUY THESE SECURITIES IN ANY JURISDICTION WHERE THE OFFER OR SALE IS NOT PERMITTED.
122
MARRIOTT BAKERSFIELD |
Subject and Market Historical Occupancy, ADR and RevPAR(1)
Competitive Set | Marriott Bakersfield | Penetration Factor | |||||||||||||||||
Year | Occupancy | ADR | RevPAR | Occupancy | ADR | RevPAR | Occupancy | ADR | RevPAR | ||||||||||
| 6/30/2014 TTM | 73.9% | $90.65 | $66.96 | 80.8% | $93.69 | $75.70 | 109.3% | 103.4% | 113.1% | ||||||||||
| 6/30/2013 TTM | 71.1% | $86.10 | $61.19 | 77.8% | $88.21 | $68.58 | 109.4% | 102.5% | 112.1% | ||||||||||
| 6/30/2012 TTM | 70.1% | $82.86 | $58.11 | 70.8% | $85.52 | $60.52 | 101.0% | 103.2% | 104.1% | ||||||||||
| (1) | Information obtained from a third party hospitality report. According to such third party hospitality report, the competitive set includes the following hotels: Four Points Bakersfield, Courtyard Bakersfield, Doubletree Bakersfield, Clarion Hotel Bakersfield, Springhill Suites Bakersfield, and Holiday Inn & Suites Bakersfield North. |
Operating History and Underwritten Net Cash Flow. The following table presents certain information relating to the historical operating performance and the Underwritten Net Cash Flow at the Marriott Bakersfield Property:
Cash Flow Analysis
2012 | 2013 | TTM 6/30/2014 | U/W | U/W $ per Room | |||||||
| Occupancy | 73.5% | 80.1% | 80.4% | 80.4% | |||||||
| ADR | $86.59 | $89.31 | $93.35 | $93.35 | |||||||
| RevPAR | $63.64 | $71.54 | $75.05 | $75.06 | |||||||
| Total Revenue | $10,054,825 | $10,717,356 | $11,177,596 | $11,177,596 | $43,157 | ||||||
| Total Department Expenses | 4,429,942 | 4,690,420 | 4,836,033 | 4,836,033 | 18,672 | ||||||
| Gross Operating Profit | $5,624,883 | $6,026,936 | $6,341,563 | $6,341,563 | $24,485 | ||||||
| Total Undistributed Expenses | 3,210,047 | 3,352,797 | 3,427,358 | 3,427,358 | 13,233 | ||||||
| Profit Before Fixed Charges | $2,414,836 | $2,674,139 | $2,914,205 | $2,914,205 | $11,252 | ||||||
| Total Fixed Charges | 378,370 | 362,755 | 365,091 | 315,563 | 1,218 | ||||||
| Net Operating Income | $2,036,466 | $2,311,384 | $2,549,114 | $2,598,642 | $10,033 | ||||||
| FF&E | 0 | 0 | 0 | 558,894 | 2,158 | ||||||
| Net Cash Flow | $2,036,466 | $2,311,384 | $2,549,114 | $2,039,748 | $7,875 | ||||||
| NOI DSCR | 1.52x | 1.72x | 1.90X | 1.94x | |||||||
| NCF DSCR | 1.52x | 1.72x | 1.90x | 1.52x | |||||||
| NOI DY | 9.5% | 10.8% | 11.9% | 12.1% | |||||||
| NCF DY | 9.5% | 10.8% | 11.9% | 9.5% | |||||||
THE INFORMATION IN THIS STRUCTURAL AND COLLATERAL TERM SHEET IS NOT COMPLETE AND MAY BE AMENDED PRIOR TO THE TIME OF SALE. THIS TERM SHEET IS NOT AN OFFER TO SELL THESE SECURITIES AND IT IS NOT A SOLICITATION OF AN OFFER TO BUY THESE SECURITIES IN ANY JURISDICTION WHERE THE OFFER OR SALE IS NOT PERMITTED.
123
| No. 13 – Pomona Ranch Plaza | ||||||||
| Loan Information | Property Information | |||||||
| Mortgage Loan Seller: | C-III Commercial Mortgage LLC | Single Asset/Portfolio: | Single Asset | |||||
Credit Assessment (Fitch/Moody’s/Morningstar): | NR/NR/NR | Property Type: | Office | |||||
| Original Principal Balance: | $17,750,000 | Specific Property Type: | Suburban | |||||
| Cut-off Date Principal Balance: | $17,750,000 | Location: | Pomona, CA | |||||
| % of Initial Pool Balance: | 1.9% | Size: | 100,000 SF | |||||
| Loan Purpose: | Refinance | Cut-off Date Principal Balance Per SF: | $177.50 | |||||
| Borrower Name: | PRBC 7 Limited Partnership | Year Built/Renovated: | 2014 | |||||
| Sponsors: | Justin Huang and Shun-Hsing Lu | Title Vesting: | Fee | |||||
| Mortgage Rate: | 4.720% | Property Manager: | Castleton Real Estate & Development, Inc. | |||||
| Note Date: | September 12, 2014 | 3rd Most Recent Occupancy(3): | NAP | |||||
| Anticipated Repayment Date: | NAP | 2nd Most Recent Occupancy(3): | NAP | |||||
| Maturity Date: | October 1, 2024 | Most Recent Occupancy(3): | NAP | |||||
| IO Period: | 1 month | Current Occupancy (As of): | 100.0% (9/1/2014) | |||||
| Loan Term (Original): | 121 months | |||||||
| Seasoning: | 0 months | Underwriting and Financial Information: | ||||||
| Amortization Term (Original): | 300 months | |||||||
| Loan Amortization Type: | Interest-only, Amortizing Balloon | 3rd Most Recent NOI(3): | NAP | |||||
| Interest Accrual Method: | Actual/360 | 2nd Most Recent NOI(3): | NAP | |||||
| Call Protection: | L(24),D(94),O(3) | Most Recent NOI(3): | NAP | |||||
Lockbox Type(1): | Hard/Springing | |||||||
| Additional Debt: | None | U/W Revenues: | $2,496,000 | |||||
| Additional Debt Type: | NAP | U/W Expenses: | $840,166 | |||||
| U/W NOI: | $1,656,434 | |||||||
| U/W NCF: | $1,486,434 | |||||||
| U/W NOI DSCR: | 1.37x | |||||||
Escrows and Reserves: | U/W NCF DSCR: | 1.23x | ||||||
| U/W NOI Debt Yield: | 9.3% | |||||||
Type: | Initial | Monthly | Cap (If Any) | U/W NCF Debt Yield: | 8.4% | |||
| Taxes | $162,500 | $27,083 | NAP | As-Is Appraised Value: | $26,800,000 | |||
| Insurance | $10,484 | $1,311 | NAP | As-Is Appraisal Valuation Date: | 7/30/2014 | |||
| Replacement Reserves | $1,667 | $1,667 | $60,000 | Cut-off Date LTV Ratio: | 66.2% | |||
TI/LC Reserve(2) | $500,000 | $12,500 | NAP | LTV Ratio at Maturity or ARD: | 49.0% | |||
| (1) | A cash flow sweep will commence 24 months prior to San Gabriel/Pomona Valley’s lease expiration. |
| (2) | Approximately $208,375 is still owed to San Gabriel/Pomona Valley in outstanding TIs and a mid-term TI allowance of $500,000 is due to the tenant any time after the fifth anniversary of the lease; the tenant has the option to use the mid-term allowance towards its rent. |
| (3) | The building improvements were constructed in 2014 with the tenant taking occupancy in March, 2014. As such, there are no historical financials available for the property. |
The Pomona Ranch Plaza mortgage loan is evidenced by a single promissory note that is secured by a first mortgage encumbering a two-story single tenant Class A office building located in Pomona, California (the “Pomona Ranch Plaza Property”). Built in 2014, the Pomona Ranch Plaza Property contains 100,000 net rentable square feet and has 453 surface parking spaces, representing a parking ratio of 4.5 spaces per 1,000 square feet of rentable area. The borrower reported total development costs of approximately $28,570,000. The Pomona Ranch Plaza Property is 100% leased to a single tenant, San Gabriel/Pomona Valleys Developmental Services. The tenant took occupancy on March 13, 2014 and its lease expires February 29, 2024; the tenant has two 5-year renewal options. The tenant’s lease is currently structured as a gross lease but becomes a net lease upon exercise of its renewal option. A cash flow sweep will commence 24 months prior to the tenant lease expiration date.
The tenant is a non-profit organization designated as “The San Gabriel Pomona Regional Center” by the Department of Developmental Services (“DDS”) of the State of California. The DDS is one of 12 departments and one board compromising the California Health and Human Services Agency. The DDS reports that it provides services and supports for approximately 228,000 children and adults with developmental disabilities and 28,000 infants with a developmental delay or established risk condition. These services are provided through state-operated developmental centers and community facilities, and contracts with twenty-one nonprofit agencies called regional centers. The Pomona Ranch Plaza Property is one of the twenty-one regional centers and services an area that includes the cities of El Monte, Monrovia, Pomona, and Glendora. It supports and advances the intent and entitlement of the Lanterman Developmental Disabilities Services Act through services such as assessment, advocacy, service coordination, education, training, communication, resource development and prevention services to over 12,000 clients. The Lanterman Developmental Disabilities Services Act, known as the “Lanterman Act,” is a piece of legislation which passed in 1977, and established the twenty-one regional centers. The tenant operates under a contract with the DDS. The contract between the tenant
THE INFORMATION IN THIS STRUCTURAL AND COLLATERAL TERM SHEET IS NOT COMPLETE AND MAY BE AMENDED PRIOR TO THE TIME OF SALE. THIS TERM SHEET IS NOT AN OFFER TO SELL THESE SECURITIES AND IT IS NOT A SOLICITATION OF AN OFFER TO BUY THESE SECURITIES IN ANY JURISDICTION WHERE THE OFFER OR SALE IS NOT PERMITTED.
124
| POMONA RANCH PLAZA |
and the DDS was recently renewed on July 1, 2014 with an expiration of June 30, 2021. The tenant’s contract with the DDS is subject to termination for lack of sufficient funding to DDS from the State of California for the applicable program. The annual state of California budget allocation to DDS for fiscal year 2014/2015 was estimated to be $4.67 billion.
Sources and Uses
| Sources | Uses | |||||||
| Original loan amount | $17,750,000 | 100.0% | Loan payoff(1) | $16,774,835 | 94.5% | |||
| Reserves | 674,651 | 3.8 | ||||||
| Closing costs | 245,109 | 1.4 | ||||||
| Return of Equity | 55,405 | 0.3 | ||||||
| Total Sources | $17,750,000 | 100.0% | Total Uses | $17,750,000 | 100.0% | |||
| (1) | Includes a $1,006,027 payoff to a borrower related entity. |
The following table presents certain information relating to the tenancies at the Pomona Ranch Plaza Property:
Major Tenants
| Tenant Name | Credit Rating (Fitch/Moody’s/ S&P) | Tenant NRSF | % of NRSF | Annual U/W Base Rent PSF | Annual U/W Base Rent | % of Total Annual U/W Base Rent | Lease Expiration Date |
| San Gabriel/Pomona Valley | NR/NR/NR | 100,000 | 100.0% | $26.28 | $2,628,000 | 100.0% | 2/29/2024 |
| Occupied Collateral Total | 100,000 | 100.0% | $26.28 | $2,628,000 | 100.0% | ||
| Vacant Space | 0 | 0.0% | |||||
| Collateral Total | 100,000 | 100.0% | |||||
The following table presents certain information relating to the lease rollover schedule at the Pomona Ranch Plaza Property:
Lease Expiration Schedule(1)
Year Ending December 31, | No. of Leases Expiring | Expiring NRSF | % of Total NRSF | Cumulative Expiring NRSF | Cumulative % of Total NRSF | Annual U/W Base Rent | Annual U/W Base Rent PSF(3) | |||||
| MTM | 0 | 0 | 0.0% | 0 | 0.0% | $0 | $0.00 | |||||
| 2014 | 0 | 0 | 0.0% | 0 | 0.0% | $0 | $0.00 | |||||
| 2015 | 0 | 0 | 0.0% | 0 | 0.0% | $0 | $0.00 | |||||
| 2016 | 0 | 0 | 0.0% | 0 | 0.0% | $0 | $0.00 | |||||
| 2017 | 0 | 0 | 0.0% | 0 | 0.0% | $0 | $0.00 | |||||
| 2018 | 0 | 0 | 0.0% | 0 | 0.0% | $0 | $0.00 | |||||
| 2019 | 0 | 0 | 0.0% | 0 | 0.0% | $0 | $0.00 | |||||
| 2020 | 0 | 0 | 0.0% | 0 | 0.0% | $0 | $0.00 | |||||
| 2021 | 0 | 0 | 0.0% | 0 | 0.0% | $0 | $0.00 | |||||
| 2022 | 0 | 0 | 0.0% | 0 | 0.0% | $0 | $0.00 | |||||
| 2023 | 0 | 0 | 0.0% | 0 | 0.0% | $0 | $0.00 | |||||
| 2024 | 1 | 100,000 | 100.0% | 100,000 | 100.0% | $2,628,000 | $26.28 | |||||
| Thereafter | 0 | 0 | 0.0% | 0 | 0.0% | $0 | $0.00 | |||||
| Vacant | 0 | 0 | 0.0% | 0 | 0.0% | $0 | $0.00 | |||||
| Total/Weighted Average | 6 | 100,000 | 100.0% | $2,628,000 | $26.28 |
| (1) | Information obtained from the underwritten rent roll. |
The following table presents historical occupancy percentages at the Pomona Ranch Plaza Property:
Historical Occupancy Percentages(1)(2)
9/1/2014 |
| 100.0% |
| (1) | Information obtained from the borrower. |
| (2) | The building improvements were constructed in February 2014 with the tenant taking occupancy in March, 2014. As such, historical occupancy is not available. |
THE INFORMATION IN THIS STRUCTURAL AND COLLATERAL TERM SHEET IS NOT COMPLETE AND MAY BE AMENDED PRIOR TO THE TIME OF SALE. THIS TERM SHEET IS NOT AN OFFER TO SELL THESE SECURITIES AND IT IS NOT A SOLICITATION OF AN OFFER TO BUY THESE SECURITIES IN ANY JURISDICTION WHERE THE OFFER OR SALE IS NOT PERMITTED.
125
| POMONA RANCH PLAZA |
Operating History and Underwritten Net Cash Flow. The following table presents certain information relating to the historical operating performance and the Underwritten Net Cash Flow at the Pomona Ranch Plaza Property:
Cash Flow Analysis(1)
| U/W | U/W $ per SF | ||||
| Base Rent | $2,628,000 | $26.28 | |||
| Less Vacancy & Credit Loss | (131,400)(2) | (1.31) | |||
| Effective Gross Income | $2,496,600 | $24.97 | |||
| Total Operating Expenses | $840,166 | $8.40 | |||
| Net Operating Income | $1,656,434 | $16.56 | |||
| TI/LC | $150,000 | 1.50 | |||
| Capital Expenditures | 20,000 | 0.20 | |||
| Net Cash Flow | $1,486,434 | $14.86 | |||
| NOI DSCR | 1.37x | ||||
| NCF DSCR | 1.23x | ||||
| NOI DY | 9.3% | ||||
| NCF DY | 8.4% |
| (1) | The improvements at the Pomona Ranch Plaza Property were constructed in February 2014 with the tenant taking occupancy in March, 2014. As such, there are no historical financials available for the property. |
| (2) | The underwritten economic vacancy is 5.0%. The Pomona Ranch Plaza Property was 100.0% physically occupied as of September 1, 2014. |
THE INFORMATION IN THIS STRUCTURAL AND COLLATERAL TERM SHEET IS NOT COMPLETE AND MAY BE AMENDED PRIOR TO THE TIME OF SALE. THIS TERM SHEET IS NOT AN OFFER TO SELL THESE SECURITIES AND IT IS NOT A SOLICITATION OF AN OFFER TO BUY THESE SECURITIES IN ANY JURISDICTION WHERE THE OFFER OR SALE IS NOT PERMITTED.
126
(THIS PAGE INTENTIONALLY LEFT BLANK)
127
| No. 14 – Courtyard by Marriott - Orlando | ||||||||
| Loan Information | Property Information | |||||||
| Mortgage Loan Seller: | Wells Fargo Bank, National Association | Single Asset/Portfolio: | Single Asset | |||||
Credit Assessment (Fitch/Moody’s/Morningstar): | NR/NR/NR | Property Type: | Hospitality | |||||
| Original Principal Balance: | $16,250,000 | Specific Property Type: | Limited Service | |||||
| Cut-off Date Principal Balance: | $16,231,234 | Location: | Orlando, FL | |||||
| % of Initial Pool Balance: | 1.7% | Size: | 200 Rooms | |||||
| Loan Purpose: | Refinance | Cut-off Date Principal Balance Per Room: | $81,156 | |||||
| Borrower Name: | TB Orlando Hotel LLC | Year Built/Renovated: | 1999/2012 | |||||
Sponsor(1): | Jeffrey Soffer | Title Vesting: | Fee | |||||
| Mortgage Rate: | 4.640% | Property Manager: | Self-managed | |||||
| Note Date: | July 17, 2014 | 3rd Most Recent Occupancy (As of): | 66.9% (12/31/2011) | |||||
| Anticipated Repayment Date: | NAP | 2nd Most Recent Occupancy (As of)(6): | 63.1% (12/31/2012) | |||||
| Maturity Date: | August 11, 2024 | Most Recent Occupancy (As of): | 69.8% (12/31/2013) | |||||
| IO Period: | None | Current Occupancy (As of): | 70.9% (5/31/2014) | |||||
| Loan Term (Original): | 120 months | |||||||
| Seasoning: | 1 month | Underwriting and Financial Information: | ||||||
| Amortization Term (Original): | 360 months | |||||||
| Loan Amortization Type: | Amortizing Balloon | 3rd Most Recent NOI (As of)(6): | $1,424,192 (12/31/2012) | |||||
| Interest Accrual Method: | Actual/360 | 2nd Most Recent NOI (As of): | $1,856,799 (12/31/2013) | |||||
| Call Protection: | L(25),D(91),O(4) | Most Recent NOI (As of): | $1,964,075 (TTM 5/31/2014) | |||||
| Lockbox Type: | Springing (Without Established Account) | |||||||
| Additional Debt: | None | U/W Revenues: | $7,204,207 | |||||
| Additional Debt Type: | NAP | U/W Expenses: | $5,298,739 | |||||
| U/W NOI: | $1,905,468 | |||||||
| U/W NCF: | $1,617,300 | |||||||
Escrows and Reserves: | U/W NOI DSCR: | 1.90x | ||||||
| U/W NCF DSCR: | 1.61x | |||||||
Type: | Initial | Monthly | Cap (If Any) | U/W NOI Debt Yield: | 11.7% | |||
| Taxes | $171,484 | $19,054 | NAP | U/W NCF Debt Yield: | 10.0% | |||
Insurance(2) | $0 | Springing | NAP | As-Is Appraised Value: | $24,000,000 | |||
| FF&E Reserve | $0 | $24,060(3) | NAP | As-Is Appraisal Valuation Date: | June 12, 2014 | |||
PIP Reserve(4) | $0 | Springing | NAP | Cut-off Date LTV Ratio: | 67.6% | |||
Seasonality Reserve(5) | $46,189 | $11,547 | $46,189 | LTV Ratio at Maturity or ARD: | 55.0% | |||
| (1) | Jeffrey Soffer is involved in various pending litigation matters involving claims resulting from the Fontainebleau Las Vegas project filing for Chapter 11 bankruptcy protection in mid-2009 (converted to Chapter 7 bankruptcy at the end of 2009), as well as other matters. See “Description of the Mortgage Pool—Statistical Characteristics of the Mortgage Loans—Default History, Prior Bankruptcy Issues and Other Proceedings” and “Description of the Mortgage Pool—Litigation Considerations” in the Free Writing Prospectus. |
| (2) | Ongoing monthly reserves for insurance are not required as long as (i) no event of default has occurred and is continuing; (ii) the Courtyard by Marriott – Orlando Property is covered by an acceptable blanket insurance policy; and (iii) the borrower provides the lender with evidence of renewal of the insurance policies and timely proof of payment of insurance premiums. |
| (3) | Monthly FF&E deposits are required in an amount equal to one twelfth of 4.0% of total revenue. The initial monthly estimate of $24,060 can be adjusted subject to lender discretion. |
| (4) | If any additional replacements or alterations to the Courtyard by Marriott - Orlando Property are required by the franchisor (“PIP Work”), borrower must deposit (within 30 days of receipt of notice from the franchisor) an amount equal to 115% of the estimated costs to complete such PIP Work, as reasonably determined by lender. |
| (5) | The Seasonality Reserve may be used towards payment of any monthly debt service payments occurring in June, July, August and September of each year; however, each disbursement can be no greater than $11,547.25. Ongoing monthly reserves are required in January, February, March and April subject to a $46,189 cap. |
| (6) | See “Cash Flow Analysis” section. |
The Courtyard by Marriott - Orlando mortgage loan is evidenced by a single promissory note secured by a first mortgage encumbering a six-story, limited service hotel, located in the Orlando, Florida central business district (the “Courtyard by Marriott - Orlando Property”). The Courtyard by Marriott - Orlando Property was built in 1999, and the lobby and guest rooms were renovated in 2011 and 2012, respectively, for a total cost of approximately $4.0 million. The Courtyard by Marriott - Orlando Property comprises 200 guest rooms, which includes 71 king guestrooms and 129 double queen guestrooms. Amenities at the Courtyard by Marriott - Orlando Property include a full-service restaurant, outdoor swimming pool, fitness center, three meeting rooms totaling approximately 2,000 square feet of meeting space and a 24-hour sundry shop. The Courtyard by Marriott - Orlando Property is located 2.0 miles north of the 875,000 square foot Amway Center which is home to the Orlando Magic NBA team and the newly constructed Dr. Phillips Center for the Performing Arts which is expected to open in November 2014. The Courtyard by Marriott franchise agreement expires in March 2024.
THE INFORMATION IN THIS STRUCTURAL AND COLLATERAL TERM SHEET IS NOT COMPLETE AND MAY BE AMENDED PRIOR TO THE TIME OF SALE. THIS TERM SHEET IS NOT AN OFFER TO SELL THESE SECURITIES AND IT IS NOT A SOLICITATION OF AN OFFER TO BUY THESE SECURITIES IN ANY JURISDICTION WHERE THE OFFER OR SALE IS NOT PERMITTED.
128
| COURTYARD BY MARRIOTT - ORLANDO |
Sources and Uses
| Sources | Uses | ||||||||
| Original loan amount | $16,250,000 | 100.0% | Loan payoff | $11,079,993 | 68.2 | % | |||
| Reserves | 217,673 | 1.3 | |||||||
| Closing costs | 105,612 | 0.6 | |||||||
| Return of equity | 4,846,722 | 29.8 | |||||||
| Total Sources | $16,250,000 | 100.0% | Total Uses | $16,250,000 | 100.0 | % |
The following table presents certain information relating to the Courtyard by Marriott - Orlando Property’s competitive set:
Subject and Market Historical Occupancy, ADR and RevPAR(1)
Competitive Set | Courtyard by Marriott – Orlando | Penetration Factor | |||||||||||||||
Year | Occupancy | ADR | RevPAR | Occupancy | ADR | RevPAR | Occupancy | ADR | RevPAR | ||||||||
| 7/31/2014 TTM | 70.2% | $107.46 | $75.48 | 69.5% | $120.67 | $83.81 | 98.9% | 112.3% | 111.0% | ||||||||
| 7/31/2013 TTM | 66.2% | $102.73 | $68.04 | 63.3% | $114.11 | $72.24 | 95.6% | 111.1% | 106.2% | ||||||||
| 7/31/2012 TTM | 62.0% | $102.77 | $63.76 | 65.1% | $108.59 | $70.71 | 104.9% | 105.7% | 110.9% | ||||||||
| (1) | Information obtained from a third party hospitality report dated August 20, 2014. The competitive set includes: Courtyard Orlando Downtown, Crowne Plaza Orlando Downtown, Doubletree Orlando Downtown, Sheraton Hotel Orlando Downtown (hotel closed in February 2014), Courtyard Orlando Altamonte Springs Maitland, Comfort Suites Downtown Orlando, Homewood Suites Orlando Maitland and Embassy Suites Orlando Downtown. |
Operating History and Underwritten Net Cash Flow. The following table presents certain information relating to the historical operating performance and the Underwritten Net Cash Flow at the Courtyard by Marriott - Orlando Property:
Cash Flow Analysis
| 2011 | 2012 | 2013 | TTM 5/31/2014 | U/W | U/W $ per Room | |||||||
| Occupancy | 66.9% | 63.1%(1) | 69.8% | 70.9% | 70.9% | |||||||
| ADR | $107.72 | $110.16 | $116.87 | $118.15 | $118.15 | |||||||
| RevPAR | $72.07 | $69.51 | $81.58 | $83.74 | $83.74 | |||||||
| Total Revenue | $5,840,103 | $5,975,937 | $6,933,867 | $7,204,207 | $7,204,207 | $36,021 | ||||||
| Total Department Expenses | 1,575,537 | 1,791,860 | 1,988,825 | 2,052,893 | 2,052,893 | 10,264 | ||||||
| Gross Operating Profit | $4,264,566 | $4,184,077 | $4,945,042 | $5,151,314 | $5,151,314 | $25,757 | ||||||
| Total Undistributed Expenses | 2,263,330 | 2,360,489 | 2,660,931 | 2,752,050 | 2,751,740 | 13,759 | ||||||
| Profit Before Fixed Charges | $2,001,236 | $1,823,588 | $2,284,111 | $2,399,264 | $2,399,574 | $11,998 | ||||||
| Total Fixed Charges | 398,808 | 399,396 | 427,312 | 435,189 | 494,106 | 2,471 | ||||||
| Net Operating Income | $1,602,428 | $1,424,192 | $1,856,799 | $1,964,075 | $1,905,468 | $9,527 | ||||||
| FF&E | 0 | 0 | 0 | 0 | 288,168 | 1,441 | ||||||
| Net Cash Flow | $1,602,428 | $1,424,192 | $1,856,799 | $1,964,075 | $1,617,300 | $8,086 | ||||||
| NOI DSCR | 1.60x | 1.42x | 1.85x | 1.96x | 1.90x | |||||||
| NCF DSCR | 1.60x | 1.42x | 1.85x | 1.96x | 1.61x | |||||||
| NOI DY | 9.9% | 8.8% | 11.4% | 12.1% | 11.7% | |||||||
| NCF DY | 9.9% | 8.8% | 11.4% | 12.1% | 10.0% | |||||||
| (1) | The Courtyard by Marriott - Orlando Property underwent a $2.4 million ($12,243 per key) guestroom renovation in 2012 and two full floors consisting of approximately 80 rooms were taken offline on a rolling basis. |
THE INFORMATION IN THIS STRUCTURAL AND COLLATERAL TERM SHEET IS NOT COMPLETE AND MAY BE AMENDED PRIOR TO THE TIME OF SALE. THIS TERM SHEET IS NOT AN OFFER TO SELL THESE SECURITIES AND IT IS NOT A SOLICITATION OF AN OFFER TO BUY THESE SECURITIES IN ANY JURISDICTION WHERE THE OFFER OR SALE IS NOT PERMITTED.
129
| No. 15 – The Shops at Starwood | |||||||
| Loan Information | Property Information | ||||||
| Mortgage Loan Seller: | Wells Fargo Bank, National Association | Single Asset/Portfolio: | Single Asset | ||||
Credit Assessment (Fitch/Moody’s/Morningstar): | NR/NR/NR | Property Type: | Mixed Use | ||||
| Original Principal Balance: | $14,300,000 | Specific Property Type: | Retail/Office | ||||
| Cut-off Date Principal Balance: | $14,300,000 | Location: | Frisco, TX | ||||
| % of Initial Pool Balance: | 1.5% | Size: | 55,385 SF | ||||
| Loan Purpose: | Refinance | Cut-off Date Principal Balance Per SF: | $258.19 | ||||
| Borrower Name: | Whitestone Shops at Starwood, LLC | Year Built/Renovated: | 2007/NAP | ||||
| Sponsor: | Whitestone REIT Operating Partnership, L.P. | Title Vesting: | Fee | ||||
| Mortgage Rate: | 4.340% | Property Manager: | Self-managed | ||||
| Note Date: | August 26, 2014 | 3rd Most Recent Occupancy (As of): | 98.0% (12/31/2011) | ||||
| Anticipated Repayment Date: | NAP | 2nd Most Recent Occupancy (As of): | 100.0% (12/31/2012) | ||||
| Maturity Date: | September 11, 2024 | Most Recent Occupancy (As of): | 100.0% (12/31/2013) | ||||
| IO Period: | 60 months | Current Occupancy (As of): | 93.6% (8/14/2014) | ||||
| Loan Term (Original): | 120 months | ||||||
| Seasoning: | 0 months | Underwriting and Financial Information: | |||||
| Amortization Term (Original): | 360 months | ||||||
| Loan Amortization Type: | Interest-only, Amortizing Balloon | 3rd Most Recent NOI (As of): | $1,360,067 (12/31/2012) | ||||
| Interest Accrual Method: | Actual/360 | 2nd Most Recent NOI (As of): | $1,430,864 (12/31/2013) | ||||
| Call Protection: | L(24),D(92),O(4) | Most Recent NOI (As of): | $1,373,259 (TTM 6/30/2014) | ||||
| Lockbox Type: | None | ||||||
| Additional Debt: | None | ||||||
| Additional Debt Type: | NAP | U/W Revenues: | $2,005,332 | ||||
| U/W Expenses: | $652,781 | ||||||
| U/W NOI: | $1,352,551 | ||||||
| U/W NCF: | $1,247,878 | ||||||
Escrows and Reserves: | U/W NOI DSCR: | 1.59x | |||||
| U/W NCF DSCR: | 1.46x | ||||||
Type: | Initial | Monthly | Cap (If Any) | U/W NOI Debt Yield: | 9.5% | ||
| Taxes | $266,319 | $29,591 | NAP | U/W NCF Debt Yield: | 8.7% | ||
Insurance(1) | $0 | Springing | NAP | As-Is Appraised Value: | $19,780,000 | ||
| Replacement Reserves | $0 | $923 | $33,231(2) | As-Is Appraisal Valuation Date: | July 28, 2014 | ||
| TI/LC Reserve | $0 | $4,615 | $232,000(3) | Cut-off Date LTV Ratio: | 72.3% | ||
Rent Concession Reserve(4) | $50,094 | $0 | NAP | LTV Ratio at Maturity or ARD: | 66.0% | ||
| (1) | Ongoing monthly reserves for insurance are not required as long as: (i) no event of default has occurred and is continuing; (ii) The Shops at Starwood Property is covered by an acceptable blanket insurance policy; and (iii) the borrower provides the lender with evidence of renewal of insurance policies and timely proof of payment of insurance premiums. |
| (2) | The Replacement Reserves will be capped at $33,321 as long as: (i) no event of default has occurred and is continuing; (ii) lender determines The Shops at Starwood Property is being adequately maintained; (iii) the DSCR is greater than 1.10x; and (iv) The Shops at Starwood Property is at least 90% occupied. |
| (3) | The TI/LC Reserve will be capped at $232,000 as long as: (i) no event of default has occurred and is continuing; (ii) lender determines The Shops at Starwood Property is being adequately maintained; (iii) the DSCR is greater than 1.10x; and (iv) The Shops at Starwood Property is at least 90% occupied. |
| (4) | Upfront Rent Concession Reserves are required for The Gent’s Place ($22,870), Century 21 ($17,170), Glambo Lily Day Spa ($4,989) and North Star MRI ($5,065). |
The Shops at Starwood mortgage loan is evidenced by a single promissory note that is secured by a first mortgage encumbering a 55,385 square foot mixed use center (“The Shops at Starwood Property”) situated on a 6.1-acre site located in Frisco, Texas, approximately 25 miles north of Dallas. The Shops at Starwood Property was built in 2007 and is comprised of two, one- and two-story buildings containing 44,923 square feet (81.1% of the net rentable area) of retail space and 10,462 square feet (18.9% of the net rentable area) of office space. The Shops at Starwood Property features 228 surface parking spaces resulting in a parking ratio of 4.1 spaces per 1,000 square feet of rentable area. The 2014 population within a one-, three- and five-mile radius of The Shops at Starwood Property was 7,099, 80,657 and 228,890, respectively, while the 2014 estimated average household income within a one-, three- and five-mile radius of The Shops at Starwood Property was $138,350, $111,812 and $116,746, respectively. As of August 14, 2014, The Shops at Starwood Property was 93.6% physically occupied by 23 tenants.
THE INFORMATION IN THIS STRUCTURAL AND COLLATERAL TERM SHEET IS NOT COMPLETE AND MAY BE AMENDED PRIOR TO THE TIME OF SALE. THIS TERM SHEET IS NOT AN OFFER TO SELL THESE SECURITIES AND IT IS NOT A SOLICITATION OF AN OFFER TO BUY THESE SECURITIES IN ANY JURISDICTION WHERE THE OFFER OR SALE IS NOT PERMITTED.
130
Sources and Uses
| Sources | Uses | ||||||||
| Original loan amount | $14,300,000 | 100.0% | Loan Payoff | $12,200,000 | 85.3 | % | |||
| Reserves | 316,413 | 2.2 | |||||||
| Closing costs | 275,439 | 1.9 | |||||||
| Return of equity | 1,508,148 | 10.5 | |||||||
| Total Sources | $14,300,000 | 100.0% | Total Uses | $14,300,000 | 100.0 | % | |||
The following table presents certain information relating to the tenancy at The Shops at Starwood Property:
Major Tenants
| Tenant Name | Credit Rating (Fitch/Moody’s/ S&P) | Tenant NRSF | % of NRSF | Annual U/W Base Rent PSF | Annual U/W Base Rent | % of Total Annual U/W Base Rent | Sales PSF(1) | Occupancy Cost(1) | Lease Expiration Date |
| Major Tenants | |||||||||
| Bonnie Ruth’s Café | NR/NR/NR | 5,255 | 9.5% | $33.15 | $174,203 | 11.6% | $408 | 10.6% | 11/30/2016 |
| Tupy’s Mexican Food | NR/NR/NR | 4,686 | 8.5% | $28.00 | $131,208 | 8.8% | NAV | NAV | 8/1/2020 |
| Tru Fire Kitchen and Bar | NR/NR/NR | 3,499 | 6.3% | $35.00 | $122,460 | 8.2% | $728 | 6.3% | 7/17/2018 |
| Century 21 | NR/NR/NR | 5,408 | 9.8% | $19.05(2) | $103,022(2) | 6.9% | NAV | NAV | 12/31/2019 |
| Kotta Sushi Lounge | NR/NR/NR | 3,102 | 5.6% | $32.00 | $99,264 | 6.6% | $726 | 7.0% | 2/28/2022 |
| Aveda Salon | NR/NR/NR | 2,629 | 4.7% | $35.66 | $93,750 | 6.3% | NAV | NAV | 12/31/2016 |
| Smashburger | NR/NR/NR | 2,500 | 4.5% | $27.50 | $68,750 | 4.6% | NAV | NAV | 8/30/2016 |
| The Gent’s Place | NR/NR/NR | 2,095 | 3.8% | $32.00(3) | $67,040(3) | 4.5% | $421 | 10.0% | 5/31/2019 |
| Total Major Tenants | 29,174 | 52.7% | $29.47 | $859,698 | 57.5% | ||||
| Non-Major Tenants | 22,693 | 41.0% | $28.06 | $636,703 | 42.5% | ||||
| Occupied Collateral Total | 51,867 | 93.6% | $28.85 | $1,496,401 | 100.0% | ||||
| Vacant Space | 3,518 | 6.4% | |||||||
| Collateral Total | 55,385 | 100.0% | |||||||
| (1) | Sales PSF and Occupancy Costs are based on the trailing 12-month period ending December 31, 2013 and the current in-place rent, respectively, unless otherwise noted. |
| (2) | Century 21 has a rent concession for the months of November 2014 and January 2015. Lender reserved the rent for those periods at the closing of mortgage loan. |
| (3) | The Gent’s Place has a rent concession for the months of December 2015, December 2016, December 2017 and December 2018. Lender reserved the rent for those periods at the closing of the mortgage loan. |
THE INFORMATION IN THIS STRUCTURAL AND COLLATERAL TERM SHEET IS NOT COMPLETE AND MAY BE AMENDED PRIOR TO THE TIME OF SALE. THIS TERM SHEET IS NOT AN OFFER TO SELL THESE SECURITIES AND IT IS NOT A SOLICITATION OF AN OFFER TO BUY THESE SECURITIES IN ANY JURISDICTION WHERE THE OFFER OR SALE IS NOT PERMITTED.
131
| THE SHOPS AT STARWOOD |
The following table presents certain information relating to the lease rollover schedule at The Shops at Starwood Property:
Lease Expiration Schedule(1)(2)
Year Ending December 31, | No. of Leases Expiring | Expiring NRSF | % of Total NRSF | Cumulative Expiring NRSF | Cumulative % of Total NRSF | Annual U/W Base Rent | Annual U/W Base Rent PSF(3) | ||||||
| MTM | 0 | 0 | 0.0% | 0 | 0.0% | $0 | $0.00 | ||||||
| 2014 | 0 | 0 | 0.0% | 0 | 0.0% | $0 | $0.00 | ||||||
| 2015 | 3 | 5,233 | 9.4% | 5,233 | 9.4% | $120,307 | $22.99 | ||||||
| 2016 | 5 | 13,504 | 24.4% | 18,737 | 33.8% | $436,543 | $32.33 | ||||||
| 2017 | 4 | 7,111 | 12.8% | 25,848 | 46.7% | $191,735 | $26.96 | ||||||
| 2018 | 3 | 5,228 | 9.4% | 31,076 | 56.1% | $179,705 | $34.37 | ||||||
| 2019 | 6 | 13,003 | 23.5% | 44,079 | 79.6% | $337,639 | $25.97 | ||||||
| 2020 | 1 | 4,686 | 8.5% | 48,765 | 88.0% | $131,208 | $28.00 | ||||||
| 2021 | 0 | 0 | 0.0% | 48,765 | 88.0% | $0 | $0.00 | ||||||
| 2022 | 1 | 3,102 | 5.6% | 51,867 | 93.6% | $99,264 | $32.00 | ||||||
| 2023 | 0 | 0 | 0.0% | 51,867 | 93.6% | $0 | $0.00 | ||||||
| 2024 | 0 | 0 | 0.0% | 51,867 | 93.6% | $0 | $0.00 | ||||||
| Thereafter | 0 | 0 | 0.0% | 51,867 | 93.6% | $0 | $0.00 | ||||||
| Vacant | 0 | 3,518 | 6.4% | 55,385 | 100.0% | $0 | $0.00 | ||||||
| Total/Weighted Average | 23 | 55,385 | 100.0% | $1,496,401 | $28.85 |
| (1) | Information obtained from the underwritten rent roll. |
| (2) | Certain tenants may have lease termination options that are exercisable prior to the originally stated expiration date of the subject lease and that are not considered in the Lease Expiration Schedule. |
| (3) | Weighted Average Annual U/W Base Rent PSF excludes vacant space. |
The following table presents historical occupancy percentages at The Shops at Starwood Property:
Historical Occupancy
12/31/2011(1) | 12/31/2012(1) | 12/31/2013(1) | 8/14/2014(2) | |||
| 98.0% | 100.0% | 100.0% | 93.6% |
| (1) | Information obtained from the borrower. |
| (2) | Information obtained from the underwritten rent roll. |
Operating History and Underwritten Net Cash Flow. The following table presents certain information relating to the Underwritten Net Cash Flow at The Shops at Starwood Property:
Cash Flow Analysis
| 2012 | 2013 | TTM 6/30/2014 | U/W | U/W $ per SF | ||||||
| Base Rent | $1,432,561 | $1,463,575 | $1,473,504 | $1,496,401 | $27.02 | |||||
| Grossed Up Vacant Space | 0 | 0 | 0 | 94,626 | 1.71 | |||||
| Total Reimbursables | 572,135 | 512,942 | 511,463 | 502,241 | 9.07 | |||||
| Percentage Rent | 49,681 | 119,177 | 106,303 | 31,391 | 0.57 | |||||
| Other Income | 1,275 | 9,119 | 11,980 | 0 | 0.00 | |||||
| Less Vacancy & Credit Loss | (20,377) | (32,102) | (85,944) | (119,327)(1) | (2.15) | |||||
| Effective Gross Income | $2,035,276 | $2,072,713 | $2,017,306 | $2,005,332 | $36.21 | |||||
| Total Operating Expenses | $675,209 | $641,848 | $644,047 | $652,781 | $11.79 | |||||
| Net Operating Income | $1,360,067 | $1,430,864 | $1,373,259 | $1,352,551 | $24.42 | |||||
| TI/LC | 0 | 0 | 0 | 93,596 | 1.69 | |||||
| Capital Expenditures | 0 | 0 | 0 | 11,077 | 0.20 | |||||
| Net Cash Flow | $1,360,067 | $1,430,864 | $1,373,259 | $1,247,878 | $22.53 | |||||
| NOI DSCR | 1.59x | 1.68x | 1.61x | 1.59x | ||||||
| NCF DSCR | 1.59x | 1.68x | 1.61x | 1.46x | ||||||
| NOI DY | 9.5% | 10.0% | 9.6% | 9.5% | ||||||
| NCF DY | 9.5% | 10.0% | 9.6% | 8.7% |
| (1) | The underwritten economic vacancy is 7.5%. The Shops at Starwood Property was 93.6% physically occupied as of August 14, 2014. |
THE INFORMATION IN THIS STRUCTURAL AND COLLATERAL TERM SHEET IS NOT COMPLETE AND MAY BE AMENDED PRIOR TO THE TIME OF SALE. THIS TERM SHEET IS NOT AN OFFER TO SELL THESE SECURITIES AND IT IS NOT A SOLICITATION OF AN OFFER TO BUY THESE SECURITIES IN ANY JURISDICTION WHERE THE OFFER OR SALE IS NOT PERMITTED.
132
(THIS PAGE INTENTIONALLY LEFT BLANK)
133
| WFRBS Commercial Mortgage Trust 2014-C23 | Transaction Contact Information |
VI. Transaction Contact Information
Questions regarding this Structural and Collateral Term Sheet may be directed to any of the following individuals:
| RBS Securities Inc. | Wells Fargo Securities, LLC | ||
| Todd Jaeger - Trading | Tel. (203) 897-2900 | Brigid Mattingly | Tel. (312) 269-3062 |
| Fax (312) 658-0140 | |||
| Adam Ansaldi | Tel. (203) 897-0881 | A.J. Sfarra | Tel. (212) 214-5613 |
| Fax (203) 873-3542 | Fax (212) 214-8970 | ||
| Jim Barnard | Tel. (203) 897-4417 | Alex Wong | Tel. (212) 214-5615 |
| Fax (203) 873-4310 | Fax (212) 214-8970 | ||
THE INFORMATION IN THIS STRUCTURAL AND COLLATERAL TERM SHEET IS NOT COMPLETE AND MAY BE AMENDED PRIOR TO THE TIME OF SALE. THIS TERM SHEET IS NOT AN OFFER TO SELL THESE SECURITIES AND IT IS NOT A SOLICITATION OF AN OFFER TO BUY THESE SECURITIES IN ANY JURISDICTION WHERE THE OFFER OR SALE IS NOT PERMITTED.
134