T. Rowe Price Group, Inc. INVESTOR DAY February 26, 2019 A copy of this presentation which includes additional information is available at troweprice.gcs-web.com/investor-relations. Data as of December 31, 2018, unless otherwise noted.
Opening and T. Rowe Price Overview Bill Stromberg PRESIDENT AND CEO T. ROWE PRICE GROUP, INC. INVESTOR DAY 2019

Forward-looking statements This presentation, and other statements that T. Rowe Price may make, may contain forward-looking statements within the meaning of the Private Securities Litigation Reform Act of 1995, with respect to T. Rowe Price’s future financial or business performance, strategies, or expectations. Forward-looking statements are typically identified by (1) words or phrases such as “trend,” “potential,” “opportunity,” “pipeline,” “believe,” “comfortable,” “expect,” “anticipate,” “current,” “intention,” “estimate,” “position,” “assume,” “outlook,” “continue,” “remain,” “maintain,” “sustain,” “seek,” “achieve,” and similar expressions or (2) future or conditional verbs such as “will,” “would,” “should,” “could,” “may,” and similar expressions. Forward-looking statements in this presentation may include, without limitation, information concerning future results of our operations, expenses, earnings, liquidity, cash flow and capital expenditures, industry or market conditions, amount or composition of AUM, regulatory developments, demand for and pricing of our products, potential product offerings, stock price, amount and timing of our stock repurchases, and other aspects of our business or general economic conditions. T. Rowe Price cautions that forward-looking statements are subject to numerous assumptions, risks, and uncertainties, which change over time. Actual results could differ materially from those anticipated in forward-looking statements, and future results could differ materially from historical performance. Forward-looking statements speak only as of the date they are made, and T. Rowe Price assumes no duty to and does not undertake to update forward-looking statements. We caution investors not to rely unduly on any forward-looking statements and urge you to carefully consider the risks and other factors described in our most recent annual, quarterly, and current reports on Form 10-K, Form 10-Q, and Form 8-K, filed with the Securities and Exchange Commission. T. ROWE PRICE GROUP, INC. INVESTOR DAY 2019 3
Agenda Opening and T. Rowe Price Overview Bill Stromberg PRESIDENT AND CEO Investments, Performance, and Capabilities Rob Sharps HEAD OF INVESTMENTS AND GROUP CIO Global Intermediary and Institutional Robert Higginbotham Distribution HEAD OF GLOBAL INVESTMENT MANAGEMENT SERVICES Financial Overview Céline Dufétel CHIEF FINANCIAL OFFICER Closing and Questions Bill Stromberg PRESIDENT AND CEO T. ROWE PRICE GROUP, INC. INVESTOR DAY 2019 4
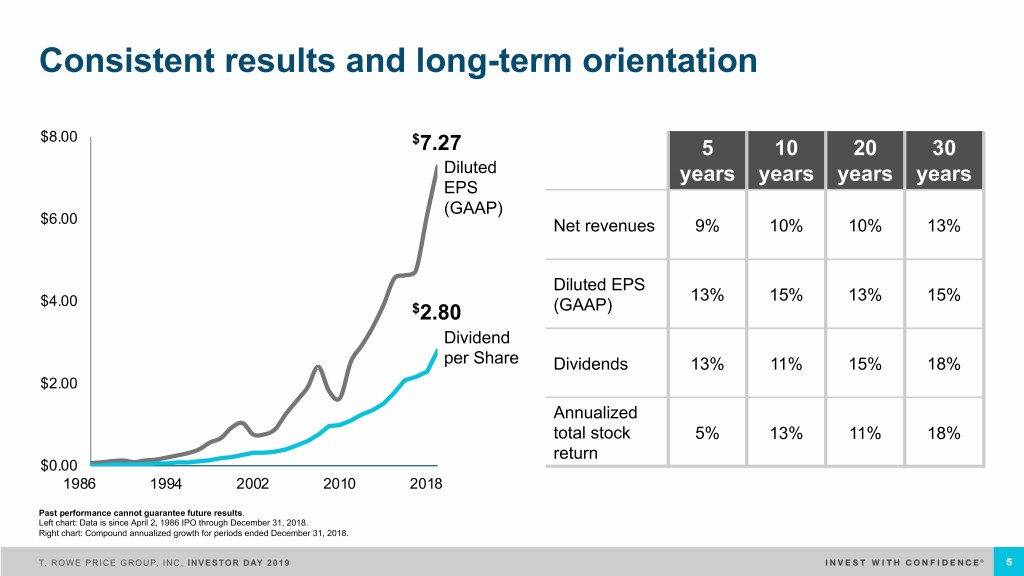
Consistent results and long-term orientation $8.00 $7.27 5 10 20 30 Diluted years years years years EPS (GAAP) $6.00 Net revenues 9% 10% 10% 13% Diluted EPS $4.00 13% 15% 13% 15% $2.80 (GAAP) Dividend per Share Dividends 13% 11% 15% 18% $2.00 Annualized total stock 5% 13% 11% 18% return $0.00 1986 1994 2002 2010 2018 Past performance cannot guarantee future results. Left chart: Data is since April 2, 1986 IPO through December 31, 2018. Right chart: Compound annualized growth for periods ended December 31, 2018. T. ROWE PRICE GROUP, INC. INVESTOR DAY 2019 5
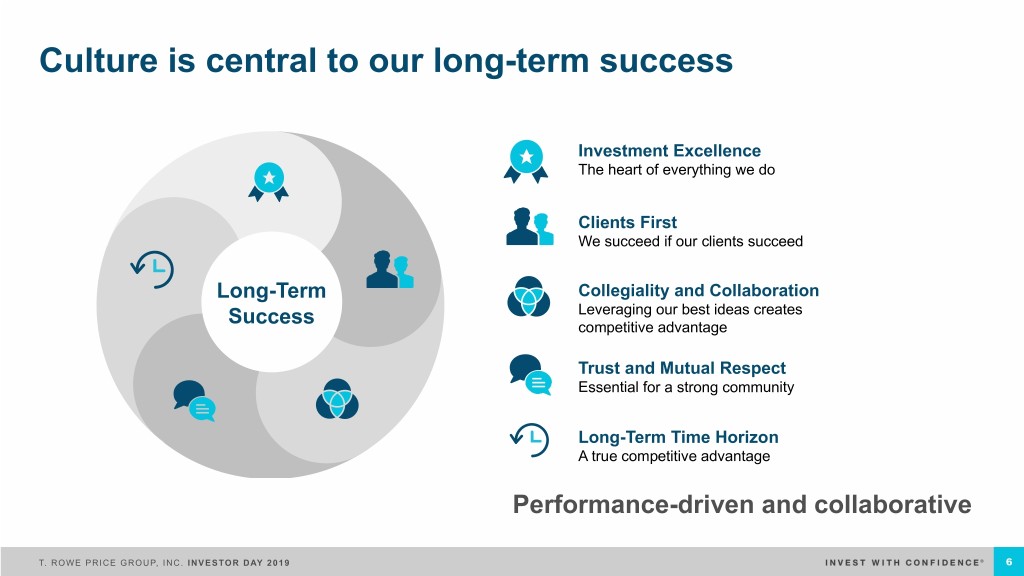
Culture is central to our long-term success Investment Excellence The heart of everything we do Clients First We succeed if our clients succeed Long-Term Collegiality and Collaboration Success Leveraging our best ideas creates competitive advantage Trust and Mutual Respect Essential for a strong community Long-Term Time Horizon A true competitive advantage Performance-driven and collaborative T. ROWE PRICE GROUP, INC. INVESTOR DAY 2019 6
Our vision We are executing on a longer-term plan Premier active asset manager Strong process orientation and system of internal controls Integrated investment solutions Destination of choice for top talent provider More global and diversified More adaptive and agile company asset manager Global partner for retirement-oriented Strong financial results and investors balance sheet T. ROWE PRICE GROUP, INC. INVESTOR DAY 2019 7
Industry challenges continue § Passive investments continuing to take share from active § Continued downward pressure on management fees § Institutional and intermediary clients demanding new vehicle types and fee structures § Aging population shifting demand from equities to income-oriented solutions § Maturing U.S. market with faster growth occurring outside the U.S. § Digital technology reshaping client engagement § Regulatory requirements increasing in all regions § A volatile equity market after an extended bull market, amidst ongoing geopolitical concerns T. ROWE PRICE GROUP, INC. INVESTOR DAY 2019 8
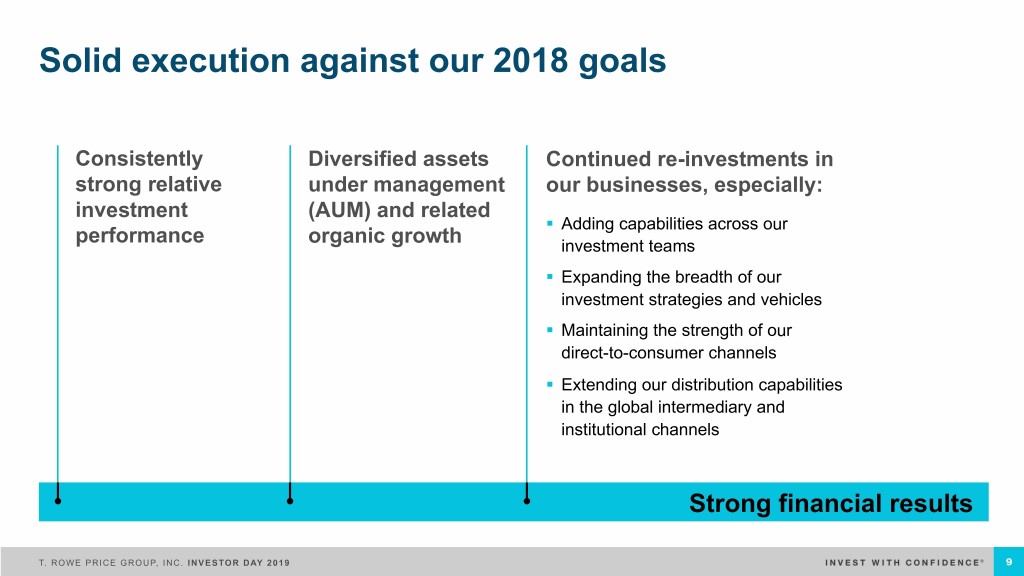
Solid execution against our 2018 goals Consistently Diversified assets Continued re-investments in strong relative under management our businesses, especially: investment (AUM) and related § Adding capabilities across our performance organic growth investment teams § Expanding the breadth of our investment strategies and vehicles § Maintaining the strength of our direct-to-consumer channels § Extending our distribution capabilities in the global intermediary and institutional channels Strong financial results T. ROWE PRICE GROUP, INC. INVESTOR DAY 2019 9
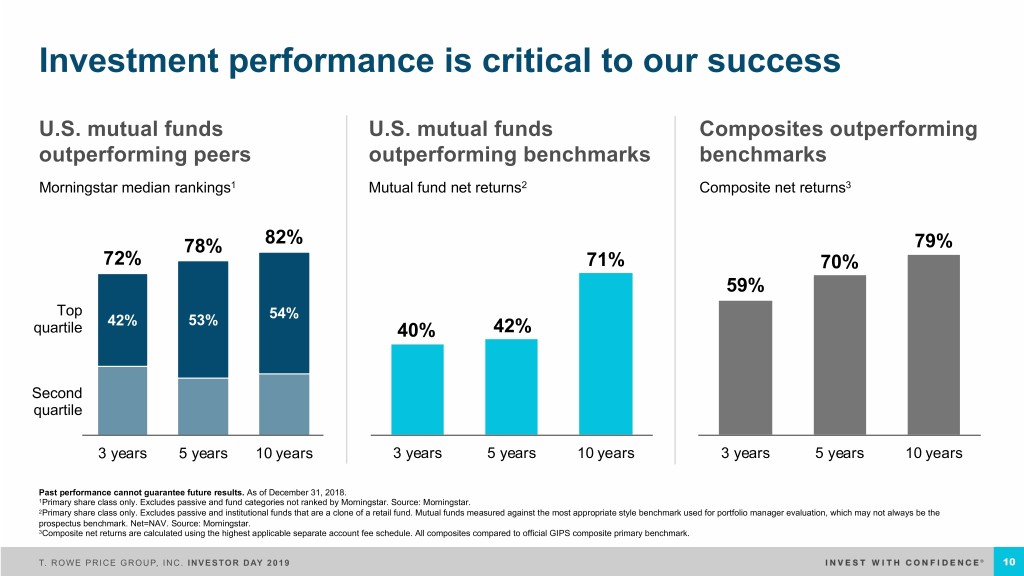
Investment performance is critical to our success U.S. mutual funds U.S. mutual funds Composites outperforming outperforming peers outperforming benchmarks benchmarks Morningstar median rankings1 Mutual fund net returns2 Composite net returns3 78% 82% 79% 72% 71% 70% 59% Top 42% 53% 54% quartile 40% 42% Second quartile 3 years 5 years 10 years 3 years 5 years 10 years 3 years 5 years 10 years Past performance cannot guarantee future results. As of December 31, 2018. 1Primary share class only. Excludes passive and fund categories not ranked by Morningstar. Source: Morningstar. 2Primary share class only. Excludes passive and institutional funds that are a clone of a retail fund. Mutual funds measured against the most appropriate style benchmark used for portfolio manager evaluation, which may not always be the prospectus benchmark. Net=NAV. Source: Morningstar. 3Composite net returns are calculated using the highest applicable separate account fee schedule. All composites compared to official GIPS composite primary benchmark. T. ROWE PRICE GROUP, INC. INVESTOR DAY 2019 10
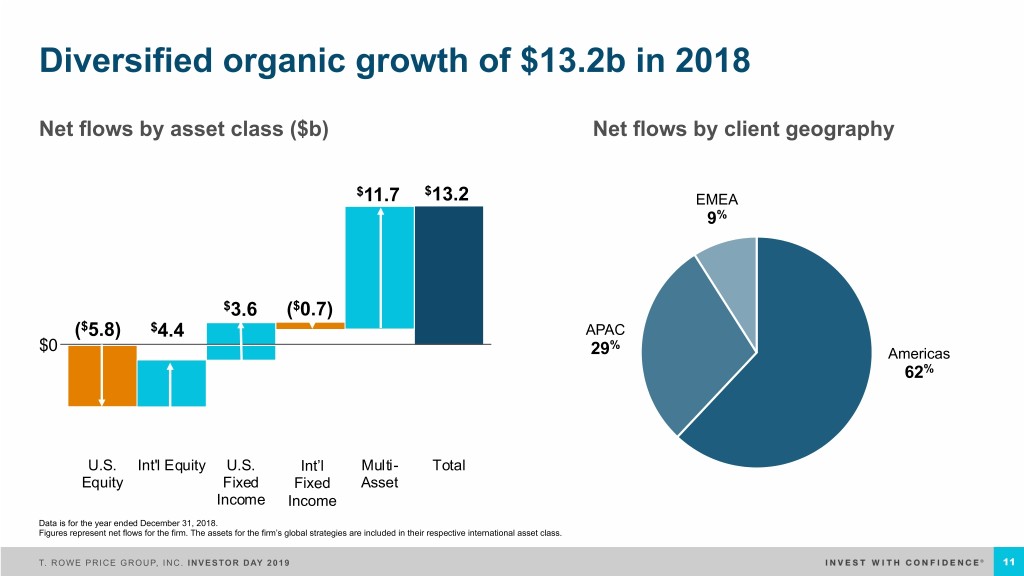
C&h3>4F+$9zqr*8@O Diversified organic growth of $13.2b in 2018 Net flows by asset class ($b) Net flows by client geography $ $ 11.7 13.2 EMEA 9% $3.6 ($0.7) ($5.8) $4.4 APAC % $0 29 Americas 62% U.S. Int'l Equity U.S. Int'lInt’l Fixed Multi- Total Equity Fixed IncomeFixed Asset Income Income Data is for the year ended December 31, 2018. Figures represent net flows for the firm. The assets for the firm’s global strategies are included in their respective international asset class. T. ROWE PRICE GROUP, INC. INVESTOR DAY 2019 11

Diversified AUM by asset class and by client type Asset class1 Client type2 EMEA/APAC Int’l Fixed U.S. Retirement – Financial Income Int’l Equity Full-Service Intermediaries 8% 2% Recordkeeping 3% 11% U.S. Fixed Income 12% U.S. Individual Investors U.S. Equity Americas 17% Financial 48% Intermediaries 47% Multi-Asset 30% Global Institutional Investors 22% Numbers represent percentages of total firm AUM as of December 31, 2018. Firm AUM includes assets managed by T. Rowe Price Associates, Inc. and its investment advisory affiliates. 1Based on investment strategy. The assets for the firm’s global strategies are included in their respective international asset class. 2Global institutional investors includes T. Rowe Price investments in proprietary products, assets of the T. Rowe Price employee benefit plans, Private Asset Management accounts, and other. T. ROWE PRICE GROUP, INC. INVESTOR DAY 2019 12
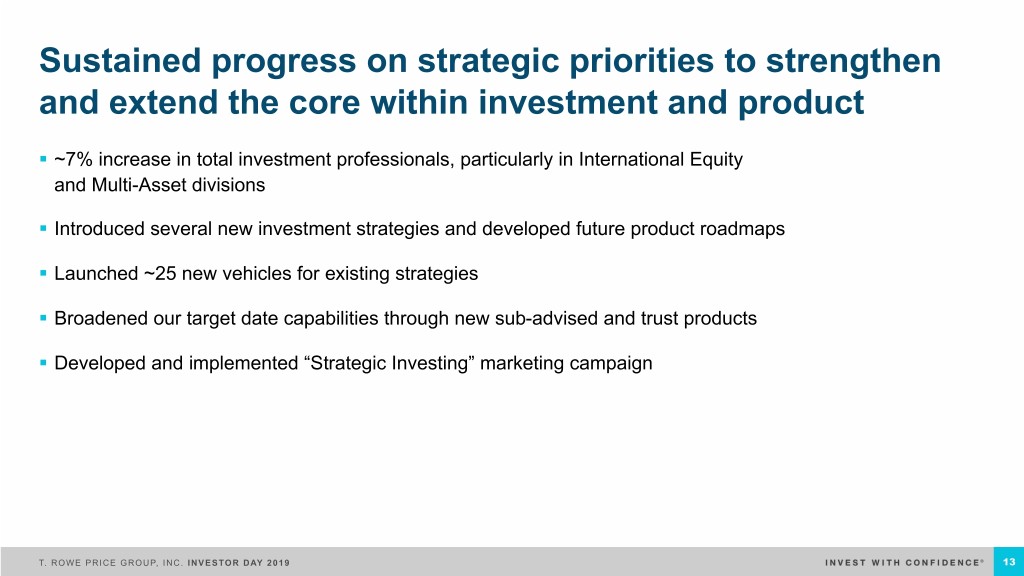
Sustained progress on strategic priorities to strengthen and extend the core within investment and product § ~7% increase in total investment professionals, particularly in International Equity and Multi-Asset divisions § Introduced several new investment strategies and developed future product roadmaps § Launched ~25 new vehicles for existing strategies § Broadened our target date capabilities through new sub-advised and trust products § Developed and implemented “Strategic Investing” marketing campaign T. ROWE PRICE GROUP, INC. INVESTOR DAY 2019 13
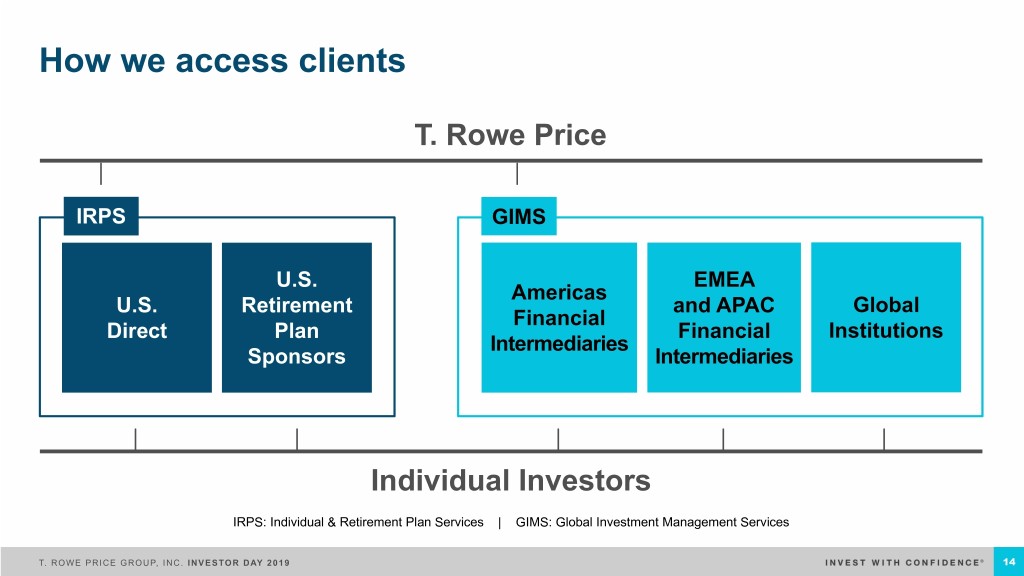
How we access clients T. Rowe Price IRPS GIMS U.S. EMEA Americas U.S. Retirement and APAC Global Financial Direct Plan Financial Institutions Intermediaries Sponsors Intermediaries Individual Investors IRPS: Individual & Retirement Plan Services | GIMS: Global Investment Management Services T. ROWE PRICE GROUP, INC. INVESTOR DAY 2019 14
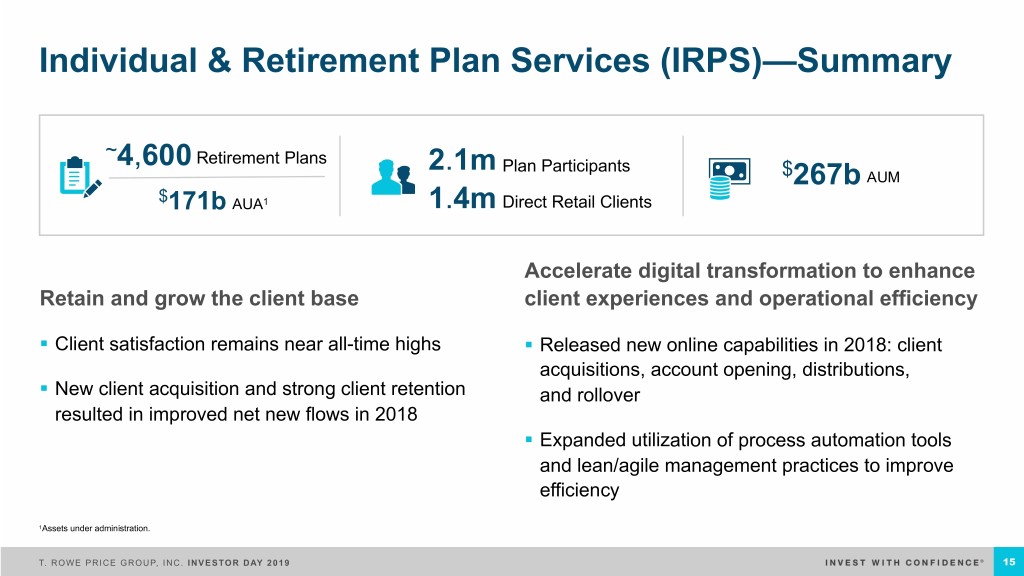
Individual & Retirement Plan Services (IRPS)—Summary ~ Retirement Plans 4,600 2.1m Plan Participants $ 267b AUM $ 171b AUA1 1.4m Direct Retail Clients Accelerate digital transformation to enhance Retain and grow the client base client experiences and operational efficiency § Client satisfaction remains near all-time highs § Released new online capabilities in 2018: client acquisitions, account opening, distributions, § New client acquisition and strong client retention and rollover resulted in improved net new flows in 2018 § Expanded utilization of process automation tools and lean/agile management practices to improve efficiency 1Assets under administration. T. ROWE PRICE GROUP, INC. INVESTOR DAY 2019 15
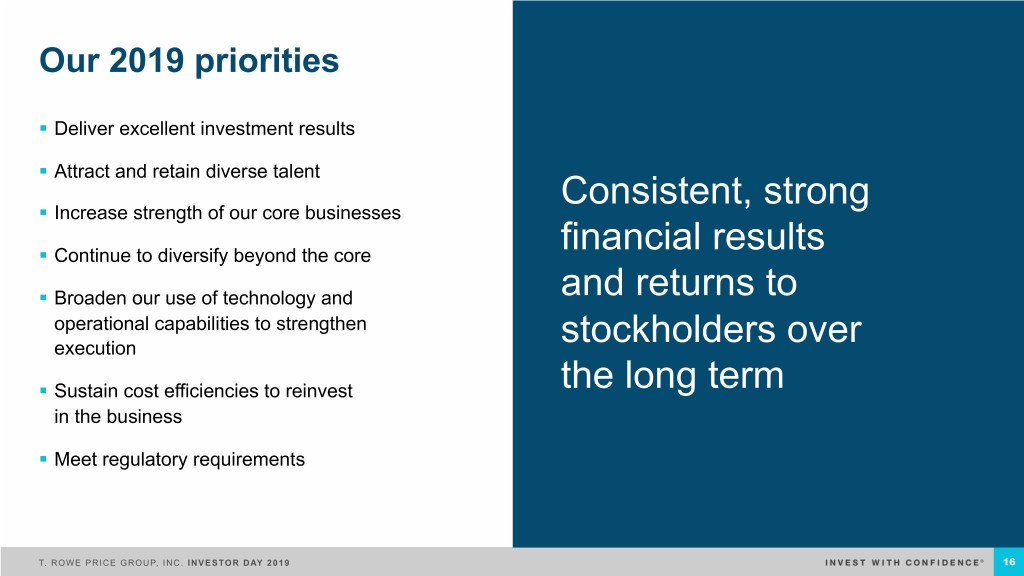
Our 2019 priorities § Deliver excellent investment results § Attract and retain diverse talent Consistent, strong § Increase strength of our core businesses § Continue to diversify beyond the core financial results § Broaden our use of technology and and returns to operational capabilities to strengthen execution stockholders over § Sustain cost efficiencies to reinvest the long term in the business § Meet regulatory requirements T. ROWE PRICE GROUP, INC. INVESTOR DAY 2019 16

Investments, Performance, and Capabilities Rob Sharps HEAD OF INVESTMENTS AND GROUP CIO T. ROWE PRICE GROUP, INC. INVESTOR DAY 2019
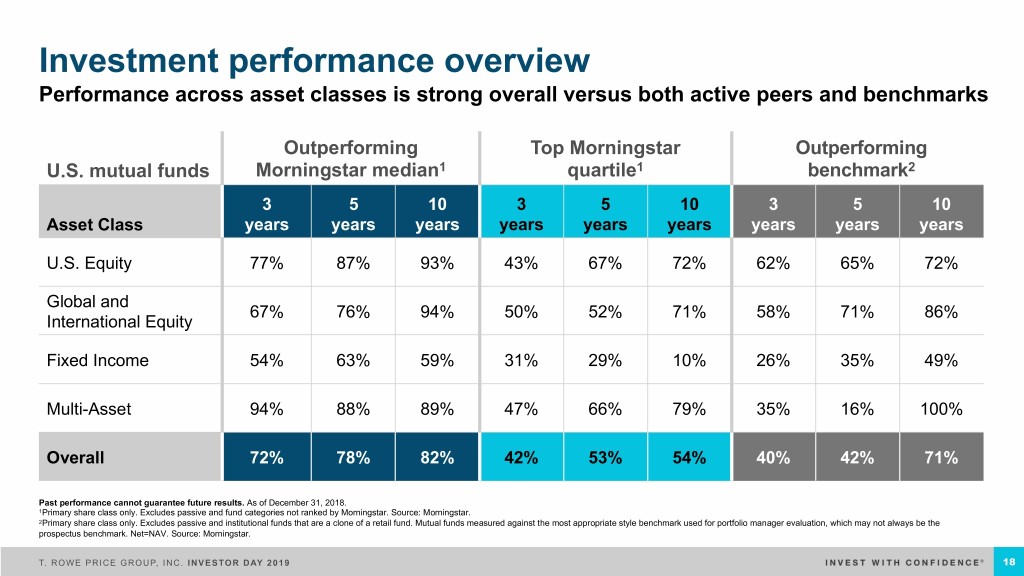
Investment performance overview Performance across asset classes is strong overall versus both active peers and benchmarks Outperforming Top Morningstar Outperforming U.S. mutual funds Morningstar median1 quartile1 benchmark2 3 5 10 3 5 10 3 5 10 Asset Class years years years years years years years years years U.S. Equity 77% 87% 93% 43% 67% 72% 62% 65% 72% Global and 67% 76% 94% 50% 52% 71% 58% 71% 86% International Equity Fixed Income 54% 63% 59% 31% 29% 10% 26% 35% 49% Multi-Asset 94% 88% 89% 47% 66% 79% 35% 16% 100% Overall 72% 78% 82% 42% 53% 54% 40% 42% 71% Past performance cannot guarantee future results. As of December 31, 2018. 1Primary share class only. Excludes passive and fund categories not ranked by Morningstar. Source: Morningstar. 2Primary share class only. Excludes passive and institutional funds that are a clone of a retail fund. Mutual funds measured against the most appropriate style benchmark used for portfolio manager evaluation, which may not always be the prospectus benchmark. Net=NAV. Source: Morningstar. T. ROWE PRICE GROUP, INC. INVESTOR DAY 2019 18
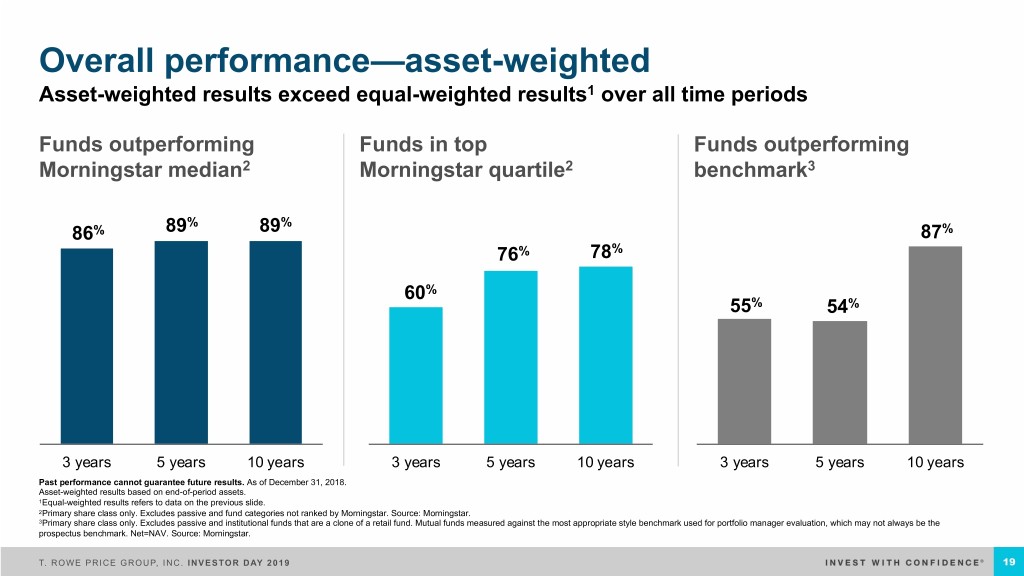
Overall performance—asset-weighted Asset-weighted results exceed equal-weighted results1 over all time periods Funds outperforming Funds in top Funds outperforming Morningstar median2 Morningstar quartile2 benchmark3 % % 86% 89 89 87% 76% 78% 60% 55% 54% 3 years 5 years 10 years 3 years 5 years 10 years 3 years 5 years 10 years Past performance cannot guarantee future results. As of December 31, 2018. Asset-weighted results based on end-of-period assets. 1Equal-weighted results refers to data on the previous slide. 2Primary share class only. Excludes passive and fund categories not ranked by Morningstar. Source: Morningstar. 3Primary share class only. Excludes passive and institutional funds that are a clone of a retail fund. Mutual funds measured against the most appropriate style benchmark used for portfolio manager evaluation, which may not always be the prospectus benchmark. Net=NAV. Source: Morningstar. T. ROWE PRICE GROUP, INC. INVESTOR DAY 2019 19
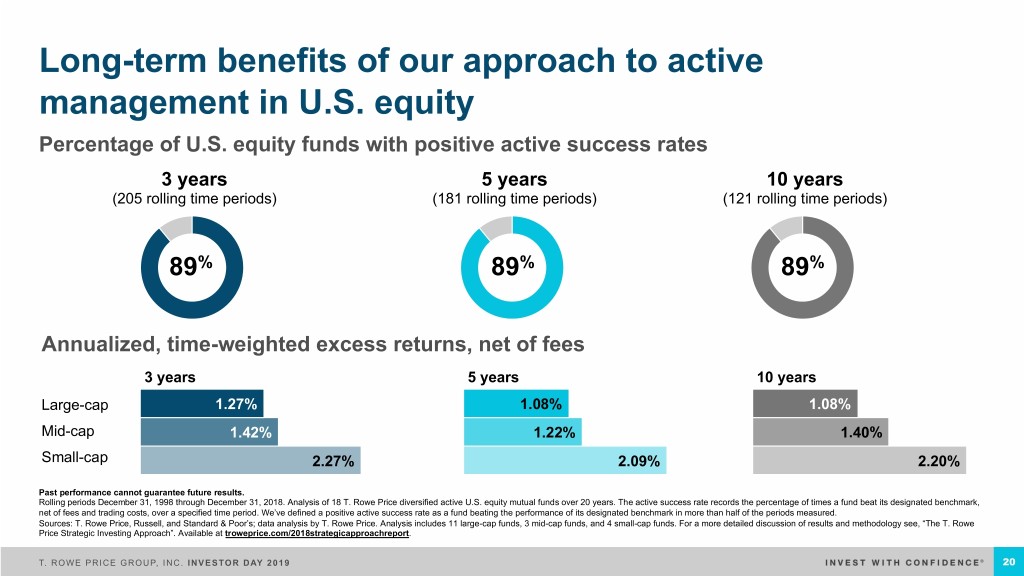
Long-term benefits of our approach to active management in U.S. equity Percentage of U.S. equity funds with positive active success rates 3 years 5 years 10 years (205 rolling time periods) (181 rolling time periods) (121 rolling time periods) 89% 89% 89% Annualized, time-weighted excess returns, net of fees 3 years 5 years 10 years Large-cap 1.27% 1.08% 1.08% Mid-cap 1.42% 1.22% 1.40% Small-cap 2.27% 2.09% 2.20% Past performance cannot guarantee future results. Rolling periods December 31, 1998 through December 31, 2018. Analysis of 18 T. Rowe Price diversified active U.S. equity mutual funds over 20 years. The active success rate records the percentage of times a fund beat its designated benchmark, net of fees and trading costs, over a specified time period. We’ve defined a positive active success rate as a fund beating the performance of its designated benchmark in more than half of the periods measured. Sources: T. Rowe Price, Russell, and Standard & Poor’s; data analysis by T. Rowe Price. Analysis includes 11 large-cap funds, 3 mid-cap funds, and 4 small-cap funds. For a more detailed discussion of results and methodology see, “The T. Rowe Price Strategic Investing Approach”. Available at troweprice.com/2018strategicapproachreport. T. ROWE PRICE GROUP, INC. INVESTOR DAY 2019 20
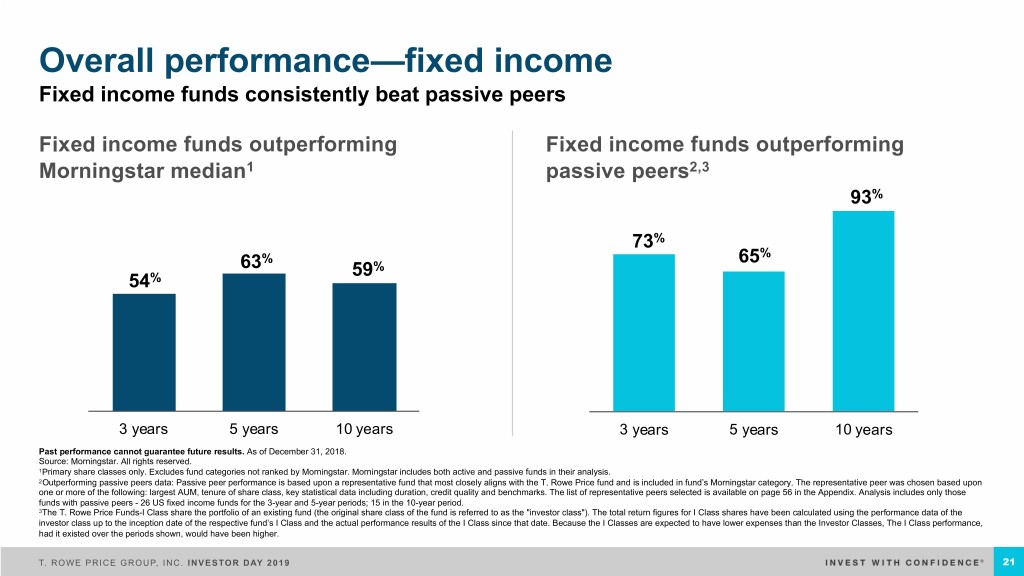
Overall performance—fixed income Fixed income funds consistently beat passive peers Fixed income funds outperforming Fixed income funds outperforming Morningstar median1 passive peers2,3 93% 73% % 65% 63 59% 54% 3 years 5 years 10 years 3 years 5 years 10 years Past performance cannot guarantee future results. As of December 31, 2018. Source: Morningstar. All rights reserved. 1Primary share classes only. Excludes fund categories not ranked by Morningstar. Morningstar includes both active and passive funds in their analysis. 2Outperforming passive peers data: Passive peer performance is based upon a representative fund that most closely aligns with the T. Rowe Price fund and is included in fund’s Morningstar category. The representative peer was chosen based upon one or more of the following: largest AUM, tenure of share class, key statistical data including duration, credit quality and benchmarks. The list of representative peers selected is available on page 56 in the Appendix. Analysis includes only those funds with passive peers - 26 US fixed income funds for the 3-year and 5-year periods; 15 in the 10-year period. 3The T. Rowe Price Funds-I Class share the portfolio of an existing fund (the original share class of the fund is referred to as the "investor class"). The total return figures for I Class shares have been calculated using the performance data of the investor class up to the inception date of the respective fund’s I Class and the actual performance results of the I Class since that date. Because the I Classes are expected to have lower expenses than the Investor Classes, The I Class performance, had it existed over the periods shown, would have been higher. T. ROWE PRICE GROUP, INC. INVESTOR DAY 2019 21
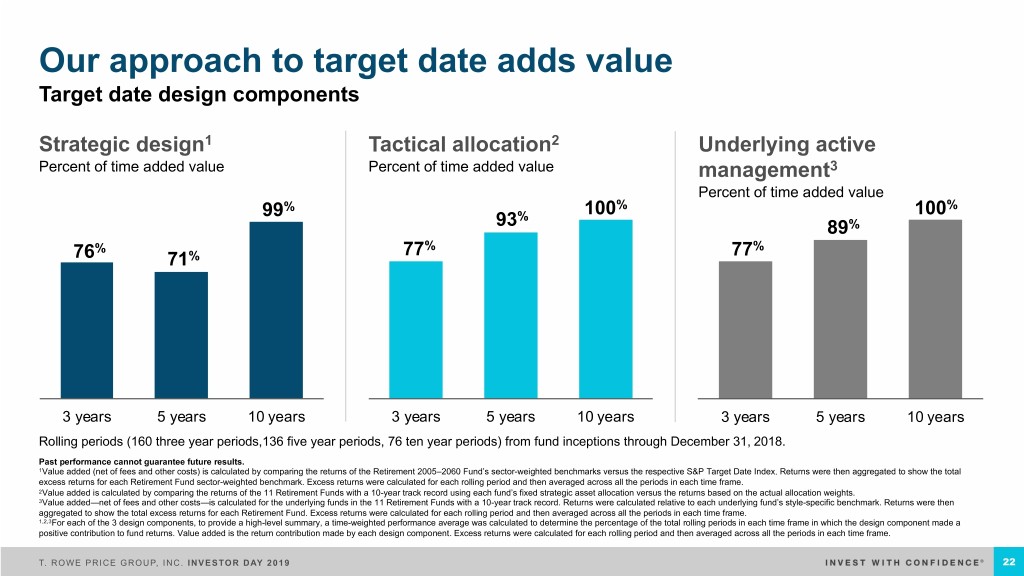
Our approach to target date adds value Target date design components Strategic design1 Tactical allocation2 Underlying active Percent of time added value Percent of time added value management3 Percent of time added value % % % 99 % 100 100 93 89% % 77% 77% 76 71% 3 years 5 years 10 years 3 years 5 years 10 years 3 years 5 years 10 years Rolling periods (160 three year periods,136 five year periods, 76 ten year periods) from fund inceptions through December 31, 2018. Past performance cannot guarantee future results. 1Value added (net of fees and other costs) is calculated by comparing the returns of the Retirement 2005–2060 Fund’s sector-weighted benchmarks versus the respective S&P Target Date Index. Returns were then aggregated to show the total excess returns for each Retirement Fund sector-weighted benchmark. Excess returns were calculated for each rolling period and then averaged across all the periods in each time frame. 2Value added is calculated by comparing the returns of the 11 Retirement Funds with a 10-year track record using each fund’s fixed strategic asset allocation versus the returns based on the actual allocation weights. 3Value added—net of fees and other costs—is calculated for the underlying funds in the 11 Retirement Funds with a 10-year track record. Returns were calculated relative to each underlying fund’s style-specific benchmark. Returns were then aggregated to show the total excess returns for each Retirement Fund. Excess returns were calculated for each rolling period and then averaged across all the periods in each time frame. 1,2,3For each of the 3 design components, to provide a high-level summary, a time-weighted performance average was calculated to determine the percentage of the total rolling periods in each time frame in which the design component made a positive contribution to fund returns. Value added is the return contribution made by each design component. Excess returns were calculated for each rolling period and then averaged across all the periods in each time frame. T. ROWE PRICE GROUP, INC. INVESTOR DAY 2019 22
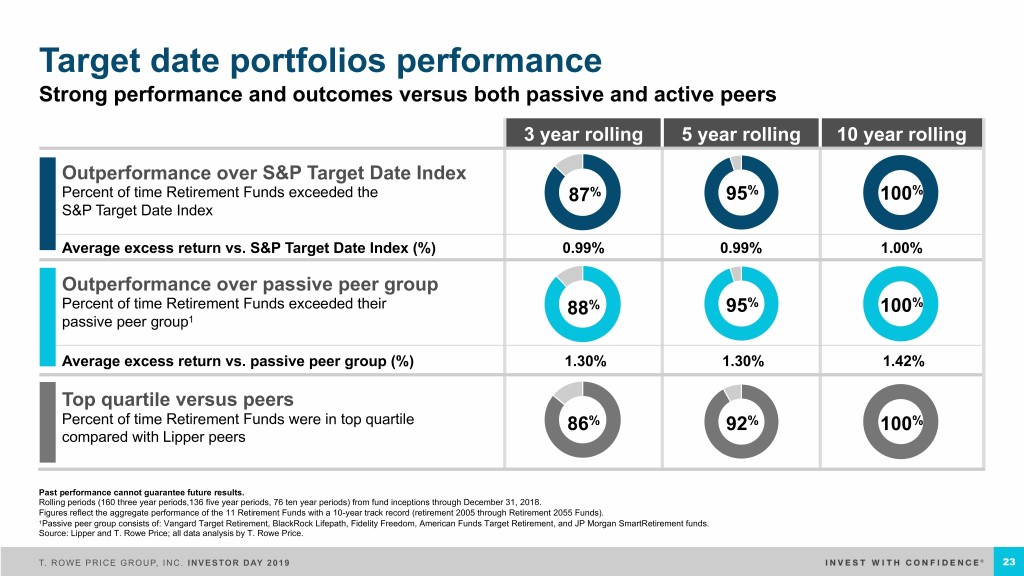
Target date portfolios performance Strong performance and outcomes versus both passive and active peers 3 year rolling 5 year rolling 10 year rolling Outperformance over S&P Target Date Index Percent of time Retirement Funds exceeded the 87% 95% 100% S&P Target Date Index Average excess return vs. S&P Target Date Index (%) 0.99% 0.99% 1.00% Outperformance over passive peer group Percent of time Retirement Funds exceeded their 88% 95% 100% passive peer group1 Average excess return vs. passive peer group (%) 1.30% 1.30% 1.42% Top quartile versus peers Percent of time Retirement Funds were in top quartile 86% 92% 100% compared with Lipper peers Past performance cannot guarantee future results. Rolling periods (160 three year periods,136 five year periods, 76 ten year periods) from fund inceptions through December 31, 2018. Figures reflect the aggregate performance of the 11 Retirement Funds with a 10-year track record (retirement 2005 through Retirement 2055 Funds). 1Passive peer group consists of: Vangard Target Retirement, BlackRock Lifepath, Fidelity Freedom, American Funds Target Retirement, and JP Morgan SmartRetirement funds. Source: Lipper and T. Rowe Price; all data analysis by T. Rowe Price. T. ROWE PRICE GROUP, INC. INVESTOR DAY 2019 23
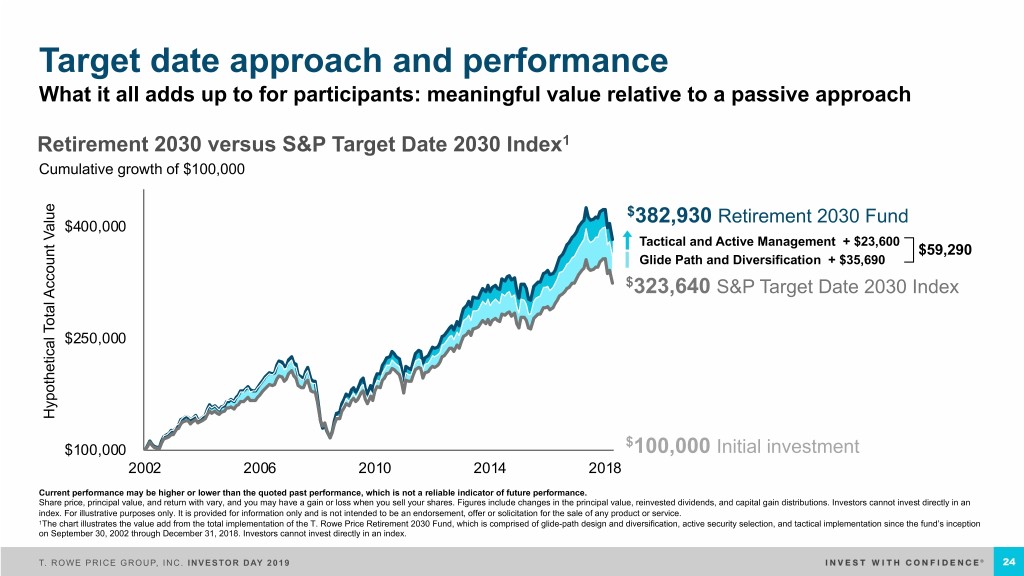
Target date approach and performance What it all adds up to for participants: meaningful value relative to a passive approach Retirement 2030 versus S&P Target Date 2030 Index1 Cumulative growth of $100,000 $382,930 Retirement 2030 Fund $400,000 Tactical and Active Management + $23,600 $59,290 Glide Path and Diversification + $35,690 $323,640 S&P Target Date 2030 Index $250,000 Hypothetical Total Account Value Account Total Hypothetical $ $100,000 100,000 Initial investment 2002 2006 2010 2014 2018 Current performance may be higher or lower than the quoted past performance, which is not a reliable indicator of future performance. Share price, principal value, and return with vary, and you may have a gain or loss when you sell your shares. Figures include changes in the principal value, reinvested dividends, and capital gain distributions. Investors cannot invest directly in an index. For illustrative purposes only. It is provided for information only and is not intended to be an endorsement, offer or solicitation for the sale of any product or service. 1The chart illustrates the value add from the total implementation of the T. Rowe Price Retirement 2030 Fund, which is comprised of glide-path design and diversification, active security selection, and tactical implementation since the fund’s inception on September 30, 2002 through December 31, 2018. Investors cannot invest directly in an index. T. ROWE PRICE GROUP, INC. INVESTOR DAY 2019 24

Multiyear investment to grow our investment capabilities globally Investment professional headcount 123 7 2003–2018 607 London/EMEA 421 Tokyo 65 Multi-Asset 41 Baltimore/U.S. Hong Kong 430 Global 197 6 19 Fixed Income 347 Singapore 14 151 9 217 107 140 Int’l Equity 105 Sydney 83 82 40 205 U.S. Equity 144 155 Investment professionals 94 607 worldwide 2003 2008 2013 2018 T. ROWE PRICE GROUP, INC. INVESTOR DAY 2019 25

Meeting client demand across the globe Primary investment strategy count1 growth over time 126 114 106 18 Multi-Asset 15 91 15 12 Global 48 Fixed Income 44 38 32 30 Int’l Equity 25 27 20 27 28 28 30 U.S. Equity 2008 2013 2015 2018 1Strategy count does not include institutional separate account and subadvisor products, multi-sector account portfolios, internal portfolios, internal reserves, and single client and charitable giving funds. Retirement/target date products count as one product suite. T. ROWE PRICE GROUP, INC. INVESTOR DAY 2019 26
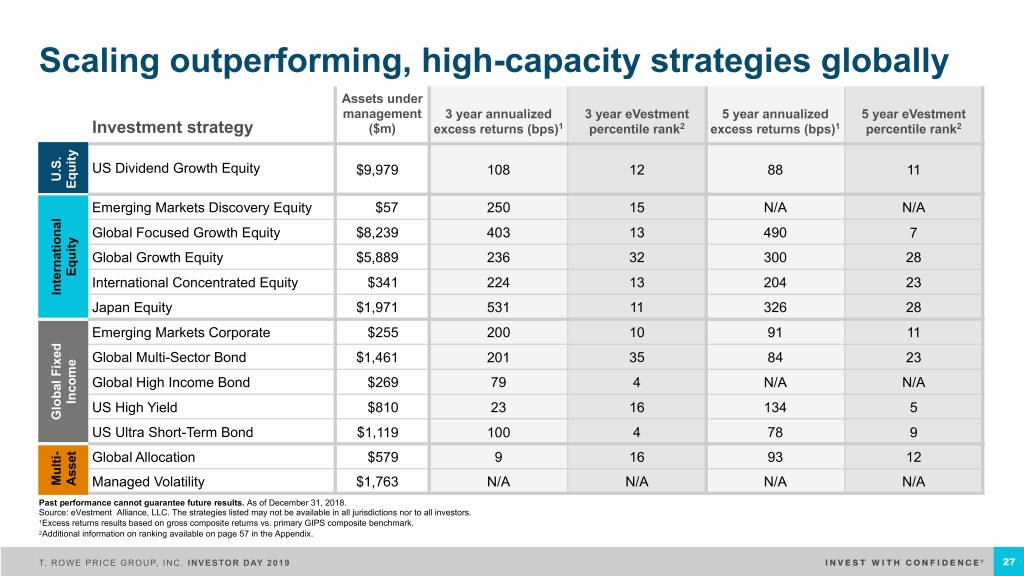
Scaling outperforming, high-capacity strategies globally Assets under management 3 year annualized 3 year eVestment 5 year annualized 5 year eVestment Investment strategy ($m) excess returns (bps)1 percentile rank2 excess returns (bps)1 percentile rank2 US Dividend Growth Equity $9,979 108 12 88 11 U.S. Equity Emerging Markets Discovery Equity $57 250 15 N/A N/A Global Focused Growth Equity $8,239 403 13 490 7 Global Growth Equity $5,889 236 32 300 28 Equity International Concentrated Equity $341 224 13 204 23 International International Japan Equity $1,971 531 11 326 28 Emerging Markets Corporate $255 200 10 91 11 Global Multi-Sector Bond $1,461 201 35 84 23 Global High Income Bond $269 79 4 N/A N/A Income US High Yield $810 23 16 134 5 Global Fixed Global US Ultra Short-Term Bond $1,119 100 4 78 9 - Global Allocation $579 9 16 93 12 Multi Asset Managed Volatility $1,763 N/A N/A N/A N/A Past performance cannot guarantee future results. As of December 31, 2018. Source: eVestment Alliance, LLC. The strategies listed may not be available in all jurisdictions nor to all investors. 1Excess returns results based on gross composite returns vs. primary GIPS composite benchmark. 2Additional information on ranking available on page 57 in the Appendix. T. ROWE PRICE GROUP, INC. INVESTOR DAY 2019 27
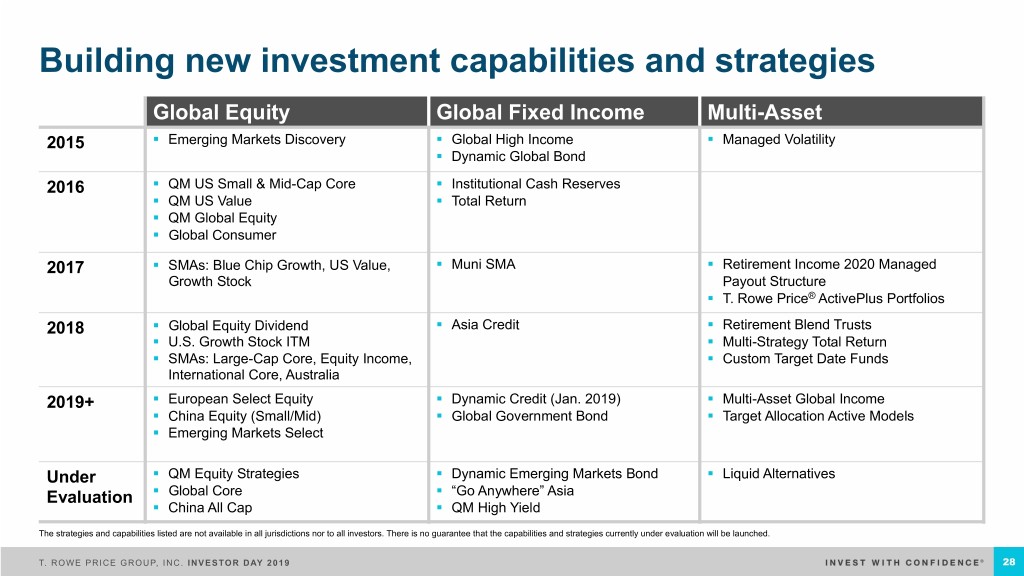
Building new investment capabilities and strategies Global Equity Global Fixed Income Multi-Asset 2015 § Emerging Markets Discovery § Global High Income § Managed Volatility § Dynamic Global Bond 2016 § QM US Small & Mid-Cap Core § Institutional Cash Reserves § QM US Value § Total Return § QM Global Equity § Global Consumer 2017 § SMAs: Blue Chip Growth, US Value, § Muni SMA § Retirement Income 2020 Managed Growth Stock Payout Structure § T. Rowe Price® ActivePlus Portfolios 2018 § Global Equity Dividend § Asia Credit § Retirement Blend Trusts § U.S. Growth Stock ITM § Multi-Strategy Total Return § SMAs: Large-Cap Core, Equity Income, § Custom Target Date Funds International Core, Australia 2019+ § European Select Equity § Dynamic Credit (Jan. 2019) § Multi-Asset Global Income § China Equity (Small/Mid) § Global Government Bond § Target Allocation Active Models § Emerging Markets Select Under § QM Equity Strategies § Dynamic Emerging Markets Bond § Liquid Alternatives Evaluation § Global Core § “Go Anywhere” Asia § China All Cap § QM High Yield The strategies and capabilities listed are not available in all jurisdictions nor to all investors. There is no guarantee that the capabilities and strategies currently under evaluation will be launched. T. ROWE PRICE GROUP, INC. INVESTOR DAY 2019 28

Meeting evolving client needs with solutions Multi-Asset Solutions Environmental, Social Equity Data Insights and Governance (ESG) § Global team with in-market § Improving our investment experience § Focus on ESG integration outcomes through data-driven across portfolios insights § Leveraging dedicated quantitative team and § Proprietary, systematic, and § Quantitative research team proprietary tools proactive process for dedicated to our fundamental evaluating ESG factors equity effort § Engaging clients and prospects on solutions utilizing a range of § ESG is a value-add in our § Specializing in "big data" and T. Rowe Price equity, fixed investors’ tool kit “machine learning” to provide income, and multi-asset actionable investment ideas capabilities T. ROWE PRICE GROUP, INC. INVESTOR DAY 2019 29
Summary Evolving Investment capabilities Culture excellence T. ROWE PRICE GROUP, INC. INVESTOR DAY 2019 30
Global Intermediary and Institutional Distribution Robert Higginbotham HEAD OF GLOBAL INVESTMENT MANAGEMENT SERVICES T. ROWE PRICE GROUP, INC. INVESTOR DAY 2019
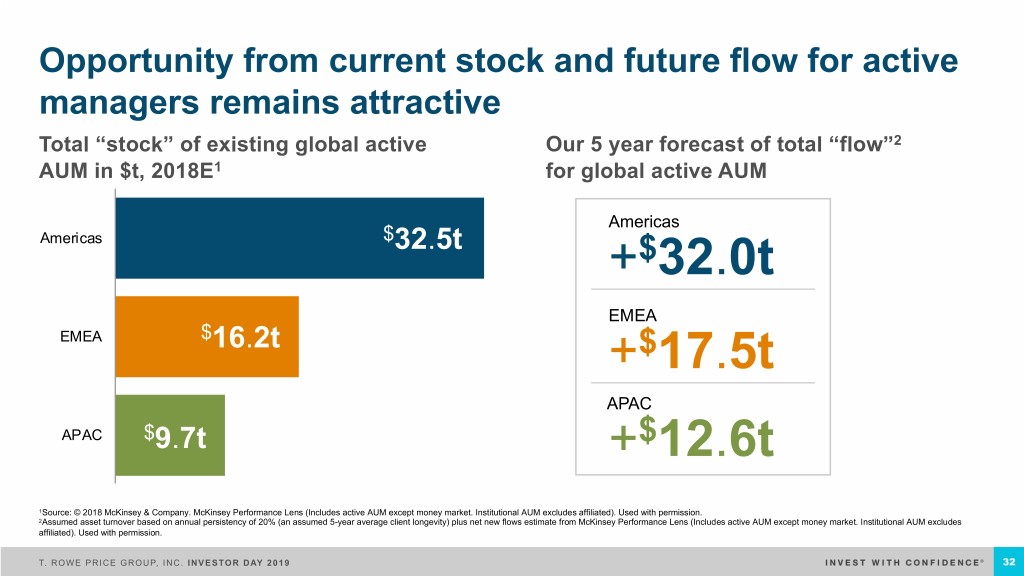
Opportunity from current stock and future flow for active managers remains attractive Total “stock” of existing global active Our 5 year forecast of total “flow”2 AUM in $t, 2018E1 for global active AUM Americas Americas $32.5t +$32.0t EMEA EMEA $16.2t +$17.5t APAC APAC $9.7t +$12.6t 1Source: © 2018 McKinsey & Company. McKinsey Performance Lens (Includes active AUM except money market. Institutional AUM excludes affiliated). Used with permission. 2Assumed asset turnover based on annual persistency of 20% (an assumed 5-year average client longevity) plus net new flows estimate from McKinsey Performance Lens (Includes active AUM except money market. Institutional AUM excludes affiliated). Used with permission. T. ROWE PRICE GROUP, INC. INVESTOR DAY 2019 32
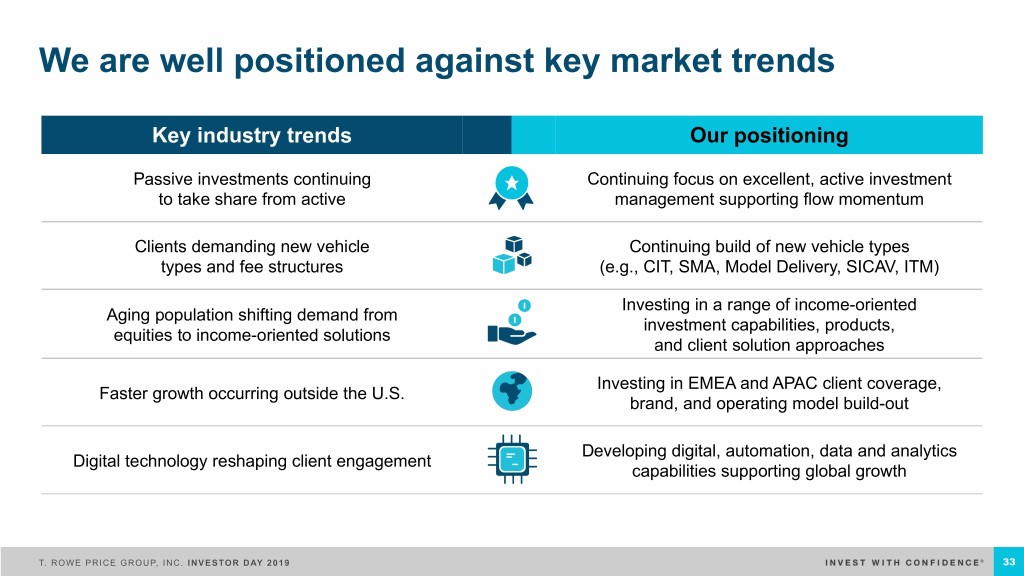
We are well positioned against key market trends Key industry trends Our positioning Passive investments continuing Continuing focus on excellent, active investment to take share from active management supporting flow momentum Clients demanding new vehicle Continuing build of new vehicle types types and fee structures (e.g., CIT, SMA, Model Delivery, SICAV, ITM) Investing in a range of income-oriented Aging population shifting demand from investment capabilities, products, equities to income-oriented solutions and client solution approaches Investing in EMEA and APAC client coverage, Faster growth occurring outside the U.S. brand, and operating model build-out Developing digital, automation, data and analytics Digital technology reshaping client engagement capabilities supporting global growth T. ROWE PRICE GROUP, INC. INVESTOR DAY 2019 33
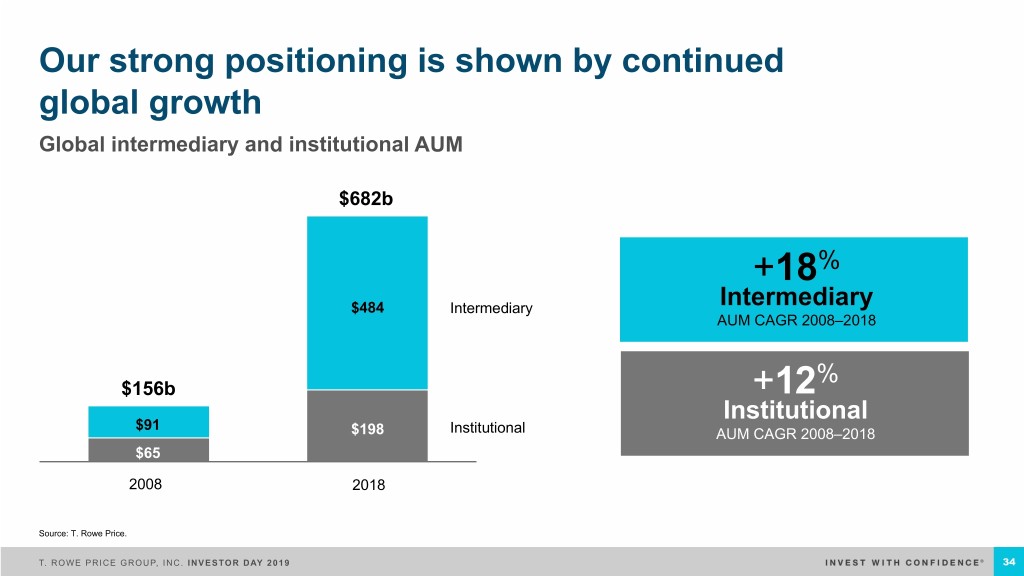
Our strong positioning is shown by continued global growth Global intermediary and institutional AUM $682b +18% $484 Intermediary Intermediary AUM CAGR 2008–2018 % $156b +12 Institutional $91 $198 Institutional AUM CAGR 2008–2018 $65 20082008 20172018 Source: T. Rowe Price. T. ROWE PRICE GROUP, INC. INVESTOR DAY 2019 34
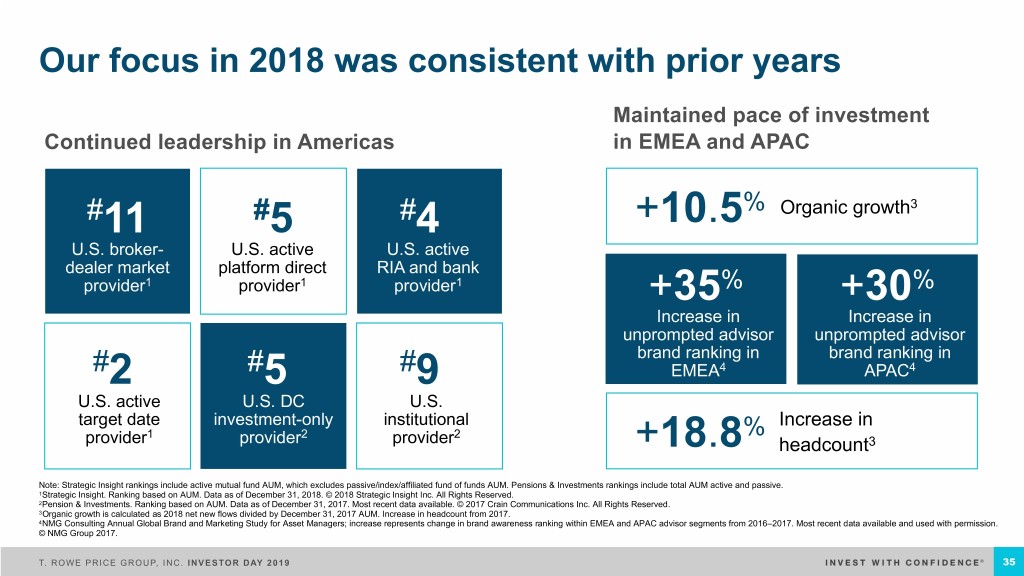
Our focus in 2018 was consistent with prior years Maintained pace of investment Continued leadership in Americas in EMEA and APAC #11 #5 #4 +10.5% Organic growth3 U.S. broker- U.S. active U.S. active dealer market platform direct RIA and bank provider1 provider1 provider1 +35% +30% Increase in Increase in unprompted advisor unprompted advisor brand ranking in brand ranking in # # # 4 4 2 5 9 EMEA APAC U.S. active U.S. DC U.S. target date investment-only institutional Increase in 1 2 2 % provider provider provider +18.8 headcount3 Note: Strategic Insight rankings include active mutual fund AUM, which excludes passive/index/affiliated fund of funds AUM. Pensions & Investments rankings include total AUM active and passive. 1Strategic Insight. Ranking based on AUM. Data as of December 31, 2018. © 2018 Strategic Insight Inc. All Rights Reserved. 2Pension & Investments. Ranking based on AUM. Data as of December 31, 2017. Most recent data available. © 2017 Crain Communications Inc. All Rights Reserved. 3Organic growth is calculated as 2018 net new flows divided by December 31, 2017 AUM. Increase in headcount from 2017. 4NMG Consulting Annual Global Brand and Marketing Study for Asset Managers; increase represents change in brand awareness ranking within EMEA and APAC advisor segments from 2016–2017. Most recent data available and used with permission. © NMG Group 2017. T. ROWE PRICE GROUP, INC. INVESTOR DAY 2019 35

Our 2018 results show continued diversified organic growth Net flows by channel Net flows by client geography Global intermediary and institutional Global intermediary and institutional 55% Intermediary 52% 58% Americas 72% 18% 10% EMEA 45% Institutional 28% 30% 32% APAC 2017 2018 2017 2018 Source: T. Rowe Price. T. ROWE PRICE GROUP, INC. INVESTOR DAY 2019 36
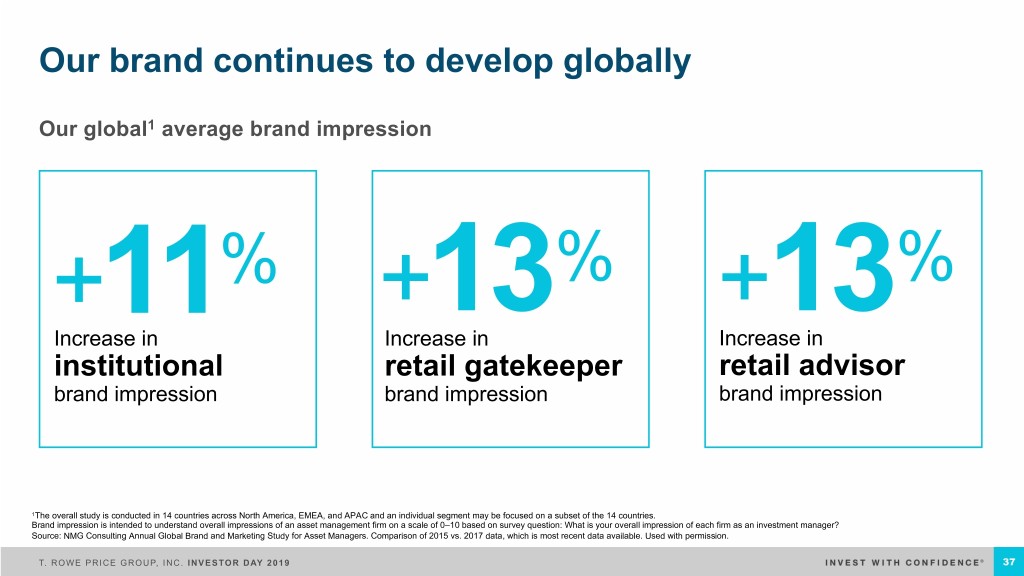
Our brand continues to develop globally Our global1 average brand impression +11% +13% +13% Increase in Increase in Increase in institutional retail gatekeeper retail advisor brand impression brand impression brand impression 1The overall study is conducted in 14 countries across North America, EMEA, and APAC and an individual segment may be focused on a subset of the 14 countries. Brand impression is intended to understand overall impressions of an asset management firm on a scale of 0–10 based on survey question: What is your overall impression of each firm as an investment manager? Source: NMG Consulting Annual Global Brand and Marketing Study for Asset Managers. Comparison of 2015 vs. 2017 data, which is most recent data available. Used with permission. T. ROWE PRICE GROUP, INC. INVESTOR DAY 2019 37
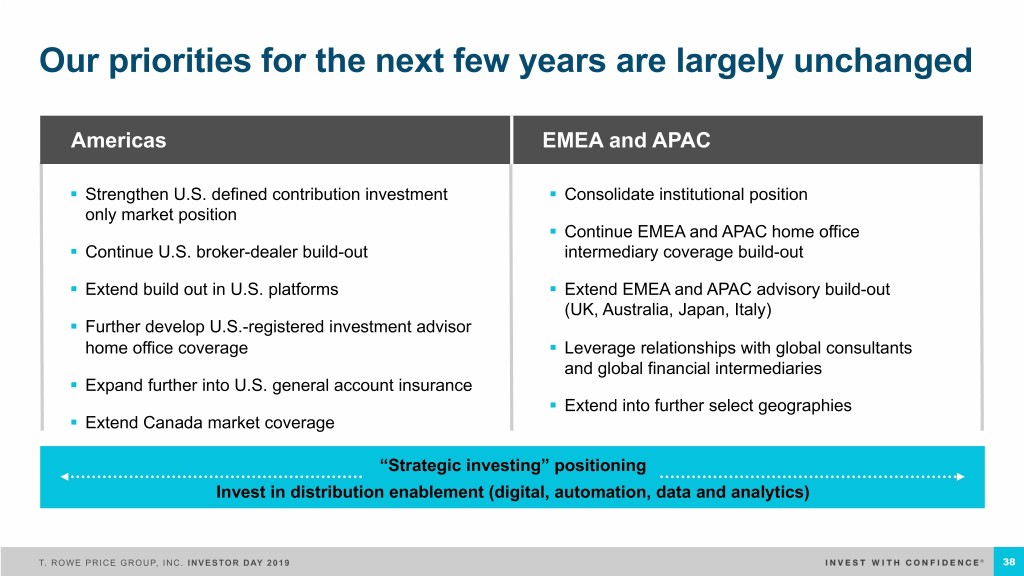
Our priorities for the next few years are largely unchanged Americas EMEA and APAC § Strengthen U.S. defined contribution investment § Consolidate institutional position only market position § Continue EMEA and APAC home office § Continue U.S. broker-dealer build-out intermediary coverage build-out § Extend build out in U.S. platforms § Extend EMEA and APAC advisory build-out (UK, Australia, Japan, Italy) § Further develop U.S.-registered investment advisor home office coverage § Leverage relationships with global consultants and global financial intermediaries § Expand further into U.S. general account insurance § Extend into further select geographies § Extend Canada market coverage “Strategic investing” positioning Invest in distribution enablement (digital, automation, data and analytics) T. ROWE PRICE GROUP, INC. INVESTOR DAY 2019 38
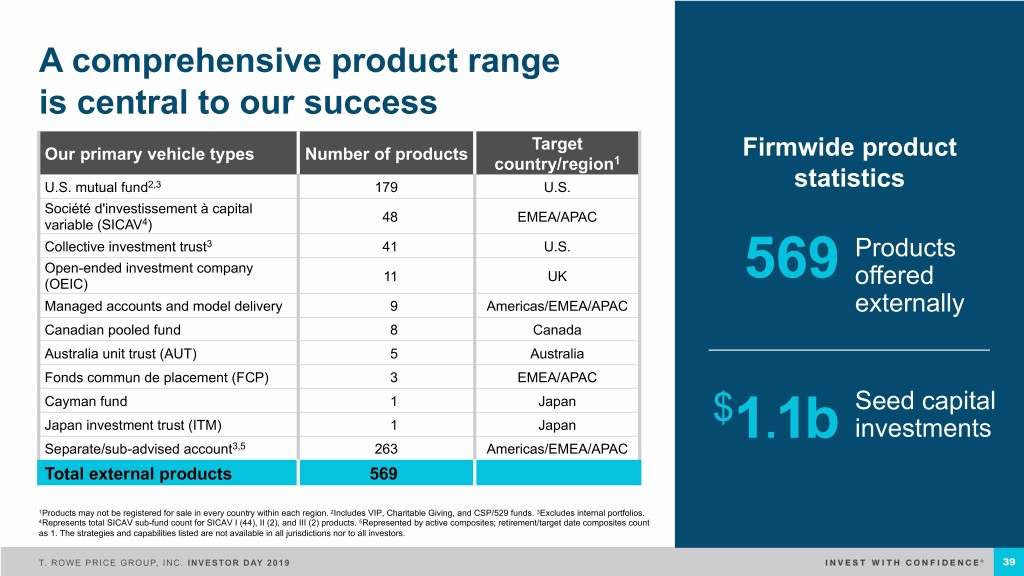
A comprehensive product range is central to our success Target Our primary vehicle types Number of products Firmwide product country/region1 U.S. mutual fund2,3 179 U.S. statistics Société d'investissement à capital 48 EMEA/APAC variable (SICAV4) Collective investment trust3 41 U.S. Products Open-ended investment company 11 UK 569 offered (OEIC) Managed accounts and model delivery 9 Americas/EMEA/APAC externally Canadian pooled fund 8 Canada Australia unit trust (AUT) 5 Australia Fonds commun de placement (FCP) 3 EMEA/APAC Cayman fund 1 Japan $ Seed capital Japan investment trust (ITM) 1 Japan 1.1b investments Separate/sub-advised account3,5 263 Americas/EMEA/APAC Total external products 569 1Products may not be registered for sale in every country within each region. 2Includes VIP, Charitable Giving, and CSP/529 funds. 3Excludes internal portfolios. 4Represents total SICAV sub-fund count for SICAV I (44), II (2), and III (2) products. 5Represented by active composites; retirement/target date composites count as 1. The strategies and capabilities listed are not available in all jurisdictions nor to all investors. T. ROWE PRICE GROUP, INC. INVESTOR DAY 2019 39
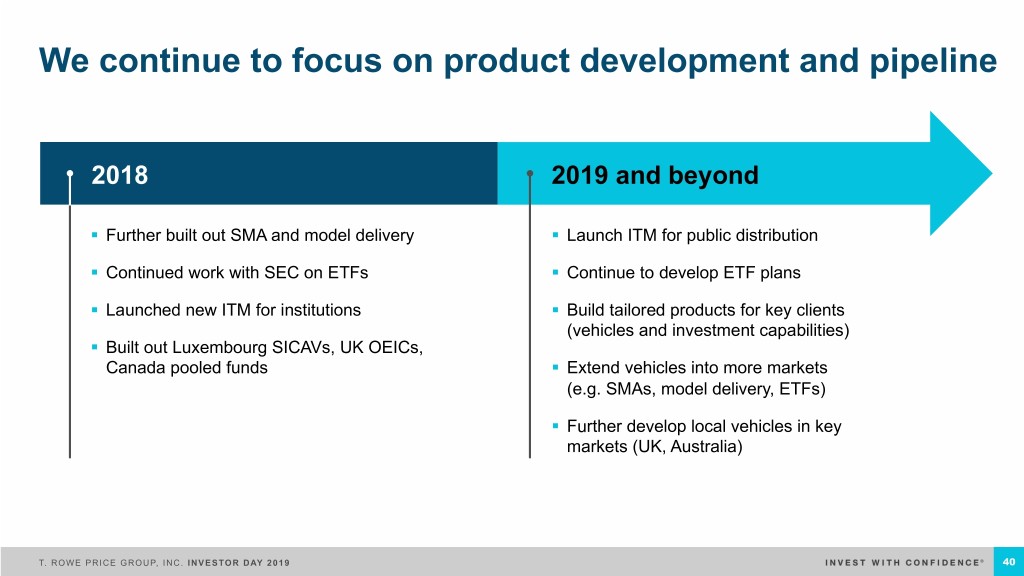
We continue to focus on product development and pipeline 2018 2019 and beyond § Further built out SMA and model delivery § Launch ITM for public distribution § Continued work with SEC on ETFs § Continue to develop ETF plans § Launched new ITM for institutions § Build tailored products for key clients (vehicles and investment capabilities) § Built out Luxembourg SICAVs, UK OEICs, Canada pooled funds § Extend vehicles into more markets (e.g. SMAs, model delivery, ETFs) § Further develop local vehicles in key markets (UK, Australia) T. ROWE PRICE GROUP, INC. INVESTOR DAY 2019 40
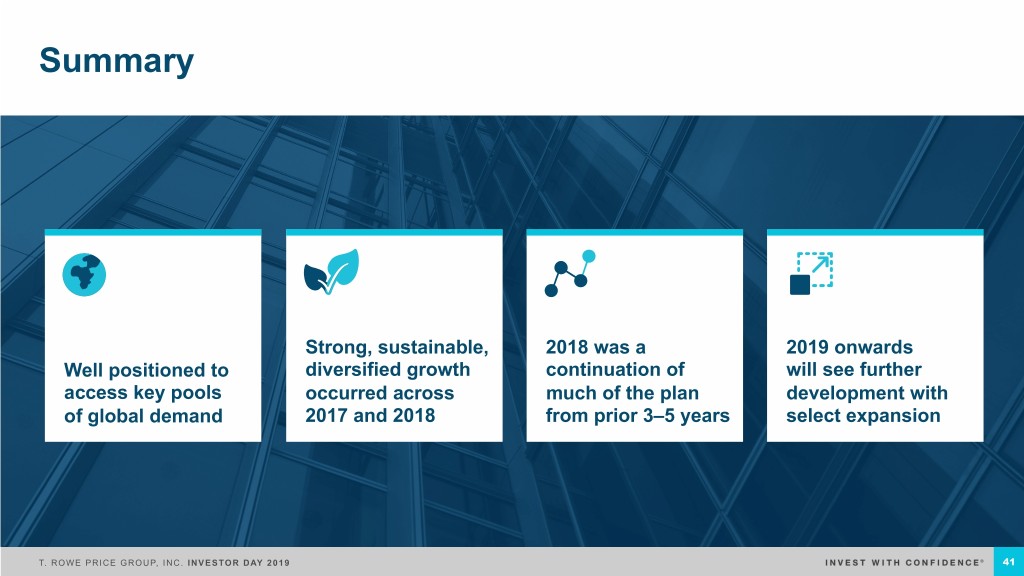
Summary Strong, sustainable, 2018 was a 2019 onwards Well positioned to diversified growth continuation of will see further access key pools occurred across much of the plan development with of global demand 2017 and 2018 from prior 3–5 years select expansion T. ROWE PRICE GROUP, INC. INVESTOR DAY 2019 41

Financial Overview Céline Dufétel CHIEF FINANCIAL OFFICER T. ROWE PRICE GROUP, INC. INVESTOR DAY 2019

Creating value for stockholders over time Organic AUM Growth Operating Margin1 Return of Capital2 1 year 1 year 1 year 1.3% 44.0% 98% 5 year 5 year 5 years (average) (average) (cumulative) 0.7% 44.1% 99% Driving sustainable, Maintaining a strong Consistently returning diversified, organic operating margin while capital to stockholders growth investing for the long term over time 1U.S. GAAP. Data reflect the impact of the new revenue recognition standard implemented in 2018. See the firm’s 2018 Annual Report on Form 10-K for further information. 2Figures represent percent of U.S. GAAP net income attributable to T. Rowe Price Group returned to stockholders. T. ROWE PRICE GROUP, INC. INVESTOR DAY 2019 43
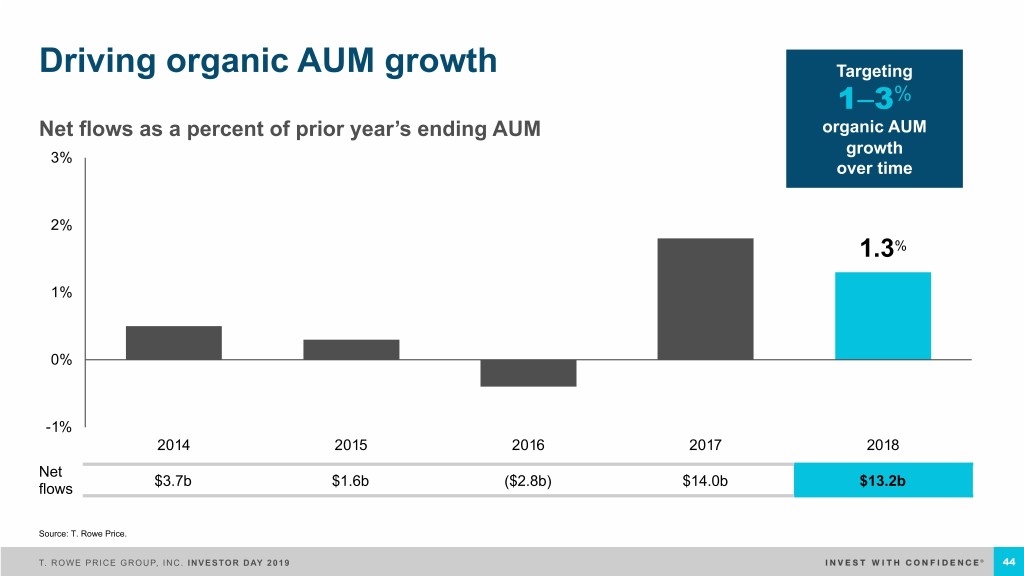
Driving organic AUM growth Targeting 1–3% Net flows as a percent of prior year’s ending AUM organic AUM growth 3% over time 2% 1.3% 1% 0% -1% 2014 2015 2016 2017 2018 Net $3.7b $1.6b ($2.8b) $14.0b $13.2b flows Source: T. Rowe Price. T. ROWE PRICE GROUP, INC. INVESTOR DAY 2019 44

Developing diversified and sustainable sources of flows Scaling strategies across asset classes Launching successful products Products launched in the last 5 years +12 Multi- 111 Fixed Asset Equity +6 +5 Income U.S. mutual $ 88 funds with 13b AUM>$500m1 U.S. mutual in 2018 net inflows funds with AUM>$500m1 3% of AUM as of December 31, 2018 2013 + 232 over 5 years 2018 Source: T. Rowe Price. 1Includes Variable Insurance Portfolios, fund of funds. Excludes College Savings Portfolios. Fund of fund AUM is also counted for component funds. 2Is net of one money market fund that descaled and includes 10 funds from the RDF I series. T. ROWE PRICE GROUP, INC. INVESTOR DAY 2019 45
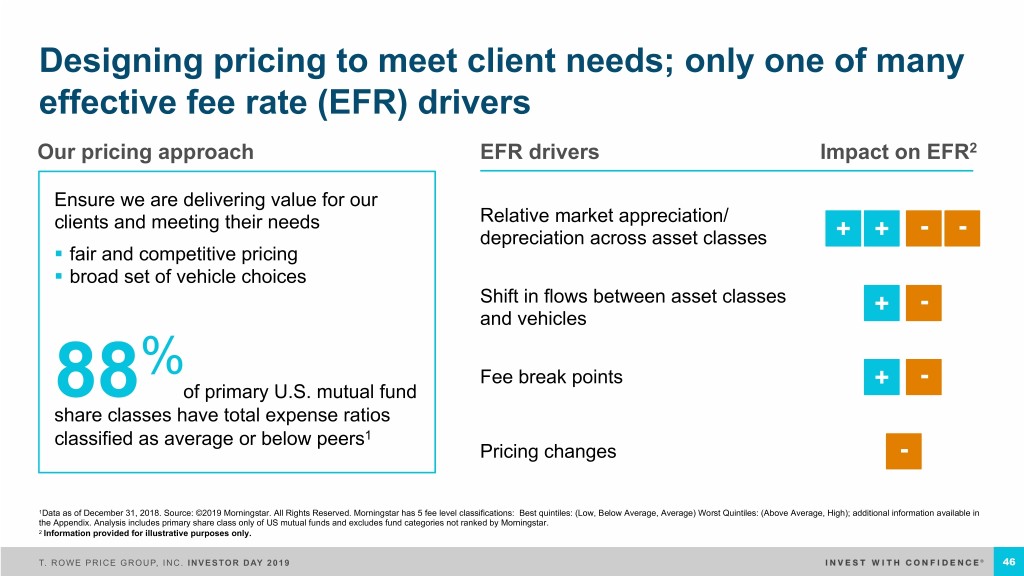
Designing pricing to meet client needs; only one of many effective fee rate (EFR) drivers Our pricing approach EFR drivers Impact on EFR2 Ensure we are delivering value for our clients and meeting their needs Relative market appreciation/ depreciation across asset classes + + - - § fair and competitive pricing § broad set of vehicle choices Shift in flows between asset classes + - and vehicles % Fee break points + - 88 of primary U.S. mutual fund share classes have total expense ratios classified as average or below peers1 Pricing changes - 1Data as of December 31, 2018. Source: ©2019 Morningstar. All Rights Reserved. Morningstar has 5 fee level classifications: Best quintiles: (Low, Below Average, Average) Worst Quintiles: (Above Average, High); additional information available in the Appendix. Analysis includes primary share class only of US mutual funds and excludes fund categories not ranked by Morningstar. 2 Information provided for illustrative purposes only. T. ROWE PRICE GROUP, INC. INVESTOR DAY 2019 46
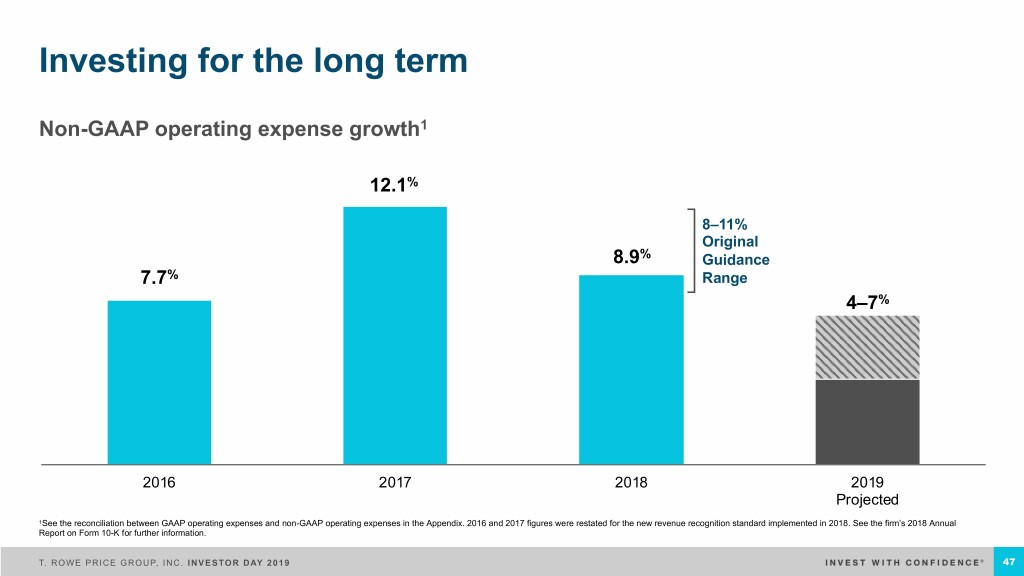
Investing for the long term Non-GAAP operating expense growth1 12.1% 8–11% Original 8.9% Guidance 7.7% Range 4–7% 2016 2017 2018 2019 Projected 1See the reconciliation between GAAP operating expenses and non-GAAP operating expenses in the Appendix. 2016 and 2017 figures were restated for the new revenue recognition standard implemented in 2018. See the firm’s 2018 Annual Report on Form 10-K for further information. T. ROWE PRICE GROUP, INC. INVESTOR DAY 2019 47
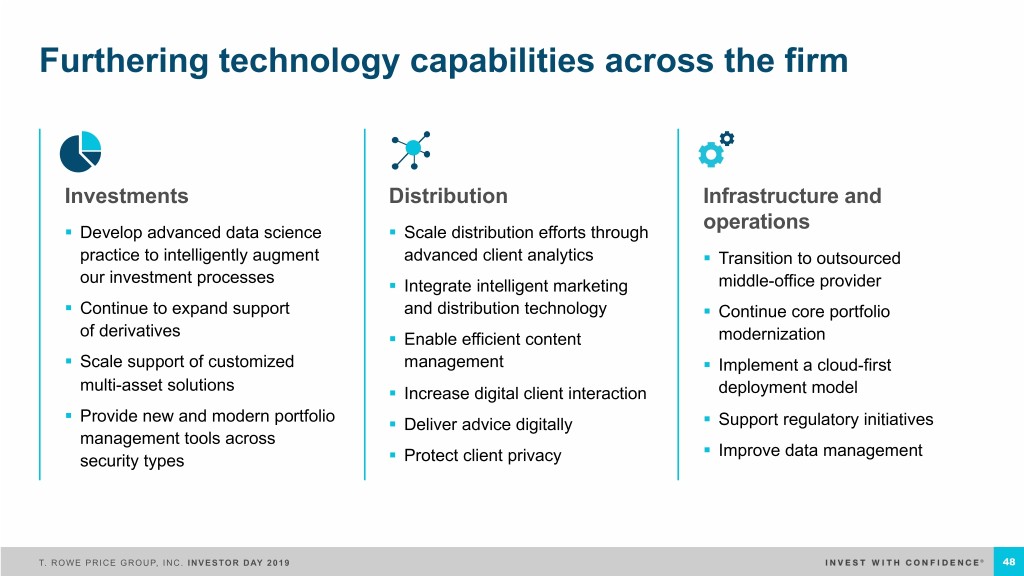
Furthering technology capabilities across the firm Investments Distribution Infrastructure and operations § Develop advanced data science § Scale distribution efforts through practice to intelligently augment advanced client analytics § Transition to outsourced our investment processes § Integrate intelligent marketing middle-office provider § Continue to expand support and distribution technology § Continue core portfolio of derivatives § Enable efficient content modernization § Scale support of customized management § Implement a cloud-first multi-asset solutions § Increase digital client interaction deployment model § Provide new and modern portfolio § Deliver advice digitally § Support regulatory initiatives management tools across § Improve data management security types § Protect client privacy T. ROWE PRICE GROUP, INC. INVESTOR DAY 2019 48
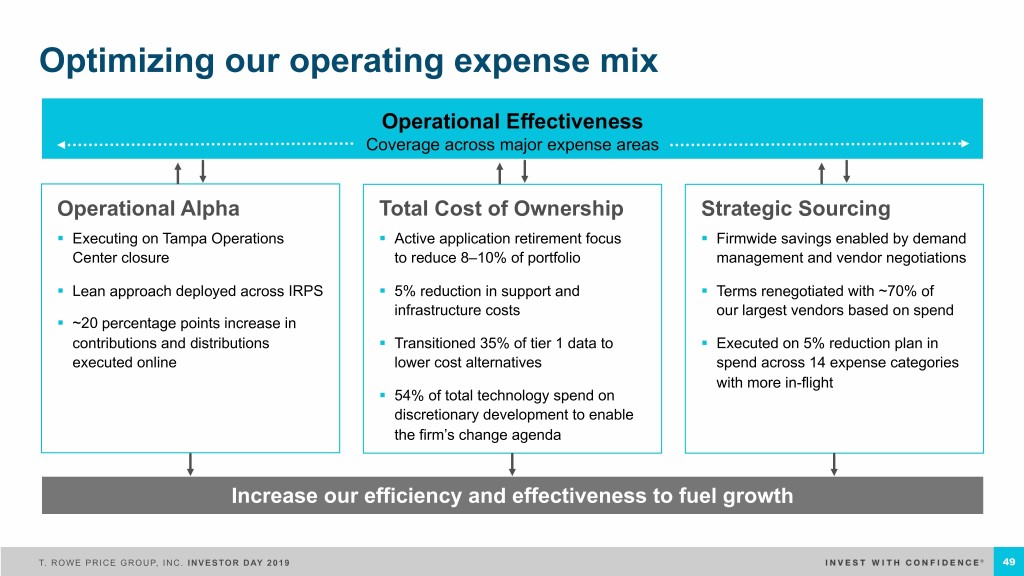
Optimizing our operating expense mix Operational Effectiveness Coverage across major expense areas Operational Alpha Total Cost of Ownership Strategic Sourcing § Executing on Tampa Operations § Active application retirement focus § Firmwide savings enabled by demand Center closure to reduce 8–10% of portfolio management and vendor negotiations § Lean approach deployed across IRPS § 5% reduction in support and § Terms renegotiated with ~70% of infrastructure costs our largest vendors based on spend § ~20 percentage points increase in contributions and distributions § Transitioned 35% of tier 1 data to § Executed on 5% reduction plan in executed online lower cost alternatives spend across 14 expense categories with more in-flight § 54% of total technology spend on discretionary development to enable the firm’s change agenda Increase our efficiency and effectiveness to fuel growth T. ROWE PRICE GROUP, INC. INVESTOR DAY 2019 49

Effectively managing capital Cash and discretionary § Investing for sustainable growth investments Business and diversification Reinvestments $ § Protecting margins over time 3.0b § Continued year-on-year increase since IPO Dividends § Strong payout ratio over time Seed capital investments 1 (41% average over past 5 years) $1.1b Share § Consistent, opportunistic program Repurchases § Long-term goal of offsetting dilution Debt free 1Based on U.S. GAAP. Includes recurring dividends only. T. ROWE PRICE GROUP, INC. INVESTOR DAY 2019 50
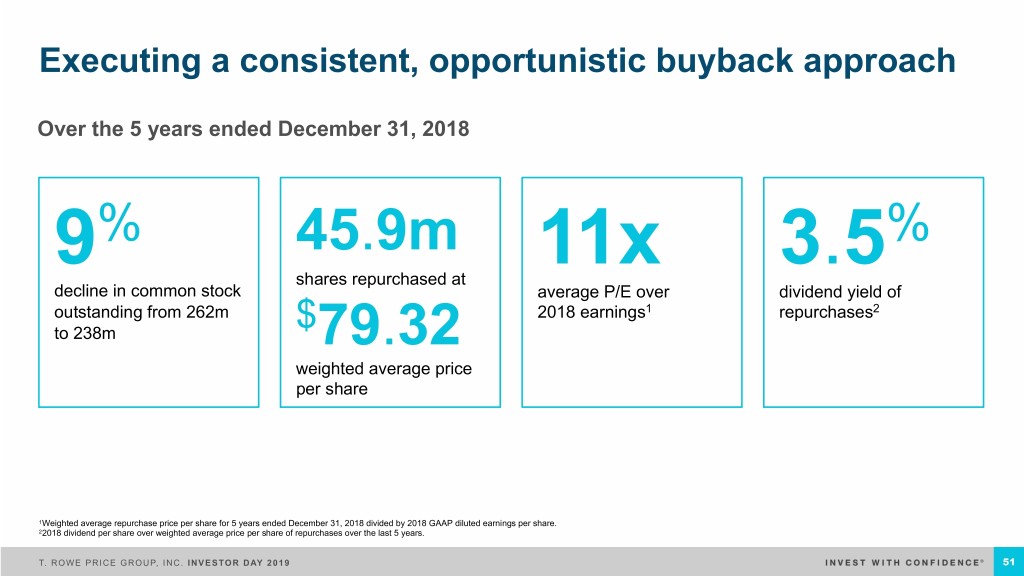
Executing a consistent, opportunistic buyback approach Over the 5 years ended December 31, 2018 9% 45.9m 11x 3.5% shares repurchased at decline in common stock average P/E over dividend yield of outstanding from 262m $ 2018 earnings1 repurchases2 to 238m 79.32 weighted average price per share 1Weighted average repurchase price per share for 5 years ended December 31, 2018 divided by 2018 GAAP diluted earnings per share. 22018 dividend per share over weighted average price per share of repurchases over the last 5 years. T. ROWE PRICE GROUP, INC. INVESTOR DAY 2019 51
Summary Driving sustainable, diversified, organic Maintaining a strong Consistently growth across asset operating margin returning capital classes, channels, while investing for to stockholders and geographies long-term growth over time T. ROWE PRICE GROUP, INC. INVESTOR DAY 2019 52
Closing thoughts Pleased Strong Investing to Attractive, Consistent, with leaders with grow and resilient disciplined progress focused diversify business capital business model return plans Moderating pace Responsive to market conditions T. ROWE PRICE GROUP, INC. INVESTOR DAY 2019 53

Appendix T. ROWE PRICE GROUP, INC. INVESTOR DAY 2019

Non-GAAP operating expenses reconciliation 2017/2016 2018/2017 2016 2017 2018 Change (%) Change (%) Operating expenses, GAAP basis $2,551.4 $2,746.1 $3,011.2 7.6% 9.7% Non-GAAP Adjustments: Expenses of consolidated T. Rowe Price investment products, net of elimination of its (6.5) (6.7) (6.5) related management and administrative fees1 Compensation expense related to market valuation changes in supplemental savings plan — (11.7) 5.6 liability2 Recoveries (nonrecurring charge) related (66.2) 50.0 15.2 to Dell appraisal rights matter3 Adjusted Operating Expenses $2,478.7 $2,777.7 $3,025.5 12.1% 8.9% 1The non-GAAP adjustments add back the management fees that we earn from the consolidated T. Rowe Price investment products and subtract the investment income and operating expenses of these products that have been included in our U.S. GAAP consolidated statements of income. We believe the consolidated T. Rowe Price investment products may impact the reader's ability to understand our core operating results. 2This non-GAAP adjustment removes the impact of market movements on the supplemental savings plan liability beginning July 1, 2017. Amounts deferred under the supplemental savings plan are adjusted for appreciation (depreciation) of hypothetical investments chosen by the employees. Since we economically hedge the exposure to these market movements, we believe it is useful to offset the non-operating investment income earned on the hedges against the related compensation expense to increase comparability period to period. 3Operating expense impact related to nonrecurring charges/recoveries associated with the Dell appraisal rights matter. We believe it is useful to readers of our consolidated statements of income to adjust for these nonrecurring charges and recoveries in arriving at adjusted operating expenses. T. ROWE PRICE GROUP, INC. INVESTOR DAY 2019 55

Additional information Fixed income passive peer analysis (p. 21) T. Rowe Price Product Name Passive Product Name T. Rowe Price Product Name Passive Product Name High Yield Low Duration Floating Rate Fund Invesco Senior Loan ETF Short-Term Bond Fund Vanguard Short-Term Bond ETF Institutional Floating Rate Fund Invesco Senior Loan ETF US Taxable Global High Income Bond Fund iShares US & Intl High Yield Corp Bd ETF U.S. Bond Enhanced Index Fund Vanguard Total Bond Market ETF High Yield Fund iShares iBoxx $ High Yield Corp Bd ETF New Income Fund Vanguard Total Bond Market ETF Institutional High Yield Fund iShares iBoxx $ High Yield Corp Bd ETF Institutional Long Duration Credit Fund iShares Long-Term Corporate Bond ETF U.S. High Yield Fund iShares iBoxx $ High Yield Corp Bd ETF Institutional Core Plus Fund Vanguard Total Bond Market ETF International Inflation Protected Bond Fund Vanguard Inflation-Protected Secs Inv Emerging Markets Bond Fund iShares JP Morgan USD Em Mkts Bd ETF Limited Duration Inflation Focused Bond PIMCO 1-5 Year US TIPS ETF Institutional Emerging Markets Bond Fund iShares JP Morgan USD Em Mkts Bd ETF Fund International Bond Fund iShares International Treasury Bond ETF U.S. Treasury Intermediate Fund Vanguard Intmdt-Term Trs ETF Emerging Markets Local Currency Bond VanEck Vectors JP Morgan EM LC Bd U.S. Treasury Long-Term Fund Vanguard Long-Term Treasury ETF Fund ETF GNMA Fund iShares GNMA Bond ETF Emerging Markets Corporate Bond Fund iShares JP Morgan EM Corporate Bond Corporate Income Fund iShares iBoxx $ Invmt Grade Corp Bd ETF ETF Municipal Summit Municipal Income Fund iShares National Muni Bond ETF Tax-Free Income Fund iShares National Muni Bond ETF Tax-Free Short-Intermediate Fund SPDR Nuveen Bloomberg Barclays Short Term Municipal Bond ETF California Tax-Free Bond Fund iShares California Muni Bond ETF New York Tax-Free Bond Fund iShares New York Muni Bond ETF T. ROWE PRICE GROUP, INC. INVESTOR DAY 2019 56
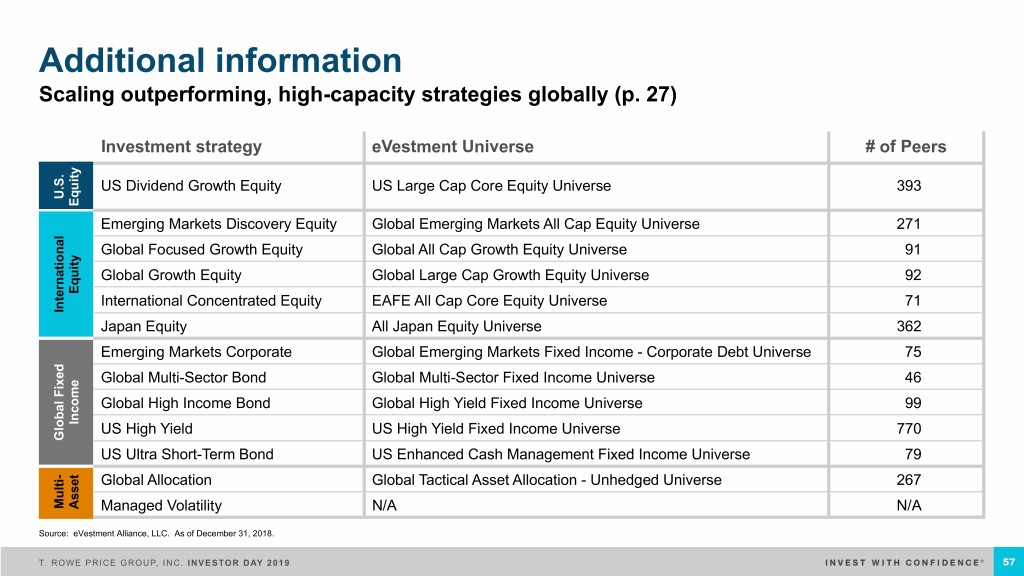
Additional information Scaling outperforming, high-capacity strategies globally (p. 27) Investment strategy eVestment Universe # of Peers US Dividend Growth Equity US Large Cap Core Equity Universe 393 U.S. Equity Emerging Markets Discovery Equity Global Emerging Markets All Cap Equity Universe 271 Global Focused Growth Equity Global All Cap Growth Equity Universe 91 Global Growth Equity Global Large Cap Growth Equity Universe 92 Equity International Concentrated Equity EAFE All Cap Core Equity Universe 71 International International Japan Equity All Japan Equity Universe 362 Emerging Markets Corporate Global Emerging Markets Fixed Income - Corporate Debt Universe 75 Global Multi-Sector Bond Global Multi-Sector Fixed Income Universe 46 Global High Income Bond Global High Yield Fixed Income Universe 99 Income US High Yield US High Yield Fixed Income Universe 770 Global Fixed Global US Ultra Short-Term Bond US Enhanced Cash Management Fixed Income Universe 79 - Global Allocation Global Tactical Asset Allocation - Unhedged Universe 267 Multi Asset Managed Volatility N/A N/A Source: eVestment Alliance, LLC. As of December 31, 2018. T. ROWE PRICE GROUP, INC. INVESTOR DAY 2019 57
Important information This material, including any statements, information, data and content contained within it and any materials, information, images, links, graphics or recordings provided in conjunction with this material are being furnished by T. Rowe Price for general informational purposes only. Under no circumstances should the material, in whole or part, be copied or distributed without consent from T. Rowe Price. The views contained herein are as of the date of the presentation. The information and data obtained from third-party sources which is contained in the report were obtained from the sources deemed reliable; however, its accuracy and completeness is not guaranteed. The products and services discussed in this presentation are available via subsidiaries of T. Rowe Price Group as authorized in countries through the world. The products and services are not available to all investors or in all countries. Visit troweprice.com to learn more about the products and services available in your country and the T. Rowe Price Group subsidiary which is authorized to provide them. The material is not intended for use by persons in jurisdictions which prohibit or restrict the distribution of the material and in certain countries the material is provided upon specific request. The material does not constitute a distribution, an offer, an invitation, recommendation or solicitation to sell or buy any securities in any jurisdiction. The material has not been reviewed by any regulatory authority in any jurisdiction. The material does not constitute advice of any nature and prospective investors are recommended to seek independent legal, financial and tax advice before making any investment decision. © 2019 Morningstar. All Rights Reserved. The information contained herein: (1) is proprietary to Morningstar and/or its content providers; (2) may not be copied or distributed; and (3) is not warranted to be accurate, complete or timely. Neither Morningstar nor its content providers are responsible for any damages or losses arising from any use of this information. Past performance is no guarantee of future results. Morningstar Fee Level: Morningstar evaluates a mutual fund share class's expense ratio relative to other funds that invest in a similar asset class and have similar distribution characteristics. Within each Comparison Group, a fund share class' expense ratio is ranked against peers using five quintiles. The Fee Level rating is objective, based entirely on a mathematical evaluation of a share class's expense ratio relative to similar funds. It is a useful tool for putting a fund's fees into context, but alone is not a sufficient basis for investment decisions. Russell Investment Group is the source and owner of the trademarks, service marks, and copyrights related to the Russell indexes. Russell® is a trademark of Russell Investment Group. The S&P Target Date indices are products of S&P Dow Jones Indices LLC, a division of S&P Global, or its affiliates (“SPDJI”) and has been licensed for use by T. Rowe Price. Standard & Poor’s® and S&P® are registered trademarks of Standard & Poor’s Financial Services LLC, a division of S&P Global (“S&P”); Dow Jones® is a registered trademark of Dow Jones Trademark Holdings LLC (“Dow Jones”). T. Rowe Price is not sponsored, endorsed, sold or promoted by SPDJI, Dow Jones, S&P, or their respective affiliates and none of such parties make any representation regarding the advisability of investing in such product(s) nor do they have any liability for any errors, omissions, or interruptions of the S&P Target Date indices T. ROWE PRICE, INVEST WITH CONFIDENCE, and the bighorn sheep design are trademarks or registered trademarks of T. Rowe Price Group, Inc. in the United States and other countries. All other trademarks are the property of T. Rowe Price or their respective owners. © 2019 T. Rowe Price Group, Inc. All rights reserved. T. ROWE PRICE GROUP, INC. INVESTOR DAY 2019 58


