
T. Rowe Price Group, Inc. INVESTOR DAY February 19, 2020 A copy of this presentation, which includes additional information, is available at troweprice.gcs-web.com/investor-relations. Data as of December 31, 2019, unless otherwise noted.
Opening and T. Rowe Price Overview Bill Stromberg PRESIDENT AND CEO T. ROWE PRICE GROUP, INC. INVESTOR DAY 2020
Forward-looking statements This presentation, and other statements that T. Rowe Price may make, may contain forward-looking statements within the meaning of the Private Securities Litigation Reform Act of 1995, with respect to T. Rowe Price’s future financial or business performance, strategies, or expectations. Forward-looking statements are typically identified by (1) words or phrases such as “trend,” “potential,” “opportunity,” “pipeline,” “believe,” “comfortable,” “expect,” “anticipate,” “current,” “intention,” “estimate,” “position,” “assume,” “outlook,” “continue,” “remain,” “maintain,” “sustain,” “seek,” “achieve,” and similar expressions or (2) future or conditional verbs such as “will,” “would,” “should,” “could,” “may,” and similar expressions. Forward-looking statements in this presentation may include, without limitation, information concerning future results of our operations, expenses, earnings, liquidity, cash flow and capital expenditures, industry challenges, market conditions, amount or composition of AUM, regulatory developments, demand for and pricing of our products, potential product offerings, stock price, amount and timing of our stock dividends or repurchases, and other aspects of our business or general economic conditions. T. Rowe Price cautions that forward-looking statements are subject to numerous assumptions, risks, and uncertainties, which change over time. Actual results could differ materially from those anticipated in forward-looking statements, and future results could differ materially from historical performance. Forward-looking statements speak only as of the date they are made, and T. Rowe Price assumes no duty to and does not undertake to update forward-looking statements. We caution investors not to rely unduly on any forward-looking statements and urge you to carefully consider the risks and other factors described in our most recent annual, quarterly, and current reports on Form 10-K, Form 10-Q, and Form 8-K, filed with the Securities and Exchange Commission. T. ROWE PRICE GROUP, INC. INVESTOR DAY 2020 3
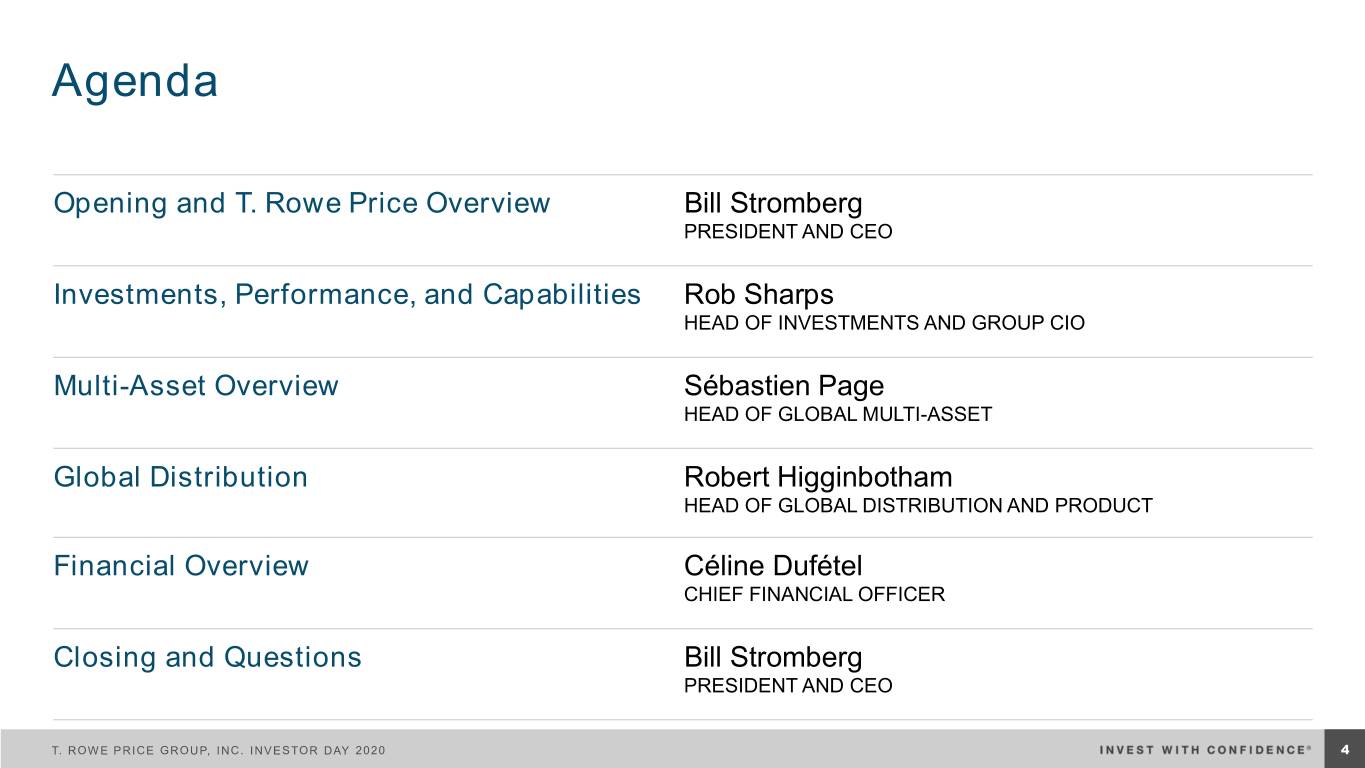
Agenda Opening and T. Rowe Price Overview Bill Stromberg PRESIDENT AND CEO Investments, Performance, and Capabilities Rob Sharps HEAD OF INVESTMENTS AND GROUP CIO Multi-Asset Overview Sébastien Page HEAD OF GLOBAL MULTI-ASSET Global Distribution Robert Higginbotham HEAD OF GLOBAL DISTRIBUTION AND PRODUCT Financial Overview Céline Dufétel CHIEF FINANCIAL OFFICER Closing and Questions Bill Stromberg PRESIDENT AND CEO T. ROWE PRICE GROUP, INC. INVESTOR DAY 2020 4
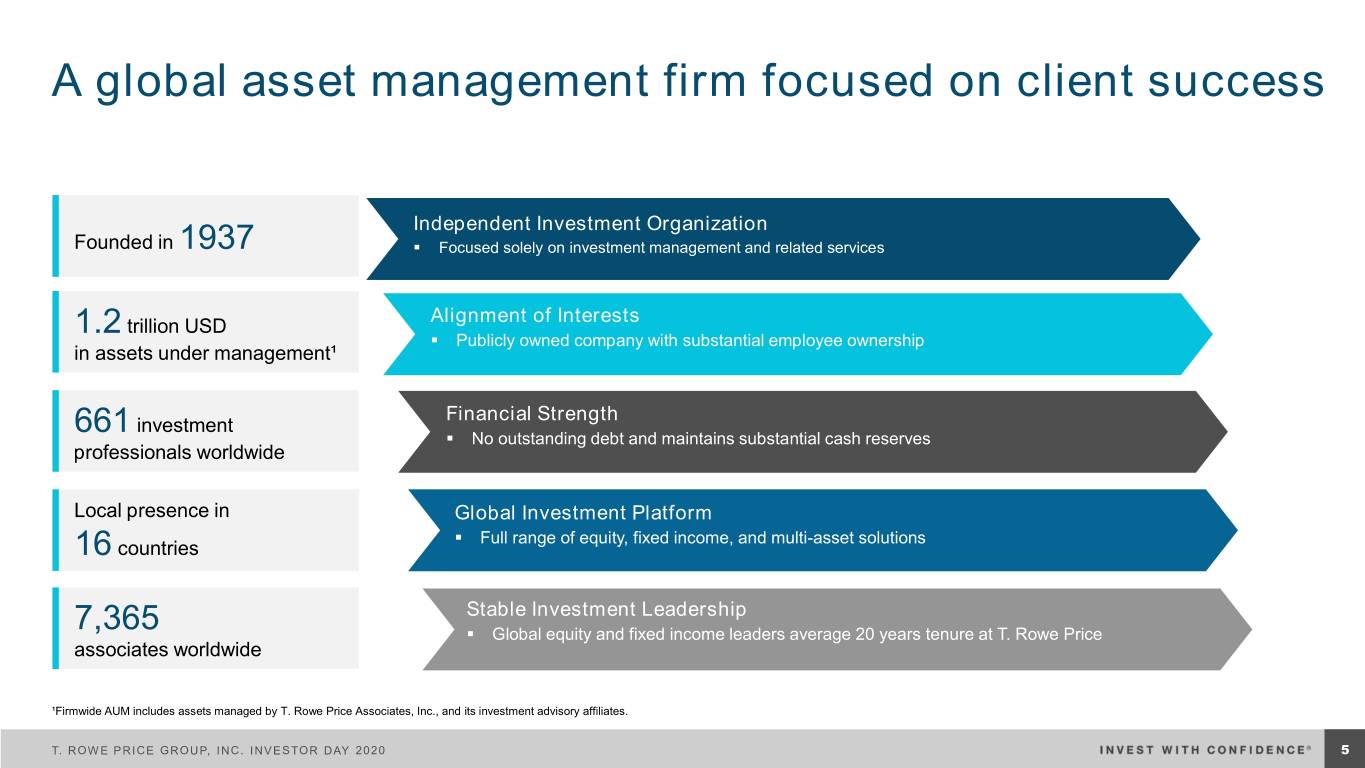
A global asset management firm focused on client success Independent Investment Organization Founded in 1937 ▪ Focused solely on investment management and related services Alignment of Interests 1.2 trillion USD ▪ Publicly owned company with substantial employee ownership in assets under management¹ Financial Strength 661 investment ▪ No outstanding debt and maintains substantial cash reserves professionals worldwide Local presence in Global Investment Platform ▪ Full range of equity, fixed income, and multi-asset solutions 16 countries Stable Investment Leadership 7,365 ▪ Global equity and fixed income leaders average 20 years tenure at T. Rowe Price associates worldwide ¹Firmwide AUM includes assets managed by T. Rowe Price Associates, Inc., and its investment advisory affiliates. T. ROWE PRICE GROUP, INC. INVESTOR DAY 2020 5

Culture is central to our long-term success Investment Excellence The heart of everything we do Clients First We succeed if our clients succeed Long-Term Collegiality and Collaboration Leveraging our best ideas creates Success competitive advantage Trust and Mutual Respect Essential for a strong community Long-Term Time Horizon A true competitive advantage Performance-driven and collaborative T. ROWE PRICE GROUP, INC. INVESTOR DAY 2020 6
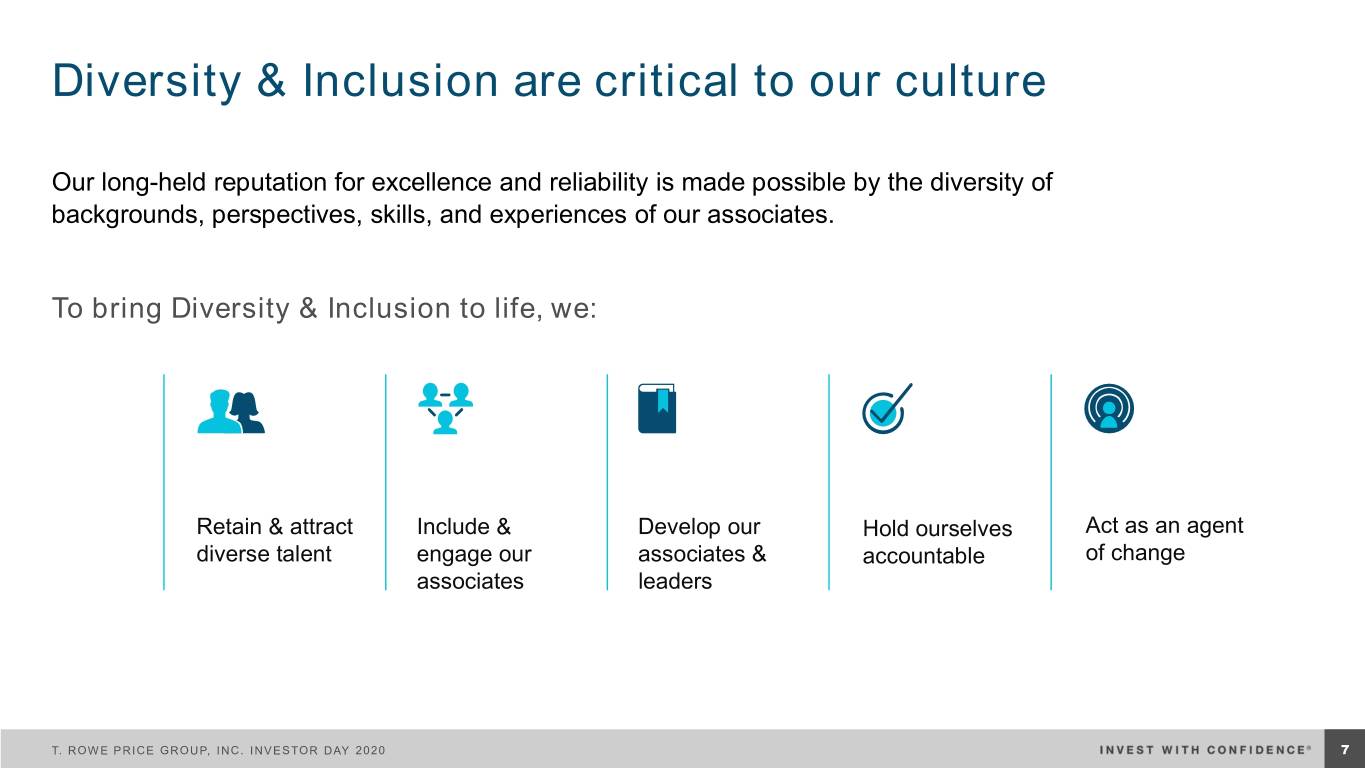
Diversity & Inclusion are critical to our culture Our long-held reputation for excellence and reliability is made possible by the diversity of backgrounds, perspectives, skills, and experiences of our associates. To bring Diversity & Inclusion to life, we: Retain & attract Include & Develop our Hold ourselves Act as an agent diverse talent engage our associates & accountable of change associates leaders T. ROWE PRICE GROUP, INC. INVESTOR DAY 2020 7

Our vision is to be a premier global active asset manager By executing on important multiyear strategic objectives More global and diversified asset Strong process orientation and effective manager internal controls, while becoming a more adaptive and agile company Global partner for retirement investors Destination of choice for top talent with and provider of integrated investment diverse workforce and inclusive culture solutions Embedding ESG and sustainability Strong financial results and principles across the firm balance sheet T. ROWE PRICE GROUP, INC. INVESTOR DAY 2020 8
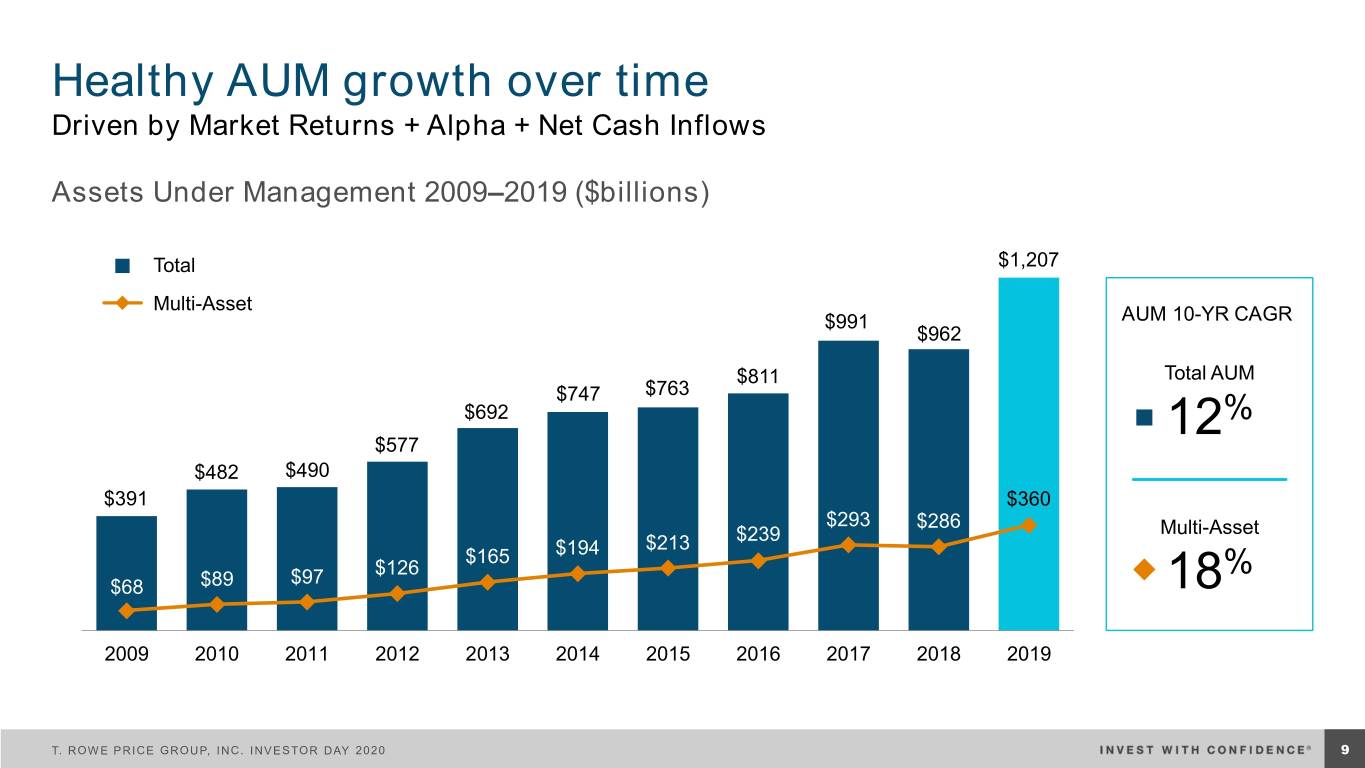
Healthy AUM growth over time Driven by Market Returns + Alpha + Net Cash Inflows Assets Under Management 2009–2019 ($billions) Total $1,207 Multi-Asset $991 AUM 10-YR CAGR $962 $811 Total AUM $747 $763 $692 12% $577 $482 $490 $391 $360 $293 $286 Multi-Asset $213 $239 $165 $194 $97 $126 % $68 $89 18 2009 2010 2011 2012 2013 2014 2015 2016 2017 2018 2019 T. ROWE PRICE GROUP, INC. INVESTOR DAY 2020 9

Consistent results and long-term orientation $10.00 5 10 20 30 $8.70 years years years years $8.00 Diluted EPS Net revenues 7% 12% 9% 13% (GAAP) $6.00 Diluted EPS 14% 18% 12% 15% (GAAP) $4.00 $3.04 Dividend Dividends 12% 12% 14% 17% $2.00 per Share Annualized total stock 11% 12% 12% 17% $0.00 return 1986 1994 2002 2010 20189 Past performance cannot guarantee future results. Left chart: Data since April 2, 1986, IPO through December 31, 2019. Right chart: Compound annualized growth for periods ended December 31, 2019. T. ROWE PRICE GROUP, INC. INVESTOR DAY 2020 10

Better fundamental growth than the S&P 500 5-Year Revenue, Earnings, and Dividend Growth T. Rowe Price 13.8% S&P 500 11.6% 8.1% 7.1% 6.4% 3.9% Revenue Earnings per Share (GAAP) Dividends per Share Data as of December 31, 2019. Sources: T. Rowe Price Company Filings; S&P via FactSet (refer to page 72 for information about this S&P information). Revenue and earnings growth percentages for the S&P 500 include actual results for companies that reported through January 31, 2020, and consensus estimates for those that have not yet reported. As of January 31, 2020, 45% of S&P 500 companies have reported comparable data that total 61% of the S&P 500 market value. T. ROWE PRICE GROUP, INC. INVESTOR DAY 2020 11

Industry challenges continue Market Context Impact on Asset Managers ▪ Passive investments continue to take share from active ▪ Higher bar on investment performance for active managers Aging population Low interest rate ▪ Increased prevalence of alternatives around the globe environment ▪ Continued pressure on fees but, in active management, low fee ineffective without performance ▪ Faster growth occurring outside the U.S. Increasing focus (and Technology and transparency) on fees data advancements ▪ Distributors are consolidating relationships, requiring more from partners and negotiating to maintain their economics ▪ Significant technology investment required to enhance investments, distribution, and client experience capabilities Evolving investor New regulatory ▪ ESG capabilities increasingly table stakes attitudes about ESG requirements T. ROWE PRICE GROUP, INC. INVESTOR DAY 2020 12

Scale positions us well to address industry challenges But investment performance guides our strategic decision-making Benefits of scale… ▪ Investment platform – Deep, global, collaborative investment teams generate insights across asset classes. Means to pay for talent and external research while investing in data analytics and quantitative tools. Paying hard-dollar globally for research in 2020. ▪ Distribution reach – Broad distribution channels around the world with analytics and Web capabilities to deliver positive client experience. ▪ Operating platform – Building a global operating platform that is scalable, efficient, and secure—and can comply with complex regulations. ▪ Financial – Strong balance sheet and healthy operating model allows reinvestment through cycles. Scale advantages exist, but it is important to manage capacity to preserve alpha generation T. ROWE PRICE GROUP, INC. INVESTOR DAY 2020 13

Good progress on our 2019 strategic priorities ▪ Maintained strong longer-term relative investment performance Investment ▪ Increased investment professional headcount to 661 worldwide, with 32% outside the U.S. 1 ▪ Launched six new strategies and 20 new products Capabilities ▪ Received exemptive relief from the SEC on our application for semi-transparent active ETFs ▪ Continued to advance ESG capabilities; first sustainable SICAV launched in January 2020 ▪ Achieved $13.2 billion in net flows (1.4% organic growth) Distribution ▪ Continued to invest across U.S. broker-dealer and defined contribution investment only channels 2 ▪ Further expanded APAC and EMEA intermediary and institutional presence, growing brand awareness Capabilities ▪ Maintained high client satisfaction in Individual Investors and Retirement Plan Services businesses ▪ Enhanced digital capabilities to improve client experience and generate long-term efficiencies ▪ Continued to modernize tech platforms across investments, trading, middle office, and performance Technology, ▪ Progressed application decommissioning, execution of multi-tiered storage strategy, and reduction of physical and virtual servers, to help manage expenses 3 Finance, and ▪ Managed expense growth at lower end of guidance through continued emphasis on operational Operations effectiveness T. ROWE PRICE GROUP, INC. INVESTOR DAY 2020 14

Our 2020 priorities ▪ Deliver excellent investment results ▪ Attract and retain talent while further advancing our Diversity & Inclusion strategy ▪ Build/launch new investment strategies and vehicles to meet client needs (e.g., ETFs) and diversify our business ▪ Enhance our standing as a retirement leader ▪ Further build our distribution teams/capabilities globally to strengthen brand rankings and diversify our business ▪ Execute on key operations and technology initiatives to improve efficiency, security, scalability, and agility ▪ Globalize shared services functions to support growth, improve governance, and meet regulatory needs ▪ Embed ESG/sustainability principles across the firm to be admirable stewards of client/stockholder capital Achieve excellent investment results for clients + attractive returns for stockholders over long term T. ROWE PRICE GROUP, INC. INVESTOR DAY 2020 15
Investments, Performance, and Capabilities Rob Sharps HEAD OF INVESTMENTS AND GROUP CIO T. ROWE PRICE GROUP, INC. INVESTOR DAY 2020
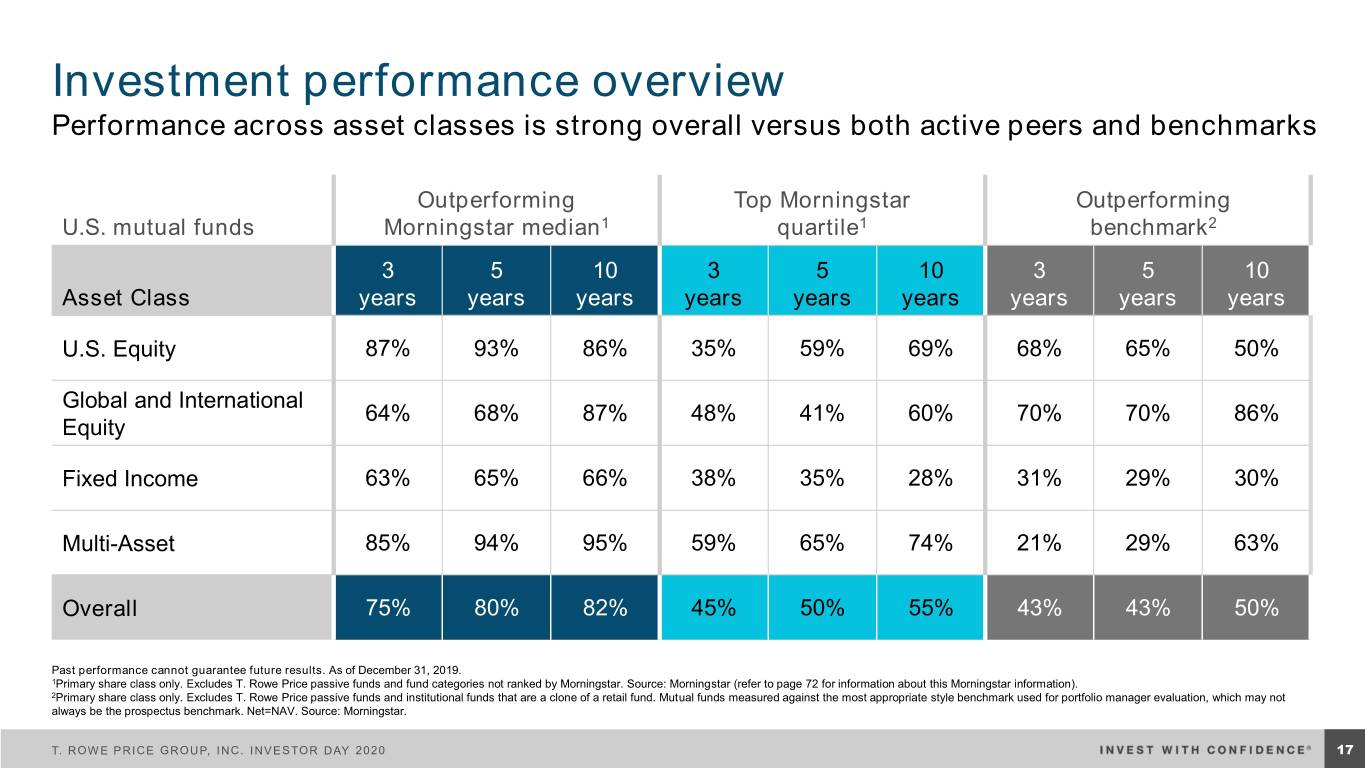
Investment performance overview Performance across asset classes is strong overall versus both active peers and benchmarks Outperforming Top Morningstar Outperforming U.S. mutual funds Morningstar median1 quartile1 benchmark2 3 5 10 3 5 10 3 5 10 Asset Class years years years years years years years years years U.S. Equity 87% 93% 86% 35% 59% 69% 68% 65% 50% Global and International 64% 68% 87% 48% 41% 60% 70% 70% 86% Equity Fixed Income 63% 65% 66% 38% 35% 28% 31% 29% 30% Multi-Asset 85% 94% 95% 59% 65% 74% 21% 29% 63% Overall 75% 80% 82% 45% 50% 55% 43% 43% 50% Past performance cannot guarantee future results. As of December 31, 2019. 1Primary share class only. Excludes T. Rowe Price passive funds and fund categories not ranked by Morningstar. Source: Morningstar (refer to page 72 for information about this Morningstar information). 2Primary share class only. Excludes T. Rowe Price passive funds and institutional funds that are a clone of a retail fund. Mutual funds measured against the most appropriate style benchmark used for portfolio manager evaluation, which may not always be the prospectus benchmark. Net=NAV. Source: Morningstar. T. ROWE PRICE GROUP, INC. INVESTOR DAY 2020 17

Overall performance—asset-weighted Asset-weighted results exceed equal-weighted results1 over all time periods Funds outperforming Funds in top Funds outperforming Morningstar median2 Morningstar quartile2 benchmark3 % 90% 94 90% % 77% 79 % % 63 59 56% 57% 3 years 5 years 10 years 3 years 5 years 10 years 3 years 5 years 10 years Past performance cannot guarantee future results. As of December 31, 2019. U.S. mutual funds only. Asset-weighted results based on end-of-period assets as of December 31, 2019. 1Equal-weighted results refers to data on the previous slide. 2Primary share class only. Excludes T. Rowe Price passive funds and fund categories not ranked by Morningstar. Source: Morningstar. 3Primary share class only. Excludes T. Rowe Price passive funds and institutional funds that are a clone of a retail fund. Mutual funds measured against the most appropriate style benchmark used for portfolio manager evaluation, which may not always be the prospectus benchmark. Net=NAV. Source: Morningstar. T. ROWE PRICE GROUP, INC. INVESTOR DAY 2020 18

Long-term benefits of our approach to active management in U.S. equity Percentage of U.S. equity funds with positive active success rates 3 years 5 years 10 years (205 rolling time periods) (181 rolling time periods) (121 rolling time periods) 89% 89% 89% Annualized, time-weighted excess returns, net of fees 3 years 5 years 10 years Large-cap 0.98% 0.84% 0.83% Mid-cap 1.02% 0.97% 1.03% Small-cap 2.14% 2.04% 2.25% Past performance cannot guarantee future results. Rolling periods December 31, 1999, through December 31, 2019. Analysis of 18 T. Rowe Price diversified active U.S. equity mutual funds over 20 years or their lifetimes. The active success rate records the percentage of times a fund beat its designated benchmark, net of fees and trading costs, over a specified time period. We’ve defined a positive active success rate as a fund beating the performance of its designated benchmark in more than half of the periods measured. Sources: T. Rowe Price, Russell, and S&P; data analysis by T. Rowe Price. Analysis includes 11 large-cap funds, 3 mid-cap funds, and 4 small-cap funds. For a more detailed discussion of results and methodology, see “The T. Rowe Price Strategic Investing Approach”. Available at https://www.troweprice.com/content/dam/fai/studies/US-Equity-Strategic-Approach.pdf. Refer to page 72 for information about this Russell information. T. ROWE PRICE GROUP, INC. INVESTOR DAY 2020 19
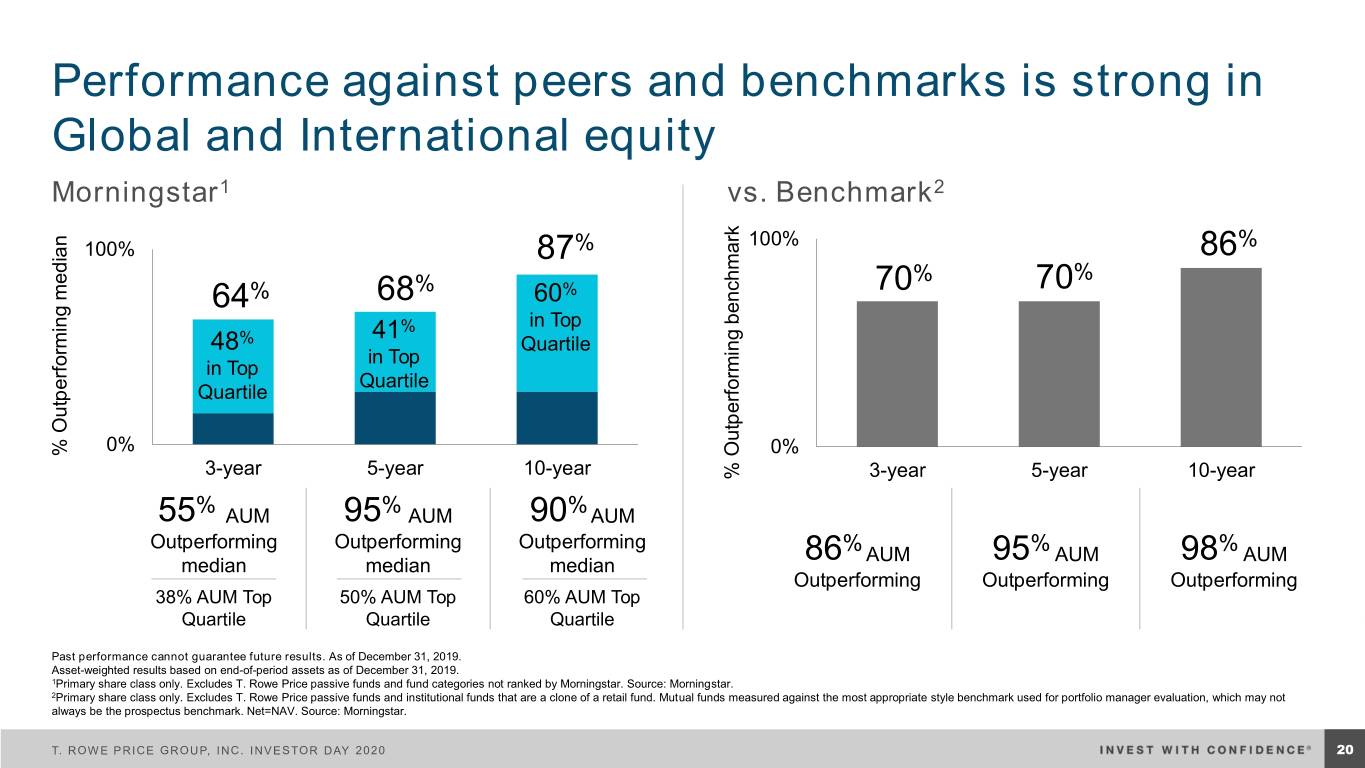
Performance against peers and benchmarks is strong in Global and International equity Morningstar1 vs. Benchmark2 100% % 100% 87% 86 % % 70% 70 64% 68 60% 41% in Top 48% Quartile in Top in Top Quartile Quartile 0% % Outperforming median Outperforming % 0% 3-year 5-year 10-year % Outperforming benchmark Outperforming % 3-year 5-year 10-year % % % 55 AUM 95 AUM 90 AUM Outperforming Outperforming Outperforming % % % AUM AUM AUM median median median 86 95 98 Outperforming Outperforming Outperforming 38% AUM Top 50% AUM Top 60% AUM Top Quartile Quartile Quartile Past performance cannot guarantee future results. As of December 31, 2019. Asset-weighted results based on end-of-period assets as of December 31, 2019. 1Primary share class only. Excludes T. Rowe Price passive funds and fund categories not ranked by Morningstar. Source: Morningstar. 2Primary share class only. Excludes T. Rowe Price passive funds and institutional funds that are a clone of a retail fund. Mutual funds measured against the most appropriate style benchmark used for portfolio manager evaluation, which may not always be the prospectus benchmark. Net=NAV. Source: Morningstar. T. ROWE PRICE GROUP, INC. INVESTOR DAY 2020 20

Fixed income performance is stronger in composites Fixed income funds outperforming Fixed income composites outperforming benchmark1 benchmark2 3-year 3-year 5-year 5-year 10-year 10-year 65% 65% 62% 60% 58% 56% 48% 40% 39% 31% 29% 30% Equal-weighted AUM-weighted Equal-weighted AUM-weighted Past performance cannot guarantee future results. As of December 31, 2019. U.S. mutual funds only. Asset-weighted results based on end-of-period assets as of December 31, 2019. 1Primary share class only. Excludes T. Rowe Price passive funds and institutional funds that are a clone of a retail fund. Mutual funds measured against the most appropriate style benchmark used for portfolio manager evaluation, which may not always be the prospectus benchmark. Net=NAV. Source: Morningstar. 2Composite net returns are calculated using the highest applicable separate account fee schedule. All composites compared with official GIPS composite primary benchmark. T. ROWE PRICE GROUP, INC. INVESTOR DAY 2020 21

Multiyear investment to grow our investment capabilities globally Investment professional headcount 661 133 10 2004–2019 London/EMEA 76 Global Multi-Asset 452 Tokyo 48 Baltimore/U.S. Global Hong Kong 454 217 22 Fixed Income 7 345 Singapore 15 158 145 International Equity 11 225 109 108 Sydney 80 79 46 223 U.S. Equity 142 166 Investment professionals 99 661 worldwide 2004 2009 2014 2019 T. ROWE PRICE GROUP, INC. INVESTOR DAY 2020 22

Investing in expanded capabilities T. Rowe Price’s strength in scale Corporate Access ▪ Dedicated in-house capabilities ▪ Supplemental to third-party access ▪ Structuring unique events Equity Data Insights ▪ Improving investment outcomes through data-driven insights ▪ Quantitative research team dedicated to our fundamental equity effort ▪ Specializing in “big data” and “machine learning” to provide actionable investment ideas ESG ▪ Proprietary quant model on 14,000+ securities ▪ Factor analysis applied to multiple data inputs to highlight risks ▪ In-house ESG expertise supporting investors T. ROWE PRICE GROUP, INC. INVESTOR DAY 2020 23
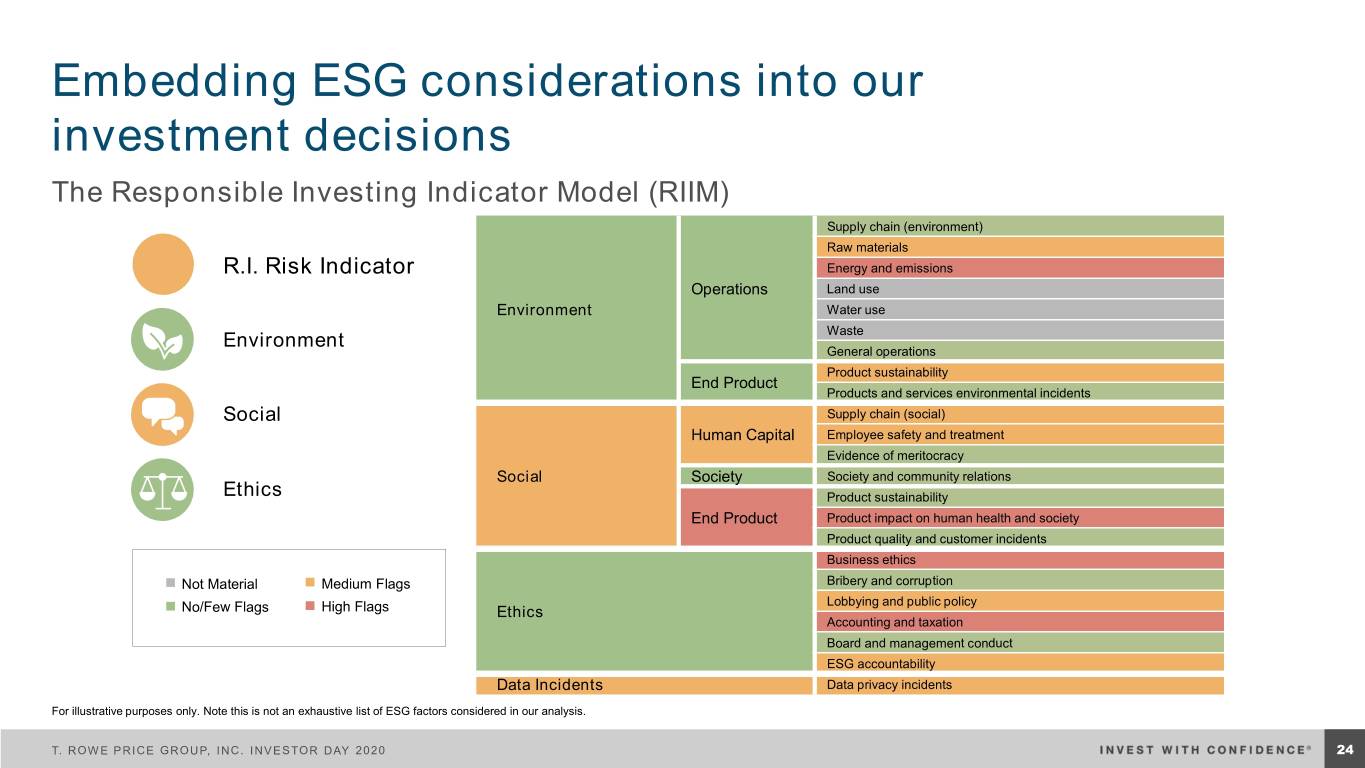
Embedding ESG considerations into our investment decisions The Responsible Investing Indicator Model (RIIM) Supply chain (environment) Raw materials R.I. Risk Indicator Energy and emissions Operations Land use Environment Water use Environment Waste General operations Product sustainability End Product Products and services environmental incidents Social Supply chain (social) Human Capital Employee safety and treatment Evidence of meritocracy Social Society Society and community relations Ethics Product sustainability End Product Product impact on human health and society Product quality and customer incidents Business ethics Not Material Medium Flags Bribery and corruption Lobbying and public policy No/Few Flags High Flags Ethics Accounting and taxation Board and management conduct ESG accountability Data Incidents Data privacy incidents For illustrative purposes only. Note this is not an exhaustive list of ESG factors considered in our analysis. T. ROWE PRICE GROUP, INC. INVESTOR DAY 2020 24

ESG is integrated into our investment process Focus of 650+ ESG Engagements in 2019 Environment, social, % or ethics only 9 Top 5 Topics by Pillar: Environment Ethics 1. Environmental disclosure 1. Bribery and corruption 2. Product sustainability 2. Lobbying activities 3. GHG emissions 3. Proxy voting ethics 4. Responsible investing 4. Regulatory changes 5. Environmental management 5. Compliance programs Governance only 35% Social Governance 1. Social disclosure 1. Executive compensation 2. Employee safety and treatment 2. Board composition 3. Proxy voting social 3. Governance structure 4. Diversity 4. Shareholder rights 5. Society and community relations 5. Succession Percentages may not equal 100% due to rounding. T. ROWE PRICE GROUP, INC. INVESTOR DAY 2020 25
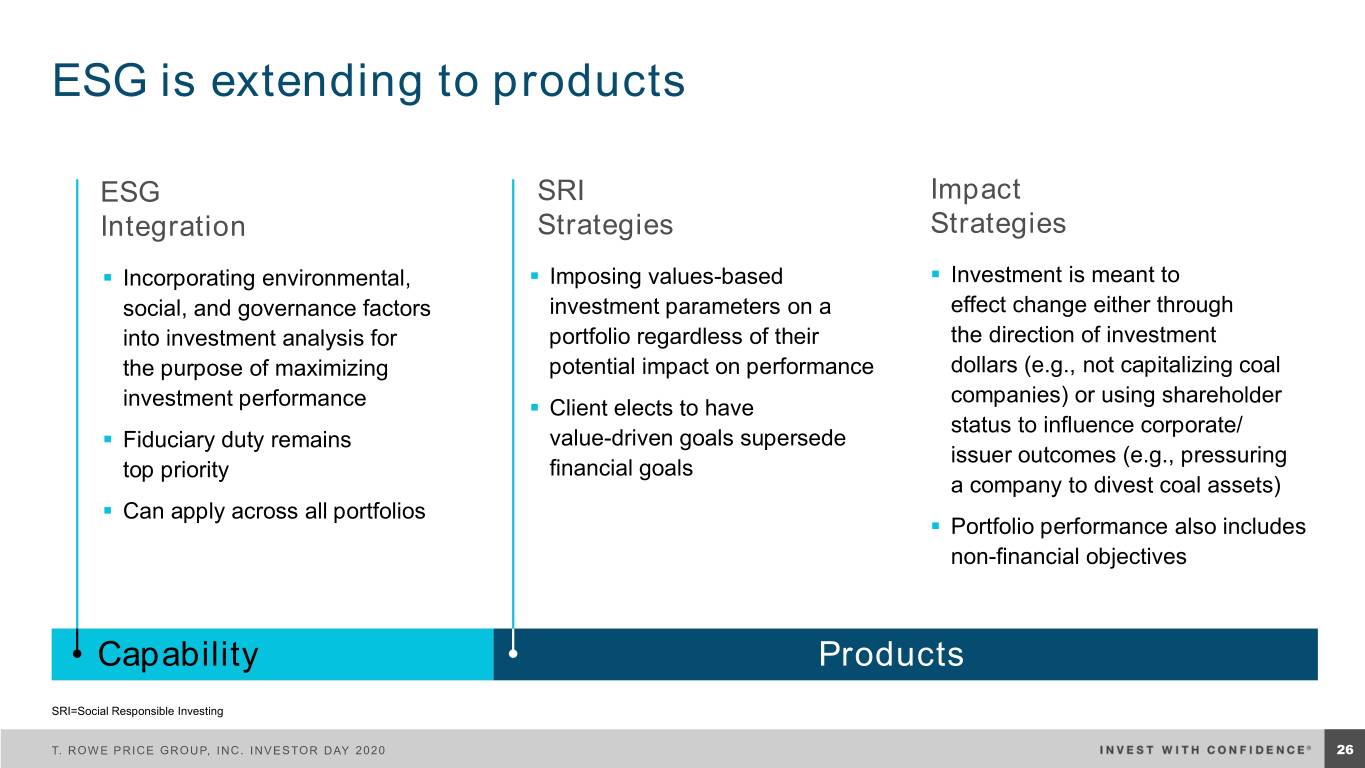
ESG is extending to products ESG SRI Impact Integration Strategies Strategies ▪ Incorporating environmental, ▪ Imposing values-based ▪ Investment is meant to social, and governance factors investment parameters on a effect change either through into investment analysis for portfolio regardless of their the direction of investment the purpose of maximizing potential impact on performance dollars (e.g., not capitalizing coal companies) or using shareholder investment performance ▪ Client elects to have status to influence corporate/ ▪ Fiduciary duty remains value-driven goals supersede issuer outcomes (e.g., pressuring top priority financial goals a company to divest coal assets) ▪ Can apply across all portfolios ▪ Portfolio performance also includes non-financial objectives Capability Products SRI=Social Responsible Investing T. ROWE PRICE GROUP, INC. INVESTOR DAY 2020 26

Delivering our investment capabilities through ETFs New Offering Right at the Starting Line ▪ Launching semi-transparent active ETFs ▪ As an early provider of semi-transparent active presents an opportunity to help redefine the ETFs, we have demonstrated our commitment to ETF industry providing innovative capabilities that meet investors’ ▪ Semi-transparent active ETFs provide an evolving needs efficient way for investors to access our alpha ▪ With the SEC’s approval of semi-transparent active generation capabilities ETFs, the timing is right to enter the ETF space to leverage our firm’s strengths in active management Client Expansion Long-Term Growth ▪ ETFs are popular with financial advisors and ▪ We plan to deliver a robust ETF product lineup individual investors because of their tax across regions and asset classes in the years efficiency, low-cost structure, and convenience to come ▪ ETFs provide the ability to leverage existing ▪ Active ETFs are in their infancy but represent a relationships and to attract new clients growth opportunity for active management T. ROWE PRICE GROUP, INC. INVESTOR DAY 2020 27

Scaling outperforming, high-capacity strategies globally AUM % 3-year annualized 5-year annualized AUM change excess returns 3-year eVestment excess returns 5-year eVestment Investment strategy ($m) yr./yr. (bps)1 percentile rank2 (bps)1 percentile rank2 U.S. Dividend Growth Equity $16,893 69% 110 19 107 10 U.S. U.S. Equity Emerging Markets Discovery Equity $280 390% 169 15 N/A N/A Global Focused Growth Equity $15,750 93% 731 17 595 13 Global Growth Equity $7,375 25% 572 37 298 39 Equity International Disciplined Equity $461 35% 156 32 227 20 International International Japan Equity $3,873 97% 569 23 603 17 Emerging Markets Corporate $1,048 311% 143 23 122 20 Global Multi-Sector Bond $1,843 26% 181 11 180 16 Global High Income Bond $538 100% 107 11 N/A N/A Income U.S. High Yield $1,158 43% 122 8 152 5 Global Fixed Global U.S. Ultra Short-Term Bond $1,977 77% 94 6 97 7 - Global Allocation $717 24% 48 14 95 8 3 Multi Asset Managed Volatility $2,138 21% 189 N/A 65 N/A Past performance cannot guarantee future results. As of December 31, 2019. The strategies listed may not be available in all jurisdictions nor to all investors. International Disciplined Equity name changed from International Concentrated Equity effective March 1, 2019. Source: eVestment Alliance, LLC. 1Excess returns results based on gross composite returns versus primary GIPS composite benchmark. 2Additional information on ranking available in the Appendix. 3eVestment ranking is not applicable as the strategy is only available via separate accounts. T. ROWE PRICE GROUP, INC. INVESTOR DAY 2020 28

Investment capabilities Expanding our product lineup globally Global Equity Global Fixed Income Global Multi-Asset 2018 ▪ Global Equity Dividend ▪ Asia Credit ▪ Retirement Blend Trusts ▪ SMAs: Large-Cap Core, Equity ▪ Multi-Strategy Total Return Income, International Core, ▪ Custom Target Date Funds Australia 2019 ▪ Global Focused Growth ITM ▪ Dynamic Credit ▪ Target Allocation Active Models ▪ Europe Select Equity ▪ Global Government Bond ▪ China Evolution Equity (Small/Mid) 2020+ ▪ Semi-Transparent Active ETFs ▪ Low Duration Credit ▪ Multi-Asset Global Income ▪ U.S. Select Value ▪ Stable Value Multi-Manager ▪ Income Models ▪ Sustainable SICAV Range ▪ Dynamic Emerging Markets ▪ Macro and Absolute Return ▪ China Growth Bond Strategy (MARS) ▪ Global Select (Core) ▪ Global Impact The strategies and capabilities listed are not available in all jurisdictions nor to all investors. There is no guarantee that the capabilities and strategies currently under evaluation will be launched. T. ROWE PRICE GROUP, INC. INVESTOR DAY 2020 29
Summary Evolving Investment capabilities Culture excellence T. ROWE PRICE GROUP, INC. INVESTOR DAY 2020 30

Multi-Asset Overview Sébastien Page HEAD OF GLOBAL MULTI-ASSET T. ROWE PRICE GROUP, INC. INVESTOR DAY 2020

Over 25 years of delivering multi-asset class solutions 1,2 $360b in Assets Under Management $400 2015 Retirement I Funds 2016 $350 Global Allocation Fund SICAV $300 2017 ® 2010 T. Rowe Price Assets in $ Billions ActivePlus Real Assets Fund $250 2012 2017 Retirement Income Retirement Trusts 2020 Portfolio $200 1990 2013 2017 Global Allocation Fund Asset Allocation Global Allocation Fund Committee Created 2013 SICAV Extended $150 1990 Target Funds 2018 Spectrum and Spectrum 2013 Multi-Strategy Total Income Funds Equity Index Option Overlay Return Fund $100 1991 2013 2018 Balanced Fund 2001 Derivatives-Based Retirement Blend Trust 1994 1996 College Savings Plan 2008 Multi-Asset Portfolios 2019 $50 Personal Strategy Spectrum 2002 Retirement 2014 U.S. Risk-Managed Funds International Fund Retirement Funds Hybrid Trusts Managed Volatility Strategy Dynamic Allocation 1995 2000 2005 2010 2015 1990 $0 1990 1995 2000 2005 2010 2015 1The combined multi-asset portfolios managed by T. Rowe Price Associates, Inc., and its applicable affiliates as of December 31, 2019. 2The total assets are adjusted for cases where a particular investment might be represented on a standalone basis as well as a component in a multi-fund portfolio. The above timeline is intended to show the evolution of when multi-asset strategies and products were launched globally. The strategies and capabilities listed are not available in all jurisdictions nor to all investors. T. ROWE PRICE GROUP, INC. INVESTOR DAY 2020 32

Strong performance and risk-adjusted outcomes Versus Morningstar peers 3-year rolling 5-year rolling 10-year rolling Top quartile Percent of time Retirement Funds 84% 92% 98% were in top quartile Top half Percent of time Retirement Funds % % % were in top half 98 97 99 Risk-adjusted outperformance Percent of time Retirement Funds’ 91% 93% 98% Sharpe ratios were in top half Past performance cannot guarantee future results. Figures reflect the aggregate performance of the 11 Retirement Funds with a 10-year track record (Retirement 2005 through Retirement 2055 Funds). Of the 11 Retirement Funds with a 10-year track record (the Retirement 2005 through 2055 Funds), 10 of 11, 10 of 11, and 10 of 11 were in the top quartile for the 3-, 5-, and 10-year periods ended December 31, 2019. Source: Morningstar. T. ROWE PRICE GROUP, INC. INVESTOR DAY 2020 33
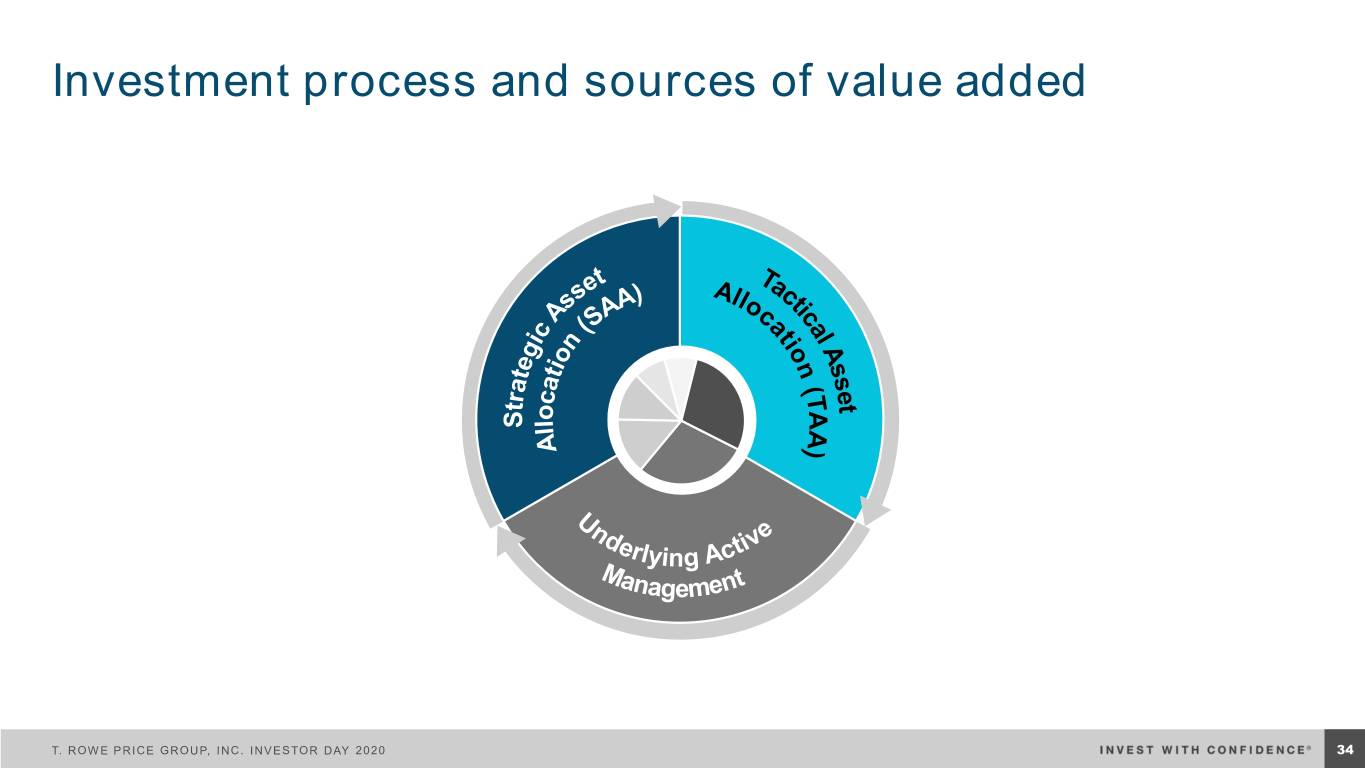
Investment process and sources of value added T. ROWE PRICE GROUP, INC. INVESTOR DAY 2020 34
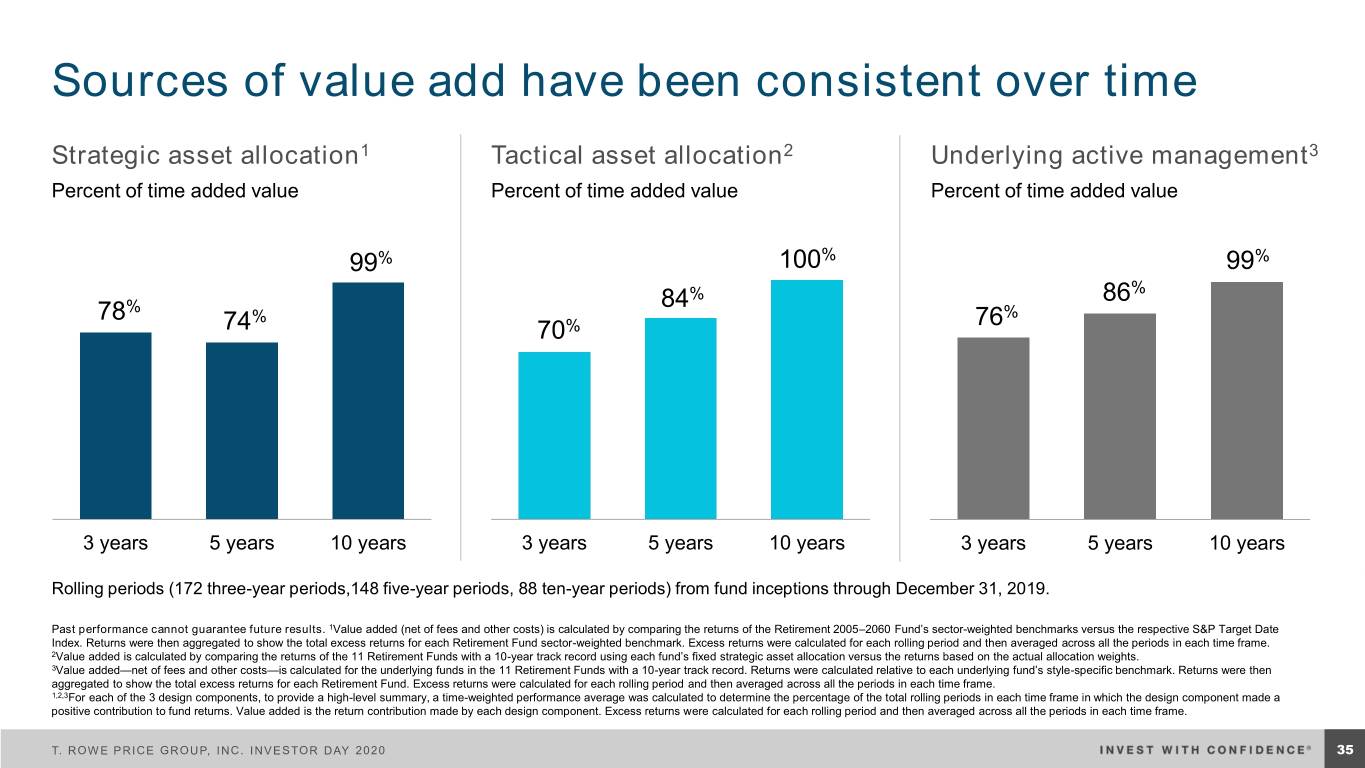
Sources of value add have been consistent over time Strategic asset allocation1 Tactical asset allocation2 Underlying active management3 Percent of time added value Percent of time added value Percent of time added value 99% 100% 99% % 86% % 84 78 % 76% 74 70% 3 years 5 years 10 years 3 years 5 years 10 years 3 years 5 years 10 years Rolling periods (172 three-year periods,148 five-year periods, 88 ten-year periods) from fund inceptions through December 31, 2019. Past performance cannot guarantee future results. 1Value added (net of fees and other costs) is calculated by comparing the returns of the Retirement 2005–2060 Fund’s sector-weighted benchmarks versus the respective S&P Target Date Index. Returns were then aggregated to show the total excess returns for each Retirement Fund sector-weighted benchmark. Excess returns were calculated for each rolling period and then averaged across all the periods in each time frame. 2Value added is calculated by comparing the returns of the 11 Retirement Funds with a 10-year track record using each fund’s fixed strategic asset allocation versus the returns based on the actual allocation weights. 3Value added—net of fees and other costs—is calculated for the underlying funds in the 11 Retirement Funds with a 10-year track record. Returns were calculated relative to each underlying fund’s style-specific benchmark. Returns were then aggregated to show the total excess returns for each Retirement Fund. Excess returns were calculated for each rolling period and then averaged across all the periods in each time frame. 1,2,3For each of the 3 design components, to provide a high-level summary, a time-weighted performance average was calculated to determine the percentage of the total rolling periods in each time frame in which the design component made a positive contribution to fund returns. Value added is the return contribution made by each design component. Excess returns were calculated for each rolling period and then averaged across all the periods in each time frame. T. ROWE PRICE GROUP, INC. INVESTOR DAY 2020 35

What it means for investors Retirement 2030 Strategy vs. S&P Target Date 2030 Index Cumulative growth of $100,000 $468,980 Retirement 2030 Strategy $400,000 $389,571 S&P Target Date 2030 Index $300,000 $200,000 Hypothetical Total Account Value Account Total Hypothetical $100,000 $100,000 Initial investment 20022002 2006 2010 2014 201820192018 As of December 31, 2019. For illustrative purposes only and is not intended to be an endorsement, offer or solicitation for the sale of any product or service. Past performance cannot guarantee future results. Performance shown is of a representative investment portfolio in the retirement 2030 suite of products. Performance shown is net of fees; it includes changes in the principle value, reinvested dividends, and capital gain distributions. Investors cannot invest directly in an index. T. ROWE PRICE GROUP, INC. INVESTOR DAY 2020 36
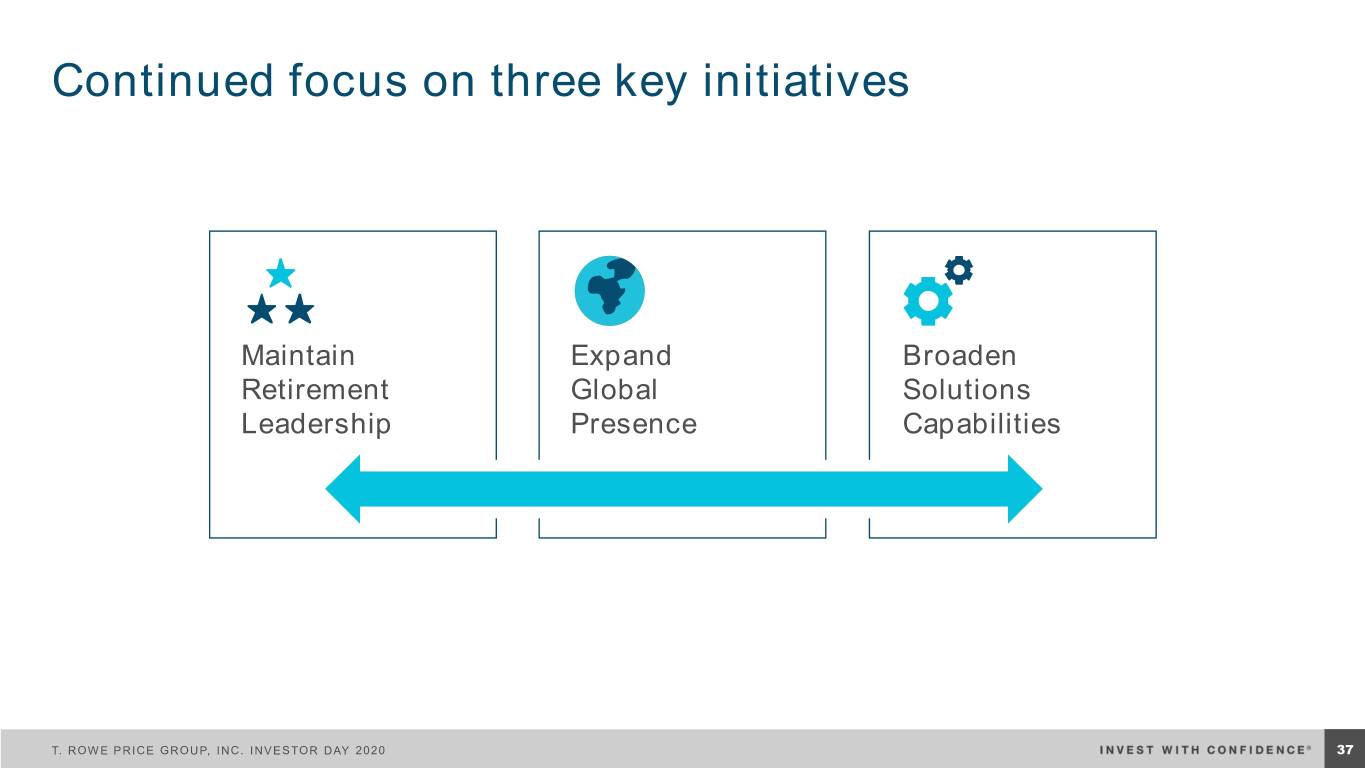
Continued focus on three key initiatives Maintain Expand Broaden Retirement Global Solutions Leadership Presence Capabilities T. ROWE PRICE GROUP, INC. INVESTOR DAY 2020 3837
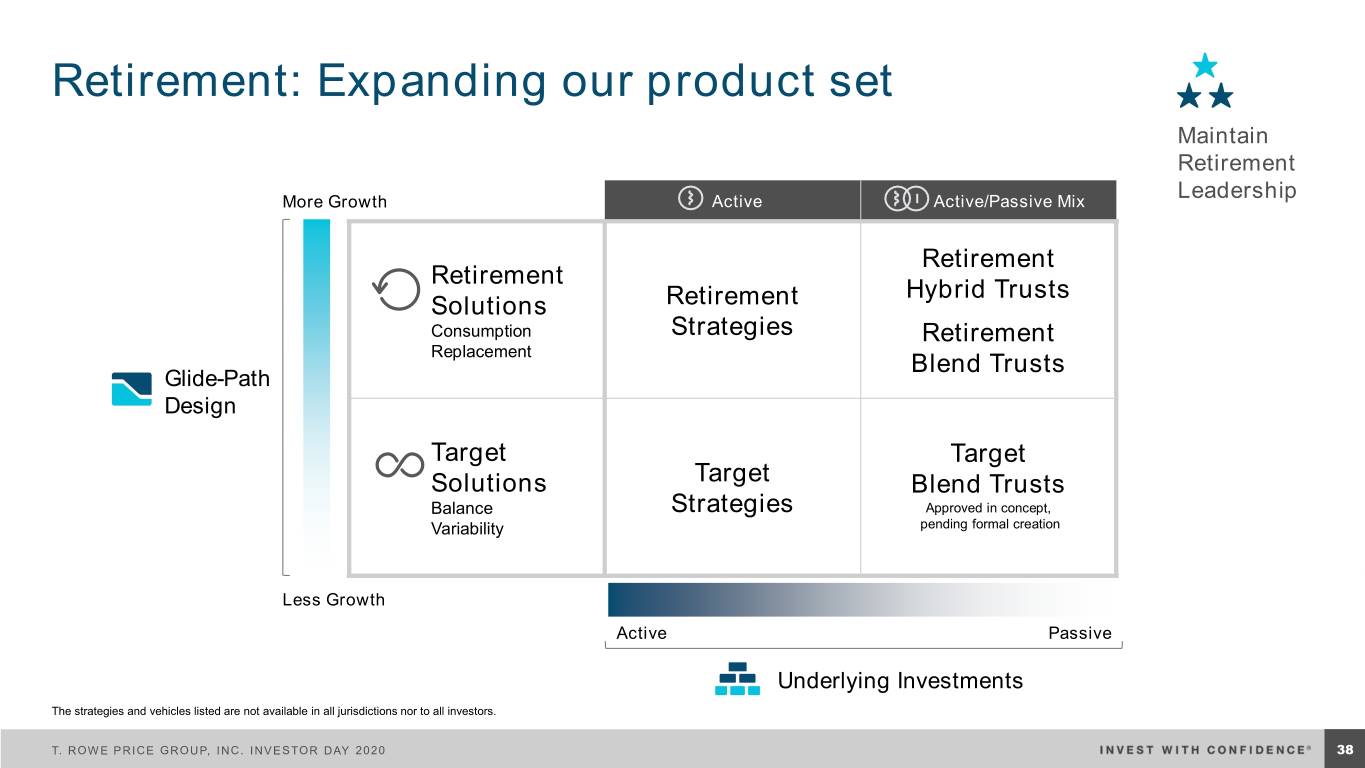
Retirement: Expanding our product set Maintain Retirement More Growth Active Active/Passive Mix Leadership Retirement Retirement Hybrid Trusts Solutions Retirement Consumption Strategies Retirement Replacement Blend Trusts Glide-Path Design Target Target Solutions Target Blend Trusts Balance Strategies Approved in concept, Variability pending formal creation Less Growth Active Passive Underlying Investments The strategies and vehicles listed are not available in all jurisdictions nor to all investors. T. ROWE PRICE GROUP, INC. INVESTOR DAY 2020 4138

Target date innovation continues Maintain As announced in our February 13 press release Retirement Leadership Adjusting our Adding investment Launching top-level glide paths components pricing T. ROWE PRICE GROUP, INC. INVESTOR DAY 2020 4239
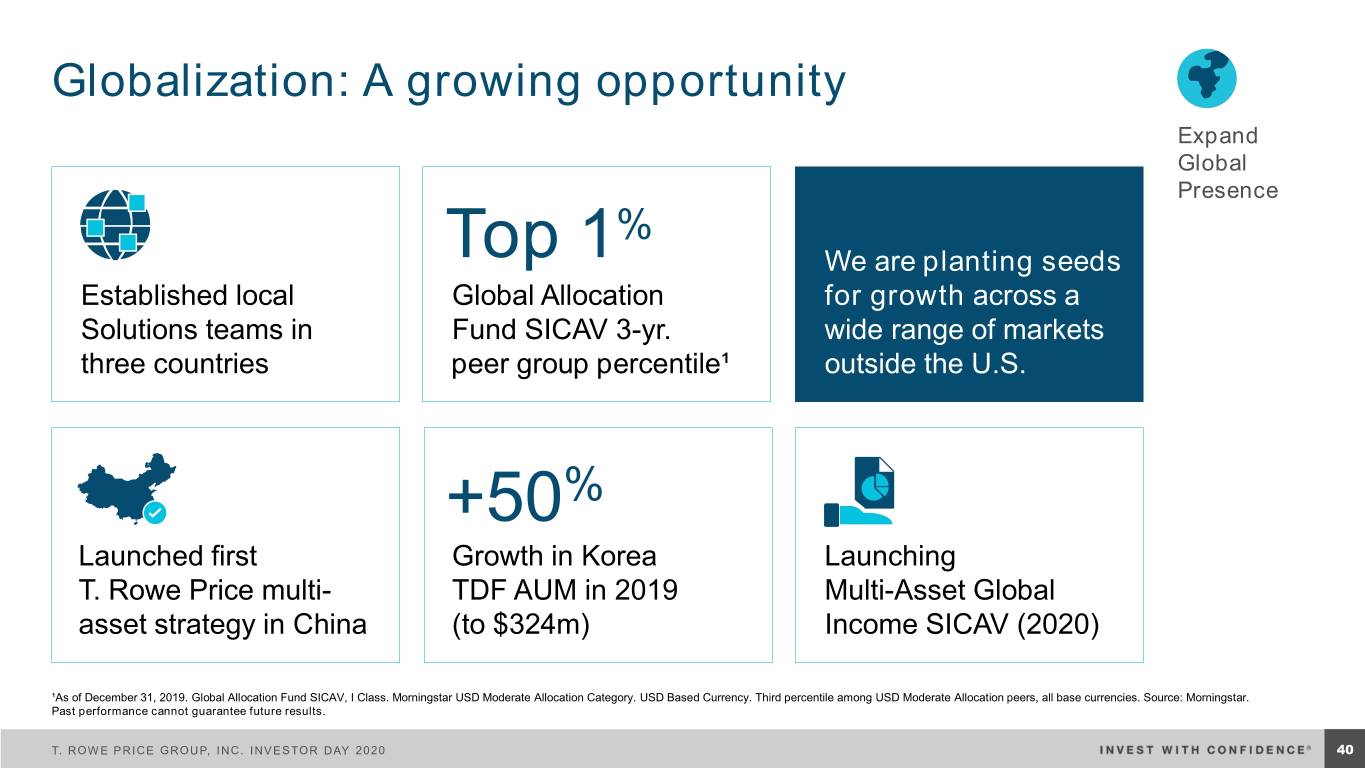
Globalization: A growing opportunity Expand Global Presence % Top 1 We are planting seeds Established local Global Allocation for growth across a Solutions teams in Fund SICAV 3-yr. wide range of markets three countries peer group percentile¹ outside the U.S. +50% Launched first Growth in Korea Launching T. Rowe Price multi- TDF AUM in 2019 Multi-Asset Global asset strategy in China (to $324m) Income SICAV (2020) ¹As of December 31, 2019. Global Allocation Fund SICAV, I Class. Morningstar USD Moderate Allocation Category. USD Based Currency. Third percentile among USD Moderate Allocation peers, all base currencies. Source: Morningstar. Past performance cannot guarantee future results. T. ROWE PRICE GROUP, INC. INVESTOR DAY 2020 4340

Solutions: Focusing on client needs Broaden Solutions Capabilities 1,500+ We are engaging Consultative client Increased flows with clients as a engagements in off-the-shelf trusted advisor across strategies channels and markets 450+ 35 Asset allocation New customized Revitalizing our studies delivered multi-asset Target Allocation strategies franchise (2020) Figures represent 2017–2019. T. ROWE PRICE GROUP, INC. INVESTOR DAY 2020 4441

Our platform is our competitive advantage Global Equities Fundamental Global U.S. International Global Equity Size and Style Sector Size and Style Emerging Markets Regional and Country ▪ Growth and Value ▪ Large-, Mid-, and Small-Cap ▪ Financial Services ▪ Growth, Core, and Value ▪ Diversified ▪ Europe ▪ Growth, Core, and Value ▪ Global Industrials ▪ Large- and Small-Cap Emerging Markets ▪ Japan Inflation-Sensitive ▪ Media and Telecom ▪ Europe ▪ Asia ex-Japan ▪ Natural Resources ▪ Global Real Estate Size and Style ▪ Asia ▪ Australia ▪ Real Estate ▪ Global Natural Resources (Developed Markets) ▪ Latin America ▪ Global Technology ▪ Large- and Small-Cap ▪ Frontier Markets ▪ Health Sciences ▪ Growth, Core, and Value ▪ Middle East and Africa ▪ Science and Technology Quantitative Global U.S. Size and Style Size and Style ▪ Value ▪ Global Equity Core ▪ Small-Cap Growth ▪ Low Volatility ▪ Small-Cap and Mid-Cap Core Global Fixed Income Corporate Municipal Core Short Duration High Yield Emerging Markets ▪ Global Investment-Grade Credit ▪ National ▪ U.S. ▪ Short Term ▪ U.S. High Yield ▪ Hard Currency Bonds ▪ U.S. Investment-Grade Credit ▪ State ▪ Global ▪ Ultra-Short Term ▪ European High Yield ▪ Local Currency Bonds ▪ Euro Investment-Grade Credit ▪ High Yield ▪ International ▪ Stable Value ▪ Floating Rate Loans ▪ Corporate Bonds ▪ Money Market Risk Mitigation Alternative Strategies ▪ Managed Volatility ▪ Multi-Strategy Total Return ▪ Long/Short Equity ▪ Equity Index-Option Strategies ▪ Unconstrained Fixed Income ▪ Macro and Absolute Return (MARS) ▪ Investments in Externally Managed Hedge Funds The strategies and capabilities listed are not available in all jurisdictions nor to all investors. T. ROWE PRICE GROUP, INC. INVESTOR DAY 2020 4542

Summary Demonstration Dedication to Pursuit of of leadership performance innovation T. ROWE PRICE GROUP, INC. INVESTOR DAY 2020 4643
Global Distribution Robert Higginbotham HEAD OF GLOBAL DISTRIBUTION AND PRODUCT T. ROWE PRICE GROUP, INC. INVESTOR DAY 2020
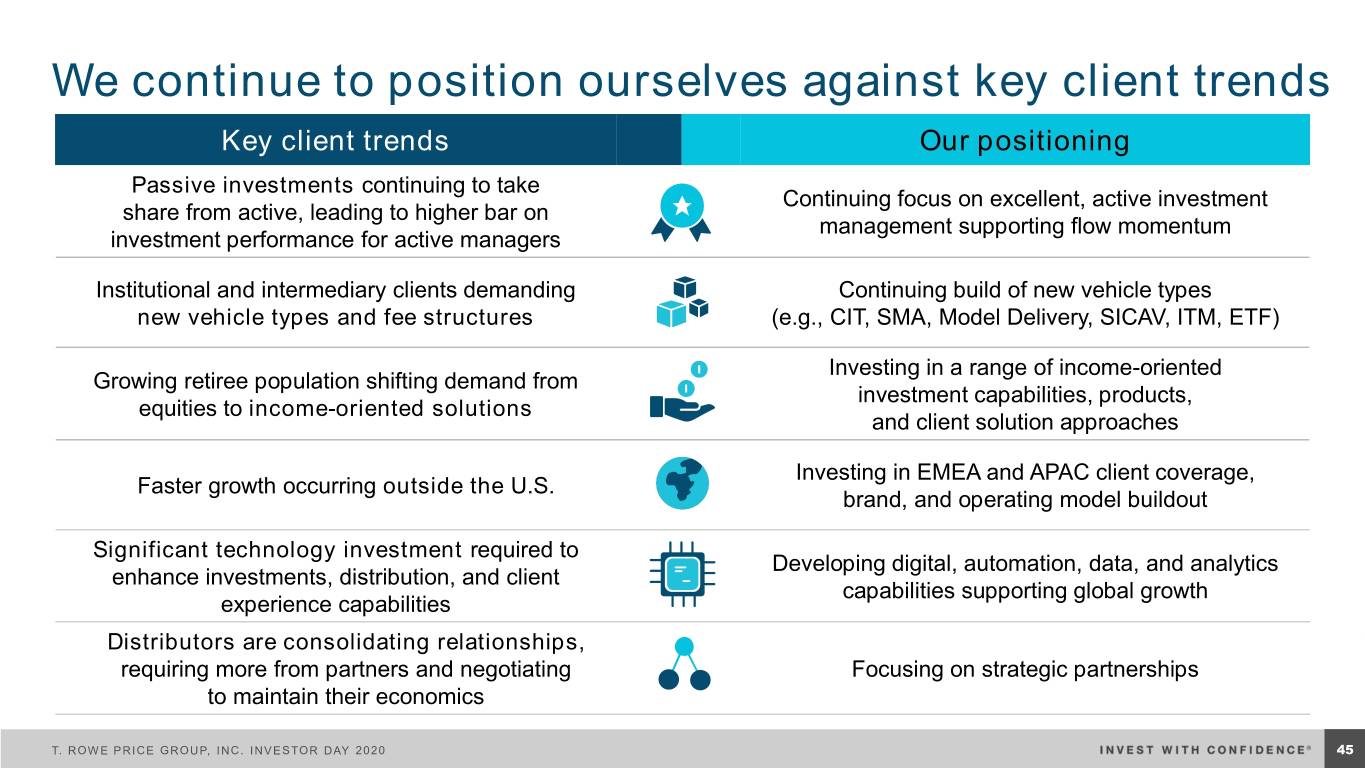
We continue to position ourselves against key client trends Key client trends Our positioning Passive investments continuing to take Continuing focus on excellent, active investment share from active, leading to higher bar on management supporting flow momentum investment performance for active managers Institutional and intermediary clients demanding Continuing build of new vehicle types new vehicle types and fee structures (e.g., CIT, SMA, Model Delivery, SICAV, ITM, ETF) Investing in a range of income-oriented Growing retiree population shifting demand from investment capabilities, products, equities to income-oriented solutions and client solution approaches Investing in EMEA and APAC client coverage, Faster growth occurring outside the U.S. brand, and operating model buildout Significant technology investment required to Developing digital, automation, data, and analytics enhance investments, distribution, and client capabilities supporting global growth experience capabilities Distributors are consolidating relationships, requiring more from partners and negotiating Focusing on strategic partnerships to maintain their economics T. ROWE PRICE GROUP, INC. INVESTOR DAY 2020 4845
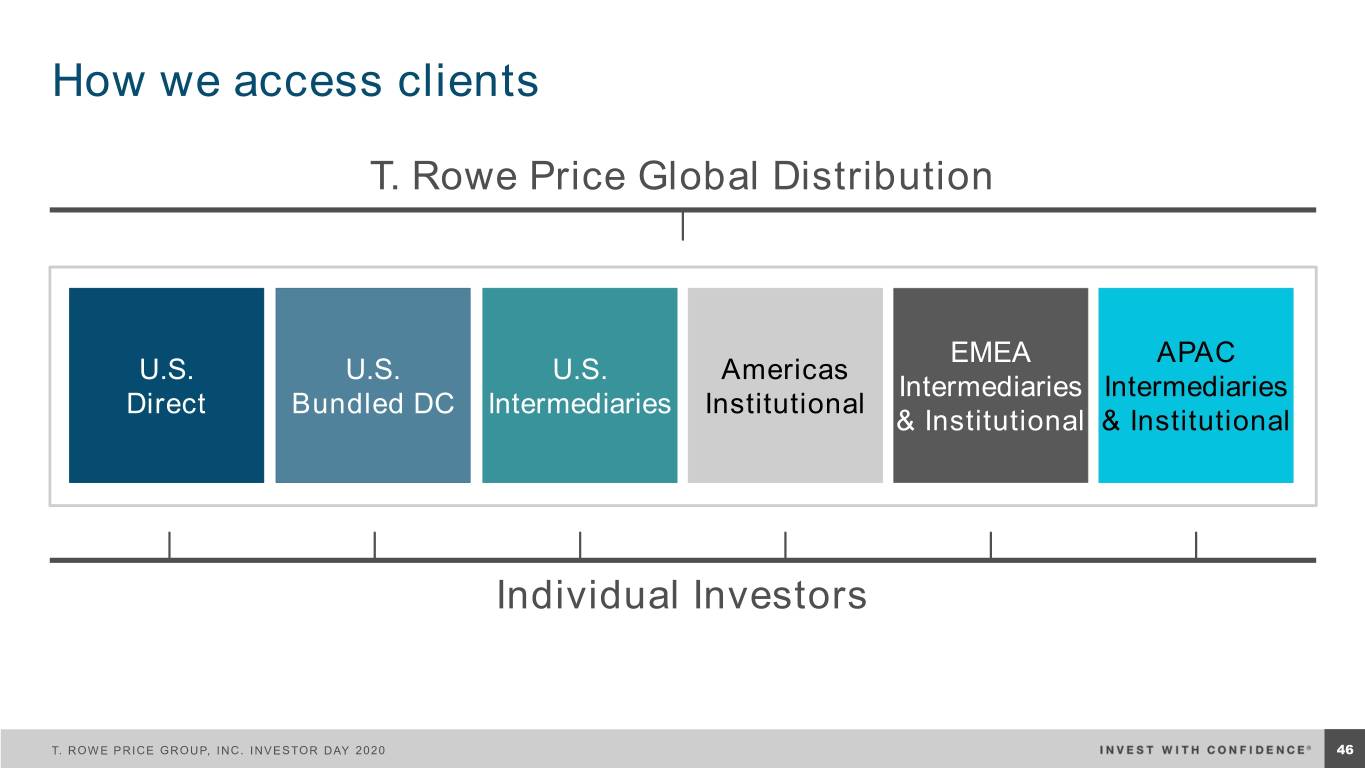
How we access clients T. Rowe Price Global Distribution EMEA APAC U.S. U.S. U.S. Americas Intermediaries Intermediaries Direct Bundled DC Intermediaries Institutional & Institutional & Institutional Individual Investors T. ROWE PRICE GROUP, INC. INVESTOR DAY 2020 4946
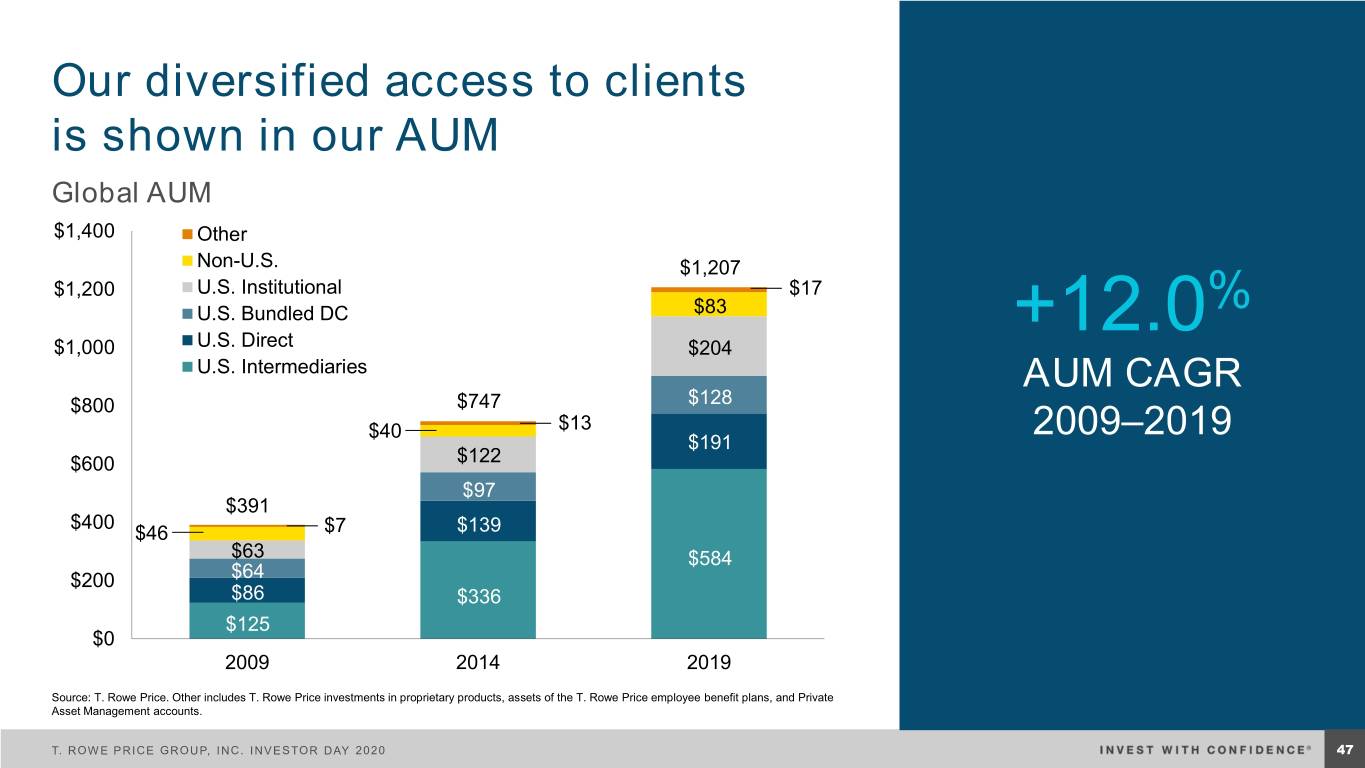
Our diversified access to clients is shown in our AUM Global AUM $1,400 Other Non-U.S. $1,207 $1,200 U.S. Institutional $17 $83 % U.S. Bundled DC +12.0 $1,000 U.S. Direct $204 U.S. Intermediaries AUM CAGR $800 $747 $128 $40 $13 2009–2019 $191 $600 $122 $97 $391 $400 $46 $7 $139 $63 $584 $200 $64 $86 $336 $125 $0 2009 2014 2019 Source: T. Rowe Price. Other includes T. Rowe Price investments in proprietary products, assets of the T. Rowe Price employee benefit plans, and Private Asset Management accounts. T. ROWE PRICE GROUP, INC. INVESTOR DAY 2020 5047
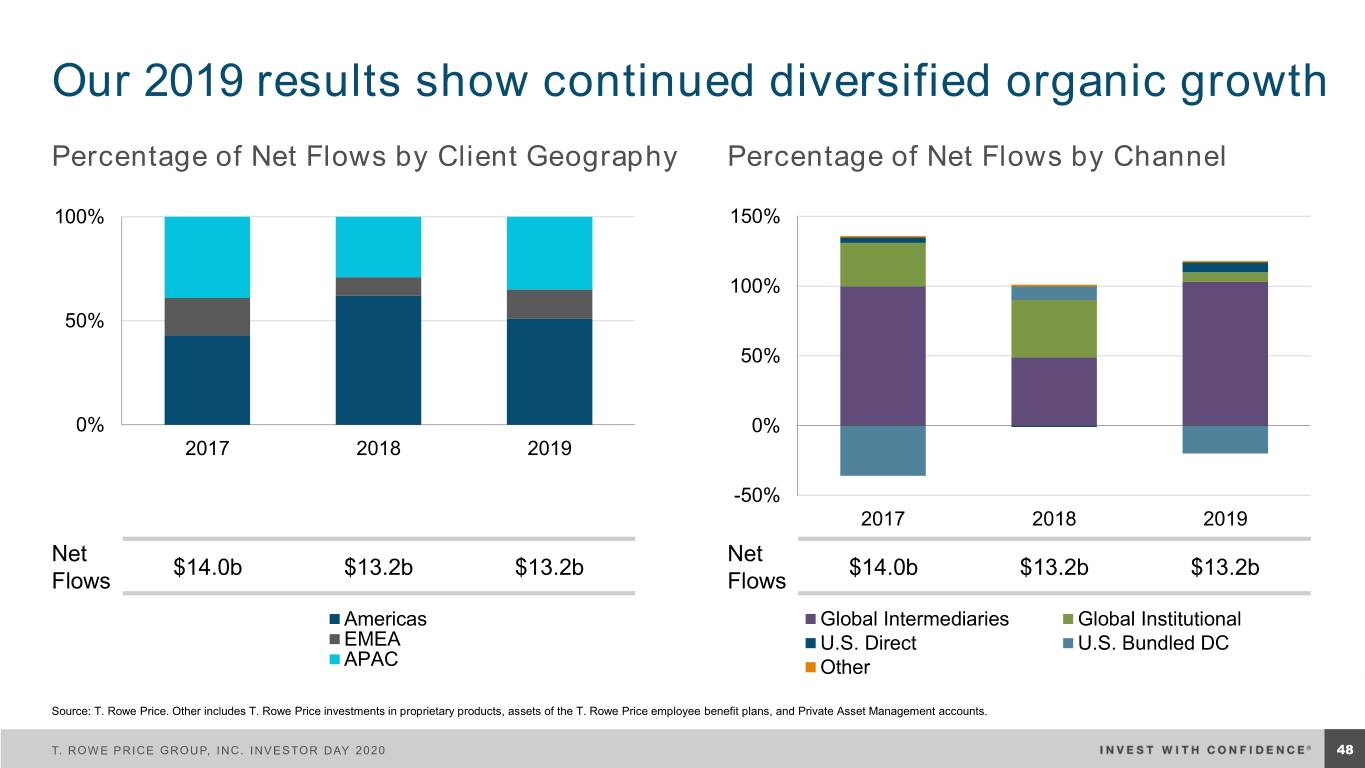
Our 2019 results show continued diversified organic growth Percentage of Net Flows by Client Geography Percentage of Net Flows by Channel 100% 150% 100% 50% 50% 0% 0% 2017 2018 2019 -50% 2017 2018 2019 Net Net $14.0b $13.2b $13.2b $14.0b $13.2b $13.2b Flows Flows Americas Global Intermediaries Global Institutional EMEA U.S. Direct U.S. Bundled DC APAC Other Source: T. Rowe Price. Other includes T. Rowe Price investments in proprietary products, assets of the T. Rowe Price employee benefit plans, and Private Asset Management accounts. T. ROWE PRICE GROUP, INC. INVESTOR DAY 2020 5148
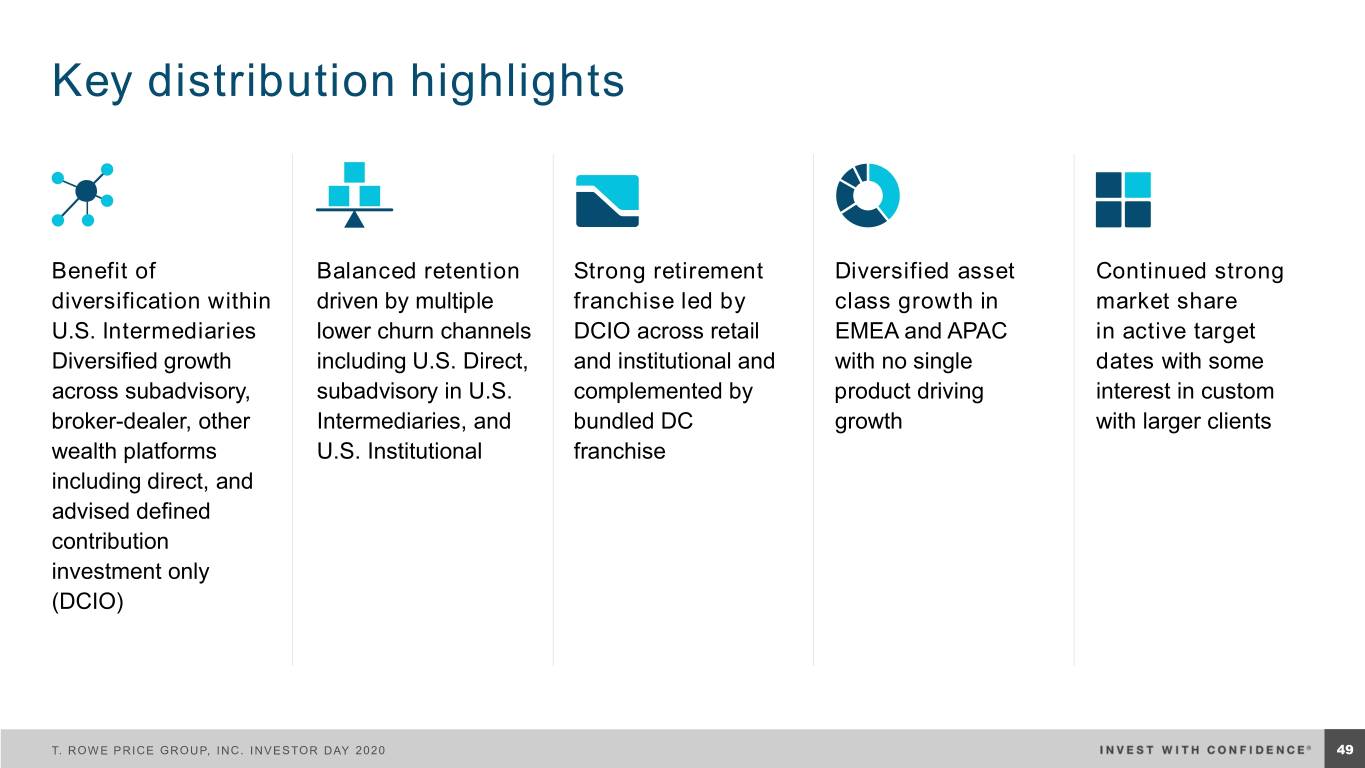
Key distribution highlights Benefit of Balanced retention Strong retirement Diversified asset Continued strong diversification within driven by multiple franchise led by class growth in market share U.S. Intermediaries lower churn channels DCIO across retail EMEA and APAC in active target Diversified growth including U.S. Direct, and institutional and with no single dates with some across subadvisory, subadvisory in U.S. complemented by product driving interest in custom broker-dealer, other Intermediaries, and bundled DC growth with larger clients wealth platforms U.S. Institutional franchise including direct, and advised defined contribution investment only (DCIO) T. ROWE PRICE GROUP, INC. INVESTOR DAY 2020 5249

A retirement leader in the U.S. Comprehensive U.S. retirement offering with complementary retirement channels and vehicles U.S. Americas U.S. U.S. Multiple Vehicles Intermediaries Institutional Direct Bundled DC U.S. mutual fund Broker- Collective Banks DB DC Mega Large dealer investment trust RIA Platform Corporate Public Medium Small Subadvised account DCIO VA Separate account #3 932k 2.25m #1 U.S. DC investment only provider1 Direct retail Retirement U.S. active target date retirement clients participants provider2 Note: Pensions & Investments rankings include total AUM active and passive. 1Pension & Investments. Ranking based on AUM. Data as of December 31, 2018. Most recent data available. 2Ranking based on actively managed TDF AUM. Investment News, 10 things to know about TDFs, March 9, 2019 edition. T. ROWE PRICE GROUP, INC. INVESTOR DAY 2020 5350
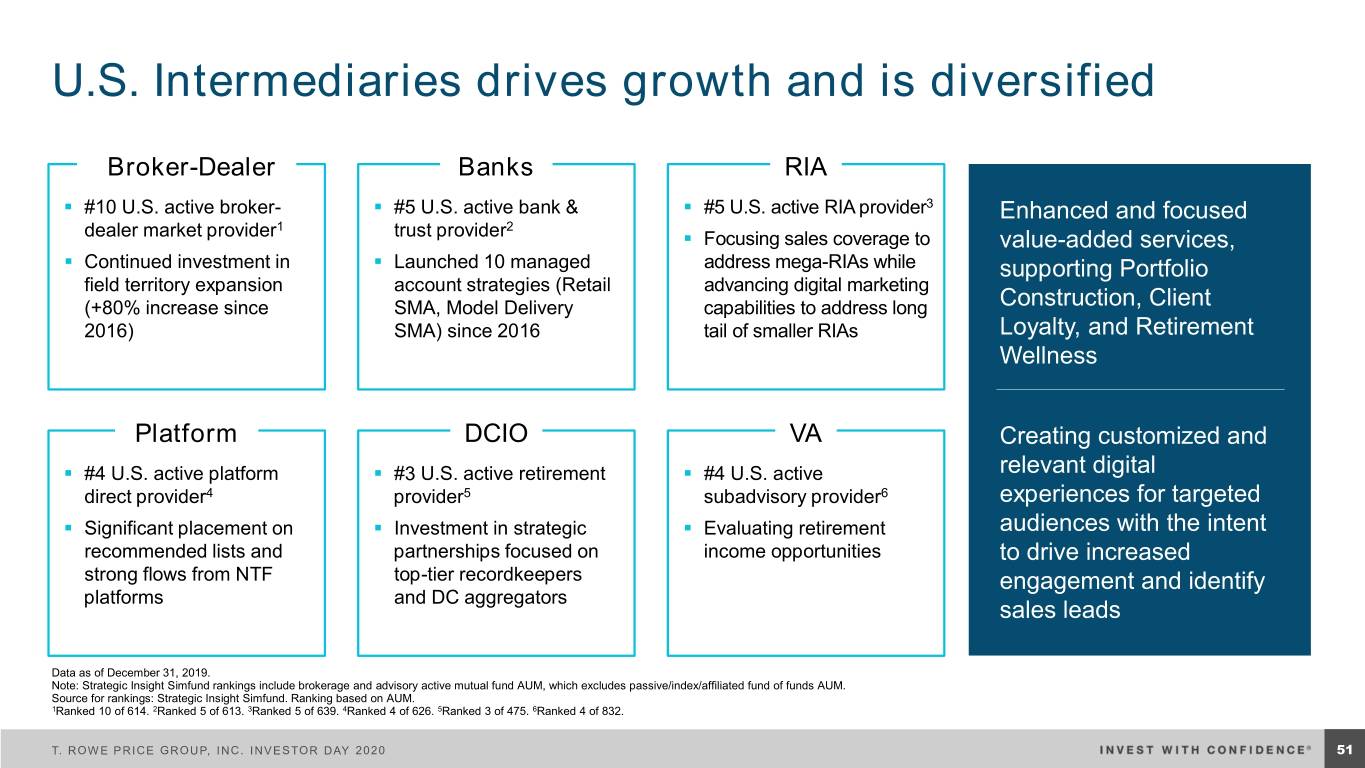
U.S. Intermediaries drives growth and is diversified Broker-Dealer Banks RIA ▪ #10 U.S. active broker- ▪ #5 U.S. active bank & ▪ #5 U.S. active RIA provider3 Enhanced and focused 1 2 dealer market provider trust provider ▪ Focusing sales coverage to value-added services, ▪ Continued investment in ▪ Launched 10 managed address mega-RIAs while supporting Portfolio field territory expansion account strategies (Retail advancing digital marketing (+80% increase since SMA, Model Delivery capabilities to address long Construction, Client 2016) SMA) since 2016 tail of smaller RIAs Loyalty, and Retirement Wellness Platform DCIO VA Creating customized and ▪ #4 U.S. active platform ▪ #3 U.S. active retirement ▪ #4 U.S. active relevant digital direct provider4 provider5 subadvisory provider6 experiences for targeted ▪ Significant placement on ▪ Investment in strategic ▪ Evaluating retirement audiences with the intent recommended lists and partnerships focused on income opportunities to drive increased strong flows from NTF top-tier recordkeepers engagement and identify platforms and DC aggregators sales leads Data as of December 31, 2019. Note: Strategic Insight Simfund rankings include brokerage and advisory active mutual fund AUM, which excludes passive/index/affiliated fund of funds AUM. Source for rankings: Strategic Insight Simfund. Ranking based on AUM. 1Ranked 10 of 614. 2Ranked 5 of 613. 3Ranked 5 of 639. 4Ranked 4 of 626. 5Ranked 3 of 475. 6Ranked 4 of 832. T. ROWE PRICE GROUP, INC. INVESTOR DAY 2020 5451
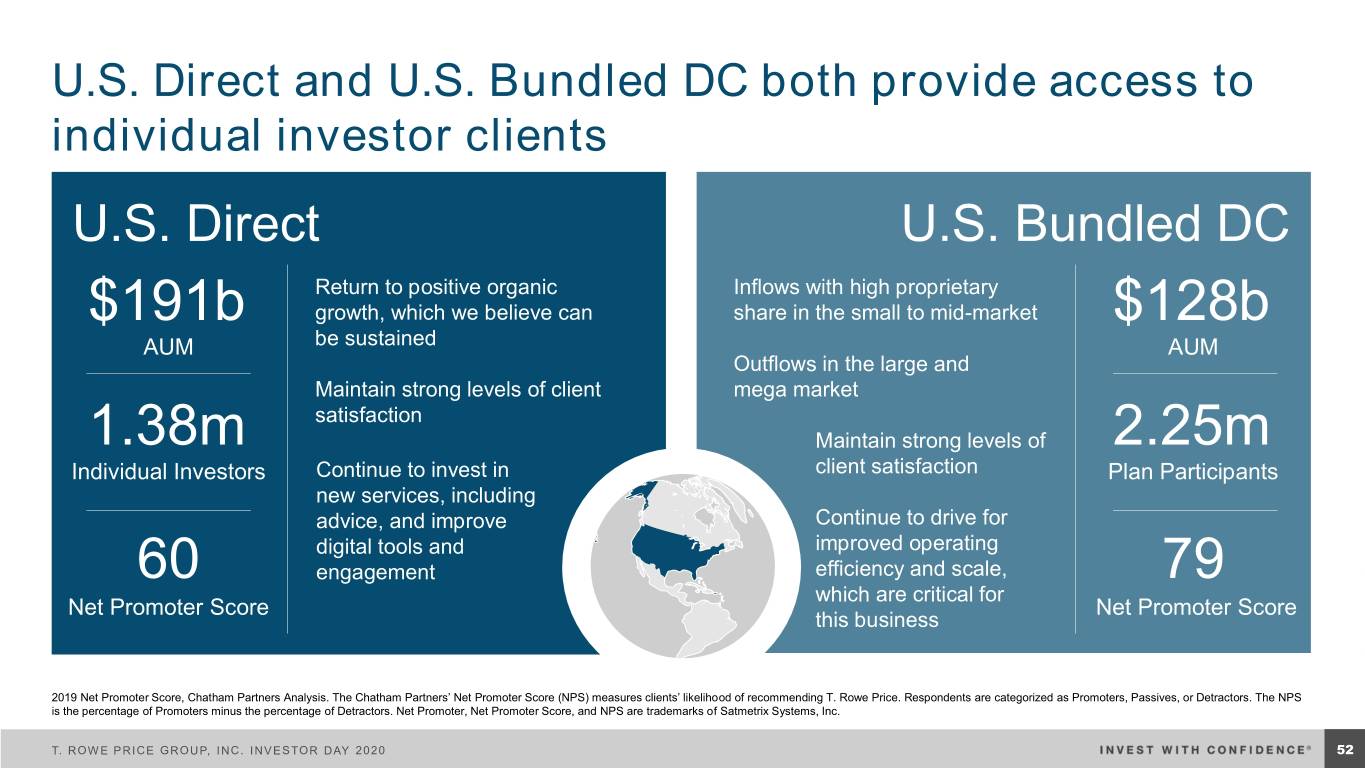
U.S. Direct and U.S. Bundled DC both provide access to individual investor clients U.S. Direct U.S. Bundled DC Return to positive organic Inflows with high proprietary $191b growth, which we believe can share in the small to mid-market $128b AUM be sustained AUM Outflows in the large and Maintain strong levels of client mega market satisfaction 1.38m Maintain strong levels of 2.25m Individual Investors Continue to invest in client satisfaction Plan Participants new services, including advice, and improve Continue to drive for digital tools and improved operating 60 engagement efficiency and scale, 79 which are critical for Net Promoter Score Net Promoter Score this business 2019 Net Promoter Score, Chatham Partners Analysis. The Chatham Partners’ Net Promoter Score (NPS) measures clients’ likelihood of recommending T. Rowe Price. Respondents are categorized as Promoters, Passives, or Detractors. The NPS is the percentage of Promoters minus the percentage of Detractors. Net Promoter, Net Promoter Score, and NPS are trademarks of Satmetrix Systems, Inc. T. ROWE PRICE GROUP, INC. INVESTOR DAY 2020 5552

We are seeing returns on our investment in EMEA and APAC EMEA APAC % Regrown a more diversified Saw strong sales and flows % 7.1 business with our new markets momentum, largely driven by 21.3 Organic growth1 all making strong contributions the Japanese ITMs Organic growth1 Defined a more focused strategy Expanded global consultant % in UK, Italy, and Germany relations team with further % 12.1 dedicated APAC coverage 13.5 Increase in Broad local product Increase in headcount2 range with strong Continue build of headcount2 seed capital support marketing team and further invest in brand % Increasing brand % 40 penetration 20 Improvement in Improvement in brand ranking3 brand ranking3 1Organic growth is calculated as 2019 net new flows divided by December 31, 2018 AUM. 2Increase in headcount from 2018 to 2019. 3NMG Consulting Annual Global Brand and Marketing Study for Asset Managers; increase represents change in brand awareness ranking within EMEA and APAC advisor segments from 2017–2018. Most recent data available and used with permission. © NMG Group 2019. T. ROWE PRICE GROUP, INC. INVESTOR DAY 2020 5653
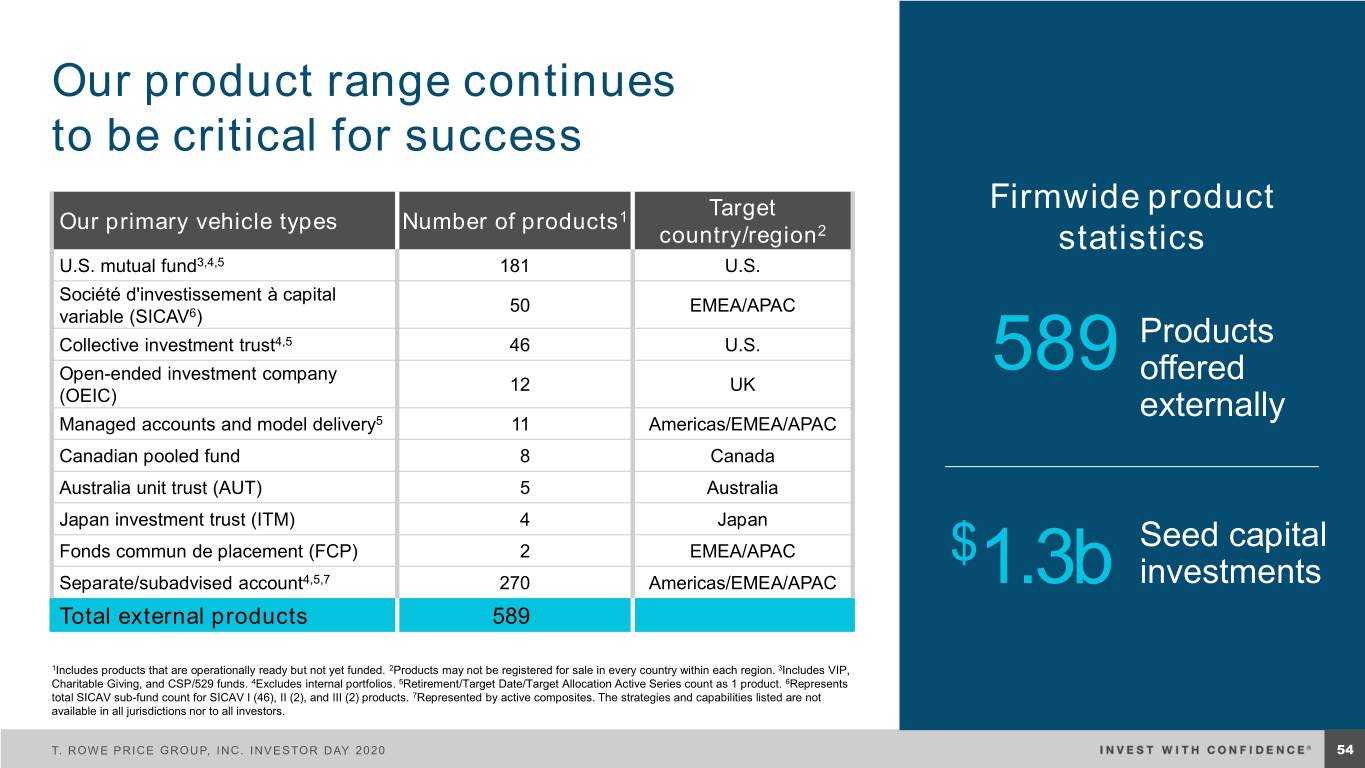
Our product range continues to be critical for success Target Firmwide product Our primary vehicle types Number of products1 country/region2 statistics U.S. mutual fund3,4,5 181 U.S. Société d'investissement à capital 50 EMEA/APAC variable (SICAV6) Collective investment trust4,5 46 U.S. Products Open-ended investment company 589 12 UK offered (OEIC) externally Managed accounts and model delivery5 11 Americas/EMEA/APAC Canadian pooled fund 8 Canada Australia unit trust (AUT) 5 Australia Japan investment trust (ITM) 4 Japan Seed capital Fonds commun de placement (FCP) 2 EMEA/APAC $ Separate/subadvised account4,5,7 270 Americas/EMEA/APAC 1.3b investments Total external products 589 1Includes products that are operationally ready but not yet funded. 2Products may not be registered for sale in every country within each region. 3Includes VIP, Charitable Giving, and CSP/529 funds. 4Excludes internal portfolios. 5Retirement/Target Date/Target Allocation Active Series count as 1 product. 6Represents total SICAV sub-fund count for SICAV I (46), II (2), and III (2) products. 7Represented by active composites. The strategies and capabilities listed are not available in all jurisdictions nor to all investors. T. ROWE PRICE GROUP, INC. INVESTOR DAY 2020 5754

Summary Well positioned Scale is a Continued focus on against key global Strong, sustainable, competitive putting clients first demand pools diversified growth advantage T. ROWE PRICE GROUP, INC. INVESTOR DAY 2020 5855
Financial Overview Céline Dufétel CHIEF FINANCIAL OFFICER T. ROWE PRICE GROUP, INC. INVESTOR DAY 2020

Creating value for stockholders over time Organic AUM Growth Operating Margin1 Return of Capital2 1 year 1 year 1 year 1.4% 44.0% 68% 5 year 5 year 5 years (average) (average) (cumulative) 0.9% 43.6% 95% Driving sustainable, Maintaining a strong Consistently returning diversified, and profitable operating margin while capital to stockholders organic growth investing for the long term over time 1Non-GAAP. See the reconciliation between GAAP operating margin and non-GAAP operating margin in the Appendix. See the firm’s 2019 Annual Report on Form 10-K for further information. 2Figures represent percent of U.S. GAAP net income attributable to T. Rowe Price Group, Inc., returned to stockholders. T. ROWE PRICE GROUP, INC. INVESTOR DAY 2020 6057

Driving organic AUM growth Net flows as a percent of prior year’s ending AUM 3% 2% 1.7% % Targeting 1.3% 1.4 sustainable, 1% diversified, and 0.2% profitable organic % % 0% growth of 1 –3 per year (0.4)% -1% 2015 2016 2017 2018 2019 Net $1.6b ($2.8b) $14.0b $13.2b $13.2b flows Source: T. Rowe Price. T. ROWE PRICE GROUP, INC. INVESTOR DAY 2020 6158
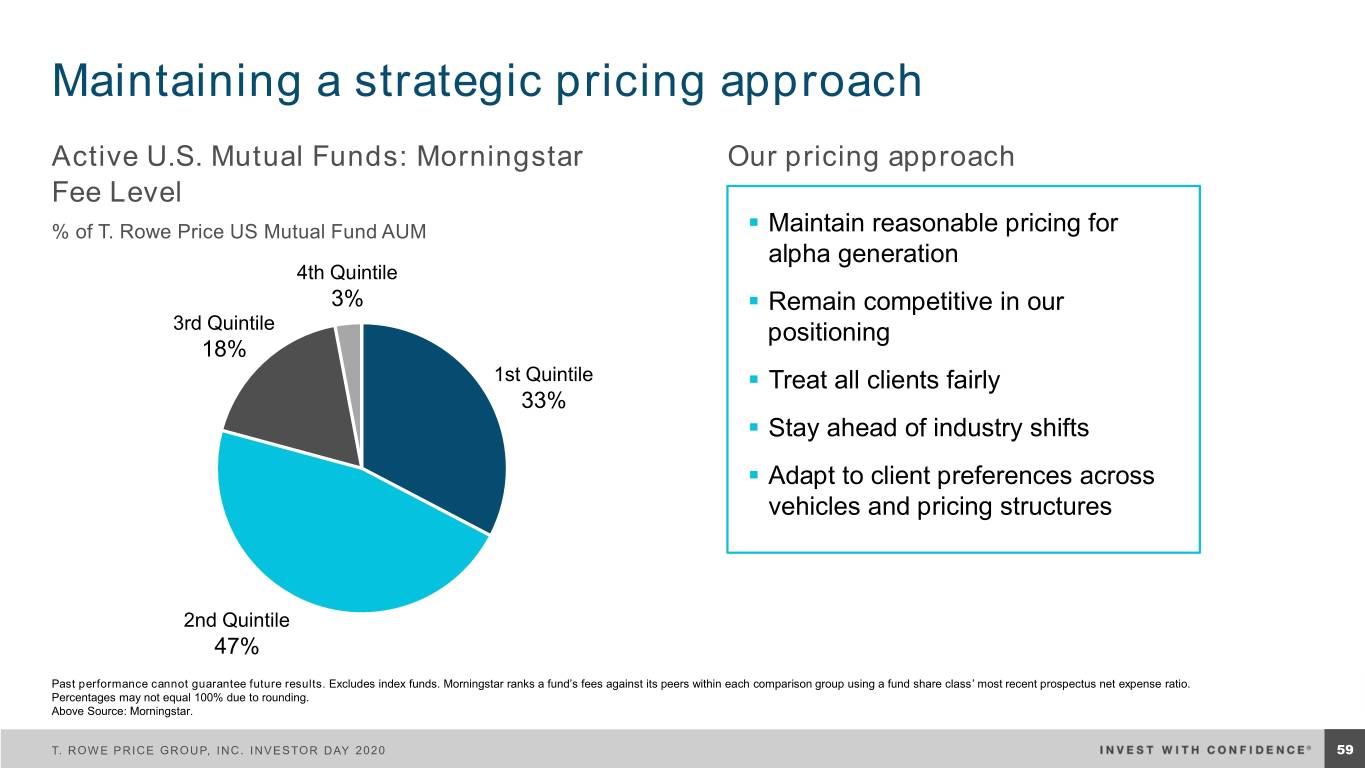
Maintaining a strategic pricing approach Active U.S. Mutual Funds: Morningstar Our pricing approach Fee Level % of T. Rowe Price US Mutual Fund AUM ▪ Maintain reasonable pricing for alpha generation 4th Quintile 3% ▪ Remain competitive in our 3rd Quintile positioning 18% 1st Quintile ▪ Treat all clients fairly 33% ▪ Stay ahead of industry shifts ▪ Adapt to client preferences across vehicles and pricing structures 2nd Quintile 47% Past performance cannot guarantee future results. Excludes index funds. Morningstar ranks a fund’s fees against its peers within each comparison group using a fund share class’ most recent prospectus net expense ratio. Percentages may not equal 100% due to rounding. Above Source: Morningstar. T. ROWE PRICE GROUP, INC. INVESTOR DAY 2020 6259

Offering vehicles and pricing structures that are mutually beneficial to our clients and us CITs ETFs TDF Restructure ▪ Tiered pricing based on ▪ Similar advisory fee as ▪ 2-7 bps lower total client scale equivalent mutual fund expense ratio for the Retirement Date Fund ▪ No AFP or 12b-1 ▪ Lower operating I series1 expenses leading to a lower total expense ratio ▪ A more predictable fixed fee, independent of ▪ Increased tax efficiency building blocks or asset allocation changes Evolving with client needs and preferences 1The TDF restructure also included the lowering of total expense ratios for some of the I Class, Investor Class and Advisor Class of the Target Date Funds and the Investor Class of the Retirement Income 2020 Fund. Pricing comparison versus total expense ratio noted in the 2019 semi-annual report. T. ROWE PRICE GROUP, INC. INVESTOR DAY 2020 6360

Investing for the long term Non-GAAP operating expense growth1 8.9% 6%–9% 4.1% 2018 2019 2020 1See the reconciliation between 2019 and 2018 GAAP operating expenses and non-GAAP operating expenses in the Appendix. See the firm’s 2019 Annual Report on Form 10-K for further information. T. ROWE PRICE GROUP, INC. INVESTOR DAY 2020 6461
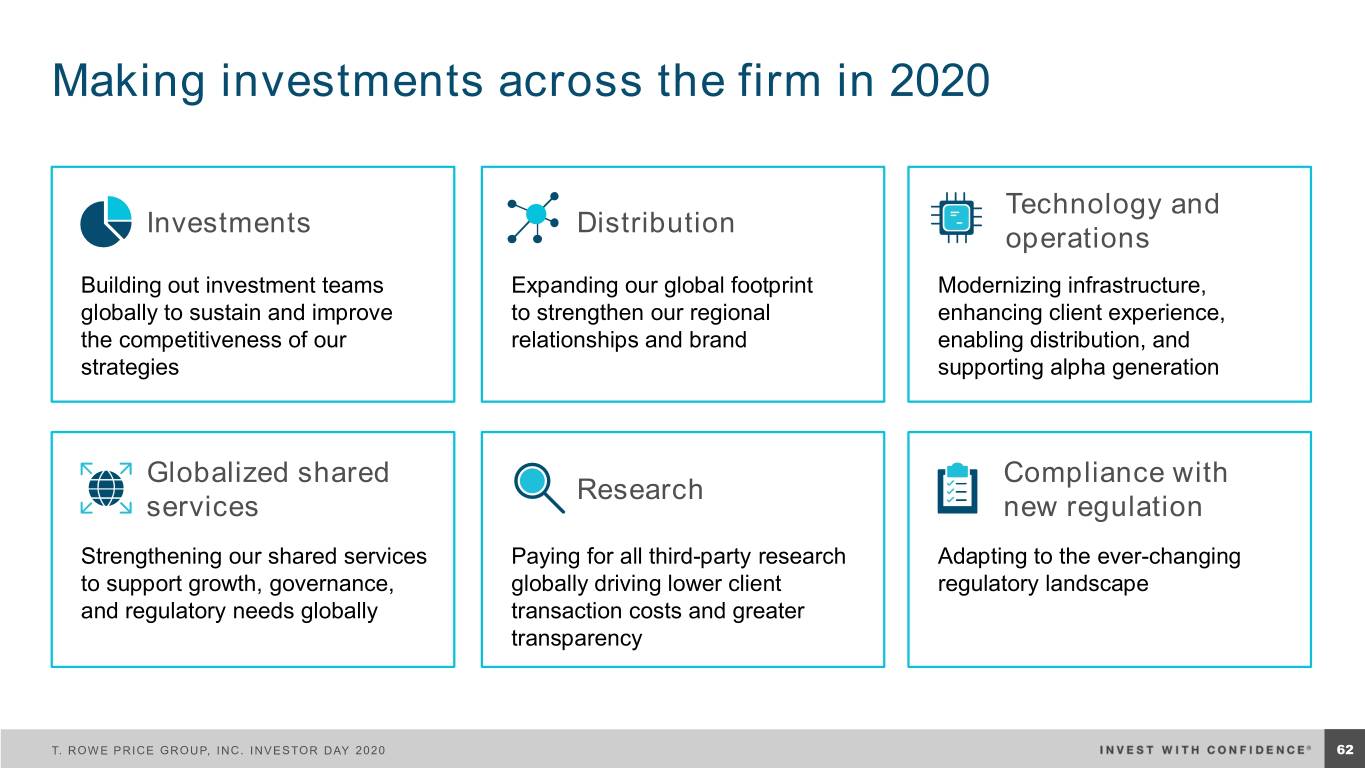
Making investments across the firm in 2020 Technology and Investments Distribution operations Building out investment teams Expanding our global footprint Modernizing infrastructure, globally to sustain and improve to strengthen our regional enhancing client experience, the competitiveness of our relationships and brand enabling distribution, and strategies supporting alpha generation Globalized shared Compliance with Research services new regulation Strengthening our shared services Paying for all third-party research Adapting to the ever-changing to support growth, governance, globally driving lower client regulatory landscape and regulatory needs globally transaction costs and greater transparency T. ROWE PRICE GROUP, INC. INVESTOR DAY 2020 6562

Modernizing our technology over multiple years 2016–2018 2019–2021 ▪ Equity data insights support ▪ Fund accounting and trade management ▪ Middle office outsourcing Front and outsourcing ▪ Derivatives enablement Middle Office ▪ Core data distribution architecture ▪ Fixed income modernization ▪ Marketing life-cycle and analytics integration Distribution and ▪ Digital enablement and client journeys ▪ Deeper client analytics Client Facing ▪ Transaction systems simplification ▪ Client experience personalization ▪ Automation of client processes ▪ Storage optimization ▪ Native cloud deployments Infrastructure ▪ Initial cloud adoption ▪ Application decommissioning T. ROWE PRICE GROUP, INC. INVESTOR DAY 2020 6663

Driving efficiencies for reinvestment Procured services Client digitization Disciplined three-year management and automation strategic and financial ▪ Renegotiations with top vendors ▪ Digitization of client interactions planning ▪ Vendor consolidation ▪ Transaction processing automation ▪ Demand management ▪ Capacity management Strong budget discipline and accountability Technology cost Middle and back optimization office modernization ▪ Storage optimization ▪ Fund accounting and middle office Mindset of reassessment outsourcing ▪ Application decommissioning and redeployment ▪ Modernization of performance ▪ Hyper-converged infrastructure systems, investment compliance, and client reporting processes T. ROWE PRICE GROUP, INC. INVESTOR DAY 2020 6764
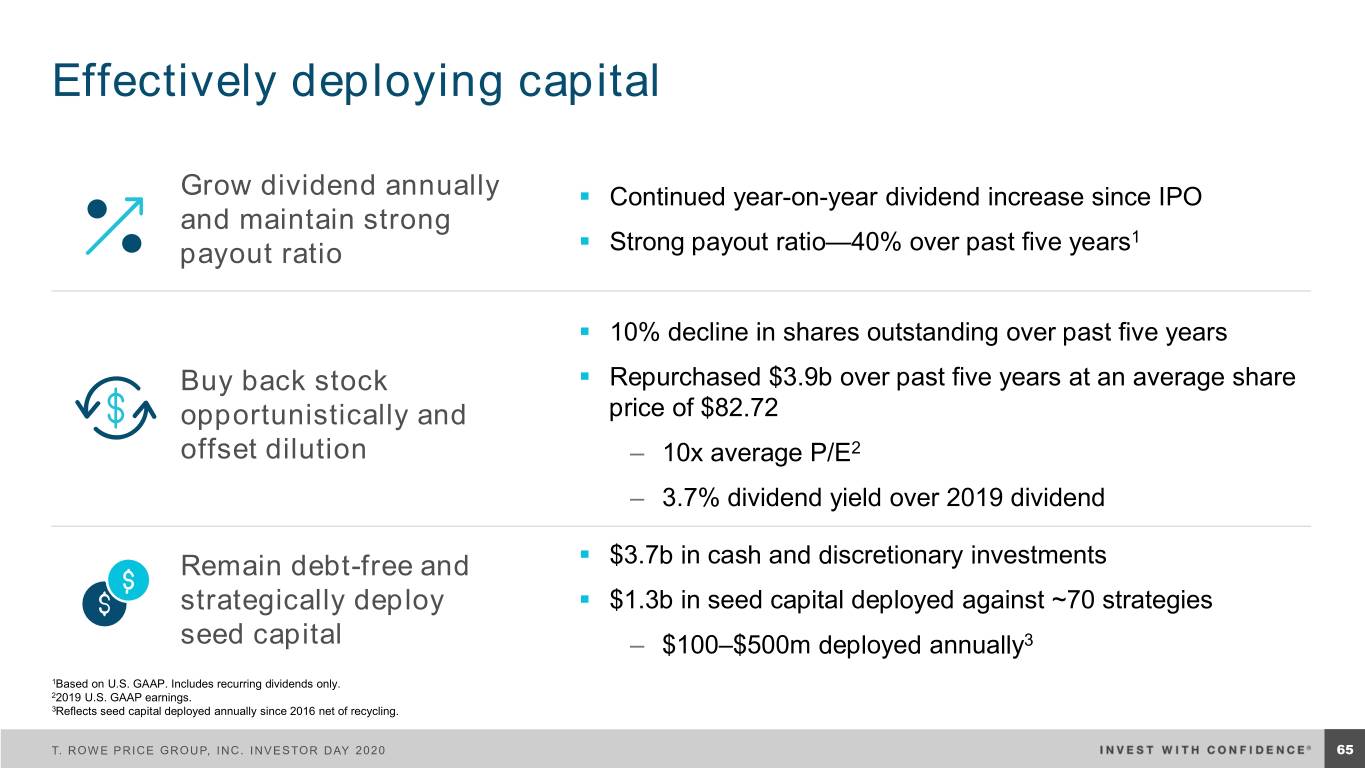
Effectively deploying capital Grow dividend annually ▪ Continued year-on-year dividend increase since IPO and maintain strong 1 payout ratio ▪ Strong payout ratio—40% over past five years ▪ 10% decline in shares outstanding over past five years Buy back stock ▪ Repurchased $3.9b over past five years at an average share opportunistically and price of $82.72 offset dilution ‒ 10x average P/E2 ‒ 3.7% dividend yield over 2019 dividend Remain debt-free and ▪ $3.7b in cash and discretionary investments strategically deploy ▪ $1.3b in seed capital deployed against ~70 strategies seed capital ‒ $100–$500m deployed annually3 1Based on U.S. GAAP. Includes recurring dividends only. 22019 U.S. GAAP earnings. 3Reflects seed capital deployed annually since 2016 net of recycling. T. ROWE PRICE GROUP, INC. INVESTOR DAY 2020 6865
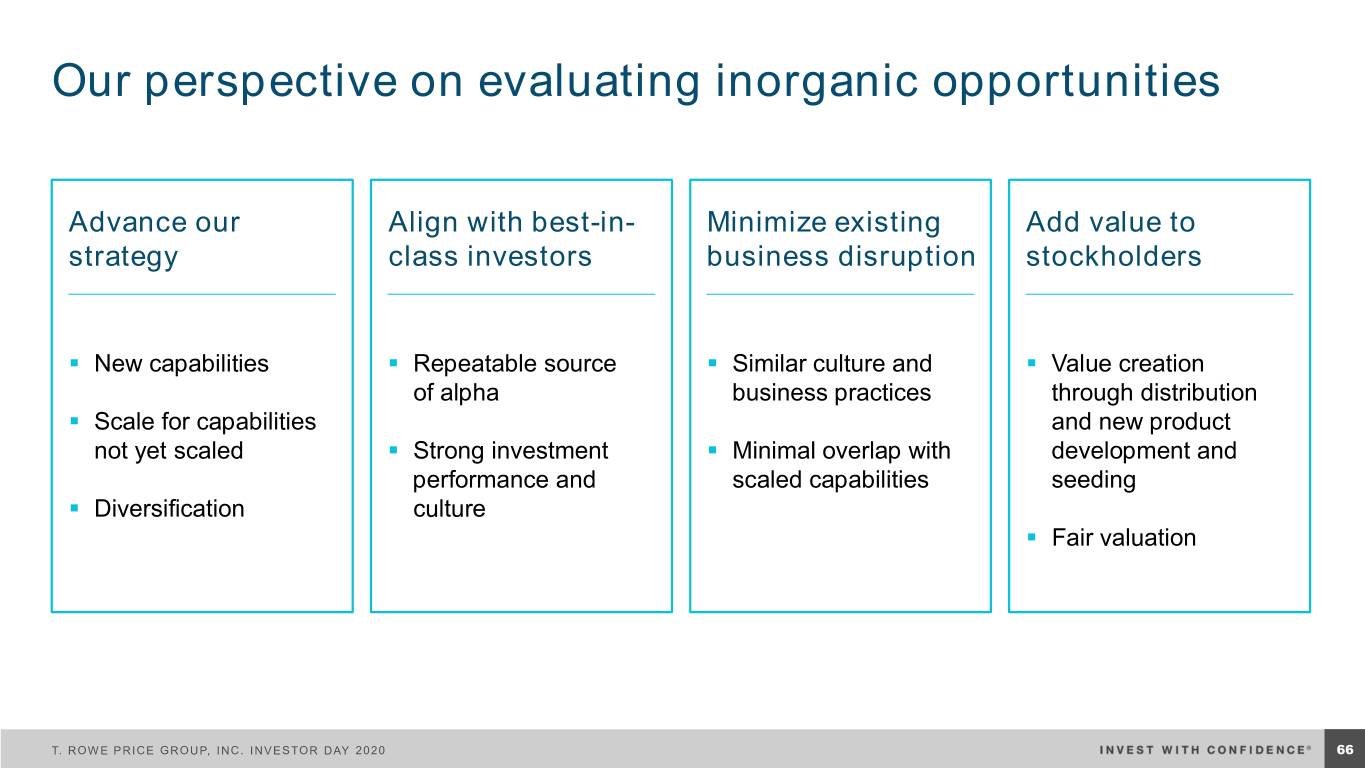
Our perspective on evaluating inorganic opportunities Advance our Align with best-in- Minimize existing Add value to strategy class investors business disruption stockholders ▪ New capabilities ▪ Repeatable source ▪ Similar culture and ▪ Value creation of alpha business practices through distribution ▪ Scale for capabilities and new product not yet scaled ▪ Strong investment ▪ Minimal overlap with development and performance and scaled capabilities seeding ▪ Diversification culture ▪ Fair valuation T. ROWE PRICE GROUP, INC. INVESTOR DAY 2020 6966

Summary: Clear objectives to measure our success Driving 1%–3% organic growth Maintaining a strong Consistently across diversified, operating margin returning capital profitable, and while investing for to stockholders sustainable sources long-term growth over time T. ROWE PRICE GROUP, INC. INVESTOR DAY 2020 7067

Closing thoughts Pleased Strong Board Investing to Attractive, Consistent, with 2019 and senior grow and resilient disciplined progress leaders with diversify business capital focused over the long model with return business term talented, plans engaged associates T. ROWE PRICE GROUP, INC. INVESTOR DAY 2020 7168

Appendix T. ROWE PRICE GROUP, INC. INVESTOR DAY 2020

Non-GAAP operating income and net revenues reconciliation 2019 2018 2017 2016 2015 Net Revenues, GAAP basis $5,617.9 $5,372.6 $4,854.9 $4,284.8 $4,200.6 Non-GAAP adjustments: Consolidated Investment Products 6.8 6.2 5.6 6.5 - Net Revenues, Non-GAAP basis $5,624.7 $5,378.8 $4,860.5 $4,291.3 $4,200.6 Operating Expenses, GAAP basis $3,230.9 $3,011.2 $2,746.1 $2,551.4 $2,301.7 Non-GAAP adjustments: Consolidated Investment Products (7.9) (6.5) (6.7) (6.5) - Supplemental Savings Plan Liability (73.2) 5.6 (11.7) - - Nonrecurring Dell 15.2 50.0 (66.2) - Operating Expenses, Non-GAAP basis $3,149.8 $3,025.5 $2,777.7 $2,478.7 $2,301.7 Operating Income, GAAP basis $2,387.0 $2,361.4 $2,108.8 $1,733.4 $1,898.9 Non-GAAP adjustments: Consolidated Investment Products 14.7 12.7 12.3 13.0 - Supplemental Savings Plan Liability 73.2 (5.6) 11.7 - - Nonrecurring Dell (15.2) (50.0) 66.2 - Operating Income, Non-GAAP basis $2,474.9 $2,353.3 $2,082.8 $1,812.6 $1,898.9 Operating Margin, GAAP basis1 42.5% 44.0% 43.4% 40.5% 45.2% Operating Margin, as adjusted1 44.0% 43.8% 42.9% 42.2% 45.2% 1Operating margin is equal to operating income divided by net revenues. T. ROWE PRICE GROUP, INC. INVESTOR DAY 2020 7370

Additional information Scaling outperforming, high-capacity strategies globally (p. 28) Investment strategy eVestment Universe # of Peers US Dividend Growth Equity US Large Cap Core Equity 913 U.S. Equity Emerging Markets Discovery Equity Global Emerging Mkts All Cap Value Equity 78 Global Focused Growth Equity Global All Cap Growth Equity 163 Global Growth Equity Global Large Cap Growth Equity 187 Equity International Disciplined Equity EAFE All Cap Core Equity 119 International Japan Equity Japan All Cap Growth Equity 85 Emerging Markets Corporate Bond Global Emerging Mkts Fixed Income - Corporate Debt 118 Global Multi-Sector Bond Global Multi-Sector Fixed Income 62 Global High Income Bond Global High Yield Fixed Income 142 Income U.S. High Yield US High Yield Fixed Income 418 Global Fixed U.S. Ultra Short-Term Bond US Enhanced Cash Management 166 - Global Allocation Strategy Global Tactical Asset Allocation 433 Multi Asset Source: eVestment Alliance, LLC. As of December 31, 2019. T. ROWE PRICE GROUP, INC. INVESTOR DAY 2020 7471
Important information This material, including any statements, information, data and content contained within it and any materials, information, images, links, graphics or recordings provided in conjunction with this material are being furnished by T. Rowe Price for general informational purposes only. Under no circumstances should the material, in whole or part, be copied or distributed without consent from T. Rowe Price. The views contained herein are as of the date of the presentation. The information and data obtained from third-party sources which is contained in the report were obtained from the sources deemed reliable; however, its accuracy and completeness is not guaranteed. The products and services discussed in this presentation are available via subsidiaries of T. Rowe Price Group as authorized in countries throughout the world. The products and services are not available to all investors or in all countries. Visit troweprice.com to learn more about the products and services available in your country and the T. Rowe Price Group subsidiary which is authorized to provide them. The material is not intended for use by persons in jurisdictions which prohibit or restrict the distribution of the material and in certain countries the material is provided upon specific request. The material does not constitute a distribution, offer, invitation, recommendation or solicitation to sell or buy any securities in any jurisdiction. The material has not been reviewed by any regulatory authority in any jurisdiction. The material does not constitute advice of any nature, and prospective investors are recommended to seek independent legal, financial, and tax advice before making any investment decision. The “S&P 500 Index” and the “S&P Target Date Indices” are products of S&P Dow Jones Indices LLC, a division of S&P Global, or its affiliates (“SPDJI”), and has been licensed for use by T. Rowe Price. Standard & Poor’s® and S&P® are registered trademarks of Standard & Poor’s Financial Services LLC, a division of S&P Global (“S&P”); Dow Jones® is a registered trademark of Dow Jones Trademark Holdings LLC (“Dow Jones”). T. Rowe Price’s product is not sponsored, endorsed, sold or promoted by SPDJI, Dow Jones, S&P or their respective affiliates, and none of such parties make any representation regarding the advisability of investing in such product nor do they have any liability for any errors, omissions, or interruptions of the “S&P 500 Index” and the “S&P Target Date Indices”. Copyright © 2020, S&P Global Market Intelligence (and its affiliates, as applicable). Reproduction of any information, data or material, including ratings (“Content”) in any form is prohibited except with the prior written permission of the relevant party. Such party, its affiliates and suppliers (“Content Providers”) do not guarantee the accuracy, adequacy, completeness, timeliness or availability of any Content and are not responsible for any errors or omissions (negligent or otherwise), regardless of the cause, or for the results obtained from the use of such Content. In no event shall Content Providers be liable for any damages, costs, expenses, legal fees, or losses (including lost income or lost profit and opportunity costs) in connection with any use of the Content. A reference to a particular investment or security, a rating or any observation concerning an investment that is part of the Content is not a recommendation to buy, sell or hold such investment or security, does not address the suitability of an investment or security and should not be relied on as investment advice. Credit ratings are statements of opinions and are not statements of fact. ©2020 Morningstar, Inc. All rights reserved. The information contained herein: (1) is proprietary to Morningstar and/or its content providers; (2) may not be copied or distributed; and (3) is not warranted to be accurate, complete, or timely. Neither Morningstar nor its content providers are responsible for any damages or losses arising from any use of this information. Past performance is no guarantee of future results. London Stock Exchange Group plc and its group undertakings (collectively, the “LSE Group”). © LSE Group 2020. FTSE Russell is a trading name of certain of the LSE Group companies. All rights in the FTSE Russell indexes or data vest in the relevant LSE Group company which owns the index or the data. Neither LSE Group nor its licensors accept any liability for any errors or omissions in the indexes or data and no party may rely on any indexes or data contained in this communication. No further distribution of data from the LSE Group is permitted without the relevant LSE Group company’s express written consent. The LSE Group does not promote, sponsor or endorse the content of this communication. © 2020 T. Rowe Price. All Rights Reserved. T. ROWE PRICE, INVEST WITH CONFIDENCE, and the Bighorn Sheep design are, collectively and/or apart, trademarks of T. Rowe Price Group, Inc. All other trademarks are the property of T. Rowe Price or their respective owners. T. ROWE PRICE GROUP, INC. INVESTOR DAY 2020 7572


